specim iq: evaluation of a new, miniaturized handheld
TRANSCRIPT
sensors
Article
Specim IQ: Evaluation of a New, MiniaturizedHandheld Hyperspectral Camera and Its Applicationfor Plant Phenotyping and Disease Detection
Jan Behmann 1,*, Kelvin Acebron 2, Dzhaner Emin 2, Simon Bennertz 2, Shizue Matsubara 2,
Stefan Thomas 1, David Bohnenkamp 1, Matheus T. Kuska 1, Jouni Jussila 4, Harri Salo 4,
Anne-Katrin Mahlein 1,3 and Uwe Rascher 2
1 INRES-Plant Diseases and Plant Protection, University of Bonn, 53115 Bonn, Germany;
[email protected] (J.B.); [email protected] (S.T.); [email protected] (D.B.);
[email protected] (M.T.K.); [email protected] (A.-K.M.)2 IBG-2, Forschungszentrum Jülich (FZJ), Jülich, 52428 Germany; [email protected] (K.A.);
[email protected] (D.E.); [email protected] (S.B.); [email protected] (S.M.);
[email protected] (U.R.)3 Institute of Sugar Beet Research (IFZ), 37079 Göttingen, Germany4 Specim Ltd., FI-90571 Oulu, Finland; [email protected] (J.J.); [email protected] (H.S.)
* Correspondence: [email protected]; Tel.: +49-228-73-4998
Received: 30 October 2017; Accepted: 24 January 2018; Published: 2 February 2018
Abstract: Hyperspectral imaging sensors are promising tools for monitoring crop plants or vegetation
in different environments. Information on physiology, architecture or biochemistry of plants can be
assessed non-invasively and on different scales. For instance, hyperspectral sensors are implemented
for stress detection in plant phenotyping processes or in precision agriculture. Up to date, a variety
of non-imaging and imaging hyperspectral sensors is available. The measuring process and the
handling of most of these sensors is rather complex. Thus, during the last years the demand for
sensors with easy user operability arose. The present study introduces the novel hyperspectral
camera Specim IQ from Specim (Oulu, Finland). The Specim IQ is a handheld push broom system
with integrated operating system and controls. Basic data handling and data analysis processes, such
as pre-processing and classification routines are implemented within the camera software. This study
provides an introduction into the measurement pipeline of the Specim IQ as well as a radiometric
performance comparison with a well-established hyperspectral imager. Case studies for the detection
of powdery mildew on barley at the canopy scale and the spectral characterization of Arabidopsis
thaliana mutants grown under stressed and non-stressed conditions are presented.
Keywords: hyperspectral camera; handheld; sensor evaluation; case studies
1. Introduction
This study introduces the novel, handheld hyperspectral camera Specim IQ and evaluates it
with respect to applications in plant physiology and plant pathology. The sensor is designed as
a mobile, hand-held and stand-alone camera (cf., Figure 1) with ground-based application areas.
For monitoring the status of plants, field, greenhouse and laboratory-based measurements can be
performed. By measuring spectral reflectance from 400 to 1000 nm, several important plant traits can
be covered by the sensor. The sensor relies on the established push broom principle but integrates a
scanner system and allows focusing in the image plane. All investigations presented in this publication
were performed on a prototype of the Specim IQ sensor and by using the corresponding software
Specim IQ Studio during the pilot phase.
Sensors 2018, 18, 441; doi:10.3390/s18020441 www.mdpi.com/journal/sensors

Sensors 2018, 18, 441 2 of 20
Figure 1. Vector visualization of the Specim IQ (Specim Ltd., Oulu, Finland) with annotations and
dimensions on the left side and RGB renderings on the right side.
Hyperspectral imaging (HSI) is a non-invasive method, which can provide detailed and highly
resolved reflectance characteristics of target materials on different scales. The reflected light of
the target is recorded with a high spectral and spatial resolution of a two-dimensional image [1].
In hyperspectral images, every pixel has more than hundred consecutive bands, containing the
reflectance values of the target for specific wavelengths called the spectral signature [1]. Many sensors
address the visible part of the electromagnetic spectrum (400–700 nm, VIS) and are also able to
measure the near-infrared wavelength (700–1000 nm, NIR) specifying them as VISNIR sensors.
The shortwave-infrared (1000–2500 nm, SWIR) part of the electromagnetic spectrum is also important
for specific applications but typically not all spectral regions can be covered by one sensor.
In recent times, an increasing number of successful studies prove the high versatility of
applications of hyperspectral imaging. Differences in the material composition of the measured
target—e.g., living plants, fruits, geological samples—are reflected in the corresponding spectral
profiles. This allows the detection of important parameters in food production, soil science and
precision agriculture [2–6]. Hyperspectral imaging is applied for an improved quality and safety
monitoring in food production [7–9]. Successful applications have been shown e.g., for lesion
detection on apple skin using a hyperspectral NIR camera [10], prediction of moisture in soybeans by
VISNIR imaging [11] and the acidity levels of grapevines from seven varieties by NIR hyperspectral
imaging [12]. Pigment concentration and other quality parameters of bell pepper were determined
using VISNIR imaging and Partial Least Squares Regression [13]. In soil science, hyperspectral imaging
is used for the investigation of soil composition and evaluation of soil quality. The spatial distribution
of three classes of organic matter within 10 × 30 cm soil samples was determined using k-means
clustering [3]. In a similar approach, a snapshot camera with the potential for outdoor application was
applied for visualizing the spatial heterogeneity and estimating soil properties like nitrogen or clay
content by Partial Least Squares Regression [2]. Using the SWIR range, a spectral library has been
developed that allows the detection of crude oil contamination in different soil types [14].
In precision agriculture, HSI can be applied for site-specific fertilization and precise plant
protection applications [15–17]. In recent years, HSI was introduced in greenhouse and field
phenotyping for non-invasive quantification of structural and functional plant traits [18]. Integrated
multi sensor platforms allow the application in the field, e.g., for grapevine phenotyping [19]. Studies
in plant pathology showed the advantage of a high spatial resolution in close range imaging to detect
and characterize plant diseases and even subtle resistance mechanisms of plants to diseases [20,21].
On the other side of the scale, hyperspectral sensors are increasingly used for ecosystem monitoring
and remote sensing of vegetation [22,23]. In this context, Vegetation Indices (VIs) are commonly used
to remotely evaluate vegetation covers both quantitatively and qualitatively [24,25]. These spectral

Sensors 2018, 18, 441 3 of 20
ratios were shown to be sensitive to changes in plant functional status which helps in estimating
gross [26,27] and net photosynthesis [28] down to its efficiency [29].
With the increase of different application scenarios, the demand for tailored hyperspectral cameras
rises. Every hyperspectral sensor type has specific strengths and limitations, which need to match the
requirements of the measured object and aim of investigation. Push broom and whisk broom scanners
capture the spectral information of a line or point on the measured object, respectively. To compose the
hyperspectral image, the object is scanned through movement or rotation [21]. However, the required
scanner process limits the application when the object is in motion.
Airborne applications mostly aim at plant status sensing or variety mapping and rely on whisk or
push broom systems. The spatial referencing is performed with suitable accuracy by using additional
correction parameters from an inertial measurement unit and global navigation satellite systems [30].
Light-weight platforms, like UAVs, have the advantage of lower flight altitudes but do not provide
such high-quality correction signals.
Triggered by the trend towards UAVs, full frame and snapshot hyperspectral cameras arouse
intense attention. Usually, the image data is spatially referenced by established structure-from-motion
software in post processing [31]. The underlying measurement principles are well-known but now
significant technical development allows to produce light-weight, reliable sensors with sufficient
radiometric accuracy for many applications. The main approaches for multi- and hyperspectral frame
cameras are spectral scanners [32], multi-point spectrometer [2], mosaic sensors and multi-sensor
systems. The Rikola hyperspectral camera (Senop, Kangasala, Finland) as a Fabry-Pérot-filter camera
specifies the wavelength of the light illuminating the panchromatic sensor array [32]. By fast changing
of the passing wavelength, hyperspectral images of up to 1010 × 1010 px and 380 bands can be
captured in the current version of the camera. A particular feature of the camera is to define the
needed bands and to reduce measurement time by reducing the number of bands. Multi-point
spectrometers, such as the Cubert S 185 (Cubert GmbH, Ulm, Germany), are capturing the whole
spectral characteristics in one shot by projecting the spectra of different pixel locations onto one 2D
sensor [32,33]. The low spatial resolution of the hyperspectral image, 50 × 50 px and 125 bands for
the Cubert S 185, is partially compensated by an additional panchromatic image with higher spatial
resolution allowing pan-sharpening. Mosaic cameras in contrast are basically multispectral cameras
that expand the principle of common RGB cameras by adding more and narrow band filters in front
of individual pixels [34]. In one image frame, up to 25 bands can be captured. A variant uses a line
layout capturing up to 70 bands in one shot but only one band for each pixel location [35]. To restore
a hyperspectral image, proper referencing and 3D reconstruction with multiple images at different
positions are necessary. Other multispectral designs integrate up to six sensor arrays, each sensing up
to three bands. They can be classified as multi camera systems with several optics and sensor arrays
(e.g., the popular TetraCam [36]). The Specim IQ shares some characteristics with these snapshot
cameras especially with the spectral scanner, e.g., capturing a full hyperspectral image without external
movement and the slight temporal delay of capturing different parts (spatial or spectral) of the image.
Latter will cause distortions if a moving object is observed. The Specim IQ may allow UAV applications
as well, but due to its focus on direct manual control it is not possible in the current version.
Ground-based hyperspectral sensing includes applications in the field, the greenhouse and the
laboratory with moving or static platforms. Moving field platforms and field robots rely mainly on line
scanner systems as the camera weight is a minor factor and the movement is already provided by the
platform [17,37,38]. Distortions as a result of vibrations do not affect the spectral signal, but only affect
the spatial image and are typically not corrected. For chlorophyll estimation in sugar beet for example,
a moving platform was combined with a linear stage [39]. A similar set-up was also recently adopted
to use high performance and thus heavy imaging spectrometers to retrieve subtle differences between
different breeding lines in the field [40,41]. In the greenhouse, more compact measurement stations are
required. For water stress detection, a line scanner camera was combined with a rotating mirror to
obtain hyperspectral images [42]. In Reddy et al. [43], a line scanner was used with a linear stage in

Sensors 2018, 18, 441 4 of 20
the greenhouse and furthermore, the same line scanner was attached to a tractor for field observations
in order to detect glyphosate-resistant weeds.
In the laboratory and in high-throughput systems, the use of line scanners is common as under
optimal measurement conditions the spatial and spectral measurement quality is superior [21,39,44].
Ge et al. [44] derived a variety of plant-physiological parameters using a conveyor belt-based
high-throughput facility with a hyperspectral sensor cabin. A mirror-based push broom sensor
was used to capture images of single sugar beet leaves and to derive disease specific vegetation
indices [21]. Jay et al. [39] used a fixed camera with attached illumination while the plant probe was
moved by a translation stage. They obtained multi-angle data and derived radiative transfer models
especially suited for the close range. Microscopic observations for the investigation of resistance
reactions of a plant against a fungal pathogen were also observed by a line scanner attached to a
microscope optic [20]. The image was gathered by moving the probe during the measurement.
High amounts of spectral data are collected with each hyperspectral image, making it difficult to
extract relevant information from the images. This leads to the requirement of advanced data analysis
methods in order to work efficiently with hyperspectral sensors [45]. For a successful application,
a suitable sensor needs to be accompanied by an appropriate data analysis pipeline, which needs to be
concerted to the sensor characteristics.
In the present study, the characteristics of the novel hyperspectral camera Specim IQ are presented,
and a direct qualitative comparison on radiometric accuracy with the well-established sensor Specim
HS-V10E-CL-30 [21,40,41,46,47] (denoted in the manuscript as Specim V10E (Specim Ltd., Oulu,
Finland)) was conducted. Further details on this sensor are provided in Section 3. The IQ sensor
is accompanied by the software Specim IQ Studio (Specim Ltd., Oulu, Finland) which relies on the
Spectral Angle Mapper (SAM) algorithm to analyze the images and to develop SAM applications which
can be executed on the device itself. The performance of the sensor and the accompanying data analysis
software were investigated in two lifelike case studies. Performance for the detection of powdery
mildew on barley and classical differentiation of Arabidopsis thaliana mutants are demonstrated.
2. Technical Description of the Specim IQ Camera System
This section provides the technical background of the sensor and gives an overview of the different
normalization possibilities and measurement modes. Specim IQ is a handheld hyperspectral camera,
which performs hyperspectral data capturing, data processing and visualization of a classification
result in one single integrated unit. The camera is supported by Specim IQ Studio software . Using
the software, the user is enabled to develop and download its own applications to the camera as it
possesses embedded processing capability. Detailed technical specifications are given in Table 1.
Table 1. Specim IQ technical specification.
Parameter Value
Spectral camera VNIR 400–1000 nm (CMOS)Viewfinder camera 5 MpixFocus camera 1.3 MpixUser interface SW SpecimProcessor NVIDIA Tegra K1Storage SD card max. 32 GBData format Specim data set with ENVI compatible data filesBattery 5200 mAh Li-Ion (Type 26650)Operational time 100 measurements with one SD card and batteryDisplay & keyboard 4.3” touch screen & 13 physical buttons

Sensors 2018, 18, 441 5 of 20
Table 1. Cont.
Parameter Value
Camera interface USB Type-CConnectivity GPSSize 207 × 91 × 74 mm (depth with lens 125.5 mm)Weight 1.3 kgF/number 1.7Wavelength range 400–1000 nmSpectral resolution FWHM 7 nmSlit length 42 µmSlit height 11.7 mmSpatial sampling 512 pxSpectral bands 204Image resolution 512 × 512 pxData output 12 bitQE peak >45%Full well capacity >32,000 e-Peak SNR >400:1Working distance 150 mm–∞
FOV 31◦ × 31◦
FOV at 1 m distance 0.55 m × 0.55 mTemperature, operational 0 ◦C to +40 ◦C
The measurements are performed based on the line scanner, i.e., push broom principle and
comprise the wavelength range 400–1000 nm. Its spatial sampling, i.e., the number of pixel per line
is 512, and the spectral resolution is 7 nm with 204 spectral bands across the wavelength range.
By adjusting the binning in spectral dimension, the amount of spectral bands can be adjusted.
The number of imaged lines is static with 512 lines and thus the camera captures always a square image
with a resolution of 512× 512 px. Specim IQ camera is equipped with a touch display, physical buttons,
chargeable battery, replaceable memory card and USB connector. The camera employs a processor
(NVIDIA Tegra K1 (NVIDIA Corporation, Santa Clara, USA)), spectral camera (CMOS technology),
viewfinder camera (5 Mpix), focus camera and a scanner with the motor for optics movement. The fore
optic of the camera provides a 31◦ × 31◦ field of view and focusing is set manually. The focus range of
the camera is from 150 mm to infinity. As an example, with 1 m distance to the target, the viewable
area is 0.55 × 0.55 m, resulting in a spatial resolution of 1.07 mm on the target.
Specim IQ is controlled via a touch screen and relies on a graphical user interface that guides
the user through the entire imaging pipeline (Figure 2). The usability has been designed to have
similarities with a standard system camera and to require only minimal user input. One main character
of the camera is its ability to convert the recorded hyperspectral data into instant classification results
displayed on the screen. For this purpose, the Specim IQ uses a workflow which is shown in Figure 2.
The measurement process is divided into five steps. During the establishment of the imaging setup,
the hyperspectral camera is directed to the target using the viewfinder camera, i.e., a RGB camera with
identical viewing direction and small vertical offset. As common for any hyperspectral measurement,
a suitable illumination providing a continuous spectrum over the wavelength range of interest is
required. This could be sunlight outdoors or halogen lamps indoors. Typically, the characteristics of
the illumination are captured by the measurement of a white reference panel, which has to be located
next to the sample.
After this, the integration time and camera focus needs to be adjusted. The viewfinder camera
image gives a preset for the integration time of the spectral camera. The preset value and a preferable
range are proposed to the user, but a manual adjustment of the integration time in the range 1–500 ms
is possible. The focusing of the system is done manually, but supported by the focus camera image.
In contrast to a traditional line scanner camera, this approach uses a normal camera image and
highlights sharp edges. The parallax between the viewfinder camera and actual spectral camera

Sensors 2018, 18, 441 6 of 20
is compensated by an automatic calibration done by edge detection between viewfinder and focus
cameras. The vertical position of the viewfinder camera image is virtually adjusted accordingly or
alternatively, based on a manual parallax correction. The adjustment is needed to overlay the spectral
and viewfinder camera images with suitable accuracy.
Figure 2. The standard workflow of the Specim IQ hyperspectral camera.
After these initial adjustment steps, image recording is started by pressing the capture button.
At first, the dark reference, representing the sensor noise without incoming light is recorded
automatically. This is done on the spectral camera home position that is blocked from incoming
light. After the dark reference acquisition, the spectral camera is moved to the measurement starting
position and the actual data acquisition is started.
After the full 512 × 512 px image is scanned, the user can check focus and integration time in the
data validation view. There, a RGB image derived from the hyperspectral image is shown together
with an intensity histogram. Based on the validation view, the image can be rejected, kept for the
further workflow or it can be selected to save only raw, uncorrected data. For the white reference
measurement, Specim IQ offers three possibilities. The white reference can be recorded prior to the
actual measurement (custom white reference). Alternatively, the white reference can be recorded
simultaneously with the actual sample (simultaneous white reference). In cases where white reference
recording is not possible, device memory provides a general halogen spectrum from 400 to 1000 nm
(pre-defined white reference). In the first two possibilities, an area scan over the white reference is

Sensors 2018, 18, 441 7 of 20
performed, in which 100 random spectra are averaged and used for data reflectance transformation.
The latter approach uses the pre-defined spectrum directly to convert the measured data to reflectance.
In all cases, the reflectance transformation is performed automatically for the data.
For data processing, Specim IQ provides three different modes: Default Recording Mode (without
any processing), Automatic Screening Mode (ASM, one-class classifier) and Application Mode (deployed
processing model developed by Specim IQ Studio).
In Default Recording Mode, all the raw data and reflectance data are saved into separate data
cubes on the data set. The data set is a folder structure, where the data is stored together with
meta information. The ASM can be used to build a single class classifier, at the site, and directly
from the user interface of the Specim IQ. The ASM mode is based on a Spectral Angle Mapper [48].
The user has a possibility to select the reference spectra, as well as threshold for class creation.
Prior to the classification, the reflectance transformation is performed as described above, as well as
automatic wavelength range selection to avoid using noisy parts of the spectra. By using the Specim
IQ Studio software, it is possible to build applications that can be uploaded to the Specim IQ camera.
In the Application Mode it is possible for the user to define data recording, visualization and saving.
Furthermore, the data classification can be defined by creating several classes, class groups, data
preprocessing (Savitzky–Golay algorithm for data smoothing [49]), and classification for the targeted
application. The Specim IQ Studio software allows to create applications without any programming
directly from a graphical user interface.
If Specim IQ is used in the Default Recording Mode, the RGB image derived from reflectance data
is shown to the user after measurement. There are possibilities for the user to check the spectra, add
tags and other information to the dataset. If the data processing capabilities of Specim IQ are used,
either with Automatic Screening or Application Mode, the classification mask is visualized as an overlay
on a RGB image or without RGB information. Using this visual feedback, a direct assessment of
imaging quality and flexible real-time analysis of samples using hyperspectral images is possible.
Importing own spectral algorithms beyond the SAM to Specim IQ is not possible and models in
Specim IQ Studio are limited to SAM only. However, importing reference spectra for the basis of
SAM classification model is supported and processing time can be optimized with wavelength range
selection and averaging spectral bands.
3. Qualitative Comparison of Specim IQ with Specim V10E
Comparative measurements of the Specim IQ system and Specim V10E sensor were conducted
to assess the measurement quality of the Specim IQ camera and to provide an impression for which
applications the new sensor is suited.
The Specim V10E sensor is an established and representative system of the class of hyperspectral
push broom cameras in the same spectral range (400–1000 nm) as the Specim IQ. In this study, four-fold
spectral binning is applied to provide a similar sampling distance using 211 bands. Capturing
1600 pixel per line, it has in general a higher spatial resolution than the Specim IQ, but it is dependent
on an external movement which is provided by a linear stage in the present setup [21,47]. The sensors
were compared in an indoor setting with halogen illumination and an outdoor setting with natural light
to capture the measuring performance for multiple relevant scenarios. Both sensors were positioned in
nadir orientation above different test materials, such as paper and polyethylene of different color (in the
following called color cards). In the laboratory, the Specim V10E—including the light sources—was
moved by a linear drive across the object of interest whereas the Specim IQ used the internal scanning
properties and a spatially fixed illumination.
During outdoor measurements, sunlight from full-midday sun (~90.000 lx) was used as the
only light source. In both scenarios, the cameras were placed as close to each other as possible with
a maximum distance of 20 cm during the movement of the line scanner. The test materials were
placed at a distance of 1 m. All images were normalized using a 99% barium sulfate white reference
(Specim), which was positioned within the field of view during image acquisition. Due to the different
Sensors 2018, 18, 441 8 of 20
measurement principles (push broom vs. static), the comparability of measurement conditions is
limited by the spatially variable light conditions in the laboratory. As a result of the moving light
sources of the Specim V10E, both cameras observed the white reference with slightly different light
intensity. To remove this effect and obtain comparable reflectance values, the spectral signatures of the
Specim IQ were scaled to attain the same mean reflectance value as the Specim V10E spectra.
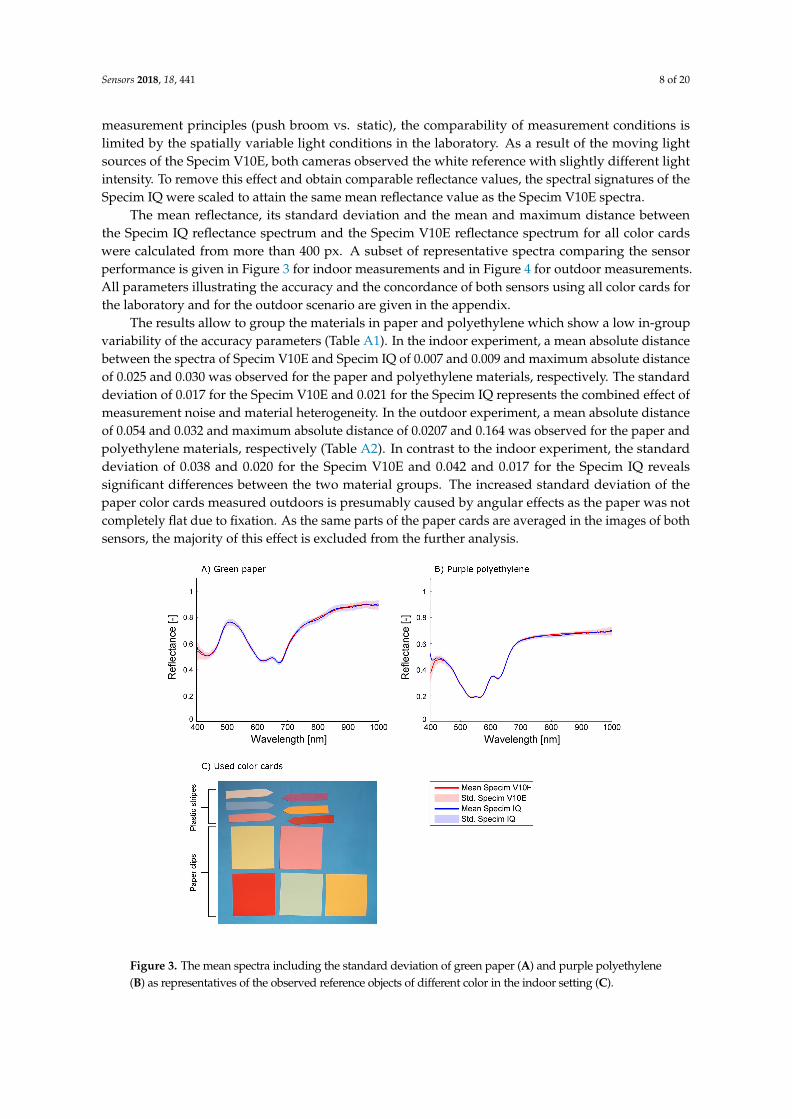
The mean reflectance, its standard deviation and the mean and maximum distance between
the Specim IQ reflectance spectrum and the Specim V10E reflectance spectrum for all color cards
were calculated from more than 400 px. A subset of representative spectra comparing the sensor
performance is given in Figure 3 for indoor measurements and in Figure 4 for outdoor measurements.
All parameters illustrating the accuracy and the concordance of both sensors using all color cards for
the laboratory and for the outdoor scenario are given in the appendix.
The results allow to group the materials in paper and polyethylene which show a low in-group
variability of the accuracy parameters (Table A1). In the indoor experiment, a mean absolute distance
between the spectra of Specim V10E and Specim IQ of 0.007 and 0.009 and maximum absolute distance
of 0.025 and 0.030 was observed for the paper and polyethylene materials, respectively. The standard
deviation of 0.017 for the Specim V10E and 0.021 for the Specim IQ represents the combined effect of
measurement noise and material heterogeneity. In the outdoor experiment, a mean absolute distance
of 0.054 and 0.032 and maximum absolute distance of 0.0207 and 0.164 was observed for the paper and
polyethylene materials, respectively (Table A2). In contrast to the indoor experiment, the standard
deviation of 0.038 and 0.020 for the Specim V10E and 0.042 and 0.017 for the Specim IQ reveals
significant differences between the two material groups. The increased standard deviation of the
paper color cards measured outdoors is presumably caused by angular effects as the paper was not
completely flat due to fixation. As the same parts of the paper cards are averaged in the images of both
sensors, the majority of this effect is excluded from the further analysis.
Figure 3. The mean spectra including the standard deviation of green paper (A) and purple polyethylene
(B) as representatives of the observed reference objects of different color in the indoor setting (C).

Sensors 2018, 18, 441 9 of 20
Figure 4. Comparison of spectral reflectance spectra from the outdoor experiment (A–D): paper green,
paper dark yellow, Polyethylene purple, Polyethylene blue. Beside the increased reflectance observed
by the Specim IQ in the NIR, all spectra reveal a high level of congruence.
Overall, it turns out that the sensors give comparable results. The shape of the observed spectra
corresponds to a high degree, resulting in mean differences of 0.009 in the laboratory and 0.043 outdoors.
The mean standard deviation of Specim IQ and Specim V10E are on the same scale indoors (0.017
and 0.021) and identical outdoors (0.029 and 0.029), but for the Specim IQ it is more homogeneous
whereas the Specim V10E has a higher noise level in the spectral border regions (400–450 nm and
900–1000 nm, cf. Figure 3A). As negative characteristics, outdoor observations with the Specim IQ
showed an increased reflectance between 925 and 1000 nm. The remaining part of the spectrum was
not affected. This results in comparably high maximum deviations (on average 0.186) and may be
related to the low integration time of 1 ms. According to the manufacturer, this effect was caused by the
low raw signal level in addition to the atmospheric (H2O) absorption band in the range between 925
and 970 nm. This results in the prompt increase in the reflectance signal. The remedy for this would be
to use spectral flattening filter in front of the fore optics and increase the integration time. Furthermore,
a line pattern was visible in all images (Figure 5). According to the manufacturer, it is induced by the
changing optical geometry at the slit during the scanning process. As a consequence, the slit width is
not completely identical for single lines of the image. Nevertheless, due to the averaging of multiple
lines, the mean spectra were not affected.

Sensors 2018, 18, 441 10 of 20
Figure 5. RGB visualization of a reflectance test image to show the line pattern. The highlighted image
part in (A) is visualized in zoom view in (B). On the white reference the line pattern is visible, whereas
on the plants it is mainly covered by natural variability.
4. Case Studies
In addition to the qualitative evaluation in comparison to an established sensor, the performance of
the Specim IQ was investigated in two case studies. In the first case study, the reflectance characteristics
of three different genotypes of Arabidopsis thaliana were recorded to test the capacity of the camera to
resolve subtle differences that are based on slightly different leaf pigment composition. The second
case study aimed to quantify the level of infestation of two barley cultivars inoculated with powdery
mildew, using the machine learning method Support Vector Machine (SVM [50]). By this selection,
two relevant applications in plant and crop science, dealing with different plant functional traits
were investigated.
4.1. Use of Specim IQ Camera System as a Tool for Understanding Physiological Response ofArabidopsis thaliana Mutants Adapted in Stressed and Non-Stressed Condition
Vegetation indices (VIs) are used by plant scientists to evaluate structural and functional
vegetation traits quantitatively and qualitatively across different scales [24,25,51,52]. They are used
for example to assess the green biomass [53], canopy structure [54], leaf area index [55], chlorophyll
content [56–58], fraction of absorbed photosynthetically active radiation (fAPAR) [55,59], and light-use
efficiency [29] of plants and canopies [60]. With the development of portable hyperspectral imaging
sensors, reflectance from visible (400–700 nm) and near infrared (700–1000 nm) spectrum can be easily
derived to study and screen mutant plants to identify genes and understand its physiological function
in a high-throughput way in phenotyping environments.
In this case study, two mutant lines of Arabidopsis thaliana acclimated in non-stressful (NSA) and
stressful (SA) condition were used as the main subject. The selected mutants are deficient in either
PsbS protein (npq4) [61] or violaxanthin de-epoxidase (npq1) [62], both resulting in a limited ability to
thermally dissipate excessive light energy via a process called non-photochemical quenching (NPQ).
In addition, the lack of violaxanthin de-epoxidase in npq1 mutant inhibits light-dependent enzymatic
conversion of carotenoids. This conversion, which is a part of NPQ regulation, causes a very subtle
spectral change in leaf reflectance that is invisible to human eyes. Both mutations are not fatal and the
plants develop normally under greenhouse conditions. Under high light conditions, however, the two
mutants are unable to adjust light energy harvesting by NPQ to protect their photosystems against
photo-damage. Along with these mutants, the “normal” plants without mutations (Col-0) were used
as a control group. Thus, by using these mutants we tested whether the Specim IQ can detect subtle
differences in leaf pigments and physiological traits.

Sensors 2018, 18, 441 11 of 20
Plants were sown in 7 × 7 cm pots (one plant per pot) filled with soil. Three plants from each
genotype were grown and acclimated to non-stressful conditions in the greenhouse while another
three plants were acclimated for at least two days to natural light and temperature conditions in the
field that are more stressful for plants. All plants were randomly distributed within the imaging frame.
The Specim IQ camera system was used to take reflectance images of Arabidopsis plants inside the
greenhouse with white panel (90% reflectance) as a reference target. As the Specim IQ software does not
support the calculation of vegetation indices, the hyperspectral imagery data was imported into ENVI
Classic 5.3 (Harris Geospatial Solutions, Broomfield, USA) resolving the regions of interest (ROI) using
Normalized Difference Vegetation Index (NDVI [63], Equation (1)) and manual tracing of individual
plants. For the case study, two VIs were calculated that are correlated to leaf chlorophyll content,
namely the NDVI and the Red Edge Inflection Point (REIP [64,65], Equation (2) by Matlab 2013a and
Signal Processing Toolbox 6.19 (The MathWorks, Inc., Natick, USA)). To derive REIP, plant spectra was
smoothed using Savitzky–Golay filtering [49] before calculating the first derivative. REIP was identified
as the maximum value of the first derivative between 690 and 720 nm after spline interpolation with 0.1 nm
resolution. As a third VI, the Photochemical Reflectance Index (PRI [66], Equation (3)) was calculated,
which is described to be sensitive to the activation of the NPQ pathway and carotenoid conversion (for
more details on these indices and their functional meaning see [25]. Using the RStudio software V1.0.143
(RStudio, Inc., Boston, USA), analysis of variance (ANOVA) was carried out using agricolae package for
all the calculated average VIs in a single plant. Likewise, pairwise mean comparison using least square
difference (LSD, α = 0.05) was performed as a post hoc analyses.
NDVI =R800 − R680
R800 + R680(1)
REIP = arg max690≤x≤720
R′x (2)
PRI =R531 − R570
R531 + R570(3)
Vegetation indices computed from the ROIs of the images of the SA and NSA plants revealed
distinct differences in NDVI, REIP and PRI. Plants’ spectral reflectance (Figure 6B) varied in green
(∼530 nm), red edge (∼700 nm) and near-infrared (>700 nm) regions of the spectrum where light-use
efficiency, narrowband and broadband greenness are estimated, respectively. For both NDVI
(Figure 6C,D) and REIP (Figure 6E,F), the two npq mutants showed significant changes between
SA and NSA while no significant difference was observed in Col-0 plants. Although the shift in red
edge inflection point is small (∼2 nm), LSD test showed significant differences between SA and NSA
plants of npq1 and npq4. Previous studies [67,68] reported that the red edge shift towards the shorter
wavelength was related to a reduced chlorophyll content in leaves. This demonstrates the sensitivity
of these indices to subtle changes in pigment ratios and leaf structures which arose in leaves of the
NPQ-deficient mutants during acclimation to the stressful condition. The third index, PRI, revealed
stress response (Figure 6G) in all plants. The PRI values decreased in all SA plants on average by
1.4-fold and the three genotypes significantly differed (α = 0.01) in the extent of the decrease (Figure 6H).
Moreover, fair resolution of pixel patterns within a single plant was captured by the calculated VIs
(Figure 6C,E,G) which can further provide spatial information on the relative distribution of different
pigments ratios reflecting plant status.
This case study demonstrates the usability of a portable hyperspectral camera to simultaneously
detect relative changes in both chlorophyll content (NDVI and REIP) and the xanthophyll cycle (PRI)
in Arabidopsis plants. While this case study only showed representative vegetation indices, it offers
more opportunity to compute other established VIs (including those which are based on derivatives
of spectra) to gain more physiological information in plants. The magnitude of change between the
SA and NSA plants can provide quantitative information indicative of stress levels, as shown here in
simple rosette of Arabidopsis thaliana.

Sensors 2018, 18, 441 12 of 20
Figure 6. Differences observed between non-stress acclimated (NSA) and stress acclimated (SA)
Arabidopsis wildtype (Col-0) and NPQ-deficient mutants (npq1 and npq4) as shown by computed
spectral ratios. Left panel shows the false-colour images of selected ROIs (A); NDVI (C); REIP (E); and
PRI (G) computed from spectral information captured by the Specim IQ camera. Right panel shows
the computed means ± standard errors of reflectance values (B); NDVI (D); REIP (F); and PRI (H) from
three individual plants randomly distributed in the imaging frame. Different letters indicate significant
differences based on LSD (α = 0.05).
4.2. Quantification of Powdery Mildew Infection on Barley
Information on disease severity of crop plants is relevant for the evaluation of the susceptibility
of host plants against specific plant pathogens. It is a crucial information source for breeders
and essential for plant protection measures in precision agriculture. Hyperspectral imaging, as a

Sensors 2018, 18, 441 13 of 20
non-invasive and objective method, has shown great promise for phenotyping applications in previous
studies [5,21,69]. Furthermore, the possibility to create automated measurement series directly
in phenotyping greenhouses and fields could lead to an increased throughput for phenotyping
applications, reducing the time required for the development of new pathogen resistant cultivars [70].
In the field of precision farming, the early and precise detection of plant diseases is also highly relevant
as it determines the efficiency of countermeasures [5].
Therefore, the Specim IQ was tested in a scenario for the assessment of powdery mildew disease
severity of different barley cultivars on the canopy scale. The cultivars Milford and Tocada, which
have different susceptibility ratings against powdery mildew with 4 and 7 according to the German
cultivar list (Descriptive Variety List; Bundessortenamt, Hanover, Germany), were investigated with
both camera systems for comparison and evaluated according to the results of subsequent image
analysis. The goal of the case study was to accurately detect powdery mildew symptoms on both
cultivars. Furthermore, it was of interest to achieve a quantification of the disease symptoms over the
image in order to assess the different disease severities of the cultivars through hyperspectral imaging
in combination with data analysis methods.
For the collection of reflectance characteristics, measurements were conducted using the Specim
IQ in a Mini-Plot phenotyping facility in a greenhouse (Thomas et al., in preparation). The “Mini-Plots”
are containers which allow the observation of small canopies of up to 360 barley plants with sufficient
soil, to enable a root system development similar to barley plants under field conditions. The plants
can grow under natural light conditions, while a curtain system at the movable measurement platform
allows the application of stable artificial light conditions with diffuse light. The diffuse light is provided
by a setup of six 120 W halogen lamps, which are spread over the measurement platform for stable
lighting conditions. The properties of the diffuse light lowers the impact of the canopy architecture
on the measurement results, due to the reduction of shadowing and different reflection angles in
the canopy. Observations were performed on 11/23/2016 at 26 days after inoculation (dai) under
controlled light conditions with a measurement distance of around 60 cm and oblique view. The images
were normalized using a white reference within the image (cf. Figure 7) and the built-in function of the
Specim IQ. A representative result of the SAM analysis of the Specim IQ Studio is given in Figure 7B.
Compared to the SVM classification in Figure 7C, the SAM detects similar regions with symptoms in
the upper leaves, but misses some of the older, brownish symptoms which are instead not assigned to a
class. This may be related to the limited number of samples used for the SAM. Therefore, an increased
number of samples may enable competitive results. A quantitative evaluation of the SAM result was
not supported by the used version of Specim IQ Studio.
To assess the suitability of the recorded images for the quantification of susceptibility, a SVM
classification model for disease symptoms was derived based on manual annotation. “Background”,
“healthy leaf tissue” and “leaf tissue with powdery mildew symptoms” were used as target classes.
The linear SVM model was learned using 15 annotated samples for each of the three classes. Using
the more complex non-linear SVM with a radial function kernel did not improve the result accuracy.
The classified background was removed from the further analysis and the ratio of symptomatic pixels
to all plant pixels was calculated. For the inoculated (inoc.) cv. Milford and cv. Tocada, disease
symptoms were detected at 25.8% and 4.4% of all plant pixels, whereas for the healthy plots (cont.)
only 2.0% and 2.2% were determined, respectively. Existing misclassifications were mainly the effect
of mixed pixels at the border of the white reference as they appear like the white mycelium on the
leaf surface. To remove this systematic bias, the disease severity was determined by subtracting the
amount of pixels classified falsely as symptomatic (inoculated-control). Strong difference of 2.2% to
23.7% for the analyzed cultivars was predicted. This values represent the visual impression of the RGB
pixels but do not represent the rated susceptibility given by the German cultivar list. The main reason
for this is the specific selection of the measured region (approximately 30 × 30 cm), which does not
represent the disease severity within the whole plot.

Sensors 2018, 18, 441 14 of 20
Using the Specim IQ, it was possible to assess the disease severity of complex canopies by
measurements in the greenhouse. Controlled illumination conditions support the high signal quality.
The spatial resolution was sufficient to identify single symptoms on the barley leaves.
Figure 7. Classification of powdery mildew using the Spectral Angle Mapper (SAM) and Support
Vector Machine (SVM). Powdery mildew detection with the SAM is based on two reference spectra for
“symptoms” and two reference spectra for “healthy tissue”. The SVM prediction is based on 15 training
samples for each class. The image contains the white reference panel on the left side.
5. Discussion
The investigations performed in this study evaluate the Specim IQ camera with regard to
spectral imaging quality and usability in typical applications in current plant phenotying research.
The comparison of the new Specim IQ camera with the established Specim V10E revealed the
competitiveness of the handheld device, but also its limits. In laboratory experiment, high level
of conformity was testified on the observed test materials. The visualized spectra in Figure 3 and
the mean distances between the spectra of averaged 0.009 (min: 0.004 and max: 0.016) show the
overall good measurement quality. At some materials the phenomenon was observed that going
from 400 nm to 450 nm the reflectance is decreasing even if the Specim V10E detects a increasing
reflectance (cf. Figure 3B). This effect leads to increased distances between the observed spectra if
the material has a decreasing reflectance in this region but has nearly no effect if the reflectance is
increasing. One reason could be the influence of stray light that adds a systematic effect to first
few bands. The option to compensate this effect by calibration or hardware adaption needs further
investigations. In the daylight observations, both cameras still show a good coherency, but to a lower
degree. Natural variation in the light intensity and composition causes a higher standard deviation of
0.029 compared to 0.019 and an increased mean distance of 0.043 (Figure 4, Table A2). A systematic
deviation of the Specim IQ with an absolute value of up to 0.10 was visible in the near infrared from
925 nm to 1000 nm. A line pattern, caused by slight instabilities of the slit width of the Specim IQ
sensor resulting in a variability of up to 5% in reflectance, was visible in all images of the Specim
IQ (Figure 5). Its effect on the reference measurements was minimized as a region of the image was
averaged. However, the Specim IQ showed suitable imaging characteristics in both environments that
allow a reliable sensing of reflectance characteristics. The performance under different environmental
conditions can be mostly deduced as they will be a mixture of the presented extreme conditions.
The application of the Specim IQ for the investigation of Arabidopsis thaliana mutants with different
rates of NPQ reveals the suitability of selected VIs and the potential of the Specim IQ to record these
subtle parameters (Figure 6). For instance, chlorophyll content was estimated with the use of REIP,
which requires a continuous hyperspectral signal as it is based on the first derivative of the vegetation
spectra. Using the three indices shown, it was possible to detect a deviation from the wildtype (Col-0)
while significant difference was observed between the two mutants under stress condition. In general,
hyperspectral imagers are able to provide such comprehensive reflectance information that allow a
Sensors 2018, 18, 441 15 of 20
flexible sensing of various target parameters applicable for high-throughput phenotyping in the lab
and in the field. The Specim IQ provides sufficient spectral resolution and radiometric accuracy to
record reliably VI values. Thus, a characterization of subtle differences in plant characteristics can
be performed by the Specim IQ given a suitable selection of VIs. Hereinafter, it is recommended to
investigate the possibility to detect steady-state chlorophyll a fluorescence based on proper derivatives
of plant spectra taken under controlled conditions [71].
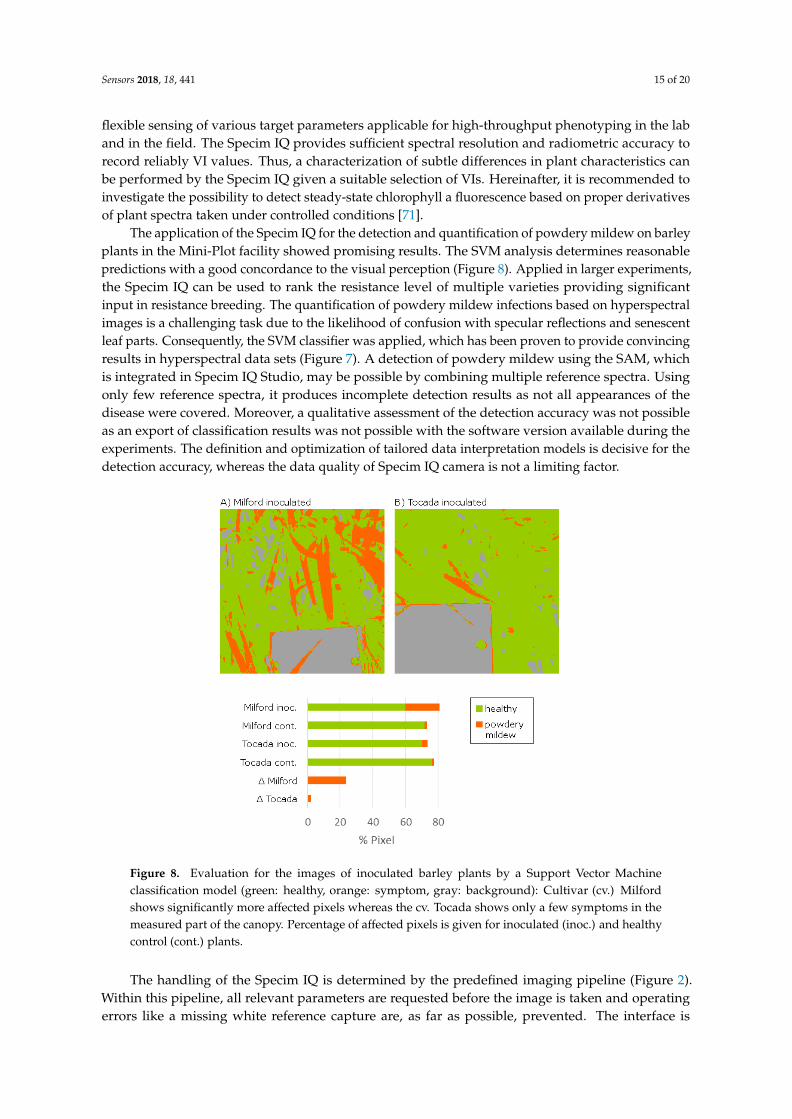
The application of the Specim IQ for the detection and quantification of powdery mildew on barley
plants in the Mini-Plot facility showed promising results. The SVM analysis determines reasonable
predictions with a good concordance to the visual perception (Figure 8). Applied in larger experiments,
the Specim IQ can be used to rank the resistance level of multiple varieties providing significant
input in resistance breeding. The quantification of powdery mildew infections based on hyperspectral
images is a challenging task due to the likelihood of confusion with specular reflections and senescent
leaf parts. Consequently, the SVM classifier was applied, which has been proven to provide convincing
results in hyperspectral data sets (Figure 7). A detection of powdery mildew using the SAM, which
is integrated in Specim IQ Studio, may be possible by combining multiple reference spectra. Using
only few reference spectra, it produces incomplete detection results as not all appearances of the
disease were covered. Moreover, a qualitative assessment of the detection accuracy was not possible
as an export of classification results was not possible with the software version available during the
experiments. The definition and optimization of tailored data interpretation models is decisive for the
detection accuracy, whereas the data quality of Specim IQ camera is not a limiting factor.
Figure 8. Evaluation for the images of inoculated barley plants by a Support Vector Machine
classification model (green: healthy, orange: symptom, gray: background): Cultivar (cv.) Milford
shows significantly more affected pixels whereas the cv. Tocada shows only a few symptoms in the
measured part of the canopy. Percentage of affected pixels is given for inoculated (inoc.) and healthy
control (cont.) plants.
The handling of the Specim IQ is determined by the predefined imaging pipeline (Figure 2).
Within this pipeline, all relevant parameters are requested before the image is taken and operating
errors like a missing white reference capture are, as far as possible, prevented. The interface is

Sensors 2018, 18, 441 16 of 20
designed to lower the initial hurdle for the unexperienced operator. The integrated touch screen
supports the user by clear instructions compared to the alternative multi-purpose buttons. If suitable
analysis programs are deployed on the device, on the fly imaging and analysis can be performed by an
inexperienced person after a short introduction. On the other side, such dialogue approach prevents a
high level of automation. Furthermore, a remote control from a computer was not supported in the
prototype version. Summarizing, in setups with a high level of repetitions, such as static measurement
or high-throughput platforms, other sensors are preferable. The Specim IQ sensor is developed for
mobile and highly flexible applications in the laboratory, the greenhouse and in the field.
6. Conclusions
The new Specim IQ camera was evaluated with regard to the measurement quality, the handling
and the performance in real-world scenarios of plant-physiological and agricultural experiments.
The radiometric evaluation of the provided Specim IQ prototype revealed a high level of concordance
to the established Specim V10E in indoor and outdoor settings. Limitations are revealed for the bands
400–415 nm at some materials and for the bands 925–1000 nm in direct sunlight. Applications are
possible indoors and outdoors. The results obtained from the VI analysis suggest potential applications
in the context of plant research and phenotyping strategies. For the assessment of powdery mildew,
the Specim IQ showed sufficient measurement capabilities and in combination with SVM a high level
of consistency to visual assessment in quantification.
The Specim IQ may become a promising hyperspectral camera device with multiple opportunities
in plant science. The high measurement quality in combination with compactness, mobility and
integrated processing capabilities creates the conditions to acquire new application fields. Trade-off
situations between data quality, throughput and stability of environmental conditions are common
in plant phenotyping. The Specim IQ allows now to transfer sensor technique at the quality level of
laboratory equipment to the greenhouse and the field without any carrier platform or control and
storage devices. Thus, the flexible and robust Specim IQ supports the technology transfer to the field
and has the potential to increase the overall impact of hyperspectral sensing technologies.
Acknowledgments: This study was funded by the German Federal Ministry of Education and Research (BMBF)within the scope of the competitive grants program “Networks of excellence in agricultural and nutritionresearch—CROP.SENSe.net” (Funding code: 0315529), Junior Research Group “Hyperspectral phenotypingof resistance reactions of barley” and due to financial support of the Daimler and Benz foundation and BayerCropScience. We thank the reviewers for the constructive and valuable remarks.
Author Contributions: J.B., K.A., D.E., A.-K.M. and U.R. conceived and designed the experiments; J.B., K.A., S.B.,S.M., S.T., D.B. and M.T.K. performed the experiments; J.B., K.A., and S.T. analyzed the data; J.B., K.A., S.T, J.J.,H.S., A.-K.M. and U.R. wrote the paper. The manuscript was revised and approved by all authors.
Conflicts of Interest: SPECIM, Spectral Imaging Oy Ltd., provided two prototypes of the Specim IQ, a training andprepared Section 2. Technical description of the Specim IQ camera system. Additionally, Specim provided financialsupport to perform the evaluation of the sensor and payed the APC. Scientists from the Forschungszentrum Jülichand Bonn University designed the scientific test cases, analysed the results, produced the graphs and wrote thetext. Representatives of the company were not involved in the design of the comparison with the Specim V10E,the case studies and the writing of the text of the case studies.

Sensors 2018, 18, 441 17 of 20
Appendix A
Table A1. Comparative performance parameters of the Specim IQ and Specim V10E observed in the
laboratory under artificial light conditions. Mean standard deviation of the homogeneous color cards,
the mean absolute distance between the mean spectra, the maximum absolute distance and the mean
relative distance in percent.
Indoor Std.Specim V10E [-]
Std.Specim IQ [-]
MeanAbs. Distance [-]
MaximumAbs. Distance [-]
MeanRel. Distance [%]
Paper, Yellow 0.017 0.022 0.008 0.022 0.019Paper, Green 0.017 0.023 0.004 0.015 0.006Paper, Red 0.015 0.016 0.016 0.033 0.098Paper, bright Yellow 0.018 0.022 0.008 0.031 0.013Paper, Pink 0.017 0.018 0.006 0.023 0.011Polyethylene, Pink 0.017 0.025 0.008 0.038 0.013Polyethylene, Blue 0.017 0.024 0.010 0.030 0.020Polyethylene, White 0.020 0.032 0.007 0.032 0.008Polyethylene, Red 0.015 0.017 0.006 0.022 0.033Polyethylene, Orange 0.016 0.016 0.006 0.037 0.013Polyethylene, Purple 0.015 0.013 0.004 0.021 0.008
Average 0.016 0.021 0.008 0.028 0.022
Table A2. Comparative performance parameters of the Specim IQ and Specim V10E observed outdoors
under natural light conditions. Mean standard deviation of the homogeneous color cards, the mean
absolute distance between the mean spectra, the maximum absolute distance and the mean relative
distance in percent.
Outdoor Std.Specim V10E [-]
Std.Specim IQ [-]
MeanAbs. Distance [-]
MaximumAbs. Distance [-]
MeanRel. Distance [%]
Paper, Yellow 0.040 0.046 0.054 0.183 0.072Paper, Green 0.041 0.047 0.060 0.222 0.077Paper, Red 0.041 0.035 0.037 0.156 0.090Paper, bright Yellow 0.031 0.035 0.050 0.193 0.065Paper, Pink 0.036 0.045 0.051 0.237 0.065Paper, White 0.040 0.043 0.071 0.254 0.081Polyethylene, Pink 0.020 0.017 0.024 0.138 0.043Polyethylene, Blue 0.020 0.016 0.039 0.185 0.057Polyethylene, White 0.023 0.022 0.023 0.145 0.025Polyethylene, Red 0.018 0.014 0.041 0.171 0.130Polyethylene, Orange 0.021 0.018 0.035 0.183 0.084Polyethylene, Purple 0.018 0.015 0.031 0.160 0.062
Average 0.029 0.029 0.043 0.186 0.071
References
1. Jensen, J.R. Remote Sensing of Environment: An Earth Ressource Perspective; Pearson: London, UK, 2006.
2. Jung, A.; Vohland, M.; Thiele-Bruhn, S. Use of a portable camera for proximal soil sensing with hyperspectral
image data. Remote Sens. 2015, 7, 11434–11448.
3. Steffens, M.; Kohlpaintner, M.; Buddenbaum, H. Fine spatial resolution mapping of soil organic matter
quality in a Histosol profile. Eur. J. Soil Sci. 2014, 65, 827–839.
4. Cheng, W.; Sun, D.W.; Pu, H.; Wei, Q. Chemical spoilage extent traceability of two kinds of processed pork
meats using one multispectral system developed by hyperspectral imaging combined with effective variable
selection methods. Food Chem. 2017, 221, 1989–1996.
5. Mahlein, A.K. Plant disease detection by imaging sensors—Parallels and specific demands for precision
agriculture and plant phenotyping. Plant Dis. 2016, 100, 241–251.
6. Sendin, K.; Williams, P.J.; Manley, M. Near infrared hyperspectral imaging in quality and safety evaluation
of cereals. Crit. Rev. Food Sci. Nutr. 2016, 13, 1–16.
7. Gowen, A.; O’Donnell, C.; Cullen, P.; Downey, G.; Frias, J. Hyperspectral imaging—An emerging process
analytical tool for food quality and safety control. Trends Food Sci. Technol. 2007, 18, 590–598.
8. Wu, D.; Sun, D.W. Advanced applications of hyperspectral imaging technology for food quality and safety
analysis and assessment: A review—Part I: Fundamentals. Innov. Food Sci. Emerg. Technol. 2013, 19, 1–14.

Sensors 2018, 18, 441 18 of 20
9. Pu, Y.Y.; Feng, Y.Z.; Sun, D.W. Recent progress of hyperspectral imaging on quality and safety inspection of
fruits and vegetables: A review. Compr. Rev. Food Sci. Food Saf. 2015, 14, 176–188.
10. Nicolaï, B.M.; Lötze, E.; Peirs, A.; Scheerlinck, N.; Theron, K.I. Non-destructive measurement of bitter pit in
apple fruit using NIR hyperspectral imaging. Postharvest Biol. Technol. 2006, 40, 1–6.
11. Huang, M.; Wang, Q.; Zhang, M.; Zhu, Q. Prediction of color and moisture content for vegetable soybean
during drying using hyperspectral imaging technology. J. Food Eng. 2014, 128, 24–30.
12. Baiano, A.; Terracone, C.; Peri, G.; Romaniello, R. Application of hyperspectral imaging for prediction of
physico-chemical and sensory characteristics of table grapes. Comput. Electron. Agric. 2012, 87, 142–151.
13. Schmilovitch, Z.; Ignat, T.; Alchanatis, V.; Gatker, J.; Ostrovsky, V.; Felföldi, J. Hyperspectral imaging of
intact bell peppers. Biosyst. Eng. 2014, 117, 83–93.
14. Scafutto, R.D.M.; de Souza Filho, C.R.; Rivard, B. Characterization of mineral substrates impregnated with
crude oils using proximal infrared hyperspectral imaging. Remote Sens. Environ. 2016, 179, 116–130.
15. Mahlein, A.K.; Oerke, E.C.; Steiner, U.; Dehne, H.W. Recent advances in sensing plant diseases for precision
crop protection. Eur. J. Plant Pathol. 2012, 133, 197–209.
16. Simko, I.; Jimenez-Berni, J.A.; Sirault, X.R. Phenomic approaches and tools for phytopathologists.
Phytopathology 2017, 107, 6–17.
17. West, J.S.; Bravo, C.; Oberti, R.; Lemaire, D.; Moshou, D.; McCartney, H.A. The potential of optical canopy
measurement for targeted control of field crop diseases. Annu. Rev. Phytopathol. 2003, 41, 593–614.
18. Fiorani, F.; Rascher, U.; Jahnke, S.; Schurr, U. Imaging plants dynamics in heterogenic environments.
Curr. Opin. Biotechnol. 2012, 23, 227–235.
19. Kicherer, A.; Herzog, K.; Bendel, N.; Klück, H.C.; Backhaus, A.; Wieland, M.; Rose, J.C.; Klingbeil, L.; Läbe, T.;
Hohl, C.; et al. Phenoliner: A New Field Phenotyping Platform for Grapevine Research. Sensors 2017,
17, 1625, doi:10.3390/s17071625.
20. Kuska, M.; Wahabzada, M.; Leucker, M.; Dehne, H.W.; Kersting, K.; Oerke, E.C.; Steiner, U.; Mahlein, A.K.
Hyperspectral phenotyping on the microscopic scale: Towards automated characterization of plant-pathogen
interactions. Plant Methods 2015, 11, 28, doi:10.1186/s13007-015-0073-7
21. Mahlein, A.K.; Steiner, U.; Hillnhütter, C.; Dehne, H.W.; Oerke, E.C. Hyperspectral imaging for small-scale analysis
of symptoms caused by different sugar beet diseases. Plant Methods 2012, 8, 3, doi:10.1186/1746-4811-8-3.
22. Malenovsky, Z.; Mishra, K.B.; Zemek, F.; Rascher, U.; Nedbal, L. Scientific and technical challenges in remote
sensing of plant canopy reflectance and fluorescence. J. Exp. Bot. 2009, 60, 2987–3004.
23. Drusch, M.; Moreno, J.; Del Bello, U.; Franco, R.; Goulas, Y.; Huth, A.; Kraft, S.; Middleton, E.M.; Miglietta, F.;
Mohammed, G.; et al. The FLuorescence EXplorer Mission Concept—ESA’s Earth Explorer 8. IEEE Trans.
Geosci. Remote Sens. 2017, 55, 1273–1284.
24. Fang, S.; Tang, W.; Peng, Y.; Gong, Y.; Dai, C.; Chai, R.; Liu, K. Remote Estimation of Vegetation Fraction
and Flower Fraction in Oilseed Rape with Unmanned Aerial Vehicle Data. Remote Sens. 2016, 8, 416,
doi:10.3390/rs8050416.
25. Rascher, U.; Nichol, C.J.; Small, C.; Hendricks, L. Monitoring spatio-temporal dynamics of photosynthesis
with a portable hyperspectral imaging system. Photogramm. Eng. Remote Sens. 2007, 73, 45–56.
26. Running, S.W.; Nemani, R.R. Relating seasonal patterns of the AVHRR vegetation index to simulated
photosynthesis and transpiration of forests in different climates. Remote Sens. Environ. 1988, 24, 347–367.
27. Sellers, P.J. Canopy reflectance, photosynthesis and transpiration. Int. J. Remote Sens. 1985, 6, 1335–1372.
28. Choudhury, B.J. Relationships between vegetation indices, radiation absorption, and net photosynthesis
evaluated by a sensitivity analysis. Remote Sens. Environ. 1987, 22, 209–233.
29. Inoue, Y.; Peñuelas, J. Relationship between light use efficiency and photochemical reflectance index in
soybean leaves as affected by soil water content. Int. J. Remote Sens. 2006, 27, 5109–5114.
30. Rossini, M.; Nedbal, L.; Guanter, L.; Ac, A.; Alonso, L.; Burkart, A.; Cogliati, S.; Colombo, R.; Damm, A.;
Drusch, M.; et al. Red and far red Sun-induced chlorophyll fluorescence as a measure of plant photosynthesis.
Geophys. Res. Lett. 2015, 42, 1632–1639.
31. Aasen, H.; Burkart, A.; Bolten, A.; Bareth, G. Generating 3D hyperspectral information with lightweight
UAV snapshot cameras for vegetation monitoring: From camera calibration to quality assurance. ISPRS J.
Photogramm. Remote Sens. 2015, 108, 245–259.

Sensors 2018, 18, 441 19 of 20
32. Näsi, R.; Honkavaara, E.; Tuominen, S.; Saari, H.; Pölönen, I.; Hakala, T.; Viljanen, N.; Soukkamäki, J.;
Näkki, I.; Ojanen, H.; et al. UAS based tree species identification using the novel FPI based hyperspectral
cameras in visible, NIR and SWIR spectral ranges. Int. Arch. Photogramm. Remote Sens. Spat. Inf. Sci. 2016,
XLI-B1, 1143–1148.
33. Bareth, G.; Aasen, H.; Bendig, J.; Gnyp, M.L.; Bolten, A.; Jung, A.; Michels, R.; Soukkamäki, J. Low-weight
and UAV-based hyperspectral full-frame cameras for monitoring crops: Spectral comparison with portable
spectroradiometer measurements. Photogramm. Fernerkund. Geoinf. 2015, 2015, 69–79.
34. Geelen, B.; Tack, N.; Lambrechts, A. A compact snapshot multispectral imager with a monolithically
integrated per-pixel filter mosaic. Proc. SPIE, 2014, 8974, 89740L, doi:10.1117/12.2037607.
35. Delalieux, S.; Delauré, B.; Tits, L.; Boonen, M.; Sima, A.; Baeck, P. High resolution strawberry field monitoring
using the compact hyperspectral imaging solution COSI. Adv. Anim. Biosci. 2017, 8, 156–161.
36. Vega, F.A.; Ramírez, F.C.; Saiz, M.P.; Rosúa, F.O. Multi-temporal imaging using an unmanned aerial vehicle
for monitoring a sunflower crop. Biosyst. Eng. 2015, 132, 19–27.
37. Wendel, A.; Underwood, J. Self-supervised weed detection in vegetable crops using ground based
hyperspectral imaging. In Proceedings of the 2016 IEEE International Conference on Robotics and
Automation (ICRA), Stockholm, Sweden, 16–21 May 2016; pp. 5128–5135.
38. Busemeyer, L.; Mentrup, D.; Möller, K.; Wunder, E.; Alheit, K.; Hahn, V.; Maurer, H.P.; Reif, J.C.;
Würschum, T.; Müller, J.; et al. Breedvision—A multi-sensor platform for non-destructive field-based
phenotyping in plant breeding. Sensors 2013, 13, 2830–2847.
39. Jay, S.; Bendoula, R.; Hadoux, X.; Féret, J.B.; Gorretta, N. A physically-based model for retrieving foliar
biochemistry and leaf orientation using close-range imaging spectroscopy. Remote Sens. Environ. 2016,
177, 220–236.
40. Pinto, F.; Müller-Linow, M.; Schickling, A.; Cendrero-Mateo, M.P.; Ballvora, A.; Rascher, U. Multiangular
Observation of Canopy Sun-Induced Chlorophyll Fluorescence by Combining Imaging Spectroscopy and
Stereoscopy. Remote Sens. 2017, 9, 415, doi:10.3390/rs9050415.
41. Pinto, F.; Damm, A.; Schickling, A.; Panigada, C.; Cogliati, S.; Müller-Linow, M.; Balvora, A.; Rascher, U.
Sun-induced chlorophyll fluorescence from high-resolution imaging spectroscopy data to quantify
spatio-temporal patterns of photosynthetic function in crop canopies. Plant Cell Environ. 2016, 39, 1500–1512.
42. Katsoulas, N.; Elvanidi, A.; Ferentinos, K.; Bartzanas, T.; Kittas, C. Calibration methodology of a
hyperspectral imaging system for greenhouse plant water stress estimation. Acta Hortic. 2016, 1142, 119–126.
43. Reddy, K.N.; Huang, Y.; Lee, M.A.; Nandula, V.K.; Fletcher, R.S.; Thomson, S.J.; Zhao, F. Glyphosate-resistant
and glyphosate-susceptible Palmer amaranth (Amaranthus palmeri S. Wats.): Hyperspectral reflectance
properties of plants and potential for classification. Pest Manag. Sci. 2014, 70, 1910–1917.
44. Ge, Y.; Bai, G.; Stoerger, V.; Schnable, J.C. Temporal dynamics of maize plant growth, water use, and leaf
water content using automated high throughput RGB and hyperspectral imaging. Comput. Electron. Agric.
2016, 127, 625–632.
45. Behmann, J.; Mahlein, A.K.; Rumpf, T.; Römer, C.; Plümer, L. A review of advanced machine learning
methods for the detection of biotic stress in precision crop protection. Precis. Agric. 2015, 16, 239–260.
46. Zhou, K.; Deng, X.; Yao, X.; Tian, Y.; Cao, W.; Zhu, Y.; Ustin, S.L.; Cheng, T. Assessing the Spectral Properties
of Sunlit and Shaded Components in Rice Canopies with Near-Ground Imaging Spectroscopy Data. Sensors
2017, 17, 578, doi:10.3390/s17030578.
47. Behmann, J.; Mahlein, A.K.; Paulus, S.; Kuhlmann, H.; Oerke, E.C.; Plümer, L. Calibration of hyperspectral
close-range pushbroom cameras for plant phenotyping. ISPRS J. Photogramm. Remote Sens. 2015,
106, 172–182.
48. Kruse, F.A.; Lefkoff, A.; Boardman, J.; Heidebrecht, K.; Shapiro, A.; Barloon, P.; Goetz, A. The spectral image
processing system (SIPS)-interactive visualization and analysis of imaging spectrometer data. AIP Conf. Proc.
1993, 283, 192–201.
49. Savitzky, A.; Golay, M.J. Smoothing and differentiation of data by simplified least squares procedures.
Anal. Chem. 1964, 36, 1627–1639.
50. Cortes, C.; Vapnik, V. Support Vector Networks. Machine Learning 1995, 20, 273–297.
51. Bannari, A.; Morin, D.; Bonn, F.; Huete, A.R. A review of vegetation indices. Remote Sens. Rev. 1995,
13, 95–120.
Sensors 2018, 18, 441 20 of 20
52. Purevdorj, T.S.; Tateishi, R.; Ishiyama, T.; Honda, Y. Relationships between percent vegetation cover and
vegetation indices. Int. J. Remote Sens. 1998, 19, 3519–3535.
53. Tucker, C.J. Red and photographic infrared linear combinations for monitoring vegetation. Remote Sens. Environ.
1979, 150, 127–150.
54. Gamon, J.A.; Field, C.B.; Goulden, M.L.; Griffin, K.L.; Hartley, A.E.; Joel, G.; Peñuela, J.; Valentini, R.
Relationships between NDVI, canopy structure, and photosynthesis in three Californian vegetation types.
Ecol. Appl. 1995, 5, 28–41.
55. Asrar, G.; Fuchs, M.; Kanemasu, E.T.; Hatfield, J.L. Estimating absorbed photosynthetic radiation and leaf
area index from spectral reflectance in wheat. Agron. J. 1984, 76, 300–306.
56. Daughtry, C.S.T.; Walthall, C.L.; Kim, M.S.; Colstoun, E.B.D. Estimating Corn Leaf Chlorophyll Concentration
from Leaf and Canopy Reflectance. Remote Sens. Environ. 2000, 74, 229–239.
57. Wu, C.; Niu, Z.; Tang, Q.; Huang, W. Estimating chlorophyll content from hyperspectral vegetation indices:
Modeling and validation. Agric. For. Meteorol. 2008, 148, 1230–1241.
58. Gitelson, A.A.; Merzlyak, M.N. Remote estimation of chlorophyll content in higher plant leaves. Int. J.
Remote Sens. 1997, 18, 2691–2697.
59. Iwata, H.; Ueyama, M.; Iwama, C.; Harazono, Y. A variation in the fraction of absorbed photosynthetically
active radiation and a comparison with MODIS data in burned black spruce forests of interior Alaska.
Polar Sci. 2013, 7, 113–124.
60. Nichol, C.J.; Rascher, U.; Matsubara, S.; Osmond, B. Assessing photosynthetic efficiency in an
experimental mangrove canopy using remote sensing and chlorophyll fluorescence. Trees 2006, 20, 9,
doi:10.1007/s00468-005-0005-7.
61. Li, X.P.; Björkman, O.; Shih, C.; Grossman, A.; Rosenquist, M.; Jansson, S.; Niyogi, K. A pigment-binding
protein essential for regulation of photosynthetic light harvesting. Nature 2000, 403, 391–395.
62. Niyogi, K.K.; Grossman, A.R.; Björkman, O. Arabidopsis mutants define a central role for the xanthophyll
cycle in the regulation of photosynthetic energy conversion. Plant Cell 1998, 10, 1121–1134.
63. Jackson, R.; Slater, P.; Pinter, P. Discrimination of growth and water stress in wheat by various vegetation
indices through clear and turbid atmospheres. Remote Sens. Environ. 1983, 13, 187–208.
64. Herrmann, I.; Pimstein, A.; Karnieli, A.; Cohen, Y.; Alchanatis, V.; Bonfil, D. LAI assessment of wheat and
potato crops by VENµS and Sentinel-2 bands. Remote Sens. Environ. 2011, 115, 2141–2151.
65. Horler, D.; Dockray, M.; Barber, J. The red edge of plant leaf reflectance. Int. J. Remote Sens. 1983, 4, 273–288.
66. Gamon, J.A.; Serrano, L.; Surfus, J.S. The photochemical reflectance index: An optical indicator of
photosynthetic radiation use efficiency across species, functional types, and nutrient levels. Oecologia
1997, 112, 492–501.
67. Vogelmann, J.; Rock, B.; Moss, D. Red edge spectral measurements from sugar maple leaves. Remote Sens.
1993, 14, 1563–1575.
68. Le Maire, G.; Francois, C.; Dufrene, E. Towards universal broad leaf chlorophyll indices using PROSPECT
simulated database and hyperspectral reflectance measurements. Remote Sens. Environ. 2004, 89, 1–28.
69. Chin, J.A.; Wang, E.C.; Kibbe, M.R. Evaluation of hyperspectral technology for assessing the presence and
severity of peripheral artery disease. J. Vasc. Surg. 2011, 54, 1679–1688.
70. Virlet, N.; Sabermanesh, K.; Sadeghi-Tehran, P.; Hawkesford, M.J. Field Scanalyzer: An automated robotic
field phenotyping platform for detailed crop monitoring. Funct. Plant Biol. 2017, 44, 143–153.
71. Zarco-Tejada, P.; Pushnik, J.; Dobrowski, S.; Ustin, S. Steady-state chlorophyll a fluorescence detection from
canopy derivative reflectance and double-peak red-edge effects. Remote Sens. Environ. 2003, 84, 283–294.
c© 2018 by the authors. Licensee MDPI, Basel, Switzerland. This article is an open access
article distributed under the terms and conditions of the Creative Commons Attribution
(CC BY) license (http://creativecommons.org/licenses/by/4.0/).