spectra analysis in imagic
TRANSCRIPT

A Little Introduction
This manual is a little "hands-on" first introduction to work with IMAGIC-5 in which the new user will get to know the generalities of the system and will classify spectra.
Version February 2002
All rights reserved
© Image Science Software GmbH
Berlin, Germany www.ImageSience.de

IMAGIC-5: Spectra Analysis
2
This manual contains the following chapters: ♦ INTRODUCTION
A little introduction for new users to learn the generalities of IMAGIC-5 image analysis system.
♦ CLASSIFICATION OF SPECTRA Doing some classification on spectra (1D images). ♦ RELATED REFERENCES
Some references
WELCOME TO THE
MAGIC WORLD
OF IMAGIC

IMAGIC-5: Spectra Analysis
3
Introduction
Starting IMAGIC-5: Currently, IMAGIC-5 is only running as a console application in an MS-DOS window. You must therefore first open such a MS-DOS window. Use the corresponding icon
or start a Command Prompt using Start / Programs / Command Prompt
You will get an MS-DOS window like this:
IMAGIC-5: Spectra Analysis
4
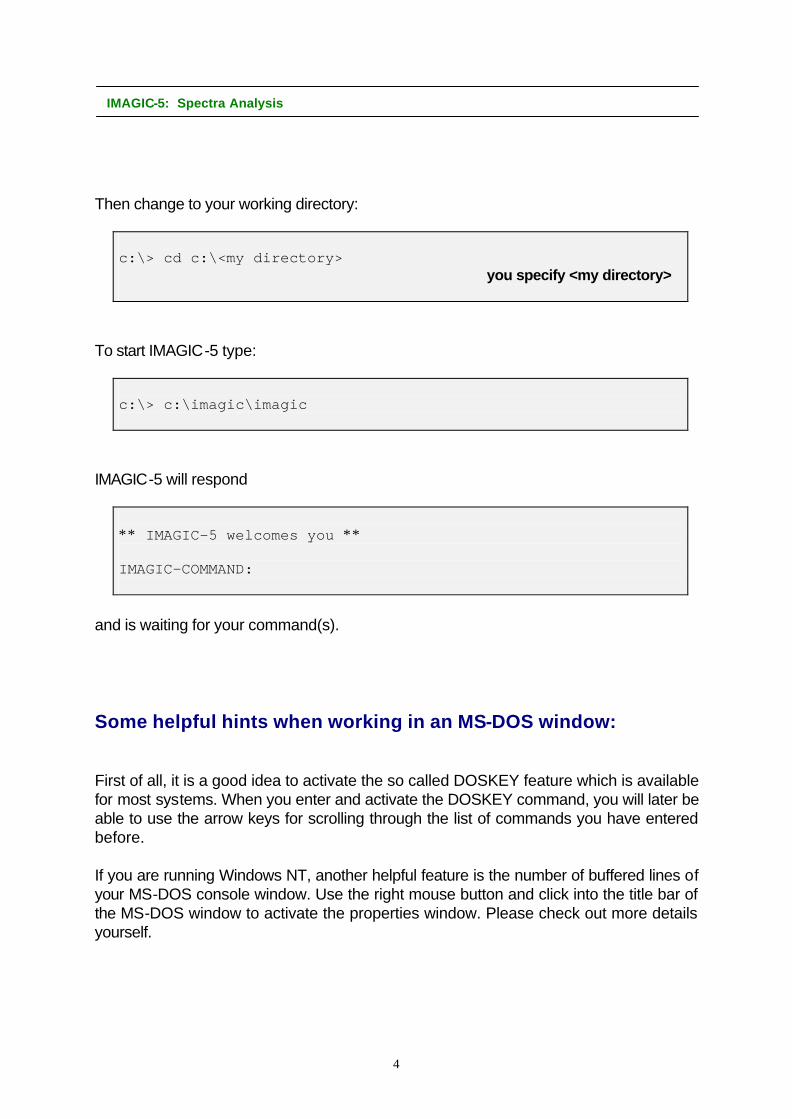
Then change to your working directory:
c:\> cd c:\<my directory> you specify <my directory>
To start IMAGIC-5 type:
c:\> c:\imagic\imagic
IMAGIC-5 will respond
∗∗ IMAGIC-5 welcomes you ∗∗ IMAGIC-COMMAND:
and is waiting for your command(s). Some helpful hints when working in an MS-DOS window: First of all, it is a good idea to activate the so called DOSKEY feature which is available for most systems. When you enter and activate the DOSKEY command, you will later be able to use the arrow keys for scrolling through the list of commands you have entered before. If you are running Windows NT, another helpful feature is the number of buffered lines of your MS-DOS console window. Use the right mouse button and click into the title bar of the MS-DOS window to activate the properties window. Please check out more details yourself.

IMAGIC-5: Spectra Analysis
5
Panic and worry: Don't ! Ø You can always give ? or HELP to get help at any level of IMAGIC-5. Ø You can ask ? for all questions that appear on the screen to get helpful explanation
of what is being asked. Ø You can always use the default answers (in brackets) by just giving CR, but, of
course, you can also type your own ones. Ø IMAGIC-5's general quit command is the ∗ . It is a legitimate answer to any question
that appears on the screen and its effect is to leave the current operation. Ø At any level of IMAGIC-5 you can give an operating system command by typing ! or
$ followed by the system command. Looking for a specific IMAGIC-5 command: Since IMAGIC-5 responds to over one-hundred different commands, it is clear that we cannot go into details. If you need assistance on valid commands you can retrieve a list of all commands by typing MENU. Example: try to find a command to import the raw spectra into IMAGIC-5:
IMAGIC-COMMAND: MENU *import
You will get a listing of all command names that have to do with "import":
IMAGIC-COMMAND: MENU *import &IMPORT-EXPORT-IMAGIC-FORMAT &IMPORT-PDB-TO-PLT
Now you can ask for specific HELP by typing:
IMAGIC-COMMAND: HELP *import

IMAGIC-5: Spectra Analysis
6
How to run an IMAGIC-5 command: Example: creating test images with command TEST-IMAGE-CREATION
IMAGIC-COMMAND: TEST-IM you can always use abbreviations of the command name ∗∗ TESTIM welcomes you ∗∗ Output filename, image loc#s [test] : ? you can give a ? to get help:
The filename consists of any string of characters that is compatible with the file system on your computer. The file filename may be followed by location numbers as in: myimage,1,20 in which case a total of 20 test images are generated by this program which occupy the first 20 locations of the image file. The file will be stored in the default directory you are working in. If you want another directory specify that by using the correct prefixes. Output filename, image loc#s [test] : you can give a system command (for example to list the directory) by using a ! or $:
Output filename, image loc#s [test] : $ dir *.img
(MS-DOS style) (Unix style: ! ls *.img) my_file1.img my_file2.img Output filename, image loc#s [test] : if you only give RETURN then the default value in brackets (here "test") is used as your answer
Image dimensions X,Y [128,128] : 64,64
your own answer etc.

IMAGIC-5: Spectra Analysis
7
The DISPLAY command: One of the most frequently used IMAGIC-5 commands is DISPLAY-IMAGE. In an XWindows / Windows NT environment, you can (and often will) start multiple display windows:
IMAGIC-COMMAND: DISP ∗∗ DISPLAY welcomes you ∗∗ Input image file, image loc#s :
The first question that will appear on the screen concerns the choice of the file you wish to display; go ahead and try to get one of the test images you just created on the screen. If you have forgotten the names of the images type:
Input image file, image loc#s : $ DIR *.img MS-DOS
or:
Input image file, image loc#s : ! ls *.img UNIX
This is just an operating system call to get a list of the files you own. Look for files with the extension ".img". Specify the image file you want to display:
IMAGIC-COMMAND: DISP ∗∗ DISPLAY welcomes you ∗∗ Input image file, image loc#s : test

IMAGIC-5: Spectra Analysis
8
Before continuing IMAGIC-5 first shows you some information about the specified image(s), like:
Image name and parameters [and history]: TEST IMAGE SIZE: 64,64 LOC: 1 TYPE: REAL CREA.DATE:21-10-1999 TESTIM:SIEMENS STAR,
In a windows environment IMAGIC-5 will ask you to give the display window size, for example:
Give size of the display window [512,512] : 800,600
Then IMAGIC-5 will show a list of all parameters (display settings) that are currently set for displaying your images, for example:
Current DISPLAY settings: Input image FILE name : test LOCATION numbers : 1 to: 3 Output DEVICE : XWINDOW SCALE factor : 1.0000 MINX, MAXX : 1 to: 64 MINY, MAXY : : 1 to: 64 GREYVALUES : : AUTOMATIC ERASE screen : : NO STARTing point (top left) : 1 , 1 Display of NAME and location : LOCATION Video lookup table (VLT) : STANDARD BLACK/WHITE Change parameter settings (ERASE,SCALE,LOC,START,SCAN,SAVE,BYE ...)? [NO] :
If you do not understand the meaning of a parameter, don't hesitate to answer ? .

IMAGIC-5: Spectra Analysis
9
Then just give RETURN, which means "NO MORE CHANGES". IMAGIC-5 will display your image(s) and will return to the parameter setting as shown above.
Change parameter settings (ERASE,SCALE,LOC,START,SCAN,SAVE,BYE ...)? [NO].: NO
If you want to change some of the parameters, please look at the words written in uppercase. If you answer the question "Change parameter settings ?" by typing such a word you can change the corresponding parameter(s). Example: In the parameter setting above the scale factor is 1.0. If you want a scaling of 2.3, answer:
Change parameter settings (ERASE,SCALE,LOC,START,SCAN,SAVE,BYE ...)? [NO] : SCALE
IMAGIC-5 will show you the current image size and ask you the next question:
Image size is : 64 x 64 Give scale factor for display [Def=1] :
You can specify the desired value, like:
Image size is : 64 x 64 Give scale factor for display [Def=1] : 2.3
IMAGIC-5: Spectra Analysis
10
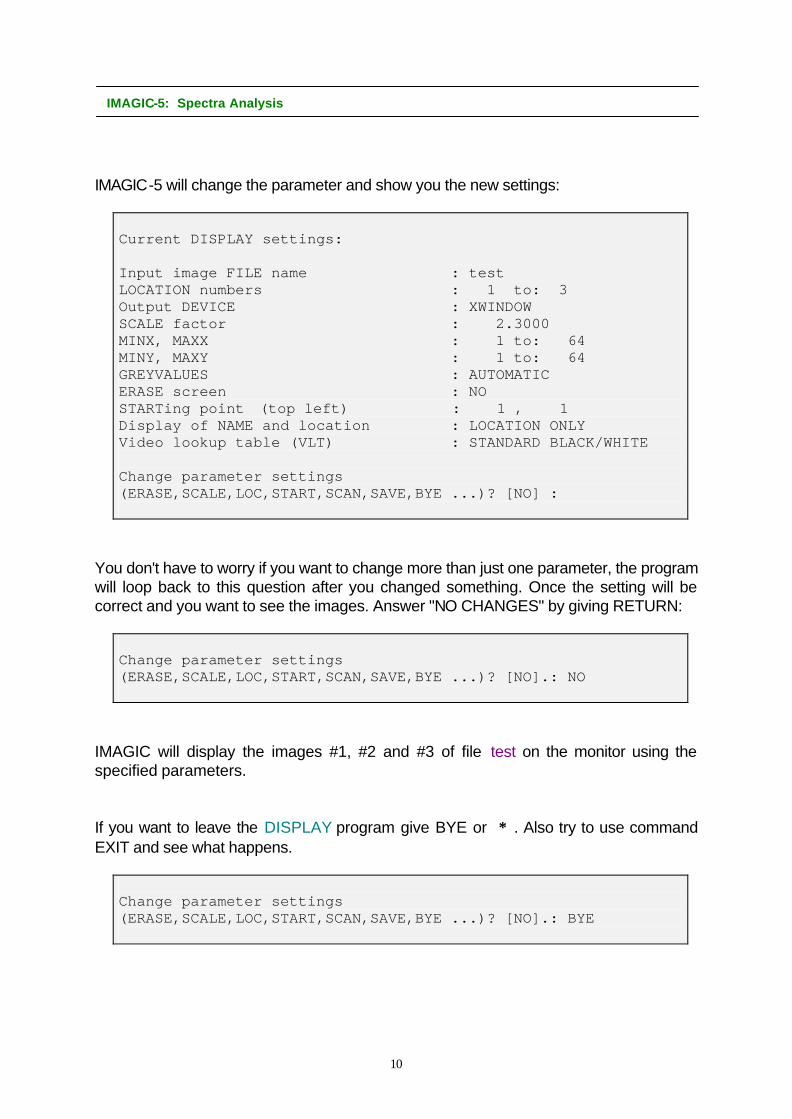
IMAGIC-5 will change the parameter and show you the new settings:
Current DISPLAY settings: Input image FILE name : test LOCATION numbers : 1 to: 3 Output DEVICE : XWINDOW SCALE factor : 2.3000 MINX, MAXX : 1 to: 64 MINY, MAXY : 1 to: 64 GREYVALUES : AUTOMATIC ERASE screen : NO STARTing point (top left) : 1 , 1 Display of NAME and location : LOCATION ONLY Video lookup table (VLT) : STANDARD BLACK/WHITE Change parameter settings (ERASE,SCALE,LOC,START,SCAN,SAVE,BYE ...)? [NO] :
You don't have to worry if you want to change more than just one parameter, the program will loop back to this question after you changed something. Once the setting will be correct and you want to see the images. Answer "NO CHANGES" by giving RETURN:
Change parameter settings (ERASE,SCALE,LOC,START,SCAN,SAVE,BYE ...)? [NO].: NO
IMAGIC will display the images #1, #2 and #3 of file test on the monitor using the specified parameters. If you want to leave the DISPLAY program give BYE or ∗ . Also try to use command EXIT and see what happens.
Change parameter settings (ERASE,SCALE,LOC,START,SCAN,SAVE,BYE ...)? [NO].: BYE

IMAGIC-5: Spectra Analysis
11
The PLOT command: This command is working (in a similar way) like DISPLAY but is used to display curves, profiles, spectra stored in either IMAGIC-5 plt format or as one-dimensional (1D) IMAGIC-5 image files. The design of PLOT is similar to the one of DISPLAY. There are also many options which you can choose and which are shown in "Current PLOT settings". Option NO CHANGE also means everything is specified, go ahead and display the curve.The command can be started by giving PLOT. Image sequences in IMAGIC-5 Every IMAGIC-5 image file can contain a sequence of images. All images in the sequence will automatically be treated by the procedure unless the user specifies a set of image location numbers explicitly, like in:
IMAGIC-COMMAND: COPY-IM ∗∗ COPYIM welcomes you ∗∗ Input file, image loc#s : test,10,64
etc.
in which case the images number 10 to 64 are used- The IMAGIC-5 co-ordinate system The IMAGIC-5 co-ordinate system is a right-handed system with its (1,1) origin in the top-left corner of the image. The length of the lines (number of rows/columns) is IYLP1 and the number of lines is IXLP1: 1,1 Y-co-ord. IYLP1 X-co-ord. IXLP1

IMAGIC-5: Spectra Analysis
12
The centre of the image, for almost all operations on the image, is given by: (IXMID,IYMID) = ( IXLP1/2 + 1 , IYLP1/2 + 1 ). This point is also the default centre of rotational symmetric masks and the like. Starting IMAGIC-5 from many windows You can start IMAGIC-5 in more than only one terminal window. For example: it can be very helpful to use one window for command DISPLAY while playing around / testing filter parameters with command BAND-PASS-FILTER in an other window.

IMAGIC-5: Spectra Analysis
13
Classification of Spectra
The purpose of this chapter is to provide the user with guidance in a practical hands-on to classify spectra.
All rights reserved
© Image Science Software GmbH
Berlin, Germany http://www.ImageScience.de

IMAGIC-5: Spectra Analysis
14
Import Spectra Data The spectra are stored as lines of a two-dimensional (2D) image, which is stored as "raw data" in integer 16bit format and which was created a Silicon Graphics workstation. First convert this image into IMAGIC-5 format: Call IMPORT-EXPORT-IMAGIC-FORMAT or EM2EM, respectively:
IMAGIC-COMMAND: EM2EM ∗∗ EM2EM welcomes you ∗∗ Data format of the input to be converted : RAW Export to which data format [?] : IMAGIC Input = set of 2D sections of a 3D volume: NO Input image file (WITH EXT.) : 7700scans.dat
You select
Mode of input : 2D
The spectra are stored as 2D image
Give image dimensions X,Y) : 7700,1552 Data type of the input file : INTG Move the input image upside down : NO Workstation of input file : Silicon Output image file (NO EXT.) : scans
You select
Pixel spacing in Angstroem (X,Y,Z) : 0,0,0
Not important here
In the example we called the IMAGIC-5 file "scans".

IMAGIC-5: Spectra Analysis
15
Check the converted image Use command DISPLAY to check the imported image. Since the monitor screen is smaller than the image size, the image will automatically be scaled with a scale factor smaller than 1. To display part(s) of the image 1:1 (SCALEFACTOR 1.0) please use the options MINX, MINY or SCAN. Use ? if you need help. Create spectra (1D images) What we really need is not one single image but a series of 1D images representing all spectra. The easiest way to do this is to simply create a new IMAGIC-5 header: Call CREATE-HEADER:
IMAGIC-COMMAND: CREATE-HEAD ∗∗ CREAHEAD welcomes you ∗∗ Output header filename, loc#s : scans,1,7700
Number of spectra
Give image dimensions X,Y : 1,1552
Length of spectra
Data type : INTG
Same as before
Give title : B800 BANDE
You can give a headers text (info)
Now IMAGIC-5 will interprete the input file (scans) as a series (of 7700) 1D images You can display (plot) the various curves by using command PLOT. The design of PLOT is similar to the one of DISPLAY. There are also many options which you can choose and which are shown in "Current PLOT settings". Option NO CHANGE also means everything is specified, go ahead and display the curve.

IMAGIC-5: Spectra Analysis
16
Normalisation and band-pass filter: There are a number of IMAGIC-5 commands to normalise, filter, manipulate 1D images (curves, spectra). If you you want to do so try to play around with commands like:
ARITHM-WITH-CURVE CUT-CURVE FILTER-CURVE MSA-CURVE-MASK PRETREAT-CURVE
As usual use HELP ëARITHM (for example) for details and/or ? if you need help to answer a certain question. Concerning filter parameters (in command FILTER-CURVE, for example): If you want to calculate the frequency cut-off in terms of spatial frequency, then here is an example. Say that the image is scanned such that each pixel is of size x. Then in the Fourier transform, the edge of the image corresponds to the maximum spatial frequency 1 / (2 ∗ x). Remember that the centre of the transform is zero spatial frequency. Thus a fraction f (between 0 and 1) corresponds to a spatial frequency of f 2 ∗ x

IMAGIC-5: Spectra Analysis
17
Multivariate statistical analysis (MSA): Input images are the original or manipulated 1D images (scans). Call MSA-RUN:
IMAGIC-COMMAND: MSA-RUN ∗∗ MSA welcomes you ∗∗ Choose mode: FRESH-MSA, REFINE [F] : fresh Distance: EUCLIDIAN, CHISQUARE, MODULATION : modulation use modulation distance
Filename input aligned "images" : scans Are there any inactive images? [NO] : no if wanted some specta can be excluded
Give input MSA mask file [none] : none Eigenimages output file : scans_eigen Pixel coordinates output file : scans_pixcoos Eigenpixel vectors output file : scans_eigenpix Give number of iterations (<64) : 24 "real science": >23 Give number of eigenimages (<69) : 68 Overcorrection factor (0< ocf< 0.9) : 0.8 Rootname for registration files : scans_msa
The results of MSA-RUN are mainly stored in the header file of the input images, in an ASCII registration file (scans_msa.lis) and in the (output) eigenimages (scans_eigen), which you can visualise with PLOT. Classification: The next step is the classification within the hyper-space created by MSA-RUN. Call MSA-CLASSIFY:
IMAGIC-COMMAND: MSA-CLASSIFY ∗∗ CLASSIFY welcomes you ∗∗ Input to be classified [IMAGES] : images Input images file (treated by MSA) : scans Percentage of images to be ignored [0] : 0 Active factors for classification? [69] : 69 this number must be less/equal the one used in MSA-RUN
IMAGIC-5: Spectra Analysis
18
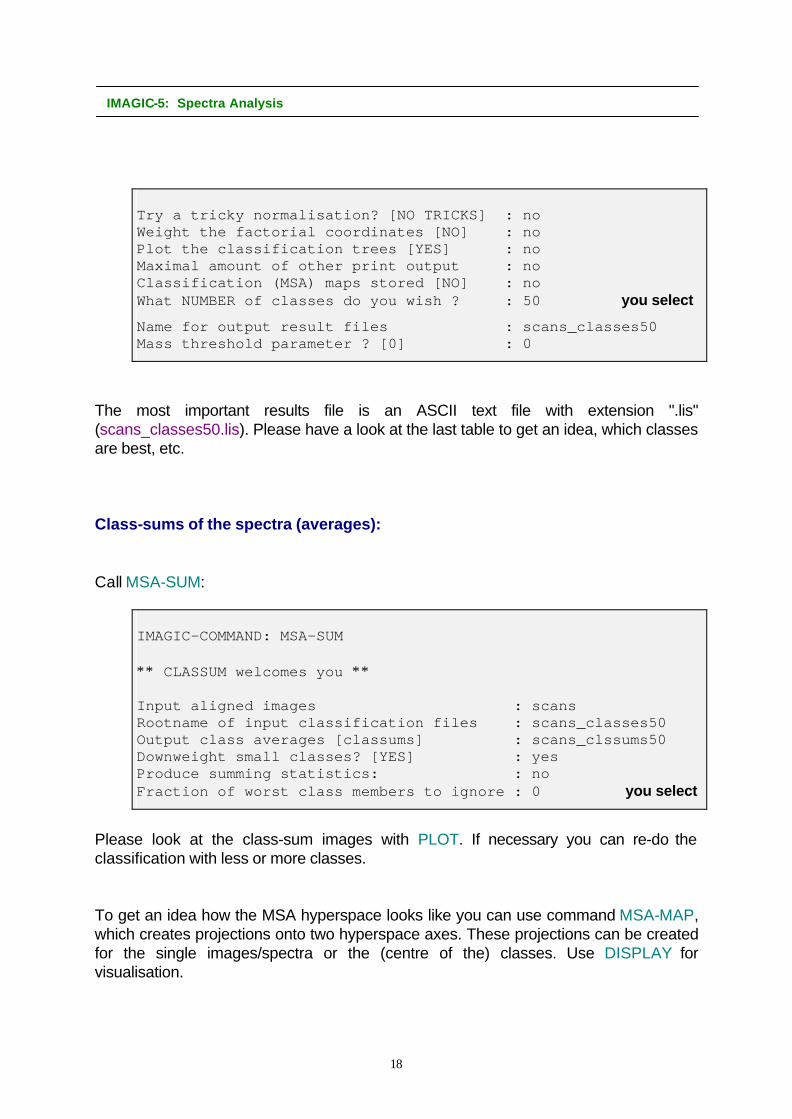
Try a tricky normalisation? [NO TRICKS] : no Weight the factorial coordinates [NO] : no Plot the classification trees [YES] : no Maximal amount of other print output : no Classification (MSA) maps stored [NO] : no What NUMBER of classes do you wish ? : 50 you select
Name for output result files : scans_classes50 Mass threshold parameter ? [0] : 0
The most important results file is an ASCII text file with extension ".lis" (scans_classes50.lis). Please have a look at the last table to get an idea, which classes are best, etc. Class-sums of the spectra (averages): Call MSA-SUM:
IMAGIC-COMMAND: MSA-SUM ∗∗ CLASSUM welcomes you ∗∗ Input aligned images : scans Rootname of input classification files : scans_classes50 Output class averages [classums] : scans_clssums50 Downweight small classes? [YES] : yes Produce summing statistics: : no Fraction of worst class members to ignore : 0 you select
Please look at the class-sum images with PLOT. If necessary you can re-do the classification with less or more classes. To get an idea how the MSA hyperspace looks like you can use command MSA-MAP, which creates projections onto two hyperspace axes. These projections can be created for the single images/spectra or the (centre of the) classes. Use DISPLAY for visualisation.

IMAGIC-5: Spectra Analysis
19
Publication Write a nice paper for Nature, Science, etc. This writing you have to do yourself as, unfortunately, the corresponding IMAGIC-5 commands (WRITE-FOR-NATURE, etc.) are still in preparation.

IMAGIC-5: Spectra Analysis
20
Related References
Some image processing references for your further reading enjoyment: M van Heel, B Gowen, R Matadeen, EV Orlova, R Finn, T Pape, D Cohen, H Stark, R Schmidt, M Schatz and A Patwardhan (2000) Single-particle electron cryo-microscopy: towards atomic resolution. Q. Rev. Biophys. 33: 307-369. WebPages: www.ImageScience.de www.ImageScience.de/imagic IMAGIC-5 M van Heel and W Keegstra (1981) IMAGIC: A fast, flexible and friendly image analysis software system. Ultramicroscopy 7: 113-130. M van Heel, G Harauz, EV Orlova, R Schmidt and M Schatz (1996) A new generation of the IMAGIC image processing system. J. Struct. Biol. 116: 17-24. Multivariate Statistical Analysis and Classification M van Heel and J Frank (1981) Use of multivariate statistics in analyzing the images of biological macromolecules. Ultramicroscopy 6: 187-194. M van Heel (1984) Multivariate statistical classification of noisy images (of randomly oriented biological macromolecules). Ultramicroscopy 13: 165-183. M van Heel (1989) Classification of very large electron microscopical data sets. Optik 82: 114-126.

IMAGIC-5: Spectra Analysis
21
Image analysis M Schatz, EV Orlova, P Dube, H Stark, F Zemlin and M van Heel (1997) Angular reconstitution in 3D electron microscopy: Practical and technical aspects. Scanning Micros. 11 (1997) 179-193. M van Heel, EV Orlova, G Harauz, H Stark, P Dube, F Zemlin and M Schatz (1997) Angular reconstitution in 3D electron microscopy: Historical and theoretical aspects. Scanning Micros. 11:195-210. FT-IR classification D Naumann, V Fijala and H Labischinski (1988) The differentiation and identification of pathogenic bacteria using FT-IR and multivariate statistical analysis. Mikrochim. Acta I, 373-377