spectral envelope analysis of timit corpus using lp, wlsp, and mvdr steve vest matlab implementation...
TRANSCRIPT
Spectral envelope analysis of TIMIT corpususing LP, WLSP, and MVDR
Steve Vest
Matlab implementation of methods by Tien-Hsiang Lo

Overview
• Methods• WLSP• MVDR
• TIMIT corpus
• Measurements

Analysis methods
• LP• Linear Prediction using autocorrelation method
• WLSP• Weighted-sum Line Spectrum Pairs
• MVDR• Minimum Variance Distortionless Response
• MVDR of WLSP• MVDR applied to WLSP coefficients

WLSP
• Purpose: Increase spectral dynamics between peaks and valleys in spectral envelope• Maximizes difference between peak and valley
amplitudes• Uses autocorrelation values beyond N to obtain
better accuracy
• When applied to Speech coding• Improves quality of decoded speech• Attenuates quantization noise level in the valleys
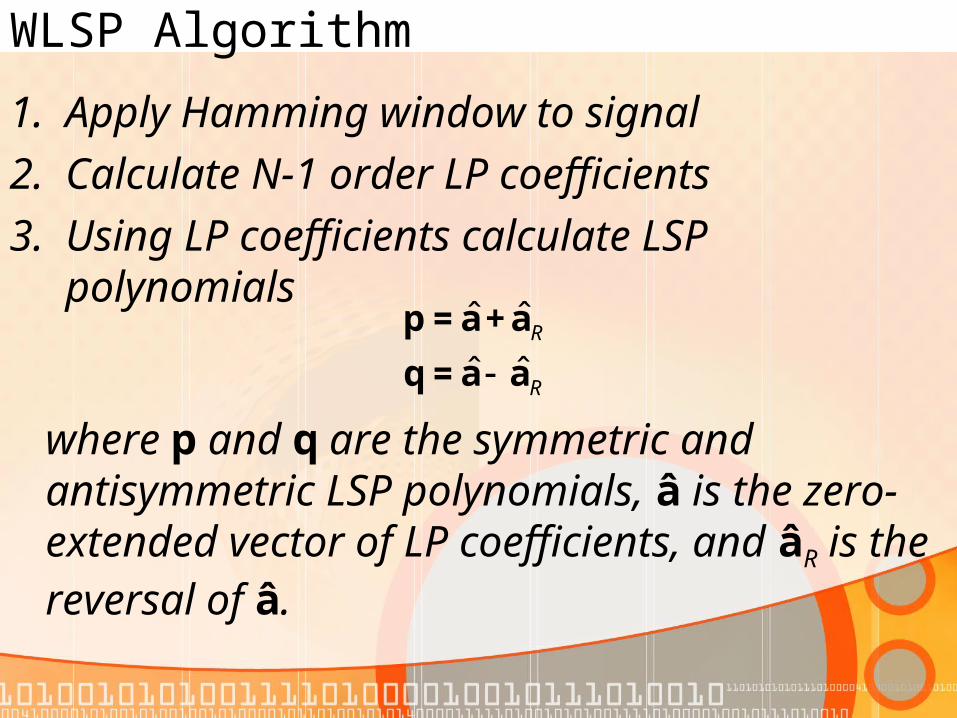
WLSP Algorithm
1. Apply Hamming window to signal
2. Calculate N-1 order LP coefficients
3. Using LP coefficients calculate LSP polynomials
ˆ ˆ
ˆ ˆR
Rp = a +a
q = a a
where p and q are the symmetric and antisymmetric LSP polynomials, â is the zero-extended vector of LP coefficients, and âR is the reversal of â.

WLSP Algorithm
3. Calculate WLSP polynomial
4. λ is the weighting parameter chosen to minimize the error between the autocorrelations of the speech and the WLSP all-pole filter impulse response• autocorrelations match n=1:N
• Minimize SSE for n=N+1:N+1+L
1
0,1
d p q

WLSP vs. LP

MVDR
• Estimates the power at each frequency by applying a special FIR filter
• Distortionless constraint• FIR filter minimizes the total output power while
preserving unity gain at the estimating frequency• Solving for distortionless filter is a constrained
optimization problem
• More robust modeling method than LP but can be equated from LP

MVDR Algorithm
1. Calculate LP coefficients ak
2. Calculate MVDR coefficients μk
*
0
*
11 2 , for 0 :
, for : 1
N k
i i kiek
k
N k i a a k NP
k N
Note that MVDR coefficients are symmetric and have order 2N+1

MVDR vs. LP

MVDR of WLSP
• Just an exercise out of curiosity• Performs WLSP• Performs MVDR using coefficients from WLSP
instead of LP
• Resulting conclusion• It’s a bad idea…
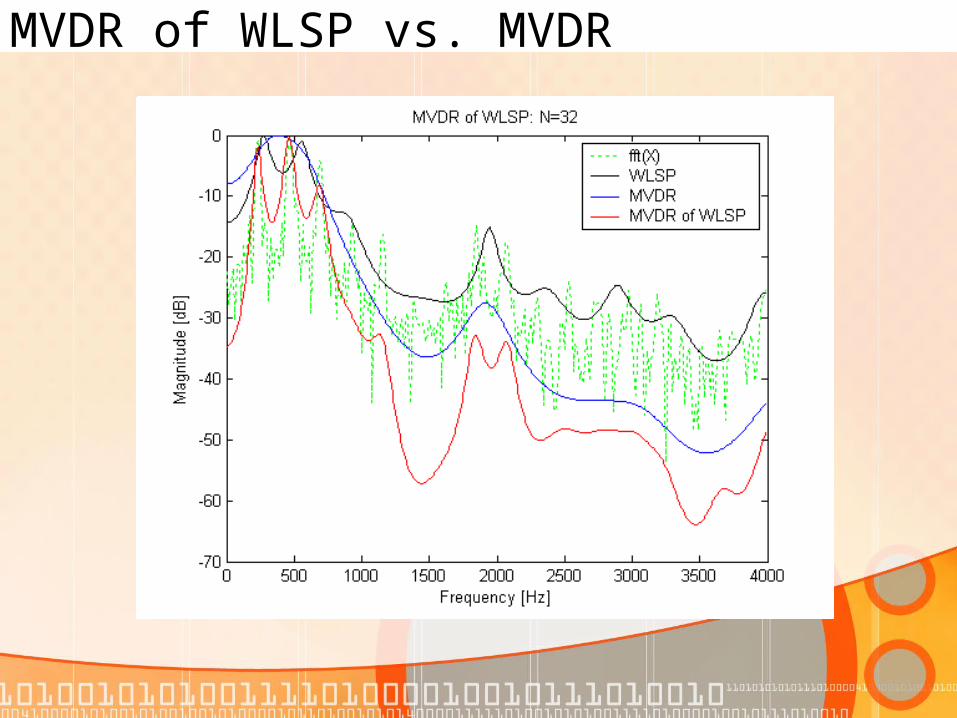
MVDR of WLSP vs. MVDR

TIMIT corpus
• “The TIMIT corpus of read speech has been designed to provide speech data forthe acquisition of acoustic-phonetic knowledge and for the development andevaluation of automatic speech recognition systems.”
• Large collection of speech samples from 8 regions of the USA
• Samples are phonetically labeled

TIMIT regions
• Region 1: New England
• Region 2: Northern
• Region 3: North Midland
• Region 4: South Midland
• Region 5: Southern
• Region 6: New York City
• Region 7: Western
• Region 8: Army Brat (moved around)
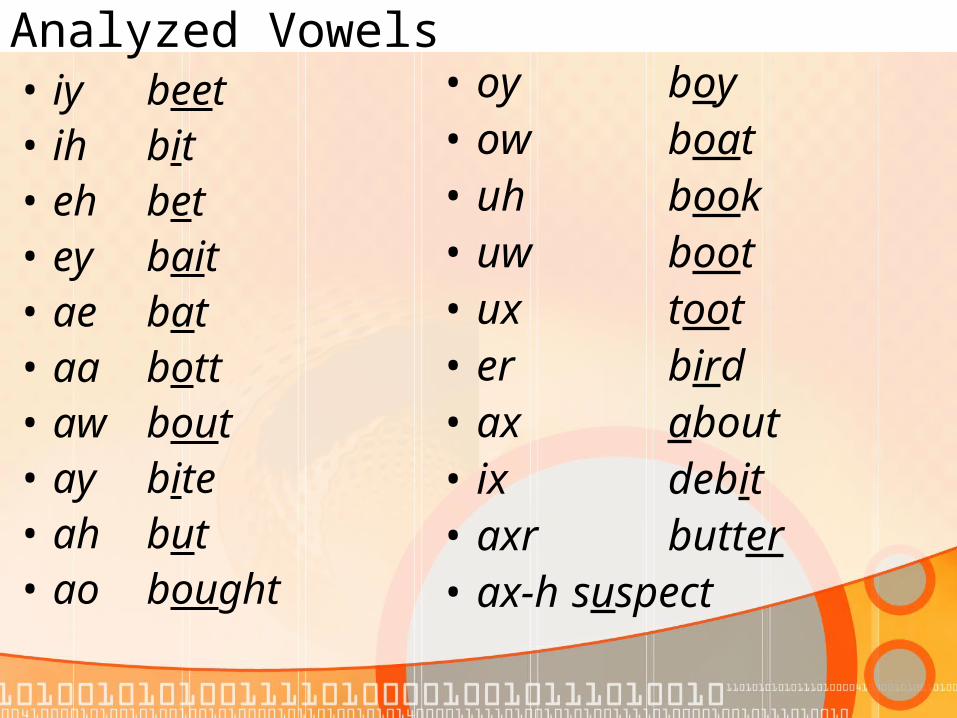
Analyzed Vowels• iy beet• ih bit• eh bet• ey bait• ae bat• aa bott• aw bout• ay bite• ah but• ao
bought
• oy boy• ow boat• uh book• uw boot• ux toot• er bird• ax about• ix debit• axr butter• ax-h suspect
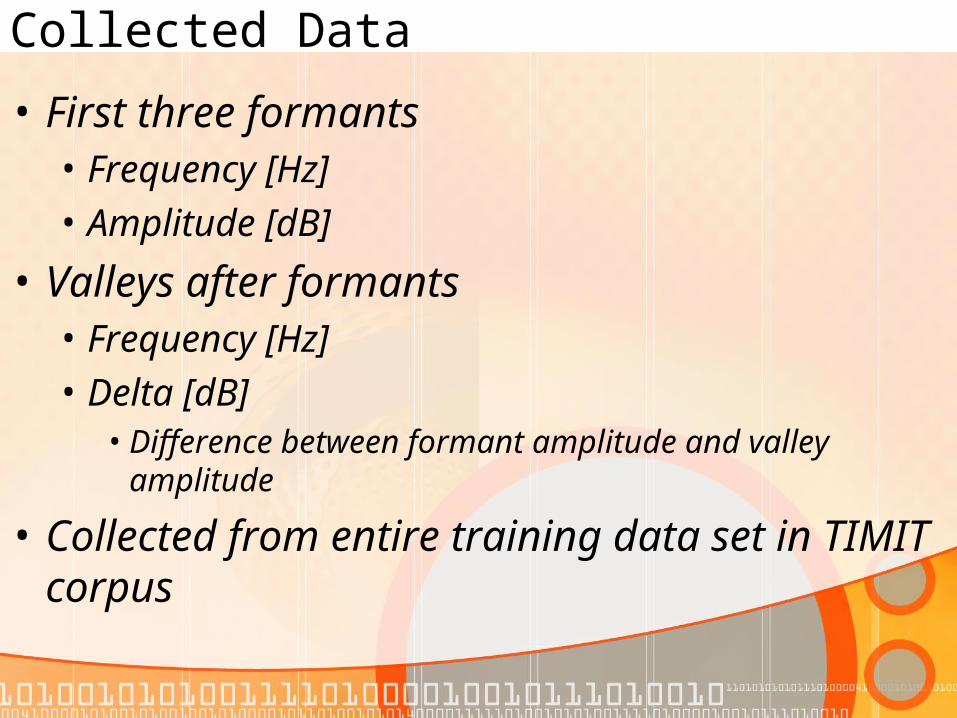
Collected Data
• First three formants• Frequency [Hz]• Amplitude [dB]
• Valleys after formants• Frequency [Hz]• Delta [dB]• Difference between formant amplitude and valley
amplitude
• Collected from entire training data set in TIMIT corpus

Collected Data
• Data organized by:• Vowel• Region• Sex• Spectral approximation method• Trineme• Phonemes preceding and following vowel
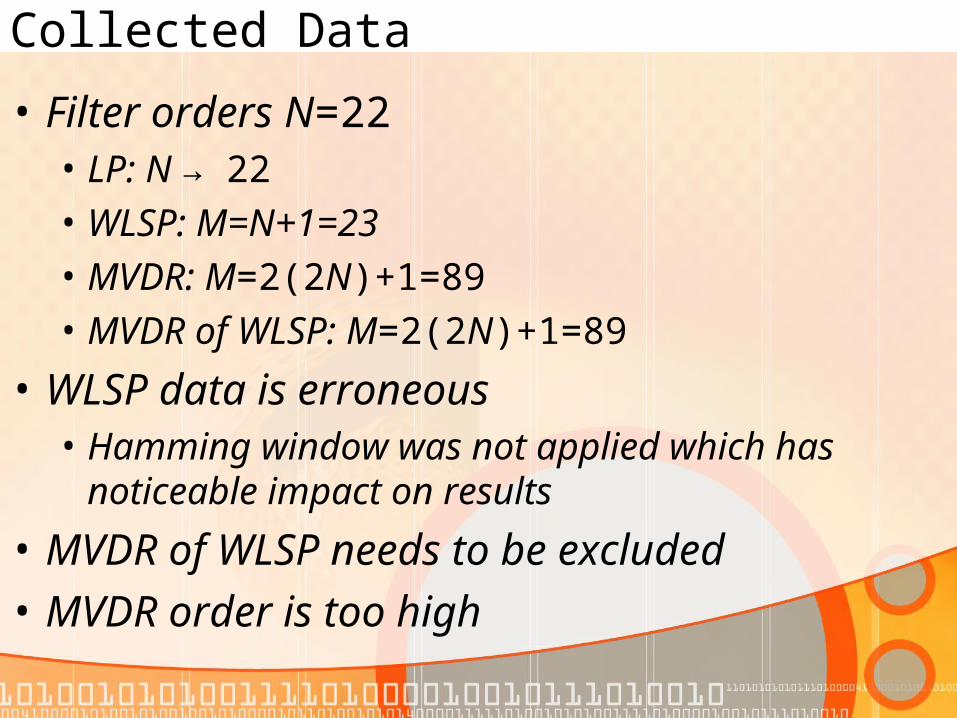
Collected Data
• Filter orders N=22• LP: N → 22
• WLSP: M=N+1=23
• MVDR: M=2(2N)+1=89
• MVDR of WLSP: M=2(2N)+1=89
• WLSP data is erroneous• Hamming window was not applied which has
noticeable impact on results
• MVDR of WLSP needs to be excluded
• MVDR order is too high

General Observations
• Formant locations vary greatly• Between different speakers• Between different Trinemes• 100-200 Hz for F1• 300-600 Hz for F2• 600-1000 Hz for F3
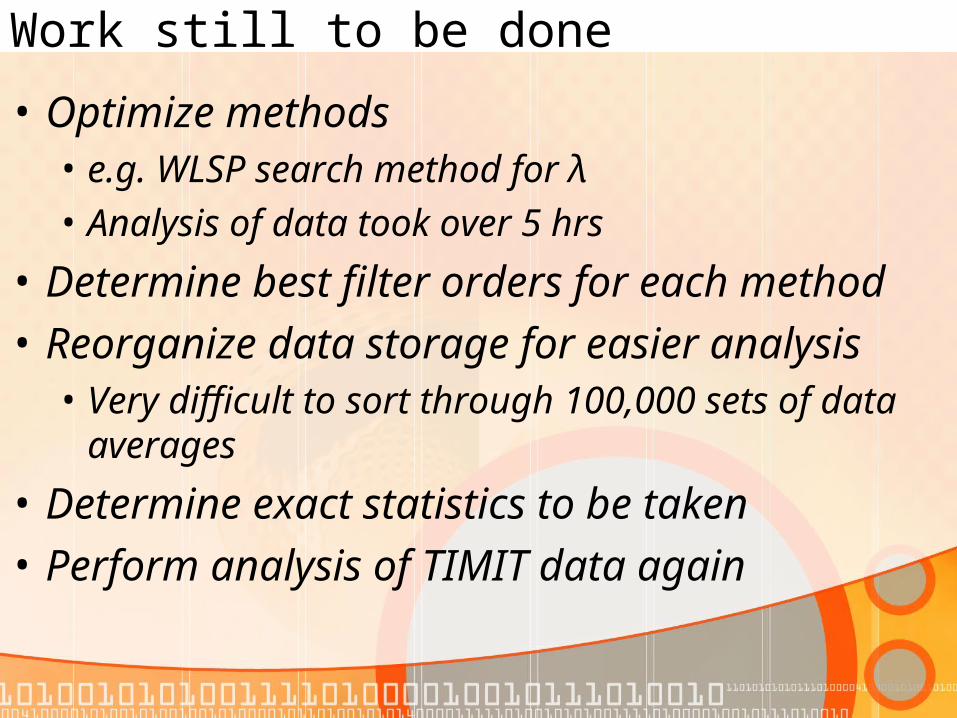
Work still to be done
• Optimize methods• e.g. WLSP search method for λ• Analysis of data took over 5 hrs
• Determine best filter orders for each method
• Reorganize data storage for easier analysis• Very difficult to sort through 100,000 sets of data
averages
• Determine exact statistics to be taken
• Perform analysis of TIMIT data again

Sources
• Murthi, Manohar N. “All-Pole Modeling of Speech Based on the Minimum Variance Distortionless Response Spectrum”. IEEE Transactions on Speech and Audio Processing, Vol. 8, No. 3, May 2000
• Backstrom, Tom. “All-Pole Modeling Technique Based on Weighted Sum of LSP Polynomials”. IEEE Signal Processing Letters, Vol. 10, No. 6, June 2003