spectral subband centroids for tone vocoder simulations of ...block diagram of vocoder simulation of...
TRANSCRIPT
Spectral Subband Centroids for Tone Vocoder
Simulations of Cochlear Implants
Anwesha Chatterjee and Kuldip Paliwal Signal Processing Laboratory, Griffith University, Brisbane, Australia
Email: {a.chatterjee, k.paliwal}@griffith.edu.au
Abstract—Cochlear Implants (CIs) have long been used to
partially restore hearing in profoundly deaf individuals
through direct electrical stimulation of the auditory nerve.
Changes in pitch due to electrode selection have been shown
to conform to the tonotopic organisation of the cochlea; i.e.,
each electrode corresponds to a localised band of the human
hearing spectrum. Studies have shown that it may be
possible to produce intermediate place percepts in some
patients by stimulating pairs of adjacent electrodes
simultaneously. Tone vocoder simulations with 2-16 output
channels were used to evaluate the effect of producing place
cues similar to spectral subband centroids of each spectral
analysis band. Signals were generated as a sum of sine
waves positioned at the spectral subband centroid (rather
than the usual centre frequency) of the frequency band
relevant to each channel. Results showed improved vowel
and consonant intelligibility, even with as low as 4-6 output
channels.
Index Terms—auditory prosthesis, cochlear implants,
speech recognition
I. INTRODUCTION
There are three defining attributes relating to sound
processing in Cochlear Implants (CIs) - intensity,
temporal resolution and spectral resolution. The degree of
spectral resolution and its effect on speech intelligibility
has often been investigated by researchers in the context
patients [2]-[4].
CIs have generally not been capable of mimicking the
fine frequency analysis performed by the human cochlea.
This is arguably caused by the finite spectral resolution
due to the limited number of available electrodes [5], [6].
Infact, until recently, spectral information in CI processed
speech was limited to the number of implanted electrodes.
However, advancements in technology have made it
possible to increase frequency resolution without the need
for additional electrodes. “Virtual” spectral channels may
be generated by actively steering current between a pair
of adjacent electrodes, thus producing multiple unique
pitches. Electrode pairs may be stimulated simultaneously
[7], [8] or sequentially [9], [10].
In this study we make use of this “virtual-channel”
concept to produce place-specific percepts and test its
effect on speech perception. Specifically, we assess the
Manuscript received June 13, 2015; revised September 8, 2015.
effect of producing place cues similar to spectral subband
centroids of each spectral channel on vowel and
consonant intelligibility. Paliwal [11] investigated
spectral subband centroids as features for automatic
speech recognition applications, and found that as little as
3 centroids were adequate for high recognition scores.
Our interest in spectral subband centroids stems from
their similarity to formant frequencies and robustness to
noise. It is known that formant information plays a
pivotal role in vowel and consonant identity. Dorman et
al. [4] argued that frequency domain cues are a principal
factor in the identification of vowels and consonants,
even when spectral resolution is limited. They found that
relative channel amplitudes provided a crude
representation of formant frequencies even with a small
number of spectral channels. Iverson et al. [12] analysed
the importance of vowel-instrinsic formant movement
and its impact on vowel recognition. Results
demonstrated that both formant movement and duration
were important cues for vowel recognition.
Most modern CI speech coding strategies have
principles similar to that of the channel vocoder [13].
Vocoded speech primarily preserves envelope
information while discarding temporal fine-structure
detail, much like the processing in contemporary CI
speech processors, and has thus been widely used in
assessing the performance of new CI speech coding
algorithms. The coding strategy implemented in this
study was similar to the CIS strategy. The fidelity of pure
tone and noise band channel vocoders for the simulation
of front end speech processing in CIs have been
investigated by several researchers [3], [13]. Dorman et
al. [3] established that scores for CI patients fell within
the range of scores of NH listeners for a 6-channel
condition. A comparative study of the two vocoders for
CI simulations was later conducted by Whitmal et al. [14],
who then concluded that tone carriers were more accurate
at reproducing temporal speech envelope fluctuations
than white random noise. Dorman et al. [4] also argued
that CI patients who use 4-6 channels of stimulation
describe their input sound as a “beep-tone” which implies
that sinusoid vocoders are a better model for CI
simulations. An alternative simulation technique is
investigated in this paper, in which vocoder simulations
are generated with sinusoids positioned at the
corresponding spectral subband centroid of each channel.
For the sake of brevity these simulations will be referred
International Journal of Signal Processing Systems Vol. 4, No. 4, August 2016
©2016 Int. J. Sig. Process. Syst. 289doi: 10.18178/ijsps.4.4.289-294
of both Normal Hearing (NH) listeners [1] as well as CI
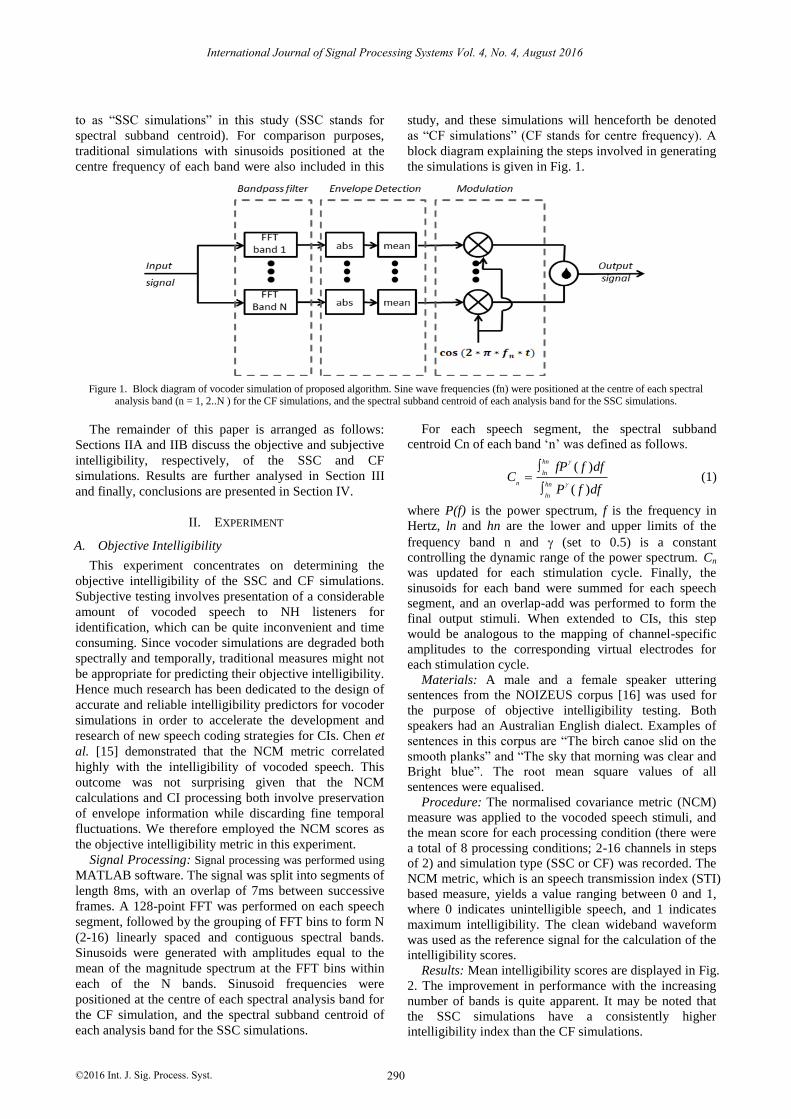
to as “SSC simulations” in this study (SSC stands for
spectral subband centroid). For comparison purposes,
traditional simulations with sinusoids positioned at the
centre frequency of each band were also included in this
study, and these simulations will henceforth be denoted
as “CF simulations” (CF stands for centre frequency). A
block diagram explaining the steps involved in generating
the simulations is given in Fig. 1.
Figure 1. Block diagram of vocoder simulation of proposed algorithm. Sine wave frequencies (fn) were positioned at the centre of each spectral analysis band (n = 1, 2..N ) for the CF simulations, and the spectral subband centroid of each analysis band for the SSC simulations.
The remainder of this paper is arranged as follows:
Sections IIA and IIB discuss the objective and subjective
intelligibility, respectively, of the SSC and CF
simulations. Results are further analysed in Section III
and finally, conclusions are presented in Section IV.
II. EXPERIMENT
A. Objective Intelligibility
This experiment concentrates on determining the
objective intelligibility of the SSC and CF simulations.
Subjective testing involves presentation of a considerable
amount of vocoded speech to NH listeners for
identification, which can be quite inconvenient and time
consuming. Since vocoder simulations are degraded both
spectrally and temporally, traditional measures might not
be appropriate for predicting their objective intelligibility.
Hence much research has been dedicated to the design of
accurate and reliable intelligibility predictors for vocoder
simulations in order to accelerate the development and
research of new speech coding strategies for CIs. Chen et
al. [15] demonstrated that the NCM metric correlated
highly with the intelligibility of vocoded speech. This
outcome was not surprising given that the NCM
calculations and CI processing both involve preservation
of envelope information while discarding fine temporal
fluctuations. We therefore employed the NCM scores as
the objective intelligibility metric in this experiment.
Signal Processing: Signal processing was performed using
MATLAB software. The signal was split into segments of
length 8ms, with an overlap of 7ms between successive
frames. A 128-point FFT was performed on each speech
segment, followed by the grouping of FFT bins to form N
(2-16) linearly spaced and contiguous spectral bands.
Sinusoids were generated with amplitudes equal to the
mean of the magnitude spectrum at the FFT bins within
each of the N bands. Sinusoid frequencies were
positioned at the centre of each spectral analysis band for
the CF simulation, and the spectral subband centroid of
each analysis band for the SSC simulations.
For each speech segment, the spectral subband
centroid Cn of each band ‘n’ was defined as follows.
( )
( )
hn
ln
n hn
ln
fP f dfC
P f df
(1)
where P(f) is the power spectrum, f is the frequency in
Hertz, ln and hn are the lower and upper limits of the
frequency band n and (set to 0.5) is a constant
controlling the dynamic range of the power spectrum. Cn
was updated for each stimulation cycle. Finally, the
sinusoids for each band were summed for each speech
segment, and an overlap-add was performed to form the
final output stimuli. When extended to CIs, this step
would be analogous to the mapping of channel-specific
amplitudes to the corresponding virtual electrodes for
each stimulation cycle. Materials: A male and a female speaker uttering
sentences from the NOIZEUS corpus [16] was used for
the purpose of objective intelligibility testing. Both
speakers had an Australian English dialect. Examples of
sentences in this corpus are “The birch canoe slid on the
smooth planks” and “The sky that morning was clear and
Bright blue”. The root mean square values of all
sentences were equalised.
Procedure: The normalised covariance metric (NCM)
measure was applied to the vocoded speech stimuli, and
the mean score for each processing condition (there were
a total of 8 processing conditions; 2-16 channels in steps
of 2) and simulation type (SSC or CF) was recorded. The
NCM metric, which is an speech transmission index (STI)
based measure, yields a value ranging between 0 and 1,
where 0 indicates unintelligible speech, and 1 indicates
maximum intelligibility. The clean wideband waveform
was used as the reference signal for the calculation of the
intelligibility scores.
Results: Mean intelligibility scores are displayed in Fig.
2. The improvement in performance with the increasing
number of bands is quite apparent. It may be noted that
the SSC simulations have a consistently higher
intelligibility index than the CF simulations.
International Journal of Signal Processing Systems Vol. 4, No. 4, August 2016
©2016 Int. J. Sig. Process. Syst. 290
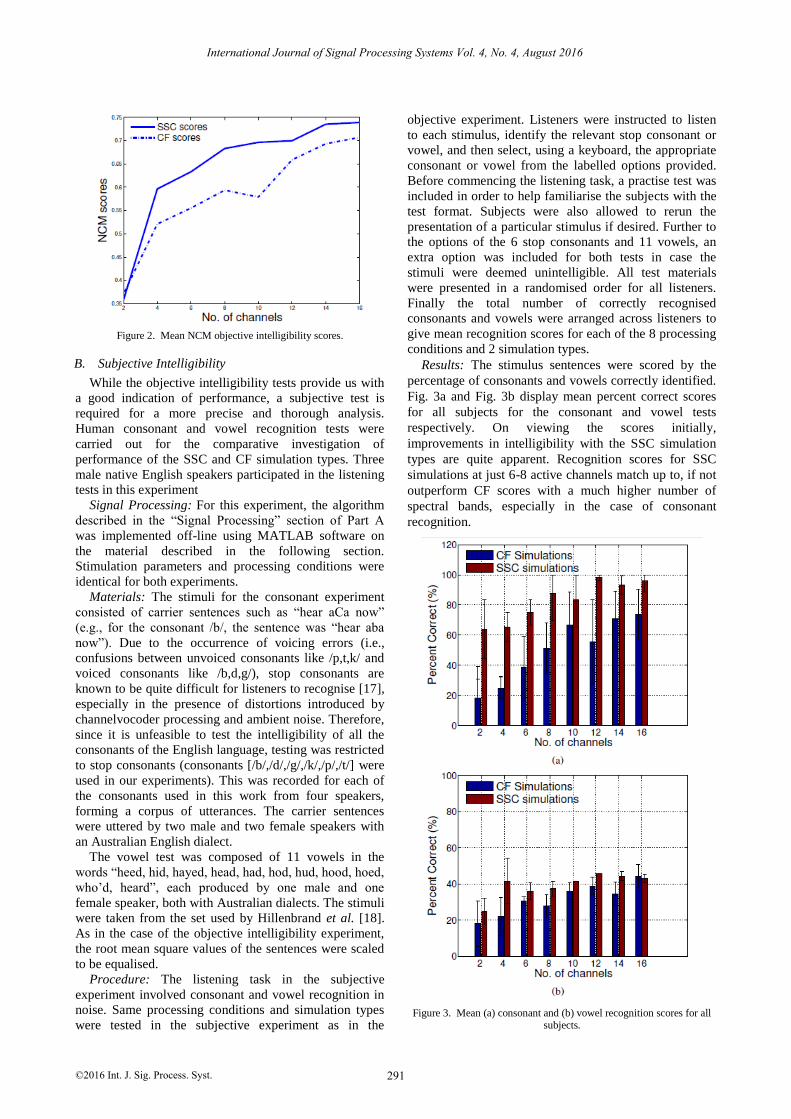
Figure 2. Mean NCM objective intelligibility scores.
B. Subjective Intelligibility
While the objective intelligibility tests provide us with
a good indication of performance, a subjective test is
required for a more precise and thorough analysis.
Human consonant and vowel recognition tests were
carried out for the comparative investigation of
performance of the SSC and CF simulation types. Three
male native English speakers participated in the listening
tests in this experiment
Signal Processing: For this experiment, the algorithm
described in the “Signal Processing” section of Part A
was implemented off-line using MATLAB software on
the material described in the following section.
Stimulation parameters and processing conditions were
identical for both experiments.
Materials: The stimuli for the consonant experiment
consisted of carrier sentences such as “hear aCa now”
(e.g., for the consonant /b/, the sentence was “hear aba
now”). Due to the occurrence of voicing errors (i.e.,
confusions between unvoiced consonants like /p,t,k/ and
voiced consonants like /b,d,g/), stop consonants are
known to be quite difficult for listeners to recognise [17],
especially in the presence of distortions introduced by
channelvocoder processing and ambient noise. Therefore,
since it is unfeasible to test the intelligibility of all the
consonants of the English language, testing was restricted
to stop consonants (consonants [/b/,/d/,/g/,/k/,/p/,/t/] were
used in our experiments). This was recorded for each of
the consonants used in this work from four speakers,
forming a corpus of utterances. The carrier sentences
were uttered by two male and two female speakers with
an Australian English dialect.
The vowel test was composed of 11 vowels in the
words “heed, hid, hayed, head, had, hod, hud, hood, hoed,
who’d, heard”, each produced by one male and one
female speaker, both with Australian dialects. The stimuli
were taken from the set used by Hillenbrand et al. [18].
As in the case of the objective intelligibility experiment,
the root mean square values of the sentences were scaled
to be equalised.
Procedure: The listening task in the subjective
experiment involved consonant and vowel recognition in
noise. Same processing conditions and simulation types
were tested in the subjective experiment as in the
objective experiment. Listeners were instructed to listen
to each stimulus, identify the relevant stop consonant or
vowel, and then select, using a keyboard, the appropriate
consonant or vowel from the labelled options provided.
Before commencing the listening task, a practise test was
included in order to help familiarise the subjects with the
test format. Subjects were also allowed to rerun the
presentation of a particular stimulus if desired. Further to
the options of the 6 stop consonants and 11 vowels, an
extra option was included for both tests in case the
stimuli were deemed unintelligible. All test materials
were presented in a randomised order for all listeners.
Finally the total number of correctly recognised
consonants and vowels were arranged across listeners to
give mean recognition scores for each of the 8 processing
conditions and 2 simulation types.
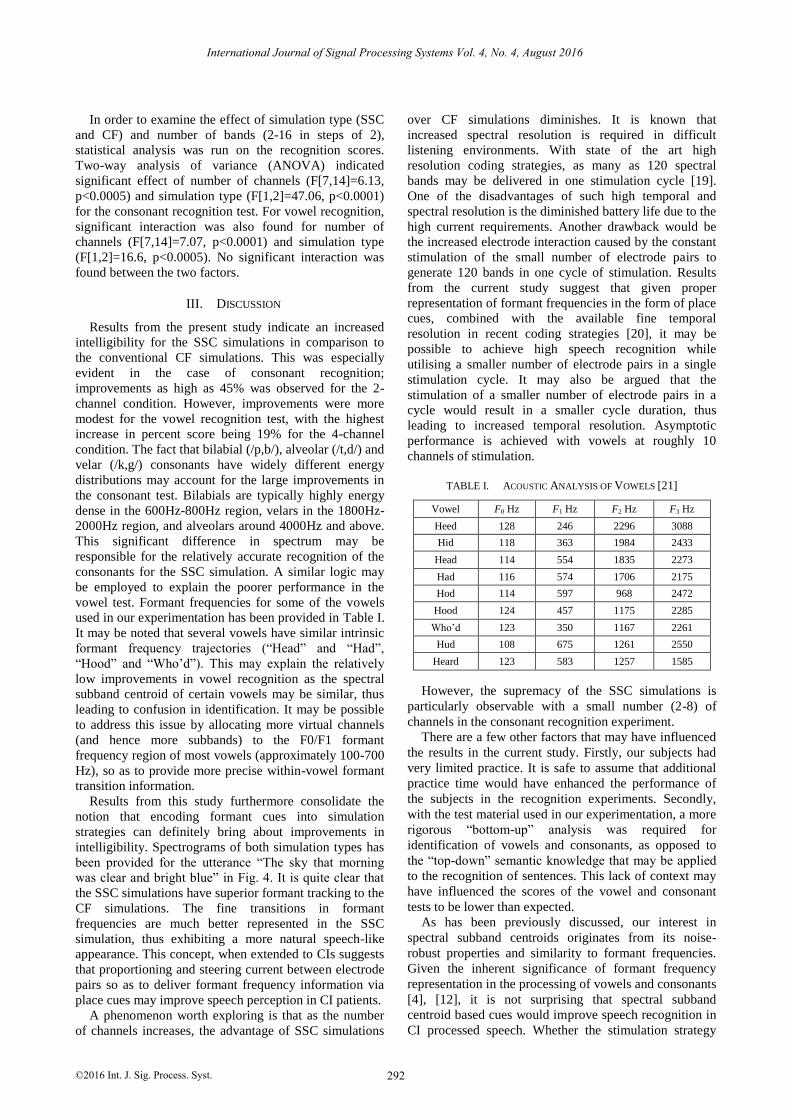
Results: The stimulus sentences were scored by the
percentage of consonants and vowels correctly identified.
Fig. 3a and Fig. 3b display mean percent correct scores
for all subjects for the consonant and vowel tests
respectively. On viewing the scores initially,
improvements in intelligibility with the SSC simulation
types are quite apparent. Recognition scores for SSC
simulations at just 6-8 active channels match up to, if not
outperform CF scores with a much higher number of
spectral bands, especially in the case of consonant
recognition.
Figure 3. Mean (a) consonant and (b) vowel recognition scores for all subjects.
International Journal of Signal Processing Systems Vol. 4, No. 4, August 2016
©2016 Int. J. Sig. Process. Syst. 291
In order to examine the effect of simulation type (SSC
and CF) and number of bands (2-16 in steps of 2),
statistical analysis was run on the recognition scores.
Two-way analysis of variance (ANOVA) indicated
significant effect of number of channels (F[7,14]=6.13,
p<0.0005) and simulation type (F[1,2]=47.06, p<0.0001)
for the consonant recognition test. For vowel recognition,
significant interaction was also found for number of
channels (F[7,14]=7.07, p<0.0001) and simulation type
(F[1,2]=16.6, p<0.0005). No significant interaction was
found between the two factors.
III. DISCUSSION
Results from the present study indicate an increased
intelligibility for the SSC simulations in comparison to
the conventional CF simulations. This was especially
evident in the case of consonant recognition;
improvements as high as 45% was observed for the 2-
channel condition. However, improvements were more
modest for the vowel recognition test, with the highest
increase in percent score being 19% for the 4-channel
condition. The fact that bilabial (/p,b/), alveolar (/t,d/) and
velar (/k,g/) consonants have widely different energy
distributions may account for the large improvements in
the consonant test. Bilabials are typically highly energy
dense in the 600Hz-800Hz region, velars in the 1800Hz-
2000Hz region, and alveolars around 4000Hz and above.
This significant difference in spectrum may be
responsible for the relatively accurate recognition of the
consonants for the SSC simulation. A similar logic may
be employed to explain the poorer performance in the
vowel test. Formant frequencies for some of the vowels
used in our experimentation has been provided in Table I.
It may be noted that several vowels have similar intrinsic
formant frequency trajectories (“Head” and “Had”,
“Hood” and “Who’d”). This may explain the relatively
low improvements in vowel recognition as the spectral
subband centroid of certain vowels may be similar, thus
leading to confusion in identification. It may be possible
to address this issue by allocating more virtual channels
(and hence more subbands) to the F0/F1 formant
frequency region of most vowels (approximately 100-700
Hz), so as to provide more precise within-vowel formant
transition information.
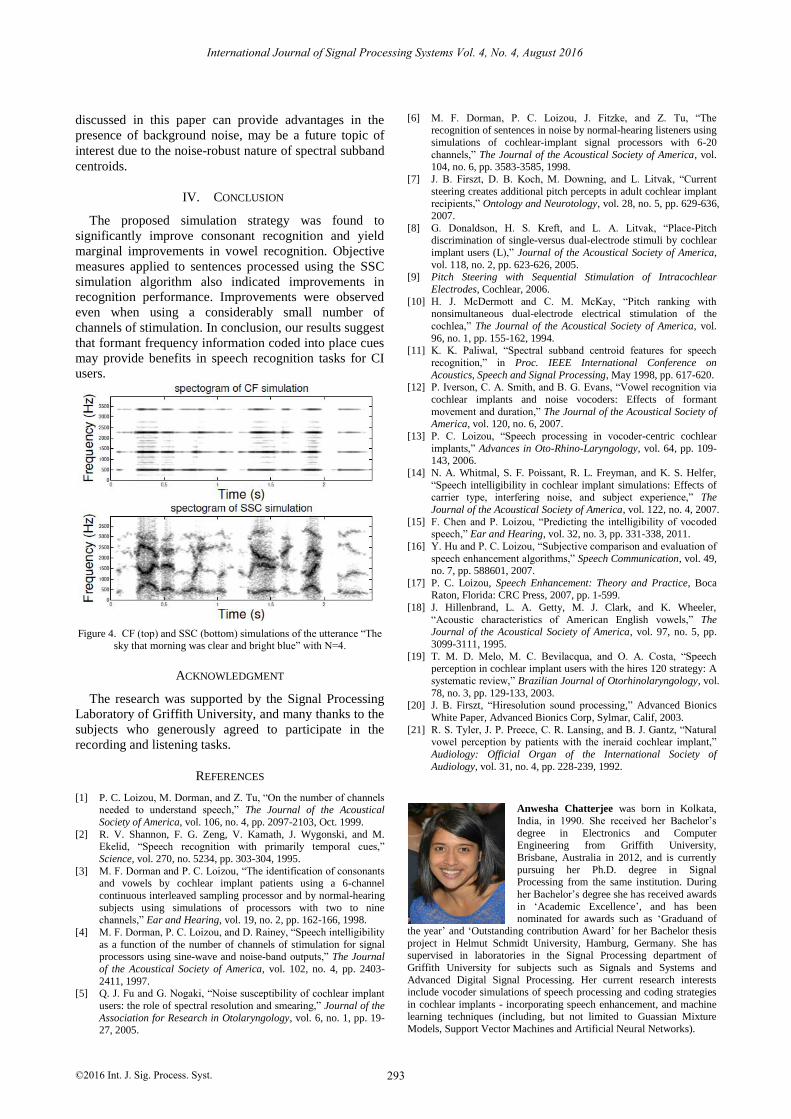
Results from this study furthermore consolidate the
notion that encoding formant cues into simulation
strategies can definitely bring about improvements in
intelligibility. Spectrograms of both simulation types has
been provided for the utterance “The sky that morning
was clear and bright blue” in Fig. 4. It is quite clear that
the SSC simulations have superior formant tracking to the
CF simulations. The fine transitions in formant
frequencies are much better represented in the SSC
simulation, thus exhibiting a more natural speech-like
appearance. This concept, when extended to CIs suggests
that proportioning and steering current between electrode
pairs so as to deliver formant frequency information via
place cues may improve speech perception in CI patients.
A phenomenon worth exploring is that as the number
of channels increases, the advantage of SSC simulations
over CF simulations diminishes. It is known that
increased spectral resolution is required in difficult
listening environments. With state of the art high
resolution coding strategies, as many as 120 spectral
bands may be delivered in one stimulation cycle [19].
One of the disadvantages of such high temporal and
spectral resolution is the diminished battery life due to the
high current requirements. Another drawback would be
the increased electrode interaction caused by the constant
stimulation of the small number of electrode pairs to
generate 120 bands in one cycle of stimulation. Results
from the current study suggest that given proper
representation of formant frequencies in the form of place
cues, combined with the available fine temporal
resolution in recent coding strategies [20], it may be
possible to achieve high speech recognition while
utilising a smaller number of electrode pairs in a single
stimulation cycle. It may also be argued that the
stimulation of a smaller number of electrode pairs in a
cycle would result in a smaller cycle duration, thus
leading to increased temporal resolution. Asymptotic
performance is achieved with vowels at roughly 10
channels of stimulation.
TABLE I. ACOUSTIC ANALYSIS OF VOWELS [21]
Vowel F0 Hz F1 Hz F2 Hz F3 Hz
Heed 128 246 2296 3088
Hid 118 363 1984 2433
Head 114 554 1835 2273
Had 116 574 1706 2175
Hod 114 597 968 2472
Hood 124 457 1175 2285
Who’d 123 350 1167 2261
Hud 108 675 1261 2550
Heard 123 583 1257 1585
However, the supremacy of the SSC simulations is
particularly observable with a small number (2-8) of
channels in the consonant recognition experiment.
There are a few other factors that may have influenced
the results in the current study. Firstly, our subjects had
very limited practice. It is safe to assume that additional
practice time would have enhanced the performance of
the subjects in the recognition experiments. Secondly,
with the test material used in our experimentation, a more
rigorous “bottom-up” analysis was required for
identification of vowels and consonants, as opposed to
the “top-down” semantic knowledge that may be applied
to the recognition of sentences. This lack of context may
have influenced the scores of the vowel and consonant
tests to be lower than expected.
As has been previously discussed, our interest in
spectral subband centroids originates from its noise-
robust properties and similarity to formant frequencies.
Given the inherent significance of formant frequency
representation in the processing of vowels and consonants
[4], [12], it is not surprising that spectral subband
centroid based cues would improve speech recognition in
CI processed speech. Whether the stimulation strategy
International Journal of Signal Processing Systems Vol. 4, No. 4, August 2016
©2016 Int. J. Sig. Process. Syst. 292
discussed in this paper can provide advantages in the
presence of background noise, may be a future topic of
interest due to the noise-robust nature of spectral subband
centroids.
IV. CONCLUSION
The proposed simulation strategy was found to
significantly improve consonant recognition and yield
marginal improvements in vowel recognition. Objective
measures applied to sentences processed using the SSC
simulation algorithm also indicated improvements in
recognition performance. Improvements were observed
even when using a considerably small number of
channels of stimulation. In conclusion, our results suggest
that formant frequency information coded into place cues
may provide benefits in speech recognition tasks for CI
users.
Figure 4. CF (top) and SSC (bottom) simulations of the utterance “The sky that morning was clear and bright blue” with N=4.
ACKNOWLEDGMENT
The research was supported by the Signal Processing
Laboratory of Griffith University, and many thanks to the
subjects who generously agreed to participate in the
recording and listening tasks.
REFERENCES
[1] P. C. Loizou, M. Dorman, and Z. Tu, “On the number of channels needed to understand speech,” The Journal of the Acoustical
Society of America, vol. 106, no. 4, pp. 2097-2103, Oct. 1999.
[2] R. V. Shannon, F. G. Zeng, V. Kamath, J. Wygonski, and M. Ekelid, “Speech recognition with primarily temporal cues,”
Science, vol. 270, no. 5234, pp. 303-304, 1995.
[3] M. F. Dorman and P. C. Loizou, “The identification of consonants and vowels by cochlear implant patients using a 6-channel
continuous interleaved sampling processor and by normal-hearing
subjects using simulations of processors with two to nine channels,” Ear and Hearing, vol. 19, no. 2, pp. 162-166, 1998.
[4] M. F. Dorman, P. C. Loizou, and D. Rainey, “Speech intelligibility
as a function of the number of channels of stimulation for signal processors using sine-wave and noise-band outputs,” The Journal
of the Acoustical Society of America, vol. 102, no. 4, pp. 2403-
2411, 1997. [5] Q. J. Fu and G. Nogaki, “Noise susceptibility of cochlear implant
users: the role of spectral resolution and smearing,” Journal of the
Association for Research in Otolaryngology, vol. 6, no. 1, pp. 19-27, 2005.
[6] M. F. Dorman, P. C. Loizou, J. Fitzke, and Z. Tu, “The recognition of sentences in noise by normal-hearing listeners using
simulations of cochlear-implant signal processors with 6-20
channels,” The Journal of the Acoustical Society of America, vol. 104, no. 6, pp. 3583-3585, 1998.
[7] J. B. Firszt, D. B. Koch, M. Downing, and L. Litvak, “Current
steering creates additional pitch percepts in adult cochlear implant recipients,” Ontology and Neurotology, vol. 28, no. 5, pp. 629-636,
2007.
[8] G. Donaldson, H. S. Kreft, and L. A. Litvak, “Place-Pitch discrimination of single-versus dual-electrode stimuli by cochlear
implant users (L),” Journal of the Acoustical Society of America,
vol. 118, no. 2, pp. 623-626, 2005. [9] Pitch Steering with Sequential Stimulation of Intracochlear
Electrodes, Cochlear, 2006.
[10] H. J. McDermott and C. M. McKay, “Pitch ranking with nonsimultaneous dual-electrode electrical stimulation of the
cochlea,” The Journal of the Acoustical Society of America, vol.
96, no. 1, pp. 155-162, 1994. [11] K. K. Paliwal, “Spectral subband centroid features for speech
recognition,” in Proc. IEEE International Conference on
Acoustics, Speech and Signal Processing, May 1998, pp. 617-620. [12] P. Iverson, C. A. Smith, and B. G. Evans, “Vowel recognition via
cochlear implants and noise vocoders: Effects of formant
movement and duration,” The Journal of the Acoustical Society of America, vol. 120, no. 6, 2007.
[13] P. C. Loizou, “Speech processing in vocoder-centric cochlear
implants,” Advances in Oto-Rhino-Laryngology, vol. 64, pp. 109-143, 2006.
[14] N. A. Whitmal, S. F. Poissant, R. L. Freyman, and K. S. Helfer,
“Speech intelligibility in cochlear implant simulations: Effects of carrier type, interfering noise, and subject experience,” The
Journal of the Acoustical Society of America, vol. 122, no. 4, 2007.
[15] F. Chen and P. Loizou, “Predicting the intelligibility of vocoded speech,” Ear and Hearing, vol. 32, no. 3, pp. 331-338, 2011.
[16] Y. Hu and P. C. Loizou, “Subjective comparison and evaluation of
speech enhancement algorithms,” Speech Communication, vol. 49, no. 7, pp. 588601, 2007.
[17] P. C. Loizou, Speech Enhancement: Theory and Practice, Boca Raton, Florida: CRC Press, 2007, pp. 1-599.
[18] J. Hillenbrand, L. A. Getty, M. J. Clark, and K. Wheeler,
“Acoustic characteristics of American English vowels,” The Journal of the Acoustical Society of America, vol. 97, no. 5, pp.
3099-3111, 1995.
[19] T. M. D. Melo, M. C. Bevilacqua, and O. A. Costa, “Speech perception in cochlear implant users with the hires 120 strategy: A
systematic review,” Brazilian Journal of Otorhinolaryngology, vol.
78, no. 3, pp. 129-133, 2003. [20] J. B. Firszt, “Hiresolution sound processing,” Advanced Bionics
White Paper, Advanced Bionics Corp, Sylmar, Calif, 2003.
[21] R. S. Tyler, J. P. Preece, C. R. Lansing, and B. J. Gantz, “Natural vowel perception by patients with the ineraid cochlear implant,”
Audiology: Official Organ of the International Society of
Audiology, vol. 31, no. 4, pp. 228-239, 1992.
Anwesha Chatterjee was born in Kolkata,
India, in 1990. She received her Bachelor’s
degree in Electronics and Computer Engineering from Griffith University,
Brisbane, Australia in 2012, and is currently
pursuing her Ph.D. degree in Signal Processing from the same institution. During
her Bachelor’s degree she has received awards
in ‘Academic Excellence’, and has been nominated for awards such as ‘Graduand of
the year’ and ‘Outstanding contribution Award’ for her Bachelor thesis
project in Helmut Schmidt University, Hamburg, Germany. She has supervised in laboratories in the Signal Processing department of
Griffith University for subjects such as Signals and Systems and
Advanced Digital Signal Processing. Her current research interests
include vocoder simulations of speech processing and coding strategies
in cochlear implants - incorporating speech enhancement, and machine learning techniques (including, but not limited to Guassian Mixture
Models, Support Vector Machines and Artificial Neural Networks).
International Journal of Signal Processing Systems Vol. 4, No. 4, August 2016
©2016 Int. J. Sig. Process. Syst. 293
Prof. Kuldip K. Paliwal obtained his Ph.D. degree from Tata Institute of Fundamental
Research, Bombay, India in 1978. He has
been carrying out research in speech processing since 1972 and has worked in
several reputed organizations such as NTH
Norway, Lucent Technologies Bell Labs, AT&T Shannon Laboratories, ATR Lab,
Japan. Since July 1993, he has been a
Professor of Telecommunication at Griffith University, Brisbane, Australia. He has co-authored more than 250
technical papers and has co-edited two books: Speech Coding and Synthesis (Elsevier) and Speech and Speaker Recognition: Advanced
Topics (Kluwer). He has received IEEE Signal Processing Society's best
(senior) paper award in 1995. He has served as associate editor of IEEE Transactions on Speech and Audio Processing and IEEE Signal
Processing Letters and as editor-in-chief of Speech Communication
Journal (Elsevier). His Research areas include Speech processing, Speech coding, Speech recognition, Speech enhancement, Speaker
recognition, Pattern recognition, artificial neural networks and Machine
learning.
International Journal of Signal Processing Systems Vol. 4, No. 4, August 2016
©2016 Int. J. Sig. Process. Syst. 294