spectral weed detection and precise spraying laboratory of agromachinery and processing els vrindts,...
TRANSCRIPT

Spectral Weed Detectionand Precise Spraying Laboratory of AgroMachinery and
ProcessingEls Vrindts, Dimitrios Moshou, Jan ReumersHerman Ramon, Josse De Baerdemaeker
Katholieke Universiteit
Research sponsored by IWT and the Belgian Ministry of Small Trade and Agriculture
Katholieke Universiteit Leuven
OverviewSpectral measurements of crops and weeds
in laboratoryin field
Processing of spectral data with neural networks Precise spraying

Katholieke Universiteit Leuven
Optical detection of weeds
Techniquesred/NIR detectors (vegetation index)image processing (color, texture, shape)remote sensing of weed patchesreflection in visible & NIR light
different detection possibilities, different scales
Requirements for on-line weed detection:fast & accurate weed detectionsynchronized with treatment

Katholieke Universiteit Leuven
Spectral weed detectionFactors affecting spectral plant
signalsleaf reflection, dependent on species and environment, stress, diseasecanopy & measurement geometrylight conditionsdetector sensitivity

Katholieke Universiteit Leuven
Spectral analysis of plant leaves
in laboratory
sample
spectrophotometer
integrating sphere
computer
Diffuse Reflectance Spectroscopy of Crop and Weed Leaves
Laboratory measurementsLaboratory measurements

Katholieke Universiteit Leuven
Diffuse Reflectance of a Leaf
0%
10%
20%
30%
40%
50%
60%
70%
200 400 600 800 1000 1200 1400 1600 1800 2000 2200 2400
wavelength (nm)
refle
ctan
ce (%
)
UV visible near infra red
waterabsorption
red edge
Laboratory measurementsLaboratory measurements

Katholieke Universiteit Leuven
Spectral Dataset
Category Plant Age Spectra indataset a
Spectra indataset b
potato + 30 leaves 63 37beet cotyledones 15 5
15 leaves 85 31maize 3-5 leaves 58 20weeds(14 species)
5-20 leaves,vegetative orgenerative
329 110
soil 16 4
Laboratory measurementsLaboratory measurements

Katholieke Universiteit Leuven
Reflectance of crop and weed leaves
0
10
20
30
40
50
60
200 400 600 800 1000 1200 1400 1600 1800 2000
wavelength (nm)
refl
ecta
nce
(%
)
Beet Lambsquarters Redshank Thistle Cockspur Soil
Laboratory measurementsLaboratory measurements

Katholieke Universiteit Leuven
Spectral analysisstepwise selection of discriminant wavelengths multivariate discriminant analysis, based on reflectance response at selected wavelengths (dataset a)
assuming multivariate normal distributionquadratic discriminant rule
classes with different covariance structure
testing the discriminant function: classification of spectra from dataset b
Laboratory measurementsLaboratory measurements

Katholieke Universiteit Leuven
Spectral response of beet & weeds
Legend: beet - annual mercury - nettle, ground ivy, scarlet pimpernel andplantain - thistle and sow thistle - cockspur - gallant soldier - lambsquarters - chickweed - redshank - black bindweed - black nightshade
Laboratory measurementsLaboratory measurements

Katholieke Universiteit Leuven
Legend: maize - annual mercury - nettle, ground ivy, scarlet pimpernel andplantain - thistle and sow thistle - cockspur - gallant soldier - lambsquarters - chickweed - redshank - black bindweed - black nightshade
Laboratory measurementsLaboratory measurements
Spectral response of maize & weeds

Katholieke Universiteit Leuven
Spectral response of potato & weeds
Legend: potato - annual mercury - nettle, ground ivy, scarlet pimpernel andplantain - thistle and sow thistle - cockspur - gallant soldier - lambsquarters - chickweed - redshank - black bindweed - black nightshade
Laboratory measurementsLaboratory measurements
Katholieke Universiteit Leuven
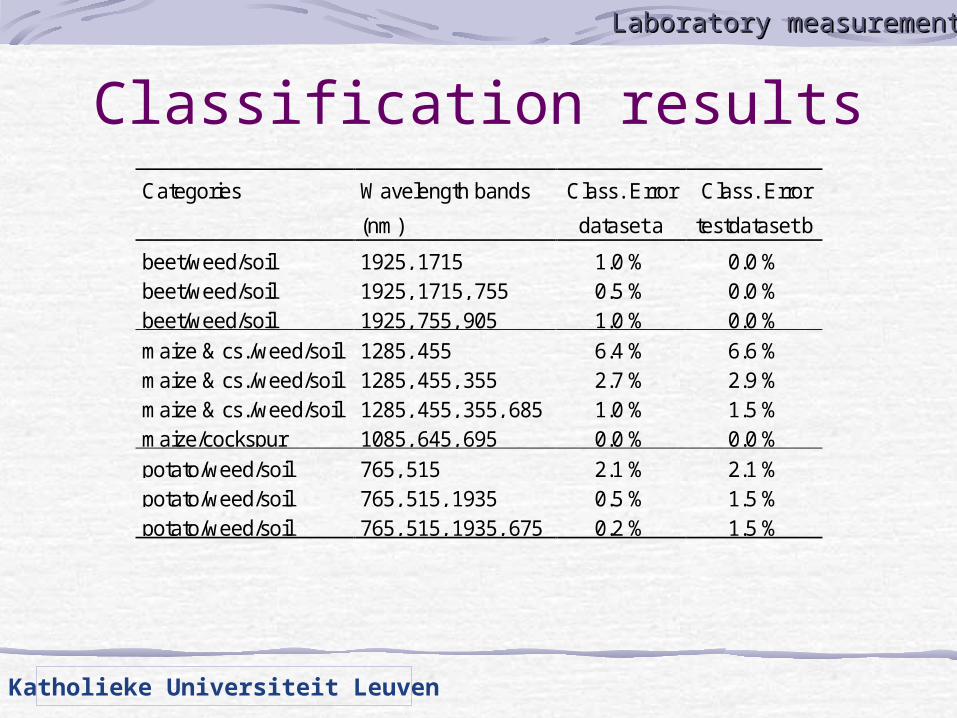
Classification resultsCategories Wavelength bands
(nm)
Class. Error
dataset a
Class. Error
testdataset b
beet/weed/soil 1925, 1715 1.0 % 0.0 %beet/weed/soil 1925, 1715, 755 0.5 % 0.0 %beet/weed/soil 1925, 755, 905 1.0 % 0.0 %
maize & cs./weed/soil 1285, 455 6.4 % 6.6 %maize & cs./weed/soil 1285, 455, 355 2.7 % 2.9 %maize & cs./weed/soil 1285, 455, 355, 685 1.0 % 1.5 %maize/cockspur 1085, 645, 695 0.0 % 0.0 %
potato/weed/soil 765, 515 2.1 % 2.1 %potato/weed/soil 765, 515, 1935 0.5 % 1.5 %potato/weed/soil 765, 515, 1935, 675 0.2 % 1.5 %
Laboratory measurementsLaboratory measurements

Field measurement of crop and weeds
Variation inlight condition
Measurement geometry
Detector sensitivity
Processingmethod
Signal path
Field measurementsField measurements

Katholieke Universiteit Leuven
Equipment for field measurement
spectrograph + 10-bit CCD, digital camera,computer,12 V battery andtransformer
on mobile platform
Field measurementsField measurements

Katholieke Universiteit Leuven
Equipment - Spectrograph
both spatial and spectral information in images
Field measurementsField measurements

Katholieke Universiteit Leuven
Image datamaize, sugarbeet, 11 weeds2 different days, different light conditions755 x 484 pixels
spatial axis
spectralaxis
Field measurementsField measurements

Katholieke Universiteit Leuven
Spectral response of sensor
0
10000
20000
30000
40000
50000
60000
480 500 520 540 560 580 600 620 640 660 680 700 720 740 760 780 800
wavelength (nm)
refl
ecti
on
val
ue
(0-6
4500
)
0
5
10
15
20
25
30
can
op
y re
flec
tan
ce (
%)
reference plate 75% sugarbeet reflection sugarbeet reflectance
Field measurementsField measurements

Katholieke Universiteit Leuven
Data processingspectral resolution: 0.71 nm /pixelplant/soil discrimination with ratio: NIR (745 nm) / red (682 nm)data reduction by calculating average per 2.1 nm, removing noisy endsresulting spectra: 484.8 - 814.6 nm range, 2.1 nm stepindependent datasets of maize, sugarbeet and weeds
Field measurementsField measurements

Katholieke Universiteit Leuven
Dataset Number of spectra
sugarbeet 1 627
sugarbeet 2 343
maize 1 611
maize 2 204
weeds 1 1251
annual mercury (286), small nettle (80), groundivy (114), lambsquarters (181), sow thistle (63),chickweed (178), bluegrass (155), red dead-nettle(19), Shepherd’s purse (141), dandelion (34)weeds 2 724
ground ivy (52), lambsquarters (340), chickweed(53), bluegrass (73), red dead-nettle (168),Arabidopsis (38)
Spectral datasets
Field measurementsField measurements

Katholieke Universiteit Leuven
0
10000
20000
30000
40000
50000
480 530 580 630 680 730 780
wavelength (nm)
me
an
re
fle
cti
on
va
lue
(0
-65
40
00
)
maize sugarbeet lambsquarters annual mercury bluegrass
Mean canopy reflectionsField measurementsField measurements

Canonical analysis of Sugarbeet - weeds
0 5 10
CAN2
-5
0
5
CAN1
Legend: sugarbeet , sow thistle , annual mercury ,small nettle , groundivy , lambsquarters , chickweed , bluegrass , red dead nettle ,shepperd's purse , dandelion
Field measurementsField measurements

Canonical analysis of Maize - weeds
Field measurementsField measurements
0 5 10CAN2
-5
0
5
CAN1
Legend: maize , sow thistle , annual mercury ,small nettle , ground ivy , lambsquarters , chickweed , bluegrass , red dead nettle , shepperd's purse , dandelion

Katholieke Universiteit Leuven
Discriminant analysis Sugarbeet
calibration dataset test datasetwavelength bands(2.1 nm width) indiscriminantfunction
% sugarbeetcorrectlyclassified
% weedscorrectlyclassified
% sugarbeetcorrecty
classified
% weedscorrectlyclassified
814.6, 801.4, 753,713.5, 698.1,522.1, 761.8,603.5, 764, 537.5,579.3
94 94 95 84
572.7, 814.6,801.4, 753, 713.5,698.1, 522.1
93 94 95 81
572.7, 814.6,676.1, 801.4, 753,713.5
92 94 94 77
Field measurementsField measurements
Katholieke Universiteit Leuven
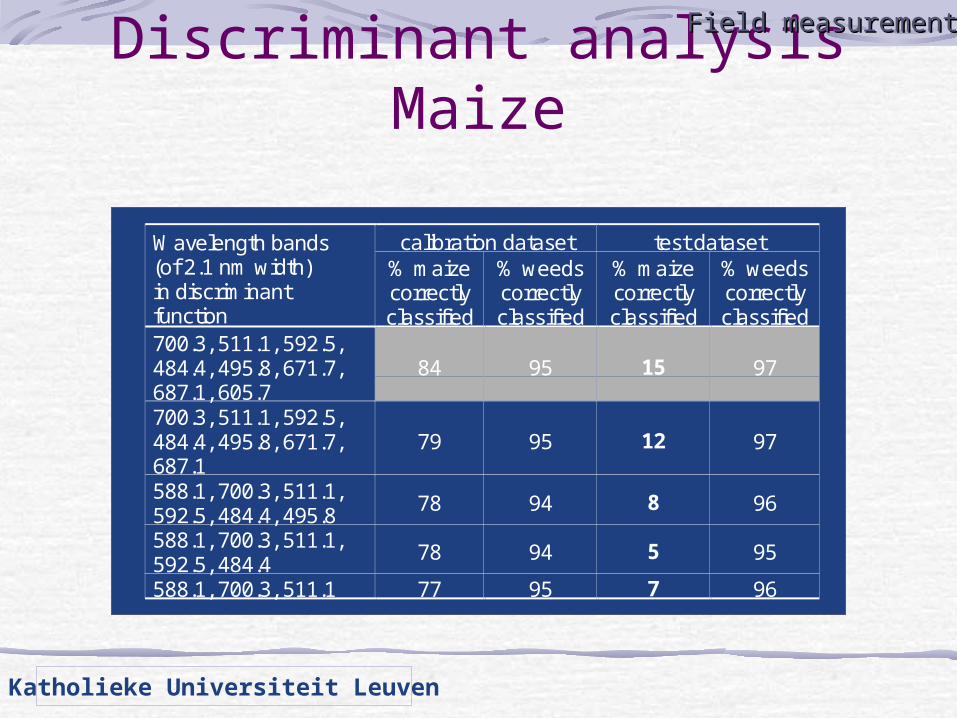
Discriminant analysis Maize
calibration dataset test datasetWavelength bands(of 2.1 nm width)in discriminantfunction
% maizecorrectlyclassified
% weedscorrectlyclassified
% maizecorrectlyclassified
% weedscorrectlyclassified
700.3, 511.1, 592.5,484.4, 495.8, 671.7,687.1, 605.7
84 95 15 97
700.3, 511.1, 592.5,484.4, 495.8, 671.7,687.1
79 95 12 97
588.1, 700.3, 511.1,592.5, 484.4, 495.8
78 94 8 96
588.1, 700.3, 511.1,592.5, 484.4
78 94 5 95
588.1, 700.3, 511.1 77 95 7 96
Field measurementsField measurements

Graphic comparison datasets
0
10000
20000
30000
40000
50000
480 580 680 780wavelength (nm)
refl
ecti
on
val
ue
maize 1 maize 2
0
10000
20000
30000
40000
50000
480 580 680 780wavelength (nm)
refl
ecti
on
val
ue
sugarbeet 1 sugarbeet 2 weed 1 weed 2
Field measurementsField measurements

Graphic comparison datasetsField measurementsField measurements
5000
10000
15000
20000
25000
0 5000 10000 15000 20000 25000 30000590.3 nm
704.7 nm
Maize
5000
10000
15000
20000
25000
30000
0 10000 20000
590.3 nm
704.7 nm
red dead nettle
0
5000
10000
15000
20000
25000
0 5000 10000 15000590.3 nm
704.7 nm
Lambsquarters

Katholieke Universiteit Leuven
Graphic comparison datasets
0
10000
20000
30000
40000
50000
60000
480 530 580 630 680 730 780
wavelength (nm)
refle
ctio
n o
f re
fere
nce
(0
- 6
54
00
)
0
1000
2000
3000
4000
5000
6000
7000
8000
diff
ere
nce
of
me
an
ma
ize
re
flect
ion
75% reference plate in sunlight difference in mean maize reflection (day 2 - day 1)
Field measurementsField measurements

Discriminant analysis ratiosSugarbeet
calibration dataset test datasetwavelength band ratios(2.1 nm width)in discriminant function
% beetcorrectlyclassified
% weedscorrectlyclassified
% beetcorrectlyclassified
% weedcorrectlyclassified
555.1/770, 643.1/687,484.8/770, 632.1/687,654.1/687, 755.2, 487,711.3/592, 775/770,
94 95 95 92
555.1/770, 643.1/687,484.8/770, 632.1/687,654.1/687, 755.2, 487,711.3/592
93 95 94 88
555.1/770, 643.1/687,484.8/770, 632.1/687,654.1/687, 755.2
90 94 92 92
555.1/770, 643.1/687,484.8/770, 632.1/687
85 93 92 92
Field measurementsField measurements

Discriminant analysis ratiosMaizecalibration dataset test dataset
Wavelength band ratios(2.1 nm width)in discriminant function
% maizecorrectlyclassified
% weedcorrectlyclassified
% maizecorrectlyclassified
% weedcorrectlyclassified
559.5/717, 528.7/717,761/548, 638.7,528.7/548, 548.5/717,678.3/687, 517.7/717,563.9/504
92 95 51 94
559.5/717, 528.7/717,761/548, 638.7,528.7/548, 548.5/717,678.3/687
93 94 42 93
559.5/717, 528.7/717,761/548, 638.7,528.7/548
91 95 41 94
559.5/717, 528.7/717,761/548, 638.7
92 94 49 93
559.5/717, 528.7/717,761/548
93 93 56 91
Field measurementsField measurements
Katholieke Universiteit Leuven
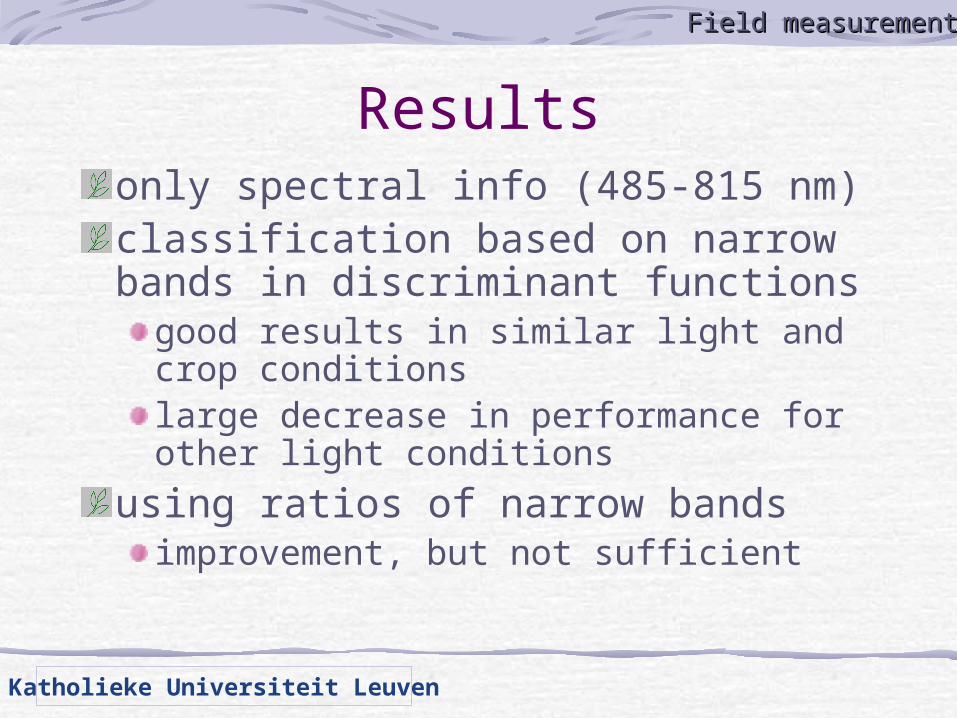
Resultsonly spectral info (485-815 nm)classification based on narrow bands in discriminant functions
good results in similar light and crop conditionslarge decrease in performance for other light conditions
using ratios of narrow bandsimprovement, but not sufficient
Field measurementsField measurements

Katholieke Universiteit Leuven
Improving resultsinfluence of light conditions
adaption of classification rule determining light condition and applying appropriate calibration/LUT
spectral inputs that are less affected by environment
measuring irradiance, calculating reflectance
other classification methods
Field measurementsField measurements

Katholieke Universiteit Leuven
Neural network for classification
Comparison of different NN techniques for classificationSelf-Organizing Map (SOM) neural network for classification
used in a supervised way for classificationneurons of the SOM are associated with local models achieves fast convergence and good generalisation.
Crop-weed classificationCrop-weed classification

Neurallattice
(A)
InputSpace
(V)
SOM MLP
class
s3(k)
first hidden layer
s2(k) s4(k)s1(k)
….
….
second hiddenlayer
weights
PNN
x1
DistributionLayer
Pattern Layer
Summation Layer
Decision Layer
)x(f1 )x(f2
Input Layer
Output Layer
1O nO
x2 xn-1 xn
ADVANTAGES• Learns with reducedamounts of data • Fast Learning • Visualisation• RetrainableDISADVANTAGES• Discrete output
ADVANTAGES• Good extrapolationDISADVANTAGES• Slow Learning • Local minima• Needs a lot of data
ADVANTAGES • Fast Learning • RetrainableDISADVANTAGES• Needs all training data during operation• Needs a lot of data
Crop-weed classificationCrop-weed classificationNeural network for
classification

METHOD MAIZE WEEDSMinimum Distance Classifier 73 75Fisher Discriminant 88 88Linear Discriminant 82 74MLP (1 hidden) 90 66MLP (2 hidden) 95 70PNN 85 77SOM (Labeled) 85 73SOM (Supervised) 85 77Hybrid Classifier 85 71SOM based RBF network 85 79LVQ 85 77LLM SOM (Proposed) 96 90
Crop-weed classificationCrop-weed classification
Comparison between methods
MLP: Multi-Layer Perceptron, PNN: Probabilistic N Network, SOM: Self-Organizing Map, LVQ: Learning Vector Qantization, LLM: Local Linear Mapping
Moshou et al., 1998, AgEng98, OsloMoshou et al., 2001, Computers and Electronics in Agriculture 31 (1): 5-16

Katholieke Universiteit Leuven
PNN MLP SOM LVQ LLM SOM Corn 93 96 89 92 97 Ranunculus repens 51 49 47 51 59 Cirsium arvense 72 68 70 72 77 Sinapis arvensis 70 64 91 70 81 Stellaria media 72 68 66 72 71 Tarraxacum officinale 66 47 58 66 72 Poa annua 64 68 59 64 66 Polygonum persicaria 66 77 58 66 78 Urtica dioica 46 52 44 44 52 Oxalis. europaea 96 99 88 96 99 Medicago lupulina 85 90 81 84 93
MLP: Multi-Layer Perceptron, PNN: Probabilistic N Network, SOM: Self-Organizing Map, LVQ: Learning Vector Qantization, LLM: Local Linear Mapping
Comparison between methodsCrop-weed classificationCrop-weed classification

Katholieke Universiteit Leuven
PNN MLP SOM LVQ LLM SOM Sugar beet 91 96 88 91 98 R. repens 55 51 49 55 61 C. arvense 74 72 71 74 80 S. arvensis 70 64 63 74 83 S. media 73 70 69 73 71 T. officinale 66 47 58 66 72 P. annua 66 70 61 66 66 P. persicaria 68 79 60 68 76 U. dioica 48 56 48 48 55 O. europaea 94 98 90 94 99 M. lupulina 87 92 84 87 93
Crop-weed classificationCrop-weed classification
MLP: Multi-Layer Perceptron, PNN: Probabilistic N Network, SOM: Self-Organizing Map, LVQ: Learning Vector Qantization, LLM: Local Linear Mapping
Comparison between methods

Katholieke Universiteit Leuven
• The strongest point is the local representation of the data accompanied by a local updating algorithm • Local updating algorithms assure much faster convergence than global updating algorithms (e.g. backpropagation for MLPs) • Because of the topologically preserving character of the SOM, the proposed classification method can deal with missing or noisy data, outperforming “optimal” classifiers (PNN) • The proposed method has been tested and gave superior results compared to a variety statistical and neural classifiers
Crop-weed classificationCrop-weed classification
Conclusions on LLM SOM technique

Precision spraying through controlled dose application
Unwanted variations in dose caused by horizontal and vertical boom movements
Precision treatment Precision treatment

Katholieke Universiteit Leuven
Active horizontal stabilisation of spray boom
Validation with ISO 5008 trackmovement of spray boom tip with and without controller
0 5 10 15 20 25 30-0.3
-0.2
-0.1
0
0.1
0.2
0.3
0.4
Time (s)
Dis
tan
ce (
m)
Precision treatment Precision treatment

Katholieke Universiteit Leuven
Vertical stabilisation of spray boom
Slow-active system for slopes
0.1 0.15 0.2 0.25 0.3 0.35 0.4 0.45 0.5 0.55 0.6-1
-0.8
-0.6
-0.4
-0.2
0
0.2
0.4
0.6
0.8
1
Frequency, Hz
Del
ta,
m
Resulting boom movement
boom
frame connected to tractor
electric motor reduction
cable
fixing between plates
rol
ultrasonic sensors
Precision treatment Precision treatment

Katholieke Universiteit Leuven
On-line selective weed treatment
Indoor test of on-line weed detection and treatmentIndoor test of on-line weed detection and treatment
Precision treatment Precision treatment

Katholieke Universiteit Leuven
Sensor: Spectral line cameraClassification: Probabilistic neural networkProgram in Labview with c-code
Image acquisition frequence: 10 images/sec, travel speed: 30cm/sec, segmentation with NDVI ( > 0.3)Off-line training of NN, On-line classification Decision to spray:> 20 weed pixels and > 35% of vegetation is weed
Spray boom with PWM nozzles and controller, provided by Teejet Technologies
Indoor test of on-line weed detection and treatment
Precision treatment Precision treatment

Indoor test of on-line weed detection and treatment
Color image and spectral image
Precision treatment Precision treatment

Katholieke Universiteit Leuven
Indoor test - ResultsComparison of nozzle activation with weed positions
Precision treatment Precision treatment

Katholieke Universiteit Leuven
Indoor test - Results
camera
nozzle
weed
Experimental set up - separate weed classes (4) did not improve crop-weed classification
-Correct detection of nearly all weeds
- Only 6 % redundant spraying of crop
- Up to 70 % reduction of herbicide use
Precision treatment Precision treatment