spectroscopic investigation of tooth caries and
TRANSCRIPT

Spectroscopic Investigation of Tooth Caries andDemineralization
Doctoral Thesis
submitted to
Cochin University of Science and Technology
for the award of the degree of
Doctor of Philosophy
by
Shiny Sara Thomas
Biophotonics Laboratory
Atmospheric Sciences Division
Centre for Earth Science Studies
Thiruvananthapuram
India
May 2009


iii
DECLARATION
I hereby declare that the thesis entitled “Spectroscopic Investigation of ToothCaries and Demineralization” is an authentic record of research work carried outby me under the supervision and guidance of Dr. N. Subhash, Scientist F, BiophotonicsLaboratory & Head, Atmospheric Sciences Division, Centre for Earth Science Studies,Thiruvananthapuram, in the partial fulfilment of the requirement for the Ph.D degreeunder the Faculty of Science, Cochin University of Science and Technology, and nopart of it has previously formed the basis of the award of any degree, diploma,associateship, fellowship or any other similar title or recognition.
Shiny Sara Thomas
Thiruvananthapuram
May 20, 2009

v
CENTRE FOR EARTH SCIENCE STUDIESAn Institution under the Kerala State Council for Science Technology & Environment
P.B. 7250, Akkulam, Trivandrum - 695 031, IndiaTel: 91-471-2511638; Fax: 91-471-2442280 e-mail: [email protected]
May 20, 2009
Dr. N. SubhashScientist F, Biophotonics Laboratory &Head, Atmospheric Sciences Division
CERTIFICATE
This is to certify that the thesis entitled “Spectroscopic Investigation of ToothCaries and Demineralization” is an authentic record of the research work carriedout by Mrs. Shiny Sara Thomas under my direct supervision and guidance in partialfulfillment of the requirements for the Ph. D degree of Cochin University of Scienceand Technology, under the Faculty of Science and no part thereof has been presentedfor the award for any degree in any University.
N. Subhash


vii
“Do not despise the day of small beginnings”

ix
Oh what a journey it has been, there were times when I thought I will never make it, to othertimes when the advice and help made me feel that this is what I was supposed to do. It’s nowtime to recognize all those who made this piece of work, possible.
This work could not have been possible to perform without the support and encouragement ofmany people and I take this occasion to express my warmest gratitude. In particular:
My research guide, Dr. N. Subhash, for giving me the opportunity to learn, perform researchunder his excellent scientific guidance and for always being accessible and lending me an earwhen things did not go right. Humble thanks for his encouragement throughout the duration ofmy study. His support made me achieve my goal. I am also grateful for his nice and warmfriendship.
I express my gratitude to the members of the Ethics Committee of the Government DentalCollege, Thiruvananthapuram for their approval of my application for conducting clinical trials. Iextend my thanks especially to Dr Beena VT for her friendliness and support during clinicaltrials. I am also grateful for the nice collaboration with Dr. Jolly Mary Varughese, Head of theDepartment of Conservative Dentistry and Endodontics, who supported me in carrying out theclinical trials. I also extend my gratitude to Dr. Anitha Balan, Head of the Department of OralMedicine and Radiology, for her support.
It has been a pleasure and really exciting to be working in a hospital atmosphere. I am wordlessto express my gratefulness to Dr. Soumyakant Mohanty of the Department of ConservativeDentistry for his support and understanding during clinical trials. I am also thankful to Dr.Anulekh Babu of the Department of Conservative Dentistry, Dr. Akhilanand Chaurasia, Dr.Satheesh, Dr. Ranimol P and Dr. Nithya of the Department of Oral Medicine and Radiology fortheir help and support. They have all shown amazing enthusiasm for our joint projects, for whichI am very grateful. All the patients who have given their time to participate in measurements arealso deeply appreciated.
This study was fully supported by my colleague Miss. Jayanthi JL especially during clinicaltrials. I appreciate you and am grateful to your friendship and support throughout the toughtimes. I express my sincere gratitude to Mr. Rupananda J Mallia for helping me during in vitrostudies and also for his support and assistance in my studies. I also extend my gratitude toMiss Aparna GN and Mr Prasanth CS for their support. I am grateful to all the postgraduatestudents who assisted me in this study especially Miss Renji, Miss. Sapna, Miss. Kavitha andMiss. Mrinalini.
Acknowledgements
x
I would like to appreciate the support I received from Dr Mini Jose and Dr. Joji Thomas duringin vitro studies.I would also extend my gratitude to the Ph.D programme review committe(CUSAT) and Dr. C. S. Paulose, member of the doctoral committe, for his valuable sugges-tions . Thanks to all the staff in the Atmospheric Science Division, CESS, especially to Mr.T. K. Krishnachandran and Mr. M. Ismail for their assistance and help. I am also extendingmy sincere thanks to the administrative staff of CESS for all their support. Finally, I wouldlike to thank Dr. M. Baba, Director and Mr. P. Sudeep, Registrar, CESS for their support andencouragement during the course of the study. I would like to extend my sincere gratitude toKerala State Council for Science, Technology and Envirnoment (KSCSTE) for their financialsupport.
I would like to take this time to extend my sincere thanks to all my friends especially Vishnuwho was always there to lend a hand or support. I am also grateful to Anjali, Chitra for beingalways there for me. I express my thanks to Hari, Sinoosh and Prasanth for their support. Therest of my friends are fortunately too many to mention by name and too good to blame me fornot doing so. Thank you!
I am especially grateful to my parents and all my family members. Without your massivesupport behind me nothing would have been possible.
Last but never the least, I would like to thank my husband Varghese for making my life sosweet and the motivation and support he has given me to complete this work.
SHINY SARA THOMAS
CESS, THIRUVANANTHAPURAM

xi
“To my dear ones”

xiii
Abstract xxi
List of Publications xxiii
Preface xxvii
Abbreviations and Acronyms xxxiii
Chapter 1
Background, Intention and Description of the Problem1.1 Background and Intention 3
1.2 Objectives of the Study 5
1.3 Some Facts About Dental Caries 6
1.3.1 Carious Process 6
1.3.2 Etiology of Caries 7
1.3.3 Clinical Presentation of Caries 7
1.3.3.1 Pit and Fissure Caries/Occlusal Caries 7
1.3.3.2 Smooth Surface Caries 7
1.3.3.3 Root Surface Caries 8
1.3.4 Histopathology of Caries 8
1.3.4.1 Caries of Enamel 8
1.3.4.2 Caries of Dentin 9
1.3.5 Diagnosis of Caries 10
1.3.5.1 Visual Examination 11
Table of Contents

xiv
1.3.5.2 Visual-Tactile Techniques 11
1.3.5.3 Radiographic Examination 12
1.3.5.4 Alternative Caries Detection Methods 13
1.3.5.4.1 Diagnostic Method Based on X-rays:
Digital and Subtraction Radiography 14
1.3.5.4.2 Diagnostic Systems Based on
Electrical Current: ECM/EIM 14
1.3.5.4.3 Transillumination: FOTI and DIFOTI 15
1.3.5.4.4 Quantitative Laser/Light-Induced
Fluorescence (QLF) 16
1.3.5.4.5 DIAGNOdent- Infrared Fluorescence 17
1.3.5.4.6 Diagnostic Based on Ultrasound
Measurements 18
1.3.5.4.7 Optical Coherence Tomography (OCT) 18
1.3.6 Prevention of Caries 19
1.3.6.1 Oral Hygiene 19
1.3.6.2 Dietary Modification 19
1.3.6.3 Other Preventive Measures 20
1.4 Conclusions 20
Chapter 2
Tooth Anatomy and its Interaction with Light
2.1 Introduction 25

xv
2.2 Tooth: An Overview 26
2.3 Tooth Development 27
2.3.1 Developmental Stages 27
2.4 Tooth Structure 30
2.4.1 Enamel 30
2.4.2 Dentin 32
2.4.3 Pulp 34
2.4.4 Supporting Structures 35
2.5 Light 36
2.5.1 Basic Aspects of Light-Tissue Interaction 37
2.5.2 Optical Properties of Hard Tissues 38
2.5.2.1 Spectral Properties of Enamel and Dentin 38
2.5.2.2 Waveguide Effects 42
2.6 Optical Spectroscopy 44
2.6.1 Fluorescence Spectroscopy 44
2.6.1.1 Basic Principles 44
2.6.1.2 Autofluorescence and Endogenous Fluorophores 45
2.6.1.3 Detection Principle 48
2.6.2 Diffuse Reflectance Spectroscopy 49
2.6.3 LIF and DR Spectroscopy in Caries Research:
Current Status 50
2.7 Conclusions 54

xvi
Chapter 3
Experimental Methods
3.1 Introduction 57
3.2 Point Monitoring System 58
3.3 Development of LIFRS System for Caries Detection 59
3.3.1 Compact LIFRS System for Clinical Trials 61
3.4 Data Acquisition and Analysis 62
3.4.1 Data Acquisition using OOI Base32 Software 62
3.4.2 Curve-Fitting of LIF Spectra 63
3.4.3 Statistical Analysis 63
3.4.3.1 Sensitivity and Specificity 63
3.4.3.2 Positive and Negative Predictive Values 64
3.4.3.3 Receiver Operating Characteristic Analysis 66
3.4.3.3.1 Area Under the Curve 67
3.5 In vitro Studies 67
3.6 In vivo Studies 68
3.6.1 Ethical Clearance for the Study 68
3.6.2 Inclusion and Exclusion Criteria for the Study 68
3.6.3 Conduct of Clinical Trials 69
3.6.4 Validation Studies 70
3.7 Conclusions 70

xvii
Chapter 4
Tooth Caries Detection by Curve-Fitting of Laser-InducedFluorescence Emission: A Comparative Evaluation with DRSpectroscopy
4.1 Introduction 73
4.2 Study Material and Protocol 73
4.3 Results 74
4.3.1 Fluorescence Measurements 74
4.3.2 Curve-Fitting Analysis 75
4.3.3 Gaussian Curve-Fitted and Raw LIF Ratios 77
4.3.4 Diffuse Reflectance Measurements 78
4.3.5 Lesion Profiling 79
4.4 Discussion 80
4.5 Conclusions 83
Chapter 5
Investigation of in vitro Dental Erosion by Optical Techniques
5.1 Introduction 87
5.2 Study Material and Protocol 87
5.3 Results 88
5.3.1 LIF Spectral Features 88
5.3.1.1 Tooth Enamel and Dentin Spectra 88
5.3.1.2 Tooth Demineralization 89

xviii
5.3.2 Diffuse Reflectance Characteristics 92
5.3.2.1 Reflectance Spectral Features 92
5.3.2.2 Tooth Demineralization 93
5.4 Discussion 94
5.5 Conclusions 99
Chapter 6
Spectroscopic Investigation of De- and Re-mineralization of ToothEnamel in vitro
6.1 Introduction 102
6.2 Study Material and Protocol 102
6.2.1 Visual Assessment of Lesions 104
6.3 Results 105
6.3.1 LIF Spectral Features 105
6.3.2 Diffuse Reflectance Spectral Features 106
6.3.3 Spectral Intensity and Curve Area Plots 106
6.4 Discussion 108
6.5 Conclusions 112
Chapter 7
Characterization of Dental Caries by LIF Spectroscopy with 404 nmExcitation
7.1 Introduction 115
7.2 Study Material and Protocol 115

xix
7.2.1 Experimental Methods 115
7.3 Results 116
7.3.1 LIF Spectral Features 116
7.3.2 LIF Intensity Ratios 117
7.3.3 Diagnostic Performance of LIF Spectroscopy 118
7.4 Discussion 119
7.5 Conclusions 122
Chapter 8Clinical Trial for Early Detection of Tooth Caries using aFluorescnce Ratio Reference Standard
8.1 Introduction 125
8.2 Study Material, Protocol and Ethical Issues 125
8.3 Results 127
8.3.1 LIF Spectral Features 127
8.3.2 LIF Intensity Ratios 128
8.3.3 Discrimination using FRS Ratio Scatter Plots 128
8.4 Discussion 130
8.4.1 LIF Spectral Features 130
8.4.2 LIF Intensity Ratios 131
8.4.3 Validation of FRS Ratio 132
8.5 Conclusions 134
xx
Chapter 9Application of Curve-Fitting to Diagnose Dental Caries in vivo
9.1 Introduction 137
9.2 Study Material, Protocol and Data Processing 137
9.3 Results 139
9.3.1 LIF Spectral Features 139
9.3.2 Curve-Fitting Analysis 139
9.3.3 Curve-Fitted and Raw LIF Ratios 140
9.3.4 Diagnostic Performance of LIF Spectroscopy 142
9.4 Discussion 142
9.5 Conclusions 146
Chapter 10Diffuse Reflectance Spectroscopy for in vivo Caries Detection10.1 Introduction 147
10.2 Study Material and Protocol 149
10.3 Results 150
10.3.1 DR Spectral Features 150
10.3.2 Discrimination with DRRS Ratio 151
10.3.3 Caries Discrimination using ROC Curve 151
10.4 Discussion 152
10.5 Conclusions 154
Chapter 11Discussion and Conclusion 157
References 167

xxi
Dental caries persists to be the most predominant oral disease in spite ofremarkable progress made during the past half- century to reduce its prevalence.Early diagnosis of carious lesions is an important factor in the prevention andmanagement of dental caries. Conventional procedures for caries detection involvevisual-tactile and radiographic examination, which is considered as “gold standard”.These techniques are subjective and are unable to detect the lesions until they arewell advanced and involve about one-third of the thickness of enamel. Therefore, allthese factors necessitate the need for the development of new techniques for earlydiagnosis of carious lesions. Researchers have been trying to develop variousinstruments based on optical spectroscopic techniques for detection of dental cariesduring the last two decades. These optical spectroscopic techniques facilitate non-invasive and real-time tissue characterization with reduced radiation exposure topatient, thereby improving the management of dental caries. Nonetheless, a cost-effective optical system with adequate sensitivity and specificity for clinical use isstill not realized and development of such a system is a challenging task.
Two key techniques based on the optical properties of dental hard tissues arediscussed in this current thesis, namely laser-induced fluorescence (LIF) and diffusereflectance (DR) spectroscopy for detection of tooth caries and demineralization.The work described in this thesis is mainly of applied nature, focusing on the analysisof data from in vitro tooth samples and extending these results to diagnose dentalcaries in a clinical environment. The work mainly aims to improve and contribute tothe contemporary research on fluorescence and diffuse reflectance for discriminatingdifferent stages of carious lesions. Towards this, a portable and compact laser-inducedfluorescence and reflectance spectroscopic system (LIFRS) was developed for pointmonitoring of fluorescence and diffuse reflectance spectra from tooth samples. TheLIFRS system uses either a 337 nm nitrogen laser or a 404 nm diode laser for theexcitation of tooth autofluorescence and a white light source (tungsten halogen lamp)for measuring diffuse reflectance.
Extensive in vitro studies were carried out on extracted tooth samples totest the applicability of LIFRS system for detecting dental caries, before being testedin a clinical environment. Both LIF and DR studies were performed for diagnosis ofdental caries, but special emphasis was given for early detection and also todiscriminate between different stages of carious lesions. Further the potential of
Abstract

xxii
LIFRS system in detecting demineralization and remineralization were also assessed.
In the clinical trial on 105 patients, fluorescence reference standard (FRS)criteria was developed based on LIF spectral ratios (F500/F635 and F500/F680) todiscriminate different stages of caries and for early detection of dental caries. TheFRS ratio scatter plots developed showed better sensitivity and specificity as comparedto clinical and radiographic examination, and the results were validated with the blind-tests. Moreover, the LIF spectra were analyzed by curve-fitting using Gaussianspectral functions and the derived curve-fitted parameters such as peak position,Gaussian curve area, amplitude and width were found to be useful for distinguishingdifferent stages of caries. In DR studies, a novel method was established based onDR ratios (R500/R700, R600/R700 and R650/R700) to detect dental caries withimproved accuracy. Further the diagnostic accuracy of LIFRS system was evaluatedin terms of sensitivity, specificity and area under the ROC curve. On the basis ofthese results, the LIFRS system was found useful as a valuable adjunct to the cliniciansfor detecting carious lesions.

xxiii
The study mentioned in this thesis is mainly based on the following scientific papers.
A. International Journals:
Subhash N, Shiny Sara Thomas, Rupananda Mallia J, Mini Jose, (2005). Tooth cariesdetection by curve fitting of laser-induced fluorescence emission: A comparativeevaluation with reflectance spectroscopy. Lasers in Surgery and Medicine 37: 320–328.
Shiny Sara Thomas, Rupananda Mallia J, Mini Jose, Subhash N (2008). Investigationof in vitro dental erosion by optical techniques. Lasers in medical Sciences 23: 319-329.
Shiny Sara Thomas, Subhash N., Rupananda Mallia J, Mini Jose (2008). Spectroscopicinvestigation of de- and re-mineralization of tooth enamel in vitro. Applied Spectroscopy(under preparation).
Shiny Sara Thomas, Jayanthi JL, Subhash N, Joji Thomas, Rupananda Mallia J,Aparna GN (2009). Characterization of dental caries by LIF spectroscopy with 404nm excitation. Lasers in medical Science (under review).
Shiny Sara Thomas, Jayanthi JL, Soumyakant M, Subhash N, Jolly Mary Varughese,Anitha Balan (2009). Clinical Trial for early detection of tooth caries using afluorescence ratio reference standard. European Journal of Oral Sciences (underreview).
Shiny Sara Thomas, Jayanthi JL, Soumyakant M, Subhash N, Jolly Mary Varughese,Anitha Balan (2009). Application of curve-fitting to diagnose dental caries in vivo.Caries Research (under preparation).
Shiny Sara Thomas, Jayanthi JL, Soumyakant M, Subhash N, Jolly Mary Varughese,Anitha Balan (2009). Diffuse reflectance spectroscopy for in vivo caries detection.Journal of Biophotonics (under preparation).
B. Patent Pending:
Subhash N, Shiny Sara Thomas, Rupananda Mallia J, Mini Jose. Tooth cariesdetection by curve fitting of UV laser induced fluorescence emission. New Provisional
List of Publications

xxiv
Indian Patent Application No.: 1919/VHE/2005, Filed on: December 12, 2005.
Subhash N, Rupananda Mallia J, Shiny Sara Thomas, Jayaprakash Madhavan, AnithaMathews, Paul Sebastian. A low cost device for detecting neoplastic changes in tissue.Indian Patent Application No.: 265/CHE/2006, Filed on: February 20, 2006.
C. Conference Proceedings:
Shiny Sara Thomas, Jayanthi J L, Joji Thomas, Rupananda J. Mallia, Aparna G N,Subhash N (2008). Characterization of dental caries by fluorescence spectroscopy,Swadeshi Science Congress 2008, Trivandrum (Presented).
D. Publications from other fields:
1. International Journals:
Subhash N, Rupananda Mallia J, Shiny Sara Thomas, Anitha Mathews, PaulSebastian, Jayaprakash Madhavan (2006). Oral cancer detection using diffusereflectance spectral ratio R540/R575 of oxygenated hemoglobin bands. Journal ofBiomedical Optics 11(1): 014018 (1–6).
Rupananda Mallia J, Subhash N, Shiny Sara Thomas, Rejnish Kumar, Anitha MathewsJayaprakash Madhavan, Paul Sebastian (2007). Oral Pre-malignancy detection usingautofluorescence spectral ratios. Oral Oncology (S) 2(1): 259–260.
Rupananda Mallia J, Shiny Sara Thomas, Anitha Mathews, Rejnish Kumar, PaulSebastian, Jayaprakash Madhavan, Subhash, N (2008). Laser-inducedautofluorescence spectral ratio reference standard for early discrimination of oralcancer. Cancer 112 (7): 1503-1512.
Rupananda Mallia J, Shiny Sara Thomas, Anitha Mathews, Rejnish Kumar, PaulSebastian, Jayaprakash Madhavan, Subhash N (2008). Oxygenated hemoglobindiffuse reflectance ratio for in vivo detection of oral pre-cancer. Journal of BiomedicalOptics 13 (4): 041306 (1-10).
Rupananda Mallia J, Shiny Sara Thomas, Paul Sebastian, Rejnish Kumar, AnithaMathews, Jayaprakash Madhavan, Subhash N (2008). Grading of oral mucosa bycurve fitting of corrected autofluorescence spectra. Head and Neck (under review).
Jayanthi JL, Rupananda Mallia J, Shiny Sara Thomas, Baiju KV, Anitha Mathews,Rejnish Kumar, Paul Sebastian, Jayaprakash Madhavan, Aparna GN, Subhash N

xxv
(2009). Discrimination analysis of autofluorescence spectra for classification of orallesions in vivo. Lasers in Surgery and Medicine (accepted).
2. Conference Proceedings:
Subhash N, Rupananda Mallia J, Shiny Sara Thomas, Anitha Mathews, PaulSebastian,, Jayaprakash Madhavan, (2004). Discrimination of malignant oral cavitylesions using R540/R575 reflectance spectral ratio. Proceedings of the InternationalPHOTONICS 2004 Conference, Kochi, December 2004.
Rupananda Mallia J, Shiny Sara Thomas, Rejnish Kumar, Anitha Mathews, PaulSebastian Jayaprakash Madhavan, Subhash N (2006). Diagnosis of oral cavityneoplasms with fluorescence spectroscopy. Kerala Science Congress 2006, CESS,Trivandrum, 458-461.
Rupananda Mallia J, Shiny Sara Thomas, Rejnish Kumar, Anitha Mathews, PaulSebastian, Jayaprakash Madhavan, Gigi Thomas, Subhash N (2007). Photodiagnosisof oral cancer detection in vivo using diffuse reflectance spectral ratios. NationalLaser Symposium, Ahemadabad, Gujarat, Dec. 17-20, (Presented).
Jayanthi J L, Rupananda J. Mallia, Shiny Sara Thomas, Aparna G N, Baiju K V,Rejinish Kumar, Anitha Mathews, Subhash N (2008). Applicability of discriminantanalysis in the grading of oral mucosa, Swadeshi Science Congress 2008, Trivandrum(Presented).

xxvii
PrefaceThis study is a multidisciplinary research intended to contribute to improved
management of dental caries. One of the significant aspects in dental caries diagnosisis that if early changes are not detected, lesion would continue to demineralise leadingto cavity formation. Once cavitation occurs, the lost tooth structure cannot beregenerated. Further, tooth demineralization is difficult to diagnose in the early stagesof development with the existing detection methods. Therefore, the main focus of thestudy is to explore the potential of laser-induced fluorescence (LIF) and diffusereflectance (DR) spectroscopy techniques to identify incipient changes in toothenamel, which is crucial for decisions on treatment modalities in operative dentistry.
Chapter 1 gives a brief insight into dental caries and demineralization thatleads to mineral loss in tooth, current methods of detection and their limitations in aclinical setting, and also on disease management. It is intended as a brief survey ofthe tools that are available to the dentists for diagnosis and should not be consideredas a comprehensive review. Finally, the significance of early detection of dental cariesand the need to develop new techniques for detecting early changes in tooth enamelare presented.
Basic knowledge on the development and structure of the teeth is essential tounderstand the various diseases affecting teeth as well as for the exploitation of opticaltechniques for diagnostic applications. In addition, a practical understanding of thebiologic processes of tissue and the physical properties of light would help tocomprehend and control the outcome of its interaction for the detection of dentalcaries. Chapter 2 details the basic anatomy of the tooth and its interaction with light,with special emphasis on the basic concepts of tissue fluorescence and diffusereflectance, which form the basis of the work presented in this thesis. In addition,different types of endogenous fluorophores and their absorption and emissioncharacteristics are also described in this chapter.
In the past decade, key technologies such as (a) compact lasers, (b) CCDdetectors and (c) easy-to-use computing platforms combined with fiber-optic coupledinstrumentation has lead to the development of many photonics based diagnosticand therapeutic methods in dentistry. The use of optical spectroscopy in dentistryis crucial for early detection of dental caries, to carry out more effective but,minimally-invasive targeted-therapies and to restore diseased tissues functionally

xxviii
and aesthetically. Among the various non-invasive optical techniques, those relyingon tooth autofluorescence and diffuse reflectance are most promising in the diagnosisof dental caries. Chapter 3 presents details of a compact, non-invasive, laser-inducedfluorescence and reflectance spectroscopic system (LIFRS) developed for detectionand point monitoring of caries progression. Details on data acquisition using LIFRSand the various statistical methods adopted for data analysis are also given in thischapter. Further, this chapter describes the ethical issues, the protocol adopted forclinical studies, and patient inclusion/exclusion criteria.
Chapter 4 examines the potential of LIFRS system for distinguishing differentstages of caries. Towards this, nitrogen laser (337.1 nm) excited fluorescence andwhite light illuminated DR spectra of extracted tooth samples belonging to differentcategories were measured. The caries tooth showed lower fluorescence andreflectance intensities in the 350 to 700 nm region as compared to sound tooth. TheLIF spectra were analyzed by curve fitting to determine the peak position of the variousbands present and their relative contribution to the overall spectra. The deconvolutedpeaks in the LIF spectra were found centered at 403.8, 434.2, 486.9 and 522.5 nm insound tooth, whereas a new peak was observed at 636.8 nm in pulp level caries.Curve-fitted parameters such as peak center, Gaussian curve area and full width athalf intensity maximum (FWHM) and their ratios were found to vary with the stage oftooth caries. The intensity and Gaussian curve area ratios of the peaks at 405, 435and 490 nm were found to be sensitive to discriminate between sound, dentin andpulp level caries. Among the diffuse reflectance spectral ratios studied, the R500/R700 was found to be most sensitive to distinguish between pulp and dentin levelcaries. The LIF measurement with spectral analysis done by curve fitting outscoresDR spectroscopy and shows potential to screen different levels of tooth decay in aclinical setting.
Chapter 5 explores the application of tissue fluorescence and DR to detecttooth demineralization and evaluates their applicability in a clinical setting. The LIFRSsystem was used to measure LIF and DR spectra from in vitro premolar toothduring various stages of artificial erosion. It was observed that both LIF and DRspectral intensity increases gradually during tooth erosion. With curve fitting carriedout using Gaussian spectral functions, broad-bands seen at 440 and 490 nm insectioned sound enamel were resolved into four peaks centered at 409.1, 438.1,492.4 and 523.1 nm, whereas in sound dentin slices the peaks were observed at412.0, 440.1, 487.8 and 523.4 nm. The fluorescence spectral ratio, F410/F525,derived from curve-fitted Gaussian peak amplitudes and curve areas were found to

xxix
be more sensitive to erosion as compared to the DR ratio R500/R700 and the rawLIF spectral ratio F440/F490.
Further, in Chapter 6, the results of a study conducted to compare thecapability of LIF and diffuse reflectance (DR) spectral data to detect de- and re-mineralization changes on in vitro tooth samples are presented. Towards this, nitrogenlaser-induced fluorescence and tungsten halogen lamp-induced DR spectra wererecorded on a miniature fiber-optic spectrometer from a set of premolar tooth samplessubjected to cyclic de- and re-mineralization (CDR) for 10 days, followed by continuousremineralization (CR) for 14 days to enhance the effect of remineralization. The LIFand DR spectral intensities were found to decrease with CDR, but get reversed duringCR. Significant differences (p <0.05) were noticed in spectral features between sound,demineralized and remineralized tooth with one-way ANOVA. The constituent peaksin sound tooth LIF spectra deconvoluted by curve fitting were found centered at 411.32,440.08, 484.37 and 521.98 nm. Spectral features like peak center, full width at halfintensity maximum (FWHM), Gaussian amplitude and curve area derived by curvefitting were found to vary with de- and re-mineralization. However, the characteristicsof LIF peaks at 410 and 525 nm were found to be more suited for detecting toothmineralization changes as compared to the raw LIF and DR spectral signatures.
Chapter 7 explains the potential of fluorescence spectroscopy (LIF) tocharacterize different stages of dental caries with 404 nm diode laser excitation. Invitro spectra were recorded on a miniature fibre-optic spectrometer from 16 sound,10 non-cavitated and 10 cavitated molar teeth. The area under curve of the receiveroperating characteristics (ROC-AUCs) and one way variance analysis (ANOVA) werecalculated. Autofluorescence spectral intensity of carious lesions were found lowerthan that of sound tooth and decreased with the extent of caries. The LIF spectra ofcaries tooth showed two peaks at 635 and 680 nm in addition to a broad band seen at500 nm in sound tooth. It was observed that fluorescence intensity ratios, F500/F635and F500/F680, of caries tooth are always lower than that of sound tooth. The ROC-AUC for discriminating caries from sound tooth was 0.94, whereas for distinguishingnon-cavitated lesions the ROC-AUC was 0.87. Statistically significant differences (p<0.001) were seen between sound, non-cavitated and cavitated caries lesions. Theseresults show that LIF spectroscopy could be utilized for characterizing different stagesof caries in a clinical setting.
Chapter 8 examines the clinical applicability of a diagnostic algorithm orthe fluorescence reference standard (FRS) developed based on LIF spectral ratios

xxx
to discriminate different stages of caries. Towards this, LIF emission spectra wererecorded in the 400-800 nm spectral range on a miniature fiber optic spectrometerfrom 105 patients, with excitation at 404 nm from a diode laser. The spectral resultswere correlated with visual-tactile and radiographic examinations. The LIF emissionof sound tooth shows a broad emission at 500 nm that is characteristic of naturalenamel whereas in carious tooth, additional peaks were seen at 635 and 680 nm,due to emission from porphyrins linked to oral bacteria. In order to discriminate differentstages of tooth caries, FRS ratio scatter plots of the fluorescence intensity ratiosF500/F635 and F500/F680 were developed to differentiate sound from incipient, soundfrom advanced and incipient from advanced caries using the spectral data obtainedfrom 65 carious sites and 25 sites of sound tooth in 65 patients. The sensitivity,specificity, PPV and NPV of the developed algorithm to detect tooth caries werecalculated and presented. Sequentially, a blind-test was carried out in 15 sound and40 carious sites of 40 patients to check the accuracy of the developed standard forearly detection of tooth caries.
Chapter 9 presents the application of LIF spectral ratios and curve-fitting fordistinguishing different stages of tooth caries in a clinical setting with 404 nm excitation.The LIF spectra show a broad emission around 500nm for sound tooth, whereasadditional peaks were seen at 635 and 680 nm in carious tooth. Curve-fittedparameters such as peak center, peak amplitude, Gaussian curve area and FWHMwere found vary with the different stages of tooth caries. Fluorescence intensity ratios,F490/F635 and F490/F675, derived from the raw spectral intensities, curve-fitted peakamplitudes and Gaussian curve areas were higher for sound tooth as compared tocaries lesions and tend to decrease with the progression of caries. The Gaussiancurve ratios, F490/F635 and F490/F675 were found to be more sensitive fordiscriminating different stages of caries as compared to raw LIF ratios. Finally, thediagnostic performance of LIF spectroscopy in a clinical settling was evaluated interms of receiver operating characteristic (ROC) curves.
The potential of DR spectroscopy for detecting tooth caries in vivo arepresented in Chapter 10. A clinical study conducted on patients has shown that invivo DR spectral intensity decreases in caries tooth. Diffuse reflectance referencestandard (DRRS) scatter plots of the DR ratios R500/R700, R600/R700 and R650/R700 were developed to differentiate sound from caries tooth using spectral datafrom 24 patients. The sensitivity, specificity, PPV and NPV of these DRRS ratios todetect tooth caries are calculated and presented. The diagnostic performance of DRspectroscopy was also evaluated in terms of receiver operating characteristic (ROC)

xxxi
curve. Among the various ratios studied, R600/R700 ratio gave comparatively highersensitivity and specificity. In this study, DR ratios were able to discriminate soundfrom non-cavitated caries lesions with an average sensitivity of 88% and specificityof 100%.
Chapter 11 is the wrapping up section, which discusses the merits of theLIFRS system and this doctoral thesis, its future perspectives in the detection ofdental caries and the limitations of the optical spectroscopy techniques utilized in thisstudy. This section also reviews the diagnostic accuracies of LIF and DR modalitiesby comparing the present results with those obtained by other research groups usingoptical techniques for early detection of caries lesions.
As stated above, the common thread in the studies presented is the use ofoptical spectroscopy to detect tissue transformations. A fiber-optic LIFRS systemwas developed in our laboratory to perform autofluorescence and diffuse reflectancemeasurements. It has therefore been the fundamental device in the course of thiswork. Its flexibility allowed us to sequentially probe the fluorescence and diffusereflectance spectra from same sample in real-time. The instrument sensitivity allowedus to detect very faint autofluorescence signals of biological tissues and the fact thatthe unit was fabricated in-house allowed us to suitably adapt and modify it whenevernecessary.


xxxiii
Abbreviations and Acronyms
ANOVA Analysis of variance
AUC Area under the curve
CCD Charge Coupled Device
CDR Cyclic de- and re-mineralization
CI Confidence interval
CR Continuous remineralization
DCJ Dentino-cemental junction
DEJ Dentino-enamel junction
DIFOTI Digital imaging fiber-optic transillumination
DR Diffuse reflectance
DRRS Diffuse reflectance reference standard
DRS Diffuse reflectance spectroscopy
ECM Electrical conductance measurement
EIM Electrical impedance measurement
FAD Flavin Adenine Dinucleotide
FN False negative
FOTI Fiber-optic transillumination
FP False positive
FPF False-positive fraction
FRS Fluorescence reference standard
FWHM Full width at half maximum
HA Hydroxyapatite

xxxiv
Hb Deoxygenated Hemoglobin
HbO2
Oxygenated Hemoglobin
IR Infrared
LF laser fluorescence
LIF Laser-induced fluorescence
LIFRS Laser-induced fluorescence reflectance spectroscopy
LIFS Laser-induced fluorescence spectroscopy
LOO Leave-one-out
NADH Reduced Nicotinamide Adenine Dinucleotide
NADPH Nicotinamide Adenine Dinucleotide phosphate
NPV Negative predictive value
OCT Optical coherence tomography
PpIX Protoporphyrin IX
PPV Positive predictive value
PS-OCT Polarization sensitive-optical coherence tomography
QLF Quantitative laser/light-induced fluorescence
ROC Receiver operating characteristic
TN True negative
TP True positive
TPF True-positive fraction
UV Ultraviolet
VIS Visible

Chapter 1
Background, Intention and Description of theProblem


11.1 BACKGROUND AND INTENTION
Dental caries is an important Dental-Public-Health dilemma and it is the mostwidespread oral disease in the world. The prevalence of dental caries has been ofgreat concern for long and is a principal subject of many epidemiological researchescarried out in India and abroad. This disease not only causes damage to the tooth,but is also responsible for several morbid conditions of the oral cavity and othersystems of the body (WHO 1981). The prevalence pattern of dental caries not onlyvaries with age, sex, socio economic status, race, geographical location, food habitsand oral hygiene practices but also within the oral cavity. All the teeth and all thesurfaces are not equally susceptible to caries. Factors contributing to the progressionof the disease include diet (mainly fermentable carbohydrates), microbes, and thehost (amount and constituents of the saliva, habits). The progression of dental carieslesions needs time. Fluoride protects the teeth from dental caries by influencing thetooth structure.
Over the last decades, a remarkable decline in caries prevalence has been noticedin the world population, primarily due to the increase in scientific knowledge on theetiology, initiation, progression and prevention of the disease coupled with the widescope of preventive measures and fluoride therapy (Elderton, 1983; Kidd et al, 1987;Newbrun, 1993; Ekstrand et al, 2001). However, it is still a major oral health concernin developing countries, affecting 60-90% of the school children and the vast majorityof adults (World Oral Health Report, 2003). On the other hand, dental caries is highlyprevalent in India, which is influenced by the lack of dental awareness among thepublic at large and is reported to be about 50-60% in India (Naseem, 2005). Thedramatic improvements in the prevalence and incidence of dental caries and thechanges in the epidemiology and pattern of disease over the past thirty years is welldocumented (Marthaler 1990, 2004). Most notably, the rate of progression throughthe teeth has slowed. This reduction in prevalence has not occurred uniformly for alldental surfaces. The utmost reduction was seen at smooth surfaces lesions, followedby proximal surfaces, so that occlusal surfaces are now the most probable sites fordevelopment of caries. Nevertheless, the disease has not been eradicated andalthough less widely distributed in the dentition and less acute in terms of lesionprogression, caries persists in the general population.

4 Spectroscopic Investigation of Tooth Caries and Demineralization
In addition to the drastic changes in the disease manifestation itself, in recentyears there has also been major progress in our understanding of the mechanismsunderlying the development of clinical stages of the disease. In clinical dentistry, thisnew knowledge has led to an evident change in the interpretation of signs of possiblehard tissue damage due to caries at individual tooth sites. Thus the initial effect of thedisease on the enamel is clinically undetectable subsurface demineralization and netloss of tooth mineral as the result of a mineral imbalance between plaque fluid andtooth surface (Fejerskov, 1997). At this stage, the damage is reversible and the affectedsite can be remineralized. Factors that determine the balance of the reactions andthus the likelihood of mineral loss or gain and the rate at which it occurs, arecomposition and thickness of the biofilm covering tooth surfaces, the diet, the fluorideion concentration, and the salivary secretion rate (Kidd & Fejerskov, 2004).
In clinical dental practice, the decrease in the rate of lesion progression has led tothe modification of thresholds for restorative intervention and a change towards aless invasive approach to the management of the disease. Despite our improvedunderstanding of the caries process and the availability of effective intervention, carieslesions still progress to the stage where tooth structure is compromised and invasiveintervention and restoration are required. On the basis of these concepts of the diseaseprocess, lesion detection and early intervention, the goals of caries management areto inhibit the initiation of new lesions, to arrest the progression of established lesionsand to enhance the natural process of lesion repair by remineralization (Featherstone,2004).
For decades, dentists have relied on visual inspection, tactile examination withprobe and X-rays to identify dental caries and early-stage cavitation sites. Amongthese, visual inspection is the favoured choice to diagnose dental caries because it isnon-destructive as compared to mechanical methods such as probing, which candamage tooth structure and X-rays, which are ionizing and hazardous in nature. All ofthese methods have limitations affecting either their diagnostic ability or their practicalityin a clinical setting. Once the caries cavity is detected by conventional techniques,tooth demineralization has usually progressed through approximately one-third toone-half of the enamel’s total thickness (Angmar-Mansson and ten Bosch, 1993;Schneiderman et al, 1997; Ashley et al, 1998; Hintze et al, 1998; Ross, 1999; Young,2002). Because X-rays only show good contrast when considerable mineral losshas already taken place, this technique allows detection only of already well-advancedcaries. At this stage, the treatment option is drilling and filling with restorative material.Thus there is an emerging need for sensitive, clinically relevant methods for early

Background, Intention and Description of the Problem 5
detection and quantification of caries lesions. The development of new techniques couldimprove the accuracy of detection and especially could create the possibility of earlycaries detection and helps to apply suitable preventive measures or operativeprocedures.
1.2 OBJECTIVES OF THE STUDY
Detection of dental caries using optical techniques is receiving a lot of attentionthese days. Several, published data demonstrate the potential of optical spectroscopyto characterize caries lesions. Diagnostic techniques based on optical spectroscopyallow non-invasive and real-time characterisation of tissue. In particular, these techniquesare fast, quantitative and can be easily automated. As well as, they also elucidate thechemical composition and morphology of the tissue which in turn help in monitoringmetabolic parameters of the tissue and also distinguish sound from carious tooth.Among them, the potential of laser-induced fluorescence (LIF) and diffuse reflectance(DR) is enormous and yet, is not fully explored for early detection of dental caries invivo. The hypothesis of present work is that these optical techniques will help todiscriminate different stages of caries with good sensitivity and specificity. This thesismainly aims at testing the applicability of LIF and DR spectroscopic techniques fordetecting caries in its early stage. As part of this work, the applicability of LIF and DRspectroscopy in detecting early demineralization and remineralization is also tested.
In this current thesis, autofluorescence and diffuse reflectance spectra were obtainedfrom sound and caries tooth belonging to different categories, with the intention of earlydetection of tooth caries. The major objectives of the study are:
1. Development of a compact, non-invasive, point monitoring laser-inducedfluorescence reflectance spectroscopy (LIFRS) system for simultaneous measurementof laser-induced fluorescence and diffuse reflectance spectra from the same toothsamples, to detect dental caries or discriminate different stages of caries.
2. Standardization of measurement parameters and study protocol through invitro studies
3. To test the applicability of the developed LIFRS system to detect dental erosion.
4. To test the ability of the device to detect early demineralization changesin tooth.
5. To study the effects of remineralization treatment on demineralized tooth.

6 Spectroscopic Investigation of Tooth Caries and Demineralization
6. Modification of the device based on the in vitro results, for clinical studies atthe Department of Conservative Dentistry and Endodontics of Government DentalCollege Thiruvananthapuram and to measure LIF and DR spectra in patient andcorrelate with visual-tactile and radiographic findings.
7. To check the diagnostic accuracy of LIFRS system with visual-tactile andradiographic examination, in terms of sensitivity, specificity and ROC analysis fordetection of dental caries both in vitro and in vivo conditions.
1.3 SOME FACTS ABOUT DENTAL CARIES
Dental caries is a dynamic process, taking place in the microbial deposits (dentalplaque on the tooth surfaces), which results in a disturbance of the equilibrium betweentooth substance and the surrounding plaque fluid so that, over time, the end result isthe loss of mineral from the tooth surface (Thylstrup and Fejerskov, 1994).
1.3.1 Carious process
The carious process affects the mineralized tissues of the teeth mainly enamel,dentin and cementum, which is caused by the action of microorganisms onfermentable carbohydrates in the diet. It can eventually lead to the demineralizationof mineral portion of these tissues, followed by the disintegration of the organicmaterial. At the crystal level, onset of carious process may be expected, butprogression of a microscopic lesion to clinically detectable lesion is not a certaintybecause in its initial stage, the process can be arrested and a carious lesion maybecome inactive. Nevertheless, progression of the lesion into dentin can finally result
Fig. 1.1 Etiology of dental caries.
Background, Intention and Description of the Problem 7
in bacterial invasion and death of the pulp and spread of infection into periapical tissues,producing pain.
1.3.2 Etiology of Caries
Dental caries is a multi-factorial disease. Many variations are seen in theincidence of caries due to the complex interplay of several factors. Basically,caries occurs when there is interaction of four principal factors; the host i.e.,tooth, the microflora, the substrate and the time. For caries to occur all the fourfactors should be favourable- it means caries requires a susceptible tooth surface,cariogenic oral flora and a suitable substrate for a sufficient length of time (Fig.1.1).
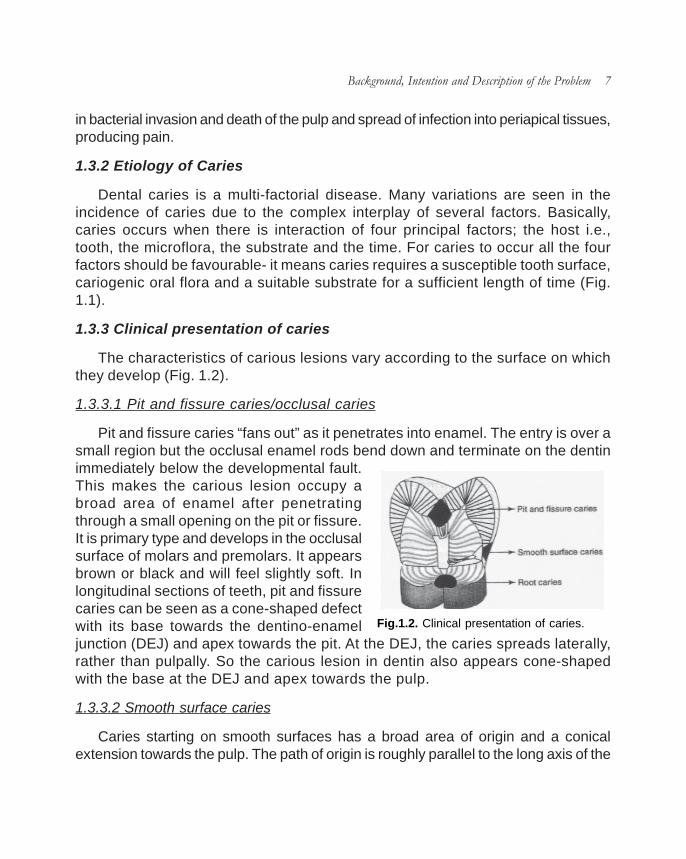
1.3.3 Clinical presentation of caries
The characteristics of carious lesions vary according to the surface on whichthey develop (Fig. 1.2).
1.3.3.1 Pit and fissure caries/occlusal caries
Pit and fissure caries “fans out” as it penetrates into enamel. The entry is over asmall region but the occlusal enamel rods bend down and terminate on the dentinimmediately below the developmental fault.This makes the carious lesion occupy abroad area of enamel after penetratingthrough a small opening on the pit or fissure.It is primary type and develops in the occlusalsurface of molars and premolars. It appearsbrown or black and will feel slightly soft. Inlongitudinal sections of teeth, pit and fissurecaries can be seen as a cone-shaped defectwith its base towards the dentino-enameljunction (DEJ) and apex towards the pit. At the DEJ, the caries spreads laterally,rather than pulpally. So the carious lesion in dentin also appears cone-shapedwith the base at the DEJ and apex towards the pulp.
1.3.3.2 Smooth surface caries
Caries starting on smooth surfaces has a broad area of origin and a conicalextension towards the pulp. The path of origin is roughly parallel to the long axis of the
Fig.1.2. Clinical presentation of caries.
8 Spectroscopic Investigation of Tooth Caries and Demineralization
enamel rods in the region. It develops on the proximal surfaces of the teeth or onthe gingival third of buccal and lingual surfaces. In longitudinal section, the cariesprocess is seen as cone-shaped area, with its base towards the enamel surfaceand its apex towards the DEJ. At DEJ, it spreads laterally along the junction, ratherthan pulpally. The base of the cone in dentin is again at the DEJ and its apex istoward the dental pulp.
1.3.3.3 Root surface caries
The cementum covering root surfaces is relatively thin and provides littleresistance to caries attack. Root surface caries begins directly on dentin. It is U-shaped in cross section and spreads more rapidly because dentin is less resistantto caries attack.
1.3.4 Histopathology of caries
1.3.4.1 Caries of enamel
Enamel is highly mineralized tissue and forms an effective barrier to bacterialattack. However, its organic substance and water content make enamel act like amolecular sieve allowing free movement of small molecules and blocking thepassage of larger molecules and ions. Caries in enamel preferentially attacks theinterprismatic areas and the more permeable Striae of Retzius, because theseregions have more organic content, followed by prism cores. As caries progressesin enamel along these regions, it spreads laterally thereby undermining enamel.
The first sign of enamel caries is seen as white spot. It appears opaque ondrying the tooth surface and translucent on wetting the surface. If the enamel lesionis allowed to develop, demineralization becomes more predominant, which in turncause a break in the enamel surface, producing cavity. Once cavity is formed,bacteria gains entry into the surface and progress deeper into the tooth.
An early enamel lesion seen under polarized light reveals four distinct zones ofmineralization. These zones include,
a) Surface Zone: This outermost zone is relatively unaffected by caries attack.It is well mineralized by replacement ions from plaque and saliva.
b) Body of the lesion: This is the major portion of enamel caries. It is poorlymineralized. Caries spreads along the Striae of Retzius and interprismatic areas

Background, Intention and Description of the Problem 9
and then attacks the prism cores. Bacteria are present in this zone.
c) Dark zone: This lies deeper to the body of the lesion and represents someremineralization.
d) Translucent zone: This is the deepest zone which represents the advancingfront of the enamel caries. This is translucent due to demineralization which creates astructureless appearance of the enamel.
These zones represent the dynamic series of events taking place in early enamelcaries. The early enamel caries can be reversed and remineralized if plaque is removed.
1.3.4.2 Caries of dentin
Caries progression in dentin is different from that of enamel. Dentin has lessermineral content and microscopic dentinal tubules provide a pathway for the spread ofcaries. Thus caries progresses more rapidly in dentin than in enamel. The DEJ is lessresistant to caries attack and allows lateral spread of caries. Dentinal caries is V-shapedin cross-section with its base at the DEJ and apex towards the pulp. Changes seen ascaries spread in dentin:
i) Weak organic acids demineralize the dentin.
ii) The organic content of dentin especially collagen undergoes degenerationand dissolution.
iii) Breakdown of the structural integrity and bacterial invasion.
Pathological changes seen in carious dentin is divided into various zones. They are
a) Zone 1, Normal dentin: The deepest zone of carious dentin is normal withnormal collagen, odontoblastic processes and intertubular dentin.
b) Zone 2, Sub-transparent dentin: Here the intertubular dentin is demineralized,odontoblast processes are damaged and fine crystals are seen in the lumen of thedentinal tubules. But no bacteria are present.
c) Zone 3, Transparent dentin: This is superficial to the subtransparent dentin.It is softer than normal dentin and exhibits mineral loss in intertubular dentin. No bacteriaare present and collagen cross-linking is intact. So this layer is capable ofremineralization.

10 Spectroscopic Investigation of Tooth Caries and Demineralization
d) Zone 4, Turbid dentin: Here dentinal tubules are widened and distorteddue to bacterial invasion. There is considerable demineralization and collagen isirreversibly denatured.
e) Zone 5, Infected dentin: This is the outermost zone. It has decomposeddentin with destruction of dentinal tubules and collagen. A high concentration ofbacteria is present. This zone has to be removed to avoid the spread of infection.
Since dentin and pulp are intimately related, once caries attack dentin the dentin-pulp complex produces a protective response by blocking the open dentinal tubules.This response depends on the severity of the caries attack.
1.3.5 Diagnosis of dental caries
Early diagnosis of carious lesion is essential because the carious process canbe modified by preventive measures so that the lesion does not advance. The searchfor an ideal caries diagnostic method continues as such technique must be accurate,sensitive, specific, reproducible and reliable. Traditional methods of caries detectioninclude visual inspection, tactile examination with an explorer and radiographicexamination. These traditional techniques are still used in contemporary dental
Fig.1.3. Diagnostic methods for dental caries.

Background, Intention and Description of the Problem 11
practices; nevertheless some practices have been altered due to paradigm shift ornew diagnostic equipment (Fig. 1.3).
1.3.5.1 Visual examination
Visual inspection is best performed in a well lit, clean, dry field, with the aid ofmagnification. The first step in assessing the caries status of a patient is to visuallyinspect all tooth surfaces, including rootsurfaces (Baysan, 2007). Visual dataof caries is a good indicator of thedegree of caries penetration within toothtissues. ‘Sharp eyes’, with or without theaid of x2-4 loupes, in combination withgood illumination and drying with a three-in-one syringe, termed as detectiontriangle (Fig. 1.4), may offer moreinformation than the use of a mirror anda sharp probe.
The procedure for initial visual inspection, with or without the help of loupes is asfollows:
a) Clean the tooth surface
b) Place cotton rolls and saliva ejector
c) With the surface wet, examine the suspected white or brown spot lesions.
d) Dry the tooth using the three-in-one syringe.
e) Confirm the presence of any white or brown spot lesions.
f) If there is any obvious cavitation, then visual-tactile examination can beconsidered to determine if there is any exposed dentin (Ekstrand et al, 2001).
1.3.5.2 Visual-Tactile Techniques
At present, most caries tends to be detected using visual-tactile criteria, based onthe presence or absence of cavitation and the surface texture of lesions. Usually curvedexplorers are used for examining occlusal pits and fissures while interproximal explorers
Fig.1.4. Detection triangle.

12 Spectroscopic Investigation of Tooth Caries and Demineralization
are used to detect proximal caries. The use of dental explorers may not improvethe accuracy of diagnosis; indeed, it may increase the number of false positivediagnoses. Probing can also transfer infective microorganisms from one site to anotherand disrupt tooth surfaces prone to cavitation (Kidd et al, 1993). It has also beenobserved that excessive pressure with a sharp explorer tip can convert initial lesionsinto cavitation (Yassin, 1995). Therefore it is advised to use only blunt probes to removedebris and confirm frank cavitation.
1.3.5.3 Radiographic examination
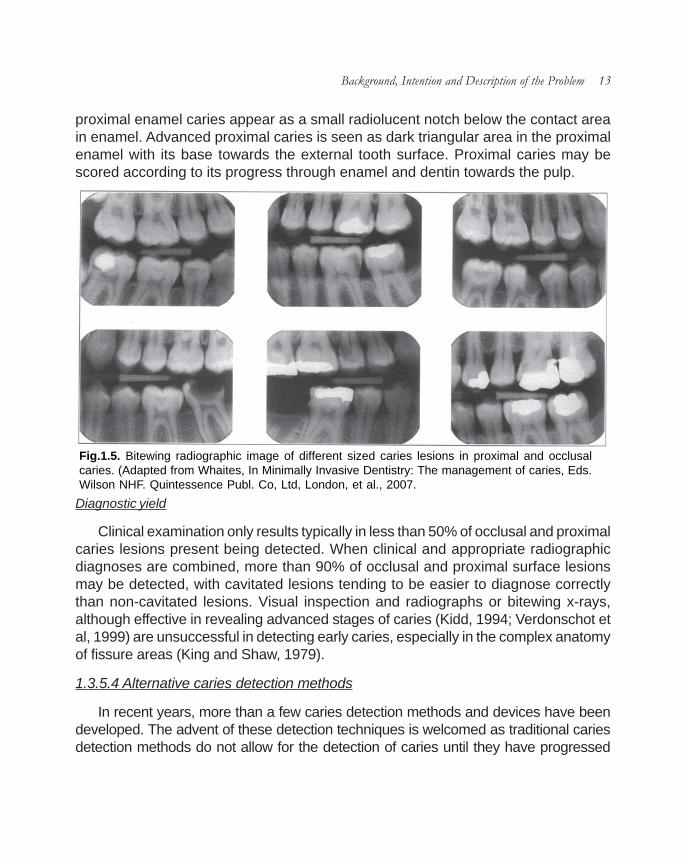
The use of radiographs to scrutinize teeth and other oral structures for thepresence of oral disease remains the ‘gold standard’ (Barnes, 2005). Conventional,intraoral periapical and bitewing radiographs are used to diagnose dental caries. Ofthe two, bitewing radiographs have more diagnostic value. Bitewing radiographs hasbeen used for the detection of occlusal and proximal surface caries as well as cariesadjacent to the margins of restorations (secondary caries) in posterior teeth in bothadults and children (Fig. 1.5). Periapical radiographs are used for detecting earlyproximal surface caries in anterior teeth. Characteristics of acceptable radiographsare shown in Table 1.1.
Initial enamel caries in the occlusal surfaces are difficult to detect using bitewingradiographs due to its complicated three dimensional shapes. Also caries involvingthe buccal or lingual grooves of molars may mimic occlusal lesions due tosuperimposition. Once caries has progressed into dentin, it appears as radiolucentzone.
Bitewing radiographs are very important in diagnosing proximal caries. Early
Charac teris tics Appearance
Im age All p arts of teeth of interest must b e show n c lose to natura l size, with min im al overlap and min im al dis to rtion
Area covered Suff icie nt t issue surrounding tooth for diagnos tic purposes
D ensity Proper dens ity for diagnos is
C ontras t Proper contras t for diagnosis
Definition and sharpness C lear out line of objec ts , minim al penum bra
Adapted f rom W hite and Pharoah. Oral radiology princ iples and interpretat ion. 5th edit ion. St Louis, M osby , 2004
Table 1.1 Characteristics of acceptable radiographs.
Background, Intention and Description of the Problem 13
proximal enamel caries appear as a small radiolucent notch below the contact areain enamel. Advanced proximal caries is seen as dark triangular area in the proximalenamel with its base towards the external tooth surface. Proximal caries may bescored according to its progress through enamel and dentin towards the pulp.
Diagnostic yield
Clinical examination only results typically in less than 50% of occlusal and proximalcaries lesions present being detected. When clinical and appropriate radiographicdiagnoses are combined, more than 90% of occlusal and proximal surface lesionsmay be detected, with cavitated lesions tending to be easier to diagnose correctlythan non-cavitated lesions. Visual inspection and radiographs or bitewing x-rays,although effective in revealing advanced stages of caries (Kidd, 1994; Verdonschot etal, 1999) are unsuccessful in detecting early caries, especially in the complex anatomyof fissure areas (King and Shaw, 1979).
1.3.5.4 Alternative caries detection methods
In recent years, more than a few caries detection methods and devices have beendeveloped. The advent of these detection techniques is welcomed as traditional cariesdetection methods do not allow for the detection of caries until they have progressed
Fig.1.5. Bitewing radiographic image of different sized caries lesions in proximal and occlusalcaries. (Adapted from Whaites, In Minimally Invasive Dentistry: The management of caries, Eds.Wilson NHF. Quintessence Publ. Co, Ltd, London, et al., 2007.

14 Spectroscopic Investigation of Tooth Caries and Demineralization
through at least the thickness of enamel. Some of these new caries detection methodsare so recent that they are not yet marketed to the dental profession and others havebeen found to be more practical for research purposes. These methods include:
1.3.5.4.1 Diagnostic method based on X-rays: Digital and subtraction radiography
Currently, digital radiographic methods offer a more superior means of detectingcaries than conventional radiographs. Digital radiographic images are created by usingthe spatial distribution of pixels and the different shades of gray of each of the pixels.These radiographic devices interface with a computer to digitize the digital radiographicimages into pixels that are then viewed on a computer. It offers several advantagesover traditional dental radiography:
i) Reduced radiation exposure to patient
ii) Instant image visualization
iii) Eliminates chemical processing and accompanying errors
iv) Image enhancement, processing and magnification can be done
The most important advantage of digital imaging is that it can be used for subtractionpurposes. Here images which are not of diagnostic value in a radiograph are reducedso that the changes in the radiograph can be precisely detected. Images taken overtime are superimposed to check the differences between original and subsequentimages.
1.3.5.4.2 Diagnostic systems based on electrical current: ECM/EIM
The theory behind the use of Electrical Conductance Measurement (ECM) is thatsound tooth enamel is an insulator, due to its high inorganic content. On the otherhand, carious or demineralized enamel has a measurable conductivity which increaseswith the degree of demineralization. On the basis of this difference, four colouredlights were used as indicator for caries.
i) Green: no caries
ii) Yellow: enamel caries
iii) Orange: dentin caries
iv) Red: pulpal involvement

Background, Intention and Description of the Problem 15
Many researchers have used ECM for both in vitro (Verdonschot et al, 1993;Ashley et al, 1998) and in vivo studies (Rock and Kidd, 1988; Verdonschot et al,1992a) and the reported sensitivities for diagnosing dentinal carious lesions ofpermanent molar and premolar ranged from 0.67 to 0.96, whereas the specificitiesranged from 0.71 to 0.98. In addition, they are more accurate in diagnosing earlyocclusal caries than visual method, radiographs or fiber optic transillumination(FOTI). The major disadvantage of ECM method is the use of sharp metal explorers,which in turn cause traumatic defects in pits and fissures.
Carious tissues have much lower electrical impedance or much better electricalconductivity than sound tooth. This principal of electrical impedance has been usedto detect caries lesions at approximal surfaces of teeth (Huysmans et al, 1996;Longbottom et al, 1996). Even though the results from these in vitro studies werevery promising, no follow up results have been reported since.
1.3.5.4.3 Transillumination: FOTI and DIFOTI
Transillumination has been used as diagnostic tool in dentistry for over 30 years(Stookey, 2003). Caries detection using transillumination with a bright fiber-opticlight depends on the light scattering by the lesion. Increased opacity of the enamelis the visual sign of early caries. Optical scattering can be used to quantify thedegree of demineralization in enamel and dentin. In sound tooth, scattering is moreprominent than absorption. Nevertheless, when light transmits through damagedtooth, light absorption increases. Dark shadowing indicates the presence of caries.It is especially useful in detecting proximal caries, with the added advantage overradiographic techniques that the patient is not exposed to ionizing radiation. It doesnot detect small carious lesions; hence its use is limited.
The Digital imaging fiber-optic transillumination (DIFOTI) is a relatively newtechnique that has developed in an attempt to decrease the short coming of FOTI,by combing FOTI and a digital CCD camera. Illumination is delivered to the toothsurface by means of fibre-optic light source. The resultant change in light distributionis captured by the camera and is sent to the computer for analysis. It is non-invasiveand can detect incipient and recurrent caries very early. But it does not measurethe depth of the lesion and are not able to discriminate between deep fissure, stainand dental caries. Nevertheless, these techniques have lower sensitivities for cariesdetection when compared with radiologic images and poor reliability as compared tovisual inspection and bitewing radiography (Hintze et al, 1998; Schneiderman et al,1997).

16 Spectroscopic Investigation of Tooth Caries and Demineralization
1.3.5.4.4 Quantitative laser/light-induced fluorescence (QLF)-yellow/orangefluorescence
As the name of the method implies, QLF is based on fluorescent light. In QLF thislight is not induced by X-rays or other ionizing radiation but by visible or near ultravioletradiation. The fluorescence of tooth tissue has been known for a very long time. Threetypes of fluorescence have to be distinguished. The first is the blue fluorescence that isexcited in the near ultraviolet. The second is the yellow and orange fluorescence excitedin the blue and green. The third is the fluorescence in the far red and near infrared thathas recently received much attention forquantitative non-image diagnosis of carieslesions. Initially the technique was developedusing lasers and was demonstrated byBjelkhan (1982). With concerns existing overthe intra oral use of lasers, de Josselin de Jong(1995) developed a system using filteredvisible light, QLF. The experimental methodinvolves quantification of the light-inducedfluorescence level of enamel. Sound, healthyenamel shows a higher fluorescence thandemineralized enamel; demineralized areasappear relatively darker under light that excitesthe fluorescence.
The teeth are illuminated with a broad beam of blue-green light from an argon ionlaser (488 nm) or blue light from a xenon arc lamp, equipped with a band pass filter withpeak transmission at 370 nm. A yellow high pass filter (520nm) is placed in front of theCCD micro camera which captures the tooth image. Image of the tooth underexamination is displayed on a PC screen (Fig. 1.6). The absolute decrease influorescence is determined by calculating the percentage loss between actual andreconstructed fluorescence and is expressed as F value.
The QLF has been tested in several in vitro and in vivo studies for smooth surface,occlusal and secondary caries (Al-Khateeb et al, 1997a; Emami et al, 1996; Pretty etal, 2002, 2003; Ferreira Zandona et al, 2000, Heinrich-Weltzein et al, 2005; Ando et al,2000, Kuhnisch et al, 2006, Hall et al, 1997). It has shown that QLF is a sensitive,reproducible method for the quantification of enamel lesions on smooth surfaces.Nevertheless, its application seems to be restricted to a lesion depth of about 500µm.
Fig.1.6. QLF image.

Background, Intention and Description of the Problem 17
Also, QLF cannot discriminate between active and inactive lesions and betweencaries, hypoplasia, stain and calculus.
1.3.5.4.5 DIAGNOdent-infrared fluorescence
The DIAGNOdent device (KaVo, Biberach, Germany) was introduced in 1998 byHibst and Gall (1998) to help in the diagnosis of occlusal caries as an adjunct tovisual inspection and radiographic examination (Fig.1.7). It operates with light from adiode laser with a wavelength of 655 nmand 1mW peak power, which istransported through a fibre bundle to thetip of a hand piece. The tip is placed incontact with tooth surface and laser lightwill penetrate the tooth. Both organic andinorganic molecules in the tooth absorblight. Fluorescence occurs within theinfrared spectrum. The fluorescence aswell as backscattered light is collectedthrough the tip and passed in ascendingfibres to a photodiode detector. Thefluorescence light is measured and itsintensity is an indication of the size anddepth of the caries lesion. Thefluorescence intensity is displayed as anumber ranging from 0 to 99, with 0indicating a minimum and 99 amaximum of fluorescence light.
In the presence of carious tooth substance, fluorescence increases. The causeof fluorescence is due to the presence of protoporphyrins and mesoporphyrins, by-products of bacteria (Hibst and Paulus, 1999, 2000). DIAGNOdent has been usedwidely for detecting occlusal and smooth surface caries (Aljehani et al, 2006,2007; Antonnen et al, 2003; Bamzahim et al, 2004, 2005; Lussi et al, 2003, 2006).In vitro validity studies showed that the sensitivity of DIAGNOdent caries diagnosesranged from 0.17 to 0.87, whereas specificity ranged from 0.72 to 0.98 (Lussi etal, 1999; Shi et al, 2000). Regarding the reliability of this method, good to excellentobserver agreement were reported (Attrill and Ashley, 2001; Lussi et al, 2001). Majorityof works indicate that DIAGNOdent is clearly more sensitive than traditional methods;
Fig.1.7. DIAGNOdent.

18 Spectroscopic Investigation of Tooth Caries and Demineralization
nevertheless, the increased likelihood of false positive diagnoses limits its usefulnessas a principle diagnostic tool (Bader et al, 2004). It is therefore recommended that theDIAGNOdent readings should serve as guidelines and a treatment choice shouldnever be based on its value alone.
1.3.5.4.6 Diagnostic based on ultrasound measurements
Ultrasonic imaging can be used to detect early caries on smooth surfaces (Ng etal, 1988). Here an ultrasonic probe is used to send and receive sound waves fromthe tooth surfaces. Sound enamel produces no echoes while, initial white spot produceweak surface echoes and cavitated areas produce echoes of higher amplitude. Thismethod is inappropriate to apply in patients and also could not detect shallow carieslesions.
1.3.5.4.7 Optical coherence tomography (OCT)
Optical coherence Tomography (OCT) that uses low coherence interferometry,has found broad applications in the cross sectional imaging of biological structures,including dental hard and soft tissue. Polarization sensitive (PS) OCT systems thatutilize polarized incident light (1310 nm) and measure the polarization information fromthe backscattered signal in two separate channels, have been used for imaging ofbirefringent tissues.
Due to the rod-like organization of hydroxyapatite crystals, dental enamel is usuallybirefringent, and initial measurement of tooth enamel with PS-OCT emphasizedcharacterization of the tissue birefringence. PS-OCT images resolved enameldemineralization through an increasing backscattered intensity and changes in theenamel birefringence. If the incident illuminating light is linearly polarized, the light scatteredfrom the demineralized lesion area will rapidly depolarize. Since carious enameldepolarizes incident polarized light, PS-OCT images both the surface and subsurfaceenamel by recording changes in the magnitude of scattering and depolarization withoutinterference from the strong surface reflection. Several studies have demonstratedthat remineralization has a significant effect on the mineral volume on the outer perimeterof the lesion, near the enamel surface. This suggests that PS-OCT could be valuablein imaging the remineralization of caries lesions. Demineralization in the enamel wasresolvable to a depth of 2-3 mm into the tooth. Moreover, OCT is not well suited forimaging entire tooth surfaces or interproximal surfaces in between teeth due to timerestraints and the enormous quantity of data that would be collected.

Background, Intention and Description of the Problem 19
1.3.6 Prevention of dental caries
1.3.6.1 Oral hygiene
Plaque control is essential in caries prevention because caries does not occurin the absence of plaque. Personal hygiene care consists of proper brushing andflossing daily. The purpose of oral hygiene is to minimize any etiologic agents ofdisease in the mouth. The primary focus of brushing and flossing is to remove andprevent the formation of plaque. As the amount of bacterial plaque increases, thetooth is more vulnerable to dental caries. A toothbrush can be used to remove plaqueon most surfaces of the teeth except for areas between teeth. When used correctly,dental floss removes plaque from areas, which could otherwise develop proximalcaries.
Professional hygiene care consists of regular dental examinations and cleanings.Sometimes, complete plaque removal is difficult, and a dentist or dental hygienistmay be needed. Along with oral hygiene, radiographs may be taken at dental visitsto detect possible dental caries development in high-risk areas of the mouth.
1.3.6.2 Dietary modification
Dietary modification is recommended to patients with active caries and those whoare at high risk for caries development. For dental health, the frequency of sugar intakeis more important than the amount of sugar consumed. In the presence of sugar andother carbohydrates, bacteria in the mouth produce acids, which can demineralizeenamel, dentin, and cementum. The more frequently teeth are exposed to thisenvironment; the more likely dental caries are to occur. Therefore, minimizing snackingis recommended, since snacking creates a continual supply of nutrition for acid-creatingbacteria in the mouth. Also, chewy and sticky foods tend to adhere to teeth longer, andconsequently are best eaten as part of a meal. Brushing the teeth after meals isrecommended. Mothers are also recommended to avoid sharing utensils and cupswith their infants to prevent transferring bacteria from the mother’s mouth. It has beenfound that milk and certain kinds of cheese can help counter tooth decay if eaten soonafter the consumption of foods potentially harmful to teeth. Also, chewing gum containingxylitol (wood sugar) is widely used to protect teeth. Xylitol’s effect on reducing plaque isprobably due to bacteria’s inability to utilize it like other sugars. Chewing and stimulationof flavour receptors on the tongue are also known to increase the production and releaseof saliva, which contains natural buffers to prevent the lowering of pH in the mouth tothe point where enamel may become demineralized.

20 Spectroscopic Investigation of Tooth Caries and Demineralization
1.3.6.3 Other preventive measures
The use of dental sealants is a good means of prevention. Sealants are thin plastic-like coating applied to the chewing surfaces of the molars. This coating prevents theaccumulation of plaque in the deep grooves and thus prevents the formation of pitand fissure caries, the most common form of dental caries. Sealants are usuallyapplied on the teeth of children, shortly after the molars erupt. Older people may alsobenefit from the use of tooth sealants, but usually their dental history and likelihood ofcaries formation are taken into consideration.
Fluoride therapy is often recommended to protect against dental caries. It hasbeen demonstrated that water fluoridation and fluoride supplements decrease theincidence of dental caries. Fluoride helps prevent decay of a tooth by binding to thehydroxyapatite crystals in enamel. The incorporated fluoride makes enamel moreresistant to demineralization and, thus, resistant to decay. Topical fluoride is alsorecommended to protect the surface of the teeth. This may include a fluoridetoothpaste or mouthwash. Many dentists include application of topical fluoride solutionsas part of routine visits.
1.4 CONCLUSIONS
Caries diagnosis in its early stage is often difficult. Accurate diagnosis is requiredin order to apply appropriate preventive measures or operative procedures. Recently,several techniques have been introduced to aid dentists in accomplishing this task.Exploration of the potential of new techniques in the biomedical field is alwayschallenging. Conventional diagnostic methods to detect demineralization or dentalcaries have limitations affecting either their diagnostic ability or feasibility in a clinicalsetting. Therefore, there is a need to develop diagnostic methods that can accuratelyscreen dental caries at an earlier stage.
Currently, radiographic examination is widely used as a diagnostic test adjunctto visual-tactile techniques. In view of the possible hazardous effects of ionizingradiation and the shortcomings in its performance in detecting small lesions, asearch for alternatives to radiography has resulted in a number of advanced methodsfor the detection of caries lesions. The development of new methods could increasethe accuracy of detection and in particular generate the likelihood of early cariesdetection. In this context, if applied effectively, optical spectroscopy has enormouspotential to represent the main forward step towards advances in diagnosticapplications. For the development of such optimized optical systems, there is a need

Background, Intention and Description of the Problem 21
to understand the structure of tooth and its interaction with light. The next chapterthrows light on different aspects of optical spectroscopy and basic concepts ofinteraction of light with dental hard tissue.


Chapter 2
Tooth Anatomy and its Interaction with Light


22.1 INTRODUCTION
The oral cavity is a unique and complex environment, where hard and soft tissuesexist in close proximity, within bacteria laden saliva. Moreover, teeth are complexanatomical units consisting of four types of tissues, each with its own structure andproperties. A basic knowledge of the development and structure of the teeth is essentialto clearly understand the various defects and diseases affecting teeth as well as forthe use of optical techniques for diagnostic applications.
All oral tissues are receptive to photonics based applications. Many of thefundamental principles governing light-tissue interactions are rather simple. Theeffects of light irradiation on dental hard tissues to some extent can be assessed interms of what happens when light interacts with tissue. These involve biologic andphysiologic processes of tissue, which are more complex in nature and reflect amore intricate interrelationship. Therefore, a practical understanding of the biologicprocesses of tissue and the physical properties of light will provide the clinician withthe ability to comprehend and control the outcome of its interaction for a multitude ofclinical applications.
The nature of tissue response to light interaction is both wavelength and time/ratedependent. Optical spectroscopic techniques involve the interaction of light withtissues, offer high intrinsic sensitivity and the use of non-ionizing radiation makes itmore suited for mass screening and repeated use without any adverse effects. Lightradiation in the UV-visible region is the preferred wavelength for this purpose. Importantaspects for tissue diagnostics are based on light scattering and emission properties.By analyzing the features of scattered and re-emitted light in terms of wavelength,indirect information on tissue characteristics can be achieved.
As compared to current clinical diagnosis, optical spectroscopic techniquesare fast, non-invasive, quantitative and provide real-time information about the extentof disease in a highly sensitive manner. Further, these systems can be easily beautomated, facilitating use by even less-skilled personnel. Fluorescencespectroscopy, Raman spectroscopy, diffuse reflectance spectroscopy and opticalcoherence tomography are emerging techniques in the field of dentistry. Amongthem, the potential of laser-induced fluorescence and diffuse reflectance is enormous

26 Spectroscopic Investigation of Tooth Caries and Demineralization
and yet, is not fully explored for early detection of demineralization or dental caries.
This chapter details the basic anatomy of the tooth and its interaction with light,with emphasis on the basic concepts of tissue fluorescence and diffuse reflectance,and this forms the basis of the work presented in this thesis. In addition, differenttypes of endogenous fluorophores and their absorption and emission characteristicsare described in this chapter.
2.2 TOOTH: An Overview
Teeth constitute approximately 20% of the surface area of the mouth, the upperteeth significantly more than thelower teeth. They are both ecto-dermal and mesodermal in originand are derived from the primitiveoral mucous membrane. Humansusually have 20 primary teeth (alsocalled deciduous, baby, or milkteeth) and 32 permanent teeth.Among primary teeth, 10 are foundin the (upper) maxilla and the other10 in the (lower) mandible. Teethare classified as incisors, canines,and molars. In the primary set ofteeth, there are two types ofincisors - centrals and laterals, andtwo types of molars - first andsecond. All primary teeth arereplaced with permanentcounterparts except for molars,which are replaced by permanentpremolars. Among permanentteeth, 16 are found in the maxillawith the other 16 in the mandible(Fig.2.1). The maxillary teeth are the maxillary central incisor, maxillary lateral incisor,maxillary canine, maxillary first premolar, maxillary second premolar, maxillary firstmolar, maxillary second molar and maxillary third molar. The mandibular teeth arethe mandibular central incisor, mandibular lateral incisor, mandibular canine,
Fig.2.1. Human dental formulae.

Tooth Anatomy and its Interaction with Light 27
mandibular first premolar, mandibular second premolar, mandibular first molar,mandibular second molar and mandibular third molar. Third molars are commonlycalled “wisdom teeth” and may never erupt into the mouth or form at all.
2.3 TOOTH DEVELOPMENT
The development of tooth is a complex process by which teeth form from embryoniccells, grow and erupt into the mouth. For human teeth to have a healthy oralenvironment, enamel, dentin, cementum, and the periodontium, must all develop duringappropriate stages of tooth development. Primary (baby) teeth start to form betweenthe sixth and eighth week in-utero, and permament teeth begin to form in the twentiethweek in-utero. If teeth do not start to develop at or near these times, they will notdevelop at all.
Tooth development/ odontogenesis begins by the localised proliferation of epithelialcells of the primitive oral mucosa, which give rise to a thickened ridge of epitheliumextending around the dental arch of each jaw knownas dental lamina. At certain points along the dentallamina, proliferation takes place at an increasedrates and epithelium grows more deeply to formenamel organ, which eventually forms the enamel.At the same time proliferative changes occurs inthe ectomesenchyme and forms the dental papilla,which eventually forms the dentin and dental pulp.The mesodermal tissue surrounding the enamelorgan later forms the dental follicle or dental sac,which finally forms the cementum, periodontalmembrane and bony crypt. The enamel organ,dental papilla and the dental follicle together formthe tooth bud or tooth germ (Fig.2.2).
2.3.1 Development Stages
Tooth develops as a result of interaction between oral epithelium and underlyingmesenchymal tissue. The ectoderm lining stomodeum begins to develop during thethird week in-utero as an invagination of the tissues underlying the forebrain. Subsequentto 37 days of development, a continuous band of epithelium forms around the oralcavity in the maxillary and mandibular processes. This epithelial band gives rise to thevestibular and dental lamina. The vestibular lamina continues to proliferate and then
Fig.2. 2. Histology slide showing atooth bud a) enamel organ, b)dental papilla and c) dental follicle.

28 Spectroscopic Investigation of Tooth Caries and Demineralization
degenerates to form a cleft thatbecomes the vestibule betweenthe cheek and the dental arch.The dental lamina proliferates toform a series of invaginationsinto the underlying mesenchymeat the sites of the future primaryteeth. Tooth developmentoccurs in many stages, whichis similar for both primary andpermanent dentition (Table 2.1).These stages depend on theappearance of developing toothstructures. Subsequent to theinitiation of tooth development,each tooth develops through thebud stage, the cap and the bellstages. Tooth development thenprogresses to the appositionand maturation stages, with theformation and mineralization ofthe hard dental structures (Fig.2.3). During the early stages (Ato C), the tooth germs grow andexpand, and the cells that formsthe dental hard-tissuesdifferentiate. Differentiation takesplace in the bell stage, settingthe stage for formation of enameland dentin (D and E). When thecrowns are formed and mineralized, the roots of the teeth begin to form. After thecalcification of root, supporting structures of the teeth - cementum, periodontalligament and alveolar bone, begins to develop (F and G). This formation occurseven if it is an incisor with a single root, a premolar with several roots or a molarwith multiple roots. Subsequently, the completed tooth crown erupts into the oralcavity (G). Root formation and cementogenesis continue until a functional toothand its supporting tissues are fully developed (G and H).
Fig.2.3. Tooth development stages. A) Bud, B) Cap, C)Bell, D) and E) Dentinogenesis and Amelogenesis, F)Crown formation, G) Root formation and eruption, H)Function (Adapted from Avery and Chiego, In Essentials ofOral Histology and Embryology: A clinical approach. Mosby,Canada, 2006).
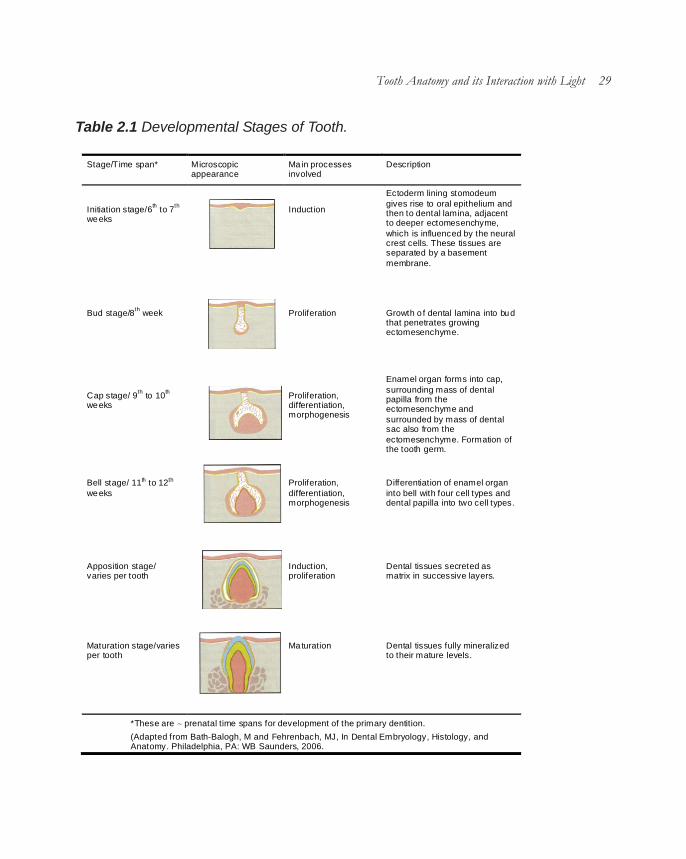
Tooth Anatomy and its Interaction with Light 29
Table 2.1 Developmental Stages of Tooth.
Stage/Time span* Microscopic appearance
Ma in processes involved
Description
Initiation stage/6th to 7th weeks
Induction
Ectoderm lining stomodeum gives rise to oral epithelium and then to dental lamina, adjacent to deeper ectomesenchyme, which is influenced by the neural crest cells. These tissues are separated by a basement membrane.
Bud stage/8th week
Proliferation
Growth o f dental lamina into bud that penetrates growing ectomesenchyme.
Cap stage/ 9th to 10th weeks
Proliferation, differentiation, morphogenesis
Enamel organ forms into cap, surrounding mass of dental papilla from the ectomesenchyme and surrounded by mass of dental sac also from the ectomesenchyme. Formation of the tooth germ.
Bell stage/ 11th to 12th weeks
Proliferation, differentiation, morphogenesis
Differentiation of enamel organ into bell with four cell types and dental papilla into two cell types.
Apposition stage/ varies per tooth
Induction, proliferation
Dental tissues secreted as matrix in successive layers.
Maturation stage/varies per tooth
Ma turation
Dental tissues fully mineralized to their mature levels.
*These are ∼ prenatal time spans for development of the primary dentition.
(Adapted from Bath-Balogh, M and Fehrenbach, MJ, In Dental Embryology, Histology, and Anatomy. Philadelphia, PA: WB Saunders, 2006.

30 Spectroscopic Investigation of Tooth Caries and Demineralization
2.4 TOOTH STRUCTURE
Structurally tooth consists of a hard, inert, acellular enamel formed by epithelialcells supported by the less mineralized, more resilient and vital hard connective tissuedentin, which is formed and supported by the dental pulp, a soft connective tissue.Teeth are attached to the bones of the jaw by supporting tissues consisting ofcementum, periodontal ligament and alveolar bone, which provide an attachmentwith adequate flexibility to withstand the forces of mastication (Fig. 2.4).
2.4.1 Enamel
Enamel covers the anatomiccrown of the tooth and is the hardestand most highly mineralizedsubstance in the human body. It isresponsible for the aesthetic colourand translucency of the tooth. Ninetysix percent of enamel consists ofinorganic material in the form ofhydroxyapatite crystals with water andorganic material forming the rest (Hunt,1959). The large amount of mineralsin enamel accounts not only for itsstrength but also for its brittleness.Enamel is ectodermal in origin and isformed by cells called ameloblasts.The normal colour of enamel varies from light-yellow to greyish white. It varies inthickness over the surface of the tooth and is often thickest at the cusp, up to2.5mm and thinnest at its border.
Enamel is composed of millions of enamel rods or prisms covered by rod sheathsand cementing inter-rod substances. The rods are densely packed and are orientedperpendicular to the dentinoenamel junction (DEJ) and the tooth surface except inthe cervical margin of permanent teeth where they are oriented outward in a slightlyapical direction. In cross section, it is best compared to a keyhole, with the top, orhead, oriented toward the crown of the tooth, and the bottom, or tail, oriented towardthe root of the tooth (Fig. 2.5). Each rod has a sheath and core. The rod sheathsurrounds rod head and tail. The number of rods per tooth varies from approximately
Fig.2.4. Structure of a tooth

Tooth Anatomy and its Interaction with Light 31
five to twelve million. Some of the specialized structural components seen in someareas of enamel are
a) Gnarled enamel: This consists of a group of enamel rods which entanglewith adjoining groups of rods and taking a curving, irregular path toward the toothsurface. It is seen in the cervical, incisal and occlusal areas.
b) Enamel tufts: These arehypomineralized structures of enamelrods and inter-rod substance. Theyarise from the DEJ and extend into theenamel along the long axis of thecrown, which may have a role in thespread of dental caries.
c) Enamel lamellae: These arethin, leafy like faults between normalgroups of enamel rods, start at theenamel surface and extend up to theDEJ. It contains mostly organicmaterial and serves as entry regionsfor bacteria causing dental caries.
d) Enamel spindles: Odontoblastic processes of dentin may cross DEJ andextend into the enamel, called enamel spindles. They are formed during the formativeperiod of enamel when they insinuate themselves between ameloblasts. They maybe pain receptors in the enamel responsible for the enamel sensitivity.
e) Hunter-Schreger bands: Changes in the direction of enamel rods thatminimize cleavage in the axial direction produce an optical appearance called Hunter-Schreger bands. They have alternate light and dark zones, which have slightlydifferent permeability and organic content.
f) Incremental Straie of Retzius: They represent the successive appositionof enamel in the form of discrete increments.
g) Prismless enamel: This is a structure less outer layer of enamel seen inthe cervical areas of teeth. It is heavily mineralized.
h) Dentino-enamel junction (DEJ): This is the interface of enamel and dentin.
Fig.2.5. Cross section of enamel rods. (Adaptedfrom Avery and Chiego, In Essentials of OralHistology and Embryology: A clinical approach.Mosby, Canada, 2006).

32 Spectroscopic Investigation of Tooth Caries and Demineralization
It is 30µm thick and hypermineralized. The DEJ is scalloped or wavy in outline asthe rounded projections of enamel fit into the shallow depressions of the dentin.
i) Nasmyth membrane/primary enamel cuticle: This is a membrane secretedby the ameloblast cell after completion of enamel formation. It covers the newlyerupted tooth.
j) Pellicle: This is a membrane formed by the precipitation of salivary proteins,which covers the enamel surface after the removal of nasmyth membrane. It canbe invaded by bacteria to form plaque which initiates dental caries or periodontaldisease.
k) Occlusal pits and fissures: Macroscopically, the occlusal enamel surfaceof molars and premolars show grooves, pits and fissures. They form at the junctionof the developmental lobes of the enamel.
2.4.2 Dentin
The dentin is a specialized connective tissue of mesodermal origin, formedfrom the dental papilla of the tooth bud. It forms the largest portion of the tooth andgives the basic shape to it. It is covered by the enamel in the crown and by thecementum in the root. Internally, dentin forms the boundary of the pulp. Dentin isconsidered as a living tissue and reacts to physiological and pathological stimuli. Itis normally yellow white in colour and is more opaque. It is softer than enamel butharder than bone or cementum. Dentin is composed of mainly inorganic material(75%) with some amount of organic matter (20%) and water (5%). The mineralphase of dentin is mainly hydroxyapatite while the organic phase is composed ofcollagen.
Structurally, dentin consists of dentinal tubules extending throughout the dentin.Each tubule is lined by peritubular dentin and surrounded by intertubular dentin (Fig.2.6).
a) Dentin tubules: These are small channels extending throughout the widthof the dentin from DEJ or dentino cemental junction (DCJ) to the pulp. It carries theodontoblastic processes, which are the cytoplasmic extensions that line the pulp.They contain the dentinal fluid and are wavy or S- shaped; are perpendicular to theDEJ or DCJ. They are more closely packed near the pulp than near enamel orcementum.

Tooth Anatomy and its Interaction with Light 33
b) Canaliculi: These are small lateral openings along the dentin tubule wall,through which odontoblastic processes convey lateral communications to the lateralbranches of adjacent odontoblastic processes.
c) Peritubular dentin: This is ahyper-mineralized area aroundodontoblast process and forms the wallof the dentin tubule. It is composed ofinorganic apatite crystals with a smallamount of organic substance.
d) Intertubular dentin: This isthe hypo-mineralized dentin which ispresent between the tubules.
e) Pre-dentin: This is an un-mineralized area, which is foundimmediately above the odontoblasticlayer.
f) Primary dentin: This is the dentin that is formed initially till the root formationis completed.
g) Secondary dentin: This is the dentin which forms after root formation iscompleted, which occurs at a slow rate and the tubules are irregular in shape. Thedentin tubules curve more sharply as they move from primary to secondary dentin.
h) Reparative or tertiary dentin: This is the dentin which is formed in responseto external irritants like attrition, abrasion, erosion, trauma, caries or restorativeprocedures. This is localized to the area of irritation, and is formed either by existingodontoblasts or by secondary odontoblasts formed from the undifferentiatedmesenchymal cells of the pulp.
i) Schlerotic dentin: This is formed as a result of change in structure of primarydentin. These are hypercalcified areas, found due to aging or as a result of erosion orcaries as a protective phenomenon. They forms from the DEJ and proceeds towardsthe pulp.
j) Dead tracts: With moderate level of injury to dentin like caries, the odontoblastcells along with their processes die leaving empty dentinal tubules. Under transmitted
Fig.2.6 Image of Dentin tubules (Adapted fromBhaskar, In Orban’s oral histology and embryology.Mosby, 2000).

34 Spectroscopic Investigation of Tooth Caries and Demineralization
light, these tubules appear as dark when viewed through microscope, called deadtracts.
2.4.3 Pulp
The pulp is a mesenchymal connective tissue that occupies pulp cavity in thecentral part of the tooth. It is formed of 75% water and 25% organic matter. It consistsof collagen fibres, ground substance, vital cells, blood vessels and nerves of thetooth. It is surrounded by dentin on all sides except at the apical foramen and accessorypulp canal opening where it is in communication with periodontal tissue.Morphologically the pulp is divided into two parts namely
1. Pulp chamber/Coronal pulp: This occupies the pulp chamber in the crownportion of the tooth. The extension of pulp chamber into the cusps of tooth, calledpulp horns, that project towards the incisal ridges.
2. Root canal/radicular pulp: This is located in the root portion of the tooth in thepulp canal. It is continuous with the periapical tissues via apical foramen.
Structurally the dental pulp contains myelinated and unmyelinated nerves, arteries,veins, lymph channels, connective tissue cells, intercellular substance, odontoblasts,fibroblasts, macrophages, collagen and fine fibres (Fig. 2.7) as described below:
a) Cells: The cells ofpulp are of three types namelyodontoblasts, fibroblasts anddefence cells. The outermostlayer of the pulp is made ofodontoblasts. They are highlydifferentiated connective tissuecells, which have a nucleus.Each cell extends into onemain (Tome’s process) andseveral small cytoplasmicprocesses. They are responsible for the formation, nutrition and sensitivity of dentin.Inner to that, is the cell free zone, which is filled with both nerve and vascular plexuses.Adjacent to cell free zone is the cell rich zone composed of fibroblasts andundifferentiated mesenchymal cells. Fibroblasts are flat and have an oval nucleusand elongated processes.
Fig.2.7. Flow chart showing the composition of pulp

Tooth Anatomy and its Interaction with Light 35
b) Intercellular substance: They consist of ground substance and fibres. Theground substance is gelatinous. The fibres are of two types namely precollagenousor Korffs and collagenous. The pulp core contains the large blood vessels and nervetrunks, which exit via apical foramen.
2.4.4 Supporting structures
The periodontinum is the supporting structure of a tooth, serving to attach thetooth to surrounding tissues and to permit sensations of touch and pressure. It consistsof the cementum, periodontal ligaments, alveolar bone and gingiva. Of these,cementum is the only one that is a part of a tooth. Periodontal ligaments connect thealveolar bone to the cementum. Alveolar bone surrounds the roots of teeth to providesupport and creates what is commonly called an alveolus. Lying over the bone is thegingival or gum, which is readily visible in the mouth.
1. Cementum: This is a hard tissue formed by the specialized cells calledcementoblasts, derived from the undifferentiated mesenchymal cells of the dentalfollicle. It covers the radicular portion of the dentin. It consists of 45% of hydroxyapatite,33% of organic material mainly collagen and protein polysaccharides and 22% water.This is light yellow in colour and is slightly softer than dentin. Cementum most oftenjoins with enamel forming cemento-enamel junction. The principal role of cementumis to serve as a medium by which periodontal ligaments can attach to the tooth forstability. Structurally cementum consists of two layers namely acellular cementum,which is seen on the coronal half of the root and does not have cells in their structureand cellular cementum, predominates on the apical half and has cementoblasts.
2. Periodontial ligament: This is a connective tissue with stratified squamousepithelial lining that attaches the cementum of the tooth to the alveolar bone. It containsblood vessels, nerves and extracellular substance mainly of collagen fibres and groundsubstance. The function of periodontal ligaments is to provide attachment of the toothto the bone, support for the tooth, formation and resorption of bone during toothmovement, sensation and eruption.
3. Alveolar process: This is a thin, compact bone which is a part of the maxilla andmandible. It forms the socket into which the tooth root fits. It is composed mainly ofinorganic material (hydroxyapatite) and some organic matrix (Type I collagen,glycoproteins and proteoglycans. Alveolar bone consists of three parts mainly:
a) Inner and outer cortical plates: These form the outer and inner plates of the

36 Spectroscopic Investigation of Tooth Caries and Demineralization
alveolar process. The cortical plates and the alveolar bone proper, meet at the alveolarcrest.
b) Alveolar bone proper: This is the inner wall of the alveolar process whichlines the socket. It surrounds the tooth root and provides attachment to the principalfibres of periodontal ligament.
c) Cancellous bone: This is the spongy bone consisting of narrow, irregularbony trabeculae that fills the inner area between the cortical plates and the alveolarbone proper.
4. Gingiva: They are the soft tissues which surround the cervical region of teeth. Itis that part of the oral mucosa which covers the alveolar bone, defines the contoursof the crown and seals the tooth root and periodontal structures from the externalenvironment. It is coral pink in colour and normally pigmented. It consists of freegingival, attached gingiva and alveolar mucosa. The part of the gingiva below thecrest but above the attachment is called the free gingival margin. The potential spacebetween the free gingival margin and the tooth is called the gingival sulcus. Justbelow the epithelial attachment lie a large number of connective tissue fibres calledthe gingivo-dental fibres.
2.5 LIGHT
Light is a form of electromagnetic energy that behaves as a particle and a wave.Laser light and ordinary light are significantly diverse. Light produced by lamp is usuallya white diffused glow, comprises a narrow band ofabout 400 nm in the visible wavelength region ofthe electromagnetic spectrum, which can be seenby the human eye. Table 2.2 shows the wavelengthbands of the visible region. Laser light have someadditional characteristics: monochromaticity,collimation and coherency.
a) Monochromaticity: lasers emit light thatis monochromatic or specifically a singlewavelength.
b) Collimation: refers to laser beam beingwell focused and does not spread out like ordinarylight
Table 2.2 Wavelength range ofvisible light in ER spectrum.
Colour Wavelength region (nm)
Viole t 400-455
Blue 455-492
Green 492-577
Yel low 577-597
Or ange 597-622
Red 622-780

Tooth Anatomy and its Interaction with Light 37
c) Coherency: means that the light waves produced are all similar. They areall in phase with one another and have the same wave shapes.
2.5.1 Basic aspects of light-tissue interaction
The extent of the light interaction with tissue is governed by the specific wavelengthof the excitation light used and the optical properties of target tissue. Light encounterswith tissue in different ways. It can be reflected, scattered, transmitted or absorbed.The absorbed energy may be also re-emitted as fluorescence. Dental structureshave complex composition and these processes occur together in some degreerelative to each other. Fig. 2.8illustrates the different phenomenathat occur when light interacts withdental tissues.
a) Reflection: Light photonis reflected from the tissue surfacewithout penetration or interactionwith the tissue.
b) Scattering: Photon isscattered from structuralcomponents of the tissue.
c) Transmission: Photon istransmitted through the tissue.
d) Absorption: Photon is absorbed by the endogenous substance present intissue.
e) Fluorescence: It is an inelastic scattering process, also occurs by theabsorption of molecules in the tissue.
f) Diffuse reflectance: Photons undergoes multiple scattering and absorptionin the tissue.
In most cases, the degree of interaction is proportional to the absorption of light bytissue. The degree of absorption and the extension of this process are dependentupon the tissue structure, content of water, haemoglobin, enamel, dentin,hydroxyapatite etc. Tissue elements that demonstrate a higher coefficient of absorption
Fig.2.8. Different processes of light-tissue interaction a)Reflection b) Scattering c) Transmission d) Absorption e)Fluorescence f) Diffuse Reflectance. Black dots shownare either tissue chromophore, flurophore or a scatterer.

38 Spectroscopic Investigation of Tooth Caries and Demineralization
for particular wavelength or spectra of light energy are called chromophores. Absolutevalues of absorption coefficients for typical tissues lie in the range, 102- 104cm-1
(Tuchin, 2007). Fig. 2.9 illustrates the optical absorption properties of water, hemoglobinand melanin. Between approximately 600 nm and 1300nm, the absorption due towater is very low. At shorter wavelengths, haemoglobin absorption is large, and athigher wavelengths the strong water absorption drastically reduces light penetration.Light in this wavelength region, often referred to as the tissue optical window, is usedfor many diagnostic and therapeutic purposes, offering a possibility to reach targetsdeep into the tissue (Boulnois, 1986).
2.5.2 Optical properties of hard tissues
Optical characteristics of the hard tissues of human teeth are of significant importancein modern dentistry. Optical properties are native properties that characterize biologicaltissues, which do not depend on the geometry of the structure. Low-intensity laser lightcan be used for diagnostic applications. The optical properties of dental tissue componentsresolve the nature and degree of the tissue reaction through the processes of absorption,transmission, reflection and scattering of the light (Dederich, 1991). To make progress inemploying optical techniques especially laser methods in dentistry, basic knowledge ofthe optical characteristics of dental hard tissues is necessary.
2.5.2.1 Spectral properties of enamel and dentin
Enamel is an ordered array of hydroxyapatite crystals surrounded by protein/lipid/
Fig.2.9. Optical absorption properties of water, hemoglobin and melanin.

Tooth Anatomy and its Interaction with Light 39
water matrix (Fried, 2003; Zijp and tenBosch, 1991; Levy and Rizoiu, 1995;Tuchin and Altshuler, 2007).Comparatively well-oriented hexagonalhydroxyapatite crystals of ~30-40 nmin diameter and up to 10 µm in length,are packed into an organic matrix toform enamel rods or prisms with anoverall cross section of 4-6 µm (Tuchinand Altshuler, 2007). Fig. 2.10 showsthe absorption spectra of enamel. Theabsorption peaks were seen at 200,600, 700, 1064, 9320 and 9900 nm(Arcoria and Miserendino, 1995). Thespecificity of the dentin is known by thedental tubules that communicate withthe enamel, pulpal surface andcementum.
Enamel and dentin are consideredto be optical systems with wave-guiding, absorption and scatteringcomponents (Altshuler et al, 1991; Zijpand ten Bosch, 1991). The absorptionand transmission of light in teeth isgenerally dependent on the wavelength of the excitation light (Koort and Frentzen,1992 a). Ultraviolet laser light is well absorbed by water and hydroxyapatite. Howeverin the mid-infrared region, the absorption of water and hydroxyapatite (HA) variesimmensely depending on the wavelength of laser light (Fig. 2.11). Absorption of waterand HA is low at wavelength of 2µm as compared to the high absorption at 3µm and10µm. At 1µm, both show absorption of about 10,000 times less than that at 3µm(Hale and Query, 1973; Nagasawa, 1983; LeGeros, 1991).
Figure 2.12 illustrates the transmittance (T), reflectance (R) and absorptance (A)spectra of sound enamel, dentin and hydroxyapatite recorded in the 250-2500 nmwavelength range. The major absorptance peaks of sound enamel are at 283, 1434and 1944 nm (Levy and Rizoiu, 1995). The dentin has prominent peaks at 283,1471 and 1942 nm and few minor peaks at 1184, 1737, 2164 and 2264 nm. The
Fig.2.10. Absorption spectra of enamel from 150 to11000 nm (Modified from Arcoria C and MiserendinoLJ. in Laser in Dentistry, Eds. L. J. Miserendino andR. M. Pick (Quintessence Publ. Co, Inc, Chicago, etal), 1995; 76.

40 Spectroscopic Investigation of Tooth Caries and Demineralization
peaks at 1434 and 1944 nmcoincide with the absorptionpeaks of water (300, 980, 1180,1450, 1900 and 2940 nm) andhydroxyapatite bands (~250,1434, 2145 and 2410 nm).Between 2700 and 2900 nm,the absorption of water andhydroxyapatite is very strong(Wigdor et al, 1994). Organictooth components (protein) areresponsible for absorption inultraviolet region (Tuchin andAltshuler, 2007). The spectra ofreflectance and transmittancefor enamel, dentin andhydroxyapatite are the reverseof the absorptance spectrum, soeach peak in absorption is nowa valley in reflection ortransmittance spectrum. Thetransmittance spectrum shows
a valley at 950, 3570 and 9410 nm for enamel and at 950 nm for hydroxyapatite. Fordentin, transmission spectra shows valleys at 3000, 5880 and 9090 nm in the farinfrared region (Levy and Rizoiu, 1995).
Dental hard tissues are anisotrophic (Zijp and ten Bosch, 1993; Fried et al,1995; Kienle et al, 2003 Altshuler and Erofeev, 1995). Absorption and scattering oflight are much stronger in dentin than in enamel. Thus the scattering coefficient ismuch larger than the absorbing coefficient (Zijp and ten Bosch, 1993; Levy andRizoiu, 1995). In the visible-near-infrared region, enamel and dentin shows smallvalues of absorption coefficient of 1- 4cm-1 as compared to high values of scatteringcoefficient (15-280cm-1). In spite of this lower values, light absorbed by these tissuesis relatively high, of 10-20% (Table 2.3). This is due to high efficiency of travellingphotons to be absorbed in a scattering medium, caused by the longer photonpathways within the scattering medium (Tuchin and Altshuler, 2007). Light scatteringand reflection at the enamel surface is essential for the studies of scatteringproperties of tooth, which helps to accurately measure the condition of enamel
Fig.2.11. Absorption of laser light in water and hydroxyapatitefrom 200 nm to 10 µm (Adapted from Koort HJ and Frentzen M.in Laser in Dentistry, Eds. L. J. Miserendino and R. M. Pick(Quintessence Publ. Co, Inc, Chicago, et al), 1995; 59.

Tooth Anatomy and its Interaction with Light 41
surface (Altshuler and Erofeev, 1995). With laser irradiation, the angular distributionof the backscattered light is defined by the enamel surface curvature, surface macro-roughness (large surface irregularity compare to the wavelength mostly of geneticnature) and surface micro-roughness (comparable with the wavelengthirregularities). Due to the first two reasons, the specular component of reflected lightmay change its direction and angular distribution within only several degrees independence of incident light beam location. The third component is diffusive in natureand is mainly associated with the processes of tooth demineralization. With increasein demineralization depth, angular distribution of diffuse light is altered, which inturn reduce its maximum intensity. If successful separation is done using specificwavelength or scattering angle, surface diffuse component can be used as a tool fordetecting tooth demineralization and pre-caries (white spots).
Fig.2.12. Spectra of absorptance, transmittance and reflectance for sound enamel,dentin and hydroxyapatite. (Adapted from Levy G and Rizoiu IM. in Laser in Dentistry,Eds. L. J. Miserendino and R. M. Pick (Quintessence Publ. Co, Inc, Chicago, et al),1995; 300-302.

42 Spectroscopic Investigation of Tooth Caries and Demineralization
Scattering of dentin depends mainly depends on two processes a) symmetricalprocesses, caused by randomly oriented mineral crystals (µ
s~10-3 – 10-4 cm-1) and
collagen fibrils (µs~190 cm-1) and b) asymmetrical processes, caused by the oriented
dentinal tubules (µs~1400 cm-1).
2.5.2.2 Waveguide Effects
The waveguide properties of enamel and dentin may have some effects onanisotropy of light propagation within the tooth (Altshuler and Erofeev, 1995; Altshuler,1995, Altshuler and Grisimov, 1990). The role of waveguides in enamel and dentin isplayed by enamel prisms and substances between dentinal tubules, respectively(Fig. 2.13). These waveguides are differentiated from conventional optical fibres bybeing non-uniform and containing scattering particles such as hydroxyapatitemicrocrystals. Nonetheless, they have waveguide properties and radiation scatteredin enamel and dentin can be captured by these natural waveguides and transportedto the pulp chamber.
The waveguide light propagation in tooth produces the following optical effects
Table 2.3 Optical properties of dental hard tissues.
Tissue Wavelength (nm)
Absorption coefficient, µa (cm-1)
Scattering coefficient, µs (cm-1)
Remarks
Dentin Enamel
543 4 180 Adapted from Zijp JR and ten Bosch JJ, 1991, 1997; Fried D et al, 1995
633 4 130 543 <1 45 633 <1 25
Dentin
543 3-4 280 Adapted from Fried D et al, 1995 633 3-4 280
1053 3-4 260
Enamel
543 <1 105 633 <1 60 1053 <1 15
Enamel 200 ∼10 ∼450 Adapted from Fried D, 2003 300 ∼5 ∼270
400 ∼1 ∼150 500 <1 ∼73 600 <1 ∼64 700 <1 ∼50 800 <1 ∼33 1000 <1 ∼16

Tooth Anatomy and its Interaction with Light 43
(Altshuler and Grisimov, 1990; Altshuler and Erofeev, 1995; Altshuler, 1995):
a) Image transmission effect: Each point of the enamel surface is opticallyconnected with a certain point of the pulp chamber surface, hence light propagationon the enamel surface would be transmitted to the pulp chamber surface. Apparently,this image could be fairly distorted, because of scattering and waveguide non-uniformity. For example, 1-mm layer of dentin would limit resolution up to 10lines/mm.
b) Effect of optical transparency anisotropy: Light transmission along andtransverse to waveguides is not equal. For a section of dentin cut longitudinally andtransversely relative to the dental tubules, these differences could be as large asseveral dozen times.Therefore, waveguide effectcould have significantinfluence on orientationanisotropy of transmittance.
c) Light field compressioneffect (optical focon effect):This is caused by thedifference of surface areas ofthe waveguides at theenamel/dentin junction and atthe pulp chamber surface aswell as number ofwaveguides is equal. The lightfield compression can createan increase in light fluxdensity whenever light ispropagating from the enamel/dentin junction to the pulp.The flux density of light isproportional to the ratio of the area of enamel/dentin junction and the part of the pulpchamber surface that is optically connected with enamel/dentin junction.
In this way, optical properties of the dental tissue can be achieved by measuringabsorption and scattering properties.
Fig.2.13. Waveguides in human teeth. (Adapted from AltshulerGB and Erofeev AV. in Laser in Dentistry, Eds. L. J. Miserendinoand R. M. Pick (Quintessence Publ. Co, Inc, Chicago, et al),1995; 287.

44 Spectroscopic Investigation of Tooth Caries and Demineralization
2.6 OPTICAL SPECTROSCOPY
Diagnostic techniques based on optical spectroscopy allow non-invasive and real-time characterisation of tissue. Optical spectroscopy depends on the interaction ofelectromagnetic radiation with dental tissues that occur at the ultraviolet (UV) andvisible (VIS) wavelength regions. As compared to current diagnostic approaches,they are fast, quantitative and also provide information about the invasive nature ofthe disease in highly sensitive manner. In addition, they also elucidate the chemicalcomposition and morphology of the tissue which in turn help in monitoring metabolicparameters of the tissue and also distinguish sound from carious tooth. Further, opticalspectroscopic systems are cost-effective and can be easily automated facilitatinguse by even less skilled personnel. Among all these optical techniques, the presentstudy focuses on fluorescence emission and diffuse reflectance of dental tissues fordetecting tooth caries and demineralization. These spectroscopic techniques havethe potential to act as an adjunct to dentist so that timely remedial measures can beadopted to stop the tooth decay.
2.6.1 Fluorescence Spectroscopy
The phenomenon of fluorescence was first discovered by Stokes in 1982, whenhe illuminated fluorite samples with UV light and found these samples emits at longerwavelength. Until the beginning of the 20th century, the potential of fluorescence formedical applications was not considered. In 1911, Stubel found that all animal tissuesemitted fluorescent light when irradiated with UV radiation.
2.6.1.1 Basic principles
When a biological molecule is irradiated at an excitation wavelength, which lieswithin the absorption spectrum of that molecule, it will absorb this energy and beexcited from its ground state (S
0) to a higher state (S
1). The molecule can then return
back from the excited state to the ground state by generating energy in the form offluorescence, at emission wavelengths, which are longer than that of the excitationwavelength. This is illustrated schematically in Fig. 2.14. Absorbing molecules, knownas chromophores, that release their excess energy by emitting fluorescence light areusually called fluorophores. The fluorescence phenomena exhibit several generalcharacteristics for a particular biologic molecule (Lakowicz, 1983). First, due to lossesin energy between absorption and emission, fluorescence occurs at emissionwavelengths, which are always red-shifted, relative to the illumination wavelength.Second, the emission wavelengths of fluorescence are independent of the excitation

Tooth Anatomy and its Interaction with Light 45
wavelength. Third, thefluorescence spectrum of abiologic molecule is generally amirror image of its absorptionspectrum.
2.6.1.2 Autofluorescence andEndogenous fluorophores
Tissue autofluorescenceoriginates from native tissues.Under UV and blue lightirradiation, all biological tissuesemit fluorescence from various endogenous fluorophores in tissue with a broaddistribution in the visible wavelength region. This fluorescence is referred to asautofluorescence, or endogenous fluorescence. The spectrum is also influenced bythe optical properties of tissue. Strong absorbers such as hemoglobin may decreasethe overall intensity of the fluorescence spectrum, without changing its shape, byabsorbing the excitation light (Chance, 1962; Gillenwater et al., 1998). It can alsoabsorb fluorescence light at certain wavelength which in turn changes the appearanceof the recorded fluorescence spectrum by generating dips in the spectrum and theillusive presence of the false peaks. Naturally, the shape of the spectrum also dependson the excitation wavelength, since this will determine what energy transitions in thefluorophores are possible. Most often, excitation in the UV or blue wavelength regionis used for laser-induced fluorescence (LIF) studies of tissues. The autofluorescencespectra are very complex, and the contributions from the different fluorophores cannotusually be separated, but can be recognized by their emission peaks.
Biological tissues are made up of a very intricate mixture of molecules. Several ofthese molecules are fluorescence emitters, when excited with a suitable wavelength.The mixture of all these emission spectra as well as the diffusion and scattering propertiesof the biological tissues make the overall autofluorescence spectrum broad and quite
featureless (Zeweller, 2000).
Table 2.4 lists the major endogenous fluorophores, along with their excitation andemission maxima (Richards-Kortum and Sevick, 1996). These endogenousfluorophores include the aminoacids, structural proteins like collagen and elastin,coenzymes like NADH and flavins, vitamins, lipids and the porphyrins. Their excitation
Fig.2.14. Energy level diagram showing the phenomena ofabsorption and fluorescence.

46 Spectroscopic Investigation of Tooth Caries and Demineralization
maxima lie between 250 and 450 nm, whereas their emission maxima lie in the range280 and 700 nm. Autofluorescence emission spectra of tissue are basically aconvolution of the emission spectra of the endogenous fluorophores of tissue andtherefore strongly depend on the wavelength of excitation light (Gupta et al, 2007).Only those endogenous fluorophores are excited and emit fluorescence whoseabsorption bands have an overlap with the wavelength of excitation light. Since, theexcitation and emission light have to propagate through the turbid tissue, the recordedautofluorescence is also influenced by the absorption and scattering at both theexcitation and the emission wavelengths (Muller et al, 2001). Fig. 2.15 shows the a)absorption and b) emission spectra of different endogenous fluorophores.
Fluorophores that are speculated to play a major role in caries processes are thestructural proteins like collagen, porphyrins and bacteria. Collagen and elastin are fibrousproteins abundant in connective tissues, teeth and bones. Collagen forms the organicpart of the dentin and any structural or pathologic association with caries processes,could be reflected in lower autofluorescence intensity (Sarkissian and Le, 2005).
Table 2.4 Excitation and emission maxima of variousendogenous fluorophores.Endogenous Fluorophores Excitation maxima(nm) Emission maxima (nm)
Sound tooth s tructure 337, 375 430-450, 480-500, 460, 560 Bacteria (mature plaque, dental caries)
320-380, 407, 360-580, 655 590-650, 635, 600-700, 720-800
Porphyrins 405, 407, 400-450, 630
590, 610, 620, 635, 675, 690 , 705
Supra and subgingival calculus
420 595, 635, 650, 695
Aminoacids Tryptophan Tyrosine Phenylalanine
280, 295 275 260
350, 340-350, 345 300, 340 280
Structural proteins Collagen Collagen cross-links Elastin Elastin cross-links
270, 325, 330, 335 370 290, 325, 350, 360 390-420, 400, 420-460
380, 390-405, 395, 400, 405 460-490 340, 400, 420, 460 500, 500-540
Coenzymes FAD, Flavins NADH NADPH
430, 450 290, 340, 350, 365 336
515, 535, 550 440, 450, 455, 460 464
Lipids Phospholipids Lipofuscin Ceroid
436 340-395 340-395
540, 560 430-460, 540 430-460, 540
Vitamins Vitamin A Vitamin K Vitamin D
327 335 390
510 480 480

Tooth Anatomy and its Interaction with Light 47
Porphyrin derivates i.e., porphyrins and metalloporphrins, are responsible forfluorescence emission from carious tooth in the red wavelength region (Konig et al,1993; Konig and Schneckenburger; 1994, Konig et al, 1998; Lenon et al, 2002;Buchalla et al, 2005). They typically have absorption maxima between 398 and 421nm and emission maxima between 530 and 633 nm (Konig and Schneckenburger;1994). The excitation spectra also support the assumption of the presence of porphyrinderivates due to a maximum around 400 nm that may represent the near-UV Soretband typical for porphyrins. PpIX concentration is found to be higher in gram negative
Fig.2.15. a) Absorption spectra and b) emission spectra of different fluorophores in biologicaltissue. Adapted from Wagnieres etal, 1998).

48 Spectroscopic Investigation of Tooth Caries and Demineralization
oral bacteria and its level increases as the dentalbio film becomes more mature, which isresponsible for the red fluorescence in teeth(Walsh and Shakibaie, 2007). Brick redfluorescence seen under long-wave UV light (366nm) is due to protoporphyrin production by thepigmented Bacteroides species (Brazier, 1986;Konig et al, 1993; Bissonnette et al, 1998), andto coproporphyrin production by Coryne-bacterium species and Candida albicans (Koniget al, 1993). When excited with 407 nm UV light,bacterial species such as Actinomycesodontolytics (found in dentin carious lesions),Bacteroides intermedius, Prevotella intermedia,Corynebacterium species and Candida albicansemit fluorescence at 620-635 nm and 700 nm, whereas Gram positive Streptococcusmutans, Enterococcus faecalis and various lactobacilli have weaker porphyrinfluorescence in red wavelength region. Thus the maturity of dental plaque, ratherthan the presence of cariogenic streptococci, is the basis for the red fluorescencewhen excited with UV-near UV light. Insummary, when dental plaque or calculus ispresent, there is an increase in absorption inthe UV spectral region at 350-420 nm, with theappearance of a fluorescence signal in thevisible red spectral region at 590-650 nm(Borisova et al, 2006; Kuhnisch et al, 2003).
2.6.1.3 Detection Principle
When a photon from laser source falls ontooth surface, it gets penetrated and absorbedby several endogenous fluorophores in tissueand these absorbed fluorophores re-emit thelight in the form of characteristic LIF spectra(Fig. 2.16). During caries processes, variationsare seen in the biochemical composition and/or the structure of the tissue, which in turn isreflected in fluorescence spectral shape and
Fig.2.17. Detection principle of DRS
Fig.2.16. Detection principle of LIF

Tooth Anatomy and its Interaction with Light 49
intensity. Generally, alterations in the concentration of these fluorophores take placeprior to major structural tissue changes, and this makes LIF very sensitive to earlycaries detection.
Fluorescence from tissue can be studied in different ways. Excitation spectra areobtained by varying the excitation wavelength while detecting at a fixed wavelength. Ifthe excitation wavelength is constant and the fluorescence is detected at severalwavelengths, emission spectra are obtained. In this study, various aspects of thefluorescence spectra such as fluorescence intensity and spectral shape are studied.Changes in fluorescence spectral shape can be understood by different methods;one such possibility is to study variations at different emission wavelengths by changingthe excitation wavelength. This method yields fluorescence spectra as a superpositionof the fluorescence of all fluorophores present within the tissue volume probed. Allthese approaches can give information about the endogenous fluorophores, chemicalcomposition and morphology of tissue.
2.6.2 Diffuse Reflectance Spectroscopy (DRS)
In DRS, light remitted from tissue undergoes a combination of elastic scatteringand absorption when illuminated in the ultraviolet–visible (UV–VIS) wavelength range,providing information about tissue absorbers and scatterers, which are believed tochange during caries formation (Fig. 2.17). In DRS both the diffuse and specularcomponents of reflectance are detected and the spectrum depends on the absorptionand scattering properties of the tissue. The absorption coefficient is directly related tothe concentration of physiologically relevant absorbers in the tissue, which includeoxygenated and deoxygenated haemoglobin. The scattering coefficient reflects thesize and density of scattering centers in tissue. Extraction of the physically meaningfulinformation from DR measurements improves our understanding of the physiologicaland structural features that differentiates sound and caries tooth, as well as improvethe diagnostic potential of optical spectroscopic techniques for diagnosis of dentalcaries. DR technique is cost-effective as compared to laser based techniques, andhas the potential to provide real-time, non-destructive, and quantitative means ofcharacterizing tooth caries.
The theory of diffuse reflection has been studied in detail by many authors(Wendlandt and Hencht, 1966; Kortum, 1969). When an inhomogeneous material isilluminated, a portion of the impinging radiation penetrates the sample while the restis reflected from the surface. The portion that penetrates the sample undergoesscattering at a large number of points in its path. Fraction of radiation that comes
50 Spectroscopic Investigation of Tooth Caries and Demineralization
back, out of the sample, is called diffusely reflected component. The returning reflectionof directional incoming radiation flux is scattered in many directions due to uneven,broken, bumpy boundary surfaces, where the coarseness is of the same order ofmagnitude as the wavelength of incident radiation. In contrast, direct or specularreflection occurs when the roughness of the boundary is small in comparison withthe wavelength of the reflected radiation.
2.6.3 LIF and DR Spectroscopy in Caries Research: Current Status
Caries diagnosis is a complex process that involves gathering information fromthe patient’s history, and through clinical and radiographic examination. Thisinformation is then evaluated to decide whether caries is present and what action,if any, should be taken. In recent years, clinicians and researchers have becomeanxious about the diagnosis of caries (Kidd and Joyston –Bechal, 1987; Sawle andAndlaw 1988; Weerheijm et al, 1989; Creanor et al, 1990; Verdonschot et al, 1992;Wenzel and Fejerskov, 1992; Weerheijm et al, 1992 a, b; Kidd et al, 1993, Borisovaet al, 2004; Rodrigues et al, 2008). Current clinical techniques for caries diagnosissuch as visual inspection and radiographs, or bitewing x-rays, although effective inrevealing advanced stages of caries (Kidd, 1994; Verdonschot et al, 1999) areunsuccessful in detecting early caries, especially in the complex anatomy of fissureareas (King and Shaw, 1979). Nevertheless, visual inspection with extensive dryingof the suspected area allows early and more accurate diagnosis of initial toothdemineralization (Ekstrand, 2004). Tactile examination with dental probe andradiographic evaluation are often ineffective in detecting enamel defects, as they maybe too small or inaccessible to the diagnostic tool. Thus there is a need to developtechniques that can act as an adjunct to the dentist so that timely remedial measurescan be adopted to stop tooth decay.
In recent years, there has been a high level of research activity in opticalspectroscopy directed towards the development of novel, non-invasive technologiesfor early detection of dental caries. The physical properties of caries lesion are thebasis for the detection and quantification of caries by optical methods, among whichare LIF and DR spectroscopy. In dentistry, LIF usually refers to measurement oftooth fluorescence, from fluorescent components (known as fluorophores) afterirradiating the tooth with specific laser light that is absorbed by the fluorophores. Ithas been shown that the fluorescence of carious dental tissues is different fromthat of sound tissues. This disparity could be used to discriminate between soundand carious tooth structure. Studies have shown that caries lesion progresses

Tooth Anatomy and its Interaction with Light 51
slowly, but has the ability to remineralize (Arends and ten Cate, 1981; Zero, 1999).The nature of caries in enamel layer depends on the physical properties of thelesion (Borisova et al, 2006). Topical application of fluoride compounds to the toothsurface is known to enhance remineralization (Jones et al, 2006). It is also verycrucial that caries lesions are thoroughly scrutinized during the period ofremineralization treatment, because of the possibility of caries to progress rapidlyinstead of remineralization. Many research groups have used various opticaltechniques in caries research (Ando et al, 2001; De Josselin de Jong, et al; 1995;Hall et al, 1997). Different excitation wavelengths or light sources were used tocharacterize dental caries and also to maximise emission from the endogenousfluorophores.
In 1911, Stubel first introduced optical spectroscopy into the field of dental researchwhen he reported the presence of tooth fluorescence under ultraviolet photo-excitation.Later, Eisenberg (1933) reported the presence of tooth fluorescence under blue orviolet light excitation. Alfano and Yao (1981) first published the result of a systematicspectroscopic investigation comparing human teeth with and without dental caries.They illuminated the tooth with excitation light at 350, 410 and 530 nm, which emittedfluorescence at wavelengths of 427, 480 and 580 nm, which corresponds to thepeaks for hydroxyapatite. In addition, they noted that, within carious regions, for eachof these emissions there was a shift towards the red portion of the spectrum. Theyalso pointed out that the relative intensity of light in the red region was greater forcarious when compared to sound regions. Using an argon laser excitation at 488 nm,Albin et al (1988) observed a fluorescence peak around 553 nm in sound teeth, whichwas red-shifted by ~ 40 nm in caries regions. However, Van der Veen and ten Bosch(1995) observed in demineralised root dentin a shoulder like emission with maximumaround 520 nm, which was more pronounced in the demineralised dentin, usingexcitation wavelengths of 460 and 488 nm.
Nitrogen laser-induced autofluorescence spectra that consist of two peaks at 440and 490 nm were found to be useful for early differentiation between caries and toothdemineralization (Borisova et al, 2004). An in-vitro study by Ribeiro et al (2005) evaluatedthe ability of a laser operating at 405 nm to detect natural caries lesions with differentstages of caries activity. They observed that the fluorescence spectra from non-cavitated caries lesions were significantly different from sound tooth structure andthat the two spectral bands around 480-500 nm and 620-640 nm are of significancein caries detection. On the other hand, Zezell et al (2007) found four emissionsbands at 455, 500, 582 and 622 nm in both sound and caries regions and observed

52 Spectroscopic Investigation of Tooth Caries and Demineralization
that the area under the fluorescence bands at 455 and 500 nm differ significantly forcaries lesions and sound tissue.
Many others also have investigated the fluorescence of human dentin and enamel(Bjelkhagen et al, 1982; Hafstrom- Bjorkman et al, 1991; Masychev et al, 2000;Matsumoto et al, 1999; Sundstrom et al, 1985). Hibst and Paulus (1998) proposedthat the enhanced fluorescence in the presence of caries results from the presenceof bacterial metabolites rather than from demineralization. They found an increasedfluorescence emission at 640 and 655 nm from carious enamel or dentin as comparedto the intact tissues (Hibst and Paulus, 1999). Konig et al (1999) showed that cariouslesions exhibited slower fluorescence decay than intact dental hard tissue. The long-lived fluorophore present in carious lesions only emitted in the red spectral region.Fluorescence decay time and spectral characteristics were typical of metal-freeporphyrin monomers (Konig et al, 1998), believed to be produced by the bacteriaassociated with caries.
In the quantitative light induced fluorescence (QLF) method where tooth isilluminated with a blue-green light that produces fluorescence in the yellow region,the demineralized areas appear as dark spots and their intensity is lower than that ofsound enamel. Ando et al (2001) reported that the decrease in fluorescence signalintensity during demineralization is due to destruction of the prism structure in enamellayer and disappearance of its waveguide properties. Pretty et al (2003), in an in-vitrostudy on premolar tooth, evaluated the ability of fluorescence to detect demineralizationand remineralization adjacent to bonded orthodontic cleats and found that QLF detectsearly smooth surface caries lesions and can also monitor demineralization adjacentto restorative materials in primary teeth (2002, 2003). Using argon laser (488 nm)excitation, Al Khateeb et al (1997b) observed that it was possible to detect smallchanges in fluorescence of demineralized enamel during in situ remineralization.This method gave good correlation (0.73-0.86) between mineral loss and fluorescence(fluorescence decreases with increasing mineral loss) for artificial and natural carieslesions (Al khateeb et al, 1997b; Emami et al, 1996).
Commercially available DIAGNOdent device (KaVo, Bilerach, Germany) thatincorporates a 655 nm diode laser and displays fluorescence of dental tissues as anumerical value ranging from 0 to 99 (higher values for deeper caries), has the abilityto detect near-infrared fluorescence from porphyrins produced by oral bacteria(Eibofner et al, 2000; Hibst et al, 2001; Alexander et al, 2003). This device has beenextensively used in various studies to detect changes in mineral content, to assess

Tooth Anatomy and its Interaction with Light 53
remineralization changes and in the detection of caries lesions (Hibst and Gall, 1998;Shi et al, 2000, 2001a; Sheehy et al, 2001; Pinelli et al, 2002; Lussi et al, 2001; Lizarelliet al, 2004; Rocha et al, 2003). DIAGNOdent performed effectively as compared tovisual-tactile examination and radiography (Attrill and Ashley, 2001). Occlusal surfacestudies in adults have shown that the device offers considerable advantages overconventional methods for some lesions (Shi et al, 2000; Lussi et al 2001; Sanchez-Figueras, 2003). However, the device was not able to detect in vitro remineralizationof natural incipient caries of primary teeth (Fausto et al, 2003). Moreover, theDIAGNOdent reported poor sensitivity (approx. 0.4) for detecting enamel lesions (Shiet al, 2000).
Alkurt et al (2008) found that laser fluorescence showed better performance indetecting occlusal caries in vivo, than visual examination and bitewing radiography.With an excitation wavelength of 655 nm, the total intensity of the resulting fluorescencelight correlates with the existence of carious lesions (Lussi et al., 2004). Shi et al(2001) has reported a sensitivity of 94% and a specificity of 100% for detecting smoothsurface caries with the QLF method, but achieved a lower sensitivity (78-82%) fordetecting occlusal caries using DIAGNOdent device (Shi et al, 2006). In this study,the in vitro diagnostic accuracy of DIAGNOdent measurements in terms of area underthe ROC curve was significantly higher (0.96) than that of conventional radiography(0.66) . In another study, Lussi et al (2001) reported a sensitivity of 92% for detectingocclusal caries using DIAGNOdent device as compared to visual inspection and bite-wing radiography. Whereas, in an earlier study, Ferreira-Zandona et al (1998) observeda sensitivity of 49% and specificity of 67% with ROC value of 0.78 for detectingdemineralization in occlusal pits and fissures.
Another quantitative optical technique, DRS is one of the simplest and most cost-effective methods for understanding biological tissue characteristics (Nichols et al.,1997; Zonios et al., 1999; Utzinger et al, 2001). The application of DRS has beenquite useful for characterization of small tissue samples and different cell layers withhigh sensitivity and specificity, but its application in a clinical environment is still verydifficult (Bakker et al., 2000). The potential for using diffuse reflectance spectroscopictechniques is greater because elastic interactions are much stronger than inelasticinteractions. Several researchers have used diffuse reflectance spectroscopy to studybiological tissues and in caries research (Farell et al., 1992; Weersink et al, 1997;Uzunov et al, 2003)
Diffuse reflectance spectroscopy in the UV–VIS wavelength range measures

54 Spectroscopic Investigation of Tooth Caries and Demineralization
tissue absorption and scattering, which reflect the intrinsic physiological andstructural properties of dental tissue. On illuminating carious tooth with light in 450-900 nm region, a significant reduction in reflectance spectral intensity was observedby Uzunov et al (2003) due to the import of exogenous molecules. They also foundthat reflectance spectral intensity ratios R500/R900 and R750/R900 decreasessignificantly by 158% and 32.4% respectively, between sound and deep cavitationtooth. Borisova et al (2007) observed significant decrease in the reflected light intensitybetween caries and non-carious lesions in the blue region. They developed an algorithmfor differentiation between carious stages with diagnostic accuracy up to 86.1%between precarious stage and sound tooth, and 100% for determination of deepcavitation
2.7 CONCLUSION
LIF and DR spectroscopy are impending tools in dentistry for the early detectionof tooth caries and demineralization, which can be used separately or in conjunction.On the basis of the progress made in optical spectroscopy, a compact, non-invasive,near real-time optical point-monitoring system was developed for early detection ofdental caries in vivo. The next chapter describes the details of the system developed,along with various ethical concerns, study protocol, and different methods of dataanalysis, processing and interpretation.

Experimental Methods
Chapter 3


33.1 INTRODUCTION
Dental practitioners have been usually plagued with diverse problems pertainingto the diagnosis and treatment of oral diseases. In the past decade, key technologiessuch as (a) compact lasers, (b) CCD detectors and (c) easy-to-use computingplatforms combined with fiber-optic coupled instrumentation has lead to thedevelopment of many photonics based diagnostic and therapeutic methods in dentistry.Rapid detection and non-invasive tissue categorization are the most importantadvantages of photonics based methods.
Optical spectroscopy in dentistry is crucial for early detection of dental caries, tocarry out more effective minimally-invasive targeted-therapies and to restore diseasedtissues functionally and aesthetically. Optical methods can be based on the propertiesof light scattering, absorption and fluorescence. In doing so, lasers and classical lightsources can be used. All of these methods have one basic principle in common; theoptical spectrum of a tissue contains information about the biochemical compositionand/or the structure of the tissue,which provide diagnostic information for tissuecharacterization. Among them, the most promising techniques to detect and classifydifferent stages of caries are those based on the quantitative measurements of toothautofluorescence and diffuse reflectance. These techniques are non-destructive andallow detection of structural and elemental changes on the surface and inside oftooth.
Many research groups have used optical spectroscopic techniques to describethe spectral properties of tooth structure at different excitation wavelengths (DeJosselin de Jong et al, 1995; Hall, 1997; Uzunov et al, 2003; Borisova et al, 2004;Ribeiro et al, 2005). When tooth is irradiated with UV or blue light, severalfluorophores in tissue produce a broad fluorescence distribution in the visiblewavelength region. This fluorescence is referred to as the autofluorescence, orendogenous fluorescence. Optical proprieties of caries lesion differ from soundtooth. The fluorescence image of carious area appears darker than the surroundingnormal surface, as a result of reduced fluorescence signal from lesion (Ando et al,2001; Ko et al, 2000; Al Khateeb et al, 1998). Possible explanation for the changesin fluorescence lies with the variation in light scattering, destruction of the prism
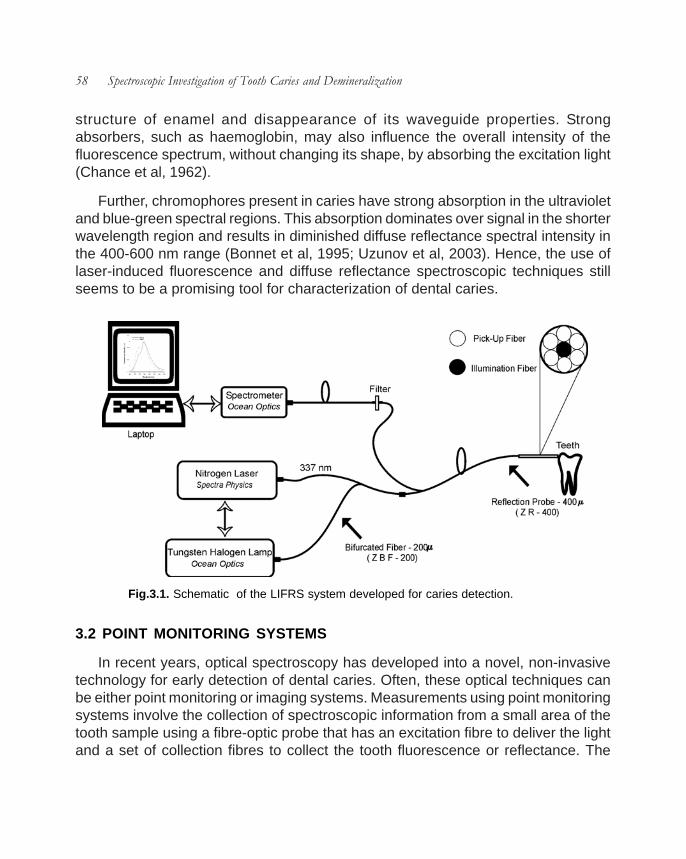
58 Spectroscopic Investigation of Tooth Caries and Demineralization
structure of enamel and disappearance of its waveguide properties. Strongabsorbers, such as haemoglobin, may also influence the overall intensity of thefluorescence spectrum, without changing its shape, by absorbing the excitation light(Chance et al, 1962).
Further, chromophores present in caries have strong absorption in the ultravioletand blue-green spectral regions. This absorption dominates over signal in the shorterwavelength region and results in diminished diffuse reflectance spectral intensity inthe 400-600 nm range (Bonnet et al, 1995; Uzunov et al, 2003). Hence, the use oflaser-induced fluorescence and diffuse reflectance spectroscopic techniques stillseems to be a promising tool for characterization of dental caries.
3.2 POINT MONITORING SYSTEMS
In recent years, optical spectroscopy has developed into a novel, non-invasivetechnology for early detection of dental caries. Often, these optical techniques canbe either point monitoring or imaging systems. Measurements using point monitoringsystems involve the collection of spectroscopic information from a small area of thetooth sample using a fibre-optic probe that has an excitation fibre to deliver the lightand a set of collection fibres to collect the tooth fluorescence or reflectance. The
Fig.3.1. Schematic of the LIFRS system developed for caries detection.

Experimental Methods 59
fluorescence light collected is usually very weak compared to the excitation light,hence the detector system must be sensitive and the ambient background light mustusually be efficiently suppressed. This can be achieved by using proper detectionand filtering systems.
In order to facilitate the sequential measurements of fluorescence and diffusereflectance from tooth in a clinical setting, we have used a compact, non-invasiveLIFRS system that detects the weak fluorescence and diffuse reflectance spectralsignatures. Details on data acquisition using LIFRS and the various techniquesadopted for data analysis are also given in this chapter.
3.3 DEVELOPMENT OF LIFRS SYSTEM FOR CARIES DETECTION
The LIFRS system for point monitoring of tooth fluorescence and diffuse reflectanceis shown in Fig.3.1. The system consists of two light sources that could be switchedfor alternate recording of fluorescenceand diffuse reflectance from the samesample maintained under identicalconditions. The diffuse reflectance(DR) spectrum of the sample wasobtained using a tungsten halogenlamp (Ocean Optics, USA, Model: LS-1-LL) with a Teflon diffuser at the outputport and fluorescence measurementswere performed using the 337.1 nmemission from a nitrogen laser (LaserScience, USA, Model: VSL-337, 30kWpeak power, 120 µJ pulse energy).Typical emission spectra of a tungstenhalogen lamp are shown in Fig. 3.2.The nitrogen laser was operated at arepetition rate of 7Hz and the laseroutput was focussed on to the centralfiber of a 3-meter long bifurcated opticalfiber (Ocean Optics, BIF 200 UV-VIS) with the help of a fiber-optic focusing assembly(Laser Science, USA, Model; Hyrax 337702,). This probe has six pick up fibres (400µm dia., each) surrounding the central fiber to collect reflectance or fluorescenceemanating from the tooth. The probe tip is terminated in a stainless steel ferrule, 15
Fig. 3.2 Spectra of tungsten halogen lamp recordedin the 400-600 nm wavelength region, scattered by aground-glass plate.

60 Spectroscopic Investigation of Tooth Caries and Demineralization
cm long and 6 mm diameter(Fig.3.3). The light emanatingfrom the sample is deliveredto a miniature fiber opticspectrometer (OceanOptics, USA, Model: USB2000FL VIS-NIR), which isconnected to the USB port ofa laptop computer forspectral data acquisition andstorage. The miniature fiber-optic spectro-meter has a600 lines/mm, 500 nm blazed grating for operation in the 360-1000 nm wavelengthrange. Fig.3.4 illustrates the optical geometry of collection and illumination fibres,used in this study.
During fluorescence studies, a long-wavelength pass filter (Schott, USA, Model:GG385) was mounted inside the inline filter holder (Ocean Optics, USA, Model: FHS-UV) for blocking the scattered laser light from entering the spectrometer. The LIF and
Fig. 3.3 Compact nitrogen laser based LIFRS system developedfor caries detection.
Fig. 3.4 A schematic diagram showing the optical geometry of the fibre-opticprobe used in optical contact with the tooth.

Experimental Methods 61
DR spectrum were recorded in the 350–700 nm spectral range at a resolution of 8nm with the 2048-element linear silicon CCD array of the spectrometer using theOOI Base32 software provided by Ocean Optics Inc., USA. The stainless steelferrule at the probe tip enables sterilization before and after use in boiling water. Aflexible 10 mm long, black PVC sleeve inserted at the probe tip avoids ambient lightfrom entering the detection system and also provides extra hygiene as it isdisposable after each measurement (Fig.3.3). The separation between the probetip and the sample was optimized (by observing the output signal) to a distance of3.5mm; in which the excitation beam completely overlaps with the collection region.During spectral measurements the output power at the illumination fiber tip ismaintained at 1±0.1 mW by monitoring the optical power before and after study ona laser power meter (Nova, Ophir, Israel) that has a suitable photodiode head(Ophir, PD300). The power density at the probe tip is measured in mW/cm2, whichgives the concentration of photons in a unit area. Total light dose on tooth samplesduring measurement is measured in J/cm2, which is the product of the fluence rate(W/cm2) and the illumination time (sec). In the present study, light dosage on toothsamples were maintained within 0.002 J/cm2, which is lower than the levels thatcause any damage to the oral tissues or tooth.
3.3.1 Compact LIFRS system for Clinical Trials
The main drawback of the system when used with 337.1 nm nitrogen laser wasthe low output power available for the excitation of the fluorescence from tooth whichin turn affected the signal to noise ratio of the detection system. Therefore the nitrogenlaser was replaced with a 404 nm diode laser (Stocker Yale, Canada, Model: TEC-XXX-404S-50-SF, 50 mW, CW). The modified version of LIFRS system shown inFig.3.1 is used for clinical trials. Further,in order to provide easy accessibility ofthe buccal and lingual sides of molarteeth, the fibre-optic probe shown inFig.3.2 was replaced with a stainlesssteel hand piece (12.5 cm long) with anangled tip (5cm long and 0.4 cmdiameter) shown in Fig. 3.5.This handpiece uses a single fiber for delivering theexcitation beam to the tooth and collectingthe light emission. Further, the long-wavelength pass filter, Schott: GG385
Fig.3.5. Stainless hand piece used for clinicalstudies.

62 Spectroscopic Investigation of Tooth Caries and Demineralization
was replaced with Schott: UG420, as this system uses a 404 nm diode laser. Thewhole LIFRS system consisting of a diode laser, tungsten halogen lamp, the inlinefilter holder and the miniature spectrometer, which was enclosed in a rectangular boxof dimensions 12 x 8 x 3 inches made of acrylic sheet. The fiber optic cables andpower supply chords were taken out through slots made in the box. These cablescould be easily removed and refitted, without the need for realignment, to get therequired power levels at the fiber tip. Fig. 3.6 shows the top view of the compact andportable LIFRS system.
3.4 DATA ACQUISTION AND ANALYSIS
3.4.1 Data acquisition using OOI Base32 software
The hand piece is sterilized before use and optical fiber light coupler fixed on thelaser head is aligned to provide a Gaussian beam profile at the fiber tip. Prior tomeasurements, the output power of the laser at the fiber-tip was measured. Thehand piece was placed in contact with the tooth to prevent stray light from entering
Fig. 3.6 Top view of the portable LIFRS developed for clinical studies of dental caries, with diodelaser at the bottom, spectrometer to the left, in–line filter holder at top and tungsten halogen lampaligned at centre of an acrylic box of dimensions 12 x 8 x 3 inches.

Experimental Methods 63
the spectrometer. The LIF and diffuse reflectance spectra were then recordedalternatively from the tooth samples by point monitoring. Fig.3.7 is a screen shot ofthe OOIBase32 program showing the in vivo LIF spectra from the caries tooth of apatient.
3.4.2 Curve-Fitting of LIF Spectra
In order to determine the peak position of the constituent bands and their relativecontribution in the overall spectrum, the LIF spectra were analyzed by a curve-fittingprogram (Microcal Origin, Ver. 6.0). Gaussian spectral functions were used in curve-fitting as these were found to be most suited in the analysis of LIF spectra [Subhashet al, 1995; Subhash and Mohanan, 1997]. The curve-fitting program uses theMarquardt-Levenberg algorithm and finds the true absolute minimum value of thesum of squared deviations (the value of χ2) by an iterative process. Best fit of thespectral data, as evidenced from the r2 (closest to unity) and low χ2 values wereobtained using the minimum number of constituent peaks in the iteration. Curve-fitted parameters such as peak center, peak amplitude, Gaussian curve area and fullwidth at half maximum (FWHM) and their ratios can be used for understanding cariesprogression and the extent of tooth demineralization.
3.4.3 Statistical Analysis
3.4.3.1 Sensitivity and Specificity
Sensitivity and specificity are two operating characteristics indicative of thediagnostic accuracy of a detection technique (Pretty and Maupome, 2004). A typicaldiagnostic method will have only two conclusions: either an individual with diseaseor without. In this thesis, they represent the potential of different spectral criteria indiscriminating sound tooth from caries tooth or in classifying different stages of caries.When results of a diagnostic procedure are compared with gold standard, there couldbe four outcomes.
True Positive (TP), whereby the results of diagnostic method indicate that theindividual has the disease, and this assessment is confirmed by the gold standard.True Negative (TN), whereby the procedure results indicate that the person does nothave disease, which is in confirmation with the gold standard. False Positive (FP),whereby the procedure results indicate that the person has the disease, but goldstandard indicates that the disease is absent. False Negative (FN), whereby theprocedure results specify that the person does not have the disease, but the gold

64 Spectroscopic Investigation of Tooth Caries and Demineralization
standard indicates that the disease is present. The sum of true positive and falsenegative decisions (TP+FN) equals the number of individuals with the disease. Thesum of false positive and true negative decisions equals the number of individualswithout disease.
Sensitivity is the measure of how accurately a diagnostic procedure is able tocorrectly identify individuals with the disease and is expressed as TP/ (TP+FN).Therefore, a procedure with 100% sensitivity will identify every diseased individual.But, specificity is the measure of how accurately a diagnostic method is able to identifycorrectly individuals without disease and is expressed as TN/ (FP+TN). An idealdiagnostic technique should be highly sensitive and specific, but for many diagnosticprocedures these two characteristics are inversely related: an increase in one isoften associated with a reduction in the other.
3.4.3.2 Positive and Negative Predictive Values
By quantifying the sensitivity of a diagnostic procedure, it is possible to determine
Fig. 3.7 Display of the OOIBase32 program showing the LIF measurement from the caries tooth ofa tooth.

Experimental Methods 65
an operating characteristic of that procedure that establishes if a patient has thedisease in question. Quantifying the specificity allows assessment of another operatingcharacteristic of the procedure to determine if the patient does not have the disease.Sensitivity and specificity are relatively independent of the prevalence of a disease(the pre-test probability that an individual patient has the disease), and therefore theseparameters are generally stable for the same procedure administered in differentstudy populations. In other words, sensitivity and specificity are inherent properties ofthe test. They are useful for comparing procedures and for deciding which test to usein a particular clinical setting.
Sensitivity and specificity do not aid in interpreting the result of a particularprocedure for an individual patient; they do not help in ruling in or ruling out thedisease once the results of the tests are known, and so they have no predictivevalue. To answer these more practical questions, the predictive values of thediagnostic procedure must be determined. The predictive values are easily derivedfrom the contingency table described in Table 3.1. The positive predictive value(PPV) is the proportion of those whose actual caries increment was high amongthose who were believed to have a high risk. The negative predictive value (NPV) isthe proportion of subjects whose actual caries increment was low among those forwhom a low risk was predicted. Whereas, the values for sensitivity and specificity
Gold standard result
Procedure result
Positive Negative Total
Positive True positive (TP) False positive (FP) TP+FP
Negative False negative
(FN)
True negative (TN) FN+TN
Total TP+TN FP+TN FN+TN+FP+TP
Sensitivity: TP/(TP+FN); Specificity: TN/(FP+TN); Positive predictive value (PPV): TP/(TP+FP); Negative
predictive value (NPV): TN/(FN+TN)
Table 3.1 A 2 x 2 contingency table illustrating the outcomes of a comparisonbetween a diagnostic procedure and gold standard and the use of these values tocalculate negative and positive predictive values

66 Spectroscopic Investigation of Tooth Caries and Demineralization
depend only on the operating characteristics of the procedure itself, the PPV andNPV vary according to the prevalence of the disease. Thus, predictive values cannotbe quoted without prior knowledge of disease prevalence in the population from whichthe estimates are being derived. PPV and NPV are not qualities of the procedureitself; rather, they are functions of both the characteristics of the procedure and theenvironment in which it is being used. In other words, the accuracy of PPV and NPVvalues would be lower in general population and when the same screening proceduresare applied to high risk populations, they are highly effective in identifying those withthe disease.
Sensitivity and NPV go together; given a constant occurrence of the disease, anincrease in sensitivity brings about an increased NPV and vice versa. A similarassociation exists between specificity and PPV. If the sensitivity and specificity remainthe same, an increase in the occurrence of the disease results in an increased PPVand a decreased NPV.
3.4.3.3 Receiver Operating Characteristic Analysis
The diagnostic performance of a test to discriminate diseased cases from normalis evaluated using receiver operating characteristic (ROC) curve analysis (Metz, 1978;Zweig and Campbell, 1993). ROC analysis is based on a graphic representation ofthe reciprocal relation between sensitivity and specificity, calculated for all possiblethreshold values. When sensitivity and specificity are analyzed jointly, a thresholdscore or cut-off must be set to divide patients into 2 categories: those presumed tohave the disease and those presumed not to have the disease.
A test scored on a continuous scale does not have just one value for the combinationof sensitivity and specificity; rather, it has a range of values, with various possible cut-off points. Because reporting only one sensitivity–specificity pair may give anoversimplified picture of the performance of the diagnostic procedure, it is more usefulto describe the entire range of values; plotting each pair of scores on an ROC plot isa good way to do this.
The true-positive probability (sensitivity) is plotted as a function of the false-positiveprobability (1 – specificity), for the entire range of cut-off points. The resulting ROCcurve provides a graphic summary of the range of decision thresholds for the test. Asthe curve approaches the upper left corner of the plot, the true-positive fraction (TPF)approaches 1 (perfect sensitivity) and the false-positive fraction (FPF) approaches

Experimental Methods 67
zero (perfect specificity); the closer the curveto the corner, the greater the overall accuracyof the test.
The discriminative ability of a procedureis defined by the distributions of diseased andnon-diseased patients. The overlap of thesegroups determines the shape and positionof the ROC curve. A straight line from thelower-left corner to the upper-right cornerdescribes a procedure in which the diseasedand non-diseased distributions overlapcompletely and the TPF and FPF are equalat any threshold. This procedure has nodiscriminative value and is worthless. Aperfect procedure has no overlap betweenthe distributions of diseased and healthypatients and would result in the straight line.
3.4.3.3.1 Area under the Curve
In addition to the relative simplicity of thisvisual representation of test accuracy, it ispossible to perform quantitative analysisyielding summary indices of the discriminatory accuracy of the test. The most commonsummary index is the area under the curve (AUC), that is, the area under the ROCcurve. The AUC is a measure of the accuracy of a diagnostic procedure and isfrequently used for comparisons between procedures. The ROC line for a perfectprocedure has an AUC of 1.0 or 100%. The closer the AUC value is to 1.0 or 100%,the more accurate the procedure. Fig. 3.8 shows the ROC curve obtained fordiscriminating sound from dentinal caries using SPSS software (Version 10, SPSSInc., Chicago, IL, USA) (see Chapter 9).
3.5 IN VITRO STUDIES
Prior to using the LIFRS system in patients, the device was tested in the laboratoryby measuring the laser-induced fluorescence and diffuse reflectance spectra fromextracted tooth samples using 337 nm nitrogen and 404 nm diode lasers. We usedraw LIF spectral intensity, curve fitted LIF amplitude and curve area ratios of the
Fig. 3.8 Receiver operating characteristic(ROC) curve obtained for sound from cariestooth. The horizontal red line represents aperfect procedure, with no overlap between thedistributions of normal and diseased patients.The diagonal green line represents aprocedure for which the diseased and non-diseased distributions overlap completely.

68 Spectroscopic Investigation of Tooth Caries and Demineralization
constituent bands to discriminate caries from sound tooth and also to classify differentstages of caries. The results were compared with the DR spectral ratios (Subhashet al., 2005). Further, the potential of LIF and DR spectroscopy to detect dentalerosion, cyclic de- and re-mineralization were also tested. The fluorescence anddiffuse reflectance spectral intensity and ratios were used to detect tooth caries,dental erosion and de- and re-mineralization.
3.6 IN VIVO STUDIES
3.6.1 Ethical Clearance for the Study
A proposal for conducting clinical trials on 100 patients to detect dental cariesusing LIFRS system was prepared and submitted to Ethics Committee of theGovernment Dental College, Trivandrum. The proposed work intended to test theapplicability of the LIFRS system to detect tooth caries and de-mineralization bymeasuring autofluorescence and diffuse reflectance from sound and caries tooth,followed by correlation with visual-tactile and radiographic findings. After getting ethicalclearance from institutional ethical committee (IEC/C/01-A/2008/DCT), clinical trialswere conducted at the Department of Conservative Dentistry and Endodontics at theGovernment Dental College, Thiruvananthapuram, India. Patients who presentthemselves at the OP clinic were examined by the clinician and those found suitablebased on the visual-tactile findings of the respective tooth were enrolled into the trial.
3.6.2 Inclusion and Exclusion Criteria for the Study
An inclusion and exclusion criterion was followed for selecting patients for thespectral measurements.
1. INCLUSION CRITERIA
i) Patients belonging to the age groups 20-50 years.
ii) Patients identified with caries by radiographic and visual impression.
iii) Patients complaining pain, sensitivities to hot and cold foods.
iv) Ability to read, understand and sign informed consent.
2. EXCLUSION CRITERIA
i) Patient refusal.

Experimental Methods 69
ii) Patients with fractures,cysts and tumors of oral cavity.
iii) Patients with gingivitisand periodontal diseases.
iv) Patients with diseasesthat are transmittable.
3.6.3 Conduct of ClinicalTrials
The patients enlisted for thestudy were explained in detailabout the pros and cons of thestudy. Signed and informedconsent was taken prior to thestudy from each patient. A totalof 105 patients, aged between 20 and 50 years with clinically suspected incipientcaries or radiographically proven tooth caries were included in the study (Fig. 3.9).Before initiation of measurements, the patients were asked to rinse their mouth withwater/saline to reduce the effects of recently consumed food and the measurement
site was cleaned with cotton- swab.The studies were carried out in vivotooth, which were selected for thestudy by an experienced clinician afterrecording its visual-tactile impression.Fig.3.10 shows a close-up view of oralcavity and molar tooth being examinedby point monitoring using the fiber-optic hand piece. After in-vivo LIF andDR spectral measurements,radiography of the measured toothwas taken. Depending upon the visual-tactile and radiographic results, thetooth was classified by an experiencedclinician, who was blinded to thespectral findings.
Fig. 3.9 Conduct of clinical trials using the LIFRS systemat the Government Dental College, Trivandrum.
Fig.3.10. Close up view of the tooth samples beingexamined by point monitoring using the fiber-optichand piece.

70 Spectroscopic Investigation of Tooth Caries and Demineralization
3.6.4 Validation Studies
To test the diagnostic accuracy of the developed LIF and DR spectral standards,a blind test was carried out in 40 patients with suspected caries. The LIF spectralratios from 40 sites in these patients were incorporated into the developed standardand correlated with the clinical and radiographic findings. Based on results obtained,the ROC-AUC, sensitivity, specificity, PPV and NPV of the spectral criteria developedwere determined.
3.7 CONCLUSION
An optical spectroscopy system known as “LIFRS” was developed to record LIFand DR spectra of tooth samples by point monitoring. The instrument was then testedon extracted tooth samples in the laboratory. Based on these in vitro results, a detailedstudy protocol was developed for clinical trials. Details of the in vitro and in vivostudies conducted and the results obtained are exclusively described in the subsequentchapters.

Chapter 4
Tooth Caries Detection by Curve-fitting of Laser-Induced Fluorescence Emission: A ComparativeEvaluation with Reflectance Spectroscopy


44.1 INTRODUCTION
Nitrogen laser (337.1 nm) excited fluorescence and white light illuminated DRspectra of extracted tooth samples were measured to detect caries formation. Thecaries tooth showed lower fluorescence and reflectance intensities in the 350 to 700nm region as compared to sound tooth. The LIF spectra were analyzed by curve-fitting to determine the peak position of the various bands present and their relativecontribution to the overall spectra. The efficacy of using the fluorescence intensityratios determined from the constituent band peak amplitudes and Gaussian curveareas are compared with those of raw spectral data and reflectance intensity ratiosin discriminating caries lesions and the results are presented in this chapter.
4.2 STUDY MATERIAL AND PROTOCOL
Sound and caries tooth belonging to different categories were collected from thedental clinic following extraction from different patients, for various reasons includingperiodontal problems. The samples were kept in PET bottles, immersed in isotonicsaline and transported to the laboratory for later measurements. Usually the sampleswere collected on the same day of extraction or on the following day and stored atroom temperature (27±3oC); but measurements were carried out as soon as thesamples reached the laboratory. The teeth were categorized as sound, dentin, andpulp level, depending on the depth of cavitation assessed using a periodontal probe.Teeth with clear enamel-intact surfaces were considered as sound, while those with3–4 mm deep caries were considered as dentin level and those with caries deeperthan 4 mm were taken as pulp level. Samples studied covered smooth surface aswell as occlusal caries. The results from 90 tooth samples are presented, out ofwhich 10 samples were affected with dentin level caries, 20 had pulp level caries,and the rest sound tooth.
Before measurements, the samples were taken out of the PET bottles and washedin running water. They were then cleared of food particles, lesions or blood clot usingan excavator and dried with tissue paper. Visual inspection is then carried out as perprotocol for tooth classification. Samples with decalcification, dental plaque, and white/brown spots were excluded. During visual inspection, the samples were categorizedbased on characteristics such as tooth type (molar, premolars, and incisors), tooth

74 Spectroscopic Investigation of Tooth Caries and Demineralization
opacity, discoloration, localizedenamel breakdown, and cavitationin opaque or discolored enamelexposing dentin or deep cavitationaffecting the pulp level. Clearsurfaces without any enamelbreakdown or discoloration wereconsidered as sound.
Due to the diverse nature of thecarious lesions, 10 sets of laser-induced fluorescence and diffusereflectance measurements weretaken from each selected area (6mm dia.). The OOI Base32software was configured to recordthe spectra, averaged for 40 scans,with boxcar width of 30 nm and anintegration time of 100 ms. In orderto determine the peak positions ofthe constituent bands and theirrelative contributions in the overallspectrum, the LIF spectrum wasanalyzed by a curve-fitting programusing Gaussian spectral functions. Various band intensity ratios are then determinedfrom the constituent band peak amplitudes and Gaussian curve areas and thencorrelated with those of raw spectral data and diffuse reflectance intensity ratios fordiscriminating different stages of tooth caries or decay.
4.3 RESULTS
4.3.1 Fluorescence Measurements
Fluorescence spectra of dental tissues differ due to changes in the compositionof pathological areas and tissue optical properties. Figure 4.1 shows the averagedfluorescence spectra recorded from 60 normal, 10 dentin, and 20 pulp level cariestooth samples. The overall fluorescence intensity was found lowest for dentin leveltooth caries and increased marginally for caries affecting the pulp.
Fig.4.1. In vitro laser-induced fluorescence spectraof sound and caries tooth affecting the dentin andpulp with excitation at 337.1 nm. The spectra shownrelate to the average of ten measurements on eachsample.

Tooth Caries Detection by Curve-fitting of Laser-Induced Fluorescence Emission 75
The fluorescence spectrum of sound tooth was found to consist of two broadbands showing maximum intensity around 490 and 440 nm, with a satellite peakaround 405 nm. The extended tail on the long wavelength side of the 490 nm peakwas suggested as due to an emission around 550 nm (Borisova et al, 204). In thecase of caries affecting the pulp, an additional peak was observed at around 630 nm,which was absent in sound tooth and dentin level caries. The dentin level caries toothexhibited the lowest intensity as compared to sound tooth and caries affecting thepulp. There was no significant difference in spectral features for smooth surface orocclusal caries.
4.3.2 Curve-fitting analysis
The mean LIF spectra from sound, dentin, and pulp level caries were analyzed bycurve-fitting using Gaussian spectral functions. Figure 4.2 (a–c) shows the peak fittedspectrum and the constituent emission bands It was seen that peak fitting of soundtooth LIF spectra using four Gaussian peaks gives the best fit, with the coefficient offitting (r2 value) close to 0.999. In the case of pulp level caries tooth, the fitting had tobe performed using five Gaussian peaks to achieve a reasonably good r2 value of 0998. Table 4.1 shows the peak positions of the various bands, their Gaussian curveareas, full width at half intensity maximum (FWHM) values and the χ2 and r2 values offitting. The data from pre-molars and molars are grouped together since no significantvariation was observed in the LIF spectra between these two types. It is seen that the
Tooth Type Peak Centre (nm)
FWHM (nm)
Area Amplitude χ2 r2
Sound Premolars (9) Molars (41)
403.80 26.99 216.91 6.41 0.013 0.999 434.20 34.28 426.43 9.92 486.88 56.22 784.32 11.12 522.45 99.83 799.26 6.38
Dentin level caries Premolars (4) Molars (6)
406.72 29.78 57.40 1.54 0.004 0.995 436.81 23.66 33.89 1.31 487.25 73.89 208.47 2.25 554.52 162.90 405.95 1.99
Pulp level caries Premolars (10) Molars (10)
404.41 28.01 58.63 1.67 0.003 0.998 437.35 32.06 105.90 2.63 489.76 55.90 214.17 3.05 530.23 100.56 376.48 2.98 636.78 34.00 45.09 1.05
Number of specimens (n) is given in parenthesis; FWHM- full width at half maximum; χ2- chi-square; r2- correlation coefficient
Table 4.1 Results of curve-fitting on the averaged LIF spectrum in the 350–690 nmregion of sound and caries tooth.

76 Spectroscopic Investigation of Tooth Caries and Demineralization
522.45 nm peak shifts towards the red region by 32 nm to 554.52 nm in dentin cariesand by 8 nm to 530.23 nm in pulp level caries. In addition, a new peak appears at636.78 nm in pulp level caries. Another notable feature is the broadening of the 522nm peak by around 63 nm; with concomitant decrease in the Gaussian curve areafrom 799.26 to 405.95 for dentin level caries. In addition, the 434.2 curve areadecreases from 426.43 to 33.89 in dentin level caries and increases to 105.9 in pulplevel caries.
4.3.3 Gaussian curve-fitted and raw LIF ratios
Fig.4.2. The constituent bands of LIF spectra of (a) sound tooth, (b) dentin level caries tooth,and (c) pulp level caries tooth. The dots on the LIF spectrum relate to the data points. The solidline is the curve- fitted line, whereas dotted lines show the constituent bands.
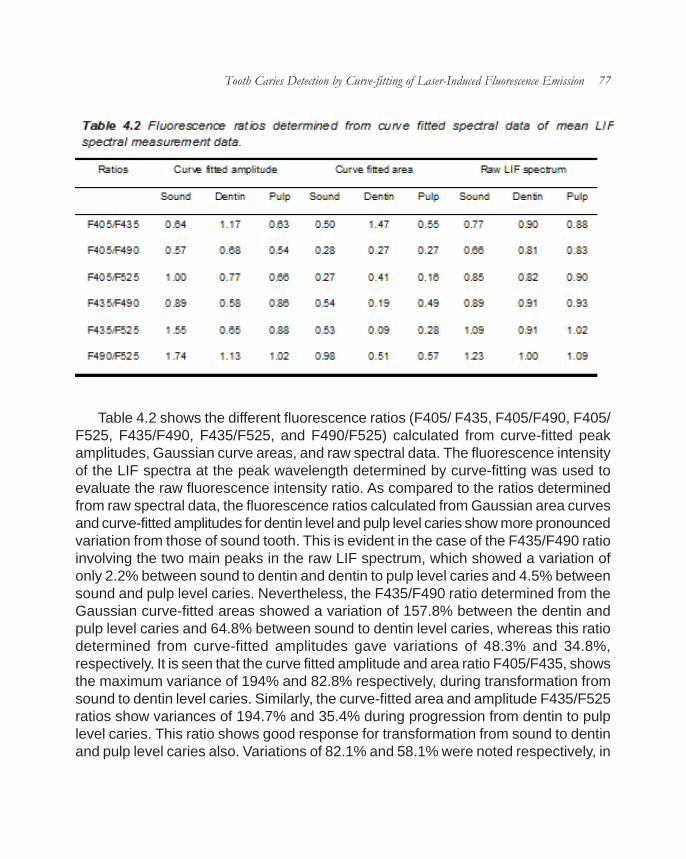
Tooth Caries Detection by Curve-fitting of Laser-Induced Fluorescence Emission 77
Table 4.2 shows the different fluorescence ratios (F405/ F435, F405/F490, F405/F525, F435/F490, F435/F525, and F490/F525) calculated from curve-fitted peakamplitudes, Gaussian curve areas, and raw spectral data. The fluorescence intensityof the LIF spectra at the peak wavelength determined by curve-fitting was used toevaluate the raw fluorescence intensity ratio. As compared to the ratios determinedfrom raw spectral data, the fluorescence ratios calculated from Gaussian area curvesand curve-fitted amplitudes for dentin level and pulp level caries show more pronouncedvariation from those of sound tooth. This is evident in the case of the F435/F490 ratioinvolving the two main peaks in the raw LIF spectrum, which showed a variation ofonly 2.2% between sound to dentin and dentin to pulp level caries and 4.5% betweensound and pulp level caries. Nevertheless, the F435/F490 ratio determined from theGaussian curve-fitted areas showed a variation of 157.8% between the dentin andpulp level caries and 64.8% between sound to dentin level caries, whereas this ratiodetermined from curve-fitted amplitudes gave variations of 48.3% and 34.8%,respectively. It is seen that the curve fitted amplitude and area ratio F405/F435, showsthe maximum variance of 194% and 82.8% respectively, during transformation fromsound to dentin level caries. Similarly, the curve-fitted area and amplitude F435/F525ratios show variances of 194.7% and 35.4% during progression from dentin to pulplevel caries. This ratio shows good response for transformation from sound to dentinand pulp level caries also. Variations of 82.1% and 58.1% were noted respectively, in

78 Spectroscopic Investigation of Tooth Caries and Demineralization
the curve-fitted area and amplitude of F435/F525 ratio during transformation of soundtooth to dentin level caries; and variations of 47.2% and 43.2% were seen respectively,in area and amplitude ratios for sound to pulp level cavitation.
4.3.4 Diffuse Reflectance Measurements
Figure 4.3 shows the in vitro diffuse reflectance spectra, averaged from 10measurements, in the 350 to 700 nm region for 60 sound, 10 dentin, and 20 pulp-level tooth samples. In all thesemeasurements, the reflectancespectral intensity of dentin levelcaries was found lower than thatof sound and pulp level caries.However, beyond 700 nm thespectral intensity of dentin levelcaries increased and remainedhigher until 900 nm (spectra notshown). The reflectance intensityratios (R500/R700, R600/ R700,and R650/R700) determinedfrom the recorded mean spectrais presented in Table 4. 3. In orderto account for sample-to-samplevariations, the averagereflectance intensity over ±10 nminterval at the chosen wavelengthwas used in determining theratios. The decrease inreflectance intensity ratio fromsound to dentin level caries was17.5% for R500/R700, 25.6% forR600/R700, and 15.3% for R650/R700, whereas these ratiosdecreased by 50.8%, 28.9%, and 12.9%, respectively on deep cavitation (pulp levelcaries). Transformation from dentin to pulp level caries was marked only in the R500/R700 ratio (15.3%). Thus, among these ratios, the diffuse reflectance spectral ratio,R500/R700, appears to be most suited to distinguish between different stages ofcaries tooth formation.
Fig.4.3. Mean in vitro diffuse reflectance spectra of sound(60 specimens) and caries tooth, affecting the dentin (10specimens) and pulp (20 specimens).

Tooth Caries Detection by Curve-fitting of Laser-Induced Fluorescence Emission 79
4.3.5 Lesion Profiling
In order to understand the relationship of the cavity profile on the fluorescence orreflectance signals, LIF measurements were carried out across different points aroundthe cavity boundaries and at the center of three pulp-level caries tooth. These werelarge sized caries, of about 5–7 mm in width and depth, which could easily beaccessed with the fiber-optic probe. Figure 4.4 shows the mean LIF spectra,averaged for the three samples, with five measurements each on the cavity edgesand central areas. As observed earlier, the 635 nm peak is clearly identifiable in thespectrum and has the same intensity at both the edges and the center, whereasthe fluorescence intensity of the 405, 435, and 490 nm peaks increases at thecavity edges. The mean LIF spectra were curve-fitted for obtaining the variousspectral signatures. No appreciable shifts were noticed in the constituent peaks inthe LIF spectra from the edges and central areas of the cavity. Among the variousratios computed, the F435/F525 ratio showed the maximum variance between theedges and center of the cavity, followed by the F405/F435, F490/F525, and F405/F490 ratios. The F435/F525 Gaussian curve area ratio was found to decrease by69% from 0.30 at the center to 0.18 at the edges whereas the correspondingamplitude ratios decreased by 38% from 0.99 to 0.72. The percentage increase inthe Gaussian curve area ratios, F405/F435 and F405/F490, between the edgesand central portions were 44.5% and 34.1%, while there was a decrease of 42% inF490/F525 ratio. The mean diffuse reflectance spectra in the 550–700 nm wavelengthrange from the cavity edges showed slightly higher intensity as compared to the

80 Spectroscopic Investigation of Tooth Caries and Demineralization
center of the cavity. The reflectanceintensity ratio (R600/R700) computedfrom the mean spectra showed anincrease of 8.5%, from 0.77 at thecavity center to 0.84 at the edges.
4.4 DISCUSSION
In this study, significant variationsbetween the fluorescence andreflectance spectra of sound, dentin,and pulp level caries was observed.The caries tooth always exhibit lowerfluorescence intensity than soundtooth. The sound tooth has thestructure and chemical composition ofhydroxyapatite. Dental caries isaccompanied by the de-calcification ofmineral components and dissolutionof the organic matrix of hydroxyapatite.Significant variations seen in thefluorescence and reflectance spectrum could be attributed to the changes in thephysical structure and chemical composition during the disintegration and decay oftooth enamel leading to caries. The normal enamel of teeth is composed of millionsof prisms or rods with waveguide properties that facilitate deep penetration whenilluminated with UV-visible light. In case of dental caries, the prism structure isdamaged and the waveguide properties are lost so that the irradiated light cannotpenetrate deeply. This leads to a reduction in the fluorescence intensity in carieslesion (Fig. 4.1).
With nitrogen laser excitation, Borisova et al. (2004) had also reported a similardecrease in fluorescence intensity for both demineralised and caries tooth. Theyalso observed broad bands centered around 490 nm with a secondary maximumat 440 nm in sound and caries tooth. However, the exact positions of the peakswere hitherto unknown. The curve-fitting of the mean sound tooth LIF spectra werecarried out using Gaussian spectral functions and found that the four peaks thatconstitute the broad LIF emission are centered at 403.80, 434.20, 486.88, and 522.45nm (Table 4.1). The fitting repeated in dentin and pulp level caries tooth showed
Fig. 4.4. Averaged in vitro nitrogen laser-inducedfluorescence spectrum at the cavity edges andcentral areas in pulp level caries tooth.

Tooth Caries Detection by Curve-fitting of Laser-Induced Fluorescence Emission 81
peak shifts of 32 and 8 nm towards the red region, respectively in dentin and pulplevel caries, for the 522 nm peak. In the case of pulp level caries, we observed anew peak at 636.78 nm (Figs. 4.2 c and 4.4) with the same intensity at the cavitycenter and edges.
Since the correlation coefficients of curve-fitting were very close to unity, forfitting carried out with four peaks, and the residuals of fitting were few and scattereduniformly over the fitted curve, it is to be assumed that the peak wavelength positionsof the sound tooth fluorescence identified by the curve-fitting algorithm are fairlyaccurate. Thus, the shift in peak position of the 522 nm band for dentin level cariesand the appearance of the new peak at 636 nm could be useful in identifying theextent or stage of tooth decay. In caries, what we usually see is a dark brown massconsisting of blood cells, food particles, and products of bacteria metabolism. Inpulp-level caries, the root system gets affected and there could be bloodcontamination of the lesions. Protoporphyrin IX (PpIX) formed during the Heme cyclehas an emission at 635 nm with UV light excitation. Hence, the appearance of the636.78 nm peak in pulp level caries (Figs. 4.2c and 4.4) could be due to presence ofPpIX in the lesion. During profiling studies inside the cavity of pulp level caries, the635 nm peak observed in the LIF spectra from the central areas of the lesion overlapswith peak from the cavity edges confirming the uniform presence of PpIX in the entirecavity area (Fig. 4.4).
The demineralised dentin shows emission peaks around 490 and 440 nm duringthe early stages of demineralization (Borisova et al, 2004). However, during laterstages of demineralization, the 440 and 490 nm band broadens due to the appearanceof secondary peaks around 405 and 525 nm. These four peaks are prominent indentin level caries also (Fig. 4.2b). This shows that features related to blood cells areabsent in dentin level caries since the root system is not affected and the bloodsupply to the roots remains intact. There are marked variations not only in the peakemission bands but also in the peak amplitude, FWHM width, and the Gaussian curvearea during caries development. The 405 nm band position and FWHM width remainunaffected during caries development. Nevertheless, there is a definite shift in thepeak position and variation in the intensity and FWHM width of the 525 nm band,which could be due to the presence of exogenous molecules/fluorophores in thetooth or due to changes in chemical composition during the disintegration process ordue to bacterial metabolism products.
Although most of the fluorescence ratios determined from curve-fitted amplitudes
82 Spectroscopic Investigation of Tooth Caries and Demineralization
and Gaussian curve areas varied during caries formation, the ratios involving the 435nm emission peak, such as F405/F435, F435/F525, and F435/F490, appeared moresuitable for sighting the evolutionary changes during caries formation (Table 4.2).Transformation from dentin to pulp level caries was seen clearly in the F435/F490and F435/F525 ratios, while sound to dentin level caries were easily detectable usingthe F405/ F435 ratios. However, the LIF spectral ratio F435/F525 determined fromcurve fitted area of the deconvoluted 435 and 525 nm peaks appeared more sensitiveto distinguish between different stages of tooth decay from sound to dentin, sound topulp and dentin to pulp. With respect to detection accuracy, Gaussian curve arearatios fared, in general, better than curve-fitted amplitude ratios. The lesion profilingstudies showed that the LIF spectral ratios F405/F435, F435/F525, and F490/F525are more sensitive as compared to reflectance ratios in the assessment of the shapeand extent of pulp level cavities.
The chromophores present in the caries, with strong absorption in the blue-greenspectral region, have also resulted in decreased diffuse reflectance spectral intensityin the 400–600 nm range (Fig. 4.3). These spectral changes in caries might be due tothe import of exogenous molecules during caries developmental process, as evidencedby the presence of increased absorption in the short wavelength region. Theconcentration of these exogenous molecules increases due to the presence of foodparticles, blood cells and bacterial activity. Earlier measurements by Uzunov et al (2003)showed significant decrease in the reflectance spectral ratios by 158% and 32.4%respectively, for R500/ R900 and R750/R900 ratios between sound and deep cavitationtooth. In our measurements, the diffuse reflectance intensity of dentin level caries beyond700 nm was more than that of the sound tooth, unlike the steady increasing trendshown up to 900 nm for sound tooth, superficial cavity, and deep cavitation (Uzunov etal, 2003). We, therefore, did not compute the ratios beyond 700 nm.
The effectiveness of using laser-induced fluorescence for detection of occlusalcaries using the DIAGNOdent device showed that fluorescence technique gives onlyaccuracies similar to that of visual inspection or radiography (Sheehy et al, 2001; Shiet al, 2001; Attril and Ashley, 2001 and Fausto et al, 2003). The main reason for this isthe unsuitability of the 655 nm laser emission of this device for excitation of the chemicalconstituents of teeth and bacterial metabolism products that cause tooth decay. Itmay further be noted that fluorescence of caries lesions is due to changes in organiccontent of the lesion rather than mineral loss. However, the use of a UV laser at 337nm establishes the enhanced capability and accuracy for LIF detection of differentstages of caries lesions.

Tooth Caries Detection by Curve-fitting of Laser-Induced Fluorescence Emission 83
The key advantages of laser-based systems are their high sensitivity and lack ofattendant risks of ionizing radiation. This leads to their frequent use in monitoringlesions of dental caries and dental erosion, and such studies could further be extendedfrom visible and UV wavelengths to the near-IR and IR for detailed analysis of theinternal composition of tooth. As compared to point monitoring of fluorescence andreflectance signatures, the use of a CCD camera based multi-wavelength imagingdevice with UV laser excitation would facilitate representation of fluorescence intensityand ratio variations across the lesion and a better understanding of caries constitutionand diagnosis. Further in vivo studies are required with the LIF system to test itsefficacy in a clinical environment. Once the characteristic emission bands, theirpositions, and relative contributions are identified by curve-fitting, routine monitoringof sound tooth will enable early identification of any physical or chemical changesoccurring in the tooth before the development of caries lesions so that preventivemeasures could be resorted well in advance.
4.5 CONCLUSIONS
The fluorescence ratios showed significant changes depending on the nature andextent of caries and the detection capability was enhanced when contributions from theconstituent bands, as determined by curve-fitting of the LIF spectra using Gaussianspectral functions were considered. Based on our findings, it can be presumed thatboth laser-induced fluorescence, with excitation by a UV laser such as the nitrogenlaser, and diffuse reflectance spectroscopy using a white light source have the potentialto diagnose different stage of caries. The advantages of using a nitrogen laser at 337.1nm, as against other visible lasers such as an argon ion laser (488 nm) or the diodelaser (655 nm) as in the case of the DIAGNOdent device, for obtaining caries sensitivefluorescence emission signatures have been clearly brought out.


Chapter 5
Investigation of in vitro Dental Erosion by OpticalTechniques


55.1 INTRODUCTION
Dental erosion is becoming an increasing predicament in dentistry and can beattributed to either exogenous or endogenous factors. Accurate diagnosis of dentalerosion in its formational phase is a challenging task. Early detection allows preventiveremineralization measures to be taken before physical and chemical changes in toothenamel and dentin sets in, causing irreversible damage to teeth. Establisheddiagnostic methods cannot detect carious process in its early stage or producearbitrary data that cannot be correlated to actual mineral loss. Thus, there is a needto develop diagnostic methods than can accurately screen dental erosion at an earlierstage.
Studies has shown that curve-fit analysis of nitrogen excited laser-inducedfluorescence (LIF) spectra using Gaussian spectral functions could differentiatedifferent stages of caries formation with improved sensitivities. This chapter exploresthe importance of tissue fluorescence and diffuse reflectance (DR) in detecting artificialdental erosion. The LIF spectra were analyzed by curve-fitting to determine the peakposition of the various bands present and their relative contribution to the overallspectra. The results of curve-fitting were compared with raw spectral data and theDR spectral characteristics to understand the suitability of these techniques indetecting early tooth demineralization and are presented here.
5.2 STUDY MATERIAL AND PROTOCOL
Sound tooth samples were collected from a nearby dental clinic following extraction,for various reasons including periodontal problems and transported to the laboratoryin isotonic saline. Four sound teeth were fixed on a glass slide with the buccal side upusing an epoxy (Araldite, Huntsman Advanced Materials, India) and sectioned laterallythrough the center on a precision thin section cutter (Buhler, USA) to obtain two slicesof each sample for recording typical enamel and dentin fluorescence and diffusereflectance spectra. Eight premolars without any clinically visible lesions were selectedfor dental erosion studies. Before measurements, the samples were washed in runningwater, cleared of food particles or blood clotting and dried with tissue paper. Aftermaking baseline LIF and diffuse reflectance measurements the samples weredemineralized with 36% phosphoric acid based etching gel, free of silica (INSTA ETCH,

88 Spectroscopic Investigation of Tooth Caries and Demineralization
Raman Research Products, Kolkata, India) for varying treatment periods of 10 s, 30s, 1 min, 5 min, 6 h and 24 h.
Before commencement of spectral measurement, the samples were brush-washed in running water to remove the applied gel and dried with tissue paper. Tensets of fluorescence and diffusereflectance spectra were recordedfrom sound enamel and dentinareas of each sectioned tooth andfrom eight premolar tooth samplesduring various stages ofdemineralization. The OOIBase32 software was configuredto record the spectra, averaged for40 scans, with boxcar width of 10nm and an integration time of350ms.
The mean LIF spectra of clearenamel and dentin recorded fromsectioned tooth slices and fromthe control and demineralized sitesduring various stages of tootherosion were curve-fitted usingGaussian spectral functions toprecisely locate the peak positionsand their variations, if any, over theperiod of demineralization (Subhash et al, 2005). The deconvoluted peak intensitiesand Gaussian curve areas were then utilized to determine the fluorescence ratios forinvestigating the extent of tooth demineralization.
5.3 RESULTS
5.3.1 LIF spectral features
5.3.1.1 Tooth enamel and dentin spectra
The LIF spectrum of sound tooth enamel recorded from the sectioned toothsamples consist of a broad band around 490 nm with shoulder in 425–475 nm region
Fig. 5.1 Mean LIF spectra from enamel and dentin toothslices normalized with respect to the maximum intensity.

Investigation of in vitro Dental Erosion by Optical Techniques 89
that appears to peak around 440 nmin sound dentin areas. The observedchanges in fluorescence spectralintensity and shape were studied bynormalizing the LIF spectra withrespect to the intensity of the 490-nmpeak. Figure 5.1 illustrates thenormalized fluorescence spectra ofsound tooth enamel and dentin. Wehave noticed a broadening of the 490-nm peak in sound dentin with anapparent shift towards the blue region.Curve-fitting of the mean LIF spectrafrom sound enamel and dentin usingfour Gaussian spectral functionsgave the best fit of data, with valuesof correlation coefficient close to0.999 in most of the fittings.Incorporation of an additional peak didnot improve the quality of fit. Figure5.2a,b shows the peak fitted LIFspectrum with the deconvolutedconstituent peaks at 409.11, 438.13,492.35 and 523.07 nm in sound toothenamel (a) and at 411.95, 440.11,487.82 and 523.36 nm in sound dentin(b). Compared to enamel, a red shiftof about 2.8 nm was seen in dentinfor the 409-nm peak and about 2 nmfor the 438-nm peak, whereas a blueshift of 4.5 nm was seen in the 492-nm peak.
5.3.1.2 Tooth demineralization
The spectrum of sound toothenamel surfaces have a shape similar to that of sound enamel recorded from thesliced samples, but with the advancement of dental erosion, there is a gradual
Fig. 5.2 Curve-fitted LIF spectrum showing theconstituent bands from a) sound enamel and b)dentin slices of tooth. The dots on the LIF spectrumrelate to the data points. The solid line is the curve-fitted line whereas dotted lines show the constituentbands.

90 Spectroscopic Investigation of Tooth Caries and Demineralization
enhancement in the fluorescence spectralintensity as shown in Fig. 5.3a. We havestudied the spectral intensity variations bynormalizing the LIF spectra with respectto the intensity of the 490-nm band. Figure5.3b shows the normalized LIF spectra fordifferent stages of tooth demineralization.The notable feature of this spectrum is theincrease in relative intensity of the 440-nmpeak during demineralization. The LIFspectrum from demineralized toothsurface has the same shape as that of thespectra from sound enamel up to 1 min,but it slowly transforms to that of dentin in5 min. In about 24 h of dental erosion, thespectrum acquires the shape of dentinspectra demonstrating the completeerosion of the enamel layer. The mean LIFspectra during different stages ofdemineralization were curve-fitted asbefore using four Gaussian spectralfunctions. Table 5.1 shows the peakpositions of the various bands, theirGaussian curve areas, full width at halfintensity maximum (FWHM) values andthe χ2 and r2 values of fitting. Since nosignificant variations were observed in theposition of the constituent peaks, they willbe henceforth designated as 410, 440,485 and 525 nm peaks for simplicity.
The fluorescence ratios (F410/F440,F410/F485, F410/ F525, F440/F485,F440/F525 and F485/F525) calculatedfrom the curve-fitted peak intensities and Gaussian curve areas of the four peaksare shown in Table 5.2. The fluorescence spectral intensity that corresponds to thepeak wavelength determined by the curve-fitting was used to evaluate the raw
Fig. 5.3a) Mean LIF spectra during various stagesof demineralization and b) LIF spectranormalized to the intensity at 490 nm band.

Investigation of in vitro Dental Erosion by Optical Techniques 91
fluorescence intensity ratios given in Table 5.2. The ratios calculated from Gaussianspectral curve areas and amplitudes show pronounced variations with respect to theraw spectral LIF ratios. The transformation from the enamel layer to the dentin layerof tooth can be visualized from the sudden increase/decrease in ratios. In all theseratios, marked deviations were seen in 5 min of dental erosion. The overlap of
Tooth Peak
Centre (nm)
FWHM (nm)
Area Amplitude χ2 r2
Sound 411.34 30.802 2394.8 62.034 8.6 0.998
439.3 28.819 3100.5 85.843 487.44 55.398 9920.3 142.88 522.29 114.48 14336 99.922
10sec 409.45 29.373 2630.9 71.464 11.9 0.998 437.87 30.101 4191.6 111.11 486.68 57.981 13449 185.07 528.78 105.62 13885 104.89
30sec 410.57 29.551 3231.6 87.252 15.62 0.998 438.54 29.606 4834.7 130.3 486.42 56.987 14736 206.32 525.9 106.97 16777 125.13
60sec
412.14 31.291 3596.3 91.704 15.68 0.998 439.18 28.349 4074.2 114.67 486.56 60.516 16474 217.2 532.61 107.06 15267 113.78
5min 412.6 33.71 6017.8 142.43 23.41 0.998 439.93 28.055 5070.8 144.21 485.29 59.574 19523 261.47 526.59 112.89 19351 136.77
6hr 412.11 29.938 4854.2 129.37 23.41 0.999 438.72 28.894 6345.2 175.22 484.37 59.312 20853 280.52 528.62 108.11 17863 131.83
24hr 409.44 29.591 9250.6 249.43 81.72 0.999 437.76 30.807 14604 378.25 484.37 56.166 35242 500.64 522.66 106.25 33955 254.98
FWHM- full width at half maximum; χ2- chi-square; r2- correlation coefficient
Table 5.1 Results of curve-fitting on the mean LIF spectrum from the sound anddemineralized regions of tooth.

92 Spectroscopic Investigation of Tooth Caries and Demineralization
normalized mean LIF spectra of sound dentin from the sliced tooth and spectra after5 min of dental erosion (Fig. 5.4) shows that the enamel layer has been completelyeroded in 5 min. During this de-mineralization period, the Gaussian curve-fittedamplitude and area F410/F440 ratio given in Table 5.2 varied, respectively, by 37.5and 54.6%, whereas that derived raw LIF spectra varied by 4.1% only. Maximumvariance of 67.7 and 82.4% were observed, respectively, for curve-fitted amplitudeand area F410/F525 ratios. In contrast, variations of 33.6 and 46.45%, respectively,were also seen in the curve-fitted amplitude and area F485/F525 ratio.
Figure 5.5 a–c shows various fluorescence ratios derived from curve-fittedGaussian peak amplitudes (a), Gaussian curve areas (b) and raw LIF spectral intensity(c) of the four emission bands from sound enamel and dentin slices and those fromdemineralized tooth by taking the mean of the ratios from spectra recorded during 0–1 min of demineralization for enamel and during 5 min–24 h of demineralization fordentin. It can be seen from Table 5.3 that fluorescence ratios obtained fordemineralized enamel and dentin have similar trends as that of spectra recordedfrom enamel and dentin areas of sliced tooth samples. Marked variations are seen inthe F410/F440 Gaussian curve area and amplitude ratios and F410/F525 ratios. With
the exception of F440/F485 ratio, thereis a pronounced increase in ratiovalue of dentin as that of enamel insliced tooth, whereas the ratios showless pronounced variation betweendemineralized enamel and dentintooth samples.
5.3.2 Diffuse reflectancecharacteristics
5.3.2.1 Reflectance spectralfeatures
There are noticeable differencesbetween the diffuse reflectancespectra of sound enamel and dentinrecorded from sliced tooth samples.Figure 5.6 shows the averagedspectra from enamel and dentin
Fig. 5.4 Mean LIF spectra of dentin slice and spectraafter 5 min of demineralization normalized to the intensityat 490 nm.

Investigation of in vitro Dental Erosion by Optical Techniques 93
slices normalized to the maximum intensity at625 nm.
5.3.2.2 Tooth demineralization
Ten sets of diffuse reflectancemeasurements were recorded from each toothsample during various stages of demineralizationand averaged. Although the spectral shaperemains the same, the diffuse reflectanceintensity follows an increasing trend withdemineralization time as shown in Fig. 5.7a. Thestandard deviation of measurement is shown attwo points on the mean spectra during differenttime periods of erosion. There is a steepincrease in intensity up to 1 min of tooth erosion,but the intensity variation is less pronouncedafterwards. The averaged spectrum at differentstages of demineralization, normalized withrespect to the maximum intensity at 625 nm isshown in Fig. 5.7b. The normalized spectra showa reduction in relative intensity with erosion inthe spectral window below 625 nm, whereas thetrend reverses beyond 625 nm. The reflectanceintensity ratios (R500/R700, R600/R700 andR650/R700) were calculated from the spectralintensities at 500, 600, 650 and 700 nm, over aspectral interval of ±5 nm. It is seen that the R500/R700 ratio decreases by 26% from 0.53 to 0.39in 24 h of demineralization, whereas the R600/R700 and R650/R700 ratios decreased onlymarginally by 7.6 and 2.6%, respectively. Figure5.8 shows the mean reflectance intensity ratiosR500/R700, R600/R700 and R650/R700 ofsectioned enamel and dentin slices and of theenamel (from recordings taken during 0–1 min)and dentin layers of tooth (from recordings takenduring 5 min–24 h) during demineralization. It is
Fig. 5.5 Fluorescence ratios derived froma) curve-fitted spectral amplitude, b)curve-fitted spectral area and c) raw LIFspectral data of sound enamel and dentinslices and those of demineralizedsamples (mean of ratios at 0, 10 s, 30 sand 1 min representing enamel andmean of ratios at 5 min, 6 h and 24 hrepresenting dentin).

94 Spectroscopic Investigation of Tooth Caries and Demineralization
seen from Table 5. 4 that the reflectance ratios afterdemineralization follow a pattern similar to that ofthe dissected enamel and dentin ratios, with theR500/R700 ratio showing maximum resemblance.
5.4 DISCUSSION
Dental enamel is crystalline in nature and iscomposed of various minerals, including the complexcalcium phosphate mineral known ashydroxyapatite. Tooth demineralization is a precursorto dental erosion and occurs below a pH of 5.5. Thephenomenon of enamel degradation is complex;however, at low pH levels, erosion is most likely tooccur (Von Fraunhofer, 2004). A carious lesion isusually rough, pitted and irregular, whereas anerosive lesion is generally smooth and regular. Thecavitated lesion is located along the cervical margin
Fig. 5.6 Mean diffuse reflectance spectra of sound toothenamel and dentin slices normalized with respect tothe maximum intensity at 625 nm.

Investigation of in vitro Dental Erosion by Optical Techniques 95
of the restoration and involves both enamel and dentin. The erosive lesions, primarilyinvolving enamel, are found along the perimeter of the restoration. It is likely that anenamel erosive lesion facilitates the creation of a carious lesion especially along thecervical margin.
Problems associated with the erosion of enamel and dentin layers can be tracedto the increased intake of acidic food and drinks, which gradually dissolve theunderlying mineral, both at the surface and at the subsurface resulting in irreversiblestructural (patho-anatomical) changes in the hard dental tissue. Further, thecariogenic challenges lead to increased surface and subsurface dissolution. Bothconditions induce changes in the optical behaviour of the affected enamel. Sincethe porous enamel scatters more light than sound enamel the net result is that theenamel becomes opaque, at the macroscopic level (ten Bosch, 1996). Opticalspectroscopic techniques provide a means to classify and identify these changesso that a proper logical treatment plan can be formulated not only to repair thedamage but, more importantly, to eliminate the cause.
In this study, it was noticed (Fig. 5.3a) that enamel destruction due todemineralization leads to an increase in the fluorescence signal intensity in the entirespectral range as observed by Ando et al (2001) and Van der Veen and ten Bosch(1995) during demineralization studies on in vitro tooth samples. In contrast, Borisovaet al. (2004) had observed a decrease in autofluorescence intensity duringdemineralization. By normalizing the spectrum with respect to the intensity of the490-nm band (Fig. 5.3b), it was possible to observe changes in fluorescence spectral

96 Spectroscopic Investigation of Tooth Caries and Demineralization
shape and in particular, of the 440-nm band during the demineralizationprocess (Table 5.1). It was seen thatthe spectral intensity of the 440-nmband actually increases with theextent of demineralization. Thisincrease in intensity at 440 nm couldbe related to the appearance of thedentin fluorescing compoundsassociated with the penetration of thedemineralizing substances to thedentin layer of the tooth or due todisappearance of prism structure ofthe hydroxyapatite in enamel withincreased demineralization. Thesechanges can be explained moreevidently by their chemicalcomposition as sound enamelconsists of greater amount ofminerals, mainly 96% inorganicmaterial (hydroxyapatite) and a smallamount of organic substance andwater (4%), whereas sound dentinconsists of a larger portion of organicmatter (35%) than enamel. Thus, thebaseline fluorescence observedcould be due to the combined effectof the inorganic matrix with absorbingorganic molecules (Hibst andPaulus, 1999; Hunter and Harold,1987). The emission from organicmatter is more intense in the 400–500 nm, and this result in dentin beingblue-shifted or relatively moreemissive than enamel at lower wavelengths. Enamel usually exhibits a strongeremission at longer wavelengths due to the emission features of the minerals ensuingin the broadening and red shift of 490-nm spectral band (Fig. 5.1).
Fig. 5.7 a ) Mean diffuse reflectance spectral intensityvariation of sound and demineralized tooth duringvarious stages of erosion and b) the same diffusereflectance spectra normalized to the intensity at 625nm.

Investigation of in vitro Dental Erosion by Optical Techniques 97
Further, by curve-fitting using Gaussian spectral functions, it was possible to resolvethe LIF spectra into four constituent peaks centered at 409.1, 438.1, 492.4 and 523.1nm in sound enamel and at 412.0, 440.1, 487.8 and 523.4 nm in sound dentin. Theemission around 410 nm in enamel and dentin could be due to the presence ofhydroxypyridinum chromophore, a collagen crosslink (Fujimoto et al, 1977; Waltersand Eyre, 1983) and dityrosine (Booij and ten Bosch 1982), as reported earlier. Thepeak positions given in Table 5.1 could be considered as fairly accurate since thecorrelation coefficients of fitting were close to unity and χ2 values were low.
Significant differences in the Gaussian amplitude and area ratios (F410/F440,F410/F525 and F485/F525) were observed during the process of demineralization(Table 5.2). Improved sensitivities were seen in these ratios as compared to thosederived from raw LIF spectra. Among the various ratios, the curve-fitted Gaussiancurve area ratio, F410/F525 shows maximum sensitivity to distinguish earlytransformation in the enamel layer. In contrast, curve-fitted Gaussian area ratioF435/F525 was reported to be suitable for discrimination between different stagesof tooth decay (Subhash et al, 2005).
The diffuse reflectance intensity in sound tooth is usually lower (Fig. 5.7a) owingto the increased reflection from the enamel surface that limits the amount of radiationinside the tooth to generate back scattering from the underlying enamel and dentinelayers. During demineralization, changes in light scattering properties associatedwith the destruction of the waveguide structure of the enamel enhance the diffusereflectance spectra. However, the nucleic acids, urocanic acid and proteins that are
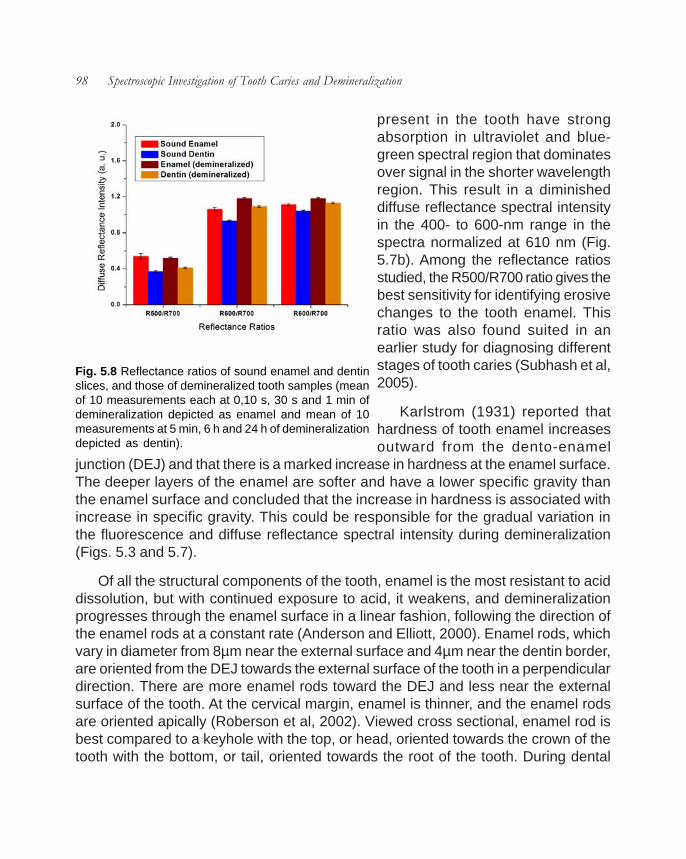
98 Spectroscopic Investigation of Tooth Caries and Demineralization
present in the tooth have strongabsorption in ultraviolet and blue-green spectral region that dominatesover signal in the shorter wavelengthregion. This result in a diminisheddiffuse reflectance spectral intensityin the 400- to 600-nm range in thespectra normalized at 610 nm (Fig.5.7b). Among the reflectance ratiosstudied, the R500/R700 ratio gives thebest sensitivity for identifying erosivechanges to the tooth enamel. Thisratio was also found suited in anearlier study for diagnosing differentstages of tooth caries (Subhash et al,2005).
Karlstrom (1931) reported thathardness of tooth enamel increasesoutward from the dento-enamel
junction (DEJ) and that there is a marked increase in hardness at the enamel surface.The deeper layers of the enamel are softer and have a lower specific gravity thanthe enamel surface and concluded that the increase in hardness is associated withincrease in specific gravity. This could be responsible for the gradual variation inthe fluorescence and diffuse reflectance spectral intensity during demineralization(Figs. 5.3 and 5.7).
Of all the structural components of the tooth, enamel is the most resistant to aciddissolution, but with continued exposure to acid, it weakens, and demineralizationprogresses through the enamel surface in a linear fashion, following the direction ofthe enamel rods at a constant rate (Anderson and Elliott, 2000). Enamel rods, whichvary in diameter from 8µm near the external surface and 4µm near the dentin border,are oriented from the DEJ towards the external surface of the tooth in a perpendiculardirection. There are more enamel rods toward the DEJ and less near the externalsurface of the tooth. At the cervical margin, enamel is thinner, and the enamel rodsare oriented apically (Roberson et al, 2002). Viewed cross sectional, enamel rod isbest compared to a keyhole with the top, or head, oriented towards the crown of thetooth with the bottom, or tail, oriented towards the root of the tooth. During dental
Fig. 5.8 Reflectance ratios of sound enamel and dentinslices, and those of demineralized tooth samples (meanof 10 measurements each at 0,10 s, 30 s and 1 min ofdemineralization depicted as enamel and mean of 10measurements at 5 min, 6 h and 24 h of demineralizationdepicted as dentin).

Investigation of in vitro Dental Erosion by Optical Techniques 99
erosion, etchants remove the outer 10 micrometers on the enamel surface and makesa porous layer 5–50 µm deep (Summit et al, 2001). This roughens the enamelmicroscopically and results in a greater surface area on which to bond. The effectsof acid etching on enamel can vary. Important variables are the amount of time theetchant is applied, the type of etchant used, and the crystal orientation in enamel (tenCate, 1998).
5.5 CONCLUSIONS
Loss of too many minerals during demineralization leads to fast development ofcaries. This underscores the importance of early detection of tooth demineralization.Caries affecting pulp and dentin can be easily detected by visual inspection, but it isa tedious task to track mineral loss during early transformations in the enamel structure.Nevertheless, formation of tooth cavity is an advanced symptom of a bacterial diseaseor chemical dissolution that has been in progress for some time. On the basis of theresults obtained in the present study, the UV laser-based ratio technique appears tohave the potential for in vivo monitoring of demineralization changes in tooth. Amongthe fluorescence ratios studied, the F410/F525 derived from curve-fitted Gaussianamplitude and area gives better sensitivity as compared to that derived directly fromthe recorded LIF spectrum. Although the R500/ R700 reflectance ratio also has thepotential to detect demineralization changes, the increase in sensitivity of the F410/F525 ratio achieved through curve-fitting using Gaussian spectral functions makes itmore suited for monitoring early transformations to the enamel layer. The informationcontained in the LIF spectral shape and constituent peaks contribution associatedwith changes in the intrinsic fluorophores content allow accurate differentiationbetween carious formation and early demineralization in tooth. Further in vivo studiesare required using the LIFRS system to test its efficacy in a clinical environment forrevealing early mineral loss and tooth demineralization.


Chapter 6
Spectroscopic Investigation of De- and Re-mineralization of Tooth Enamel in vitro


66.1 INTRODUCTION
Cyclic demineralization and remineralization of the tooth replicate the naturalprocess of demineralization and remineralization that takes place in the oral cavityenvironment. Characterization of the behaviour of tooth enamel lesions in a simulatednatural environment by optical methods leads to improvement in sensitivities fordetection of early demineralization and helps to introduce appropriate treatmentmodalities that avoid the risk of aesthetic damage or restorative intervention. Towardsthis, nitrogen laser-induced fluorescence and tungsten halogen lamp-induced DRspectra were recorded on a miniature fiber-optic spectrometer from tooth samplessubjected to cyclic de- and re-mineralization (CDR) for 10 days, followed by continuousremineralization (CR) for 14 days. The LIF and DR spectral intensities were found todecrease with CDR, but get reversed during CR. This chapter presents the applicabilityof LIFRS to detect de- and re-mineralization changes in tooth in vitro and correlatesthe results of curve-fitting with those obtained from raw spectral data and DRmeasurements.
6.2 STUDY MATERIAL AND PROTOCOL
Twenty five sound teeth were collected from a nearby dental clinic followingextraction, for various reasons including periodontal problems and transported to thelaboratory in isotonic saline. Prior to measurements, the samples were washed indeionized water, cleared of food particles or blood clotting and dried with tissue paper.A square window of dimensions 3.5 mm × 3.5 mm was made on buccal side of eachtooth by painting the remaining portions with acid resistant nail polish. After recordingthe baseline spectra, tooth samples were exposed to demineralization andremineralization by a cyclic process to stimulate a near natural in vivo environment(Jones et al, 2006). The daily schedule for cyclic treatment consisted of 6 hrdemineralization and 17 hr remineralization. During demineralization, each toothsample was immersed in 40 mL aliquot buffer solution containing 2.0 mmol/L calcium,2.0mmol/L phosphate and 0.075mol/L acetate, maintained at pH 4.3 and 37oCtemperature. Afterwards, each sample was remineralized in a 20mL solution of1.5mmol/L calcium, 0.9 mmol/L phosphate and 150mmol/L potassium chloridemaintained at pH 7.0 and 37oC temperature. Tooth samples were subjected to 10

104 Spectroscopic Investigation of Tooth Caries and Demineralization
days of cyclic demineralization andremineralization (CDR) regime, whichrepresents an early caries lesion. The toothsamples were then subjected tocontinuous remineralization (CR) for 14days in the above mineralizing solution,with the addition of 2-ppm F- in the form ofNaF to enhance the remineralization effect.
The LIF and diffuse reflectance spectrawere then recorded in the 350-700 nmspectral range using the OOI Base32software (Ocean Optics Inc., USA) aftereach phase of de-mineralization/remineralization treatment of tooth lesions.The OOI Base32 software was configuredto record the spectra, averaged for 40scans, with a boxcar width of 10 nm andan integration time of 350 ms. Ten sets ofautofluorescence and diffuse reflectancespectra were recorded sequentially fromthe exposed region of tooth samples aftereach treatment of CDR and CR. The meanspectra from each treatment is thendetermined and used in data analysis. Themean LIF spectra from the sound,demineralized and remineralized regionswere curve-fitted using Gaussian spectralfunctions. The deconvoluted peakintensities and Gaussian curve areas werethen utilized to identify de- and re-mineralization changes in tooth enamel.
6.2.1 Visual assessment of lesions
An experienced clinician, who was blinded to the spectral findings examined eachtooth after completion of fluorescence and diffuse reflectance measurements. Anysigns of demineralization, normally a white spot or surface roughness along with the
Fig.6.1. a) Mean LIF spectra during CDR and CR,and b) LIF spectra normalized to the intensity at490 nm.

Spectroscopic Investigation of De- and Re-mineralization of Tooth Enamel in vitro 105
time at which it occured, were recorded. An analysis of variance (ANOVA) wasperformed to detect whether the average LIF and DR spectral intensities differedbetween the sound, demineralized and remineralized enamel groups.
6.3 RESULTS
6.3.1 LIF spectral features
The fluorescence spectrum of sound tooth consists of a broad peak at 490 nmwith a less intense shoulder around 440 nm. Although the spectral shape remainsthe same during de-mineralization and re-mineralization, the fluorescence intensityfollows a decreasing trend in 10 days of CDR and an increasing trend in 14 days ofCR, as shown in Fig. 6.1a. In order to ascertain changes in the emission peak intensity,the LIF spectra were normalized with respect to the intensity of the 490 nm peak asshown in Fig. 6.1b. Fig.6.2 shows the extent of change in the 440 nm peak intensityafter CDR and CR. A gradual decrease in intensity was observed for the 440 nmband during CDR, which was followed by an intensity enhancement in CR. Further,beyond 500nm, we noticed a corresponding increment in intensity followed by a declinein the long wavelength tail of the 490 nm peak.
The mean LIF spectra duringvarious stages of CDR and CRwere curve-fitted usingGaussian spectral functions. Itcan be seen that peak fitting ofLIF spectra using four Gaussianspectral peaks gives the best fit,with an r2 value of 0.998. Table6.1 shows the peak position ofthe various bands, theirGaussian curve areas, full widthat half intensity maximum(FWHM) and the χ2 and r2
values of fitting during differentstages of CDR and CR. Insound tooth, the four bands arelocated at 411.32, 440.08,484.37 and 521.98 nm. These
Fig.6.2. Mean fluorescence spectral intensity variation at 440nm during CDR and CR.

106 Spectroscopic Investigation of Tooth Caries and Demineralization
bands will henceforth bedesignated as 410, 440, 485and 525 nm peaks, forsimplicity. It is seen that the525 nm peak shifts towardsthe red region by 35.3 nmduring CDR and these shiftsgets completely nullified in 14days of CR (Table 6.1). Inaddition, it was observed thatthe FWHM width of the 525 nmpeak reduced by 27.7 nm in10 days of CDR, which getsreversed within 14 days of CRwhereas an opposite trendwas observed in the case ofthe 485 nm peak, as shown inFig.6.3. Furthermore, adecreasing trend followed byan enhancement is observed in the curve-fitted peak amplitude and Gaussian curvearea of all the four peaks at 410, 440, 485and 525 nm during CDR and CR. However,these variations were pronounced for the 410 and 525 nm peaks, as shown in Fig.6.4(a, b).
6.3.2 Diffuse reflectance spectral features
Fig. 6.5 a, b shows the mean diffuse reflectance spectra during various stages ofCDR and CR, and the same normalized to the intensity at 675 nm. It can be seen thatCDR produces a gradual decline in spectral intensity, whereas CR produces anincrease in intensity (Fig. 6.5a). However, in the normalized DR spectra there are nonoticeable changes in the spectral shape, except for a slight decrease in spectralintensity in the 450 to 600 nm region.
6.3.3 Spectral intensity and curve area plots
The temporal profile of raw LIF intensity at 440 and 490 nm and the DR spectralintensity at 500 nm is plotted in Fig. 6.6a along with changes in the Gaussian curvearea of the deconvoluted peaks at 410 and 525 nm in Fig. 6.6b during CDR, whereas
Fig.6.3. Width (FWHM) of 525 and 485 nm peaks obtained bycurve fitting.

Spectroscopic Investigation of De- and Re-mineralization of Tooth Enamel in vitro 107
the corresponding changes during CR is shown in Fig. 6.7(a, b). The overallfluorescence and diffuse reflectance spectral intensities and Gaussian curve areasof the constituent bands were found to decrease gradually with CDR (Fig. 6.6) owingto mineral loses in tooth, whereas the intensity increases with CR owing to mineralrestoration (Fig. 6.7). As compared to the variations seen in raw spectral intensity at440, 490 and 500 nm, the Gaussian curve area of 410 and 525 nm peaks show apronounced variation. This can also be seen from the slope of the correspondinglines in Fig. 6.6 and 6.7.
Visual inspection of the teeth failed to detect any signs of demineralization until 6days. At the 10th day, visual evidence of demineralization was noted in all experimentalsamples. Spectral data were analyzed by ANOVA and statistically significantdifferences in mean spectral intensities (p<0.05) were noticed between sound,demineralized and remineralized enamel in LIF and DR spectral measurements,
Table 6.1. Results of curve-fitting on the mean LIF spectrum from sound andexposed areas of tooth during CDR and CR.
Tooth Peak Centre (nm) FWHM (nm) Area Amplitude χ2 r2
Sound 411.32 33.722 6064.6 143.49 32.79 0.998 440.08 30.699 7637.9 198.52 484.37 50.489 17575 277.74 521.98 107.23 27189 202.31
CDR(3 day) 406.83 23.869 1891 63.21 12.68 0.999 436.13 33.589 6685.5 158.81 485.23 55.147 16718 241.88 534.02 81.969 10450 101.72
CDR(6 day) 406.79 22.62 967 34.109 5.56 0.998 435.74 32.658 3563.5 87.062 486.74 58.101 11474 157.57 541.7 80.143 6177.6 61.503
CDR(10 day) 408.41 23.765 544.96 18.297 1.57 0.998 436.12 28.753 1218.6 33.816 488.95 65.254 6675.4 81.623 557.37 79.485 2902.1 29.132
CR(7day) 408.1 23.232 840 28.849 2.34 0.999 436.66 30.588 2302.8 60.069 485.54 53.986 5681.3 83.967 523.99 102.13 7594.8 59.331
CR(14 day) 408.76 26.759 1302.3 38.832 3.29 0.999 437.6 30.59 2775 72.382
484.25 54.182 6866.1 101.11 523.39 102.46 8161.8 63.56
Abbreviations: FWHM- full width at half maximum; χ2- chi-square; r2- correlation coefficient; CDR- cyclic demineralization and remineralization; CR- continuous remineralization

108 Spectroscopic Investigation of Tooth Caries and Demineralization
demonstrating a significant decrease in spectral intensity during demineralizationand an increase during remineralization.
6.4 DISCUSSION
Tooth enamel is a very highly mineralized tissue consisting of approximately 96%of dry weight as inorganic material while the rest is water and organic material (Hunt,1959; Dawes, 2003). Demineralization and remineralization have a vital impact onthe strength and hardness of dental enamel. Usually, a tooth is in a constant state ofcyclic or back-and-forth demineralization and remineralization due to interactions withfermentable carbohydrates and surrounding saliva. Initial enamel caries develop when
the pH level at the tooth surface is lowerthan which could be counterbalanced byremineralization. It has been found that atlower pH, millions of calcium and othermineral ions are released from thehydroxyapatite latticework, which eventuallyleads to loss in structural integrity of toothenamel. Caries advance may be arrestedat this stage. In the present CDR study, thepH was maintained at a lower value of 4.3by periodic monitoring using a pH meter.Monitoring demineralization andremineralization of dental hard tissues isessential for the prevention and minimallyinvasive treatment of dental caries. Opticalspectroscopic techniques provide anapproach to identify these incipient changesin enamel so that a proper restorativeprocedure can be formulated to preventcaries progression.
We have used the in vitro cyclicdemineralization and remineralization whichis the best possible way to simulate an invivo environment for studying the dynamicsof tooth caries development (ten Cate,
Fig.6.4(a, b). Curve-fitted peak amplitude andGaussian curve area of 410 and 525 nm peaks.
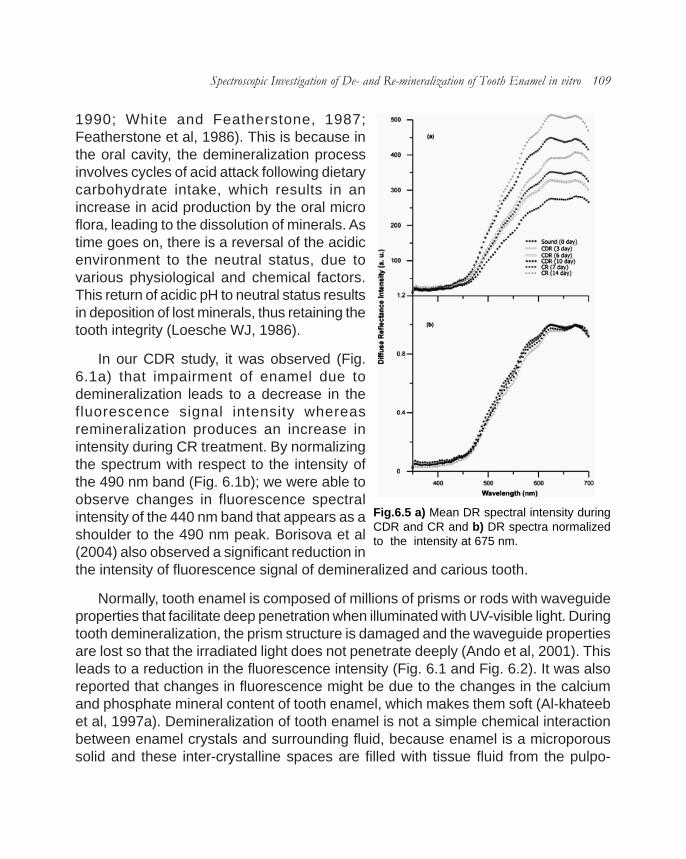
Spectroscopic Investigation of De- and Re-mineralization of Tooth Enamel in vitro 109
1990; White and Featherstone, 1987;Featherstone et al, 1986). This is because inthe oral cavity, the demineralization processinvolves cycles of acid attack following dietarycarbohydrate intake, which results in anincrease in acid production by the oral microflora, leading to the dissolution of minerals. Astime goes on, there is a reversal of the acidicenvironment to the neutral status, due tovarious physiological and chemical factors.This return of acidic pH to neutral status resultsin deposition of lost minerals, thus retaining thetooth integrity (Loesche WJ, 1986).
In our CDR study, it was observed (Fig.6.1a) that impairment of enamel due todemineralization leads to a decrease in thefluorescence signal intensity whereasremineralization produces an increase inintensity during CR treatment. By normalizingthe spectrum with respect to the intensity ofthe 490 nm band (Fig. 6.1b); we were able toobserve changes in fluorescence spectralintensity of the 440 nm band that appears as ashoulder to the 490 nm peak. Borisova et al(2004) also observed a significant reduction inthe intensity of fluorescence signal of demineralized and carious tooth.
Normally, tooth enamel is composed of millions of prisms or rods with waveguideproperties that facilitate deep penetration when illuminated with UV-visible light. Duringtooth demineralization, the prism structure is damaged and the waveguide propertiesare lost so that the irradiated light does not penetrate deeply (Ando et al, 2001). Thisleads to a reduction in the fluorescence intensity (Fig. 6.1 and Fig. 6.2). It was alsoreported that changes in fluorescence might be due to the changes in the calciumand phosphate mineral content of tooth enamel, which makes them soft (Al-khateebet al, 1997a). Demineralization of tooth enamel is not a simple chemical interactionbetween enamel crystals and surrounding fluid, because enamel is a microporoussolid and these inter-crystalline spaces are filled with tissue fluid from the pulpo-
Fig.6.5 a) Mean DR spectral intensity duringCDR and CR and b) DR spectra normalizedto the intensity at 675 nm.
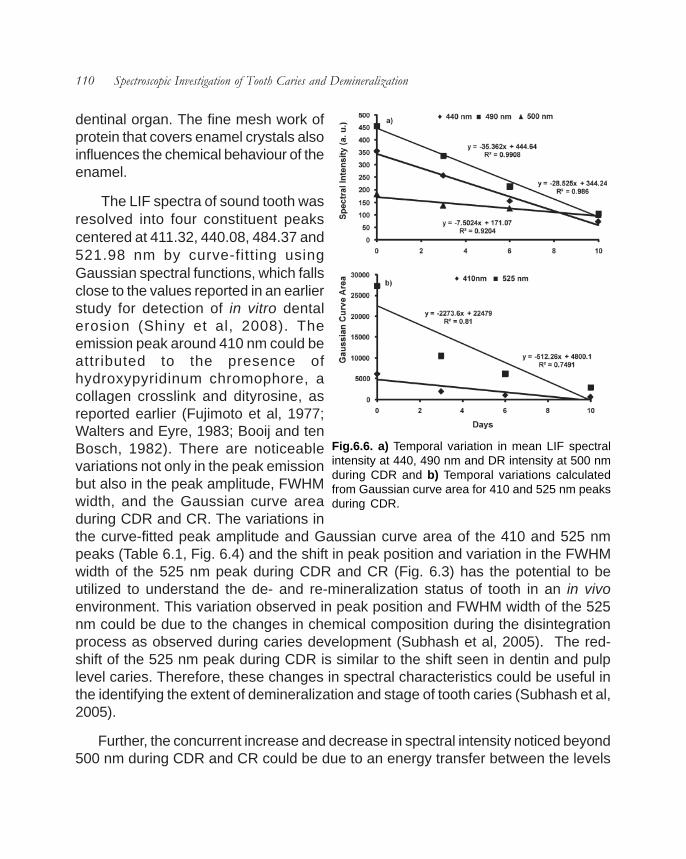
110 Spectroscopic Investigation of Tooth Caries and Demineralization
dentinal organ. The fine mesh work ofprotein that covers enamel crystals alsoinfluences the chemical behaviour of theenamel.
The LIF spectra of sound tooth wasresolved into four constituent peakscentered at 411.32, 440.08, 484.37 and521.98 nm by curve-fitting usingGaussian spectral functions, which fallsclose to the values reported in an earlierstudy for detection of in vitro dentalerosion (Shiny et al, 2008). Theemission peak around 410 nm could beattributed to the presence ofhydroxypyridinum chromophore, acollagen crosslink and dityrosine, asreported earlier (Fujimoto et al, 1977;Walters and Eyre, 1983; Booij and tenBosch, 1982). There are noticeablevariations not only in the peak emissionbut also in the peak amplitude, FWHMwidth, and the Gaussian curve areaduring CDR and CR. The variations inthe curve-fitted peak amplitude and Gaussian curve area of the 410 and 525 nmpeaks (Table 6.1, Fig. 6.4) and the shift in peak position and variation in the FWHMwidth of the 525 nm peak during CDR and CR (Fig. 6.3) has the potential to beutilized to understand the de- and re-mineralization status of tooth in an in vivoenvironment. This variation observed in peak position and FWHM width of the 525nm could be due to the changes in chemical composition during the disintegrationprocess as observed during caries development (Subhash et al, 2005). The red-shift of the 525 nm peak during CDR is similar to the shift seen in dentin and pulplevel caries. Therefore, these changes in spectral characteristics could be useful inthe identifying the extent of demineralization and stage of tooth caries (Subhash et al,2005).
Further, the concurrent increase and decrease in spectral intensity noticed beyond500 nm during CDR and CR could be due to an energy transfer between the levels
Fig.6.6. a) Temporal variation in mean LIF spectralintensity at 440, 490 nm and DR intensity at 500 nmduring CDR and b) Temporal variations calculatedfrom Gaussian curve area for 410 and 525 nm peaksduring CDR.

Spectroscopic Investigation of De- and Re-mineralization of Tooth Enamel in vitro 111
involved in the 440-nm emissionand the long wavelength tail of the490 nm band. The red shift of the525 nm peak seen in the curve-fittedspectra during CDR and itscomplete retrace to initial values(Table 6.1) during CR supports thishypothesis.
The diffuse reflectance intensityin sound tooth is higher owing toincreased reflection from theenamel surface. This leads to alower amount of radiation enteringbeyond the enamel to generatesufficient back scattering from theunderlying enamel and dentinelayers. Further, duringdemineralization, changes in lightscattering properties associatedwith the destruction of thewaveguide structure of the enameldiminish the diffuse reflectancespectra (Ando et al, 2001).However, the nucleic acids, urocanic acid and proteins that are present in toothhave strong absorption in the ultraviolet and blue-green spectral regions and thisdominates over signal in the shorter wavelength region and results in diminisheddiffuse reflectance spectral intensity in the 400-600 nm range (Fig. 6.5). It is alsoseen that an increase in mineral volume from fluoride-enhanced remineralizationsignificantly decreases optical reflectivity of artificial lesions within an enlargedsurface zone, whereas reflectivity does not necessarily decrease in the body ofunderlying lesion after remineralization (Jones and Fried, 2006).
As carious lesion undergoes remineralization, the deep porosities accumulatemore mineral than lesion surface zone. It is also reported that successfulremineralization of the surface zone limits the continued diffusion of ions into thedeeper regions of the lesion, which was observed during in vivo remineralizationstudies of early caries (Arends and Gelhard, 1983). As lesion progresses, the mineral
Fig.6.7. a) Temporal variation in mean LIF spectral intensityat 440, 490 nm and DR intensity at 500 nm during CR andb) Temporal variations calculated from Gaussian curvearea for 410 and 525 nm peaks during CR.
112 Spectroscopic Investigation of Tooth Caries and Demineralization
content at specific depth does not vary significantly after a certain volume; instead,diffusion of ions through this area doesn’t affect the mineral volume (Arends et al,1997), whereas in remineralization, mineral volume is increased mainly by growth ofthe remaining crystals, restoration of partially demineralized crystals and the depositionof newly formed crystals (Yanagisawa and Miake, 2003) ,which might be the reasonfor the gradual variations in fluorescence and DR spectral features duringremineralization (Fig. 6.1 and Fig. 6.5). Also, remineralization process is slower ascompared to demineralization, when mineral uptake occurs in very small quantities.
6.5 CONCLUSIONS
The study shows that both LIF with excitation by a UV laser (337 nm) and DRspectroscopy with white light illumination have the potential to identify de- and re-mineralization changes in tooth from spectral intensity variations. Among the variousparameters studied, variation in the FWHM width and peak position of the 525 nmpeak deconvoluted by curve-fitting, and the changes in the Gaussian amplitude andcurve area of the 410 and 525 nm peaks appear to be effective in identifying incipientchanges in tooth. Although the diffuse reflectance intensity variation during CDR andCR are marked, the information contained in the LIF spectral intensity and constituentpeak contributions achieved through curve fitting are more suited for monitoring ofearly transformations in tooth enamel. Nevertheless, these modalities need to befurther explored in a clinical environment to test its efficacy for monitoring changes inmineral content.

Chapter 7
Characterization of Dental Caries by LIFSpectroscopy with 404 nm Excitation


77.1 INTRODUCTION
Despite our improved understanding of the caries process and the availability ofeffective intervention, caries lesions still progress to the stage where tooth structureis compromised and invasive intervention and restoration are required. Studies haveshown that non-cavitated caries lesions are significantly more prevalent than cavitatedcaries lesions. This chapter reports the performance of the laser-induced fluorescence(LIF) spectroscopy in detecting dental caries and to classify between different stagesof caries with excitation at 404 nm from a diode laser. Towards this, in vitro LIF spectrawere recorded from 16 sound, 10 non-cavitated and 10 cavitated molar teeth.Autofluorescence spectral intensity of caries lesions were found lower than that ofsound tooth and decreased with the extent of caries. The LIF spectra of caries toothshowed two peaks at 635 and 680 nm in addition to the broad band seen at 500 nmin sound tooth. The efficiency of using the fluorescence spectral intensity ratios inidentifying caries lesions was studied and the results are presented.
7.2 STUDY MATERIAL AND PROTOCOL
Sound and caries tooth samples belonging to different categories were collectedfrom a nearby dental clinic following extraction, for various reasons includingperiodontal problems and were transported to the laboratory in isotonic saline. Usuallythe samples were stored at room temperature (27 ± 3 oC) and measurements werecarried out as soon as the samples reached the laboratory. The tooth samples wereclassified clinically, by an experienced dental practitioner, depending on the visual-tactile or radiographic examination before extraction from the patient. Clear enamel-intact tooth surfaces were considered as sound, while enamel caries with intactsurface, with loss of luster, surface roughness, white spot and brown lesions wereconsidered as non-cavitated lesions and those with visible cavitation, deeper than 3-4 mm were taken as cavitated lesion. The study samples included 16 sound, 10 non-cavitated and 10 cavitated molar teeth. Samples studied covered occlusal surfacecaries.
7.2.1 Experimental Methods
Before measurements, the samples were taken out of the PET bottles and washed

116 Spectroscopic Investigation of Tooth Caries and Demineralization
in running water. They were then cleared of food particles or blood clot using a toothbrush and water and then dried with tissue paper. Visual inspection was again carriedout as per the protocol for tooth classification. During visual-tactile inspection, thesamples were categorized based on characteristics such as tooth type, toothdiscoloration, localized enamel breakdown, and cavitation in enamel exposing dentinor affecting the pulp.
Due to the diverse nature of the caries lesions, 12 sets of LIF measurementswere taken from each selected area (6 mm dia.) and averaged for data analysis. TheOOI Base32 software was configured to record the spectra, averaged for 40 scans,with boxcar width of 8 nm and an integration time of 50ms. Fluorescence intensityratios are then determined from the emission peak intensity of the mean spectra fordiscriminating different stages of dental caries. To account for the broad nature of thepeaks and sample-to-sample variation in peak position due to changes in chemicalcomposition or fluorophore content of tooth, the mean LIF spectral intensity over aninterval of ±10 nm at the emission peak was used to determine the LIF spectralratios. ANOVA was performed to detect whether the average LIF spectral intensitydiffered between the groups belonging to sound, non-cavitated and cavitated carieslesions.
The ROC curve areas were then determined to classify different stages of caries.In ROC analysis, which is an excellent statistical approach for new techniques withnumerical values, the sensitivities for detecting dental caries are plotted against valuesof 1 minus the specificity. The more precisely a technique separates the data classes,the closer would be the corresponding ROC-AUC to unity. In the present study, toothwithout lesion were considered as sound, while tooth with loss of lustre, surfaceroughness and visible cavitation were considered as caries lesion. This allows oneto make a fair judgment on the efficacy of methods without being constricted to asingle value of sensitivity and specificity, which largely depends on the cut-off valuechosen (Metz, 1978).
7.3 RESULTS
7.3.1 LIF spectral features
Fluorescence spectra of dental hard tissues vary due to alteration in the chemicalcomposition of pathological areas and tissue optical properties. Figure 7.1 shows theaveraged fluorescence spectra recorded from 16 sound, 10 non-cavitated and 10cavitated tooth samples, normalized to the maximum intensity around 500 nm. The

Characterization of Dental Caries by LIF Spectroscopy with 404 nm Excitation 117
overall fluorescence intensity of caries lesions were found lower than that of soundtooth and decreased with the extent of caries. However, the fluorescence spectralintensity in the red wavelength region was greater for carious when compared tosound regions. The LIF spectrum of sound tooth shows a broad emission around500 nm with a long tail extending towards the red region. In non-cavitated and cavitatedcaries lesions, two additional peaks were seen at 635 and 680 nm. In cavitated carieslesion, the 500 nm band appears broadened and red-shifted by about 10-15 nm.
7.3.2 LIF intensity ratios
Mean LIF spectral intensity ratios (F500/F635 and F500/F680) determined from
Fig.7.1. Mean LIF spectra from sound and caries lesions belonging todifferent stages, normalized to fluorescence peak intensity. Sound spectrarepresent the mean of 12 measurements each in 16 samples, whereasthe spectrum from non-cavitated and cavitated caries lesions is the meanof 12 measurements in 10 samples.
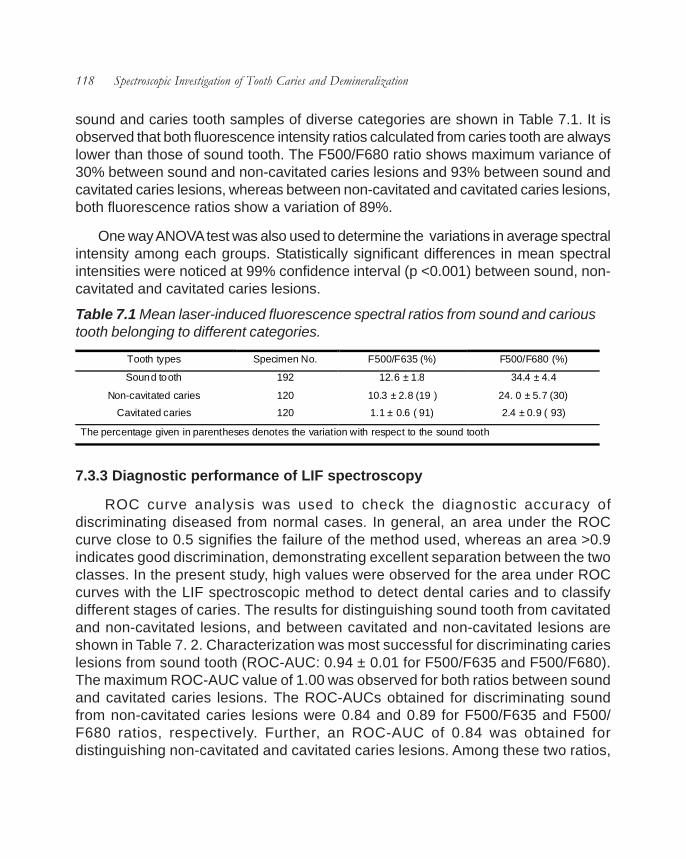
118 Spectroscopic Investigation of Tooth Caries and Demineralization
sound and caries tooth samples of diverse categories are shown in Table 7.1. It isobserved that both fluorescence intensity ratios calculated from caries tooth are alwayslower than those of sound tooth. The F500/F680 ratio shows maximum variance of30% between sound and non-cavitated caries lesions and 93% between sound andcavitated caries lesions, whereas between non-cavitated and cavitated caries lesions,both fluorescence ratios show a variation of 89%.
One way ANOVA test was also used to determine the variations in average spectralintensity among each groups. Statistically significant differences in mean spectralintensities were noticed at 99% confidence interval (p <0.001) between sound, non-cavitated and cavitated caries lesions.
7.3.3 Diagnostic performance of LIF spectroscopy
ROC curve analysis was used to check the diagnostic accuracy ofdiscriminating diseased from normal cases. In general, an area under the ROCcurve close to 0.5 signifies the failure of the method used, whereas an area >0.9indicates good discrimination, demonstrating excellent separation between the twoclasses. In the present study, high values were observed for the area under ROCcurves with the LIF spectroscopic method to detect dental caries and to classifydifferent stages of caries. The results for distinguishing sound tooth from cavitatedand non-cavitated lesions, and between cavitated and non-cavitated lesions areshown in Table 7. 2. Characterization was most successful for discriminating carieslesions from sound tooth (ROC-AUC: 0.94 ± 0.01 for F500/F635 and F500/F680).The maximum ROC-AUC value of 1.00 was observed for both ratios between soundand cavitated caries lesions. The ROC-AUCs obtained for discriminating soundfrom non-cavitated caries lesions were 0.84 and 0.89 for F500/F635 and F500/F680 ratios, respectively. Further, an ROC-AUC of 0.84 was obtained fordistinguishing non-cavitated and cavitated caries lesions. Among these two ratios,
Tooth types Specimen No. F500/F635 (%) F500/F680 (%)
Sound tooth 192 12.6 ± 1.8 34.4 ± 4.4
Non-cavitated caries 120 10.3 ± 2.8 (19 ) 24. 0 ± 5.7 (30)
Cavitated caries 120 1.1 ± 0.6 ( 91) 2.4 ± 0.9 ( 93)
The percentage given in parentheses denotes the variation with respect to the sound tooth
Table 7.1 Mean laser-induced fluorescence spectral ratios from sound and carioustooth belonging to different categories.

Characterization of Dental Caries by LIF Spectroscopy with 404 nm Excitation 119
the F500/F680 was more suited to discriminate all caries lesions from sound tooth(ROC-AUC: 0.94). These studies suggest that information on the stage of cariescould be extracted from autofluorescence characteristics of cavitated and non-cavitatedlesions.
7.4 DISCUSSION
Dental caries is a chronic, endemic disease. The chronic nature of the disease ismanifested in slow lesion progression, and this offers a window of opportunity forintervention, to reverse mineral loss or atleast arrest lesion progression, before thedevelopment of irreversible damage to the dental hard tissues. Most of the opticaltechniques are based on the differences in fluorescence between sound tooth enameland caries lesion.
In this study, significant variation was observed between the fluorescence spectraof sound tooth and that of different caries tooth (Fig. 7.1). The caries tooth alwaysexhibit lower fluorescence intensity than sound tooth. This could be attributed to thechanges in the fluorophore content and to the absorption and scattering properties ofthe caries layer. Normally, tooth enamel is composed of millions of prisms or rodswith waveguide properties that facilitate deep penetration when illuminated with light.In case of dental caries, the prism structure is damaged and the waveguide propertiesare lost so that the irradiated light cannot penetrate deeply. This leads to a reductionin the fluorescence intensity of caries lesion (Ando et al, 2001). Changes seen in thefluorescence spectrum could also be attributed to the changes in the physical structureand chemical composition during the disintegration of tooth enamel leading to cariesformation or due to the import of exogenous molecules during the caries process.This clearly supports the progressive rise of fluorescence spectral intensity in the redwavelength region during caries progression, with concomitant decrease in the

120 Spectroscopic Investigation of Tooth Caries and Demineralization
autofluorescence emission around 500 nm.
Another possible explanation for the changes in fluorescence lies with the variationin light scattering. When tooth is illuminated by blue light, it gets absorbed by thechromophores in the tooth. In dental caries, the light propagation directions are differentas compared to sound tooth so that more fluorescent photons are emitted in soundtooth than in caries lesion (Ando et al, 2001). Konig et al (1999) also observed thatcarious lesions exhibited slower fluorescence decay than intact sound tissue. Thelong-lived fluorophore present in carious lesions only emitted in the red spectral region.
With 404 nm laser excitation, a broad autofluorescence emission was observedaround 500 nm in sound tooth from natural enamel (Konig et al, 1998). Also emissionsat 635 and 680 nm from endogenous porphyrins, particularly protoporphyrin IX (PpIX),meso-porphyrin and coproporphrin in bacteria were observed (Hibst et al, 2001). PpIXconcentration is reported to be higher in Gram-negative oral bacteria and its levelincreases as the dental biofilm becomes more mature, which is responsible for thered fluorescence in teeth (Walsh and Shakibaie, 2007).
When excited with 366 nm UV light, caries tooth was shown to exhibit a brick redfluorescence, which is due to protoporphyrin production by the pigmented Bacteroidesspecies (Brazier, 1986; Konig et al, 1993; Bissonnette et al, 1998), and coproporphyrinproduction by Corynebacterium species and Candida albicans (Konig et al, 1993).With407 nm UV light, bacterial species such as Actinomyces odontolytics (found indentin carious lesions), Bacteroides intermedius, Prevotella intermedia,Corynebacterium species and Candida albicans emit fluorescence at 620-635 nmand 700nm, whereas Gram-positive Streptococcus mutans, Enterococcus faecalisand various lactobacilli showed weaker emissions in the red wavelength region.Thus the maturity of dental plaque, rather than the presence of cariogenic streptococci,forms the basis for red fluorescence when excited with near-UV or UV light. In summary,when dental plaque or calculus is present, there is an increase in absorption in theUV spectral region of 350-420 nm, with fluorescence emission in the red spectralregion of 590-650 nm (Borisova et al, 2006; Kuhnisch et al, 2003).
Significant differences in the fluorescence intensity ratios (F500/F635 and F500/F680) were observed during caries process. As compared to the mean fluorescencespectral intensity ratios of sound tooth given in Table 7.1, the caries tooth belonging todifferent stages has lower ratios. The F500/F680 ratio shows maximum sensitivityto distinguish early caries formation. Both the fluorescence intensity ratios used to
Characterization of Dental Caries by LIF Spectroscopy with 404 nm Excitation 121
classify the sound tooth from caries show very low independent Student t-test values,p<0.001.
Shi et al (2001) has reported a sensitivity of 94% and a specificity of 100% fordetecting smooth surface caries with the QLF method, but could achieve only a lowersensitivity (78-82%) for detecting occlusal caries using DIAGNOdent device (Shi etal, 2000). In this study, the in vitro diagnostic accuracy of DIAGNOdent measurementsin terms of area under the ROC curve was significantly higher (0.96) than that ofconventional radiography (0.66) (Shi et al, 2000). However, Lussi et al (2001) reporteda sensitivity of 92% for detecting occlusal caries using DIAGNOdent device ascompared to visual inspection and bite-wing radiography. In another study, Ferreira-Zandona et al (1998) observed a sensitivity of 49% and specificity of 67%, withROC value of 0.78, for detecting demineralization in occlusal pits and fissures.Further, Angnes et al (2005) observed that visual inspection was the most validmethod for caries diagnosis followed by laser-induced fluorescence, in terms ofROC-AUC, sensitivity and specificity. Using a 405 nm diode laser, Ribeiro et al(2005) reported significant differences in the spectral ratios of integrated fluorescencein the wavelength region between 480-500 nm and 620-640 nm for sound tooth andall smooth surface non-cavitated caries with p<0.001. However with the same laser,Zezell et al (2007) observed fluorescence from natural and cut surfaces of carieslesions to be nearly the same for shiny and dull lesion, but different for brownlesion (p<0.05).
Attrill and Ashley (2001) found that laser fluorescence was more accurate fordetecting occlusal caries as compared to visual examination and intraoralradiography. In another study by Olmez et al (2006) observed that for occlusalcaries detection, LIF shows higher sensitivity and specificity as compared to visualinspection and bitewing radiography. However, Burin et al (2005) assessed theefficiency of LIF, visual examination and bitewing radiography and found that visualinspection was as valid as LIF, which should be considered a better adjunct thanbitewing radiography for caries diagnosis.
This study shows comparatively better sensitivity in discriminating caries lesionsfrom sound tooth using LIF spectral signatures (mean ROC-AUC= 0.94 ±. 0.01).However, for detecting non-cavitated caries lesion (early enamel caries) the ROC-AUC was slightly lower at 0.87 (Table 7. 2).
Diagnostic algorithms based on the endogenous porphyrins produced by oralbacteria have been successfully brought out in this study. We have demonstrated
122 Spectroscopic Investigation of Tooth Caries and Demineralization
that by using the LIF spectral ratios, it is possible to characterize both lesion typesand more significantly, discriminate caries from sound tooth. Moreover, it confirmsthe previous result that sound and caries tooth can be discriminated through the useof LIF spectroscopy (Borisova et al, 2004; Ando et al, 2001; Subhash et al, 2005 andRibeiro et al, 2005).
7.5 CONCLUSIONS
Early diagnosis of caries lesion provides for more efficient remedy for cariesprogression, avoiding operative treatment. It appears that the information presentedby non-invasive LIF spectroscopy has the capability to successfully detect dentalcaries and to classify different stages of caries. Among the LIF ratios studied, F500/F680 ratio is found to be more suited to comprehend caries progression and also todiscriminate sound tooth from caries. It is observed that the fluorescence spectralsignatures vary with respect to the changes in endogenous fluorophores during toothcaries development and therefore allow accurate diagnosis of the stage of dentalcaries from LIF spectral intensity ratios. Further in vivo studies are necessary withLIF to test the efficacy of these ratios to diagnose caries in a clinical setting.

Chapter 8
Clinical Trial for Early Detection of Tooth Cariesusing Fluorescence Ratio Reference Standard


88.1 INTRODUCTION
Laser-induced fluorescence (LIF) has been increasingly used in recent years asa powerful tool for caries detection. The fluorescence detection technique may be analternative to the dental probe or radiographic examination. This chapter presents theclinical applicability of a diagnostic algorithms or fluorescence reference standards(FRS) based on LIF spectral ratios to discriminate different stages of caries and todetect early tooth caries. Towards this, LIF emission spectra were recorded in the400-800 nm spectral range on a miniature fiber-optic spectrometer in 105 patients,with excitation at 404 nm from a diode laser. The spectral results were correlatedwith visual-tactile and radiographic examinations. The LIF spectra of sound toothshows a broad emission at 500 nm that is characteristic of natural enamel whereasin carious tooth, additional peaks were seen at 635 and 680 nm, due to emissionfrom porphyrins present in oral bacteria. In order to discriminate different stages oftooth caries, FRS ratio scatter plots of the fluorescence intensity ratios F500/F635and F500/F680 were developed to differentiate sound from enamel caries, soundfrom dentinal caries and enamel caries from dentinal caries using spectral dataobtained from 65 carious sites and 25 sites of sound tooth in 65 patients. The sensitivity,specificity, PPV and NPV of the FRS to detect tooth caries are calculated andpresented. A blind-test was carried out in 40 patients at 15 sound and 40 carioussites to check the accuracy of the developed standard for early detection of toothcaries.
8.2 STUDY MATERIAL, PROTOCOL AND ETHICAL ISSUES
The study was conducted at the Department of Conservative Dentistry andEndodontics of the Government Dental College, Thiruvananthapuram, India. Ethicalapproval for the study was provided by the Institutional Ethical Committee of theGovernment Dental College, Thiruvananthapuram (IEC/C/01-A/2008/DCT). Allvolunteers were provided with patient information sheet and consent forms. Afterexplaining details of the study, consent form was endorsed by each patient prior tothe initiation of study.
A total of 105 patients, aged between 20 and 50 years, with clinically suspiciousincipient caries or radiographically proven tooth caries participated in the study. Anexperienced clinician identified the tooth for spectral measurement in each patientand recorded its visual-tactile findings. If clinical observation was positive, bitewingradiographs were taken. Thereafter, LIF measurements were carried out.

126 Spectroscopic Investigation of Tooth Caries and Demineralization
After positioning the patients inthe dental chair, visual-tactileexamination was performed, withthe aid of a light reflector, air/waterspray and dental mirror. The teethobserved as sound during clinicalexamination were included ascontrol in the study. Samplesstudied covered smooth surface aswell as occlusal caries. The studypopulation comprised of 40 sound(clear enamel-intact tooth surfaces),50 enamel (white spot, loss of lusterand rough) and 55 dentinal carieslesions (localized enamelbreakdown or cavitation in opaqueor discolored enamel exposing thedentin). Samples with any kind ofstaining, hypoplasia and fluorosiswere excluded.
Before initiation of measure-ments, the patients were asked towash their mouth with saline toreduce the effects of recentlyconsumed food. The oral cavity wasthen cleaned and the measurementsite dried with cotton- swab. The OOIBase32 software was configured torecord the spectra, averaged for 40scans, with boxcar width of 8 nmand an integration time of 50 ms. Dueto the diverse nature of the carieslesions, 15 sets of LIF measure-ments were taken from each of thecaries lesions and sound tooth of thesame patient for comparison, and the mean spectra of each site is determined for
Fig. 8.1a). Mean in vivo LIF spectra from sound and carieslesions belonging to different stages and b) LIF spectranormalized to maximum fluorescence emission intensity.Sound tooth spectra represent the mean of 15measurements each in 25 samples, whereas enamelcaries spectra is of 15 × 30 measurements and thedentinal caries spectra is of 15 × 35 measurements.

Clinical Trial for Early Detection of Tooth Caries using Fluorescence Ratio Reference Standard 127
further analysis. Depending upon the visual-tactile and radiographic results, eachtooth was classified as sound, enamel or dentinal caries by the clinician, who wasblinded to the spectral findings. ANOVA was performed to detect whether the averageLIF spectral intensity differed between each of these groups.
Fluorescence intensity ratios are then calculated from the recorded mean spectraand correlated with visual-tactile and radiographic findings. To account for the broadnature of the peaks and sample-to-sample variation in peak position due to changesin chemical composition and fluorophore content of the tooth, the mean LIF spectralintensity over an interval of ±10 nm at the emission peak was used to determine theLIF spectral ratios. In-order to discriminate sound from enamel caries, sound fromdentinal caries and enamel from dentinal caries, fluorescence reference standard(FRS) scatter plots of the respective intensity ratios (F500/F635 and F500/F680)were developed using the spectral data obtained from 65 carious sites (30 enamelcaries and 35 dentinal caries) and 25 sites of sound tooth in 65 patients. A blind-testwas carried out in 40 patients and the data obtained from 40 carious sites and 15sound sites were used to check the accuracy of the developed standard. Anindependent Student t-test was performed on the FRS ratios to discriminate differentstages of caries, and to determine the statistical significance of the developed methodfor early detection of dental caries.
8.3 RESULTS
8.3.1 LIF spectral features
Fig. 8.1a) shows the mean in vivo LIF spectra recorded from 25 sites of soundtooth, 30 sites of enamel caries and 35 dentinal caries lesions and Fig. 8.1b), thesame LIF spectra normalized to the peak emission intensity. The standard deviationis shown for the prominent peaks in the mean LIF spectra of sound and caries toothbelonging to various stages of decay. The overall fluorescence intensity of carieslesions were found lower than that of sound tooth. Nevertheless, the fluorescencespectral intensity in the red wavelength region was greater for caries lesions ascompared to sound tooth. The LIF spectrum of sound tooth shows a broad emissionaround 500 nm with a long tail extending towards the red wavelength, whereas, twoadditional peaks are seen at 635 and 680 nm in caries tooth. In advanced carieslesion, 500 nm band appears broadened and red-shifted by about 30 nm. The peaksat 635 and 680 nm are very prominent in advanced caries lesions. However, the 680nm peak appears broadened in incipient caries. The spectra shows a sharp rising

128 Spectroscopic Investigation of Tooth Caries and Demineralization
edge in the short wavelength side (400-450 nm), which is due to absorbance of the420 nm long-wavelength pass filter (Schott UG420) used for blocking the back-scattered laser light from entering the spectrometer.
One way ANOVA test was used to determine the average spectral intensity variationamong the 3 groups. Statistically significant differences in mean spectral intensities(p <0.001) were noticed between sound tooth, enamel caries and dentinal carieslesions.
8.3.2 LIF intensity ratios
Mean LIF spectral intensity ratios (F500/F635 and F500/F680) determined fromthe sound and caries tooth samples are listed in Table 8. 1. It was observed that boththe F500/F635 and F500/F680 ratios of caries tooth have values lower than those ofsound tooth. The F500/F680 ratio shows a maximum variation of 48% between soundand enamel caries and 82% between sound and dentinal caries, whereas betweenenamel and dentinal caries lesions, this ratio has a variation of 64%.
8.3.3 Discrimination using FRS ratio Scatter plots
A reference standard consisting of fluorescence spectral intensity ratio scatterplot was developed to facilitate discrimination between different types of caries. Fig.8.2 (a-b) shows the scatter plots of the FRS ratios F500/F635 and F500/F680 in 65patients, with their lesions diagnosed as enamel and dentinal caries, along with thecontrol data from 25 sites of sound teeth. The fluorescence intensity ratios (Table8.1) used in this classification has low independent Student t-test values of p<0.001.Cut-off lines were drawn between sound tooth and enamel caries, sound tooth and
Table 8.1 Mean LIF spectral ratios determined from in vivo LIFspectral data from sound and caries tooth.
Tooth Types Population (n) F500/F635 F500/F680
Sound 40 10.94±1.7 27.89±6.8
Enamel Caries 50 6.48±1.7 (41) 14.59±6.3 (48)
Dentinal Caries 55 2.59±1.4 (76) 5.16±3.4 (82)
The percentage given in parentheses shows the variation with respect to the sound tooth

Clinical Trial for Early Detection of Tooth Caries using Fluorescence Ratio Reference Standard 129
dentinal caries, enamel and dentinal caries data points, at values that correspond tothe average ratio values of the respective groups. For example, to differentiate thesound tooth from enamel caries, the cut off line was drawn at 8.69 (the mean ratio of
Fig. 8.2(a-b) FRS scatter plots of fluorescence intensity ratios a) F500/F635 and b) F500/F680 from 65 patients, diagnosed as enamel caries and dentinal caries along with theratios from 25 sound tooth.The solid symbols represent data points of FRS whereas thehollow symbols represent the results of blind test carried out in 40 patients.

130 Spectroscopic Investigation of Tooth Caries and Demineralization
the sound tooth and enamel caries lesion data points). The classification sensitivity,specificity, positive predictive value and negative predictive value for discriminatingeach category were calculated based on the cut- off values, by validation with visual-tactile and radiographic observation results.
For F500/F635 and F500/F680 ratios, by selecting a cut-off at the mean value ofsound tooth and dentinal caries values (6.87 and 16.67) respectively, a sensitivityand specificity of 100% were achieved for discriminating these categories, with apositive and negative predictive value of 1. In Fig.8.2a, by selecting 8.69 as the cut-off value in the F500/F635 scatter plot to discriminate sound tooth from enamel caries,a sensitivity and specificity of 87% and 100% respectively were obtained, with a positivepredictive value of 1 and negative predictive value of 0.86. In this study, only 4 out ofthe 30 enamel caries lesions were misclassified as sound. For discriminating enamelfrom dentinal caries, a sensitivity and specificity of 89% and 80% respectively, wereachieved for the same ratio by using 4.73 as the cut-off value, with a correspondingpositive predictive value of 0.84 and negative predictive value of 0.86. Here, only 4 outof 35 dentinal caries lesions were misclassified as enamel and 6 out of 30 enamelcaries lesions were misdiagnosed as dentinal caries. Furthermore, an overallsensitivity and specificity of 85% and 90% respectively, were achieved fordiscriminating sound tooth from enamel caries, whereas a sensitivity and specificityof 100% was obtained to discriminate sound tooth from dentinal caries. Table 8.2illustrates independent and overall sensitivity, specificity, PPV and NPV of FRS ratios,F500/F635 and F500/F680 for classifying different stages of tooth caries.
8.4 DISCUSSION
Until now visual inspection alone or its combination with radiography is consideredas the gold standard for caries detection. However, x-rays are ionizing and hazardousin nature and cannot detect caries until they are well advanced. Hence developmentof diagnostic algorithms or reference standards based on LIF spectral ratios wouldbe of great help for the real-time, non-invasive detection of tooth caries in the clinic.
8.4.1 LIF spectral features
The mean LIF spectra from sound and caries tooth shows characteristic featuresbased on the absorption and scattering properties of light by cariogenic substancesand fluorophores in the tooth. The reduction in the fluorescence intensity of the carieslesion could also be attributed to the changes in the physical structure and chemicalcomposition during the disintegration of tooth enamel leading to caries or due to the

Clinical Trial for Early Detection of Tooth Caries using Fluorescence Ratio Reference Standard 131
import of exogenous molecules during the caries process. This clearly supports theprogressive rise of fluorescence spectral intensity in the red wavelength region withcaries progression, and the consequent decrease in the autofluorescence emissionaround 500 nm.
Normally, tooth enamel is composed of millions of prisms or rods with waveguideproperties that facilitate deep penetration when illuminated with visible light. In thecase of dental caries, the prism structure is damaged and the waveguide propertiesare lost so that the irradiated light cannot penetrate deeply. This leads to a reductionin the fluorescence intensity in caries lesion (Ando et al, 2001).
The broad autofluorescence emission around 500 nm in sound tooth is due to theemission from natural enamel and dentin (Konig et al, 1998) and emissions observedat 635 and 680 nm are due to endogenous porphyrins and metalloporhyrins, inparticular protoporphyrin IX (PpIX), meso-porphyrin and copro-porphyrin synthesisedby bacteria (Konig et al, 1998; Hibst et al, 2001). PpIX concentration is reported to behigher in Gram-negative oral bacteria and its level increases as the dental biofilmbecomes more mature, which is responsible for the red fluorescence in teeth (Walshand Shakibaie, 2007). Pretty et al (2005) reported that the fluorescence due toporphyrins in certain oral plaque species, particularly Gram-negative anaerobes, ismore abundant in late than early plaque (Marsh and Martin, 1999). Similarly, Buchalla(2005) reported that caries lesions fluoresce at 624, 650 and 690 nm, as due toporphyrins, more efficiently when excited in the wavelength range between 400 and420 nm.
Konig et al (1993) observed that the autofluorescence emission in the red spectralregion of carious lesions with 407 nm krypton ion laser excitation, is caused by theoral microorganisms such as Prevotella intermedia, Actinomyces odontolytics,Corynebacterium species and Candida albicans, which are able to synthesise highlevels of endogenous metal-free fluorescent porphyrins. They also found that lacticacid bacteria, such as lactobacilli and streptococci, did not show typical porphyrinfluorescence in the red wavelength region. Thus the maturity of dental plaque, ratherthan the presence of cariogenic streptococci, is the basis for the red fluorescencewhen excited with near-UV light (Coulthwaite et al, 2006).
8.4.2 LIF intensity ratios
As compared to the mean fluorescence spectral intensity ratios of sound toothgiven in Table 8. 1, the caries tooth belonging to different categories has lower ratios.

132 Spectroscopic Investigation of Tooth Caries and Demineralization
Both LIF ratios showed 100% sensitivity and specificity for detecting dentinal caries(p<0.001). Nevertheless, by selecting suitable cut-off value, both FRS ratios coulddetect enamel caries with an average sensitivity of 85% and specificity of 90%.
8.4.3 Validation of FRS ratio
The best standard for validating detection accuracy in a clinical setting should beone that is derived from actual patient data. Blind-test for validation of FRS used datafrom 40 patients with the results correlated by clinical and radiographic findings(Fig.8.2a-c). The corresponding sensitivity, specificity, PPV and NPV for differentiatingdifferent stages of tooth caries are given in Table 8.2. It is found that both FRS ratiosdiscriminates sound tooth from enamel and dentinal caries with 100% sensitivity andspecificity. An overall sensitivity of 100% and specificity of 93% was achieved indiscriminating enamel from dentinal caries lesions with a positive predictive value of0.95 and negative predictive value of 1.00.
Validation of the diagnostic method usually takes place under clinical conditions, iffollow-up treatment is planned. Nevertheless, if no operative intervention is intended,validation of the results is difficult for want of proper gold standard. Visual inspection

Clinical Trial for Early Detection of Tooth Caries using Fluorescence Ratio Reference Standard 133
appears to have very low specificity and high sensitivity for detecting enamel cariesand the opposite is true for dentinal caries of primary and permanent teeth. Thisshows that changes in enamel are easily identified by visual examination, while severaldentinal caries might be covered up by mineralized enamel (Rodrigues et al, 2008;Valera et al, 2008; Ie and Verdonschot, 1994). Instead, visual inspection combinedwith radiography classified 82% of caries correctly (Bader et al, 2004). Recently in anin vitro study, Valera et al (2008) compared visual inspection, radiographic examinationand use of DIAGNOdent device as well as their combinations for occlusal cariesdetection and found that visual and radiographic examination resulted in a specificityof 99%, whereas visual inspection alone resulted in 100% specificity. Therefore, weused a combination of visual-tactile and radiographic examinations as the gold standardfor caries diagnosis in this study.
In a recent study, Alkurt et al (2008) reported LIF to be more reliable to assessactual lesion depth than visual inspection or bitewing radiography. Similarly, in a clinicalstudy with permanent and primary molar teeth, Costa et al (2007) observed that laserfluorescence measurements yielded results similar to visual examination. In anotherstudy, Huth et al (2008) reported that LIF shows good discrimination between soundand carious tooth with area under the curve (AUC) of 0.92 and 0.78 for discriminatingbetween enamel and dentin caries. Reis et al (2006) reported that no significantdifference was observed between LIF measurements and visual inspection underboth in vitro and in vivo conditions.
Attrill and Ashley (2001) compared LIF, visual examination and radiography andfound that LIF was the most precise method (sensitivity of 77-80%) for detection ofocclusal caries extending into dentine in extracted primary molars. In another study,Lussi, et al (2001) reported a sensitivity and specificity of 92% and 86%, respectivelyfor detecting occlusal dentin caries using DIAGNOdent device as compared to visualinspection and bite-wing radiography. When carious enamel was used as threshold,sensitivity was about 96%. Anttonen, et al (2003) observed a sensitivity of 92% andspecificity of 82% by selecting a cut-off point of 30 for occlusal caries detection inchildren. Similarly, the study conducted by Heinrich-Weltzien, et al (2005) revealedsensitivity values of 93%; however the specificity was lower (63%) when comparedto the other reports. In another study, Olmez et al (2006) reported that LIF has highersensitivity and specificity as compared to visual inspection and bitewing radiographyfor occlusal caries detection. However, Burin et al (2005) assessed the efficiency ofLIF, visual examination and bitewing radiography and found that visual inspectionwas as valid as LIF, which should be considered a better adjunct than bitewing

134 Spectroscopic Investigation of Tooth Caries and Demineralization
radiography for caries diagnosis.
In comparison, the results of this clinical study showed improvements indiscrimination between sound and carious tooth and between different stages of caries.It may be noted that both FRS ratios gave 100% sensitivity and specificity fordiscriminating sound tooth from enamel (incipient) caries and dentinal (advanced)caries. As regards differentiation of enamel caries from dentinal caries, the F500/F635 ratio showed 100% sensitivity and 90% specificity. Furthermore, the sensitivityand specificity shown in Table 8.2 for blind tests are also higher than the earlier reports(Lussi et al, 2001; Anttonen et al, 2003; Rodrigues et al, 2008; Huth et al, 2008; Angneset al, 2005).
The investigation shows that diagnostic algorithms based on fluorescence intensityratio of the emission peaks can localize and discriminate caries lesions from soundtooth. With the help of FRS threshold, the F500/F635 and F500/F680 ratio algorithmsclassified caries lesions from sound tooth with an average sensitivity and specificityof more than 90% with a positive predictive value of 0.96 and a negative predictivevalue of 0.92. This study relies on the assumption that the gold standard (a combinationof visual-tactile and radiographic examination) provides diagnosis with 100% ofsensitivity and specificity (i.e., 0% false-positives and false-negatives).
8.5 CONCLUSIONS
The blind-test results of this clinical study illustrate that information provided bynon-invasive LIF spectroscopy has excellent potential to detect dental caries in itsearly stage. The FRS ratio diagnostic algorithm based on tissue autofluorescencewas found to be sensitive and specific in discriminating different stages of tooth cariesand in detecting early changes in tooth enamel that lead to caries formation. Therefore,LIF spectroscopy could function as a tool to dentists for early detection of tooth caries,in particular those not visible to the eye, hidden under restorations and beneath theexposed enamel surfaces in a fast and sensitive manner. Both FRS ratios (F500/F635 and F500/F680) were found suitable to understand caries progression fromsound to enamel and dentinal caries with 100% sensitivity and specificity with PPV ofand NPV of 1.00. Our results confirm that classification of tooth caries fromfluorescence signatures, with 404 nm diode laser excitation allows precise visualisationand quantification of both the intrinsic green fluorescence of dental hard tissues aswell as the red fluorescence of bacterial origin. The potential of LIF spectroscopy todetect secondary caries has not been tested and would be interesting.

Chapter 9
Application of Curve-fitting to Diagnose DentalCaries in vivo


99.1 INTRODUCTION
This section discusses the advantage of analyzing the LIF spectra by curve-fittingfor distinguishing different stages of tooth caries. Towards this, LIF emission spectrawere recorded in the 400-800 nm spectral range on a miniature fiber-optic spectrometerfrom 105 patients, with excitation at 404 nm from a diode laser. The spectral resultswere correlated with visual-tactile examinations. It was noticed that caries tooth havelower fluorescence intensities as compared to sound tooth and the intensity decreaseswith the progression of caries. The LIF emission of sound tooth shows a broademission around 500 nm whereas two additional peaks are seen at 635 and 680 nmin carious tooth. In order to locate the exact peak positions of the constituent bandsand their relative contributions in the overall spectrum, LIF spectra were analyzed bycurve-fitting using Gaussian spectral functions. Thus, it was possible to determinethe variance in curve-fitting parameters such as peak center, Gaussian curve area,peak amplitude, FWHM and their ratios for different stages of tooth caries. Acomparative evaluation of these ratios with those derived from raw LIF spectral datawas made and the results are presented. Further, the diagnostic performance of LIFspectroscopy in a clinical setting was evaluated in terms of receiver operatingcharacteristic (ROC) curve.
9.2 STUDY MATERIAL, PROTOCOL AND DATA PROCESSING
The study population, ethicalissues and acquisitionparameters were mentionedearlier (Chapter 8). The recordedLIF spectra shows a sharp risingedge in the short wavelength side(400-450 nm), which is due to theusage of the 420 nm long-wavelength pass filter (SchottUG420) for blocking the back-scattered laser light from enteringthe spectrometer. In order tocorrect the influence of this filter,the recorded LIF spectra iscorrected using the spectraltransmittance of the filter in the 350-800 nm wavelength region (Fig.9.1). Fig. 9.2
Fig. 9.1 External transmittance curve of Schott filterUG420.

138 Spectroscopic Investigation of Tooth Caries and Demineralization
represents the in vivo LIF spectra recorded with the UG420 filter and the correctedfluorescence spectra of sound tooth.
The corrected LIF spectra were analyzed by curve-fitting using Gaussian spectralfunctions to determine the peak positions of the constituent bands and their relativecontribution in the overall spectrum using Origin software (details given in Chapter3). Various band intensity ratios were then determined from the constituent peakamplitudes and Gaussian curve areas and correlated with those derived from rawspectral data. An independent Student’s t-test was performed on the Gaussianamplitude and area ratios, F490/F635 and F490/F675, to assess the statisticalsignificance of the fluorescence ratios in discriminating different stages of tooth caries.
Fig. 9.2 Mean in vivo LIF spectra of a sound tooth and the corresponding filtertransmittance corrected spectra.

Application of Curve-fitting to Diagnose Dental Caries in vivo 139
The diagnostic performance achieved by curve-fitting was determined in terms ofROC curve. The resultant ROC curvedisplays variation in sensitivity andspecificity along the diagnostic range.The use of gold standard is aprerequisite for the assessment ofROC curve.
9.3 RESULTS
9.3.1 LIF spectral features
Fig. 9.3a) shows the corrected LIFspectra recorded from sound tooth,enamel caries and dentinal caries andFig. 9.3b) that after normalization to thepeak intensity. As compared to soundtooth, caries tooth exhibit lowerfluorescence intensity. The LIFspectrum of sound tooth consists of abroad auto-fluorescence around 500nm with a long tail extending towardsthe red region possibly due to anemission peak around 550 nm. But, incaries tooth, two additional peaks areseen at 635 and 680 nm. In addition,caries tooth exhibit an apparent redshift in the emission maxima.
9.3.2 Curve-fitting analysis
The mean LIF spectra from sound,enamel and dentinal caries tooth wereanalyzed by curve-fitting usingGaussian spectral functions. Fig. 9.4(a-c) shows the peak fitted spectrumand the constituent emission bands. Itwas seen that curve fitting of soundtooth with the help of three Gaussian
Fig.9.3. a) Mean corrected LIF spectra from soundand caries lesions belonging to different stages andb) normalized to maximum fluorescence intensity.Sound spectra represent the mean of 15measurements each in 40 samples, whereasenamel caries spectra is of 15 × 50 measurementsand the dentinal caries spectra is of 15 × 55measurements.

140 Spectroscopic Investigation of Tooth Caries and Demineralization
peaks gives a good fit (correlation coefficient r2 = 0.998). In the case of carious tooth,five Gaussian peaks were required to give a good fit of the mean LIF spectra. Table9.1 shows the peak position of the various bands, their Gaussian curve areas, fullwidth at half intensity maximum (FWHM) and the χ2 and r2 values of fitting. It is seenthat the 491.85 nm peak shifts towards the red region by 14 nm in enamel and 15 nmin dentinal caries. Further this peak appears broadened with a shoulder peak around513.21 nm, which shifts towards the red region by 19 nm to 532 in enamel caries andby 38 nm to 551.75 nm in dentinal caries. Another notable feature is the broadening ofthe 560 nm peak by 12 nm; with concurrent decrease in Gaussian curve area andpeak amplitude in dentinal caries. Besides, the 625.8 nm and 655.62 nm peaks seenin enamel caries shift towards the red region by 7.3 nm and 19.1 nm in dentinalcaries. For the 625.8 nm and 655.62 nm peaks seen in enamel caries, the curvefitted amplitude and area values show an increasing trend with increase in the stageof caries. During caries progression from enamel to dentinal stage, the increase inthe 625.8 nm peak amplitude and area is 60% and 20%, while the correspondingincrease in the 655.62 nm peak amplitude is 48% and 29%, respectively. However,for sake of simplicity these peaks will be designated as 490, 513, 560, 635 and 675nm peaks.
9.3.3 Curve-fitted and Raw LIF ratios
Table 9.2 shows the fluorescence ratios (F490/F635 and F490/F675) calculated
Tooth Peak Centre (nm)
FWHM (nm)
Area Amplitude χ2 r2
491.85 21.9 3058.1 111.42 513.21 66.618 47084 563.92
Sound tooth
561.37 108.35 30673 225.88
105.6
0.998
505.31 56.865 29481 413.66 532 17.758 744.31 33.442
563.13 56.669 15612 219.81 625.8 31.21 1923 49.162
Enamel caries
655.62 93.343 5316.1 45.442
19.8
0.999
507.19 58.331 14294 195.52 550.82 45.464 2019.1 35.434 573.15 85.074 12989 121.82 633.05 15.361 2382.8 123.77
Dentinal caries
674.67 67.785 7480.3 88.05
22.1 0.997
Table 9.1 Curve-fitted parameters of the mean in vivo LIF spectra from soundtooth, enamel caries and dentinal caries.

Application of Curve-fitting to Diagnose Dental Caries in vivo 141
from curve-fitted peak amplitudes, Gaussian curve areas and raw spectral data fordifferent stages of caries. The fluorescence intensity of the LIF spectra at the peakwavelength determined by curve-fitting was used to evaluate the raw fluorescenceintensity ratio. As compared to the ratios determined from raw spectral data, thefluorescence ratios calculated from Gaussian area curves and curve-fitted amplitudesshow increased variation with the extend of caries. For example, the raw LIF spectralratio F490/F635 involving the two main peaks, which has a variation of 60% betweenenamel and dentinal stage of caries, showed an enhanced variation of 81.2% whencurve-fitted peak amplitude values are used for determination of this ratio. Similarly,
Fig. 9.4(a-c) Curve-fitted LIF spectrum showing the constituent bands from (a) soundand (b) enamel and c) dentinal caries tooth. The dots on the LIF spectrum relate to thedata points, the solid line is the curve-fitted line and the dotted and dashed lines showthe constituent bands.

142 Spectroscopic Investigation of Tooth Caries and Demineralization
the curve-fitted amplitude and area F490/F675 ratios showed variances of 75.6%and 65.6% during caries progression from enamel to dentin as compared to 60%change noted in the raw F490/F675 ratio. Fig. 9.5(a-c) shows the fluorescence ratiosderived from curve-fitted spectral amplitude, curve-fitted spectral area and raw LIFspectral data for these two stages of caries.
9.3.4 Diagnostic performance of LIF spectroscopy
The ability of LIF spectroscopy to discriminate different types of caries lesionsfrom sound tooth can be assessed from the ROC curve, where the sensitivitiesare plotted against the 1-specificities as in Fig.9.6 a-c. In general, a value for the areaunder ROC curve close to 0.9 indicates good discrimination between the two classesstudied. The receiver-operator characteristic areas under the curve (ROC-AUCs)was 1.0 (p<0.001) for discriminating sound from dentinal caries and 0.97 fordistinguishing sound from enamel caries (Table 9.3). For the distinction betweenenamel and dentinal caries, the ROC-AUC was 0.86.
9.4 DISCUSSION
The broad autofluorescence peak around 500 nm in sound tooth is due to emissionfrom natural enamel, particularly hydroxyapatite (Alfano and Yao, 1981; Konig et al,1998) and emissions at 635 and 680 nm are from endogenous porphyrins, particularlyprotoporphyrin IX (PpIX), meso-porphyrin and copro-porphyrin in bacteria (Konig etal, 1998; Hibst et al, 2001 and Subhash et al, 2005).
The mean LIF spectra from sound and caries tooth shows characteristic featuresbased on the absorption and scattering properties of light by carious substances anddifferences in the content of fluorophores. As reported earlier (Ando et al, 2001; Borisovaet al, 2004 and Subhash et al, 2005), the caries tooth exhibits lower fluorescenceintensities than sound tooth. The reduction in the fluorescence intensity of the caries
Table 9.2 In vivo LIF ratios determined from Gaussian curve-fitted amplitude,area and raw spectral data.
Curve-fitted amplitude Curve-fitted area Raw LIF spectrum Ratios Enamel
caries Dentinal caries
Enamel caries
Dentinal caries
Enamel caries
Dentinal caries
F490/F635 8.41 1.58 15.33 5.99 5.19±0.3 2.04±0.2 F490/F675 9.1 2.22 5.55 1.91 11.59±1.08 4.61±0.9

Application of Curve-fitting to Diagnose Dental Caries in vivo 143
lesion could be attributed to the changes in the physical structure and chemicalcomposition during the disintegration of tooth enamel leading to caries or due to importof exogenous molecules during the caries process. This clearly supports theprogressive rise of the fluorescence spectralintensity in the red wavelength region anddecrease around 500 nm with the cariesprogression (Borisova et al, 2006). Moreover,porphyrin peaks that are prominent in cariestooth can also be used for discriminatedifferent stages of caries.
Further, by curve-fitting using Gaussianspectral functions, it was possible to resolvethe LIF spectra of sound tooth into threeconstituent peaks centered at 491.85, 513.21and 561.37 nm whereas two additional peakswere required, respectively at 625.8 and655.62 nm and at 633.05 and 674.67 nm inenamel and dentinal caries, to fit the spectraldata. Since the correlation coefficients ofcurve-fitting were very close to unity, and theresiduals of fitting were few and scattereduniformly over the fitted curve, it is to beassumed that the peak wavelength positionsidentified by the curve-fitting algorithm are fairlyaccurate. There are marked variations not onlyin the peak emission bands but also in thepeak amplitude, FWHM width, and theGaussian curve area during cariesdevelopment. The variation in peak position,intensity and FWHM width of the 490 nm bandis noteworthy. Therefore, shift in peak positionof the 490 nm peak between enamel anddentinal caries, and the appearance of the newpeak at 635 and 675 nm would be usefulindicators of the extent or stage of tooth caries.In comparison, in an earlier study using 337
Fig. 9.5 Fluorescence ratios derived froma) curve-fitted spectral amplitude, b)curve-fitted spectral area and c) raw LIFspectral data from different stages ofcaries lesions.

144 Spectroscopic Investigation of Tooth Caries and Demineralization
nm nitrogen laser, it was found that the curve-fitting of the sound tooth shows fourpeaks centered at 403.80, 434.20, 486.88, and 522.45 nm. Further, the 522 nm peakis seen red-shifted by 32 and 8 nm in dentin and pulp level caries. A new peak at636.78 nm was also seen in the case of pulp level caries (Subhash et al, 2005).
Significant differences in the Gaussian amplitude and area ratios (F490/F635 andF490/F675) were observed during caries progression (Table 9.2). As compared toratios derived from raw LIF spectra, marginal increase in sensitivities was seen withcurve-fitting. Among the various ratios, the curve-fitted Gaussian peak amplitude ratio,
Fig.9.6 Receiver operating characteristics curves (ROC) for discriminating differentstages of caries lesions using LIF spectroscopy a) the discrimination cut-offbetween sound and enamel caries, b) the discrimination cut-off between soundand dentinal caries and c) the discrimination cut-off between enamel and dentinalenamel and dentinal caries lesions.

Application of Curve-fitting to Diagnose Dental Caries in vivo 145
F490/F635 appears to be more suited to distinguish different stages of tooth caries.All these fluorescence intensity ratios used to classify the sound from caries toothhad a low independent Student t-test value, p<0.001. In contrast, in an earlier study,curve-fitted Gaussian area ratio F435/F525 was reported to be suitable fordiscrimination between different stages of tooth decay (Subhash et al, 2005). Using a405 nm diode laser excitation, Ribeiro et al (2005) also reported significant differencesin the spectral ratios of the integrated fluorescence in wavelength region between480-500 nm and 620-640 nm for sound tooth and all smooth surface non-cavitatedcaries (p<0.001).
Shi et al (2000) found that the in vitro diagnostic accuracy of DIAGNOdentmeasurements in terms of area under the ROC curve was significantly higher (0.96)than for conventional radiography (0.66). In an in vitro study, Ferreira-Zandona et al(1998) observed a sensitivity of 49% and specificity of 67% with ROC value of 0.78for detecting demineralization in occlusal pits and fissures. Angnes et al (2005)reported that that visual inspection was the most valid method for caries diagnosisfollowed by laser fluorescence in terms of ROC-AUC, sensitivity and specificity. In arecent study by Huth et al (2008) it was observed that the LF device’s discriminationperformance for different caries depths was moderate to good with AUC of 0.92 fordiscrimination between sound and carious tooth and 0.78 for discrimination betweenenamel and dentin caries. In another study, Olmez et al (2006) observed that LFshows higher sensitivity and specificity as compared to visual inspection and bitewingradiography for occlusal caries detection. However, Burin et al (2005) assessed theefficiency of LF, visual examination and bitewing radiography and found that visualinspection was as valid as LF device, which should be considered as a better adjunctthan bitewing radiography for caries diagnosis.
Table 9.3 Results of ROC analysis in the discrimination of enamel and dentinalcaries from sound tooth.
Receiver Operating Characteristics Curve Lesion Type AUC 95% CI p
Sound - Enamel caries 0.97 0.92-1.000 <0.001 Sound – Dentinal caries 1.0 1.0-1.0 <0.001 Enamel– Dentinal caries 0.86 0.75-0.96 <0.001
CI: Confidence Interval; p: Significance of difference to the diagonals; AUC: Area under the Curve

146 Spectroscopic Investigation of Tooth Caries and Demineralization
In comparison, the results of this in vivo study showed that the diagnosticperformance of LIF spectroscopy in discriminating different stages of caries can beimproved with curve-fitting using Gaussian spectral functions. Further, it was possibleto discriminate dentinal caries from sound tooth with an AUC of 1.0, while the AUC’swere 0.97 and 0.86, respectively for discrimination between enamel caries and soundtooth, and between enamel and dentinal caries.
The benefit of ROC analysis is that it displays the diagnostic performance moresystematically than sensitivity and specificity, which depends on the cut-off point.This analysis also provides an overall validity for the methods employed. From amathematical point of view, the ROC analysis gives a better picture, since it does notconsider any given threshold. However, in clinical practice, clinicians usually have toconsider a cut-off point at which the treatment options fall from non-invasive to invasiveapproach. Therefore, the sensitivity and specificity values are still valuable tools forcomparison of diagnostic methods.
9.5 CONCLUSIONS
LIF ratios showed significant changes depending on the nature and extent of cariesand the detection capability was enhanced when contributions from constituent bandsderived by curve-fitting of the LIF spectra using Gaussian spectral functions wereconsidered. Further, it can be presumed that LIF with excitation by a 404 nm diodelaser has the potential to diagnose different stages of caries. Studies have shownthat tooth decay or caries not only affect the fluorescence spectral intensities, butalso alter the spectral shape as evidenced by the appearance of new peaks, peakshifts, and variations in curve-fitted peak area, intensity and bandwidth. Moreover, theratios determined from curve-fitted spectral parameters showed better sensitivity totissue transformations as compared to the ratios derived from raw spectral data.Among the two ratios studied, F490/F635 ratio determined from curve fitted amplitudewas found to be more suited to understand caries progression and to discriminatesound from caries tooth. The LIF spectroscopy’s diagnostic performance for detectingand discriminating different stages of tooth caries as evidenced by ROC analysisindicates that it can be used as an adjunct tool in the diagnosis of dental caries.

Chapter 10
Diffuse Reflectance Spectroscopy for in vivoDetection of Caries


1010.1 INTRODUCTION
Diffuse reflectance (DR) spectral features in the ultraviolet–visible (UV–VIS)wavelength range, which depends on tissue absorption and scattering, reflects theintrinsic physiological and structural properties of lesion. As this technique uses whitelight illumination such as that of a tungsten-halogen lamp, it is cost-effective, andshows great potential to provide near real-time, non-destructive, and quantitativecharacterization of tooth caries. Therefore, a clinical trial was carried out to assessthe capability of DR spectroscopy for detecting tooth caries in vivo. This chapterpresents the results of the clinical trial conducted at the Government Dental College,Trivandrum in 24 patients. Diffuse reflectance reference standard (DRRS) scatterplots of the reflectance intensity ratios R500/R700, R600/R700 and R650/R700 wereused to differentiate sound from non-cavitated caries lesions. The sensitivity,specificity, PPV and NPV of the DRRS ratios in detecting tooth caries are calculatedand presented. Further, the diagnostic performance of DR spectroscopy in a clinicalsetting was evaluated in terms of receiver operating characteristic (ROC) curve.
10.2 STUDY MATERIAL AND PROTOCOL
24 patients, aged between 20 and 50 years with clinically suspected with non-cavitated caries were included in this study. An experienced clinician selects the toothlesion for spectral measurement in each patient and records its visual-tactile imprintas per the protocol described earlier (Chapter 8). The visual criteria included theabsence of any tooth discoloration whereas the tactile criteria are the smoothnessand hardness felt without a catch by dental probe during its passage over thesuspicious surface. The study population included 225 sites of sound (clear enamel-intact tooth surfaces), and 360 sites of non-cavitated caries lesions (white spot, dull,brown spot).
Ethical issues and acquisition parameters were as mentioned in Chapter 8. DRspectrum is recorded from selected sites on a miniature fiber-optic spectrometer,with white light illumination from the tungsten halogen lamp of the dental light (ConfidentDental Equipments Ltd, India, 20W) in the patient examination chair. The fiber-optichandpiece for DR light collection from lesion uses a 400 microns dia. optical fiber.DR intensity ratios are calculated from the recorded mean spectra by measurementof spectral intensities at 500, 600, 650 and 700 nm over an interval of ±10 nm. In-order to discriminate sound from non-cavitated caries lesions, diffuse reflectancereference standard (DRRS) ratio scatter plots of the DR intensity ratios R500/R700,

150 Spectroscopic Investigation of Tooth Caries and Demineralization
R600/R700 and R650/R700 weredeveloped using the spectral dataobtained from 24 patients. Anindependent Student t-test wasperformed on the DRRS ratios todiscriminate sound from caries tooth,and to determine the statisticalsignificance of the developed model fordetection of dental caries. Fordetermining the diagnostic accuraciesof DR incaries discrimination, ROCcurves of sensitivity versus 1-specificitywere plotted.
10.3 RESULTS
10.3.1 DR spectral features
Significant variation in the DRintensities was seen between soundand caries tooth. Fig.10.1a, b shows themean DR spectra recorded from soundand caries tooth and that afternormalization. As seen in Fig 10.1a theDR intensity of caries tooth is markedlylower than that of sound tooth. However,beyond 700 nm the spectral intensitydecreases further (spectra not shown).The standard deviation in the recordedspectra is shown at 500, 600 and 650nm wavelength positions in the meanDR spectra of sound and carieslesions. The DR spectrum shows abroad reflectance dip between 540 and580 nm, which might be due tohemoglobin absorption. The normalized spectrum shows a reduction in relativeintensity with caries formation in the spectral window below 600 nm whereas thetrend reverses beyond 625 nm. The reflectance intensity ratios (R500/R700, R600/
Fig.10. 1 Mean DR spectra recorded from (a) soundand caries tooth and (b) the DR spectra normalized tothe maximum intensity. Sound spectra represent themean of 15 measurements each in 15 samples,whereas non-cavitated caries lesions spectra are of15 × 24 measurements.

Diffuse Reflectance Spectroscopy for in vivo Detection of Caries 151
R700 and R650/R700) determined from the recorded mean spectra is presented inTable 10.1. Among these ratios, R600/R700 ratio shows the maximum decrease of93.1% from sound to non-cavitated caries lesions, while R650/R700 and R500/R700shows decreases of 46.2% and 10.8%, respectively.
10.3.2 Discrimination with DRRS ratio
The DR spectral ratio of caries tooth is always lower than that of sound tooth.Fig.10. 2 (a-c) shows the scatter plots of the DRRS ratios R500/R700, R600/ R700,and R650/R700 from 24 patients. Cut-off lines were drawn between sound and cariestooth at values that correspond to the average ratio values of the respective groups.The classification sensitivity and specificity for discriminating each group werecalculated based on the cut- off values, by confirmation with visual-tactile findings.The DR intensity ratios have shown a low independent Student t-test values of p<0.01.
For R500/R700 ratio, by selecting a cut-off at the mean of sound (0.43) andnon-cavitated caries (0.18) tooth, a sensitivity of 83% and specificity of 100% wereachieved for discrimination, with a positive predictive value of 1 and negativepredictive value of 0.79. In Fig.8.2b, by selecting 1.08 as the cut-off value todiscriminate sound tooth from caries lesions, a sensitivity and specificity of 92%and 100% were obtained, respectively for R600/R700 with a positive predictive valueof 1 and negative predictive value of 0.88. Among the study population, only 2 of the24 caries lesions were misclassified as sound. Table 10.2 illustrates independentand overall sensitivities, specificities, PPV and NPV of DRRS ratios, R500/R700,R600/ R700, and R650/R700 for tooth caries detection.
10.3.3 Caries Discrimination using ROC curve
ROC curves were plotted with sensitivitiy against 1-specificity to graphically
Table 10.1 Mean DR spectral ratios determined in vivo from soundand non-cavitated caries tooth.
DR ratios Sites (n) R500/R700 R600/R700 R650/R700
Sound 225 0.43±0.03 1.41±0.1 1.49±0.01
Caries 360 0.18±0.1 0.75±0.2 1.18±0.1

152 Spectroscopic Investigation of Tooth Caries and Demineralization
i l lustrate the capabil ity of DRspectroscopy for discriminating non-cavitated caries from sound tooth(Fig.8.3). The plot shows an AUC of0.95 (CI: 0.92 to 1.0), confirming thediagnostic ability of the DRspectroscopy to discriminate betweensound and non-cavitated caries lesions.
10.4 DISCUSSION
DR spectroscopy refers to thedetection of both the diffuse andspecular components of reflectance.We have explored the use of DRspectroscopy in the visible spectralrange for diagnosis of tooth caries. Aset of diffuse reflectance spectrabetween 400 and 700 nm measuredfrom sound and caries tooth wereanalyzed using DRRS ratio and ROCanalysis.
DR spectrum reflects theabsorption and scattering properties oftissue. The absorption coefficient isdirectly related to the concentration ofphysiologically relevant absorbers inthe tissue. Tissue absorption in thevisible spectral region is due to naturalabsorbers such as hemoglobin,bilirubin, melanin, and water. The
scattering coefficient reflects the size and density of scattering centers in tissue. Inthis in vivo study, we observed significant differences between the DR spectra ofsound and caries tooth. The spectrum of sound tooth is a combination of diffusedreflection from the enamel and dentine layers (Uzunov et al, 2003). With increase indemineralization, angular distribution of diffuse light is altered, which in turn reducesthe maximum DR intensity (Tuchin and Altshuler, 2007). If successful separation is
Fig. 10.2(a-c) DRRS developed from sound andcaries tooth of 24 patients for a) R500/R700, b) R600/R700 and c) R650/R700 ratios.
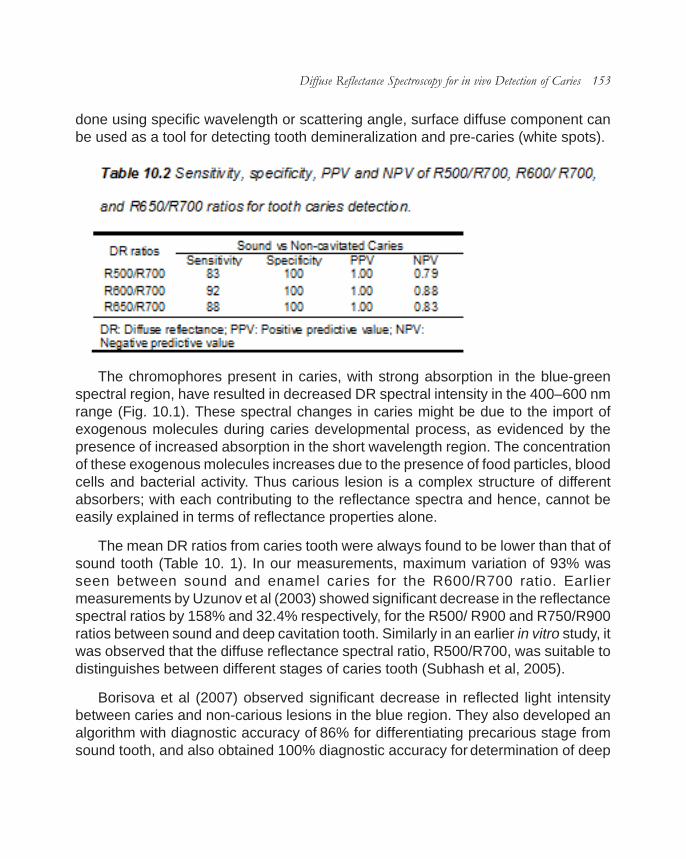
Diffuse Reflectance Spectroscopy for in vivo Detection of Caries 153
done using specific wavelength or scattering angle, surface diffuse component canbe used as a tool for detecting tooth demineralization and pre-caries (white spots).
The chromophores present in caries, with strong absorption in the blue-greenspectral region, have resulted in decreased DR spectral intensity in the 400–600 nmrange (Fig. 10.1). These spectral changes in caries might be due to the import ofexogenous molecules during caries developmental process, as evidenced by thepresence of increased absorption in the short wavelength region. The concentrationof these exogenous molecules increases due to the presence of food particles, bloodcells and bacterial activity. Thus carious lesion is a complex structure of differentabsorbers; with each contributing to the reflectance spectra and hence, cannot beeasily explained in terms of reflectance properties alone.
The mean DR ratios from caries tooth were always found to be lower than that ofsound tooth (Table 10. 1). In our measurements, maximum variation of 93% wasseen between sound and enamel caries for the R600/R700 ratio. Earliermeasurements by Uzunov et al (2003) showed significant decrease in the reflectancespectral ratios by 158% and 32.4% respectively, for the R500/ R900 and R750/R900ratios between sound and deep cavitation tooth. Similarly in an earlier in vitro study, itwas observed that the diffuse reflectance spectral ratio, R500/R700, was suitable todistinguishes between different stages of caries tooth (Subhash et al, 2005).
Borisova et al (2007) observed significant decrease in reflected light intensitybetween caries and non-carious lesions in the blue region. They also developed analgorithm with diagnostic accuracy of 86% for differentiating precarious stage fromsound tooth, and also obtained 100% diagnostic accuracy for determination of deep
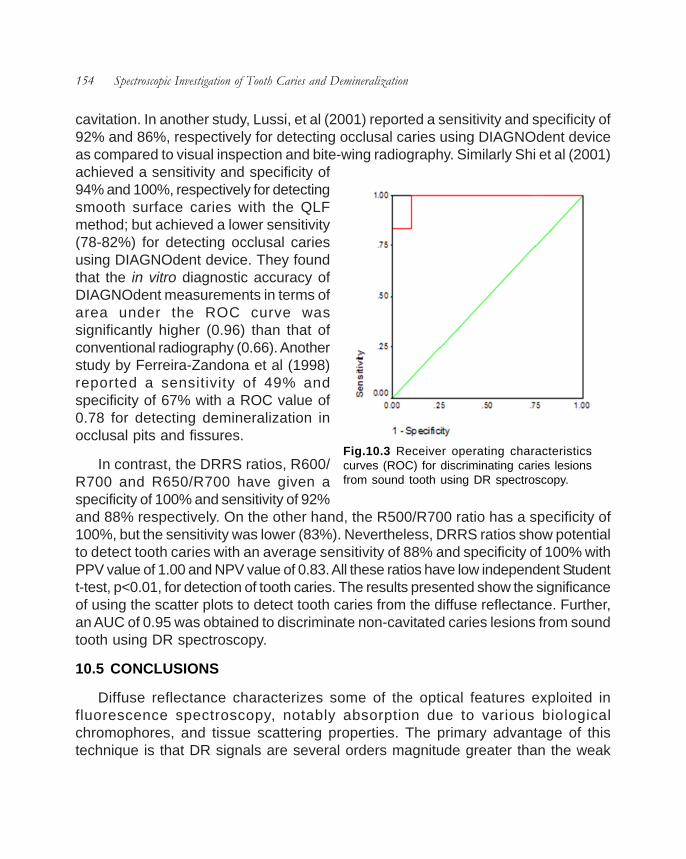
154 Spectroscopic Investigation of Tooth Caries and Demineralization
cavitation. In another study, Lussi, et al (2001) reported a sensitivity and specificity of92% and 86%, respectively for detecting occlusal caries using DIAGNOdent deviceas compared to visual inspection and bite-wing radiography. Similarly Shi et al (2001)achieved a sensitivity and specificity of94% and 100%, respectively for detectingsmooth surface caries with the QLFmethod; but achieved a lower sensitivity(78-82%) for detecting occlusal cariesusing DIAGNOdent device. They foundthat the in vitro diagnostic accuracy ofDIAGNOdent measurements in terms ofarea under the ROC curve wassignificantly higher (0.96) than that ofconventional radiography (0.66). Anotherstudy by Ferreira-Zandona et al (1998)reported a sensitivity of 49% andspecificity of 67% with a ROC value of0.78 for detecting demineralization inocclusal pits and fissures.
In contrast, the DRRS ratios, R600/R700 and R650/R700 have given aspecificity of 100% and sensitivity of 92%and 88% respectively. On the other hand, the R500/R700 ratio has a specificity of100%, but the sensitivity was lower (83%). Nevertheless, DRRS ratios show potentialto detect tooth caries with an average sensitivity of 88% and specificity of 100% withPPV value of 1.00 and NPV value of 0.83. All these ratios have low independent Studentt-test, p<0.01, for detection of tooth caries. The results presented show the significanceof using the scatter plots to detect tooth caries from the diffuse reflectance. Further,an AUC of 0.95 was obtained to discriminate non-cavitated caries lesions from soundtooth using DR spectroscopy.
10.5 CONCLUSIONS
Diffuse reflectance characterizes some of the optical features exploited influorescence spectroscopy, notably absorption due to various biologicalchromophores, and tissue scattering properties. The primary advantage of thistechnique is that DR signals are several orders magnitude greater than the weak
Fig.10.3 Receiver operating characteristicscurves (ROC) for discriminating caries lesionsfrom sound tooth using DR spectroscopy.

Diffuse Reflectance Spectroscopy for in vivo Detection of Caries 155
endogenous fluorescence of tissues. In addition, the present system uses the halogenlight of the patient examination chair enabling savings on cost. Therefore, if DRmeasurements are capable of discriminating sound and non-cavitated carious lesionsat comparable accuracies of fluorescence measurements, there would be aconsiderable increase in cost-effectiveness. On the basis of the results obtained inthe present study, the non-invasive DR spectroscopic technique appears to have thepotential for detecting tooth caries in vivo, but with comparatively lower sensitivitiesand specificities as compared to fluorescence techniques. Among the various ratiosstudied, R600/R700 ratio appears to be more suited. Nevertheless, the present studieswere able to discriminate sound from caries lesions with an overall sensitivity of 88%and specificity of 100% and a detailed trial to discern various types of cavitationsincluding incipient stages could prove its effectiveness in a clinical setting.


Chapter 11
Discussion and Conclusion


11This chapter reviews the entire study presented in this thesis and summarizes
the benefits of optical spectroscopic techniques and their limitations related to theearly detection of dental caries. A comparison of the diagnostic accuracies of the LIFand DR spectroscopic techniques to identify incipient changes in tooth enamel andto discriminate between tooth erosion and caries is also presented in this chapter. Anassessment of the future prospective of optical techniques in the field of dentistry isdescribed on the basis of the current work.
Dental caries is the most widespread oral disease in the world. In spite of ourimproved knowledge of the caries process and the availability of effective intervention,caries lesions still develop to the point where tooth structure is compromised andinvasive intervention and restoration are required. Appropriate diagnosis of cariouslesions at their earlier stages is a major factor in the prevention and management ofdental caries. It is also clear that reliable and detailed information about the extentand severity of existing caries will enhance the likelihood of a successful treatmentoutcome. However, visual examination alone is inadequate to detect early cariouslesions. Further, biochemical composition and/or structural changes associated withtooth caries disturb optical properties of dental hard tissues. Hence, optical diagnostictechniques appear to be a more suited for early diagnosis of tooth caries, which inturn improves disease management (Chapter 1).
Dental hard tissues are receptive to photonics based applications. When lightinteracts with tooth, it undergoes the processes of elastic scattering, absorption andfluorescence, before leaving the tooth surface. Dental caries is accompanied by thedecalcification of mineral components and dissolution of the organic matrix ofhydroxyapatite, which in turn affect the absorption and scattering properties of dentalhard tissues. Further, increased fluorescence seen in carious lesions is due toendogenous porphyrin production by several oral microorganisms. Therefore, generalinformation about the structure, biologic processes of tissue and physical propertiesof light will help to understand and control the outcome of its interaction with biologicalsystems for diagnostic purposes (Chapter 2).
Recent years have seen an increase in research activity directed towards thedevelopment of several diagnostic methods, particularly in the assessment of earlycaries lesions. Quite a few optical spectroscopy systems have been developed andare available for commercial purposes. This study uses a compact laser-inducedfluorescence and reflectance spectroscopy (LIFRS) system to non-invasively detectcaries formation and demineralization changes in tooth by point monitoring. The LIFRS

160 Spectroscopic Investigation of Tooth Caries and Demineralization
system consists of two light sources that could be switched for alternate recording offluorescence and diffuse reflectance spectra. The LIFRS system uses either nitrogen(337 nm) or a diode (404 nm) laser for the excitation of fluorescence and has atungsten halogen lamp for diffuse reflectance measurements. The light from either ofthese sources is coupled through optical fibres to the specimen under investigationthrough a fiber-optic hand-piece. The resultant LIF or DR spectra collected from thespecimen is recorded on a miniature fibre-optic spectrometer, connected to the USBport of the laptop computer (Chapter 3).
In the present study, the LIFRS system was used under both in vitro and in vivoconditions for detection and characterization of different stages of caries lesions.Before being tested in a clinical environment, extensive in vitro studies were carriedout on extracted tooth samples to test the applicability of LIFRS system for detectingdental caries. During in vitro studies, tooth autofluorescence was measured usingboth the 337 nm nitrogen laser and the 404 nm diode laser to identify the appropriateexcitation regimen in UV-visible range for caries diagnosis and data processingalgorithm were developed. Further, the potential of LIFRS system for detectingdemineralization and remineralization changes in tooth samples were evaluated.
LIF and diffuse reflectance (DR) signatures of sound/healthy and carious toothare of interest in caries detection. It was observed that carious lesions showed lowerfluorescence and DR intensities as compared to sound tooth. With excitation at 337nm,the LIF spectrum of sound tooth consists of two broad bands with maxima around490 and 440 nm, with a satellite peak at 405 nm. In pulp level caries an additionalpeak appears at 630 nm (Chapter 4). In addition, during caries progression, variationscan be seen in the fluorescence emission spectral shape with respect to the extentof caries. In order to determine the peak positions of the constituent bands and theirrelative contributions in the overall spectrum, the LIF spectrum was analyzed by acurve-fitting program using Gaussian spectral functions. The deconvoluted peakswere found centered at 403.80, 434.20, 486.88, and 522.45 nm in sound tooth. But, indentin and pulp level caries the 522 nm peak was seen red-shifted by 32 and 8 nm,respectively. The exact source for the appearance of this peak is not clear, but itcould be due to various factors like the presence of exogenous molecules/fluorophoresin the tooth or changes in chemical composition during the disintegration process orfrom bacteria metabolism products. With respect to detection accuracy, fluorescenceratios determined from curve-fitted amplitudes and Gaussian curve areas showedhigher contrast between different stages of caries or tooth decay as compared toraw LIF ratios. The ratios involving the 435 nm emission peak, such as F405/F435,

Discussion and Conclusion 161
F435/F525, and F435/F490, appeared more suitable for sighting the evolutionarychanges during caries formation.
With 404 nm excitation, the sound tooth shows only the 500 nm autofluorescencepeak, with a long tail extending towards the red region, whereas, two additional peaksare seen at 635 and 680 nm in the case of caries tooth (Chapter 7). Further, thefluorescence intensity of the 635 and 680 nm peaks increases with the extent ofcaries and could be used as a marker for discriminating different stages of carieslesions. The enhancement in these autofluorescence peak intensities in particular at635 nm, seen in the normalized LIF spectra was found to be most sensitive fordetection of early changes in tooth enamel and distinguishing different stages of toothdecay (Chapter 8). Further, by curve-fitting, LIF spectra from sound tooth were resolvedinto three constituent peaks centered at 491.85, 513.21 and 561.37 nm but twoadditional peaks were seen at 625.8 and 655.62 nm in enamel caries and at 633.05and 674.67 nm in dentinal caries (Chapter 9). In addition, Gaussian peak amplituderatio, F490/F635 was found to be more suited to distinguish between different stagesof tooth caries.
The potential of LIFRS system to detect early stages of dental erosion was tested.It was observed that both LIF and DR spectral intensity increases gradually with tootherosion. While examining sectioned slices of sound enamel and dentin, with curve-fitting carried out using Gaussian spectral functions, broad bands seen at 440 and490 nm in enamel were resolved into four peaks centered at 409.1, 438.1, 492.4 and523.1 nm, whereas in dentin the peaks were observed at 412.0, 440.1, 487.8 and523.4 nm. The transformation from the enamel layer to the dentin layer of tooth canbe visualized from the sudden increase/decrease in ratios. The fluorescence spectralratio, F410/F525, derived from curve-fitted Gaussian peak amplitudes and curve areaswere found to be more sensitive to erosion as compared to the DR spectral ratioR500/R700 and the raw LIF spectral ratio (Chapter 5). Likewise, the LIFRS systemwas used to detect early demineralization and remineralization changes in toothenamel. Both the LIF and DR spectral intensities show a decreasing trend duringcyclic de- and re-mineralization and this trend gets reversed during continuousremineralization. Curve-fitted parameters such as peak center, FWHM, Gaussianamplitude and curve area were found to vary with de/re-mineralization changes intooth enamel. Variations seen in Gaussian curve area and amplitude of thedeconvoluted peaks at 410 and 525 nm of LIF spectra were found to be more suitedfor detecting mineralization changes in tooth as compared to the raw LIF and DRspectral characteristics (Chapter 6).

162 Spectroscopic Investigation of Tooth Caries and Demineralization
Even though, analysis of LIF spectra by curve-fitting with Gaussian spectralfunctions increases the detection accuracy for caries diagnosis, it is a tedious andtime consuming process. Further, caries lesions reveal characteristic fluorescenceemission peaks within the red wavelength region, from porphyrin derivatives. Diodelaser excitation at 404 nm induces red fluorescence more effectively than 337 nmnitrogen laser excitation. Also, differences between the fluorescence intensity of soundand carious tooth were marked with excitation at 404 nm than at 337 nm.
Receiver operating characteristic (ROC) analysis was used to compare thediagnostic performance of 337 nm nitrogen laser and 404 nm diode laser excitationfor discrimination between different stages of dental caries using SPSS software(Version 10, SPSS Inc., Chicago, IL, USA) and the results are given in Table 11.1.Both techniques showed high area under the curve (AUC) for discriminating soundfrom non-cavitated and cavitated caries lesions. Further, the AUC obtained fordiscrimination between non-cavitated and cavitated caries lesions was good (0.82)with 404 nm excitation. As compared to 337 nm excitation, results obtained withexcitation at 404 nm were found to be more sensitive in discriminating different stagesof caries lesions.
During clinical trials, LIF and DR spectra were recorded from sound tooth andclinically or radiographically proven carious lesions belonging to different stages. Itmay also be noted that different stages of caries lesions were occasionally seen inthe same tooth. It was observed that the position of peaks in the LIF spectra of soundenamel region and sound tooth determined by curve-fitting are different. This could
Table 11.1 A comparison of 337 and 404 nm LIF in caries discrimination with ROC-AUC analysis.
LIF spectral intensity Receiver Operating Characteristics Curve
337 nm 404 nm Lesion Type
AUC 95% CI p AUC 95% CI p
Sound – Non-cavitated Caries 0.91 0.88-0.93 <0.001 0.86 0.83-0.89 <0.001
Sound – Cavitated Caries 0.96 0.91-1.0 <0.001 0.98 0.96-1.0 <0.001
Non-cavitated - Cavitated Caries
0.59 0.49-0.68 <0.001 0.82 0.79-0.85 <0.001
CI: Confidence Interval; p: Significance of difference to the Diagonals; AUC: Area under the Curve.

Discussion and Conclusion 163
be avoided by measuring sound enamel spectra from sound tooth, not from soundarea of caries affected tooth, as the laser beam can penetrate to the caries affectedlesions underneath and show the spectra of carious tooth. Further this will lead tofalse positive results with lower specificities.
The clinical trial were carried out in 105 patients at the Government Dental College,Trivandrum. Fluorescence reference standard (FRS) scatter plots were developedbased on spectral ratio F500/F635, F500/F680 to discriminate different stage of cariesfrom sound tooth. The FRS ratio scatter plots showed better sensitivity and specificityas compared to clinical and radiographic examination. Among these FRS ratios, theF500/F635 ratio appeared to be more suited for detecting early tooth caries. Also theblind-test conducted in a population of 40 patients confirmed the reliability of thedeveloped FRS ratio in discriminating different stages of caries lesions with 100%sensitivity and specificity (Chapter 8). However, the clinical trials were carried out inpatients who had already developed symptoms of caries such as pain and sensitivityto foods. Therefore the diagnostic accuraries achieved may not always be attaintablein random population. The advantage of using spectral ratios is that it eliminatessystemic errors due to changes in excitation energy/ light levels, detection systemconfiguration and spectral response.
The DR ratios were also used for detecting dental caries, both under in vitro andin vivo conditions (Chapter 4 & 10). Among the various ratios studied, R500/R700and R600/R700 ratios appear to be more suited for detecting tooth caries. The studiesconducted have shown that DR ratios have the ability to discriminate sound fromcarious lesions with a sensitivity of 88% and specificity of 100%. The major advantagesof this technique is that diffuse reflectance signals are several orders of magnitudegreater than the weak endogenous fluorescence signals of tooth and that one coulduse the inbuilt tungsten halogen lamp of the dentist’s examination chair to record theDR spectra. Therefore, if DR measurements were capable of discriminating soundfrom carious lesions at similar accuracies to that of fluorescence measurements,there would be a considerable increase in cost-effectiveness.
Many research groups have used optical techniques to detect dental caries, (Attrilland Ashley, 2001; Alwas-Danowska et al, 2002; Virajsilp et al, 2005; Reis et al, 2006;Alkurt et al, 2008), to discriminate between different stages of caries (Uzunov et al,2003; Borisova et al, 2007), to discriminate between tooth caries and demineralization,(Borisova et al, 2004), and to detect remineralization in carious lesions (Arends andGelhard, 1983; Fausto et al, 2003; Jones and Fried, 2006). Jone et al, 2006). An ideal

164 Spectroscopic Investigation of Tooth Caries and Demineralization
diagnostic method should offer high sensitivity and high specificity (Ekstrand et al,1997). The real challenge for a diagnostic method lies in its ability to identify carieslesions in its incipient stage. The efficiency of laser fluorescence for caries detection
Table 11.2 Comparative evaluation of the diagnostic accuracies of the presentstudy with the results obtained by different groups using optical spectroscopy forcaries detection.
Research Group Diagnostic Method Sites Sensitivity Specificity Hall et al, 1996 QLF Smooth surface, in vitro 0.75 0.90
Lussi et al, 1999 DIAGNOdent Permanent teeth, occlusal
surfaces, in vitro 0.76-0.84 0.79-0.87
Shi et al, 2001 QLF Smooth surface, in vitro 0.76 0.92
Shi et al, 2000 DIAGNOdent Permanent teeth, occlusal
surfaces, in vitro 0.78-0.82 1
Francescut and
Lussi, 2003 DIAGNOdent Permanent teeth, occlusal
surfaces, in vitro 0.73 0.65
Costa et al, 2002 DIAGNOdent Permanent teeth, occlusal surfaces, in vitro
0.79 0.89
Bamzahim et al, 2002
DIAGNOdent Permanent teeth, occlusal surfaces, in vitro
0.8 1
Lussi et al, 2001 DIAGNOdent Permanent teeth, occlusal surfaces, in vivo
0.92 0.86
Heinrich-Weltzien et al, 2002
DIAGNOdent Permanent teeth, occlusal surfaces, in vivo
0.93 0.63
Anttonen et al, 2003 DIAGNOdent Permanent teeth, occlusal surfaces, in vivo
0.92 0.69
Rocha et al, 2003 DIAGNOdent Deciduous teeth, occlusal surfaces, in vivo
0.73 0.95
Bamzahim et al, 2005
DIAGNOdent Secondary caries, in vivo 0.6 0.81
Huth et al, 2008 DIAGNOdent pen Permanent teeth, occlusal surfaces, in vivo
0.88 0.85
Rodrigues et al, 2008 DIAGNOdent Permanent teeth, proximal surfaces, in vivo
0.89 0.82
Rodrigues et al, 2008 DIAGNOdent Permanent teeth, occlusal surfaces, in vitro
0.2-0.69 0.72-0.94
Angnes et al, 2005 DIAGNOdent Permanent teeth, occlusal surfaces, in vivo
0.81 0.54
Present study (Chapter 8)
LIF spectroscopy, fluorescence reference
standard (FRS) ratio scatter plots
Permanent teeth, in vivo
1 1
Present study (Chapter 10)
DR spectroscopy, DR spectral ratio
scatter plots
Permanent teeth, in vivo
0.88
1

Discussion and Conclusion 165
was investigated and compared with conventional methods. Some of these diagnosticmodalities show promising results to discriminate sound from caries lesions withgood enough sensitivity and specificity. Table 11.2 gives a comparison of the diagnosticaccuracies of the LIF and DR spectroscopic studies presented in this thesis with theresults obtained by other research groups for caries detection, both in vitro and invivo.
The diagnostic performances of LIF and DR spectroscopy for caries detectionwere evaluated in terms of the area under ROC curve, sensitivity and specificity. Forboth LIF and DR spectroscopy, detection of caries lesions was successful with ROC-AUC values between 0.93 and 0.98. Sensitivity, specificity and AUC (Az) obtained forLIF ratios F500/F635 and F500/F680 (Chapter 8) and DR ratios R500/R700, R600/R700 and R650/R700 (Chapter 10) to detect caries lesions are shown in Table 11.3.In general, an area under the ROC curve >0.9 indicates good classification betweenthe two classes. Moreover, AUC obtained using LIF ratios F500/F635 wer 0.98, whilefor F500/F680 it was 0.97. In comparison, the DR ratio R600/R700 gave an AUCvalue of 0.97 to discriminate sound from carious lesions. But the sensitivity washigher than that of DRS or detecting caries with LIF. Nonetheless, the results ofstatistical analysis evaluating the diagnostic performance showed LIF-FRS ratio as abetter diagnostic parameter as compared to DRRS ratio.
The advantage of ROC analysis is that it demonstrates the diagnostic performancemore methodically than sensitivity and specificity, which are determined by only onecut-off point. This analysis also provides an overall validity of the methods employed.Therefore from a mathematical point of view, the ROC analysis is the best one athoughit does not consider any given threshold. However, in clinical practice clinicians usuallyhave to consider a cut-off point in which the treatment options falls from non-invasive
Table 11.3 Comparison of LIFS and DRS in diagnosing dentalcaries in terms of sensitivity, specificity and area under the ROCcurve (Az).
Methodology Sensitivity Specificity ROC-AUC (Az)
LIFS F500/F635 100 100 0.98 F500/F680 100 100 0.97
DRS R500/R700 83 100 0.93 R600/R700 92 100 0.97 R650/R700 88 100 0.94
166 Spectroscopic Investigation of Tooth Caries and Demineralization
to invasive approach and this makes sensitivity and specificity values of the diagnosticmethod is still valuable.
The advantages of using a diode laser at 404 nm as against other lasers at longeremission such as argon ion laser (488 nm) or diode laser (655 nm), for obtainingcaries sensitive fluorescence signatures have been clearly brought out. The majordisadvantage of DIAGNOdent is the unsuitability of the 655 nm laser emission of thisdevice for excitation of the chemical constituents of teeth like the protoporphyrin, orthe altered tooth substances and bacterial metabolism products that cause toothdecay. It may further be noted that fluorescence of caries lesions is due to changes inorganic content of the lesion rather than mineral loss. Further, the use of a diodelaser emitting at 404 nm which matches with the absorption band of PpIX, confirmsthe enhanced capability and accuracy for LIF spectroscopy to detect different stagesof caries lesions. Moreover, this facilitates visualisation and quantification of both theintrinsic green fluorescence and red fluorescence of bacterial origin from dentaltissues.
Our studies have shown that the developed LIFRS system has the potential tomeasure autofluorescence and diffuse reflectance spectra from tooth and can beused as a suitable tool for non-invasive and real time diagnosis of dental caries. TFurthermore, thes techniques could also be a useful to detect dental erosion and tomonitor de- and re-mineralization changes in tooth. If properly used and correctlyinterpreted, this device would improve caries detection and diagnosis and therefore,the selection of proper restorative intervention. However, for optimal application of thetechnique, tooth surface should be properly cleaned before measurement becausethe spectra could be influenced by the plaque, calculus and stains. Further, the probetip should be kept in close contact with tooth surfaces in order to reduce stray lightfrom entering the detection system. In conclusion, studies with the LIFRS systemhas shown that it has the potential to be further developed into a cost effective portablesystem for clinical use in view of the recent developments of low cost LED’s emittingin the near UV region.
Besides, more clinical studies based on relatively larger samples need to be carriedout to detect caries lesions present in pits and fissures and around restoration.Because, secondary caries occur as a result of restoration failure and detection byconventional methods is oftendifficult. In addition, there is little information about theuse of optical techniques in tooth with enamel hypoplasia, fluorosis or discoloration,which might influence the fluorescence spectral intensity. Therefore, more researchis required in this direction, as well.

References 167
References
1. Albin S, Byvik CE, Buoncristani AM. Laser induced fluorescence of dental caries,In Laser Surgery: Characterization and Therapeutics 1988; SPIE vol. 907: 96-99.
2. Alfano RR, Yao SS. Human teeth with and without dental caries studied by visibleluminescent spectroscopy. J Dent Res 1981; 54: 67.
3. Alexander H. Device for identifying caries, plaque, bacterial infection, concretions,tartar and other fluorescent substances on teeth. US Patent 6,561,802. May 13,2003.
4. Aljehani A, Bamzahim M, Yousif MA, Shi XQ. In vivo reliability of an infraredfluorescence method for quantification of carious lesions in orthodontic patients.Oral Health and Preventive Dentistry 2006; 4: 145-150.
5. Aljehani A, Yang LF, Shi XQ. In vitro quantification of smooth surface caries withDIAGNOdent and the DIAGNOdent pen. Acta Odontol Scand 2007; 65: 60-63.
6. Al-Khateeb S, Ten Cate JM, Angmar-Mansson B, de Josselin De Jong E,Sundstrom G, Exterkate RAM , Oliveby A. Quantification of formation andremineralization of artificial enamel lesions with a new portable fluorescencedevice. Adv Dent Res. 1997a; 11: 502-506.
7. Al-Khateeb S, Oliveby A, de Josselin De Jong E, Angmar-Mansson B. Laserfluorescence quantification of remineralization in situ of incipient enamel lesions:influence of fluoride supplements. Caries Res. 1997b; 31: 132-140.
8. Al-Khateeb S, Forsberg C, de Josselin de Jong E, Angmar-Mansson B. Alongitudinal laser fluorescence study of white spot lesions in orthodontic patients.Am J Orthod Dentofac Orthop 1998; 113: 595-602.
9. Alkurt MT, Peker I, Arisu HD, Bala O, Altunkaynak B. In vivo comparison of laserfluorescence measurements with conventional methods for occlusal cariesdetection. Lasers Med Sci 2008; 23: 307-312.
10. Alwas-Danowska HM, Plasschaert AJM, Suliborski S, Verdonschot EH. Reliabilityand validity issues of laser fluorescence measurements in occlusal cariesdiagnosis. J Dent 2002; 30:129–134.

168 Spectroscopic Investigation of Tooth Caries and Demineralization
11. Anderson P, Elliott JC. Rates of mineral loss in human enamel during in-vitrodemineralization perpendicular and parallel to the natural surface. CariesResearch 2000; 34: 33-40.
12. Ando M, Eggertsson H, Isaacs R, Analoui M, Stookey G. Comparative studies ofseveral methods for the early detection of fissure lesions. In Early detection ofdental caries II, eds. Stookey GK. Indianapolis: Indiana University, School ofdentistry 2000; 279-299.
13. Ando M, van der Veen MH, Schemehorn BR, Stookey GK. Comparative study toquantify demineralized enamel in deciduous and permanent teeth using laser-and light- induced fluorescence techniques. Caries Res. 2001; 35: 464-470.
14. Angmar-Mansson B, ten Bosch JJ. Advances in methods for diagnosing coronalcaries: A review. Adv Dent Res. 1993; 7: 70-79.
15. Angnes V, Angnes G, Batisttella M, Grande RHM, Loguercio AD. Clinicaleffectiveness of laser fluorescence, visual inspection and radiography in thedetection of occlusal caries. Caries Res 2005; 39: 490-495.
16. Anttonen V, Seppa L, Hausen H. Clinical study of the use of the laser fluorescencedevice DIAGNOdent for detection of occlusal caries in children. Caries Res 2003;37: 17-23.
17. Arcoria C, Miserendino LJ. In Laser in Dentistry, Eds. Miserendino LJ and PickRM, Quintessence Publ. Co, Inc, Chicago, et al., 1995; 76.
18. Arends J, ten Cate JM. Tooth enamel remineralization. J Cryst Growth. 1981; 53:135-147.
19. Arends J, Gelhard T. In Demineralization and Remineralization of the teeth. Eds.,Leach S and Edgar W, IRL Press, Oxford, UK, 1983; 1-16.
20. Arends J, Ruben JL, Inaba D. Major topics in quantitative microradiography ofenamel and dentin: R parameter, mineral distribution visualization, and hyper-remineralization. Adv. Dent. Res. 1997; 11: 403–414.
21. Ashley PF, Blinkhorn AS, Davies RM. Occlusal caries diagnosis: An invitrohistological validation of the electronic caries monitor [ECM] and other methods.J Dent 1998; 26(2): 83-88.
22. Altshuler GB, Erofeev AV. In Laser in Dentistry, Eds. Miserendino LJ and PickRM, Quintessence Publ. Co, Inc, Chicago, et al., 1995; 283.
References 169
23. Altshuler GB. J. Optical model of the tissues of the human tooth. J Opt Technol1995; 62: 516-520.
24. Altshuler GB, Grisimov VN, Ermolaev VS, Vityaz IV. Human tooth as an opticaldevice. SPIE Proc Holography Interferometry Opt Pattern Recognition Biomed1991; 1429: 95-104.
25. Altshuler GB, Grisimov VN. Effect of waveguide light propogation in human tooth.Dokl Acad Sci USSR 1990: 3: 1245-1248.
26. Attrill DC, Ashley PF. Occlusal caries detection in primary teeth: a comparison ofDIAGNOdent with conventional methods. Br. Dent. J. 2001; 190: 440-443.
27. Avery JK and Chiego, Jr DJ. In Essentials of Oral Histology and Embryology: AClinical Approach. Mosby, Canada, 2006.
28. Bader JD, Shugars DA. A systematic review of the performance of a laserfluorescence device for detecting caries. J Am Dent Assoc 2004; 135: 1413-1426.
29. Balooch M, Demos SG, Kinney JH, Marshall GW, Balooch G, Marshall SJ. Localmechanical and optical properties of healthy and transparent root dentin. J MaterSci Mater Med 2001; 12: 507-514.
30. Bamzahim M, Shi XQ, Angmar-Mansson B. Occlusal caries detection andquantification by DIAGNOdent and Electronic Caries Monitor: in vitro comparison.Acta Odontol Scand 2002; 60: 360-364.
31. Bamzahim M, Shi XQ, Angmar-Mansson B. Secondary caries detection byDIAGNOdent and radiography: a comparative in vitro study. Acta Odontol Scand2004; 62: 61-64.
32. Bamzahim M, Aljehani A, Shi XQ. Clinical performance of DIAGNOdent fordetection of secondary carious lesion. Acta Odontol Scand 2005; 63: 26-30.
33. Barnes CM. Dental hygiene participation in managing incipient and hidden caries.Dent Clin N Am 2005; 49: 795-813.
34. Bath-Balogh, M and Fehrenbach, MJ, In Dental Embryology, Histology, andAnatomy. Philadelphia, PA: WB Saunders, 2006.
35. Baysan A. In Minimally Invasive Dentistry: The management of caries, Eds. WilsonNHF, Quintessence Publ. Co, Ltd, London, et al., 2007; 29-33.

170 Spectroscopic Investigation of Tooth Caries and Demineralization
36. Bhaskar SN. In Orban’s oral histology and embryology, Tenth Edition, Mosby,2000.
37. Bissonnette R, Zeng H, McLean DI, Schreiber WE, Roscoe DL, Lui H: Psoriaticplaques exhibit red autofluorescence that is due to protoporphyrin IX. J InvestDermatol 1998; 111: 586– 590.
38. Bjelkhagen H, Sundstrom , Angmar-Mansson B. Early detection of enamel cariesby luminescence exited by visible laser light. Swed Dent J 1982; 6: 1-7.
39. Booij M, ten Bosch JJ. A fluorescent compound in bovine dental enamel matrixcompared with synthetic dityrosine. Archs Oral Biol 1982; 27: 417-421.
40. Borisova EG, Uzunov TT, Avramov LA. Early differentiation between caries andtooth demineralization using laser-induced autofluorescence spectroscopy.Lasers Surg Med 2004; 34: 249-253.
41. Borisova E, Uzunov T, Avramov L. Laser-induced autofluorescence study of cariesmodel in vitro. Lasers Med Sci 2006; 21(1): 34-41.
42. Borisova E, Uzunov T, Valkanov S, Avramov L. Light diffuse reflectance for detectionand differentiation of teeth caries lesions. SPIE Proc. 2007; 6535.
43. Boulnois JL. Photophysical processes in recent medical laser developments: Areview, Lasers Med Sci 1986; 1: 47-66.
44. Brazier J: A note on ultra-violet red fluorescence of anaerobic bacteria in vitro. JAppl Bacteriol 1986; 60: 121–126.
45. Buchalla W. Comparative fluorescence spectroscopy shows differences innoncavitated enamel lesions. Caries Res 2005; 39: 150-156.
46. Bulher CM, Ngaotheppitak P, Fried D. Imaging of occlusal dental caries (decay)with near-IR light at 1310 nm. Optics Exp. 2005; 13: 573-582.
47. Burin C, Burin C, Loguercio AD, Grande RH, Reis A. Occlusal caries detection: acomparison of a laser fluorescence system and conventional methods. PediatrDent 2005; 27:307–312.
48. Chance B, Cohen P, Jobsis F, Schoener B. Intracellular oxidation-reduction statesin vivo, Science 1962; 137: 499-508.
49. Costa AM, Yamaguti PM, De Paula LM, Bezzerra AC. In vitro study of laser diode655 nm diagnosis of occlusal caries. ASDC J Dent Child 2002; 69: 249-253.

References 171
50. Costa AM, Bezzerra AC, Fuks AB. Assessment of the accuracy of visualexamination, bite-wing radiographs and DIAGNOdent on the diagnosis of occlusalcaries. European Archives of Paediatric Dentistry 2007; 8: 118–122.
51. Coulthwaite L, Pretty IA, Smith PW, Higham SM, Verran J. The microbiologicalorigin of fluorescence observed in plaque on dentures during QLF analysis. CariesRes 2006; 40: 112-116.
52. Creanor SL, Russell JL, Strang DM, Stephen KW, Burchell CK. The prevalenceof clinically undetected occlusal dentine caries in Scottish adolescents. Br DentJ 1990; 169: 126-129.
53. Darling C, Huynh G, Fried D. Light scattering properties of natural and artificiallydemineralized dental enamel at 1310-nm. J Biomed Opt. 2006; 11(3): 034023(1-11).
54. Dawes C. What is the critical pH and why does a tooth dissolve in acid?. J CanDent Assoc. 2003; 69: 722 - 724.
55. Dederich DN. Laser tissue interaction. Alpha Omegan 1991; 84: 33-36.
56. De Josselin de Jong E, Sundstrom F, Westerling H, Tranaeus S, ten Bosch JJ,Angmar-Mansson B. A new method for in vivo quantification of changes in initialenamel caries with laser fluorescence. Caries Res. 1995; 29(1): 2-7.
57. Drakaki E, Borisova E, Makropoulou M, Avramov L, Serafetinides AA, Angelov I.Laser-induced autofluorescence studies of animal skin used in modelling of humancutaneous tissue spectroscopic measurements. Skin research and technology2007; 1-10.
58. Eibofner E, Klotz M, Lussi A, Bareiss M. Method and device for determination ofcaries in teeth. US Patent 6,102,704. August 15, 2000.
59. Eisenberg J. Phenomena observed by subjecting dental tissues to ultra-violetrays corresponding to approximately 3590AU. Dent Cosmos 1933; 5: 284.
60. Ekstrand KR, Ricketts DN, Kidd EA. Reproducibility and accuracy of threemethods for assessment of demineralization depth of the occlusal surface: an invitro examination. Caries Res 1997; 31: 224–231.
61. Ekstrand KR, Ricketts DN, Kidd EAM. Occlusal caries: pathology, diagnosis andlogical management. Dent Update 2001; 28: 380–387.
62. Ekstrand KR. Improving clinical visual detection- potential for caries clinical trials.J. Dent. Res. 2004; 83: C67-71.
172 Spectroscopic Investigation of Tooth Caries and Demineralization
63. Elderton RJ. Longitudinal study of dental treatment in the General Dental servicein Scotland. Br Dent J 1983; 155: 91–96.
64. Emami Z, Al-Khateeb S, de Josselin de Jong E, Sundstrom F, Trollsas K, Angmar-Mansson B. Mineral loss in incipient caries lesions quantified with laserfluorescence and longitudinal microradiography: A methodologic study. ActaOdontol Scand. 1996; 54: 8-13.
65. Farrell TJ, Patterson MS, Wilson B. A diffusion theory model of spatially resolved,steady-state diffuse reflectance for the non-invasive determination of tissue opticalproperties in vivo. Med Phys 1992; 19: 879-888.
66. Fausto MM, Jose N, Danilo AD. Evaluation of the effectiveness of laserfluorescence in monitoring in vitro remineralization of incipient caries lesions inprimary teeth. Caries Res. 2003; 37: 442-444.
67. Featherstone JDB, O’Reilly MM, Shariati M, Brugler S. In Factors relating todemineralization and remineralization of the teeth, S. A. Leach, Ed., IRL Press,Oxford, UK, 1986.
68. Featherstone JD. The caries balance: the basis for caries management by riskassessment. Oral Health Prev Dent 2004; 2: 259-264.
69. Fejerskov O. Concepts of dental caries and their consequences for understandingthe disease. Community Dent oral Epidemiol 1997; 25: 5-12.
70. Ferreira Zandona AG, Analoui M, Beiswanger BB, Isaacs R, Kafrawy A, Eckert G,Stookey G. An in vitro comparison between laser fluorescence and visualexamination for detection of demineralization in occlusal pits and fissures. CariesRes 1998; 32: 210-218.
71. Ferreira Zandona AG, Isaacs R, Van der Veen MH, Stookey G. Indiana pilot clinicalstudy of quantitative light fluorescence. In Early detection of dental caries II, eds.Stookey GK. Indianapolis: Indiana University, School of dentistry 2000; 219-230.
72. Francescut P, Lussi A. Correlation between fissure discoloration, DIAGNOdentmeasurements and caries depth: an in vitro study. Pediatr Dent 2003; 25: 559-564.
73. Fried D, Glena RE, Featherstone JDB, Seka W. Nature of light scattering in dentalenamel and dentin at visible and near-infrared wavelengths. Appl Opt 1995; 34:1278-1285.

References 173
74. Fried D. In Biomedical Photonics Handbook, Ed. Tuan Vo-Dinh, CRC Press,Boca Raton, 2003; 50-51.
75. Fujimoto D, Akiba K, Nakamura N. Isolation and characterization of a fluorescentmaterial in bovine Achilles tendon collagen. Biochem Biophys Res Comm. 1977;76: 1124-1129.
76. Gillenwater A, Jacob R, Richards-Kortum R. Fluorescence spectroscopy: Atechnique to improve the early detection of aerodigestive tract neoplasia. Head &Neck 1998; 556-562.
77. Gupta PK, Ghosh N, Patel HS. In Fundamentals and applications of Biophotonicsin Dentistry, Eds. Kishen A and Asundi A, Imperial College Press, London, 2007;135-136.
78. Hafstrom-Bjorkman U, Sundström F, ten Bosch JJ. Fluorescence in dissolvedfractions of human enamel. Acta Odontol Scand 1991; 49: 133–138.
79. Hale GM, Querry MR. Optical constants of water in the 200 nm to 200 µmwavelength region. Appl Opt 1973; 12: 555-563.
80. Hall AF, DeSchepper E, Ando M, Stookey GK. Dye-enhanced laser fluorescencemethod. Presented at 1st Annual Indiana Conference. Indianapolis, IndianaUniversity Press 1996a; 156-171.
81. Hall AF, DeSchepper E, Ando M, Stookey GK. In vitro studies of laser fluorescencefor detection and quantification of mineral loss from dental caries. Adv Dent Res.1997; 11: 507-514.
82. Heinrich –Weltzien R, Weerheijm KL, Kuhnisch J, Oehme T, Stosser L. Clnicalevaluation of visual, radiographic and laser fluorescence methods for detectionof occlusal caries. ASDC J Dent Child 2002; 69: 127-132.
83. Heinrich –Weltzien R, Kuhnisch J, Ifland S, Tranaeus S, Angmar-Mansson B,Stosser L. Detection of initial caries lesions on smooth surfaces by quantitativelight-induced fluorescence and visual examination: an in vivo comparison. Eur JOral Sci 2005; 113: 494-498.
84. Hibst R, Gall R. Development of diode laser-based fluorescence caries detector.Caries Res. 1998; 32: 294.
85. Hibst R, Paulus R. Caries detection by red excited fluorescence investigationson fluorophores. Caries Res 1998; 32: 294.
174 Spectroscopic Investigation of Tooth Caries and Demineralization
86. Hibst R, Paulus R. Caries detection by red excited fluorescence: Investigationson fluorophores. Caries Res 1999; 33: 295.
87. Hibst R, Paulus R: A new approach on fluorescence spectroscopy for cariesdetection. SPIE 1999; 3593: 141–147.
88. Hibst R, Paulus R. Molecular basis of red exited caries fluorescence. CariesRes 2000; 34: 323.
89. Hibst R, Paulus R. Method and device for the recognition of caries, plaque,concretions or bacterial infection on teeth. US Patent 6,186,780. February 13,2001.
90. Hibst R, Paulus R, Lussi A. Detection of occlusal caries by laser fluorescence:basic and clinical investigations. Med Laser Appl 2001; 16: 205-213.
91. Hintze H, Wenzel A, Danielsen B, Nyvad B. Reliability of visual examination, fiber-optic transillumination, bite-wing radiography and reproducibility of direct visualexamination following tooth separation for the identification of cavitated cariouslesions in contacting approximal surfaces. Caries Res. 1998; 32(3): 204-209.
92. Hunt AM. A description of the molar teeth and investing tissues of normal guineapigs. J Dent Res 1959; 38(2): 216-31.
93. Hunter RS, Harold RW. The measurement of appearance, Wiley & Sons ed. 2New York, 1987; 29-35.
94. Huth KC, Neuhaus KW, Gygax M, Bucher K, Crispin A, Paschos E, Hickel R,Lussi A. Clinical performance of a new laser fluorescence for detection of occlusalcaries lesions in permanent molars. J Dent 2008; 36: 1033-1040.
95. Huysmans MC, Longbottom C, Pitts NB, Los P, Bruce PG. Impedancespectroscopy of teeth with and without approximal caries lesions: an in vitro study.J Dent Res 1996; 75: 1871-1878.
96. Ie YL, Verdonschot EH. Performance of diagnostic systems in occlusal cariesdetection compared. Community Dent Oral Epidemiol 1994; 22: 187-191.
97. Jones RS, Fried D. Remineralization of Enamel caries can decrease opticalreflectivity. J Dent Res. 2006; 85(9), 804-808.
98. Jones RS, Darling CL, Featherstone JDB, Fried D. Remineralization of in vitrodental caries assessed with polarization-sensitive optical coherence tomography.J Biomed Opt. 2006; Jan/Feb 11(1): 014016(1-9).

References 175
99. Karlstrom S. Physical, physiological and pathological studies of dental enamel,with special reference to the question of its vitality. A.-B Fahlcrantz’ Boktryckeri;Stockholm 1931; 182.
100. Kidd EAM, Joyston-Bechal S. Essentials of dental caries: the disease ad itsmanagement. Bristol. Wright, 1987.
101. Kidd EAM, Ricketts DNJ, Pitts NB. Occlusal caries diagnosis: A changingchallenge for clinicians and epidemiologists. J Dent 1993; 21: 323-331.
102. Kidd EAM. The diagnosis and management of the early carious lesion inpermanent teeth. Dent. Update 1994; 11: 69 -81.
103. Kidd EAM, Joyston-Bechal S: Essentials of dental caries: the disease ad itsmanagement. Oxford University Press Inc., New York, 1997.
104. Kidd EA & Fejerskov O. What constitutes dental caries? Histopathology ofcarious enamel and dentin related to the action of cariogenic biofilms. J DentRes 2004; 83(Spec C): 35–38.
105. Kienle A, Forster FK, Diebolder R, Hibst R. Light Propagation in Dentin: Influenceof Light Propagation on Anisotropy. Phys Med Biol 2003; 48: N7-N14.
106. King NM, Shaw L. Value of bitewing radiographs in detection of occlusal caries,Community Dent and Oral Epidemiol 1979; 7(4): 218-221.
107. Ko CC, Tantbirojin D, Wang T, Douglas WH. Optical scattering power forcharacterization of mineral loss”, J. Dent. Res. 2000; 79; 1584-1589.
108. Konig K, Hibst R, Meyer H, Flemming G, Schneckenburger H. Laser-inducedautofluorescence of carious regions of human teeth and caries-involved bacteria.SPIE 1993; 2080: 170–180.
109. Konig K, Schneckenburger H. Laser-induced autofluorescence for medicaldiagnosis. J Fluoresc 1994; 4: 17-40.
110. Konig K, Flemming G, Hibst R. Laser-induced autofluorescence spectroscopyof dental caries. Cell Mol Biol 1998; 44: 1293-1300.
111. Konig K, Schneckenburger H, Hibst R. Time-gated in vivo autofluorescenceimaging of dental caries. Cell Mol Biol (Noisy-le-grand) 1999; 45: 233-239.
112. Koort HJ, Frentzen M. YAG-lasers in restorative dentistry: A histologicalinvestigation. In Laser Surgery: Advanced Characterization, Therapeutics and

176 Spectroscopic Investigation of Tooth Caries and Demineralization
Systems III, Eds. Anderson PR, Katzir A, SPIE Proc 1992 a; 1643: 403-411.
113. Kortum G. Reflectance Spectroscopy, Springer, New York - Berlin - Heidelberg,1969.
114. Kuhnisch J, Heinrich–Weltzien R, Tranaeus S, Angmar-Mansson B, Stosser L.Confounding factors in clinical studies using QLF. Int Poster J Dent Oral Med2003; 5(2): 177.
115. Kuhnisch J, Ifland S, Tranaeus S, Angmar-Mansson B, Hickel R, Stosser L,Heinrich –Weltzien R. Estabilishing quantitative light-induced fluorescence cut-offs for the detection of occlusal dentine lesions. Eur J Oral Sci 2006; 114: 483-488.
116. Lakowicz JR. Principles of fluorescence spectroscopy. Plenum Press, NewYork, 1983.
117. Lennon AM, Buchalla W, Switalski L, Stookey GK. Residual caries detectionusing visible fluorescence. Caries Res 2002; 36: 315–319.
118. LeGeros RZ. Calcium phosphates in oral biology and medicine. Karger, Basel-Munchen-Paris. 1991.
119. Levy G, Rizoiu IM. In Laser in Dentistry, Eds. Miserendino LJ and Pick RM,Quintessence Publ. Co, Inc, Chicago, et al., 1995; 300.
120. Lizarelli RFZ, Bregagnolo DDS, Lizarelli RZ, Palhares JMC and Villa GEP. Acomparative in vitro study to diagnose decayed dental tissue using differentmethods. Photomedicine and Laser Surgery 2004; 22: 205-210.
121. Loesche WJ. Role of Streptococcus mutans in human dental caries. MicrobiolRev. 1986; 50(4): 353-380.
122. Longbottom C, Huysmans MC, Pitts NB, Los P, Bruce PG. Detection of dentaldecay and its extent using a. c. impedance spectroscopy. Nat Med 1996; 2:235-237.
123. Lussi A, Imwinkelried S, Pitts NB, Longbottom C, Reich E. Performance andreproducibility of a laser fluorescence system for detection of occlusal cariesin vitro. Caries Res 1999; 33: 261-266.
124. Lussi A, Megert B, Longbottom C, Reich E, Francescut P. Clinical performanceof a laser fluorescence device for detection of occlusal caries lesions. Eur JOral Sci. 2001; 109: 14-19.

References 177
125. Lussi A, Francescut P. Performance of conventional and new methods fordetection of occlusal caries in deciduous teeth. Caries Res 2003; 37: 2-7.
126. Lussi A, Hibst R, Paulus R. DIAGNOdent: an optical method for caries detection.J Dent Res 2004; 83: C80–C3.
127. Lussi A, Hellvig E. Performance of a new laser fluorescence device for thedetection of occlusal caries in vitro. J Dent 2006; 34: 467-471.
128. Marsh P, Martin MV. Oral Microbiology, ed 4, Oxford, Wright 1999; 61-63.
129. Marthaler TM. Caries status in Europe and predictions of future trends. CariesRes 1990; 24: 381-396.
130. Marthaler TM. Changes in dental caries 1953-2003. Caries Res 2004; 28: 173-181.
131. Masychev VI, Sokolovsky AA, Kesler G, Alexandrov MT. Early dental cariesdetection by method of PNC-diagnostics: Comparison with visual and X-raymethods. SPIE 2000; 3910: 269–280.
132. Matsumoto H, Kitamura S, Araki T. Autofluorescence in human dentine in relationto age, tooth type and temperature measured by nanosecond time-resolvedfluorescence microscopy. Arch Oral Biol 1999; 44: 309–318.
133. Metz CE. Basic principles of ROC analysis. Sem Nucl Med 1978; 8: 283-298.
134. Muller MG, Gergakoudi I, Zhang Q, Wu J, Feld MS. Intrinsic fluorescencespectroscopy in turbid media: disentangling effects of scattering and absorption.Appl Opt 2001; 40: 4633-4646.
135. Nagasawa A. Research and development of laser in dental and oral surgery. InNew Frontiers in Laser Medicine and Surgery, Eds. K. Atsumi. Elsevier,Amsterdam- Oxford, 1983; 233-241.
136. Naseem S. Oral and dental diseases: Causes, prevention and treatmentstrategies: Burden of diseases. National Commission on Macroeconomics andHealth. 2005; 275-298.
137. Newbrun E. Problems in caries diagnosis. Int Dent J 1993; 43: 133–142.
138. Nichols MG, Hull EL, Foster TH. Design and testing of a white-light, steady-statediffuse reflectance spectrometer for determination of optical properties of highlyscattering systems. Appl. Opt. 1997; 36(1): 93–104.

178 Spectroscopic Investigation of Tooth Caries and Demineralization
139. Ng SY, Ferguson MWJ, Payne PA, Slater P. Ultrasonic studies of unblemishedand artificially demineralized enamel in extracted human teeth: a new methodfor detecting early caries. J Dent 1988; 16: 201-209.
140. Olmez A, Tuna D, Oznurhan F. Clinical evaluation of DIAGNOdent in detectionof occlusal caries in children. J Clin Pediatr Dent 2006; 30:287–291 312.
141. Pinelli C, Serra MC, Loffredo LCM. Validity and reproducibility of a laserfluorescence system for detecting the activity of white-spot lesions on freesmooth surfaces in vivo. Caries Res 2002; 36: 19-24.
142. Pretty IA, Edgar WM, Higham SM. Detection of in vitro demineralization of primaryteeth using quantitative light-induced fluorescence (QLF). Int. J of Paediatr. Dent.2002; 12: 158- 167.
143. Pretty I.A, Pender N, Edgar WM, Higham SM. The in vitro detection of earlyenamel de- and re-mineralization adjacent to bonded orthodontic cleats usingquantitative light-induced fluorescence. Eur J Orthod. 2003; 25: 217-223.
144. Pretty IA, Smith PW, Edgar WM, Higham SM. Detection of in vitro ondemineralization adjacent to restorations using quantitative light inducedfluorescence (QLF). Dental Materials 2003; 19: 368-374.
145. Pretty IA, Edgar WM, Smith PW, Higham SM. Quantification of dental plaque inthe research environment. J Dent 2005; 33: 193-207.
146. Ramanujam N. Fluorescence spectroscopy of neoplastic and non-neoplastictissues. Neoplasia 2000; 2: 89-117.
147. Reis A, Mendes FM, Angnes V, Angnes G, Grande RH, Loguercio AD. Performanceof methods of occlusal caries detection in permanent teeth under clinical andlaboratory conditions. J Dent 2006; 34: 89-96.
148. Ribeiro A, Rousseau C, Girkin J, Hall A, Strang R, Whitters CJ, Creanor S,Gomes ASL. A preliminary investigation of a spectroscopic technique for thediagnosis of natural caries lesions. J Dent 2005; 33: 73-78.
149. Richards-Kortum R, Sevick-Muraca E. Quantitative optical spectroscopy fortissue diagnosis. Annual Review of Physical Chemistry 1996; 47: 555-606.
150. Roberson T, Heymann HO, Swift EJ. Sturdevant’s Art & Science of OperativeDentistry St Louis, Missouri, Mosby, 2002.
151. Rocha RO, Ardenghi TM, Oliveira LB, Rodrigues CRMD and Ciamponi AL. In

References 179
vivo effectiveness of laser fluorescence compared to visual inspection andradiography for detection of occlusal caries in primary teeth. Caries Res 2003;37: 437-441.
152. Rodrigues JA, Diniz MB, Josgrilberg EB, Cordeiro RCL. In vitro comparison oflaser fluorescence performance with visual examination for detection of occlusalcaries in permanent and primary molars. Lasers Med Sci 2008; DOI 10.1007/s10103-008-0552-4.
153. Rodrigues JA, Hug I, Lussi A. The influence of zero value subtraction on theperformance of a new laser fluorescence device for approximal caries detection.Lasers Med Sci 2008; DOI 10.1007/s10103-008-0549-z.
154. Rock WP, Kidd EAM. The electronic detection of demineralization in occlusalfissures. Br Dent J 1988; 164: 243-247.
155. Ross G. Caries diagnosis with the DIAGNOdent Laser: A user’s productevaluation. Ont Dent 1999; 76(2): 21-24.
156. Sanchez-Figueras A Jr. Occlusal pit-and-fissure caries diagnosis: a problemno more. A science-based approach using laser-based fluorescence device.Compend Contin Educ Dent 2003; 24: 3-11.
157. Sarkissian A, Le AN. Fiber optic fluorescence microprobe for endodonticdiagnosis. Journal of dental education 2005; 69: 633-638.
158. Sawle RF, Andlaw RJ. Has occlusal caries become more difficult to diagnose?A study comparing clinically undetected lesions in molar teeth of 14-16 year oldchildren in 1974 and 1992. British Dent J 1988; 164: 209-211.
159. Schneiderman A, Elbaum M, Shultz T, Keem S, Greenebaum M, Driller J.Assessment of dental caries with digital imaging fiber-optic transillumination(DIFOTI): in vitro study. Caries Res. 1997; 31: 103-110.
160. Sheehy EC,. Brailsford SR, Kidd EAM, Beighton D, Zoitopoulos L. Comparisonbetween visual examination and a laser fluorescence system for in vivodiagnosis of occlusal caries. Caries Res 2001; 35: 421-426.
161. Shiny ST, Rupananda JM, Mini J, Subhash N. Investigation of in vitro dentalerosion by optical techniques. Lasers Med Sci. 2008; 23: 319-329.
162. Shi XQ, Welander U, Angmar-Mansson B. Occlusal caries detection with KaVoDIAGNOdent and radiography: an in vitro comparison. Caries Res. 2000; 34:151-158.

180 Spectroscopic Investigation of Tooth Caries and Demineralization
163. Shi XQ, Tranaeus S, Angmar-Mansson B. Comparison of QLF and DIAGNOdentfor quantification of smooth surface caries. Caries Res. 2001a; 35: 21-26.
164. Stokes GG, Uber die andung der brechbarkeit des lichtes. Philos Trans R Soc,1852; 107: 11.
165. Stubel H, Die fluoreszone tierische gewebe in ultravioletten licht. Pflingers ArchGes Physiol 1911; 142: 1.
166. Stookey GK. The evolution of caries detection. Dimensions of Dental Hygiene2003; 12: 5.
167. Subhash N, Mazzinghi P, Agati G, Fusi F, Lercari B. Analysis of laser inducedfluorescence line shape of intact leaves: Application to UV stress detection.Photochem Photobiol 1995; 62: 711-718.
168. Subhash N, Mohanan CN. Curve fit analysis of chlorophyll fluorescence spectra:Application to nutrient stress detection in sunflower. Remote Sens Environ 1997;60: 347-356.
169. Subhash N, Shiny ST, Rupananda JM, Mini J. Tooth caries detection by curvefitting of laser-induced fluorescence emission: A comparative evaluation withreflectance spectroscopy. Lasers Surg Med 2005; 37: 320-328.
170. Sundstrom F, Fredriksson K, Montan S, Hafstrom -Bjorkman U, Strom J: Laser-induced fluorescence from sound and carious tooth substance: Spectroscopicstudies. Swed Dent J 1985; 9: 71–80.
171. Summit, James B, William J, Robbins, Richard S, Schwartz. Fundamentals ofoperative dentistry: A contemporary approach, 2nd edition, QuintessencePublishing Co, Inc. 2001.
172. Takamori K., Hokari N, Okumura Y, Watanabe S. Detection of occlusal cariesunder sealants by use of laser fluorescence system. J Clin Laser Med Surg2001; 19: 267-271.
173. Ten Bosch J. Light scattering and related methods in caries diagnosis. In: Earlydetection of dental caries. Ed. Stookey GK, Indianapolis: Indiana UniversitySchool of Dentistry, 1996; 81-90.
174. Ten Cate JM. In vitro studies on the effects of fluoride on de- and remineralization.J Dent Res. 1990; 69: Spec No. 614-619.

References 181
175. Ten Cate AR. Oral Histology: Development, Structure, and Function, 5th edn.,St Louis, Mosby, 1998.
176. The World Oral Health report, 2003.
177. Thylstrup A and Fejerskov O. Text book of clinical cariology (2nd edition),Munksgaard, Copenhagen, 1994.
178. Tuchin VV, Altshuler GB. In Fundamentals and Applications of Biophotonics inDentistry, Eds. Kishen A and Asundi A, Imperial College Press, London, 2007;256.
179. Utzinger U, Brewer M, Silva E, Gershenson D, Bast RC Jr, Follen, Richards-Kortum R. Reflectance spectroscopy for in vivo characterization of ovariantissue. Lasers Surg Med 2001; 28(1): 56–66.
180. Uzunov TT, Borisova EG, Kamburova KP, Avramov LA. Reflectancespectroscopy of human teeth in vitro. BPU-5: Fifth General conference of theBalkan Physical Union SP16-003 1775-1778, 2003.
181. Valera FB, Pessan JP, Valera RC, Mondelli J, Percinoto C. Comparison of visualinspection, radiographic examination, laser fluorescence and their combinationson treatment decisions for occlusal surfaces. American J Dent 2008; 21: 25–29.
182. Van der Veen MH and ten Bosch JJ. Autofluorescence of bulk sound and in vitrodemineralised human root dentin. Eur J Oral Sci 1995; 103: 375-381.
183. Verdonschot EH, Bronkhorst EM, Burgersdijk RCW, Konig KG, Schacken MJM,Truin GJ. Performance of some diagnostic systems in examinations for smallocclusal carious lesions. Caries Res 1992; 26: 59-64.
184. Verdonschot EH, Bronkhorst EM, Burgersdijk RCW, Konig KG, Schaeken MJM,Truin GJ. Performance of some diagnostic systems in examinations for smallocclusal carious lesions. Caries Res 1992a; 26: 59-64.
185. Verdonschot EH, Wenzel A, Truin GJ, Konig KG. Performance of electricalresistance measurements adjunct to visual inspection in the early diagnosis ofocclusal caries. J Dent 1993; 21: 332-337.
186. Verdonschot EH, Angmar-Mansoon B, ten Bosch JJ, Deery CH, HuysmansMCDNJM, Pitts NB, Waller E. Developments in caries diagnosis and theirrelationship to treatment decisions and quality of care. Caries Res. 1999; 33:32-40.
182 Spectroscopic Investigation of Tooth Caries and Demineralization
187. Virajsilp V, Thearmontree A, Aryatawong S, Paiboonwarachat D. Comparisonof proximal caries detection in primary teeth between laser fluorescence andbitewing radiography. Pediatr Dent 2005; 27:493–499.
188. Von Fraunhofer J. Dissolution of dental enamel in soft drinks. General Dentistry2004; 52(4): 308-312.
189. Wagnieres G, Star W, Wilson B. In vivo fluorescence spectroscopy and imagingfor oncological applications. Photochemistry and Photobiology 1998; 68(5): 603-632.
190. Walsh LJ, Shakibaie F. Ultraviolet-induced fluorescence: shedding new light ondental biofilms and dental caries. Australasian dental practice, 2007; 56-60.
191. Walters C, Eyre DR. Collagen cross links in human dentin: increasing contentof hydroxypyridinum residues with age. Calcif Tissue Int. 1983; 35: 401-405.
192. Weerheijm KL, van Amerongen WE, Eggink CO. The clinical diagnosis ofocclusal caries: A problem. J Dent Child 1989; 56: 196-200.
193. Weerheijm KL, Groen HJ, Bast AJJ, Kieft JA, Eijkman MAJ, van AmerongenWE. Clinically undetected occlusal dentine caries: A radiographic comparison.Caries Res 1992a; 26: 305-309.
194. Weerheijm KL, Grujthuysen RJM, van Amerongen WE. Prevlaence of hiddencaries. J dent Child 1992b; 59: 408-412.
195. Weersink RA, Hayward JE, Diamond KR, Patterson MS: Accuracy of non-invasive in vivo measurements of photosensitizer uptake based on a diffusionmodel of reflectance spectroscopy. Photochem Photobiol 1997; 66: 326-335.
196. Wendlandt WW, Hecht HG. Spectroscopie de reflectance. Interscience (J. Wiley)New York, 1966; 21.
197. Wenzel A, Fejerskov O. Validity of diagnosis of questionable caries lesions inocclusal surfaces of extracted third molars. Caries Res 1992; 26: 188-194.
198. Whaites E, In Minimally Invasive Dentistry: The management of caries, Eds.Wilson NHF, Quintessence Publ. Co, Ltd, London, et al., 2007; 38.
199. White DJ, Featherstone JDB. A longitudinal microhardness analysis of fluoridedentifrice effects on lesion progression in vitro. Caries Res. 1987; 21: 502-512.
200. White SC and Pharoah MJ. Oral radiology principles and interpretation. 5thedition. St Louis, Mosby, 2004.

References 183
201. Wigdor H, Rizoiu IM, Levy G. Light interaction with dental hard tissuesspectrophotometry. Presented at the American Society for Laser Medicine andSurgery, New Orleans, April 1994; 18-20.
202. World Health Organisation, Dental Health published in World Health, 1981. InChakraborty M, Saha JB, Bhattacharya RN, Roy A, Ram R. Epidemiologicalcorrelates of dental caries in an urban shun of West Bengal. Indian J of PubHlth 1997; 41(2): 56.
203. Yanagisawa T, Miake Y. High-resolution electron microscopy of enamel-crystaldemineralization and remineralization in carious lesions. J. Electron Microsc.2003; 52, 605–613.
204. Yassin OM. In vitro studies of the effect of a dental explorer on the formation ofan artificial carious lesion. J Dent Children 1995; 62: 111-117.
205. Young DA. New caries detection technologies and modern caries management:merging the strategies. Gen Dent. 2002; 50(4): 320-331.
206. Zero D T. Dental caries process. Dent Clin North Am. 1999; 43: 635-664.
207. Zezell DM, Ribeiro AC, Bachmann L, Gomes ASL, Rousseau C, Girkin J.Characterization of natural carious lesions by fluorescence spectroscopy at405-nm excitation wavelength. J Biomed Opt 2007; 12(6): 064013 (1-6).
208. Zijp JR, ten Bosch JJ. Angular dependence of He–Ne laser light scattering bybovine and human dentine. Arch Oral Biol 1991; 36: 283-289.
209. Zijp JR and ten Bosch JJ. Theoretical model for the scattering of light by dentinand comparison with measurements. Appl Opt 1993; 32: 411-415.
210. Zijp JR and ten Bosch JJ. Anisotropy of volume-backscattered light. Appl Opt1997; 36: 1671-1680.
211. Zonios G, Perelman L, Backman V, Manoharan R, Fitzmaurice M, Van Dam J,Feld MS: Diffuse reflectance spectroscopy of human adenomatous colon polypsin vivo. Appl Opt 1999; 38: 6628-6637.