spectroscopy and pollution monitoring 9-12-07 · the physics of prism and grating spectrometers and...
TRANSCRIPT


Spectroscopy and Pollution Monitoring
Photonics-Enabled Technologies
OPTICS AND PHOTONICS SERIES
OP-TEC: The National Center of Optics and Photonics Education
An NSF ATE Project

© 2008 CORD
This document was developed by OP-TEC: The National Center for Optics and Photonics Education, an initiative of the Advanced Technological Education (ATE) program of the National Science Foundation.
Published and distributed by OP-TEC University of Central Florida http://www.op-tec.org ISBN 1-57837-492-8
Permission to copy and distribute This work is licensed under the Creative Commons Attribution-NonCommercial-NoDerivatives 4.0 International License. http://creativecommons.org/licenses/by-nc-nd/4.0. Individuals and organizations may copy and distribute this material for non-commercial purposes. Appropriate credit to the University of Central Florida & the National Science Foundation shall be displayed, by retaining the statements on this page.

PREFACE This module is one of three pertaining to the role of optics and lasers in spectroscopy. OP-TEC treats spectroscopy as a photonics-enabled technology. The current OP-TEC series on photonics-enabled technologies comprises modules in the areas of manufacturing, biomedicine, forensic science and homeland security, optoelectronics, and environmental monitoring, as listed below. (This list will expand as the OP-TEC series grows. For the most up-to-date list of modules, visit http://www.op-tec.org.)
Manufacturing Laser Welding and Surface Treatment Laser Material Removal: Drilling, Cutting, and Marking Lasers in Testing and Measurement: Alignment Profiling and Position Sensing Lasers in Testing and Measurement: Interferometric Methods and Nondestructive Testing
Environmental Monitoring Basics of Spectroscopy Spectroscopy and Remote Sensing Spectroscopy and Pollution Monitoring
Biomedicine Lasers in Medicine and Surgery Therapeutic Applications of Lasers Diagnostic Applications of Lasers
Forensic Science and Homeland Security Lasers in Forensic Science and Homeland Security Infrared Systems for Homeland Security Imaging System Performance for Homeland Security Applications
Optoelectronics Photonics in Nanotechnology
The modules pertaining to each technology can be used collectively as a unit or separately as stand-alone items, as long as prerequisites have been met.
For students who may need assistance with or review of relevant mathematics concepts, a review and study guide entitled Mathematics for Photonics Education (available from CORD) is highly recommended.
The original manuscript of this module, Spectroscopy and Remote Sensing, was prepared by Dr. Leno Pedrotti (CORD). Formatting and artwork were provided by Mark Whitney, Kathy Kral, and Virginia York (CORD).

CONTENTS Introduction ..................................................................................................................................... 1 Prerequisites .................................................................................................................................... 1 Objectives........................................................................................................................................ 2 Scenario........................................................................................................................................... 2 Basic Concepts ................................................................................................................................ 3
Spectroscopic Techniques........................................................................................................... 3 Integrating sphere photometer................................................................................................. 3 Raman spectroscopy................................................................................................................ 5 Laser-induced breakdown spectroscopy (LIBS) ..................................................................... 7
Pollution ...................................................................................................................................... 8 What is pollution? ................................................................................................................... 8 Land pollution ......................................................................................................................... 9 Water pollution........................................................................................................................ 9 Air pollution .......................................................................................................................... 10 Spread of air pollutants ......................................................................................................... 13
Common Pollution Problems .................................................................................................... 15 Acid rain................................................................................................................................ 15 Smog...................................................................................................................................... 17
Laser-Based Gas Sensing.......................................................................................................... 18 Multipass transmission absorption spectroscopy .................................................................. 19 Hollow waveguide transmission absorption spectroscopy ................................................... 19 Light detection and ranging (LIDAR)................................................................................... 20
Global Warming and the Greenhouse Effect ............................................................................ 20 What is global warming?....................................................................................................... 20 How does global warming occur? ......................................................................................... 21 How do we reduce the concentration of greenhouse gases? ................................................. 22 Watchdog agencies................................................................................................................ 23
Laboratories................................................................................................................................... 23 Lab 1: Measuring tailpipe gases................................................................................................ 23 Lab 2: Detecting acid rain ......................................................................................................... 26
Problem Exercises ......................................................................................................................... 30 Bibliography.................................................................................................................................. 31

1
PHOTONICS-ENABLED TECHNOLOGIES: SPECTROSCOPY
Spectroscopy and Pollution Monitoring
INTRODUCTION This module is the third in a series of three modules that deal with environmental monitoring. The three, taken in sequence, cover first the basic idea of what spectroscopy is and what it does (Basics of Spectroscopy); second, several basic instruments used to form and measure spectra of various light sources and their relationship to remote sensing (Spectroscopy and Remote Sensing); and third, other spectroscopic instruments and their involvement with the monitoring of pollution (Spectroscopy and Pollution Monitoring).
In this module, we will learn first how integrating sphere systems, Raman scatter, and laser-induced breakdown spectroscopy enable us to analyze spectral signatures that are omitted by or reflected from targets of interest, such as polluted air, water, or land. Then, we will examine the broad topic of pollution—what it is, where it occurs, and how it is monitored.
PREREQUISITES The student should be familiar with the following before attempting to complete this module.
1. High school mathematics through intermediate algebra and the basics of trigonometry
2. CORD’s Optics and Photonics Series Course 1, Fundamentals of Light and Lasers
3. CORD’s Optics and Photonics Series Course 2, Elements of Photonics
Module 2-1: Operational Characteristics of Lasers Module 2-2: Specific Laser Types Module 2-3: Optical Detectors and Human Vision
4. It is highly recommended that the module Spectroscopy and Remote Sensing be perused before studying this module.
2 Optics and Photonics Series, Spectroscopy
OBJECTIVES When you have finished this module, you will be able to:
• Define pollution and identify the three major types.
• Describe how an integrating sphere photometer works.
• Calculate the increased radiance produced by an integrating sphere photometer.
• Describe Raman spectroscopy and identify which general substances it can detect.
• Convert between wave numbers and wavelength.
• Describe how laser-induced breakdown spectroscopy works and how it is used to identify elements in various substances.
• Describe land pollution and list its typical sources.
• Describe water pollution, what contributes to it, and how it is controlled.
• Describe air pollution, what contributes to it, and how it is controlled.
• Describe how air pollution spreads from one location to another.
• Use Graham’s law to compare the speeds at which different gases spread.
• Describe what is meant by acid rain, what causes it, and how we attempt to control it.
• Describe smog, where it comes from, and how we try to control it.
• Explain how ozone in the atmosphere can be both beneficial and harmful.
• Describe current spectroscopic means of using lasers to detect trace gases.
• Describe global warming, what causes it, and its consequences.
• Identify the Greenhouse gases and explain how they contribute to global warming.
• Define pH and explain how one can measure whether a substance is an acid or a base.
• Name at least five federal watchdog agencies concerned with detecting and controlling pollution in the United States.
SCENARIO Camryn works as a technician for an engineering firm that has been hired by the National Aeronautics and Space Administration (NASA) to help map the earth’s ozone layer. (Ozone in the atmosphere has both beneficial and harmful effects. Understanding changes in its levels, and what causes those changes, can help us to reduce pollution and other manmade contributors to global warming.) Camryn’s firm uses global ozone maps produced by the Total Ozone Mapping Spectrometer (TOMS), a high-tech device that orbits the earth aboard the Japanese Advanced Earth Observing Satellite (ADEOS). Camryn’s firm also obtains data from a similar instrument on the US TOMS-Earth Probe spacecraft. Earth Probe provides high-resolution images of atmospheric features related to urban pollution and biomass burning (such as forest fires, dust

Spectroscopy and Pollution Monitoring 3
storms, and small volcanic eruptions), in addition to ozone measurements. The mapping spectrometer gauges ozone concentration by comparing the intensity of ultraviolet light in incident sunlight to that scattered back to the satellite from the Earth’s atmosphere. Various other instruments on the ADEOS measure the vertical profile of ozone and other trace gases in the polar regions, measure ozone below the orbital track, profile trace gases as the spacecraft passes over ground-based laser sites, and measure sulfur dioxide in the atmosphere in the wake of volcanic eruptions.
Camryn’s job involves gathering and organizing data on a daily basis. To perform her tasks she must have a “big picture” idea of the processes involved. She reports directly to a group of engineers, who rely on her accuracy and thoroughness. Camryn thrives on the fast-paced, high-tech atmosphere in which she works. She also takes pride in knowing that her work makes the world a cleaner and safer place. Best of all, she was able to obtain all the necessary skills through a two-year associate degree program that emphasized the use of lasers and photonics for environmental monitoring.
BASIC CONCEPTS In the module titled Spectroscopy and Remote Sensing, we examined some of the defining parameters and characteristics of spectroscopic instruments. And we looked in some detail at the physics of prism and grating spectrometers and the use of spectrophotometers and mass spectrometers. Here, we continue to look at spectroscopic instruments that enable one to analyze spectral signatures—intensity versus wavelength. We then examine integrating sphere photometers, Raman spectroscopy, and laser-induced breakdown spectroscopy.
Spectroscopic Techniques Integrating sphere photometer Integrating sphere systems are used to measure the radiant energy reflected from a wide variety of materials, including paint (lead content), fabric, plastic, metals, geological samples (rocks, dirt, vegetative decay), and biological specimens. The reflectance data collected by an integrating sphere photometer can be analyzed spectrally (intensity versus wavelength) or in a single value such as luminous reflectance. Figure 1 shows a simple schematic drawing of an integrating sphere system with a photodetector that records the output. In essence, an integrating sphere is an optical device consisting of a hollow spherical cavity with its interior surface coated for high reflectivity (i.e., white) and with small holes for entrance and exit ports. It is helpful to note that the integrating sphere accepts radiant energy reflected from some substances and, by many internal reflections within the sphere, presents, in effect, an increased amount of radiant energy for optical analysis. In a typical integrating sphere application, a sample under observation is positioned at a specific location in the wall of the sphere and illuminated by a beam of light. The light reflected from the sample surface is collected by the sphere via multiple interior diffuse reflections. A representative fraction of the collected energy is transferred to an external detector.

4 Optics and Photonics Series, Spectroscopy
Figure 1 Schematic representation of an integrating sphere system
Figure 1 shows input radiant flux (watts) of amount φi entering the sphere through a port of area Ai. Inside the sphere, the flux undergoes multiple reflections and is increased. A fraction is drawn off for analysis through the exit port of area, Ae. The surface area of the sphere is As and the reflectivity of the inner surface is ρ. It can be shown that the radiance Ls of the inner surface of the sphere, in watts per m2 per solid angle steradians, is given by Equation 1.
is
s
( )( )1 (1 )
LA fφ ρ
=π −ρ −
(1)
where f = i e
s
A AA+ is the so-called port fraction.
Example 1 Maria uses an integrating sphere to measure the reflecting power of a certain sunscreen. The sphere she is using has a reflectivity ρ of 0.95, a port fraction of 0.1, a radius of 30 cm, and an input flux from the sunscreen of 5 watts. What is the radiance Ls created by the sphere?
Solution
Ls = S
i( )( )1 (1 )A f
φ ρπ −ρ −
where φi = 5 watts As = 4πrs
2 = 4π(0.3m)2 = 0.36π m2
ρ = 0.95 f = 0.1
we obtain Ls = 5( )(0.36 )π π
( 0.951 0.95(1 0.1)− −
) = 9.2 w/m2-Sr
The integrating sphere has accepted the 5 watts of reflected light from the sunscreen and, by virtue of multiple internal reflections, has generated a higher radiance of 9.2 w/m2-Sr, a fraction of which will be sent to the photodetector for optical analysis.

Spectroscopy and Pollution Monitoring 5
Raman spectroscopy Raman spectroscopy is a technique that is useful in studying the vibrational and rotational energy level structure of molecules. Knowledge of this structure provides another spectral “fingerprint” for helping one to identify the molecular substance.
Raman spectroscopy relies on inelastic scattering of photons incident on the substance. As is characteristic of inelastic scattering processes, the scattered photon will have less energy than the incident one with the energy loss being converted into other forms of energy in the scattering material. Usually, monochromatic laser light in the visible, near infrared, or near ultraviolet is incident on the molecular substance to be analyzed. This light will stimulate characteristic bond vibrations in the molecule, causing the laser light energy to shift upward (anti-Stokes Raman scattering) or downward (Stokes Raman scattering), depending on how the molecule de-excites. Figure 2 shows the energy level involvement of a typical molecule undergoing Raman scatter.
Figure 2 Energy level involvement of a typical molecule undergoing Raman scatter
So-called Rayleigh scattering is elastic scattering, which means that the absorbed and emitted photons are of equal energy, as shown by the boldest arrows in Figure 2. Rayleigh scattering is likely when the particles or molecules causing the scatter of light have dimensions that are small compared to the wavelength of the incident light. The scattering of sunlight from oxygen and nitrogen molecules in the atmosphere is an example of Rayleigh scattering.
By contrast and as previously mentioned, Raman scattering is inelastic. Thus, note in Figure 2 that the scattered photon for the case of Stokes Raman scattering is of lower energy than the incident photon, and for the case of anti-Stokes Raman scattering is of higher energy. Both Stokes and anti-Stokes Raman scattering are less probable—about 1 in 107 incident photons scatter by Stokes or anti-Stokes processes—than Rayleigh scattering, as is indicated by the darkness of the pairs of lines in Figure 2. Nevertheless, detection of the Stokes and anti-Stokes scattered light provides specific information concerning the vibrational energy levels of the molecule and therefore of the molecule itself.

6 Optics and Photonics Series, Spectroscopy
Raman spectroscopy is used often to identify organic molecules, where the spectral fingerprint is in the range of 500–2000 cm–1 (wave number units). Many molecules in toxic materials (gas, liquid, or solid) can thus be identified, both in accordance with their nature and concentration. A laboratory setup for obtaining Raman spectra is shown in Figure 3.
Figure 3 Laboratory setup for obtaining Raman spectra
Example 2 Wave numbers, rather than wavelengths, are used often by spectroscopists to identify energies involved in absorptions and emissions. The wave number, ν , is simply the inverse of the wavelength, 1/λ, and represents the number of full wave cycles that occur over a unit of distance. Wave number is used because the energy of a photon expressed in wave numbers ν is given by E = hcν —as contrasted with E = hc/λ in wavelength—so the photon energy E in the expression E = hc/λ is directly proportional to the wave number ν .
Based on the range of 500–2000 cm–1 (in wave numbers) given for Raman scattering, convert the wave numbers to the corresponding wavelengths in μm (micrometers) and the frequency f in Hertz (Hz).
Solution
(a) ν = 500 cm–1 = 1λ
λ = 11
500 cm− = 1500 cm = 2 × 10⁻³ cm = 2 × 10⁻³cm ( 1 m
100 cm ) = 2 × 10⁻⁵ m
λ = 2 × 10⁻⁵m = 20 × 10–6m = 20μm – in the far infrared
(b) f = cλ
= 8
63 10 m/s20 10 m−××
= 0.15 × 10¹⁴ Hz
(c) Similarly, for ν = 2000 cm–1, we find that λ = 5 μm and f = 0.6×10¹⁴Hz—in the near infrared.

Spectroscopy and Pollution Monitoring 7
Laser-induced breakdown spectroscopy (LIBS) LIBS is a simple method of identifying a substance with the help of a laser-generated spark. The target substance can be a solid, liquid, or gas. The laser can be a two-watt Nd:YAG laser with a wavelength of 532 nm and a pulse length of 5 nanoseconds. The focused laser pulse is directed onto the target surface, where the energy of the pulse heats, vaporizes, atomizes, and ionizes the material on the surface. This results in a small, hot plasma, typically 2 mm in diameter and 4 mm long. Figure 4a shows an LIBS plasma formed on ordinary soil.
(a) (b)
Figure 4 LIBS plasma formed on ordinary soil
The atoms and ions in the plasma emit light, which is then detected and analyzed, providing the critical identifying spectral fingerprint. The LIBS spectrum resulting from laser plasma formed on copper is shown in Figure 4b. The spectrum is readily observed visually by looking at the plasma through a transmission diffraction grating. One can see clearly the purple, blue, green, and red lines due to light emission from the neutral copper atoms.
A typical LIBS laboratory setup is shown in Figure 5.
Figure 5 Typical LIBS laboratory setup
The system shown is transportable; the sampling head can be used at distances of 40 feet or so from the spectrograph, detector, and spectral image-forming computer. Figure 6 shows a spectrum belonging to a sample containing many elements—magnesium (Mg), silicon (Si), calcium (Ca), iron (Fe), aluminum (Al), sodium (Na) and potassium (K).

8 Optics and Photonics Series, Spectroscopy
Figure 6 A spectrum belonging to a sample containing Mg, Si, Ca, Fe, Al, Na, and K
Compared to more conventional methods of spectroscopic analysis of toxic or polluting substances, LIBS has these advantages.
• Simple in design and simple to operate
• Rapid measurements (taken in one minute or less)
• Can be used for gases, liquids, and solids
• Can be automated
• Non-invasive and can be used where the sample is
• Little or no sample preparation required
Pollution With a brief survey of several spectroscopic methods for detecting toxic materials behind us, we now turn our attention to pollution—what it is, where we find it, and how it is being controlled.
What is pollution? According to the Merriam-Webster dictionary, pollution is the action of contaminating the environment with a variety of man-made wastes. Such contamination includes mainly land, water, and air. Of all the first-world countries, the U.S. is the most polluting nation on the face of the earth, hardly a desirable ranking. The U.S. does spend a significant fraction of its gross national product (GNP) to help clean up the environment and is ranked 7th among nations on pollution control. This rank of 7th translates to an expenditure of over $120 billion a year on pollution control, abatement, regulation, monitoring, and research and development.
Spectroscopy and Pollution Monitoring 9
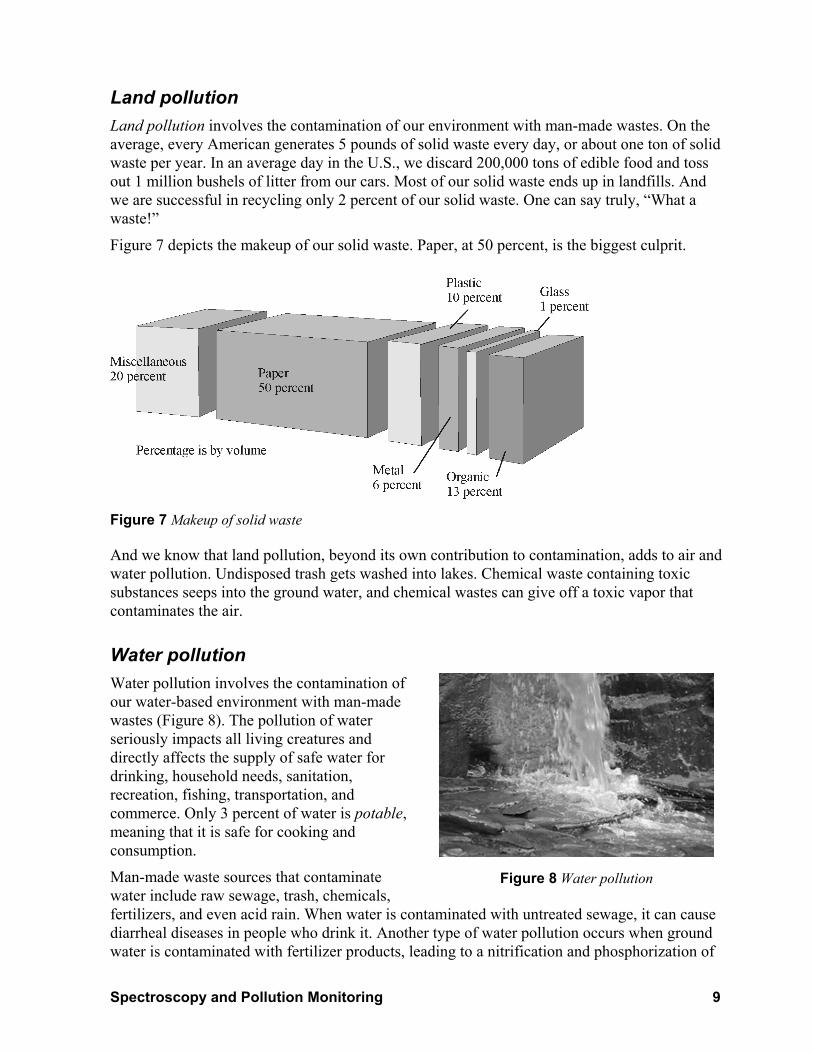
Land pollution Land pollution involves the contamination of our environment with man-made wastes. On the average, every American generates 5 pounds of solid waste every day, or about one ton of solid waste per year. In an average day in the U.S., we discard 200,000 tons of edible food and toss out 1 million bushels of litter from our cars. Most of our solid waste ends up in landfills. And we are successful in recycling only 2 percent of our solid waste. One can say truly, “What a waste!”
Figure 7 depicts the makeup of our solid waste. Paper, at 50 percent, is the biggest culprit.
Figure 7 Makeup of solid waste
And we know that land pollution, beyond its own contribution to contamination, adds to air and water pollution. Undisposed trash gets washed into lakes. Chemical waste containing toxic substances seeps into the ground water, and chemical wastes can give off a toxic vapor that contaminates the air.
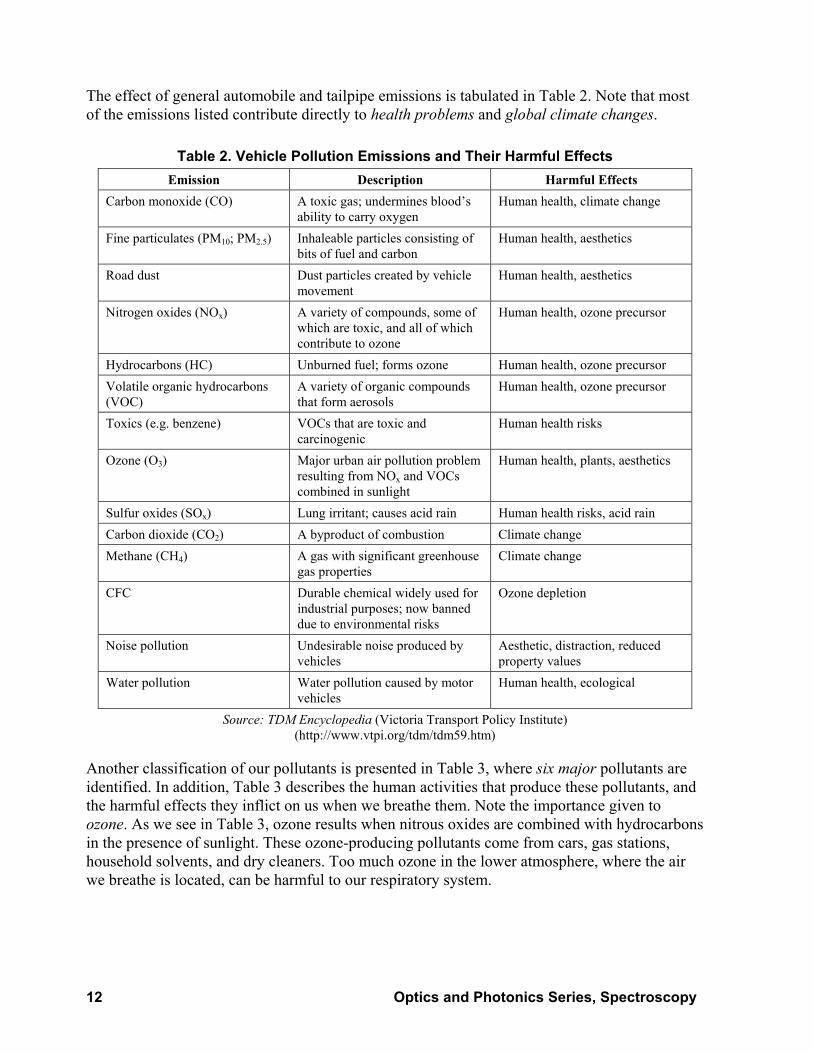
Water pollution Water pollution involves the contamination of our water-based environment with man-made wastes (Figure 8). The pollution of water seriously impacts all living creatures and directly affects the supply of safe water for drinking, household needs, sanitation, recreation, fishing, transportation, and commerce. Only 3 percent of water is potable, meaning that it is safe for cooking and consumption.
Man-made waste sources that contaminate water include raw sewage, trash, chemicals,
Figure 8 Water pollution
fertilizers, and even acid rain. When water is contaminated with untreated sewage, it can cause diarrheal diseases in people who drink it. Another type of water pollution occurs when ground water is contaminated with fertilizer products, leading to a nitrification and phosphorization of

10 Optics and Photonics Series, Spectroscopy
the water. These added nutrients (nitrogen and phosphorus) change the chemistry of the water. When this water runs into lakes and oceans it causes algae and aquatic plants to grow excessively and choke off open water areas, depriving them of needed oxygen. As a result, fish and other organisms may die for lack of oxygen. Other types of water pollution, as we have already mentioned, come from trash dumped in or near bodies of water and from toxic chemicals seeping—one way or another—into the water.
Pollutants that render water unsafe include the elements arsenic, lead, and mercury, as well as microbial pathogens, untreated sewage, contaminated sediment, dredged material, and disinfection by-products. It is the goal of technicians working in the environmental monitoring field to use spectroscopic instrumentation, whether it be Raman scattering equipment, LIBS systems, or other spectrophotometers, to identify pollutants and their concentration and to help devise controls to keep the pollutants within safe limits.
Air pollution While land pollution and water pollution are of major concern to us as human beings, we are probably more aware of the hazards of air pollution. With every breath we take, pollutants in air can infiltrate our lungs and affect our health. As in land and water pollution, the culprit in air pollution is man-made waste.
The air we breathe is made up of a mixture of common gases: 78 percent nitrogen, 21 percent oxygen, and around 1 percent other gases such as argon, carbon dioxide, and water vapor. The Earth’s air may also contain particulate pollutants that are odorless and colorless. Other air pollution, such as smog—a haze or cloud of harmful particulates—can envelop an entire city.
Many times, factories and smokestack industries release greenhouse gases such as carbon dioxide, chloro-fluoro-carbons (CFC), methane, and nitrous oxide, as pictured in Figure 9.
Figure 9 Emission of greenhouse gases
These gases lead to the “greenhouse effect” or global warming. This is a phenomenon wherein the greenhouse gases trap heat in the atmosphere and, in so doing, raise the temperature of the Earth. The burning of fossil fuels (mainly coal) can also release harmful gases.
The gases and particulates which form the major air pollutants are:
Carbon dioxide (CO2) Nitrogen oxides (NOx)
Carbon monoxide (CO) Hydrocarbons
Sulfur oxides (SOx) Particulates, like lead
Serious sources of air pollution are emissions from smokestack industries and automobile exhaust pipes. In the U.S., roughly 67 percent of sulfur dioxide (SO2) and 25 percent of all nitrous oxides (NOx) come from electric power generation that depends on the burning of fossil

Spectroscopy and Pollution Monitoring 11
fuels such as coal and oil. When the SOx and NOx compounds react with water, oxygen and other chemicals in the air form mild solutions of sulfuric acid (H2SO4) and nitric acid (HNO3). The end product is acid rain. Figure 10 illustrates the process from the formation of pollutants to the deposition of acid rain.
Figure 10 From the formation of pollutants to the deposition of acid rain
We are a nation of drivers. Transportation accounts for about 30 percent of total U.S. energy consumption and about 70 percent of petroleum (hydrocarbon) consumption. Table 1 breaks down the vehicle types and their use of energy. Note that automobiles lead the entire family of transportation vehicles in energy consumption.
Table 1. Energy Use by Vehicle Type Trillion BTUs Percent of Total Automobiles 9,126 34.0% Light trucks (including vans and SUVs) 6,617 25.0% Trucks and private buses 4,563 17.0% Aviation 2,546 10.0% Water 1,300 4.9% Pipeline 1,009 3.8% Off-highway (construction and agriculture) 680 2.5% Railroads 607 2.3% Buses 207 0.8% Motorcycles 26 0.1%
Source: TDM Encyclopedia (Victoria Transport Policy Institute) (http://www.vtpi.org/tdm/tdm59.htm)
12 Optics and Photonics Series, Spectroscopy
The effect of general automobile and tailpipe emissions is tabulated in Table 2. Note that most of the emissions listed contribute directly to health problems and global climate changes.
Table 2. Vehicle Pollution Emissions and Their Harmful Effects Emission Description Harmful Effects
Carbon monoxide (CO) A toxic gas; undermines blood’s ability to carry oxygen
Human health, climate change
Fine particulates (PM10; PM2.5) Inhaleable particles consisting of bits of fuel and carbon
Human health, aesthetics
Road dust Dust particles created by vehicle movement
Human health, aesthetics
Nitrogen oxides (NOx) A variety of compounds, some of which are toxic, and all of which contribute to ozone
Human health, ozone precursor
Hydrocarbons (HC) Unburned fuel; forms ozone Human health, ozone precursor Volatile organic hydrocarbons (VOC)
A variety of organic compounds that form aerosols
Human health, ozone precursor
Toxics (e.g. benzene) VOCs that are toxic and carcinogenic
Human health risks
Ozone (O3) Major urban air pollution problem resulting from NOx and VOCs combined in sunlight
Human health, plants, aesthetics
Sulfur oxides (SOx) Lung irritant; causes acid rain Human health risks, acid rain Carbon dioxide (CO2) A byproduct of combustion Climate change Methane (CH4) A gas with significant greenhouse
gas properties Climate change
CFC Durable chemical widely used for industrial purposes; now banned due to environmental risks
Ozone depletion
Noise pollution Undesirable noise produced by vehicles
Aesthetic, distraction, reduced property values
Water pollution Water pollution caused by motor vehicles
Human health, ecological
Source: TDM Encyclopedia (Victoria Transport Policy Institute) (http://www.vtpi.org/tdm/tdm59.htm)
Another classification of our pollutants is presented in Table 3, where six major pollutants are identified. In addition, Table 3 describes the human activities that produce these pollutants, and the harmful effects they inflict on us when we breathe them. Note the importance given to ozone. As we see in Table 3, ozone results when nitrous oxides are combined with hydrocarbons in the presence of sunlight. These ozone-producing pollutants come from cars, gas stations, household solvents, and dry cleaners. Too much ozone in the lower atmosphere, where the air we breathe is located, can be harmful to our respiratory system.

Spectroscopy and Pollution Monitoring 13
Table 3. Six Major Air Pollutants Pollutant Human Activity Sources Effects
Nitrogen oxides Automobile exhausts, industrial and power plant furnaces
Irritate lungs, eyes, throat, and nose; fatal in high concentrations; reduce plant growth and seed production; damage eggs of fish; react with other chemicals to form acid rain and ozone
Sulfur oxides Home, industrial, and power plant furnaces
Aggravate lung diseases; stunt plant growth; damage buildings, metals, rubber, paper, paint, and other materials; react with water to form acid rain
Carbon monoxide Primarily automobile exhaust Displaces oxygen in the blood, causing impaired vision and reflexes and finally death
Lead Formerly by the use of leaded gasoline; also by metal smelters and battery-acid plants
Affects blood-forming reproductive, nervous, and kidney systems; can cause learning and behavior problems in children
Particulates Coal-burning power plants, steel mills, mining operations, volcanoes, and forest fires
Can aggravate heart and respiratory problems; can carry carcinogenic compounds into lungs, soil, buildings, and painted surfaces; interfere with photosynthesis
Ozone Produced by combining of nitrogen oxides and hydrocarbons; these come from automobiles, gas stations, dry cleaners, household solvents
Adversely affects respiratory system; damages crops, trees, seeds, and fruits; damages rubber and paint
Source: Air and Other Gases (CORD, 1999)
On the other hand, the presence of ozone in the upper atmosphere is beneficial to us. Here ozone absorbs harmful ultraviolet radiation, which can cause skin cancer and cataracts.
Ozone depletion in the upper atmosphere is linked to the presence of chlorofluorocarbons (CFC). These CFCs contain highly reactive chlorine atoms that are released when the CFCs break down. They react with the ozone and help to destroy the ozone layer. Significant efforts have been made to eliminate CFCs in air conditioning systems in our homes and cars, in refrigerators, and in propellants in aerosol spray cans.
Spread of air pollutants Before we leave this section on air pollution, we should say a word or two about how gases (pollutants) can spread and disperse into the atmosphere or along the ground. How this dispersion or diffusion occurs depends on two properties of the gas—its density and its molecular weight.
The density and molecular weight of several common gases are given in Table 4. Each value is at standard temperature (0°C) and standard pressure (760 mm Hg).

14 Optics and Photonics Series, Spectroscopy
Table 4. Density and Molecular Weight of Several Common Gases (at 0°C and 760 mm Hg)
Gas Density (g/liter) Molecular weight (g/mole) Air 1.293 29.0 Carbon dioxide 1.977 44.0 Hydrogen 0.090 2.0 Helium 0.178 4.0 Nitrogen 1.251 28.0 Oxygen 1.429 32.0
Note that dry air has a density of 1.293 grams per liter. Any gas with a higher density than 1.293 g/ such as carbon dioxide, nitrogen, and oxygen will sink to the ground and even collect as gas pockets in valleys and depressions along the ground. Any gas with a density lower than air (such as hydrogen, helium, and steam) will rise to higher altitudes. (We are all familiar with the natural tendency of helium-filled balloons to rise.) In short, gases of higher density than air will sink and diffuse near the ground; gases of lower density will rise and spread out at higher elevations.
Example 3 A molecule of sulfur dioxide (SO2) is made up of one atom of sulfur and two atoms of oxygen. If a gas of pure SO2 escapes into the air, will it rise or sink?
Solution Sulfur has an atomic weight of 32 g, while oxygen has an atomic weight of 16 g. Thus, the gram molecular weight of SO2 is equal to (32 + 2 × 16) g or 64 g. Since this is a gram molecular weight equal to one mole, it fills a volume of 22.4 liters at standard temperature and pressure. Thus, the density of SO2 is given by
density = mass of one mole in g22.4 liter
density = 64 g22.4 = 2.86 g/l
Since the density of dry air is around 1.29 g/l, a pure gas of SO2 is more than twice as dense as air and will sink to the ground.
In addition to gas density as a determining factor in gas dispersion, one can show that gases with higher molecular weights (MW) diffuse or spread more slowly than gases with lower MW. This is summed up in Graham’s law by Equation 2.
2
1
VV
= 1
2
MWMW
(2)
where V2 is the speed of diffusion of gas with molecular weight MW2 and V1 is the speed of diffusion of gas with molecular weight MW1.

Spectroscopy and Pollution Monitoring 15
Example 4 Nitrogen oxide (NO2) has a molecular weight of 46 grams per mole (14 + 2 × 16 = 46) and sulfur dioxide (SO2) has a molecular weight of 64 grams/mole (32 + 2 × 16 = 64). According to Graham’s law, how much faster does NO2 spread than SO2?
Solution
2
2
NO
SO
VV = 2
2
of SO of NO
MWMW
2
2
NO
SO
VV = 64
46 = 8
6.78 = 1.18
Thus, the lighter NO2 molecules will spread out about 1.2 times faster than the heavier SO2 molecules.
Common Pollution Problems Let us now turn our attention to several of the more common (notorious) pollution problems we face—acid rain, smog, and global warming.
Acid rain “Acid rain” is a broad term referring to a mixture of wet and dry material falling from the atmosphere and containing higher-than-normal amounts of nitric and sulfuric acids. When we burn fossil fuels (coal, oil, and natural gases), we produce oxides of nitrogen and sulfur, in several forms such as SO2, SO3, NO, or NO2. We often refer to these oxides with the general notation SOx (sulfur oxides) and NOx (nitrogen oxides). When SOx and NOx get into the air—as depicted in Figure 11—they combine with water in the atmosphere to form acids.
For example, SO3 combines with water (H2O) to form sulfuric acid (H2SO4), as follows:
SO3 + H2O → H2SO4
Then, when it rains, the acids fall to Earth as acid rain.
An acid is any substance that gives hydrogen ions (H+)—an atom of ordinary hydrogen stripped of its single electron—to a solution, while a base alkaline is any substance that removes hydrogen ions (H+) from a solution. For example, when an acid such as hydrochloric acid (HCl) is added to water, the following reaction, called ionization, happens:
HCl (in water) → H+ + Cl⎯
Notice that in water HCl ionizes to form a positive ion (H+) and a negative ion (Cl⎯). The more H+ ions produced in the solution, the more acidic the solution becomes.
A measure of the concentration of H+ ions produced in the solution is called its pH. The value of pH for any solution determines how acidic or how basic (alkaline) the solutions is. The pH of a solution is related to the H+ ion concentration, denoted as [H+], by the following relationship:
pH = –log10 [H+] (3)

16 Optics and Photonics Series, Spectroscopy
Figure 11 Formation of acid rain
The pH values for solutions of different H+ concentrations are shown in Figure 12.
Figure 12 pH values for solutions of different concentrations of H+ ions
For example, from Figure 12, if the moles/liter of H+ is, say, 10–3, the concentration [H+] is 10–3. Then Equation 3 becomes
pH = –log10 [10–3] = –(–3) = 3
as shown along the lower pH scale of Figure 12.

Spectroscopy and Pollution Monitoring 17
Example 5 The H+ ion concentration is found to be [H+] = 10–7 for one solution and 10–12 for another. What is the pH for each solution?
Solution From Equation 12, for [H+] = 10–7,
pH = –log10 [10–7] = –(–7) = 7
From Equation 12, for [H+] = 10–12,
pH = –log10 [10–12] = –(–12) = 12
In accordance with Figure 12, solutions with a pH in the range of 0 to 7 are acidic, and solutions with a pH in the range of 7 to 14 are alkalinic. A solution with a pH of 7 is considered neutral, as in the case of pure water, which is neither an acid nor a base.
When an acid such as H2SO4 is spilled on the soil, the acid ionizes in the soil water, spreads outward and downward within the soil water, and eventually reaches sources of groundwater (rivers, lakes, streams) and contaminates them.
Harmful effects of acid rain—Thus, acid rain causes lakes and streams to become acidic and contributes to damage to trees at high elevations—such as red spruce trees above 2,000 feet. Acid rain affects many sensitive forest soils. In addition, acid rain speeds up the decay of building materials, paints, and structures such as buildings and bridges. Beyond this, acid rain gradually defaces the statues and sculptures that help to preserve our national heritage. Significant amounts of acid rain reduce visibility and damage respiratory health. As of the year 2000, the most acidic rain falling in the U.S. had a pH near 4.3.
Reducing acid rain—As we have indicated, almost all of the electricity that supports modern life comes from the burning of fossil fuels such as coal, natural gas, and oil. And when fossil fuels are burned, they release the two offending pollutants, SOx and NOx. To reduce these polluting emissions, power plants can use lower-sulfur coal, wash the coal to remove coal dust, and use a technology involving “scrubbers.” These devices chemically remove SO2 from gases as they leave smokestacks. In addition, power plants can switch fuels (from coal to natural gas, for example) and develop and use alternative energy sources such as nuclear power, hydroelectric power, solar energy, wind farms, and geothermal energy.
Alongside power plants as major contributors to SOx and NOx in the atmosphere, we have tailpipe emissions from automobiles. Catalytic converters, which are similar to power plant scrubbers, reduce NOx emissions from cars and help clean up the air. Whenever and however man reduces the release of SOx and NOx into the atmosphere, the environment and human health will benefit from the resulting reduction in acid rain.
Smog Smog is a mixture of smoke, water droplets, and gases trapped in the air blanket near the ground. The trapped gases include sulfur oxides, nitrogen oxides—the “bad boys” of acid rain—carbon monoxide, incompletely burned hydrocarbons, and, most importantly, ozone. It is the

18 Optics and Photonics Series, Spectroscopy
presence of ozone at ground level that contributes to the choking, coughing, and stinging eyes we experience in the midst of smog.
Smog-forming pollutants come from sources such as tailpipe emissions, power plants, factories, and many things we use around the house such as paints, hair spray, charcoal starter fluids, solvents, and various forms of plastic packaging. In urban areas—especially in large cities like Los Angeles and Mexico City—at least half of the smog comes from cars, buses, trucks, and boats. Major smog events are linked to high temperature, abundant sunshine, winds, and temperature inversions. In general, smog is more severe on hot, sunny days.
The harmful effects of smog—Smog causes health problems associated with difficulty in breathing, asthma, lung infections, colds, and eye irritation. The principal pollutant in smog, ozone, further inhibits plant growth and can cause considerable damage to forests and crops. And everyone who has experienced smog in large urban areas (population 250,000 or more) knows that visibility while driving is significantly reduced.
Reducing smog—Actions that help to reduce acid rain also help to reduce smog. In particular, most large communities are taking the following steps to control smog:
• Change the composition of gasoline used in automobiles
• Use alternative fuels such as natural gas rather than coal and oil
• Ban charcoal burners and wood burning in stoves and fireplaces where ozone levels are high
• Cut down on tailpipe emissions by encouraging car pooling
• Restrict traffic volume in congested travel areas
• Improve accessibility and volume of public transportation
• Assess “smog fees” on cars based on miles driven and on levels of tailpipe emissions produced
• Buy and scrap old cars that emit relatively large amounts of dirty exhaust As mentioned in the discussion on acid rain, catalytic converters installed in the exhaust systems of automobiles and trucks reduce the amounts of carbon monoxide (CO) and nitrogen oxides (NOx) in tailpipe emissions. And with reference to the first beneficial action given in the list above, if combustion of gasoline in cars’ engines were completely efficient, the gasoline, a hydrocarbon fuel, would be completely oxidized and lead to the emission of harmless products—CO2 and H2O—as shown below.
2C8H18 + 2502 → 16CO2 + 18H2O(Octane)
Of course, exhaust fumes still contain CO, NOx and SOx, even though reduced by the presence of the catalytic converter.
Laser-Based Gas Sensing Measurement techniques in gas spectrophotometry use several types of lasers to detect trace gases such as CO, NOx and SOx with emission wavelengths in the mid-infrared spectral range.
Spectroscopy and Pollution Monitoring 19
This detection process can sense the presence of trace gases at extremely low levels—parts per million to parts per billion.
Without going into the details of the laser technology involved—that is beyond the scope of this module—we list three available measurement techniques. (They are taken from the April 2006 issue of Photonics Spectra).
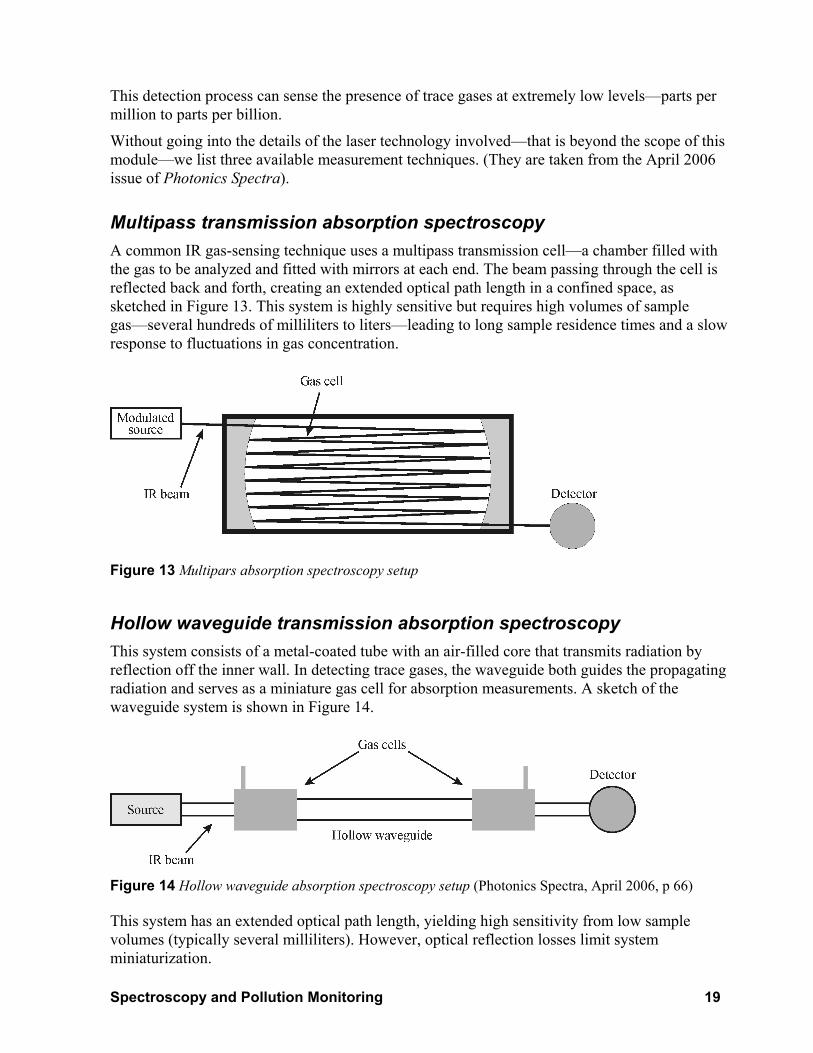
Multipass transmission absorption spectroscopy A common IR gas-sensing technique uses a multipass transmission cell—a chamber filled with the gas to be analyzed and fitted with mirrors at each end. The beam passing through the cell is reflected back and forth, creating an extended optical path length in a confined space, as sketched in Figure 13. This system is highly sensitive but requires high volumes of sample gas—several hundreds of milliliters to liters—leading to long sample residence times and a slow response to fluctuations in gas concentration.
Figure 13 Multipars absorption spectroscopy setup
Hollow waveguide transmission absorption spectroscopy This system consists of a metal-coated tube with an air-filled core that transmits radiation by reflection off the inner wall. In detecting trace gases, the waveguide both guides the propagating radiation and serves as a miniature gas cell for absorption measurements. A sketch of the waveguide system is shown in Figure 14.
Figure 14 Hollow waveguide absorption spectroscopy setup (Photonics Spectra, April 2006, p 66)
This system has an extended optical path length, yielding high sensitivity from low sample volumes (typically several milliliters). However, optical reflection losses limit system miniaturization.

20 Optics and Photonics Series, Spectroscopy
Light detection and ranging (LIDAR) LIDAR is a measuring process commonly used in atmospheric sensing wherein light from a source (in this case, IR radiation) is transmitted over large distances to a target and is partially reflected to a detector, as sketched in Figure 15. Changes in the properties of the reflected light provide useful information about the target—a factory smokestack belching toxic emissions, for example. Alternatively, the LIDAR system can also provide the identity of gaseous compounds situated between the source and the target.
Figure 15 LIDAR system used to detect distant trace gases (Photonics Spectra, April 2006, p 67)
A variation in the LIDAR techniques, called differential absorption LIDAR, can be used to detect atmospheric gases or pollutants by examining the ratio of the intensity of a beam incident on the absorbing sample to the intensity of a beam used as a reference.
Global Warming and the Greenhouse Effect We now turn to one of the “hottest” topics capturing the attention of scientists and concerned citizens during the first decade of the 21st century—global warming.
What is global warming? In a few words, global warming is the increase in the average temperature of the Earth’s near-surface blanket of air. For example, the average air temperature near the Earth’s surface increased by 0.74 ± 0.18°C during the past century. Various climate models predict that global surface temperatures are likely to rise by 1.1 to 6.4°C between now and the year 2100.

Spectroscopy and Pollution Monitoring 21
An increase in global warming can have serious weather and environmental effects. One can expect ice-cap melting at the poles, leading to a rise in sea levels. One can expect changes in the amount and location of precipitation, resulting in floods and drought. One can also expect changes in agricultural yields, glacier retreat, extinction of certain plant and animal species, and increases in the global spreading of various diseases.
How does global warming occur? The Earth both receives and emits radiation, maintaining a reasonable balance. Most of the ultraviolet and visible radiation from the sun that is not scattered back to space by the Earth’s atmosphere is transmitted to the Earth’s surface – its land and its water. Very little is absorbed by the atmosphere. The part transmitted is largely absorbed at the surface, heating the land and the water.
Part of the energy absorbed at the surface is reradiated to the atmosphere as long-wave infrared radiation. The longer-wavelength reradiated infrared emission occurs because the Earth is cooler and thus emits IR at longer wavelengths. But the atmosphere is not completely transparent to this longer-wavelength IR radiation because the atmosphere contains carbon dioxide (CO2), water vapor (H2O), ozone (O3) and methane (CH4)—the so-called greenhouse gases. These gases absorb a considerable portion of the long-wavelength IR radiation before partially reradiating it back to the Earth’s surface.
Thus, although a large portion of short-wave (UV and visible) radiation from the sun is transmitted through the atmosphere to the ground, a large portion of the reradiated long-wave IR radiation is trapped by the atmosphere and does not escape back into space. This causes the Earth’s atmosphere to rise to a higher temperature than would otherwise be the case. The conclusion is obvious: Reduce the concentration of greenhouse gases in the atmosphere and global warming will be brought under control.
In the “florist’s greenhouse”—after which the greenhouse effect and greenhouse analogy are named—the glass windows transmit the solar radiation into the greenhouse but partially trap the longer IR radiation emitted by the cooler plants and soil. This trapped radiation and the blocking of natural convective forces that would otherwise allow hot air to rise and escape from the greenhouse cause the temperature in the greenhouse to rise above that of the free air outside. The similarity between the effects of radiative and convective forces in the florist’s greenhouse and the global atmospheric warming described above accounts for the tendency to speak of global warming and the greenhouse effect in the same context.
On Earth, each greenhouse gas contributes to the greenhouse effect. Water vapor contributes about 36–70 percent, carbon dioxide about 9–26 percent, methane about 4–9 percent, and ozone about 3–7 percent. The main culprit is CO2, which has been increasing in the atmosphere due to our increased reliance on fossil fuels. Let us not overlook, however, the fact that greenhouse gases and the greenhouse effect are also beneficial to our planet. Without them our atmosphere would be cooler and our nighttimes would be much colder. It is just a matter of too much of a good thing—too much CO2 and H2O.
Figure 16 presents a helpful picture of energy transfer and balance between outer space, the Earth’s atmosphere, and the Earth’s surface. The numbers, in watts/m2 of radiation power density, help us keep track of the transfers involved.

22 Optics and Photonics Series, Spectroscopy
Figure 16 Exchanges of energy between outer space, the Earth’s atmosphere, and the Earth’s surface
A close examination of Figure 16 reveals the following:
• Solar input is 235 w/m2 (168 w/m2 to Earth’s surface, 67 w/m2 to Earth’s atmosphere).
• Radiation back to space is the same—235 w/m2 (195 w/m2 from atmosphere, 40 w/m2 from Earth’s surface).
• Radiation given up by the atmosphere is 519 w/m2 (324 w/m2 to Earth’s surface, 195 w/m2 into space).
• Radiation deposited in the atmosphere is the same—519 w/m2 (67 w/m2 from the sun, 452 w/m2 trapped by the greenhouse gases). (adapted from Wikipedia, “Greenhouse Effect”)
Figure 16 outlines the greenhouse effect, in which radiation is trapped in the atmosphere, exchanged with the Earth’s surface, and (in a small amount) reradiated back into space.
Controlling global warming will continue to be a major challenge for mankind. Reduction of CO2 in the atmosphere, presently at the level of about 383 parts per million (ppm) and increasing at the rate of 0.7 ppm per year, will be a necessary and positive step.
How do we reduce the concentration of greenhouse gases? The following actions will help.
• Burn fuels that are lower in sulfur content
• Develop technologies that burn fossil fuels more completely
• Scrub smokestack emissions
• Decrease conversion of forests and prairie lands to agricultural farms

Spectroscopy and Pollution Monitoring 23
• Reduce alteration of the Earth’s surface through deforestation and the creation of lakes
• Avoid spilling oil at sea
• Shift power generation from fossil fuels to nuclear power, wind power, solar power, and geothermal energy
Taken together, these actions will restore the Earth’s greenhouse gases to levels that will prevent further warming of the atmosphere.
Watchdog agencies Now that we have looked at important types of pollution, what causes them, and how we monitor and attempt to control them, let us list some of the nation’s important watchdog agencies whose task it is to monitor and control land, water, and air pollution.
• U.S. Environmental Protection Agency (USEPA)—a wide-reaching, powerful federal agency tasked with protecting the environment and human health
• U.S. Department of Agriculture (USDA)—concerned with all entities that affect the health and productivity of agriculture in the United States
• Centers for Disease Control (CDC)—concerned with the occurrence, spread, and control of all diseases that affect people, animals and plants; sensitive to the effects of pollution
• National Ambient Air Quality Standard (NAAQS)—concerned with establishing and maintaining natural standards for pollution-free air
• National Pollution Discharge Elimination System (NPDES)—concerned with control of water pollution by regulating sources that discharge pollutants into the waters of the United States
• National Atmospheric Deposition Program (NADP)—network of over 100 federal, state, and local government agencies and private sector organizations that collect data on acid rain and mercury deposition
• Clean Air Statues and Trends Network (CASTIN)—provides atmospheric data on acid rain, ground-level ozone, and other forms of atmospheric pollution
LABORATORIES
Lab 1: Measuring tailpipe gases This module has indicated the presence of toxic gases due to two major sources—smokestack industries and vehicle tailpipe emissions. This laboratory will introduce you to the automotive industry’s efforts to measure and control tailpipe emissions with the help of diagnostic gas analyzers. Since such instrumentation is not likely to be part of the laboratory equipment found in typical photonics programs, we have designed this laboratory around a visit to an automotive technology department in or around your two-year technical institute or college.

24 Optics and Photonics Series, Spectroscopy
In completing this laboratory you will visit an automotive technology department, examine the diagnostic gas analyzers in use, and talk with the lead automotive instructor. A set of questions has been designed to help you understand the diagnostic process, how the toxic gases are detected, and how automobile engines are built and tuned to minimize the production of tailpipe gases.
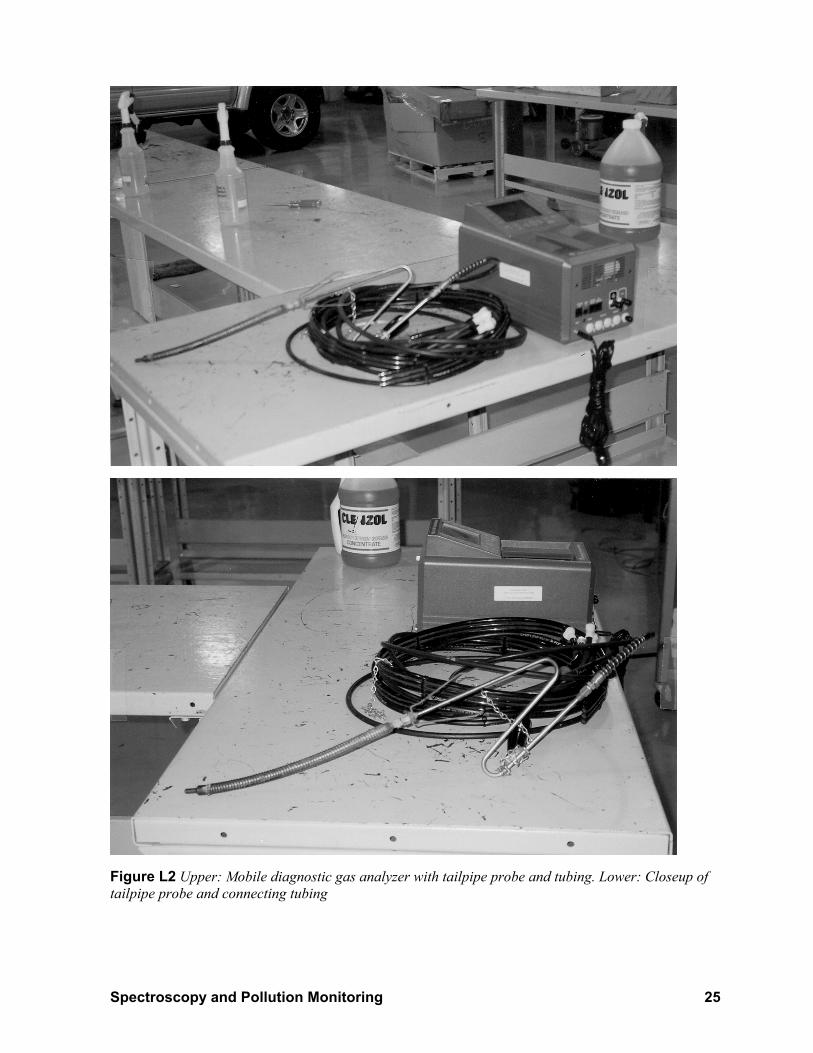
Figure L1 shows a diagnostic gas analyzer manufactured by SUN ELECTRIC U.K. LIMITED (model DGA 1000). The main parts include the diagnostic gas sampling system, a control panel with cursor keys, and a video display screen.
Figure L1 Overall view of a diagnostic automotive gas analyzer
A tailpipe probe, not shown in Figure L1, is depicted in Figure L2. The upper photo in Figure L2 shows a small portable diagnostic system with the tailpipe probe and connecting tubing. The lower photo shows a close-up of the tailpipe probe, indicating clearly the sensor that is inserted into the tailpipe.
Spectroscopy and Pollution Monitoring 25
Figure L2 Upper: Mobile diagnostic gas analyzer with tailpipe probe and tubing. Lower: Closeup of tailpipe probe and connecting tubing

26 Optics and Photonics Series, Spectroscopy
As you examine the diagnostic gas analyzer, seek permission from the instructor to take appropriate pictures and obtain answers to the questions that follow. The answers to these questions will help you prepare the final lab report.
1. What gases are detected by the gas analyzer? Is concentration measured in percentage (%) or parts per million (ppm)? Do all gas analyzers detect the same number of toxic gases?
2. If possible, obtain a printout of a tailpipe gas emission report identifying the gases detected and their concentrations. (Include this, with an explanation of the printout, in your write-up of this laboratory). Was the printout taken with engine idling, engine accelerating, or engine under load? Do the three engine conditions produce different results? What determines whether a car “fails” a tailpipe emission test?
3. What is a dynamometer and how is it used in testing for tailpipe gases?
4. What is a catalytic converter and how is it used to control tailpipe emissions?
5. Ask the instructor what is done, or should be done, to the fuel/air mixture and engine combustion temperature to achieve ideal engine performance to decrease the production of toxic gases?
6. Determine where the EPA Certification Lab is for your state and what role it plays in controlling tailpipe emissions?
7. What role does the National Air Ambient Quality Standard (NAAQS) play in your state?
8. How often is a diagnostic gas analyzer calibrated and who performs the calibration?
In your write-up of this laboratory, include photos you have taken, sketches of the tailpipe probe, printouts of the toxic gases present and their concentrations, ideal engine performance indicators for low toxic gas emissions, and the roles of state and national environmental protection agencies.
Lab 2: Detecting acid rain The following experiments (adapted from EPA teaching resources) have been chosen for their simplicity and for ready access to inexpensive lab materials. Each has to do with measuring pH to determine whether selected substances are acids or bases.
Lab 2, Experiment 1. Measuring the approximate pH of chemicals in water
Materials
pH paper and color chart (pH range 3 to 12) or garden soil pH testing kit
Distilled water (available at grocery stores and drug stores)
White vinegar
Household ammonia (or baking soda)
3 small, clear cups or glasses

Spectroscopy and Pollution Monitoring 27
3 stirring spoons
Measuring cups and spoons (1/2 cup, 1/4 cup, and 1 teaspoon)
Procedure
1. Rinse each cup with distilled water and shake out excess water. Label one cup vinegar, the second cup ammonia, and the third cup water.
2. Pour 1/2 cup distilled water into each of the 3 cups.
3. Add 1/2 teaspoon white vinegar to the vinegar cup and stir with a clean spoon.
4. Add 1/2 teaspoon ammonia to the ammonia cup and stir with a clean spoon.
5. Do not add anything to the water cup.
6. Dip an unused, clean strip of pH paper in the vinegar cup for about 2 seconds and immediately compare with the color chart. Write down the approximate pH value and set the cup aside. (If you are using a garden soil pH tester kit, pour 1/4 teaspoon of the contents of the vinegar cup into the test container and add 1/4 teaspoon of the test solution. Cover the test tube and shake once or twice to mix, or stir if necessary. Compare with the color chart provided in the kit and record the result.)
7. Dip an unused, clean strip of pH paper in the ammonia cup for about 2 seconds and immediately compare with the color chart. Write down the approximate pH value and set the cup aside. (If using a garden soil pH tester kit, repeat the same process in step 6, using the contents of the ammonia cup instead of the vinegar cup.)
8. Dip an unused, clean strip of pH paper into the water cup for about 2 seconds and immediately compare it with the color chart. Write down the approximate pH value. (If using a garden soil pH tester kit, repeat the same process above using the contents of the water cup instead of the ammonia cup.)
Questions
1. Is vinegar an acid or a base? What was the color of the pH strip?
2. Is ammonia (or baking soda) an acid or a base? What was the color of the pH strip?
3. Pure water has a pH of 7—indicating that pure water is neither an acid nor a base. What did you find for distilled water? Were you surprised? (Note: Carbon dioxide in the air mixes with the distilled water, making it somewhat acidic—pH between 5.6 and 7.) What happens if you add about 1/8 teaspoon of baking soda to the distilled water?
4. How can you use what you have learned here to detect pollution? What kind?
Lab 2, Experiment 2. Measuring pH of common substances In this experiment you will use a pH indicator to measure the pH of fruits, common beverages, and borax. Borax is a cleaning agent that is sometimes added to laundry detergent. It is available at grocery stores. Many foods and household cleaners are either acids or bases. Acids usually taste sour; bases usually taste bitter. Household cleaners are toxic, so you should never taste them, and you should learn how to control them.
28 Optics and Photonics Series, Spectroscopy
Materials
pH paper and color chart (range pH 2 to 12) or garden soil pH testing kit
3 fresh whole fruits (lemon, lime, orange or melon)
3 beverages (cola, carbonated non-cola, milk)
1/8 teaspoon borax
Measuring spoons (1/4 and 1/8 teaspoons)
4 small, clear cups or glasses
1 clean stirring spoon
Procedures
1. Cut each fruit in half, drying off the paring knife after each cut. (Why?)
2. Place an unused strip of pH paper half-on and half-off the inside of the cut fruit. Leave until wet (about 2 seconds). Immediately compare with the color chart. Write down the approximate pH value of the fruit. (If using a garden soil pH tester kit, squeeze 1/4 teaspoon of juice from the cut fruit into the test container and add 1/4 teaspoon of the test solution. Cover the test container and shake once or twice to mix, or stir if necessary. Compare with the color chart provided in the kit and record the result.)
3. Repeat the same process for the other 2 fruits.
4. Label the 3 cups—one cola, another noncola, and the third milk.
5. Pour each liquid into its labeled cup.
6. Dip an unused strip of pH paper into the cola, compare with the color chart, and record the result. Repeat the same process for the other beverages. Be sure to use a clean, unused strip of pH paper for each one. (If using a garden soil pH tester kit, pour 1/4 teaspoon of cola into the test container and add 1/4 teaspoon of the test solution. Tightly press your finger over the top of the test container and shake once or twice to mix, or stir if necessary. Compare with the color chart provided in the kit and record the result.)
7. Add 1/8 teaspoon borax to 1/4 cup distilled water and stir for about 2 minutes. Dip an unused strip of pH paper into the borax mixture, compare with the color chart, and record the result. (If using a garden soil pH tester kit, pour 1/4 teaspoon of the borax/water mixture into the test container and add 1/4 teaspoon of the test solution. Tightly press your finger over the top of the test container and gently shake, or stir if necessary. Compare with the color chart provided in the kit and record the result.)
Questions
1. Are the fruits acids or bases? What are their approximate pH values?
2. Are the colas and noncolas acids or bases? What is the approximate pH for each?
3. How did milk test out? (What you found may depend on the freshness of the milk and how it was processed at the dairy.)
4. Was the borax/water mixture acidic or basic? What was the approximate pH?
Spectroscopy and Pollution Monitoring 29
Lab 2, Experiment 3. Measuring the pH of neighborhood water sources In this experiment you will measure the pH of natural water sources located near your home or school.
Materials
pH paper and color chart (pH 2 to 7) or garden soil pH testing kit
Clean paper cups
Procedures
1. Locate a stream, river, lake, or pond. If possible, go with your instructor or a classmate.
2. Scoop some of the surface water into a cup. Identify the source of the water in your notes.
3. Measure the pH of the water using either pH paper or a garden soil pH testing kit; record the result.
Questions
1. Based on where you live and what you learned about acid rain, are you surprised by what you found?
2. If you tested multiple types of water sources (pond, river, lake, ocean), did each have about the same pH? Did any show evidence of acid rain?
Lab 2, Experiment 4. Measuring the pH of different soils In this experiment you will collect soil and measure its pH. The pH level is one of several important conditions that affect the health of plants and animals. In addition, you will also be asked to survey the plants and animals that live in the area where you collect the soil. Area surveys provide information about how well plants and animals can live under different environmental conditions.
For this experiment, you will need an inexpensive garden soil pH test kit. It can be obtained from lawn and garden stores or nurseries.
Materials
Garden soil pH test kit
Distilled water
2 cups of soil from each of two or three different locations
Measuring spoons
Digging tool
Self-sealing plastic bags

30 Optics and Photonics Series, Spectroscopy
Procedures
1. Pick two or three different soil locations, such as a garden, wooded area, city park, zoo grounds, or meadow. Go with your instructor or a classmate.
2. At each location, observe the plants and animals living in or rooted on these soils, especially those that are in greatest numbers. Write down in your notes as much as you can about what you find. Dig down about 2 inches, scoop out 2 cups of soil, and seal it in a plastic bag. Label each plastic bag. Be sure to clean your digging tool after collecting soil samples at each location.
3. Measure the pH of each soil sample following the directions provided in the garden soil pH test kit. Record the approximate pH of each soil sample.
Questions
1. Were any of your soil samples acidic? To what degree?
2. Did you collect soil from an area that is heavy in limestone? If so, what did you find?
3. Ask a florist in your neighborhood how to change the soil from acidic to basic? Ask your florist whether some plants do better in acidic soil? In basic soil?
4. Ask your florist what type of pollution one must protect against to grow healthy plants.
PROBLEM EXERCISES 1. List the three main parts of the Earth that are involved in pollution.
2. Use Equation 1 to calculate the reflecting power of an aloe-based skin lotion using an integrating sphere photometer. You are given that the radius of the integrating sphere is 20 cm, the reflectivity of the sphere is ρ = 0.96, the port fraction is f = 0.15, and the input flux from the skin lotion is 6 watts. What radiance Ls does the sphere develop?
3. The fingerprint of a spectra emitted by a toxic substance includes a wave number of 3000 cm–1. Convert this to an equivalent wavelength λ and frequency f, and identify where this emission lies in the EM spectrum.
4. Identify the six major air pollutants.
5. What are two major sources of air pollution we need to control?
6. List at least five toxic emissions from automobile tailpipes.
7. Assume that air is made up of 78 percent nitrogen (N2), 21 percent oxygen (O2) and 1 percent argon (A). Determine the density of air in grams/liter from the basic definition of gas density.
density (g/l) = Mol. Wt. in grams/mole22.4 liters/mole
Use the fact that a gram-molecular weight of any gas will occupy 22.4 liters at standard temperature and pressure, and that the gram molecular weights for nitrogen, oxygen, and

Spectroscopy and Pollution Monitoring 31
argon are 28 g/mole, 33 g/mole, and 40 g/mole respectively. Did your calculation for the density of air come close to 1.29g/l?
8. Use Graham’s law to calculate the speed-of-spreading ratio for the gas CO2 to the gas NO2.
9. The hydrogen ion concentration [H+] of a certain soil is found to be 10–13. What is the pH of this soil? Is it acidic or basic?
10. What are the offending gases found in smog?
11. Why is an increase in the atmospheric concentration of carbon dioxide (CO2) of major concern in global warming?
12. What are the greenhouse gases and why are they so named? Do the greenhouse gases serve a useful purpose?
BIBLIOGRAPHY “Sensing Trace Gases,” Photonics Spectra, A Lauren Publication, April 2006, Vol 40. Issue 4,
Pittsfield, Massachusetts.
Applications in Biology/Chemistry, Air and Other Gases, CORD, Waco, Texas, 1995.
Applications in Biology/Chemistry, Waste and Waste Management, CORD, Waco, Texas, 1995.
Benitz, J. Process Engineering and Design for Air Pollution, PTR Prentice Hall, 1993.
deNevers, N. Air Pollution Control Engineering, McGraw Hill, 1995.
Dubay, Lapinski, Schoch and Tweed, Environmental Science, 3rd Edition, New York: SFAW, 1999.
“Environmental Science – Pollution” (http://www.pages.drexel.edu; August 2000).
Giancoli, D.C., Physics, Prentice Hall, 2005.
Kaufman, D.G., and Franz, C.M., Biosphere 2000: Protecting Our Global Environment, New York: Harper Collins, 1993.
Pedrotti, F., Pedrotti, L.S., and Pedrotti, L.M., Introduction to Optics, Prentice Hall, 2007.
Serway, R.A., Principles of Physics, Saunders College Publishing, 1994.
Turco, R.P., Earth Under Siege from Air Pollution to Global Change, Oxford University Press, 1997.
Wark, K., Warner, C.F., and Davis, W.T., Air Pollution: Its Origin and Control, Addison-Wesley, 1998.