spectrum brands holdings 2010 annual report · my message is one of confi dence and opti-mism...
TRANSCRIPT

SPECTRUM BRANDS HOLDINGS 2010 Annual Report
Providing Quality and Value to Consumers Worldwide
™
GLOBAL BATTERIESOur battery products span the globe, from North America to Europe and Latin America where we are among the top one, two or three players in each region. In Central Eu-rope, the premium-positioned VARTA® is the second-largest alkaline battery brand. In North America, Rayovac® is the number- three brand with a well-defi ned value proposition, and in Latin America, the Rayovac® brand dominates the battery market. Our portfolio features a wide variety of consumer batteries, includingalkaline, zinc carbon, hearing aid, rechargeable batteries and chargers. Rayovac® and VARTA® also market portable lighting products.
PERSONAL CAREOur Remington® brand is a leading namein electric shaving and grooming andpersonal care products, including men’s and women’s shavers, beard and mustache trimmers, body trimmers, nose and ear trimmers, hair dryers, straightening irons, styling irons, and hairsetters. Innovative new products ensure strong market positions. In North America, Remington® is the market leader in grooming products and women’s shavers and holds the number-two position in men’s shavers. In the Asia-Pacifi c region and the U.K., Remington® is the market leader in grooming products and one of the top two hair care brands.
GLOBAL PET SUPPLIESSpectrum’s United Pet Group is one of the world’s largest specialty pet suppliers.In the aquatics category, Tetra® is the top global premium brand name. Tetra®
products include fi sh food and watertreatments, aquariums, fi lters, heaters,pumps and other aquatic supplies.Our companion pet products includetreats, clean-up and training aidproducts, health and grooming aids,and bedding. These are marketedunder brands such as 8-in-1®, Dingo®
and Nature’s Miracle®. United Pet’swell-known products have broad distribution throughout North America, Europe and Japan.
HOME & GARDENCutter®, Repel®, Hot Shot® and Spectracide® are among the highly recognized names in our United Industries’ Home & Garden portfolio of branded consumer products. They include home, lawn and garden insect and weed control products, personal and area mosquito repellents, and specialty plant care products which are attractive markets in North America with high barriers to entry. Retail distribution includes home improvement centers, mass merchandisers, hardware stores, grocery stores and drug chains. Within these retail locations, our products are typically positioned as the superior value brand and occupy a strong, number-two position in each category in which they compete.
SMALL APPLIANCESIn June 2010, Spectrum Brands acquired Russell Hobbs and its market-leading positions in six key kitchen appliance categories, including indoor grills, irons, toaster ovens, toasters, citrus juicers and breadmakers. Its well-known brands include George Foreman®,Black & Decker®, Breadman®, Farberware® and, in Europe, Russell Hobbs®. With strong relationships among major retailers, Russell Hobbs offers a convenient line of products that appeal to growing consumer trends for more healthy eating and stay-at-home cooking. Russell Hobbs products enjoy a leading presence in North America and Europe, primarily the U.K., with a growing position in Latin America.
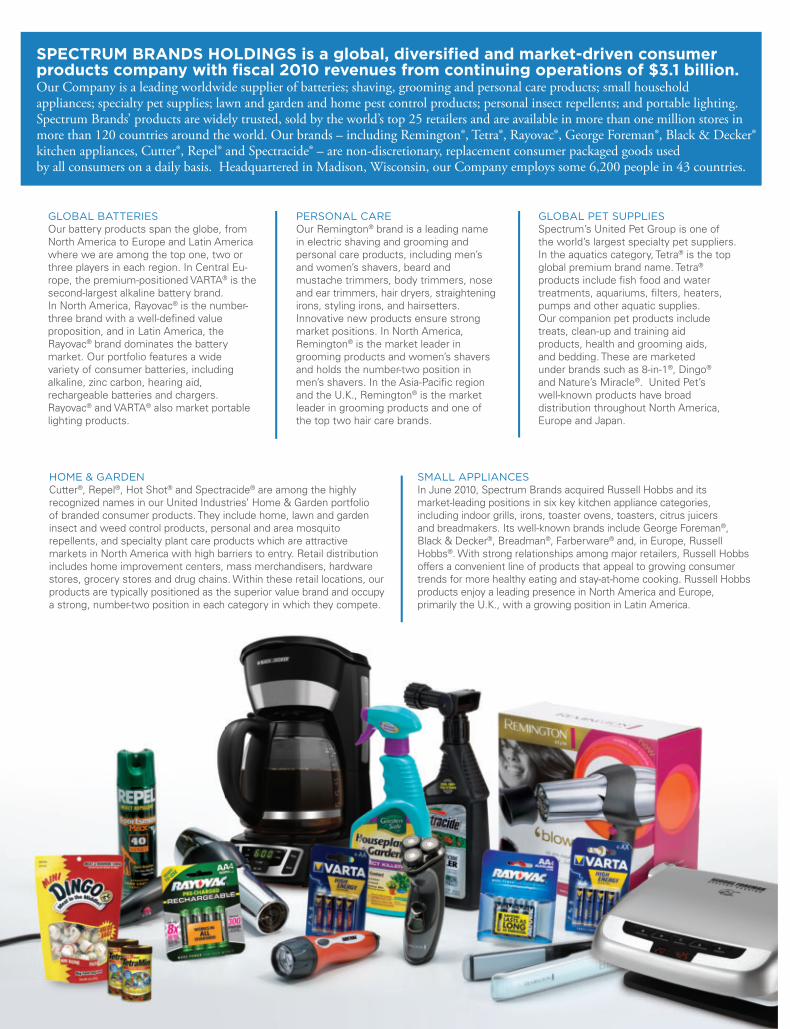
SPECTRUM BRANDS HOLDINGS is a global, diversifi ed and market-driven consumer products company with fi scal 2010 revenues from continuing operations of $3.1 billion. Our Company is a leading worldwide supplier of batteries; shaving, grooming and personal care products; small household appliances; specialty pet supplies; lawn and garden and home pest control products; personal insect repellents; and portable lighting. Spectrum Brands’ products are widely trusted, sold by the world’s top 25 retailers and are available in more than one million stores in more than 120 countries around the world. Our brands – including Remington®, Tetra®, Rayovac®, George Foreman®, Black & Decker® kitchen appliances, Cutter®, Repel® and Spectracide® – are non-discretionary, replacement consumer packaged goods used by all consumers on a daily basis. Headquartered in Madison, Wisconsin, our Company employs some 6,200 people in 43 countries.

My message is one of confi dence and opti-mism about the future of Spectrum Brands Holdings. Since becoming your new Chief Executive Offi cer in April 2010, we have worked diligently to develop a focused and realistic vision and plan to build a stronger Spectrum Brands. Our leadership team is tested and brings the deep experience required to steer our Company’s expansion.
Spectrum Brands completed a solid fi scal 2010, delivering net sales growth of 3.4 percent from continuing operations and a 10.5 percent increase in adjusted EBITDA, while ending the year with a strong liquidity position. We saw signifi cant market share gains in key product categories, and all segments reported increased adjusted EBITDA. Spectrum Brands is now a $3.1 billion, global consumer products company with a broad offering of widely trusted, extendable and like brands for like retailers that provide quality, performance and value to consumers worldwide. We enjoy a true global footprint with a solid presence on six continents in more than 120 countries.
We enter fi scal 2011 with momentum and an unwavering focus on our strategic, operational and fi nancial goals, and with compelling oppor-tunities for market share and EBITDA growth. We have the capacity to generate strong and continuous free cash fl ow built upon a diversifi ed revenue stream, attractive margins, and the top one, two or three global market position with powerful and enduring brand names in categories with limited signifi cant competitors.
A clear roadmap and multi-year strategy guide our efforts to drive additional shareholder value creation. Our vision is straightforward: To be the leader in retailer metrics with superior value consumer products for everyday use. We are on track or ahead of schedule to meet the fi nancial objectives we have developed, most importantly to create an additional $1 billion of enterprisevalue by the end of fi scal 2013 through a combination of adjusted EBITDA growth and aggressive debt reduction, which is already in motion. As a start, two voluntary prepayments of $50 million and $20 million in recent months have reduced our $750 million senior secured Term Loan to $680 million.
We believe fi scal 2011 should be another year of growth and progress. We expect net sales from continuing operations to increase 3 to 4 percent, adjusted EBITDA to grow to $455-$465 million, and free cash fl ow to reach $155-$165 million. Importantly, we anticipate cumulative debt reduction on our senior secured Term Loan in fi scal 2011 of at least $200 million.
A signifi cant fi scal 2010 achievement was our acquisition of the Russell Hobbs small appliances business, with its widely respected brands and leading market positions. Upon completion of this acquisition, our Company became Spectrum Brands Holdings from Spectrum Brands, Inc. As part of the Russell Hobbs merger, we completed a major debt refi nancing. This signifi cantly improved our Company’s fi nancial profi le by strengthening our capital structure, reducing fi nancial risk, improving our leverage
David R. LumleyChief Executive Offi cer and President – Global Batteries and Personal Care and Home and Garden
VISION
GOAL
Be Th e Leader in Retailer Metrics with Superior Value Consumer Products for Everyday Use
Create an Additional $1 Billion of Enterprise Value in Th ree Years Th rough a Combination of EBITDA Growth and Debt Reduction
TO OUR SHAREHOLDERSWith a pivotal and successful fi scal 2010 behind us and an outlook for even better performance in fi scal 2011, Spectrum Brands Holdings is moving into a promising new era, building a strong foundation for continuing growth and greater value creation.

MARKET POSITIONINGFocus on #2 brands in markets with high barriers to entry
VALUE TO RETAILERSBest retailer margin; category management; merchandising
The “Spectrum Value Model” differentiates Spectrum Brands and provides stability and sustainable earnings.{Spectrum
ValueModel
“SAME PERFORMANCE, LESS PRICE, BETTER VALUE”
1Product PerformanceMatch or exceed competitorproduct performance
2Focused InvestmentInvest in product performance,R&D and cost improvement
3Point of Sale FocusWin at point of sale, not through brand advertising
4Control CostsShared services, global new product development and common platforms
ratio and extending debt maturities, while enhancing liquidity and increasing capital available for growth.
The Russell Hobbs integration is on track, and we remain confi dent of achieving, and possibly exceeding, the $25-$30 million of cost synergies we have projected over the next few years. There are additional opportunities to capture revenue and new product development synergies as we begin leveraging each company’s regional strengths in complementary categories. Beyond Russell Hobbs, important integrations are occurring within our Global Pet and Home & Garden businesses, even as we have completed the relocation of our corporate headquarters from Atlanta back to Madison, Wisconsin. In short, Spectrum Brands now has a streamlined organization aligned along global business units, and connected through a shared services platform.
In addition to organic growth in our business segments, and a focus on driving more volume through our plants to improve capacity utiliza-tion rates, we look to grow our Global Pet and Home & Garden segments through small, bolt-on acquisitions. To that end, our Global Pet business recently completed an accretive $12.5 million acquisition of Seed Resources, a leader in the domestic wild bird seed cake businesswith its well-known Birdola® premium brand.
Our Spectrum Value Model is at the heart of our operating approach. As the accompanying chart shows, this model emphasizes providing value to the consumer with products that work as well as or better than our competition for a lower cost. We do this while also delivering higher retailer margins. We concentrate our efforts to win at point of sale and on creating andmaintaining a low-cost, effi cient operating struc-ture that allows our top-line growth to contribute directly to our profi tability. This operating model permeates our businesses. We live it every day.
We believe our superior value brand strategy is working well. We are maintaining or growing share in most of our key product categories. We continue to target driving our cost structure down and intend to move rapidly to strengthen our balance sheet with further and regular debt reduction payments.
The result is a more accountable, agile and competitive Spectrum Brands – a business much better positioned to generate steady and profi table margins. Although market conditions change constantly, our brand fundamentals – from manufacturing and distribution to product development and market position – are solid. As a result, we are confi dent in the ability of our focused businesses to more fully realize their potential going forward as businesses designed to deliver strong, consistent cash fl ow.

A key priority of your Board of Directors and senior management team is to ensure a high level of accountability to our shareholders. This is accomplished through management incentive compensation programs based on performance and aligned with investors’ priorities. A balance of long-term and short-term compensation programs for our top leadership team provides appropriate rewards for performance against specifi c metrics, predominantly adjusted EBITDA and free cash fl ow targets. Our major priority is aggressive, continu-ing debt reduction to materially strengthen our balance sheet.
Macroeconomictrends most likely will remain challeng-ing worldwide. We are not depending on any meaningful economic recovery or improvement in consumer spending in our outlook for higher sales and cash fl ow in fi scal 2011. One of our hallmark strengths, however, is that many Spectrum Brands products are non-discretionary, replacement products needed by consumers in their everyday lives.
Given this, we believe by providing superior margins to our customers and offering consumers the same performance at a better price or better performance at the same price is the winning strategy. As the global value proposition leader in our space, we will continue to move forward to invest in our business, reduce our cost structure, launch new products, grow EBITDA and provide strong free cash fl ow generation. We believe
our businesses should allow us to pay down debt by at least $200 million and grow adjusted EBITDA to $455-$465 million in fi scal 2011. This should allow us to reduce our leverage to 3 times or less by the end of fi scal 2012.
In closing, I want to thank our Board of Directors for their guidance, commitment and energy in building a prosperous Spectrum Brands. We also are grateful to our more than 6,000 talented and dedicated employees around the world for their
productivity and zeal.
Our Company’s exciting and promising journey carries on. We will stay the course, always looking to accelerate the pace when and where we can. Spectrum Brands has the vision, the mission, the strategy, the fi nancial and human resources, the business models, and the market and product opportunities needed to drive a
prosperous and rewarding future and even greater value for our stakeholder family. Thank you for your continued support.
Sincerely,
David R. LumleyChief Executive Offi cer and President – Global Batteries and Personal Care and Home and GardenJanuary 25, 2011
“ . . . our businesses should allow us to pay down debt by at least $200 million and grow adjusted EBITDA to
$455-$465 million in fi scal 2011.”

BOARD OF DIRECTORS
David M. Maura* ²
Vice President and Director of Investment, Harbinger Capital PartnersAge 38; Director since 2010
Kenneth C. Ambrecht ², ³
Managing Partner, KCA Associates LLCAge 65; Director since 2009
Eugene I. Davis ¹, ²
Chairman and CEO, Pirinate Consulting Group LLCAge 55; Director since 2009
Virginia A. Kamsky ³
Chairman and CEO, Kamsky Associates, Inc.Age 57; Director since 2010
Marc S. Kirschner ¹, ³
Independent Business Restructuring ConsultantAge 68; Director since 2009
David R. Lumley
Chief Executive Offi cer and President – Global Batteries and Personal Care and Home and Garden Spectrum Brands Holdings, Inc.Age 56; Director since 2010
Non-GAAP Measurements Within this annual report, reference is made to adjusted earnings before interest, taxes, depreciation and amortization (EBITDA) and free cash fl ow. These non-GAAP metrics are reconciled to their nearest GAAP equivalents within the Company’s Periodic Report on Form 8-K fi led with the SEC on December 6, 2010 within Exhibit 99.1 thereto. Adjusted EBITDA is a metric used by management and frequently used by the fi nancial community which provides insight into an organization’s operating trends and facilitates comparisons between peer companies, since interest, taxes, depreciation and amortization can differ greatly between organizations as a result of differing capital structures and tax strategies. Adjusted EBITDA can also be a useful measure of a company’s ability to service debt and is one of the measures used for determining the Company’s debt covenant compliance. Adjusted EBITDA excludes certain items that are unusual in nature or not comparable from period to period. The Company’s management believes that free cash fl ow is useful to both management and investors in their analysis of the Company’s ability to service and repay its debt and meet its working capital requirements. Free cash fl ow should not be considered in isolation or as a substitute for pretax income (loss), net income (loss), cash provided by (used in) operating activities or other statement of operations or cash fl ow statement data prepared in accordance with GAAP or as a measure of profi tability or liquidity. In addition, the calculation of free cash fl ow does not refl ect cash used to service debt and, therefore, does not refl ect funds available for investment or discretionary uses. While the Company’s management believes that non-GAAP measurements are useful supplemental information, such adjusted results are not intended to replace the Company’s GAAP fi nancial results and should be read in conjunction with those GAAP results.
DIRECTORS AND OFFICERS
Norman S. Matthews ³
Independent Business ConsultantAge 78; Director since 2009
Terry L. Polistina
President, Small Appliances, Spectrum Brands Holdings, Inc.Age 47; Director since 2009
Robin Roger ³
Managing Director and General Counsel, Harbinger Capital PartnersAge 53; Director since 2010
Hugh R. Rovit ¹
Chief Executive Offi cer, Sure Fit, Inc.Age 50; Director since 2009
*Interim Chairman of the Board
COMMITTEES OF THE BOARD
¹ Audit CommitteeMr. Davis is Chair.
² Compensation CommitteeMr. Ambrecht is Chair.
³ Nominating and Corporate Governance CommitteeMr. Matthews is Chair.
EXECUTIVE OFFICERS
David R. Lumley
Chief Executive Offi cer and President – Global Batteries and Personal Care and Home and Garden Age 56; joined Company in 2005
Anthony L. Genito
Executive Vice President and Chief Financial Offi cerAge 54; joined Company in 2004
John A. Heil
President, Global Pet SuppliesAge 58; joined Company in 2005
Terry L. Polistina
President, Small AppliancesAge 47; joined Company in 2010
John R. Wilson
Senior Vice President, Secretary and General CounselAge 36; joined Company in 2005
As of January 25, 2011

COMPARISON OF TOTAL STOCKHOLDER RETURN
The following graph compares the cumulative total stockholder return on our Common Stock to thecumulative total return of (i) the Russell 2000 Financial Index and (ii) our peer group selected in good faith,which is composed of the following companies: Alberto-Culver Company, Central Garden & Pet Company,Church & Dwight Co., Inc., The Clorox Company, Elizabeth Arden, Inc., Energizer Holdings, Inc., ExideTechnologies, Fortune Brands, Inc., Hasbro, Inc., Jarden Corporation, Mattel, Inc., Newell Rubbermaid Inc.,Revlon, Inc., The Scotts Miracle-Gro Company and Tupperware Brands Corporation.
The comparison below assumes that $100 was invested in (i) the common stock of SBI (the “SBI CommonStock”) from September 2, 2009 until June 16, 2010, and (ii) following the completion of the Merger, ourCommon Stock from June 16, 2010 until September 30, 2010. The comparison is based upon the closing price ofthe SBI Common Stock or our Common Stock, as applicable, and assumes the reinvestment of all dividends, ifany. The returns of each of the companies in our peer group are weighted according to the respective company’sstock market capitalization at the beginning of each period for which a return is indicated.
Comparison of Cumulative Total Return
$90
$100
$110
$120
$130
$140
$150
9/02/0
9
9/30/0
9
10/31
/09
11/30
/09
12/31
/09
1/31/1
0
2/28/1
0
3/31/1
0
4/30/1
0
5/31/1
0
6/30/1
0
7/31/1
0
8/31/1
0
9/30/1
0
Spectrum Brands Holdings, Inc. Russell 2000 Peer Group


UNITED STATESSECURITIES AND EXCHANGE COMMISSION
Washington, D.C. 20549
FORM 10-K
È ANNUAL REPORT PURSUANT TO SECTION 13 OR 15(d) OF THE SECURITIESEXCHANGE ACT OF 1934For the Fiscal Year Ended September 30, 2010.
OR
‘ TRANSITION REPORT PURSUANT TO SECTION 13 OR 15(d) OF THESECURITIES EXCHANGE ACT OF 1934For the transition period from to
Commission file No. 001-34757
SPECTRUM BRANDS HOLDINGS, INC.(Exact name of registrant as specified in its charter)
Delaware 27-2166630(State or other jurisdiction ofincorporation or organization)
(I.R.S. EmployerIdentification Number)
601 Rayovac Drive, Madison, Wisconsin 53711(Address of principal executive offices) (Zip Code)
Registrant’s telephone number, including area code: (608) 275-3340Securities registered pursuant to Section 12(b) of the Act:
NoneSecurities registered pursuant to Section 12(g) of the Act:
Title of each class
Common Stock, Par Value $.01
Indicate by check mark if the registrant is a well-known seasoned issuer, as defined in Rule 405 of the SecuritiesAct. Yes ‘ No È
Indicate by check mark if the registrant is not required to file reports pursuant to Section 13 or Section 15(d) of theAct. Yes ‘ No È
Indicate by check mark whether the registrant (1) has filed all reports required to be filed by Section 13 or 15(d) of theSecurities Exchange Act of 1934 during the preceding 12 months (or for such shorter period that the registrant was required to filesuch reports), and (2) has been subject to such filing requirements for the past 90 days. Yes È No ‘
Indicate by check mark whether the registrant has submitted electronically and posted on its corporate Web site, if any, everyInteractive Data File required to be submitted and posted pursuant to Rule 405 of Regulation S-T (§232.405 of this chapter) duringthe preceding 12 months (or for such shorter period that the registrant was required to submit and post such files). Yes ‘ No ‘
Indicate by check mark if disclosure of delinquent filers pursuant to Item 405 of Regulation S-K is not contained herein, andwill not be contained, to the best of registrant’s knowledge, in definitive proxy or information statements incorporated by referencein Part III of this Form 10-K or any amendment to this Form 10-K. ‘
Indicate by check mark whether the registrant is a large accelerated filer, an accelerated filer, a non-accelerated filer, or asmaller reporting company. See the definitions of “large accelerated filer,” “accelerated filer” and “smaller reporting company” inRule 12b-2 of the Exchange Act. (Check one):
Large accelerated filer ‘ Accelerated filer È Non-accelerated filer (Do not check if a smaller reporting company)‘Smaller reporting company ‘
Indicate by check mark whether the registrant is a shell company (as defined in Rule 12b-2 of the ExchangeAct). Yes ‘ No È
The aggregate market value of the voting stock held by non-affiliates of the registrant was approximately $484,943,967 basedupon the closing price on the last business day of the registrant’s (or its predecessor’s) most recently completed second fiscal quarter(April 1, 2010).* As of December 10, 2010, there were outstanding 51,020,426 shares of the registrant’s Common Stock, par value$0.01 per share.
DOCUMENTS INCORPORATED BY REFERENCEPortions of the registrant’s definitive proxy statement to be filed within 120 days of September 30, 2010 are incorporated by
reference in this Annual Report on Form 10-K in response to Part III, Items 10, 11, 12, 13 and 14.
* For purposes of this calculation only, shares of the registrant’s Common Stock, par value $0.01 per share, held by directors andexecutive officers and by Harbinger Capital Partners Master Fund I, Ltd., Harbinger Capital Partners Special SituationsFund, L.P. and Global Opportunities Breakaway Ltd. have been treated as owned by affiliates.

TABLE OF CONTENTS
Page
PART IITEM 1. BUSINESS . . . . . . . . . . . . . . . . . . . . . . . . . . . . . . . . . . . . . . . . . . . . . . . . . . . . . . . . . . . . . . . . . . 1
ITEM 1A. RISK FACTORS . . . . . . . . . . . . . . . . . . . . . . . . . . . . . . . . . . . . . . . . . . . . . . . . . . . . . . . . . . . . . 13
ITEM 1B. UNRESOLVED STAFF COMMENTS . . . . . . . . . . . . . . . . . . . . . . . . . . . . . . . . . . . . . . . . . . . 33
ITEM 2. PROPERTIES . . . . . . . . . . . . . . . . . . . . . . . . . . . . . . . . . . . . . . . . . . . . . . . . . . . . . . . . . . . . . . . 34
ITEM 3. LEGAL PROCEEDINGS . . . . . . . . . . . . . . . . . . . . . . . . . . . . . . . . . . . . . . . . . . . . . . . . . . . . . . 35
ITEM 4. (REMOVED AND RESERVED) . . . . . . . . . . . . . . . . . . . . . . . . . . . . . . . . . . . . . . . . . . . . . . . . 36
PART II
ITEM 5. MARKET FOR THE REGISTRANT’S COMMON EQUITY, RELATED STOCKHOLDERMATTERS AND ISSUER PURCHASES OF EQUITY SECURITIES . . . . . . . . . . . . . . . . . 37
ITEM 6. SELECTED FINANCIAL DATA . . . . . . . . . . . . . . . . . . . . . . . . . . . . . . . . . . . . . . . . . . . . . . . . 39
ITEM 7. MANAGEMENT’S DISCUSSION AND ANALYSIS OF FINANCIAL CONDITION ANDRESULTS OF OPERATIONS . . . . . . . . . . . . . . . . . . . . . . . . . . . . . . . . . . . . . . . . . . . . . . . . 42
ITEM 7A. QUANTITATIVE AND QUALITATIVE DISCLOSURES ABOUT MARKET RISK . . . . . . 84
ITEM 8. FINANCIAL STATEMENTS AND SUPPLEMENTARY DATA . . . . . . . . . . . . . . . . . . . . . . 85
ITEM 9. CHANGES IN AND DISAGREEMENTS WITH ACCOUNTANTS ON ACCOUNTINGAND FINANCIAL DISCLOSURE . . . . . . . . . . . . . . . . . . . . . . . . . . . . . . . . . . . . . . . . . . . . . 85
ITEM 9A. CONTROLS AND PROCEDURES . . . . . . . . . . . . . . . . . . . . . . . . . . . . . . . . . . . . . . . . . . . . . . 85
ITEM 9B. OTHER INFORMATION . . . . . . . . . . . . . . . . . . . . . . . . . . . . . . . . . . . . . . . . . . . . . . . . . . . . . . 86
PART III
ITEM 10. DIRECTORS, EXECUTIVE OFFICERS AND CORPORATE GOVERNANCE . . . . . . . . . . . 87
ITEM 11. EXECUTIVE COMPENSATION . . . . . . . . . . . . . . . . . . . . . . . . . . . . . . . . . . . . . . . . . . . . . . . . 87
ITEM 12. SECURITY OWNERSHIP OF CERTAIN BENEFICIAL OWNERS AND MANAGEMENTAND RELATED STOCKHOLDERMATTERS . . . . . . . . . . . . . . . . . . . . . . . . . . . . . . . . . . 88
ITEM 13. CERTAIN RELATIONSHIPS AND RELATED TRANSACTIONS AND DIRECTORINDEPENDENCE . . . . . . . . . . . . . . . . . . . . . . . . . . . . . . . . . . . . . . . . . . . . . . . . . . . . . . . . . . 88
ITEM 14. PRINCIPAL ACCOUNTING FEES AND SERVICES . . . . . . . . . . . . . . . . . . . . . . . . . . . . . . . 88
PART IV
ITEM 15. EXHIBITS, FINANCIAL STATEMENTS AND SCHEDULES . . . . . . . . . . . . . . . . . . . . . . . . 89
INDEX TO CONSOLIDATED FINANCIAL STATEMENTS AND FINANCIALSTATEMENT SCHEDULE . . . . . . . . . . . . . . . . . . . . . . . . . . . . . . . . . . . . . . . . . . . . . . . . . . 90
SIGNATURES . . . . . . . . . . . . . . . . . . . . . . . . . . . . . . . . . . . . . . . . . . . . . . . . . . . . . . . . . . . . . . . 169
EXHIBIT INDEX . . . . . . . . . . . . . . . . . . . . . . . . . . . . . . . . . . . . . . . . . . . . . . . . . . . . . . . . . . . . 170

PART I
ITEM 1. BUSINESS
General
Spectrum Brands Holdings, Inc., a Delaware corporation (“SB Holdings”), is a global branded consumerproducts company and was created in connection with the combination of Spectrum Brands, Inc. (“SpectrumBrands”), a global branded consumer products company and Russell Hobbs, Inc. (“Russell Hobbs”), a smallappliance brand company, to form a new combined company (the “Merger”). The Merger was consummated onJune 16, 2010. As a result of the Merger, both Spectrum Brands and Russell Hobbs are wholly-ownedsubsidiaries of SB Holdings and Russell Hobbs is a wholly-owned subsidiary of Spectrum Brands. SB Holdings’common stock trades on the New York Stock Exchange (the “NYSE”) under the symbol “SPB.”
Unless the context indicates otherwise, the terms the “Company,” “Spectrum,” “we,” “our” or “us” are usedto refer to SB Holdings and its subsidiaries subsequent to the Merger and Spectrum Brands prior to the Merger,as well as both before and on and after the Effective Date, as defined below. The term “Old Spectrum,” refersonly to Spectrum Brands, our Wisconsin predecessor, and its subsidiaries prior to the Effective Date.
In connection with the Merger, we refinanced Spectrum Brands’ existing senior debt, except for SpectrumBrands’ 12% Senior Subordinated Toggle Notes due 2019 (the “12% Notes”), which remain outstanding, and aportion of Russell Hobbs’ existing senior debt through a combination of a new $750 million Term Loan dueJune 16, 2016 (the “Term Loan”), new $750 million 9.5% Senior Secured Notes maturing June 15, 2018 (the“9.5% Notes”) and a new $300 million ABL revolving facility due June 16, 2014 (the “ABL Revolving CreditFacility” and together with the Term Loan, the “Senior Credit Facilities” and the Senior Credit Facilities togetherwith the 9.5% Notes, the “Senior Secured Facilities”).
As further described below, on February 3, 2009, we and our wholly owned United States (“U.S.”)subsidiaries (collectively, the “Debtors”) filed voluntary petitions under Chapter 11 of the U.S. Bankruptcy Code(the “Bankruptcy Code”), in the U.S. Bankruptcy Court for the Western District of Texas (the “BankruptcyCourt”). On August 28, 2009 (the “Effective Date”), the Debtors emerged from Chapter 11 of the BankruptcyCode. Effective as of the Effective Date and pursuant to the Debtors’ confirmed plan of reorganization, SpectrumBrands converted from a Wisconsin corporation to a Delaware corporation.
Financial information included in our financial statements prepared after August 30, 2009 will not becomparable to financial information from prior periods. See Item 1A. Risk Factors—“Risks Related To OurEmergence From Bankruptcy” for more information.
We are a global branded consumer products company with positions in seven major product categories:consumer batteries; small appliances; pet supplies; electric shaving and grooming; electric personal care; portablelighting; and home and garden control products.
We manage our business in four reportable segments: (i) Global Batteries & Personal Care, which consistsof our worldwide battery, shaving and grooming, personal care and portable lighting business (“GlobalBatteries & Personal Care”); (ii) Global Pet Supplies, which consists of our worldwide pet supplies business(“Global Pet Supplies”); (iii) the Home and Garden Business, which consists of our home and garden controlproduct offerings, including household insecticides, repellants and herbicides (the “Home and GardenBusiness”); and (iv) Small Appliances, which consists of small electrical appliances primarily in the kitchen andhome product categories (“Small Appliances”).
We manufacture and market alkaline, zinc carbon and hearing aid batteries, herbicides, insecticides andrepellants and specialty pet supplies. We design, market and distribute rechargeable batteries, battery-poweredlighting products, electric shavers and accessories, grooming products, hair care appliances, small household
1

appliances and personal care products. Our manufacturing and product development facilities are located in theU.S., Europe, Latin America and Asia. Substantially all of our rechargeable batteries and chargers, shaving andgrooming products, small household appliances, personal care products and portable lighting products aremanufactured by third-party suppliers, primarily located in Asia.
We sell our products in approximately 120 countries through a variety of trade channels, including retailers,wholesalers and distributors, hearing aid professionals, industrial distributors and original equipmentmanufacturers (“OEMs”) and enjoy strong name recognition in our markets under the Rayovac, VARTA andRemington brands, each of which has been in existence for more than 80 years, and under the Tetra, 8-in-1,Spectracide, Cutter, Black & Decker, George Foreman, Russell Hobbs, Farberware and various other brands.
Global and geographic strategic initiatives and financial objectives are determined at the corporate level.Each business segment is responsible for implementing defined strategic initiatives and achieving certainfinancial objectives and has a general manager responsible for sales and marketing initiatives and the financialresults for all product lines within that business segment.
Our operating performance is influenced by a number of factors including: general economic conditions;foreign exchange fluctuations; trends in consumer markets; consumer confidence and preferences; our overallproduct line mix, including pricing and gross margin, which vary by product line and geographic market; pricingof certain raw materials and commodities; energy and fuel prices; and our general competitive position,especially as impacted by our competitors’ advertising and promotional activities and pricing strategies.
In November 2008, our board of directors committed to the shutdown of the growing products portion of theHome and Garden Business, which includes the manufacturing and marketing of fertilizers, enriched soils, mulchand grass seed, following an evaluation of the historical lack of profitability and the projected input costs andsignificant working capital demands for the growing products portion of the Home and Garden Business for ourfiscal year ended September 30, 2009 (“Fiscal 2009”). We believe the shutdown was consistent with what wehave done in other areas of our business to eliminate unprofitable products from our portfolio. As of March 29,2009, we completed the shutdown of the growing products portion of the Home and Garden Business.Accordingly, the presentation herein of the results of continuing operations excludes the growing productsportion of the Home and Garden Business for all periods presented. See Note 9, Discontinued Operations, to ourConsolidated Financial Statements included in this Annual Report on Form 10-K for further details on thedisposal of the growing products portion of the Home and Garden Business.
On December 15, 2008, prior to our Bankruptcy Filing, as defined below, Old Spectrum was advised that itscommon stock would be suspended from trading on the NYSE prior to the opening of the market onDecember 22, 2008. It was advised that the decision to suspend its common stock was reached in view of the factthat it had recently fallen below the NYSE’s continued listing standard regarding average global marketcapitalization over a consecutive 30 trading day period of not less than $25 million, the minimum threshold forlisting on the NYSE. Old Spectrum’s common stock was delisted from the NYSE effective January 23, 2009.
On March 18, 2010, the common stock of Spectrum Brands was listed on the NYSE. In connection with theconsummation of the Merger, on June 16, 2010 the common stock of Spectrum Brands was delisted from theNYSE and the common stock of SB Holdings succeeded to its listing status under the symbol “SPB.”
As a result of our Bankruptcy Filing, we were able to significantly reduce our indebtedness. As a result ofthe Merger, we were able to further reduce our outstanding debt leverage ratio. However, we continue to have asignificant amount of indebtedness relative to our competitors and paying down outstanding indebtednesscontinues to be a priority for us. The Bankruptcy Filing is discussed in more detail under “Chapter 11Proceedings.”
2

Chapter 11 Proceedings
On February 2, 2009, the Company did not make a $25.8 million interest payment due February 2, 2009 onthe Company’s 73⁄8% Senior Subordinated Notes due 2015 (the “73⁄8 Notes”), triggering a default with respect tothe notes. On February 3, 2009, we announced that we had reached agreements with certain noteholders,representing, in the aggregate, approximately 70% of the face value of our then outstanding senior subordinatednotes, to pursue a refinancing that, if implemented as proposed, would significantly reduce our outstanding debt.As a result of its substantial leverage, the Company determined that, absent a financial restructuring, it would beunable to achieve future profitability or positive cash flows on a consolidated basis solely from cash generatedfrom operating activities or to satisfy certain of its payment obligations as the same may become due and be atrisk of not satisfying the leverage ratios to which it was subject under its then existing senior secured term loanfacility, which ratios became more restrictive in future periods. Accordingly, the Debtors filed voluntary petitionsunder Chapter 11 of the Bankruptcy Code, in the Bankruptcy Court (the “Bankruptcy Filing”) and filed with theBankruptcy Court a proposed plan of reorganization (the “Proposed Plan”) that detailed the Debtors’ proposedterms for the refinancing. The Chapter 11 cases were jointly administered by the Bankruptcy Court as CaseNo. 09-50455 (the “Bankruptcy Cases”). The Bankruptcy Court entered a written order (the “ConfirmationOrder”) on July 15, 2009 confirming the Proposed Plan (as so confirmed, the “Plan”).
On the Effective Date the Plan became effective, and the Debtors emerged from Chapter 11 of theBankruptcy Code. Pursuant to and by operation of the Plan, on the Effective Date, all of Old Spectrum’s existingequity securities, including the existing common stock and stock options, were extinguished and deemedcancelled. Reorganized Spectrum Brands, Inc. filed a certificate of incorporation authorizing new shares ofcommon stock. Pursuant to and in accordance with the Plan, on the Effective Date, reorganized SpectrumBrands, Inc. issued a total of 27,030,000 shares of common stock and approximately $218 million in aggregateprincipal amount of the 12% Notes to holders of allowed claims with respect to Old Spectrum’s 81⁄2 % SeniorSubordinated Notes due 2013 (the “81⁄2 Notes”), the 73⁄8% Notes and Variable Rate Toggle Senior SubordinatedNotes due 2013 (the “Variable Rate Notes”) (collectively, the “Senior Subordinated Notes”). For a furtherdiscussion of the 12% Notes see “Debt Financing Activities—12% Notes.” Also on the Effective Date,reorganized Spectrum Brands, Inc. issued a total of 2,970,000 shares of common stock to supplemental andsub-supplemental debtor-in-possession credit facility participants in respect of the equity fee earned under theDebtors’ debtor-in-possession credit facility.
Our Products
We compete in seven major product categories: consumer batteries; pet supplies; electric shaving andgrooming; electric personal care products; home and garden control products; small appliances and portablelighting. Our broad line of products includes:
• consumer batteries, including alkaline and zinc carbon batteries, rechargeable batteries and chargersand hearing aid batteries and other specialty batteries;
• pet supplies, including aquatic equipment and supplies, dog and cat treats, small animal foods, clean upand training aids, health and grooming products and bedding;
• home and garden control products including household insect controls, insect repellents and herbicides;
• electric shaving and grooming devices;
• small appliances, including small kitchen appliances and home product appliances;
• electric personal care and styling devices; and
• portable lighting.
3

Net sales of each product category sold, as a percentage of net sales of our consolidated operations, is setforth below.
Percentage of Total CompanyNet Sales for the Fiscal Year Ended
September 30,
2010 2009 2008
Consumer batteries . . . . . . . . . . . . . . . . . . . . . . . . . . . . . . . . . . . . . . . . . . . . . . . . . 34% 37% 38%Pet supplies . . . . . . . . . . . . . . . . . . . . . . . . . . . . . . . . . . . . . . . . . . . . . . . . . . . . . . 22 26 25Home and garden control products . . . . . . . . . . . . . . . . . . . . . . . . . . . . . . . . . . . . 13 14 14Electric shaving and grooming . . . . . . . . . . . . . . . . . . . . . . . . . . . . . . . . . . . . . . . 10 10 10Small appliances . . . . . . . . . . . . . . . . . . . . . . . . . . . . . . . . . . . . . . . . . . . . . . . . . . 9 — —Electric personal care products . . . . . . . . . . . . . . . . . . . . . . . . . . . . . . . . . . . . . . . 8 9 9Portable lighting . . . . . . . . . . . . . . . . . . . . . . . . . . . . . . . . . . . . . . . . . . . . . . . . . . . 4 4 4
100% 100% 100%
Consumer Batteries
We market and sell a full line of alkaline batteries (AA, AAA, C, D and 9-volt sizes) to both retail andindustrial customers. Our alkaline batteries are marketed and sold primarily under the Rayovac and VARTAbrands. We also manufacture alkaline batteries for third parties who sell the batteries under their own privatelabels. Our zinc carbon batteries are also marketed and sold primarily under the Rayovac and VARTA brandsand are designed for low- and medium-drain battery-powered devices.
We believe that we are currently the largest worldwide marketer and distributor of hearing aid batteries. Wesell our hearing aid batteries through retail trade channels and directly to professional audiologists under severalbrand names and private labels, including Beltone, Miracle Ear and Starkey.
We also sell Nickel Metal Hydride (NiMH) rechargeable batteries and a variety of battery chargers underthe Rayovac and VARTA brands.
Our other specialty battery products include camera batteries, lithium batteries, silver oxide batteries,keyless entry batteries and coin cells for use in watches, cameras, calculators, communications equipment andmedical instruments.
Pet Supplies
In the pet supplies product category we market and sell a variety of leading branded pet supplies for fish,dogs, cats, birds and other small domestic animals. We have a broad line of consumer and commercial aquaticsproducts, including integrated aquarium kits, standalone tanks and stands, filtration systems, heaters, pumps, andother equipment, fish food and water treatment products. Our largest aquatics brands are Tetra, Marineland,Whisper, Jungle and Instant Ocean. We also sell a variety of specialty pet products, including dog and cat treats,small animal food and treats, clean up and training aid products, health and grooming aids, and bedding products.Our largest specialty pet brands include 8-in-1, Dingo, Firstrax, Nature’s Miracle and Wild Harvest.
Home and Garden Control Products
In the home and garden control products category we currently sell and market several leading home andgarden care products, including household insecticides, insect repellent, herbicides, garden and indoor plantfoods and plant care treatments. We offer a broad array of household insecticides such as spider, roach and antkiller, flying insect killer, insect foggers, wasp and hornet killer, flea and tick control products and roach and antbaits. We also manufacture and market a complete line of insect repellent products that provide protection from
4

insects, especially mosquitoes. These products include both personal repellents, such as aerosols, pump spraysand wipes as well as area repellents, such as yard sprays, citronella candles and torches. Our largest brands in theinsect control category include Hot Shot, Cutter and Repel. Our herbicides, garden and indoor plant foods andplant care treatment brands include Spectracide, Real-Kill and Garden Safe. We have positioned ourselves as thevalue alternative for consumers who want products that are comparable to, but sold at lower prices than,premium-priced brands.
Electric Shaving and Grooming
We market and sell a broad line of electric shaving and grooming products under the Remington brandname, including men’s rotary and foil shavers, beard and mustache trimmers, body trimmers and nose and eartrimmers, women’s shavers and haircut kits.
Small Appliances
In the small appliances category, we market and sell a broad range of products in three major productcategories: branded small household appliances, pet and pest products, and personal care products. We market abroad line of small kitchen appliances under the George Foreman, Black &Decker, Russell Hobbs, Farberware,Juiceman, Breadman and Toastmaster brands, including grills, bread makers, sandwich makers, kettles, toasterovens, toasters, blenders, juicers, can openers, coffee grinders, coffeemakers, electric knives, deep fryers, foodchoppers, food processors, hand mixers, rice cookers and steamers. We also market small home productappliances, including hand-held irons, vacuum cleaners, air purifiers, clothes shavers and heaters, primarily underthe Black & Decker and Russell Hobbs brands. Pet products include cat litter boxes sold under the LitterMaidbrand. The consumable accessories including privacy tents, litter carpets, crystal litter cartridges, charcoal filters,corn-based litter and replaceable waste receptacles. The pest control products include pest control and repellingdevices that use ultra-sonic sound waves to control insects and rodents, primarily in homes. Russell Hobbs’personal care products in the small appliances category include hand-held dryers, curling irons, straighteningirons, brush irons, air brushes, hair setters, facial brushes, skin appliances and electric toothbrushes, which areprimarily marketed under the Russell Hobbs, Carmen and Andrew Collinge brands.
Electric Personal Care Products
Our electric personal care products, marketed and sold under the Remington brand name, include hairdryers, straightening irons, styling irons and hair setters.
Portable Lighting
We offer a broad line of battery-powered, portable lighting products, including flashlights and lanterns forboth retail and industrial markets. We sell our portable lighting products under the Rayovac and VARTA brandnames, under other proprietary brand names and pursuant to licensing arrangements with third parties.
Sales and Distribution
We sell our products through a variety of trade channels, including retailers, wholesalers and distributors,hearing aid professionals, industrial distributors and OEMs. Our sales generally are made through the use ofindividual purchase orders, consistent with industry practice. Retail sales of the consumer products we markethave been increasingly consolidated into a small number of regional and national mass merchandisers. This trendtowards consolidation is occurring on a worldwide basis. As a result of this consolidation, a significantpercentage of our sales are attributable to a very limited group of retailer customers, including, Wal-Mart, TheHome Depot, Carrefour, Target, Lowe’s, PetSmart, Canadian Tire, PetCo and Gigante. Our sales to Wal-Martrepresented approximately 22% of our consolidated net sales for the fiscal year ended September 30, 2010. Noother customer accounted for more than 10% of our consolidated net sales in the fiscal year ended September 30,2010.
5

Segment information as to revenues, profit and total assets as well as information concerning our revenuesand long-lived assets by geographic location for the last three fiscal years is set forth in Item 7. Management’sDiscussion and Analysis of Financial Condition and Results of Operations and Note 11, Segment Results, inNotes to Consolidated Financial Statements included in this Annual Report on Form 10-K.
Sales and distribution practices in each of our reportable segments are as set forth below.
Global Batteries & Personal Care
We manage our Global Batteries & Personal Care sales force by geographic region and product group. Oursales team is divided into three major geographic territories, North America, Latin America and Europe and therest of the world (“Europe/ROW”). Within each major geographic territory, we have additional subdivisionsdesigned to meet our customers’ needs.
We manage our sales force in North America by distribution channel. We maintain separate sales groups toservice (i) our retail sales and distribution channel, (ii) our hearing aid professionals channel and (iii) ourindustrial distributors and OEM sales and distribution channel. In addition, we utilize a network of independentbrokers to service participants in selected distribution channels.
We manage our sales force in Latin America by distribution channel and geographic territory. We sellprimarily to large retailers, wholesalers, distributors, food and drug chains and retail outlets. In countries wherewe do not maintain a sales force, we sell to distributors who market our products through all channels in themarket.
The sales force serving our customers in Europe/ROW is supplemented by an international network ofdistributors to promote the sale of our products. Our sales operations throughout Europe/ROW are organized bygeographic territory and the following sales channels: (i) food/retail, which includes mass merchandisers,discounters and drug and food stores; (ii) specialty trade, which includes clubs, consumer electronics stores,department stores, photography stores and wholesalers/distributors; and (iii) industrial, government, hearing aidprofessionals and OEMs.
Global Pet Supplies
Our Global Pet Supplies sales force is aligned by customer, geographic region and product group. We sellpet supply products to mass merchandisers, grocery and drug chains, pet superstores, independent pet stores andother retailers.
Home and Garden Business
The sales force of the Home and Garden Business is aligned by customer. We sell primarily to homeimprovement centers, mass merchandisers, hardware stores, lawn and garden distributors, and food and drugretailers in the U.S.
Small Appliances
In the small appliances category, Russell Hobbs’ products are sold principally by internal sales staff locatedin North America, Latin America, Europe, Australia and New Zealand. Russell Hobbs also uses independentsales representatives, primarily in Central America and the Caribbean. Russell Hobbs distributes most of its smallappliance products to retailers, including mass merchandisers, department stores, home improvement stores,warehouse clubs, drug chains, catalog stores and discount and variety stores. In addition to directing itsmarketing efforts toward retailers, Russell Hobbs sells certain of its products directly to consumers throughinfomercials and its Internet websites.
6

Manufacturing, Raw Materials and Suppliers
The principal raw materials used in manufacturing our products—zinc powder, electrolytic manganesedioxide powder and steel—are sourced either on a global or regional basis. The prices of these raw materials aresusceptible to price fluctuations due to supply and demand trends, energy costs, transportation costs, governmentregulations and tariffs, changes in currency exchange rates, price controls, general economic conditions and otherunforeseen circumstances. We have regularly engaged in forward purchase and hedging derivative transactions inan attempt to effectively manage the raw material costs we expect to incur over the next 12 to 24 months.
Substantially all of our rechargeable batteries and chargers, portable lighting products, hair care and otherpersonal care products and our electric shaving and grooming products and small appliances are manufactured bythird party suppliers that are primarily located in the Asia/Pacific region. We maintain ownership of most of thetooling and molds used by our suppliers.
We continually evaluate our manufacturing facilities’ capacity and related utilization. As a result of suchanalyses, we have closed a number of manufacturing facilities during the past five years. In general, we believeour existing facilities are adequate for our present and foreseeable needs.
Research and Development
Our research and development strategy is focused on new product development and performanceenhancements of our existing products. We plan to continue to use our strong brand names, established customerrelationships and significant research and development efforts to introduce innovative products that offerenhanced value to consumers through new designs and improved functionality.
In our fiscal years ended September 30, 2010, 2009 and 2008, we invested $31.0 million, $24.4 million and$25.3 million, respectively, in product research and development.
Patents and Trademarks
We own or license from third parties a significant number of patents and patent applications throughout theworld relating to products we sell and manufacturing equipment we use. We hold a license that expires in March2022 for certain alkaline battery designs, technology and manufacturing equipment from Matsushita ElectricalIndustrial Co., Ltd. (“Matsushita”), to whom we pay a royalty.
We also use and maintain a number of trademarks in our business, including DINGO, JUNGLETALK,MARINELAND, RAYOVAC, REMINGTON, TETRA, VARTA, 8IN1, CUTTER, HOT SHOT, GARDENSAFE, NATURE’S MIRACLE, REPEL, SPECTRACIDE, SPECTRACIDE TERMINATE, GEORGEFOREMAN, RUSSELL HOBBS and BLACK & DECKER. We seek trademark protection in the U.S. and inforeign countries by all available means, including registration.
As a result of the October 2002 sale by VARTA AG of substantially all of its consumer battery business tous and VARTA AG’s subsequent sale of its automotive battery business to Johnson Controls, Inc. (“JohnsonControls”), we acquired rights to the VARTA trademark in the consumer battery category and Johnson Controlsacquired rights to the trademark in the automotive battery category. VARTA AG continues to have rights to usethe trademark with travel guides and industrial batteries and VARTA Microbattery GmbH has the right to use thetrade mark with micro batteries. We are party to a Trademark and Domain Names Protection and DelimitationAgreement that governs ownership and usage rights and obligations of the parties relative to the VARTAtrademark.
As a result of the common origins of the Remington Products, L.L.C. (“Remington Products”), business weacquired in September 2003 and the Remington Arms Company, Inc. (“Remington Arms”), the REMINGTONtrademark is owned by us and by Remington Arms each with respect to its principal products as well as
7

associated products. Accordingly, we own the rights to use the REMINGTON trademark for electric shavers,shaver accessories, grooming products and personal care products, while Remington Arms owns the rights to usethe trademark for firearms, sporting goods and products for industrial use, including industrial hand tools. Inaddition, the terms of a 1986 agreement between Remington Products and Remington Arms provides for theshared rights to use the REMINGTON trademark on products which are not considered “principal products ofinterest” for either company. We retain the REMINGTON trademark for nearly all products which we believecan benefit from the use of the brand name in our distribution channels.
We license the Black & Decker brand in North America, Latin America (excluding Brazil) and theCaribbean for four core categories of household appliances: beverage products, food preparation products,garment care products and cooking products. Russell Hobbs has licensed the Black & Decker brand since 1998for use in marketing various household small appliances. In December 2007, Russell Hobbs and The Black &Decker Corporation (“BDC”) extended the trademark license agreement for a third time through December 2012,with an automatic extension through December 2014 if certain milestones are met regarding sales volume andproduct return. Under the agreement as extended, Russell Hobbs agreed to pay BDC royalties based on apercentage of sales, with minimum annual royalty payments as follows:
• Calendar year 2010: $14.5 million
• Calendar year 2011: $15.0 million
• Calendar year 2012: $15.0 million
The agreement also requires us to comply with maximum annual return rates for products.
If BDC does not agree to renew the license agreement, we have 18 months to transition out of the brandname. No minimum royalty payments will be due during such transition period. BDC has agreed not to competein the four core product categories for a period of five years after the termination of the license agreement. Uponrequest, BDC may elect to extend the license to use the Black & Decker brand to certain additional productcategories. BDC has approved several extensions of the license to additional categories and geographies.
Competition
In our retail markets, we compete for limited shelf space and consumer acceptance. Factors influencingproduct sales include brand name recognition, perceived quality, price, performance, product packaging, designinnovation, and consumer confidence and preferences as well as creative marketing, promotion and distributionstrategies.
The battery product category is highly competitive. Most consumer batteries manufactured throughout theworld are sold by one of four global companies: Spectrum Brands (manufacturer/seller of Rayovac and VARTAbrands); Energizer Holdings, Inc. (“Energizer”) (manufacturer/seller of the Energizer brand); The Procter &Gamble Company (“Procter & Gamble”) (manufacturer/seller of the Duracell brand); and Matsushita(manufacturer/seller of the Panasonic brand). We also face competition from the private label brands of majorretailers, particularly in Europe. The offering of private-label batteries by retailers may create pricing pressure inthe consumer battery market. Typically, private-label brands are not supported by advertising or promotion, andretailers sell these private label offerings at prices below competing name-brands. The main barriers to entry fornew competitors are investment in technology research, cost of building manufacturing capacity and the expenseof building retail distribution channels and consumer brands.
In the U.S. alkaline battery category, the Rayovac brand is positioned as a value brand, which is typicallydefined as a product that offers comparable performance at a lower price. In Europe, the VARTA brand iscompetitively priced with other premium brands. In Latin America, where zinc carbon batteries outsell alkalinebatteries, the Rayovac brand is competitively priced.
8
The pet supply product category is highly fragmented with over 500 manufacturers in the U.S. alone,consisting primarily of small companies with limited product lines. Our largest competitors in this productcategory are Mars Corporation (“Mars”), The Hartz Mountain Corporation (“Hartz”) and Central Garden & PetCompany (“Central Garden & Pet”). Both Hartz and Central Garden & Pet sell a comprehensive line of petsupplies and compete with a majority of the products we offer. Mars sells primarily aquatics products.
Products we sell in the lawn and garden product category through the Home and Garden Business facecompetition from The Scotts Miracle-Gro Company (“Scotts Company”), which markets lawn and gardenproducts under the Scotts, Ortho, Roundup and Miracle-Gro brand names; Central Garden & Pet, which marketsgarden products under the AMDRO and Sevin brand names; and Bayer A.G., which markets lawn and gardenproducts under the Bayer Advanced brand name.
Products we sell in the household insect control product category through the Home and Garden Business,face competition from S.C. Johnson & Son, Inc. (“S.C. Johnson”), which markets insecticide and repellentproducts under the Raid and OFF! brands; Scotts Company, which markets household insect control productsunder the Ortho brand; and Henkel KGaA, which markets insect control products under the Combat brand.
Our primary competitors in the electric shaving and grooming product category are Norelco, a division ofKoninklijke Philips Electronics NV (“Philips”), which sells and markets rotary shavers, and Braun, a division ofProcter & Gamble, which sells and markets foil shavers. Through our Remington brand, we sell both foil androtary shavers.
Primary competitive brands in the small appliance category include Hamilton Beach, Proctor Silex,Sunbeam, Mr. Coffee, Oster, General Electric, Rowenta, DeLonghi, Kitchen Aid, Cuisinart, Krups, Braun, Rival,Europro, Kenwood, Philips, Morphy Richards, Breville and Tefal. The key competitors of Russell Hobbs in thismarket in the U.S. and Canada include Jarden Corporation, DeLonghi America, Euro-Pro Operating LLC, MetroThebe, Inc., d/b/a HWI Breville, NACCO Industries, Inc. (Hamilton Beach) and SEB S.A. In addition, RussellHobbs competes with retailers who use their own private label brands for household appliances (for example,Wal-Mart).
Our major competitors in the electric personal care product category are Conair Corporation, Wahl ClipperCorporation and Helen of Troy Limited (“Helen of Troy”).
Our primary competitors in the portable lighting product category are Energizer and Mag Instrument, Inc.
Some of our major competitors have greater resources and greater overall market share than we do. Theyhave committed significant resources to protect their market shares or to capture market share from us and maycontinue to do so in the future. In some key product lines, our competitors may have lower production costs andhigher profit margins than we do, which may enable them to compete more aggressively in advertising and inoffering retail discounts and other promotional incentives to retailers, distributors, wholesalers and, ultimately,consumers.
Seasonality
On a consolidated basis our financial results are approximately equally weighted between quarters, however,sales of certain product categories tend to be seasonal. Sales in the consumer battery, electric shaving andgrooming and electric personal care product categories, particularly in North America, tend to be concentrated inthe December holiday season (Spectrum’s first fiscal quarter). Demand for pet supplies products remains fairlyconstant throughout the year. Demand for home and garden control products sold though the Home and GardenBusiness typically peaks during the first six months of the calendar year (Spectrum’s second and third fiscalquarters). Small Appliances peaks from July through December primarily due to the increased demand bycustomers in the late summer for “back-to-school” sales and in the fall for the holiday season. For a more
9

detailed discussion of the seasonality of our product sales, see Item 7. Management’s Discussion and Analysis ofFinancial Condition and Results of Operations—“Seasonal Product Sales.”
Governmental Regulations and Environmental Matters
Due to the nature of our operations, our facilities are subject to a broad range of federal, state, local andforeign legal and regulatory provisions relating to the environment, including those regulating the discharge ofmaterials into the environment, the handling and disposal of solid and hazardous substances and wastes and theremediation of contamination associated with the releases of hazardous substances at our facilities. We believethat compliance with the federal, state, local and foreign laws and regulations to which we are subject will nothave a material effect upon our capital expenditures, financial condition, earnings or competitive position.
From time to time, we have been required to address the effect of historic activities on the environmentalcondition of our properties. We have not conducted invasive testing at all facilities to identify all potentialenvironmental liability risks. Given the age of our facilities and the nature of our operations, it is possible thatmaterial liabilities may arise in the future in connection with our current or former facilities. If previouslyunknown contamination of property underlying or in the vicinity of our manufacturing facilities is discovered, wecould incur material unforeseen expenses, which could have a material adverse effect on our financial condition,capital expenditures, earnings and competitive position. Although we are currently engaged in investigative orremedial projects at some of our facilities, we do not expect that such projects, taking into account establishedaccruals, will cause us to incur expenditures that are material to our business, financial condition or results ofoperations; however, it is possible that our future liability could be material.
We have been, and in the future may be, subject to proceedings related to our disposal of industrial andhazardous material at off-site disposal locations or similar disposals made by other parties for which we are heldresponsible as a result of our relationships with such other parties. In the U.S., these proceedings are under theFederal Comprehensive Environmental Response, Compensation and Liability Act of 1980 (“CERCLA”) orsimilar state laws that hold persons who “arranged for” the disposal or treatment of such substances strictly liablefor costs incurred in responding to the release or threatened release of hazardous substances from such sites,regardless of fault or the lawfulness of the original disposal. Liability under CERCLA is typically joint andseveral, meaning that a liable party may be responsible for all costs incurred in investigating and remediatingcontamination at a site. As a practical matter, liability at CERCLA sites is shared by all of the viable responsibleparties. We occasionally are identified by federal or state governmental agencies as being a potentiallyresponsible party for response actions contemplated at an off-site facility. At the existing sites where we havebeen notified of our status as a potentially responsible party, it is either premature to determine whether ourpotential liability, if any, will be material or we do not believe that our liability, if any, will be material. We maybe named as a potentially responsible party under CERCLA or similar state laws for other sites not currentlyknown to us, and the costs and liabilities associated with these sites may be material.
It is difficult to quantify with certainty the potential financial impact of actions regarding expenditures forenvironmental matters, particularly remediation, and future capital expenditures for environmental controlequipment. Nevertheless, based upon the information currently available, we believe that our ultimate liabilityarising from such environmental matters, taking into account established accruals of $9.6 million for estimatedliabilities at September 30, 2010 should not be material to our business or financial condition.
Electronic and electrical products that we sell in Europe, particularly products sold under the Remingtonbrand name, VARTA battery chargers, certain portable lighting and all of our batteries, are subject to regulationin European Union (“EU”) markets under three key EU directives. The first directive is the Restriction of the Useof Hazardous Substances in Electrical and Electronic Equipment (“RoHS”) which took effect in EU memberstates beginning July 1, 2006. RoHS prohibits companies from selling products which contain certain specifiedhazardous materials in EU member states. We believe that compliance with RoHS will not have a material effecton our capital expenditures, financial condition, earnings or competitive position. The second directive is entitled
10

the Waste of Electrical and Electronic Equipment (“WEEE”). WEEE makes producers or importers of particularclasses of electrical goods financially responsible for specified collection, recycling, treatment and disposal ofpast and future covered products. WEEE assigns levels of responsibility to companies doing business in EUmarkets based on their relative market share. WEEE calls on each EU member state to enact enabling legislationto implement the directive. To comply with WEEE requirements, we have partnered with other companies tocreate a comprehensive collection, treatment, disposal and recycling program. As EU member states passenabling legislation we currently expect our compliance system to be sufficient to meet such requirements. Ourcurrent estimated costs associated with compliance with WEEE are not significant based on our current marketshare. However, we continue to evaluate the impact of the WEEE legislation as EU member states implementguidance and as our market share changes, and, as a result, actual costs to our company could differ from ourcurrent estimates and may be material to our business, financial condition or results of operations. The thirddirective is the Directive on Batteries and Accumulators and Waste Batteries, which was adopted in September2006 and went into effect in September 2008 (the “Battery Directive”). The Battery Directive bans heavy metalsin batteries by establishing maximum quantities of those heavy metals in batteries and mandates wastemanagement of batteries, including collection, recycling and disposal systems. The Battery Directive places thecosts of such waste management systems on producers and importers of batteries. The Battery Directive calls oneach EU member state to enact enabling legislation to implement the directive. We currently believe thatcompliance with the Battery Directive will not have a material effect on our capital expenditures, financialcondition, earnings or competitive position. However, until such time as the EU member states adopt enablinglegislation, a full evaluation of these costs cannot be completed. We will continue to evaluate the impact of theBattery Directive and its enabling legislation as EU member states implement guidance.
Certain of our products and facilities in each of our business segments are regulated by the United StatesEnvironmental Protection Agency (the “EPA”) and the United States Food and Drug Administration (the “FDA”)or other federal consumer protection and product safety agencies and are subject to the regulations such agenciesenforce, as well as by similar state, foreign and multinational agencies and regulations. For example, in the U.S.,all products containing pesticides must be registered with the EPA and, in many cases, similar state and foreignagencies before they can be manufactured or sold. Our inability to obtain or the cancellation of any registrationcould have an adverse effect on our business, financial condition and results of operations. The severity of theeffect would depend on which products were involved, whether another product could be substituted and whetherour competitors were similarly affected. We attempt to anticipate regulatory developments and maintainregistrations of, and access to, substitute chemicals and other ingredients. We may not always be able to avoid orminimize these risks.
The Food Quality Protection Act (“FQPA”) established a standard for food-use pesticides, which is that areasonable certainty of no harm will result from the cumulative effect of pesticide exposures. Under the FQPA,the EPA is evaluating the cumulative effects from dietary and non-dietary exposures to pesticides. The pesticidesin certain of our products continue to be evaluated by the EPA as part of this program. It is possible that the EPAor a third party active ingredient registrant may decide that a pesticide we use in our products will be limited ormade unavailable to us. We cannot predict the outcome or the severity of the effect of the EPA’s continuingevaluations of active ingredients used in our products.
Certain of our products and packaging materials are subject to regulations administered by the FDA. Amongother things, the FDA enforces statutory prohibitions against misbranded and adulterated products, establishesingredients and manufacturing procedures for certain products, establishes standards of identity for certainproducts, determines the safety of products and establishes labeling standards and requirements. In addition,various states regulate these products by enforcing federal and state standards of identity for selected products,grading products, inspecting production facilities and imposing their own labeling requirements.
Employees
We had approximately 6,100 full-time employees worldwide as of September 30, 2010. Approximately 20%of our total labor force is covered by collective bargaining agreements. There is one collective bargaining
11

agreement that will expire during our fiscal year ending September 30, 2011, which covers approximately 12%of the labor force under collective bargaining agreements, or approximately 2% of our total labor force. Webelieve that our overall relationship with our employees is good.
Available Information
Our Annual Reports on Form 10-K, Quarterly Reports on Form 10-Q, Current Reports on Form 8-K andamendments to reports filed pursuant to Sections 13(a) and 15(d) of the Securities Exchange Act of 1934, asamended (the “Exchange Act”), are made available free of charge on or through our website atwww.spectrumbrands.com as soon as reasonably practicable after such reports are filed with, or furnished to, theUnited States Securities and Exchange Commission (the “SEC”). You may read and copy any materials we filewith the SEC at the SEC’s Public Reference Room at 100 F Street, NE, Washington, DC 20549. You may obtaininformation on the operation of the Public Reference Room by calling the SEC at 1-800-SEC-0330. The SECalso maintains an Internet site that contains our reports, proxy statements and other information at www.sec.gov.In addition, copies of our (i) Corporate Governance Guidelines, (ii) charters for the Audit Committee,Compensation Committee and Nominating and Corporate Governance Committee, (iii) Code of BusinessConduct and Ethics and (iv) Code of Ethics for the Principal Executive Officer and Senior Financial Officers areavailable at our Internet site at www.spectrumbrands.com under “Investor Relations—Corporate Governance.”Copies will also be provided to any stockholder upon written request to the Vice President, Investor Relations &Corporate Communications, Spectrum Brands Holdings, Inc. at 601 Rayovac Drive, Madison, Wisconsin 53711or via electronic mail at [email protected], or by contacting the Vice President, InvestorRelations & Corporate Communications by telephone at (608) 275-3340.
12

ITEM 1A. RISK FACTORS
Forward-Looking Statements
We have made or implied certain forward-looking statements in this Annual Report on Form 10-K. Allstatements, other than statements of historical facts included in this Annual Report, including the statementsunder Item 7. Management’s Discussion and Analysis of Financial Condition and Results of Operationsregarding our business strategy, future operations, financial condition, estimated revenues, projected costs,projected synergies, prospects, plans and objectives of management, as well as information concerning expectedactions of third parties, are forward-looking statements. When used in this Annual Report, the words“anticipate,” “intend,” “plan,” “estimate,” “believe,” “expect,” “project,” “could,” “will,” “should,” “may” andsimilar expressions are also intended to identify forward-looking statements, although not all forward-lookingstatements contain such identifying words.
Since these forward-looking statements are based upon our current expectations of future events andprojections and are subject to a number of risks and uncertainties, many of which are beyond our control andsome of which may change rapidly, actual results or outcomes may differ materially from those expressed orimplied herein, and you should not place undue reliance on these statements. Important factors that could causeour actual results to differ materially from those expressed or implied herein include, without limitation:
• the impact of our substantial indebtedness on our business, financial condition and results ofoperations;
• the impact of restrictions in our debt instruments on our ability to operate our business, finance ourcapital needs or pursue or expand business strategies;
• any failure to comply with financial covenants and other provisions and restrictions of our debtinstruments;
• our ability to successfully integrate the business acquired in connection with the combination withRussell Hobbs and achieve the expected synergies from that integration at the expected costs;
• the impact of expenses resulting from the implementation of new business strategies, divestitures orcurrent and proposed restructuring activities;
• the impact of fluctuations in commodity prices, costs or availability of raw materials or terms andconditions available from suppliers, including suppliers’ willingness to advance credit;
• interest rate and exchange rate fluctuations;
• the loss of, or a significant reduction in, sales to a significant retail customer(s);
• competitive promotional activity or spending by competitors or price reductions by competitors;
• the introduction of new product features or technological developments by competitors and/or thedevelopment of new competitors or competitive brands;
• the effects of general economic conditions, including inflation, recession or fears of a recession,depression or fears of a depression, labor costs and stock market volatility or changes in trade,monetary or fiscal policies in the countries where we do business;
• changes in consumer spending preferences and demand for our products;
• our ability to develop and successfully introduce new products, protect our intellectual property andavoid infringing the intellectual property of third parties;
• our ability to successfully implement, achieve and sustain manufacturing and distribution costefficiencies and improvements, and fully realize anticipated cost savings;
• the cost and effect of unanticipated legal, tax or regulatory proceedings or new laws or regulations(including environmental, public health and consumer protection regulations);
13

• public perception regarding the safety of our products, including the potential for environmentalliabilities, product liability claims, litigation and other claims;
• the impact of pending or threatened litigation;
• changes in accounting policies applicable to our business;
• government regulations;
• the seasonal nature of sales of certain of our products;
• the effects of climate change and unusual weather activity; and
• the effects of political or economic conditions, terrorist attacks, acts of war or other unrest ininternational markets.
Some of the above-mentioned factors are described in further detail in the section entitled “Risk Factors” setforth below. You should assume the information appearing in this Annual Report on Form 10-K is accurate onlyas of September 30, 2010 or as otherwise specified, as our business, financial condition, results of operations andprospects may have changed since that date. Except as required by applicable law, including the securities lawsof the U.S. and the rules and regulations of the SEC, we undertake no obligation to publicly update or revise anyforward-looking statement, whether as a result of new information, future events or otherwise to reflect actualresults or changes in factors or assumptions affecting such forward-looking statement.
14

RISK FACTORS
Any of the following factors could materially and adversely affect our business, financial condition andresults of operations and the risks described below are not the only risks that we may face. Additional risks anduncertainties not currently known to us or that we currently view as immaterial may also materially andadversely affect our business, financial condition or results of operations.
Risks Related to the Merger
Significant costs have been incurred in connection with the consummation of the Merger and are expectedto be incurred in connection with the integration of Spectrum Brands and Russell Hobbs into a combinedcompany, including legal, accounting, financial advisory and other costs.
We expect to incur one-time costs of approximately $23 million in connection with integrating theoperations, products and personnel of Spectrum Brands and Russell Hobbs into a combined company, in additionto costs related directly to completing the Merger described below. These costs may include costs for:
• employee redeployment, relocation or severance;
• integration of information systems;
• combination of research and development teams and processes; and
• reorganization or closures of facilities.
In addition, we expect to incur a number of non-recurring costs associated with combining our operationswith those of Russell Hobbs, which cannot be estimated accurately at this time. We incurred approximately $85million of transaction fees and other costs related to the Merger. Additional unanticipated costs may yet beincurred as we integrate our business with that of Russell Hobbs. Although we expect that the elimination ofduplicative costs, as well as the realization of other efficiencies related to the integration of our operations withthose of Russell Hobbs, may offset incremental transaction and transaction-related costs over time, this netbenefit may not be achieved in the near term, or at all. There can be no assurance that we will be successful inour integration efforts. In addition, while we expect to benefit from leveraging distribution channels and brandnames across both companies, we cannot assure you that we will achieve such benefits.
We may not realize the anticipated benefits of the Merger.
The Merger involved the integration of two companies that previously operated independently. Theintegration of our operations with those of Russell Hobbs is expected to result in financial and operationalbenefits, including increased revenues and cost savings. There can be no assurance, however, regarding when orthe extent to which we will be able to realize these increased revenues, cost savings or other benefits. Integrationmay also be difficult, unpredictable, and subject to delay because of possible company culture conflicts anddifferent opinions on technical decisions and product roadmaps. We must integrate or, in some cases, replace,numerous systems, including those involving management information, purchasing, accounting and finance,sales, billing, employee benefits, payroll and regulatory compliance, many of which are dissimilar. In someinstances, we and Russell Hobbs have served the same customers, and some customers may decide that it isdesirable to have additional or different suppliers. Difficulties associated with integration could have a materialadverse effect on our business, financial condition and operating results.
Integrating our business with that of Russell Hobbs may divert our management’s attention away fromoperations.
Successful integration of our and Russell Hobbs’ operations, products and personnel may place a significantburden on our management and other internal resources. The diversion of management’s attention, and anydifficulties encountered in the transition and integration process, could harm our business, financial conditionsand operating results.
15

Risks Related To Our Emergence From Bankruptcy
Because our consolidated financial statements are required to reflect fresh-start reporting adjustments to bemade upon emergence from bankruptcy, financial information in our financial statements prepared afterAugust 30, 2009 will not be comparable to our financial information from prior periods.
All conditions required for the adoption of fresh-start reporting were met upon emergence from Chapter 11of the Bankruptcy Code on the Effective Date. However, in light of the proximity of that date to our accountingperiod close immediately following the Effective Date, which was August 30, 2009, we elected to adopt aconvenience date of August 30, 2009 for recording fresh-start reporting. We adopted fresh-start reporting inaccordance with the Accounting Standards Codification (“ASC”) Topic 852: “Reorganizations,” pursuant towhich our reorganization value, which is intended to reflect the fair value of the entity before consideringliabilities and approximate the amount a willing buyer would pay for the assets of the entity immediately after thereorganization, was allocated to the fair value of assets in conformity with Statement of Financial AccountingStandards No. 141, “Business Combinations,” using the purchase method of accounting for businesscombinations. We stated liabilities, other than deferred taxes, at a present value of amounts expected to be paid.The amount remaining after allocation of the reorganization value to the fair value of identified tangible andintangible assets was reflected as goodwill, which is subject to periodic evaluation for impairment. In addition,under fresh-start reporting the accumulated deficit was eliminated. Thus, our future statements of financialposition and results of operations are not be comparable in many respects to statements of financial position andconsolidated statements of operations data for periods prior to the adoption of fresh-start reporting. The lack ofcomparable historical information may discourage investors from purchasing our securities. Additionally, thefinancial information included in this Annual Report on Form 10-K may not be indicative of future financialinformation.
Risks Related To Our Business
We are a parent company and our primary source of cash is and will be distributions from our subsidiaries.
We are a parent company with limited business operations of our own. Our main asset is the capital stock ofour subsidiaries. We conduct most of our business operations through our direct and indirect subsidiaries.Accordingly, our primary sources of cash are dividends and distributions with respect to our ownership interestsin our subsidiaries that are derived from their earnings and cash flow. Our subsidiaries might not generatesufficient earnings and cash flow to pay dividends or distributions in the future. Our subsidiaries’ payments to uswill be contingent upon their earnings and upon other business considerations. In addition, our senior creditfacilities, the indentures governing our notes and other agreements limit or prohibit certain payments ofdividends or other distributions to us. We expect that future credit facilities will contain similar restrictions.
Our substantial indebtedness may limit our financial and operating flexibility, and we may incur additionaldebt, which could increase the risks associated with our substantial indebtedness.
We have, and we expect to continue to have, a significant amount of indebtedness. As of September 30,2010, we had total indebtedness under our Senior Secured Facilities, the 12% Notes and other debt ofapproximately $1.8 billion. Our substantial indebtedness has had, and could continue to have, material adverseconsequences for our business, and may:
• require us to dedicate a large portion of our cash flow to pay principal and interest on our indebtedness,which will reduce the availability of our cash flow to fund working capital, capital expenditures,research and development expenditures and other business activities;
• increase our vulnerability to general adverse economic and industry conditions;
• limit our flexibility in planning for, or reacting to, changes in our business and the industry in which weoperate;
16

• restrict our ability to make strategic acquisitions, dispositions or exploiting business opportunities;
• place us at a competitive disadvantage compared to our competitors that have less debt; and
• limit our ability to borrow additional funds (even when necessary to maintain adequate liquidity) ordispose of assets.
Under the Senior Secured Facilities and the indenture governing the 12% Notes (the “2019 Indenture”), wemay incur additional indebtedness. If new debt is added to our existing debt levels, the related risks that we nowface would increase.
Furthermore, a substantial portion of our debt bears interest at variable rates. If market interest ratesincrease, the interest rate on our variable rate debt will increase and will create higher debt service requirements,which would adversely affect our cash flow and could adversely impact our results of operations. While we mayenter into agreements limiting our exposure to higher debt service requirements, any such agreements may notoffer complete protection from this risk.
Restrictive covenants in the Senior Secured Facilities and the 2019 Indenture may restrict our ability topursue our business strategies.
The Senior Secured Facilities and the 2019 Indenture each restrict, among other things, asset dispositions,mergers and acquisitions, dividends, stock repurchases and redemptions, other restricted payments, indebtednessand preferred stock, loans and investments, liens and affiliate transactions. The Senior Secured Facilities and the2019 Indenture also contain customary events of default. These covenants, among other things, limit our abilityto fund future working capital and capital expenditures, engage in future acquisitions or development activities,or otherwise realize the value of our assets and opportunities fully because of the need to dedicate a portion ofcash flow from operations to payments on debt. In addition, the Senior Secured Facilities contain financialcovenants relating to maximum leverage and minimum interest coverage. Such covenants could limit theflexibility of our restricted entities in planning for, or reacting to, changes in the industries in which they operate.Our ability to comply with these covenants is subject to certain events outside of our control. If we are unable tocomply with these covenants, the lenders under our Senior Secured Facilities or 12% Notes could terminate theircommitments and the lenders under our Senior Secured Facilities or 12% Notes could accelerate repayment ofour outstanding borrowings, and, in either case, we may be unable to obtain adequate refinancing outstandingborrowings on favorable terms. If we are unable to repay outstanding borrowings when due, the lenders under theSenior Secured Facilities or 12% Notes will also have the right to proceed against the collateral granted to themto secure the indebtedness owed to them. If our obligations under the Senior Secured Facilities and the 12%Notes are accelerated, we cannot assure you that our assets would be sufficient to repay in full such indebtedness.
Assuming consummation of a pending transaction by which Harbinger Group, Inc. (“HRG”) wouldacquire a majority of the outstanding shares of our common stock, any sale or other disposition by HRG tonon-affiliates of a sufficient amount of the common stock of SB Holdings would constitute a change ofcontrol under the agreements governing Spectrum Brands’ debt.
HRG and Harbinger Capital Partners Master Fund I, Ltd. (“Harbinger Master Fund”), Harbinger CapitalPartners Special Situations Fund, L.P and Global Opportunities Breakaway Ltd. (collectively, the “HarbingerParties”) are parties to a Contribution and Exchange Agreement (the “Exchange Agreement”), pursuant to theterms of which the Harbinger Parties will contribute 27,756,905 shares of SB Holdings common stock to HRGand received in exchange for such shares an aggregate of 119,909,830 shares of HRG common stock (the “ShareExchange”). Immediately following the consummation of the Share Exchange, HRG will own approximately54.4% of our common stock and the Harbinger Parties will own approximately 12.7% of the outstanding sharesof our common stock. The Harbinger Parties will own approximately 93.3% of the outstanding HRG commonstock.
17
Following consummation of the Share Exchange, any sale or other disposition by HRG to non-affiliates of asufficient amount of the common stock of SB Holdings could constitute a change of control under the agreementsgoverning Spectrum Brands’ debt, including any foreclosure on or sale of SB Holdings’ common stock pledgedas collateral by HRG pursuant to the indenture governing HRG’s $350 million 10.625% Senior Secured Notesdue 2015. Under the Term Loan and the ABL Revolving Credit Facility, a change of control is an event ofdefault and, if a change of control were to occur, Spectrum Brands would be required to get an amendment tothese agreements to avoid a default. If Spectrum Brands was unable to get such an amendment, the lenders couldaccelerate the maturity of each of the Spectrum Brands Term Loan and the ABL Revolving Credit Facility. Inaddition, under the indentures governing the 9.5% Notes and the 12% Notes, upon a change of control of SBHoldings, Spectrum Brands is required to offer to repurchase such notes from the holders at a price equal to101% of principal amount of the notes plus accrued interest or obtain a waiver of default from the holders of suchnotes. If Spectrum Brands was unable to make the change of control offer or obtain a waiver of default, it wouldbe an event of default under the indentures that could allow holders of such notes to accelerate the maturity of thenotes. See “Risks Related to SB Holdings’ Common Stock—The Harbinger Parties and, following the ShareExchange, HRG, will exercise significant influence over us and their interests in our business may be differentfrom the interest of our stockholders.”
We face risks related to the current economic environment.
The current economic environment and related turmoil in the global financial system has had and maycontinue to have an impact on our business and financial condition. Global economic conditions havesignificantly impacted economic markets within certain sectors, with financial services and retail businessesbeing particularly impacted. Our ability to generate revenue depends significantly on discretionary consumerspending. It is difficult to predict new general economic conditions that could impact consumer and customerdemand for our products or our ability to manage normal commercial relationships with our customers, suppliersand creditors. The recent continuation of a number of negative economic factors, including constraints on thesupply of credit to households, uncertainty and weakness in the labor market and general consumer fears of acontinuing economic downturn could have a negative impact on discretionary consumer spending. If theeconomy continues to deteriorate or fails to improve, our business could be negatively impacted, including as aresult of reduced demand for our products or supplier or customer disruptions. Any weakness in discretionaryconsumer spending could have a material adverse effect on our revenues, results of operations and financialcondition. In addition, our ability to access the capital markets may be restricted at a time when it could benecessary or beneficial to do so, which could have an impact on our flexibility to react to changing economic andbusiness conditions.
In 2010, concern over sovereign debt in Greece, Ireland and certain other European Union countries causedsignificant fluctuations of the Euro relative to other currencies, such as the U.S. Dollar. Destabilization of theEuropean economy could lead to a decrease in consumer confidence, which could cause reductions indiscretionary spending and demand for our products. Furthermore, sovereign debt issues could also lead tofurther significant, and potentially longer-term, economic issues such as reduced economic growth anddevaluation of the Euro against the U.S. Dollar, any of which could adversely affect our business, financialconditions and operating results.
We may not be able to retain key personnel or recruit additional qualified personnel whether as a result ofthe Merger or otherwise, which could materially affect our business and require us to incur substantialadditional costs to recruit replacement personnel.
We are highly dependent on the continuing efforts of our senior management team and other key personnel.As a result of the Merger, our current and prospective employees could experience uncertainty about their futureroles. This uncertainty may adversely affect our ability to attract and retain key management, sales, marketingand technical personnel. Any failure to attract and retain key personnel, whether as a result of the Merger orotherwise, could have a material adverse effect on our business. In addition, we currently do not maintain “keyperson” insurance covering any member of our management team.
18

We participate in very competitive markets and we may not be able to compete successfully, causing us tolose market share and sales.
The markets in which we participate are very competitive. In the consumer battery market, our primarycompetitors are Duracell (a brand of Procter & Gamble), Energizer and Panasonic (a brand of Matsushita). Inthe electric shaving and grooming and electric personal care product markets, our primary competitors are Braun(a brand of Procter & Gamble), Norelco (a brand of Philips), and Vidal Sassoon and Revlon (brands of Helen ofTroy). In the pet supplies market, our primary competitors are Mars, Hartz and Central Garden & Pet. In theHome and Garden Business, our principal national competitors are Scotts, Central Garden & Pet and S.C.Johnson. Our principal national competitors within our Small Appliances segment include Jarden Corporation,DeLonghi America, Euro-Pro Operating LLC, Metro Thebe, Inc., d/b/a HWI Breville, NACCO Industries, Inc.(Hamilton Beach) and SEB S.A. In each of these markets, we also face competition from numerous othercompanies. In addition, in a number of our product lines, we compete with our retail customers, who use theirown private label brands, and with distributors and foreign manufacturers of unbranded products. Significant newcompetitors or increased competition from existing competitors may adversely affect our business, financialcondition and results of our operations.
We compete with our competitors for consumer acceptance and limited shelf space based upon brand namerecognition, perceived product quality, price, performance, product features and enhancements, productpackaging and design innovation, as well as creative marketing, promotion and distribution strategies, and newproduct introductions. Our ability to compete in these consumer product markets may be adversely affected by anumber of factors, including, but not limited to, the following:
• We compete against many well-established companies that may have substantially greater financial andother resources, including personnel and research and development, and greater overall market sharethan us.
• In some key product lines, our competitors may have lower production costs and higher profit marginsthan us, which may enable them to compete more aggressively in offering retail discounts, rebates andother promotional incentives.
• Product improvements or effective advertising campaigns by competitors may weaken consumerdemand for our products.
• Consumer purchasing behavior may shift to distribution channels where we do not have a strongpresence.
• Consumer preferences may change to lower margin products or products other than those we market.
• We may not be successful in the introduction, marketing and manufacture of any new products orproduct innovations or be able to develop and introduce, in a timely manner, innovations to ourexisting products that satisfy customer needs or achieve market acceptance.
Some competitors may be willing to reduce prices and accept lower profit margins to compete with us. As aresult of this competition, we could lose market share and sales, or be forced to reduce our prices to meetcompetition. If our product offerings are unable to compete successfully, our sales, results of operations andfinancial condition could be materially and adversely affected.
We may not be able to realize expected benefits and synergies from future acquisitions of businesses orproduct lines.
We may acquire partial or full ownership in businesses or may acquire rights to market and distributeparticular products or lines of products. The acquisition of a business or of the rights to market specific productsor use specific product names may involve a financial commitment by us, either in the form of cash or equityconsideration. In the case of a new license, such commitments are usually in the form of prepaid royalties and
19
future minimum royalty payments. There is no guarantee that we will acquire businesses or product distributionrights that will contribute positively to our earnings. Anticipated synergies may not materialize, cost savings maybe less than expected, sales of products may not meet expectations, and acquired businesses may carryunexpected liabilities.
Sales of certain of our products are seasonal and may cause our operating results and working capitalrequirements to fluctuate.
On a consolidated basis our financial results are approximately equally weighted between quarters, however,sales of certain product categories tend to be seasonal. Sales in the consumer battery, electric shaving andgrooming and electric personal care product categories, particularly in North America, tend to be concentrated inthe December holiday season (Spectrum’s first fiscal quarter). Demand for pet supplies products remains fairlyconstant throughout the year. Demand for home and garden control products sold though the Home and GardenBusiness typically peaks during the first six months of the calendar year (Spectrum’s second and third fiscalquarters). Small Appliances peaks from July through December primarily due to the increased demand bycustomers in the late summer for “back-to-school” sales and in the fall for the holiday season. As a result of thisseasonality, our inventory and working capital needs fluctuate significantly during the year. In addition, ordersfrom retailers are often made late in the period preceding the applicable peak season, making forecasting ofproduction schedules and inventory purchases difficult. If we are unable to accurately forecast and prepare forcustomer orders or our working capital needs, or there is a general downturn in business or economic conditionsduring these periods, our business, financial condition and results of operations could be materially and adverselyaffected.
We are subject to significant international business risks that could hurt our business and cause our resultsof operations to fluctuate.
Approximately 44% of our net sales for the fiscal year ended September 30, 2010 were from customersoutside of the U.S. Our pursuit of international growth opportunities may require significant investments for anextended period before returns on these investments, if any, are realized. Our international operations are subjectto risks including, among others:
• currency fluctuations, including, without limitation, fluctuations in the foreign exchange rate of theEuro;
• changes in the economic conditions or consumer preferences or demand for our products in thesemarkets;
• the risk that because our brand names may not be locally recognized, we must spend significantamounts of time and money to build brand recognition without certainty that we will be successful;
• labor unrest;
• political and economic instability, as a result of terrorist attacks, natural disasters or otherwise;
• lack of developed infrastructure;
• longer payment cycles and greater difficulty in collecting accounts;
• restrictions on transfers of funds;
• import and export duties and quotas, as well as general transportation costs;
• changes in domestic and international customs and tariffs;
• changes in foreign labor laws and regulations affecting our ability to hire and retain employees;
• inadequate protection of intellectual property in foreign countries;
• unexpected changes in regulatory environments;
20

• difficulty in complying with foreign law;
• difficulty in obtaining distribution and support; and
• adverse tax consequences.
The foregoing factors may have a material adverse effect on our ability to increase or maintain our supply ofproducts, financial condition or results of operations.
Adverse weather conditions during our peak selling season for our home and garden control products couldhave a material adverse effect on our Home and Garden Business.
Weather conditions in the U.S. have a significant impact on the timing and volume of sales of certain of ourlawn and garden and household insecticide and repellent products. Periods of dry, hot weather can decreaseinsecticide sales, while periods of cold and wet weather can slow sales of herbicides.
Our products utilize certain key raw materials; any increase in the price of, or change in supply anddemand for, these raw materials could have a material and adverse effect on our business, financialcondition and profits.
The principal raw materials used to produce our products—including zinc powder, electrolytic manganesedioxide powder, petroleum-based plastic materials, steel, aluminum, copper and corrugated materials (forpackaging)—are sourced either on a global or regional basis by us or our suppliers, and the prices of those rawmaterials are susceptible to price fluctuations due to supply and demand trends, energy costs, transportationcosts, government regulations, duties and tariffs, changes in currency exchange rates, price controls, generaleconomic conditions and other unforeseen circumstances. In particular, during 2007 and 2008, and to date in2010, we experienced extraordinary price increases for raw materials, particularly as a result of strong demandfrom China. Although we may increase the prices of certain of our goods to our customers, we may not be able topass all of these cost increases on to our customers. As a result, our margins may be adversely impacted by suchcost increases. We cannot provide any assurance that our sources of supply will not be interrupted due to changesin worldwide supply of or demand for raw materials or other events that interrupt material flow, which may havean adverse effect on our profitability and results of operations.
We regularly engage in forward purchase and hedging derivative transactions in an attempt to effectivelymanage and stabilize some of the raw material costs we expect to incur over the next 12 to 24 months; however,our hedging positions may not be effective, or may not anticipate beneficial trends, in a particular raw materialmarket or may, as a result of changes in our business, no longer be useful for us. In addition, for certain of theprincipal raw materials we use to produce our products, such as electrolytic manganese dioxide powder, there areno available effective hedging markets. If these efforts are not effective or expose us to above average costs foran extended period of time, and we are unable to pass our raw materials costs on to our customers, our futureprofitability may be materially and adversely affected. Furthermore, with respect to transportation costs, certainmodes of delivery are subject to fuel surcharges which are determined based upon the current cost of diesel fuelin relation to pre-established agreed upon costs. We may be unable to pass these fuel surcharges on to ourcustomers, which may have an adverse effect on our profitability and results of operations.
In addition, we have exclusivity arrangements and minimum purchase requirements with certain of oursuppliers for the Home and Garden Business, which increase our dependence upon and exposure to thosesuppliers. Some of those agreements include caps on the price we pay for our supplies and in certain instances,these caps have allowed us to purchase materials at below market prices. When we attempt to renew thosecontracts, the other parties to the contracts may not be willing to include or may limit the effect of those caps andcould even attempt to impose above market prices in an effort to make up for any below market prices paid by usprior to the renewal of the agreement. Any failure to timely obtain suitable supplies at competitive prices couldmaterially adversely affect our business, financial condition and results of operations.
21

We may not be able to fully utilize our U.S. net operating loss carryforwards.
As of September 30, 2010, Spectrum Brands had U.S. federal and state net operating loss carryforwards ofapproximately $1,087 million and $936 million, respectively. These net operating loss carryforwards expirethrough years ending in 2031. As of September 30, 2010, our management determined that it continues to bemore likely than not that the net U.S. deferred tax asset, excluding certain indefinite lived intangibles, will not berealized in the future and as such recorded a full valuation allowance to offset the net U.S. deferred tax asset,including Spectrum Brands’ net operating loss carryforwards. In addition, Spectrum Brands has had changes ofownership, as defined under Section 382 of the Internal Revenue Code of 1986, as amended (the “IRC”), thatcontinue to subject a significant amount of Spectrum Brands’ U.S. net operating losses and other tax attributes tocertain limitations. We estimate that approximately $296 million of our federal and $463 million of our state netoperating losses will expire unused due to the limitation in Section 382 of the IRC.
As a consequence of the Salton-Applica Merger, as well as earlier business combinations and issuances ofcommon stock consummated by both companies, use of the tax benefits of Russell Hobbs’ loss carryforwards isalso subject to limitations imposed by Section 382 of the IRC. The determination of the limitations is complexand requires significant judgment and analysis of past transactions. Our analysis to determine what portion ofRussell Hobbs’ carryforwards are restricted or eliminated by that provision is ongoing and, pursuant to suchanalysis, we expect that a significant portion of these carryforwards will not be available to offset future taxableincome, if any. In addition, use of Russell Hobbs’ net operating loss and credit carryforwards is dependent uponboth Russell Hobbs and us achieving profitable results in the future. The Russell Hobbs’ net operating losscarryforwards are subject to a full valuation allowance at September 30, 2010.
If we are unable to fully utilize our net operating losses, other than those restricted under Section 382 of theIRC, as discussed above, to offset taxable income generated in the future, our results of operations could bematerially and negatively impacted.
Consolidation of retailers and our dependence on a small number of key customers for a significantpercentage of our sales may negatively affect our business, financial condition and results of operations.
As a result of consolidation of retailers and consumer trends toward national mass merchandisers, asignificant percentage of our sales are attributable to a very limited group of customers. Our largest customeraccounted for approximately 22% of our consolidated net sales for the fiscal year ended September 30, 2010. Asthese mass merchandisers and retailers grow larger and become more sophisticated, they may demand lowerpricing, special packaging, or impose other requirements on product suppliers. These business demands mayrelate to inventory practices, logistics, or other aspects of the customer-supplier relationship. Because of theimportance of these key customers, demands for price reductions or promotions, reductions in their purchases,changes in their financial condition or loss of their accounts could have a material adverse effect on our business,financial condition and results of operations.
Although we have long-established relationships with many of our customers, we do not have long-termagreements with them and purchases are generally made through the use of individual purchase orders. Anysignificant reduction in purchases, failure to obtain anticipated orders or delays or cancellations of orders by anyof these major customers, or significant pressure to reduce prices from any of these major customers, could havea material adverse effect on our business, financial condition and results of operations. Additionally, a significantdeterioration in the financial condition of the retail industry in general could have a material adverse effect on oursales and profitability.
In addition, as a result of the desire of retailers to more closely manage inventory levels, there is a growingtrend among them to purchase products on a “just-in-time” basis. Due to a number of factors, including(i) manufacturing lead-times, (ii) seasonal purchasing patterns and (iii) the potential for material price increases,we may be required to shorten our lead-time for production and more closely anticipate our retailers’ andcustomers’ demands, which could in the future require us to carry additional inventories and increase our
22
working capital and related financing requirements. This may increase the cost of warehousing inventory orresult in excess inventory becoming difficult to manage, unusable or obsolete. In addition, if our retailerssignificantly change their inventory management strategies, we may encounter difficulties in filling customerorders or in liquidating excess inventories, or may find that customers are cancelling orders or returning products,which may have a material adverse effect on our business.
Furthermore, we primarily sell branded products and a move by one or more of our large customers to sellsignificant quantities of private label products, which we do not produce on their behalf and which directlycompete with our products, could have a material adverse effect on our business, financial condition and resultsof operations.
As a result of our international operations, we face a number of risks related to exchange rates and foreigncurrencies.
Our international sales and certain of our expenses are transacted in foreign currencies. During the fiscalyear ended September 30, 2010, approximately 44% of both our net sales and our operating expenses weredenominated in foreign currencies. We expect that the amount of our revenues and expenses transacted in foreigncurrencies will increase as our Latin American, European and Asian operations grow and, as a result, ourexposure to risks associated with foreign currencies could increase accordingly. Significant changes in the valueof the U.S. dollar in relation to foreign currencies will affect our cost of goods sold and our operating marginsand could result in exchange losses or otherwise have a material effect on our business, financial condition andresults of operations. Changes in currency exchange rates may also affect our sales to, purchases from and loansto our subsidiaries as well as sales to, purchases from and bank lines of credit with our customers, suppliers andcreditors that are denominated in foreign currencies.
We source many products from, and sell many products in, China and other Asian countries. To the extentthe Chinese Renminbi (“RMB”) or other currencies appreciate with respect to the U.S. dollar, we may experiencefluctuations in our results of operations. Since 2005, the RMB has no longer been pegged to the U.S. dollar at aconstant exchange rate and instead fluctuates versus a basket of currencies. Although the People’s Bank of Chinaregularly intervenes in the foreign exchange market to prevent significant short-term fluctuations in the exchangerate, the RMB may appreciate or depreciate within a flexible peg range against the U.S. dollar in the medium tolong term. Moreover, it is possible that in the future Chinese authorities may lift restrictions on fluctuations in theRMB exchange rate and lessen intervention in the foreign exchange market.
While we may enter into hedging transactions in the future, the availability and effectiveness of thesetransactions may be limited, and we may not be able to successfully hedge our exposure to currency fluctuations.Further, we may not be successful in implementing customer pricing or other actions in an effort to mitigate theimpact of currency fluctuations and, thus, our results of operations may be adversely impacted.
A deterioration in trade relations with China could lead to a substantial increase in tariffs imposed on goodsof Chinese origin, which potentially could reduce demand for and sales of our products.
We purchase a number of our products and supplies from suppliers located in China. China gainedPermanent Normal Trade Relations (“PNTR”) with the U.S. when it acceded to the World Trade Organization(“WTO”), effective January 2002. The U.S. imposes the lowest applicable tariffs on exports from PNTRcountries to the U.S. In order to maintain its WTO membership, China has agreed to several requirements,including the elimination of caps on foreign ownership of Chinese companies, lowering tariffs and publicizing itslaws. China may not meet these requirements, it may not remain a member of the WTO, and its PNTR tradingstatus may not be maintained. If China’s WTO membership is withdrawn or if PNTR status for goods producedin China were removed, there could be a substantial increase in tariffs imposed on goods of Chinese originentering the U.S. which could have a material negative adverse effect on our sales and gross margin.
23

Our international operations may expose us to risks related to compliance with the laws and regulations offoreign countries.
We are subject to three EU Directives that may have a material impact on our business: Restriction of theUse of Hazardous Substances in Electrical and Electronic Equipment, Waste of Electrical and ElectronicEquipment and the Directive on Batteries and Accumulators and Waste Batteries, discussed below. Restriction ofthe Use of Hazardous Substances in Electrical and Electronic Equipment requires us to eliminate specifiedhazardous materials from products we sell in EU member states. Waste of Electrical and Electronic Equipmentrequires us to collect and treat, dispose of or recycle certain products we manufacture or import into the EU atour own expense. The EU Directive on Batteries and Accumulators and Waste Batteries bans heavy metals inbatteries by establishing maximum quantities of heavy metals in batteries and mandates waste management ofthese batteries, including collection, recycling and disposal systems, with the costs imposed upon producers andimporters such as us. Complying or failing to comply with the EU Directives may harm our business. Forexample:
• Although contracts with our suppliers address related compliance issues, we may be unable to procureappropriate Restriction of the Use of Hazardous Substances in Electrical and Electronic Equipmentcompliant material in sufficient quantity and quality and/or be able to incorporate it into our productprocurement processes without compromising quality and/or harming our cost structure.
• We may face excess and obsolete inventory risk related to non-compliant inventory that we maycontinue to hold in fiscal 2010 for which there is reduced demand, and we may need to write down thecarrying value of such inventories.
• We may be unable to sell certain existing inventories of our batteries in Europe.
Many of the developing countries in which we operate do not have significant governmental regulationrelating to environmental safety, occupational safety, employment practices or other business matters routinelyregulated in the U.S. or may not rigorously enforce such regulation. As these countries and their economiesdevelop, it is possible that new regulations or increased enforcement of existing regulations may increase theexpense of doing business in these countries. In addition, social legislation in many countries in which weoperate may result in significantly higher expenses associated with labor costs, terminating employees ordistributors and closing manufacturing facilities. Increases in our costs as a result of increased regulation,legislation or enforcement could materially and adversely affect our business, results of operations and financialcondition.
We may not be able to adequately establish and protect our intellectual property rights, and theinfringement or loss of our intellectual property rights could harm our business.
To establish and protect our intellectual property rights, we rely upon a combination of national, foreign andmulti-national patent, trademark and trade secret laws, together with licenses, confidentiality agreements andother contractual arrangements. The measures that we take to protect our intellectual property rights may proveinadequate to prevent third parties from infringing or misappropriating our intellectual property. We may need toresort to litigation to enforce or defend our intellectual property rights. If a competitor or collaborator files apatent application claiming technology also claimed by us, or a trademark application claiming a trademark,service mark or trade dress also used by us, in order to protect our rights, we may have to participate in expensiveand time consuming opposition or interference proceedings before the U.S. Patent and Trademark Office or asimilar foreign agency. Similarly, our intellectual property rights may be challenged by third parties orinvalidated through administrative process or litigation. The costs associated with protecting intellectual propertyrights, including litigation costs, may be material. For example, our Small Appliances segment has spent severalmillion dollars on protecting its patented automatic litter box business over the last few years. Furthermore, evenif our intellectual property rights are not directly challenged, disputes among third parties could lead to theweakening or invalidation of our intellectual property rights, or our competitors may independently develop
24

technologies that are substantially equivalent or superior to our technology. Obtaining, protecting and defendingintellectual property rights can be time consuming and expensive, and may require us to incur substantial costs,including the diversion of the time and resources of management and technical personnel.
Moreover, the laws of certain foreign countries in which we operate or may operate in the future do notprotect, and the governments of certain foreign countries do not enforce, intellectual property rights to the sameextent as do the laws and government of the U.S., which may negate our competitive or technological advantagesin such markets. Also, some of the technology underlying our products is the subject of nonexclusive licensesfrom third parties. As a result, this technology could be made available to our competitors at any time. If we areunable to establish and then adequately protect our intellectual property rights, our business, financial conditionand results of operations could be materially and adversely affected.
We license various trademarks, trade names and patents from third parties for certain of our products. Theselicenses generally place marketing obligations on us and require us to pay fees and royalties based on net sales orprofits. Typically, these licenses may be terminated if we fail to satisfy certain minimum sales obligations or ifwe breach the terms of the license. The termination of these licensing arrangements could adversely affect ourbusiness, financial condition and results of operations.
In our Small Appliances segment, we license the use of the Black & Decker brand for marketing in certainsmall household appliances in North America, South America (excluding Brazil) and the Caribbean. Sales ofBlack & Decker branded products represented approximately 53% of the total consolidated revenue of our SmallAppliances segment in both Fiscal 2010 and Fiscal 2009. In December 2007, BDC extended the licenseagreement through December 2012, with an automatic extension through December 2014 if certain milestonesare met regarding sales volume and product return. The failure to renew the license agreement with BDC or toenter into a new agreement on acceptable terms could have a material adverse effect on our financial condition,liquidity and results of operations.
Claims by third parties that we are infringing their intellectual property and other litigation could adverselyaffect our business.
From time to time in the past we have been subject to claims that we are infringing the intellectual propertyof others. We currently are the subject of such claims and it is possible that third parties will assert infringementclaims against us in the future. An adverse finding against us in these or similar trademark or other intellectualproperty litigations may have a material adverse effect on our business, financial condition and results ofoperations. Any such claims, with or without merit, could be time consuming and expensive, and may require usto incur substantial costs, including the diversion of the resources of management and technical personnel, causeproduct delays or require us to enter into licensing or other agreements in order to secure continued access tonecessary or desirable intellectual property. If we are deemed to be infringing a third party’s intellectual propertyand are unable to continue using that intellectual property as we had been, our business and results of operationscould be harmed if we are unable to successfully develop non-infringing alternative intellectual property on atimely basis or license non-infringing alternatives or substitutes, if any exist, on commercially reasonable terms.In addition, an unfavorable ruling in intellectual property litigation could subject us to significant liability, aswell as require us to cease developing, manufacturing or selling the affected products or using the affectedprocesses or trademarks. Any significant restriction on our proprietary or licensed intellectual property thatimpedes our ability to develop and commercialize our products could have a material adverse effect on ourbusiness, financial condition and results of operations.
25
Our dependence on a few suppliers and one of our U.S. facilities for certain of our products makes usvulnerable to a disruption in the supply of our products.
Although we have long-standing relationships with many of our suppliers, we generally do not have long-term contracts with them. An adverse change in any of the following could have a material adverse effect on ourbusiness, financial condition and results of operations:
• our ability to identify and develop relationships with qualified suppliers;
• the terms and conditions upon which we purchase products from our suppliers, including applicableexchange rates, transport costs and other costs, our suppliers’ willingness to extend credit to us tofinance our inventory purchases and other factors beyond our control;
• the financial condition of our suppliers;
• political instability in the countries in which our suppliers are located;
• our ability to import outsourced products;
• our suppliers’ noncompliance with applicable laws, trade restrictions and tariffs; or
• our suppliers’ ability to manufacture and deliver outsourced products according to our standards ofquality on a timely and efficient basis.
If our relationship with one of our key suppliers is adversely affected, we may not be able to quickly oreffectively replace such supplier and may not be able to retrieve tooling, molds or other specialized productionequipment or processes used by such supplier in the manufacture of our products.
In addition, we manufacture the majority of our foil cutting systems for our shaving product lines, usingspecially designed machines and proprietary cutting technology, at our Portage, Wisconsin facility. Damage tothis facility, or prolonged interruption in the operations of this facility for repairs, as a result of labor difficultiesor for other reasons, could have a material adverse effect on our ability to manufacture and sell our foil shavingproducts which could in turn harm our business, financial condition and results of operations.
We face risks related to our sales of products obtained from third-party suppliers.
We sell a significant number of products that are manufactured by third party suppliers over which we haveno direct control. While we have implemented processes and procedures to try to ensure that the suppliers we useare complying with all applicable regulations, there can be no assurances that such suppliers in all instances willcomply with such processes and procedures or otherwise with applicable regulations. Noncompliance couldresult in our marketing and distribution of contaminated, defective or dangerous products which could subject usto liabilities and could result in the imposition by governmental authorities of procedures or penalties that couldrestrict or eliminate our ability to purchase products from non-compliant suppliers. Any or all of these effectscould adversely affect our business, financial condition and results of operations.
Class action and derivative action lawsuits and other investigations, regardless of their merits, could havean adverse effect on our business, financial condition and results of operations.
We and certain of our officers and directors have been named in the past, and may be named in the future, asdefendants of class action and derivative action lawsuits. In the past, we have also received requests forinformation from government authorities. Regardless of their subject matter or merits, class action lawsuits andother government investigations may result in significant cost to us, which may not be covered by insurance, maydivert the attention of management or may otherwise have an adverse effect on our business, financial conditionand results of operations.
26

We may be exposed to significant product liability claims which our insurance may not cover and whichcould harm our reputation.
In the ordinary course of our business, we may be named as a defendant in lawsuits involving productliability claims. In any such proceeding, plaintiffs may seek to recover large and sometimes unspecified amountsof damages and the matters may remain unresolved for several years. Any such matters could have a materialadverse effect on our business, results of operations and financial condition if we are unable to successfullydefend against or settle these matters or if our insurance coverage is insufficient to satisfy any judgments againstus or settlements relating to these matters. Although we have product liability insurance coverage and an excessumbrella policy, our insurance policies may not provide coverage for certain, or any, claims against us or maynot be sufficient to cover all possible liabilities. Additionally, we do not maintain product recall insurance. Wemay not be able to maintain such insurance on acceptable terms, if at all, in the future. Moreover, any adversepublicity arising from claims made against us, even if the claims were not successful, could adversely affect thereputation and sales of our products. In particular, product recalls or product liability claims challenging thesafety of our products may result in a decline in sales for a particular product. This could be true even if theclaims themselves are ultimately settled for immaterial amounts. This type of adverse publicity could occur andproduct liability claims could be made in the future.
We may incur material capital and other costs due to environmental liabilities.
We are subject to a broad range of federal, state, local, foreign and multi-national laws and regulationsrelating to the environment. These include laws and regulations that govern:
• discharges to the air, water and land;
• the handling and disposal of solid and hazardous substances and wastes; and
• remediation of contamination associated with release of hazardous substances at our facilities and atoff-site disposal locations.
Risk of environmental liability is inherent in our business. As a result, material environmental costs mayarise in the future. In particular, we may incur capital and other costs to comply with increasingly stringentenvironmental laws and enforcement policies, such as the EU Directives: Restriction of the Use of HazardousSubstances in Electrical and Electronic Equipment, Waste of Electrical and Electronic Equipment and theDirective on Batteries and Accumulators and Waste Batteries, discussed above. Moreover, there are proposedinternational accords and treaties, as well as federal, state and local laws and regulations, that would attempt tocontrol or limit the causes of climate change, including the effect of greenhouse gas emissions on theenvironment. In the event that the U.S. government or foreign governments enact new climate change laws orregulations or make changes to existing laws or regulations, compliance with applicable laws or regulations mayresult in increased manufacturing costs for our products, such as by requiring investment in new pollution controlequipment or changing the ways in which certain of our products are made. We may incur some of these costsdirectly and others may be passed on to us from our third-party suppliers. Although we believe that we aresubstantially in compliance with applicable environmental laws and regulations at our facilities, we may notalways be in compliance with such laws and regulations or any new laws and regulations in the future, whichcould have a material adverse effect on our business, financial condition and results of operations.
From time to time, we have been required to address the effect of historic activities on the environmentalcondition of our properties or former properties. We have not conducted invasive testing at all of our facilities toidentify all potential environmental liability risks. Given the age of our facilities and the nature of our operations,material liabilities may arise in the future in connection with our current or former facilities. If previouslyunknown contamination of property underlying or in the vicinity of our manufacturing facilities is discovered, wecould be required to incur material unforeseen expenses. If this occurs, it may have a material adverse effect onour business, financial condition and results of operations. We are currently engaged in investigative or remedialprojects at a few of our facilities and any liabilities arising from such investigative or remedial projects at suchfacilities may have a material effect on our business, financial condition and results of operations.
27

We are also subject to proceedings related to our disposal of industrial and hazardous material at off-sitedisposal locations or similar disposals made by other parties for which we are responsible as a result of ourrelationship with such other parties. These proceedings are under CERCLA or similar state or foreign jurisdictionlaws that hold persons who “arranged for” the disposal or treatment of such substances strictly liable for costsincurred in responding to the release or threatened release of hazardous substances from such sites, regardless offault or the lawfulness of the original disposal. Liability under CERCLA is typically joint and several, meaningthat a liable party may be responsible for all of the costs incurred in investigating and remediating contaminationat a site. We occasionally are identified by federal or state governmental agencies as being a potentiallyresponsible party for response actions contemplated at an off-site facility. At the existing sites where we havebeen notified of our status as a potentially responsible party, it is either premature to determine if our potentialliability, if any, will be material or we do not believe that our liability, if any, will be material. We may be namedas a potentially responsible party under CERCLA or similar state or foreign jurisdiction laws in the future forother sites not currently known to us, and the costs and liabilities associated with these sites may have a materialadverse effect on our business, financial condition and results of operations.
Compliance with various public health, consumer protection and other regulations applicable to ourproducts and facilities could increase our cost of doing business and expose us to additional requirementswith which we may be unable to comply.
Certain of our products sold through, and facilities operated under, each of our business segments areregulated by the EPA, the FDA or other federal consumer protection and product safety agencies and are subjectto the regulations such agencies enforce, as well as by similar state, foreign and multinational agencies andregulations. For example, in the U.S., all products containing pesticides must be registered with the EPA and, inmany cases, similar state and foreign agencies before they can be manufactured or sold. Our inability to obtain,or the cancellation of, any registration could have an adverse effect on our business, financial condition andresults of operations. The severity of the effect would depend on which products were involved, whether anotherproduct could be substituted and whether our competitors were similarly affected. We attempt to anticipateregulatory developments and maintain registrations of, and access to, substitute chemicals and other ingredients,but we may not always be able to avoid or minimize these risks.
As a distributor of consumer products in the U.S., certain of our products are also subject to the ConsumerProduct Safety Act, which empowers the U.S. Consumer Product Safety Commission (the “ConsumerCommission”) to exclude from the market products that are found to be unsafe or hazardous. Under certaincircumstances, the Consumer Commission could require us to repair, replace or refund the purchase price of oneor more of our products, or we may voluntarily do so. For example, Russell Hobbs, in cooperation with theConsumer Commission, voluntarily recalled approximately 9,800 units of a thermal coffeemaker sold under theBlack & Decker brand in August 2009 and approximately 584,000 coffeemakers in June 2009. Any additionalrepurchases or recalls of our products could be costly to us and could damage the reputation or the value of ourbrands. If we are required to remove, or we voluntarily remove our products from the market, our reputation orbrands could be tarnished and we may have large quantities of finished products that could not be sold.Furthermore, failure to timely notify the Consumer Commission of a potential safety hazard can result insignificant fines being assessed against us. Additionally, laws regulating certain consumer products exist in somestates, as well as in other countries in which we sell our products, and more restrictive laws and regulations maybe adopted in the future.
The FQPA established a standard for food-use pesticides, which is that a reasonable certainty of no harmwill result from the cumulative effect of pesticide exposures. Under the FQPA, the EPA is evaluating thecumulative effects from dietary and non-dietary exposures to pesticides. The pesticides in certain of our productsthat are sold through the Home and Garden Business continue to be evaluated by the EPA as part of this program.It is possible that the EPA or a third party active ingredient registrant may decide that a pesticide we use in ourproducts will be limited or made unavailable to us. We cannot predict the outcome or the severity of the effect ofthe EPA’s continuing evaluations of active ingredients used in our products.
28

In addition, the use of certain pesticide and fertilizer products that are sold through our global pet suppliesbusiness and through the Home and Garden Business may, among other things, be regulated by various local,state, federal and foreign environmental and public health agencies. These regulations may require that onlycertified or professional users apply the product, that users post notices on properties where products have beenor will be applied or that certain ingredients may not be used. Compliance with such public health regulationscould increase our cost of doing business and expose us to additional requirements with which we may be unableto comply.
Any failure to comply with these laws or regulations, or the terms of applicable environmental permits,could result in us incurring substantial costs, including fines, penalties and other civil and criminal sanctions orthe prohibition of sales of our pest control products. Environmental law requirements, and the enforcementthereof, change frequently, have tended to become more stringent over time and could require us to incursignificant expenses.
Most federal, state and local authorities require certification by Underwriters Laboratory, Inc. (“UL”), anindependent, not-for-profit corporation engaged in the testing of products for compliance with certain publicsafety standards, or other safety regulation certification prior to marketing electrical appliances. Foreignjurisdictions also have regulatory authorities overseeing the safety of consumer products. Our products may notmeet the specifications required by these authorities. A determination that any of our products are not incompliance with these rules and regulations could result in the imposition of fines or an award of damages toprivate litigants.
Public perceptions that some of the products we produce and market are not safe could adversely affect us.
On occasion, customers and some current or former employees have alleged that some products failed toperform up to expectations or have caused damage or injury to individuals or property. Public perception that anyof our products are not safe, whether justified or not, could impair our reputation, damage our brand names andhave a material adverse effect on our business, financial condition and results of operations.
If we are unable to negotiate satisfactory terms to continue existing or enter into additional collectivebargaining agreements, we may experience an increased risk of labor disruptions and our results ofoperations and financial condition may suffer.
Approximately 20% of our total labor force is employed under collective bargaining agreements. One ofthese agreements, which covers approximately 12% of the labor force under collective bargaining agreements, orapproximately 2% of our total labor force, is scheduled to expire on September 30, 2011. While we currentlyexpect to negotiate continuations to the terms of these agreements, there can be no assurances that we will beable to obtain terms that are satisfactory to us or otherwise to reach agreement at all with the applicable parties.In addition, in the course of our business, we may also become subject to additional collective bargainingagreements. These agreements may be on terms that are less favorable than those under our current collectivebargaining agreements. Increased exposure to collective bargaining agreements, whether on terms more or lessfavorable than existing collective bargaining agreements, could adversely affect the operation of our business,including through increased labor expenses. While we intend to comply with all collective bargaining agreementsto which we are subject, there can be no assurances that we will be able to do so and any noncompliance couldsubject us to disruptions in our operations and materially and adversely affect our results of operations andfinancial condition.
Significant changes in actual investment return on pension assets, discount rates and other factors couldaffect our results of operations, equity and pension contributions in future periods.
Our results of operations may be positively or negatively affected by the amount of income or expense werecord for our defined benefit pension plans. GAAP requires that we calculate income or expense for the plans
29

using actuarial valuations. These valuations reflect assumptions about financial market and other economicconditions, which may change based on changes in key economic indicators. The most significant year-endassumptions we used to estimate pension income or expense are the discount rate and the expected long-term rateof return on plan assets. In addition, we are required to make an annual measurement of plan assets andliabilities, which may result in a significant change to equity. Although pension expense and pension fundingcontributions are not directly related, key economic factors that affect pension expense would also likely affectthe amount of cash we would contribute to pension plans as required under the Employee Retirement IncomeSecurity Act of 1974, as amended.
If our goodwill, indefinite-lived intangible assets or other long-term assets become impaired, we will berequired to record additional impairment charges, which may be significant.
A significant portion of our long-term assets consist of goodwill, other indefinite-lived intangible assets andfinite-lived intangible assets recorded as a result of past acquisitions. We do not amortize goodwill andindefinite-lived intangible assets, but rather review them for impairment on a periodic basis or whenever eventsor changes in circumstances indicate that their carrying value may not be recoverable. We consider whethercircumstances or conditions exist which suggest that the carrying value of our goodwill and other long-livedassets might be impaired. If such circumstances or conditions exist, further steps are required in order todetermine whether the carrying value of each of the individual assets exceeds its fair market value. If analysisindicates that an individual asset’s carrying value does exceed its fair market value, the next step is to record aloss equal to the excess of the individual asset’s carrying value over its fair value.
The steps required by GAAP entail significant amounts of judgment and subjectivity. Events and changes incircumstances that may indicate that there is impairment and which may indicate that interim impairment testingis necessary include, but are not limited to: strategic decisions to exit a business or dispose of an asset made inresponse to changes in economic; political and competitive conditions; the impact of the economic environmenton the customer base and on broad market conditions that drive valuation considerations by market participants;our internal expectations with regard to future revenue growth and the assumptions we make when performingimpairment reviews; a significant decrease in the market price of our assets; a significant adverse change in theextent or manner in which our assets are used; a significant adverse change in legal factors or the businessclimate that could affect our assets; an accumulation of costs significantly in excess of the amount originallyexpected for the acquisition of an asset; and significant changes in the cash flows associated with an asset. As aresult of such circumstances, we may be required to record a significant charge to earnings in our financialstatements during the period in which any impairment of our goodwill, indefinite-lived intangible assets or otherlong-term assets is determined. Any such impairment charges could have a material adverse effect on ourbusiness, financial condition and operating results.
Risks Related to SB Holdings’ Common Stock
The Harbinger Parties and, following the Share Exchange, HRG, will exercise significant influence over usand their interests in our business may be different from the interests of our stockholders.
As a result of the consummation of the Merger and other transactions, as of the date hereof, the HarbingerParties beneficially owned approximately 67% of our outstanding common stock. Upon consummation of theShare Exchange, HRG will own approximately 54% of our outstanding common stock and the remainingHarbinger Parties will own approximately 13% of our outstanding common stock. The Harbinger Parties willown approximately 93% of the outstanding common stock of HRG. The Harbinger Parties and, assuming theconsummation of the Share Exchange, HRG, both separately and in conjunction with the Harbinger Parties, willhave the ability to influence the outcome of any corporate action by us, which requires stockholder approval,including, but not limited to, the election of directors, approval of merger transactions and the sale of all orsubstantially all of our assets. In addition, we are a party to a stockholder agreement with HRG and the HarbingerParties.
30

This influence and actual control may have the effect of discouraging offers to acquire SB Holdings becauseany such consummation would likely require the consent of HRG and perhaps HRG and the Harbinger Parties.HRG and the Harbinger Parties may also delay or prevent a change in control of SB Holdings. See “RisksRelated to our Business—Assuming consummation of a pending transaction by which Harbinger Group, Inc.(“HRG”) would acquire a majority of the outstanding shares of our common stock, any sale or other dispositionby HRG to non-affiliates of a significant amount of the common stock of SB Holdings would constitute a changeof control under the agreements governing Spectrum Brands’ debt.”
In addition, because, as of the date hereof the Harbinger Parties owned, and, assuming the consummation ofthe Share Exchange, HRG and the Harbinger Parties will own more than 50% of the voting power of SBHoldings, SB Holdings is considered a controlled company under the NYSE listing standards. As such, theNYSE corporate governance rules requiring that a majority of SB Holdings’ board of directors and SB Holdings’entire compensation committee be independent do not apply. As a result, the ability of SB Holdings’ independentdirectors to influence its business policies and affairs may be reduced.
If HRG and/or the Harbinger Parties sell substantial amounts of SB Holdings’ common stock in the publicmarket, or investors perceive that these sales could occur, the market price of SB Holdings’ common stock couldbe adversely affected. SB Holdings has entered into a registration rights agreement (the “Registration RightsAgreement”) with HRG, the Harbinger Parties and certain other stockholders. If requested properly under theterms of the Registration Rights Agreement, these stockholders have the right to require SB Holdings to registerall or some of such shares for sale under the Securities Act in certain circumstances and also have the right toinclude those shares in a registration initiated by SB Holdings. If SB Holdings is required to include the shares ofits common stock held by these stockholders pursuant to these registration rights in a registration initiated by SBHoldings, sales made by such stockholders may adversely affect the price of SB Holdings’ common stock andSB Holdings’ ability to raise needed capital. In addition, if these stockholders exercise their demand registrationrights and cause a large number of shares to be registered and sold in the public market or demand that SBHoldings register their shares on a shelf registration statement, such sales or shelf registration may have anadverse effect on the market price of SB Holdings’ common stock.
The interests of HRG and the Harbinger Parties, which have investments in other companies, may from timeto time diverge from the interests of other SB Holdings stockholders and from each other, particularly withregard to new investment opportunities. Neither HRG nor the Harbinger Parties are restricted from investing inother businesses involving or related to the marketing or distribution of household products, pet and pestproducts and personal care products. Both HRG and the Harbinger Parties may also engage in other businessesthat compete or may in the future compete with SB Holdings.
Even though SB Holdings’ common stock is currently traded on the NYSE, it has less liquidity than manyother stocks quoted on a national securities exchange.
The trading volume in SB Holdings’ common stock on the NYSE has been relatively low when comparedwith larger companies listed on the NYSE or other stock exchanges. Because of this, it may be more difficult forstockholders to sell a substantial number of shares for the same price at which stockholders could sell a smallernumber of shares. We cannot predict the effect, if any, that future sales of SB Holdings’ common stock in themarket, or the availability of shares of its common stock for sale in the market, will have on the market price ofSB Holdings’ common stock. We can give no assurance that sales of substantial amounts of SB Holdings’common stock in the market, or the potential for large amounts of sales in the market, would not cause the priceof SB Holdings’ common stock to decline or impair SB Holdings’ future ability to raise capital through sales ofits common stock. Furthermore, because of the limited market and generally low volume of trading in SBHoldings’ common stock that could occur, the share price of its common stock could be more likely to beaffected by broad market fluctuations, general market conditions, fluctuations in our operating results, changes inthe market’s perception of our business, and announcements made by SB Holdings, its competitors or partieswith whom SB Holdings has business relationships. The lack of liquidity in SB Holdings’ common stock may
31
also make it difficult for us to issue additional securities for financing or other purposes, or to otherwise arrangefor any financing we may need in the future. In addition, we may experience other adverse effects, including,without limitation, the loss of confidence in us by current and prospective suppliers, customers, employees andothers with whom we have or may seek to initiate business relationships.
The market price of SB Holdings’ common stock is likely to be highly volatile and could fluctuate widely inprice in response to various factors, many of which are beyond our control.
Factors that may influence the price of the common stock include, without limitation, the following:
• loss of any of our key customers or suppliers;
• additions or departures of key personnel;
• sales of the common stock;
• our ability to execute our business plan;
• operating results that fall below expectations;
• additional issuances of the common stock;
• low volume of sales due to concentrated ownership of the common stock;
• intellectual property disputes;
• industry developments;
• economic and other external factors;
• period-to-period fluctuations in our financial results; and
• market concerns with respect to the potential indirect impact of matters not directly involving SBHoldings but impacting HRG or the Harbinger Parties.
In addition, the securities markets have from time to time experienced significant price and volumefluctuations that are unrelated to the operating performance of particular companies. These market fluctuationsmay also materially and adversely affect the market price of the common stock. You should also be aware thatprice volatility might be worse if the trading volume of shares of the common stock is low.
Additional issuances of SB Holdings’ common stock may result in dilution to its existing stockholders.
As of September 30, 2010, we had two active equity incentive plans under which shares of the Companycould be issued, the 2009 Spectrum Brands Inc. Incentive Plan (the “2009 Plan”) and the Spectrum BrandsHoldings, Inc. 2007 Omnibus Equity Award Plan (the “RH Plan”). On October 21, 2010, the our Board ofDirectors adopted the Spectrum Brands Holdings, Inc. 2011 Omnibus Equity Award Plan (“2011 Plan”), subjectto shareholder approval prior to October 21, 2011 and we intend to submit the 2011 Plan for shareholderapproval in connection with our next Annual Meeting. Upon such shareholder approval, no further awards willbe granted under the 2009 Plan and the 2007 RH Plan. 4,625,676 shares of our common stock of the Company,net of cancellations, may be issued under the 2011 Plan. While we have begun granting awards under the 2011Plan, the 2011 Plan (and awards granted thereunder) are subject to the approval by a majority of the holders ofour common stock eligible to vote thereon prior to October 21, 2011. As December 10, 2010, we have issued667,933 restricted shares and 1,694,048 restricted stock units under the 2009 Plan, the RH Plan and the 2011Plan and are authorized to issue up to a total of 3,202,590 shares of our common stock, or options or restrictedstock units exercisable for shares of common stock.
In addition, our board of directors has the authority to issue additional shares of capital stock to provideadditional financing or for other purposes in the future. The issuance of any such shares or exercise of any such
32

options may result in a reduction of the book value or market price of the outstanding shares of common stock. Ifwe do issue any such additional shares or any such options are exercised, such issuance or exercise also willcause a reduction in the proportionate ownership and voting power of all other stockholders. As a result of suchdilution, the proportionate ownership interest and voting power of a holder of shares of common stock could bedecreased. Further, any such issuance or exercise could result in a change of control. Under our certificate ofincorporation, holders of 5% or more of the outstanding common stock or capital stock into which any shares ofcommon stock may be converted have certain rights to purchase their pro rata share of certain future issuances ofsecurities.
Spectrum Brands has historically not paid dividends on its public common stock and we do not anticipatepaying dividends on our public common stock in the foreseeable future, and, therefore, any return oninvestment may be limited to the value of the common stock.
Spectrum Brands, prior to the Merger had not declared or paid dividends on its common stock since thestock commenced public trading in 1997, we have not declared or paid dividends on our common stock since thestock commenced public trading in 2010, and while we continue to evaluate the potential payment of dividends,we do not currently anticipate paying dividends in the foreseeable future. The payment of dividends onoutstanding common stock will depend on earnings, financial condition and other business and economic factorsaffecting us at such time as our board of directors may consider relevant, including the ability to do so under ourcredit and other debt agreements. If we do not pay dividends, returns on an investment in our common stock willonly occur if the stock price appreciates.
ITEM 1B. UNRESOLVED STAFF COMMENTS
None.
33

ITEM 2. PROPERTIES
The following table lists our principal owned or leased manufacturing, packaging, and distribution facilitiesat September 30, 2010:
Facility Function
Global Batteries & Personal CareFennimore, Wisconsin(1) . . . . . . . . . . . . . . Alkaline Battery ManufacturingPortage, Wisconsin(1) . . . . . . . . . . . . . . . . Zinc Air Button Cell and Lithium Coin Cell Battery, Foil
Shaver Component ManufacturingDischingen, Germany(1) . . . . . . . . . . . . . . Alkaline Battery ManufacturingWashington, UK(2) . . . . . . . . . . . . . . . . . . Zinc Air Button Cell Battery Manufacturing & DistributionGuatemala City, Guatemala(1) . . . . . . . . . Zinc Carbon Battery ManufacturingJaboatao, Brazil(1) . . . . . . . . . . . . . . . . . . . Zinc Carbon Battery ManufacturingManizales, Colombia(1) . . . . . . . . . . . . . . . Zinc Carbon Battery ManufacturingDixon, Illinois(2) . . . . . . . . . . . . . . . . . . . . Battery & Lighting Device Packaging & DistributionVisalia, California(2) . . . . . . . . . . . . . . . . . Electric Shaver & Personal Care Product DistributionEllwangen-Neunheim, Germany(2) . . . . . . Battery & Lighting Device, Electric Shaver & Personal Care
Product Distribution
Global Pet SuppliesMentor, Ohio(3) . . . . . . . . . . . . . . . . . . . . . Aquatics ManufacturingNoblesville, Indiana(1) . . . . . . . . . . . . . . . Aquatics ManufacturingMoorpark, California(2) . . . . . . . . . . . . . . . Aquatics ManufacturingBridgeton, Missouri(2) . . . . . . . . . . . . . . . . Pet Supply Manufacturing (shared with the Home and Garden
Business)Blacksburg, Virginia(1) . . . . . . . . . . . . . . . Pet Supply Manufacturing, Assembly & DistributionMelle, Germany(1) . . . . . . . . . . . . . . . . . . . Pet Food & Pet Care ManufacturingMelle, Germany(2) . . . . . . . . . . . . . . . . . . . Pet Food & Pet Care DistributionEdwardsville, Illinois(2) . . . . . . . . . . . . . . Pet Supply Product Distribution
Home and Garden BusinessVinita Park, Missouri(2) . . . . . . . . . . . . . . Household & Controls and Contract ManufacturingBridgeton, Missouri(2) . . . . . . . . . . . . . . . . Household & Controls Manufacturing (shared with Global Pet)
Small AppliancesRedlands, California(2) . . . . . . . . . . . . . . . WarehouseWolverhampton, England(1) . . . . . . . . . . . WarehouseManchester, England(1) . . . . . . . . . . . . . . . Warehouse and Sales and administrative officeWolverhampton, England(2) . . . . . . . . . . . Warehouse
(1) Facility is owned.(2) Facility is leased.(3) Exited the facility in October 2010.
We also own, operate or contract with third parties to operate distribution centers, sales offices andadministrative offices throughout the world in support of our business. We lease our administrative headquartersand primary research and development facility located in Madison, Wisconsin.
We believe that our existing facilities are suitable and adequate for our present purposes and that theproductive capacity in such facilities is substantially being utilized or we have plans to utilize it.
34

ITEM 3. LEGAL PROCEEDINGS
Litigation
In December 2009, San Francisco Technology, Inc. filed an action in the Federal District Court for theNorthern District of California against the Company, as well as a number of unaffiliated defendants, claimingthat each of the defendants had falsely marked patents on certain of its products in violation of Article 35,Section 292 of the U.S. Code and seeking to have civil fines imposed on each of the defendants for such claimedviolations. The Company is reviewing the claims and intends to vigorously defend this matter but, as of the dateof this Annual Report on Form 10-K, cannot estimate any possible losses.
In May 2010, Herengrucht Group, LLC (“Herengrucht”) filed an action in the U.S. District Court for theSouthern District of California against the Company claiming that the Company had falsely marked patents oncertain of its products in violation of Article 35, Section 292 of the U.S. Code and seeking to have civil finesimposed on each of the defendants for such claimed violations. Herengrucht dismissed its claims withoutprejudice in September 2010.
Applica Consumer Products, Inc. (“Applica”), a subsidiary of the Company, is a defendant in NACCOIndustries, Inc. et al. v. Applica Incorporated et al., Case No. C.A. 2541-VCL, which was filed in the Court ofChancery of the State of Delaware in November 2006.
The original complaint in this action alleged a claim for, among other things, breach of contract againstApplica and a number of tort claims against certain entities affiliated with the Harbinger Parties. The claimsagainst Applica related to the alleged breach of the merger agreement between Applica and NACCO Industries,Inc. (“NACCO”) and one of its affiliates, which agreement was terminated following Applica’s receipt of asuperior merger offer from the HCP Funds. On October 22, 2007, the plaintiffs filed an amended complaintasserting claims against Applica for, among other things, breach of contract and breach of the implied covenantof good faith relating to the termination of the NACCO merger agreement and asserting various tort claimsagainst Applica and the HCP Funds. The original complaint was filed in conjunction with a motion preliminarilyto enjoin the HCP Funds’ acquisition of Applica. On December 1, 2006, plaintiffs withdrew their motion for apreliminary injunction. In light of the consummation of Applica’s merger with affiliates of the HCP Funds inJanuary 2007 (Applica is currently a subsidiary of Russell Hobbs), the Company believes that any claim forspecific performance is moot. Applica filed a motion to dismiss the amended complaint in December 2007.Rather than respond to the motion to dismiss the amended complaint, NACCO filed a motion for leave to file asecond amended complaint, which was granted in May 2008. Applica moved to dismiss the second amendedcomplaint, which motion was granted in part and denied in part in December 2009.
The trial is currently scheduled for February 2011. The Company intends to vigorously defend the action,but may be unable to resolve the disputes successfully or without incurring significant costs and expenses. As aresult, Russell Hobbs and Harbinger Master Fund have entered into an indemnification agreement, dated as ofFebruary 9, 2010, by which Harbinger Master Fund has agreed, effective upon the consummation of the Merger,to indemnify Russell Hobbs, its subsidiaries and any entity that owns all of the outstanding voting stock ofRussell Hobbs against any out-of-pocket losses, costs, expenses, judgments, penalties, fines and other damages inexcess of $3 million incurred with respect to this litigation and any future litigation or legal action against theindemnified parties arising out of or relating to the matters which form the basis of this litigation.
Applica is a defendant in three asbestos lawsuits in which the plaintiffs have alleged injury as the result ofexposure to asbestos in hair dryers distributed by that subsidiary over 20 years ago. Although Applica nevermanufactured such products, asbestos was used in certain hair dryers distributed by it prior to 1979. TheCompany believes that these actions are without merit and intends to vigorously defend the action, but may beunable to resolve the disputes successfully without incurring significant expenses. As of the date of this AnnualReport on Form 10-K, the Company cannot estimate any possible losses. At this time, the Company does notbelieve it has coverage under its insurance policies for the asbestos lawsuits.
35
The Company is a defendant in various matters of litigation generally arising out of the ordinary course ofbusiness.
Environmental
We are subject to various federal, state and local environmental laws and regulations. We believe we are insubstantial compliance with all such environmental laws that are applicable to our operations. See also thediscussion captioned “Governmental Regulations and Environmental Matters” under Item 1 above.
ITEM 4. (REMOVED AND RESERVED)
36

PART II
ITEM 5. MARKET FOR THE REGISTRANT’S COMMON EQUITY, RELATED STOCKHOLDERMATTERS AND ISSUER PURCHASES OF EQUITY SECURITIES
SB Holdings is a global consumer products company and was created in connection with the combination ofSpectrum Brands and Russell Hobbs to form a new combined company, on June 16, 2010. SB Holdings’common stock (the “SBH Common Stock”) is traded on the NYSE under the symbol “SPB.” Prior to June 16,2010, Spectrum Brands’ common stock was traded on the NYSE under the symbol “SPB.” The SBH CommonStock has a par value of $0.01 per share.
The common stock of reorganized Spectrum Brands (the “New Common Stock”) began quotation on theOTC Bulletin Board and the Pink Sheet Electronic Quotation Service under the symbol “SPEB” on September 2,2009. The New Common Stock began trading on the NYSE under the new ticker symbol “SPB” on March 18,2010. In connection with the consummation of the Merger, the New Common Stock was delisted from the NYSEand the SBH Common Stock succeeded to its listing status under the symbol “SPB.”
As of December 10, 2010, there were approximately 21 holders of record based upon data provided by thetransfer agent for the SBH Common Stock. We believe the number of beneficial holders of our New CommonStock is significantly in excess of this amount. The transfer agent for the SBH Common Stock is Mellon InvestorServices LLC.
The following table sets forth the reported high and low bid prices per share of (i) for the period fromAugust 30, 2009 through March 17, 2010, the New Common Stock as reported on the Pink Sheet ElectronicQuotation Service; (ii) for the period from March 18, 2010 through June 15, 2010, the New Common Stock asreported on the NYSE Composite Transaction Tape; and (iii) for the period from June 16, 2010, the SBHCommon Stock thereafter as reported on the NYSE Composite Transaction Tape since March 18, 2010 for thefiscal period indicated:
High Low
Fiscal 2010Quarter ended September 30, 2010 . . . . . . . . . . . . . . . . . . . . . . . . . . . . . . . . . . . . . . $29.88 $22.86Quarter ended July 4, 2010 . . . . . . . . . . . . . . . . . . . . . . . . . . . . . . . . . . . . . . . . . . . . $30.95 $23.70Quarter ended April 4, 2010 . . . . . . . . . . . . . . . . . . . . . . . . . . . . . . . . . . . . . . . . . . . $33.00 $22.00Quarter ended January 3, 2010 . . . . . . . . . . . . . . . . . . . . . . . . . . . . . . . . . . . . . . . . . $23.50 $21.05
Fiscal 2009Quarter ended September 30, 2009 (from August 30 through September 30,2009) . . . . . . . . . . . . . . . . . . . . . . . . . . . . . . . . . . . . . . . . . . . . . . . . . . . . . . . . . . . $25.00 $12.50
From November 21, 1997, the day the Old Common Stock commenced trading, to December 22, 2008, ourcommon stock, par value $0.01 per share (the “Old Common Stock”) was traded on the NYSE under the symbol“SPC.”
On December 15, 2008, we were advised that our Old Common Stock would be suspended from trading onthe NYSE prior to the opening of the market on December 22, 2008. We were advised that the decision tosuspend our Old Common Stock was reached in view of the fact that we had recently fallen below the NYSE’scontinued listing standard regarding average global market capitalization over a consecutive 30 trading dayperiod of not less than $25 million, the minimum threshold for listing on the NYSE. Our Old Common Stock wasdelisted from the NYSE effective January 23, 2009. Our Old Common Stock was then quoted on the Pink SheetElectronic Quotation Service under the symbol “SPCB” until August 28, 2009 when the Old Common Stock wascancelled pursuant to the Plan in our Chapter 11 reorganization.
37

The following table sets forth the reported high and low prices per share of the Old Common Stock asreported on the NYSE Composite Transaction Tape and the Pink Sheet Electronic Quotation Service for thefiscal periods indicated:
High Low
Fiscal 2009Quarter ended September 30, 2009 (through August 27, 2009) . . . . . . . . . . . . . . . . $0.05(1) $0.01(1)Quarter ended June 28, 2009 . . . . . . . . . . . . . . . . . . . . . . . . . . . . . . . . . . . . . . . . . . . $0.30(1) $0.04(1)Quarter ended March 29, 2009 . . . . . . . . . . . . . . . . . . . . . . . . . . . . . . . . . . . . . . . . . $0.17(1) $0.01(1)Quarter ended December 28, 2008 . . . . . . . . . . . . . . . . . . . . . . . . . . . . . . . . . . . . . . $1.86(2) $0.08(2)
(1) Represents market prices while Spectrum Brands operated during the Chapter 11 reorganization for periodssubsequent to February 2, 2009.
(2) High price reflects the high sales price on NYSE prior to Old Spectrum’s suspension from trading onDecember 15, 2008. Low price reflects the OTC market low bid price during the balance of the quarter.
The OTC bid prices represent prices between dealers and do not include retail markup, markdown orcommission.
The historical prices for the Old Common Stock and the New Common Stock may not be indicative of theanticipated or prospective value or future trading price of or trading market for the SBH Common Stock.
Spectrum Brands did not declare or pay any cash dividends on our Old Common Stock at any time since itcommenced public trading in 1997 through its delisting in connection with the Merger on June 16, 2010, and we didnot declare or pay cash dividends on the SBH Common Stock at any time since it commenced public trading onJune 16, 2010, and while we continue to evaluate the potential payment of dividends, we do not currently anticipatepaying cash dividends on the SBH Common Stock in the foreseeable future, but currently intend to retain any futureearnings for reinvestment in our business or use such future earnings to pay down our outstanding indebtedness. Inaddition, the terms of our Senior Secured Facilities and the 2019 Indenture restrict our ability to pay dividends toour stockholders. Any future determination to pay cash dividends will be at the discretion of our board of directorsand will be dependent upon our financial condition, results of operations, capital requirements, contractualrestrictions and such other factors as the board of directors deems relevant.
Information regarding our equity compensation plans is set forth in Item 12. Security Ownership of CertainBeneficial Owners and Management and Related Stockholder Matters-Equity Compensation Plan Information.
Purchases of Equity Securities by the Issuer and Affiliated Purchasers
We did not repurchase any of our own securities during the last quarter of the fiscal year endedSeptember 30, 2010, and we do not have any publicly announced repurchase plan. The following table reflectsopen market purchases of our common stock made by the Harbinger Parties, who may be considered “affiliatedpurchasers” (as defined in Rule 10b-18(a)(3) of the Securities Exchange Act of 1934, as amended).
Period
TotalNumber ofShares
Purchased
AveragePrice PaidPer Share
Total Number ofShares Purchased as
Part of PubliclyAnnounced Plans
or Programs
Maximum Numberof Shares that mayYet Be PurchasedUnder the Plansor Programs
Quarter Ended September 30, 2010July 5, 2010 – August 1, 2010 . . . . . 600,000 $27.01 600,000 —August 2, 2010 – August 29,2010 . . . . . . . . . . . . . . . . . . . . . . . 300,200 $28.80 300,200 —
August 30, 2010 – September 30,2010 . . . . . . . . . . . . . . . . . . . . . . . 87,620 $25.09 87,620 —
Total . . . . . . . . . . . . . . . . . . . . . 987,820 $27.38 987,820 —
38

ITEM 6. SELECTED FINANCIAL DATA
The following selected historical financial data is derived from our audited consolidated financialstatements. Only our Consolidated Statements of Financial Position as of September 30, 2010 and 2009 and ourConsolidated Statements of Operations, Consolidated Statements of Shareholders’ Equity (Deficit) andComprehensive Income (Loss) and Consolidated Statements of Cash Flows for the years ended September 30,2010, 2009 and 2008 are included elsewhere in this Annual Report on Form 10-K. The information presentedbelow as of and for the fiscal year ended September 30, 2010 also includes that of Russell Hobbs since theMerger on June 16, 2010.
On November 5, 2008, Spectrum Brands’ board of directors committed to the shutdown of the growingproducts portion of the Home and Garden Business, which includes the manufacturing and marketing offertilizers, enriched soils, mulch and grass seed, following an evaluation of the historical lack of profitability andthe projected input costs and significant working capital demands for the growing product portion of the Homeand Garden Business during Fiscal 2009. During the second quarter of Fiscal 2009, we completed the shutdownof the growing products portion of the Home and Garden Business and, accordingly, began reporting the resultsof operations of the growing products portion of the Home and Garden Business as discontinued operations. Asof October 1, 2005, we began reporting the results of operations of Nu-Gro Pro and Tech as discontinuedoperations. We also began reporting the results of operations of the Canadian division of the Home and GardenBusiness as discontinued operations as of October 1, 2006, which business was sold on November 1, 2007.Therefore, the presentation of all historical continuing operations has been changed to exclude the growingproducts portion of the Home and Garden Business, the Nu-Gro Pro and Tech and the Canadian division of theHome and Garden Business but to include the remaining control products portion of the Home and GardenBusiness. The following selected financial data should be read in conjunction with our consolidated financialstatements and notes thereto and the information contained in Item 7. Management’s Discussion and Analysis ofFinancial Condition and Results of Operations included elsewhere herein.
The financial information indicated may not be indicative of future performance. This financial informationand other data should be read in conjunction with our consolidated financial statements, including the notesthereto, and Item 7. Management’s Discussion and Analysis of Financial Condition and Results of Operations.
39

SuccessorCompany
PredecessorCompany
2010(14)
Period fromAugust 31, 2009
throughSeptember 30,
2009
Period fromOctober 1, 2008
throughAugust 30,
2009 2008 2007 2006
Statement of Operations Data:Net sales . . . . . . . . . . . . . . . . . . . . . . . $2,567.0 $ 219.9 $2,010.6 $ 2,426.6 $2,332.7 $2,228.5Gross profit . . . . . . . . . . . . . . . . . . . . . 921.4 64.4 751.8 920.1 876.7 871.2Operating income (loss)(1) . . . . . . . . . 168.7 0.1 156.8 (684.6) (251.8) (289.1)(Loss) income from continuingoperations before income taxes . . . . (124.2) (20.0) 1,123.4 (914.8) (507.2) (460.9)
(Loss) income from discontinuedoperations, net of tax(2) . . . . . . . . . (2.7) 0.4 (86.8) (26.2) (33.7) (2.5)
Net (loss) income(3)(4)(5)(6)(7) . . . . . (190.1) (70.8) 1,013.9 (931.5) (596.7) (434.0)Restructuring and related charges—cost of goods sold(8) . . . . . . . . . . . . $ 7.1 $ 0.2 $ 13.2 $ 16.5 $ 31.3 $ 21.1
Restructuring and related charges—operating expenses(8) . . . . . . . . . . . 17.0 1.6 30.9 22.8 66.7 33.6
Other expense (income), net(9) . . . . . . 12.3 (0.8) 3.3 1.2 (0.3) (4.1)Interest expense (13) . . . . . . . . . . . . . . $ 277.0 $ 17.0 $ 172.9 $ 229.0 $ 255.8 $ 175.9Per Share Data:Net (loss) income per common share:
Basic . . . . . . . . . . . . . . . . . . . . . . $ (5.28) $ (2.36) $ 19.76 $ (18.29) $ (11.72) $ (8.77)Diluted . . . . . . . . . . . . . . . . . . . . . (5.28) $ (2.36) 19.76 (18.29) (11.72) (8.77)
Average shares outstanding:Basic . . . . . . . . . . . . . . . . . . . . . . 36.0 30.0 51.3 50.9 50.9 49.5Diluted(10) . . . . . . . . . . . . . . . . . 36.0 30.0 51.3 50.9 50.9 49.5
Cash Flow and Related Data:Net cash provided (used) by operatingactivities . . . . . . . . . . . . . . . . . . . . . . $ 57.3 $ 75.0 $ 1.6 $ (10.2) $ (32.6) $ 44.5
Capital expenditures(11) . . . . . . . . . . . 40.3 2.7 8.1 18.9 23.2 55.6Depreciation and amortization(excluding amortization of debtissuance costs)(11) . . . . . . . . . . . . . 117.4 8.6 58.5 85.0 77.4 82.6
Statement of Financial PositionData (at period end):
Cash and cash equivalents . . . . . . . . . . $ 170.6 $ 97.8 $ 104.8 $ 69.9 $ 28.4Working capital(12) . . . . . . . . . . . . . . 536.9 323.7 371.5 370.2 397.2Total assets . . . . . . . . . . . . . . . . . . . . . 3,873.6 3,020.7 2,247.5 3,211.4 3,549.3Total long-term debt, net of currentmaturities . . . . . . . . . . . . . . . . . . . . . 1,723.1 1,530.0 2,474.8 2,416.9 2,234.5
Total debt . . . . . . . . . . . . . . . . . . . . . . . 1,743.8 1,583.5 2,523.4 2,460.4 2,277.2Total shareholders’ equity (deficit) . . . 1,046.4 660.9 (1,027.2) (103.8) 452.2
(1) During Fiscal 2010, 2009, 2008, 2007 and 2006, pursuant to the Financial Accounting Standards BoardCodification Topic 350: “Intangibles-Goodwill and Other,” we conducted our annual impairment testing ofgoodwill and indefinite-lived intangible assets. As a result of these analyses we recorded non-cash pretaximpairment charges of approximately $34 million, $861 million, $362 million and $433 million in theperiod from October 1, 2008 through August 30, 2009, Fiscal 2008, Fiscal 2007 and our fiscal year endedSeptember 30, 2006 (“Fiscal 2006”), respectively. See the “Critical Accounting Policies—Valuation ofAssets and Asset Impairment” section of Item 7. Management’s Discussion and Analysis of FinancialCondition and Results of Operations as well as Note 3(i), Significant Accounting Policies—IntangibleAssets, of Notes to Consolidated Financial Statements included in this Annual Report on Form 10-K forfurther details on these impairment charges.
40

(2) Fiscal 2007 loss from discontinued operations, net of tax, includes a non-cash pretax impairment charge ofapproximately $45 million to reduce the carrying value of certain assets, principally consisting of goodwill andintangible assets, relating to our Canadian Division of the Home and Garden Business in order to reflect theestimated fair value of this business. Fiscal 2008 loss from discontinued operations, net of tax, includes anon-cash pretax impairment charge of approximately $8 million to reduce the carrying value of intangibleassets relating to our growing products portion of the Home and Garden Business in order to reflect theestimated fair value of this business. See Note 9, Discontinued Operations, of Notes to Consolidated FinancialStatements included in this Annual Report on Form 10-K for information relating to these impairment charges.
(3) Fiscal 2010 income tax expense of $63 million includes a non-cash charge of approximately $91.9 millionwhich increased the valuation allowance against certain net deferred tax assets.
(4) Included in the period from August 31, 2009 through September 30, 2009 for the Successor Company is anon-cash tax charge of $58 million related to the residual U.S. and foreign taxes on approximately $166million of actual and deemed distributions of foreign earnings. The period from October 1, 2008 throughAugust 30, 2009 income tax expense includes a non-cash adjustment of approximately $52 million whichreduced the valuation allowance against certain deferred tax assets.Included in the period from October 1, 2008 through August 30, 2009 for the Predecessor Company is anon-cash charge of $104 million related to the tax effects of the fresh start adjustments. In addition,Predecessor Company includes the tax effect on the gain on the cancellation of debt from theextinguishment of the senior subordinated notes as well as the modification of the senior term credit facilityresulting in approximately $124 million reduction in the U.S. net deferred tax asset exclusive of indefinitelived intangibles. Due to the Company’s full valuation allowance position as of August 30, 2009 on the U.S.net deferred tax asset exclusive of indefinite lived intangibles, the tax effect of the gain on the cancellationof debt and the modification of the senior secured credit facility is offset by a corresponding adjustment tothe valuation allowance of $124 million. The tax effect of the fresh start adjustments, the gain on thecancellation of debt and the modification of the senior secured credit facility, net of correspondingadjustments to the valuation allowance, are netted against reorganization items.
(5) Fiscal 2008 income tax benefit of $10 million includes a non-cash charge of approximately $222 millionwhich increased the valuation allowance against certain net deferred tax assets.
(6) Fiscal 2007 income tax expense of $56 million includes a non-cash charge of approximately $180 millionwhich increased the valuation allowance against certain net deferred tax assets.
(7) Fiscal 2006 income tax benefit of $29 million includes a non-cash charge of approximately $29 millionwhich increased the valuation allowance against certain net deferred tax assets.
(8) See Note 14, Restructuring and Related Charges, of Notes to Consolidated Financial Statements included inthis Annual Report on Form 10-K for further discussion.
(9) Fiscal 2006 includes a $8 million net gain on the sale of our Bridgeport, CT manufacturing facility, acquiredas part of the Remington Products Company, L.L.C. acquisition and subsequently closed in Fiscal 2004, andour Madison, WI packaging facility, which was closed in our fiscal year ended September 30, 2003.
(10) Each of Fiscal 2010, the period from August 31, 2009 through September 30, 2009, the period fromOctober 1, 2008 through August 30, 2009, Fiscal 2008, 2007 and 2006 does not assume the exercise ofcommon stock equivalents as the impact would be antidilutive.
(11) Amounts reflect the results of continuing operations only.(12) Working capital is defined as current assets less current liabilities.(13) Fiscal 2010 includes a non-cash charge of $83 million related to the write off of unamortized debt issuance
costs and the write off of unamortized discounts and premiums related to the extinguishment of debt thatwas refinanced in conjunction with the Merger.
(14) Fiscal 2010, includes the results of Russell Hobbs’ operations since June 16, 2010. Russell Hobbscontributed $238 million in Net Sales and recorded operating income of $1 million for the period fromJune 16, 2010 through September 30, 2010, which includes $13 million of acquisition and integrationrelated charges. In addition, Fiscal 2010 includes $26 million of Acquisition and integration related chargesassociated with the Merger.
41

ITEM 7. MANAGEMENT’S DISCUSSION AND ANALYSIS OF FINANCIAL CONDITION ANDRESULTS OF OPERATIONS
Introduction
The following is management’s discussion of the financial results, liquidity and other key items related toour performance and should be read in conjunction with Item 6. Selected Financial Data and our ConsolidatedFinancial Statements and related notes included in this Annual Report on Form 10-K. Certain prior year amountshave been reclassified to conform to the current year presentation. All references to Fiscal 2010, 2009 and 2008refer to fiscal year periods ended September 30, 2010, 2009 and 2008, respectively.
Spectrum Brands Holdings, Inc., a Delaware corporation (“SB Holdings”), is a global branded consumerproducts company and was created in connection with the combination of Spectrum Brands, Inc. (“SpectrumBrands”), a global branded consumer products company and Russell Hobbs, Inc. (“Russell Hobbs”), a globalbranded small appliance company, to form a new combined company (the “Merger”). The Merger wasconsummated on June 16, 2010. As a result of the Merger, both Spectrum Brands and Russell Hobbs are wholly-owned subsidiaries of SB Holdings and Russell Hobbs is a wholly-owned subsidiary of Spectrum Brands. SBHoldings’ common stock trades on the New York Stock Exchange (the “NYSE”) under the symbol “SPB.”
In connection with the Merger, we refinanced Spectrum Brands’ existing senior debt (except for the 12%Notes, which remain outstanding) and a portion of Russell Hobbs’ existing senior debt through a combination ofa new $750 million U.S. Dollar Term Loan due June 16, 2016, new $750 million 9.5% Senior Secured Notesmaturing June 15, 2018 and a new $300 million ABL revolving facility due June 16, 2014.
As further described below, on February 3, 2009, we and our wholly owned United States (“U.S.”)subsidiaries (collectively, the “Debtors”) filed voluntary petitions under Chapter 11 of the U.S. Bankruptcy Code(the “Bankruptcy Code”), in the U.S. Bankruptcy Court for the Western District of Texas (the “BankruptcyCourt”). On August 28, 2009 (the “Effective Date”), the Debtors emerged from Chapter 11 of the BankruptcyCode. Effective as of the Effective Date and pursuant to the Debtors’ confirmed plan of reorganization, weconverted from a Wisconsin corporation to a Delaware corporation.
Unless the context indicates otherwise, the terms the “Company,” “Spectrum,” “we,” “our” or “us” are usedto refer to SB Holdings and its subsidiaries subsequent to the Merger and Spectrum Brands prior to the Merger,as well as both before and on and after the Effective Date. The term “New Spectrum,” however, refers only toSpectrum Brands, Inc., our Delaware successor, and its subsidiaries after the Effective Date, and the term “OldSpectrum,” refers only to Spectrum Brands, our Wisconsin predecessor, and its subsidiaries prior to the EffectiveDate.
Business Overview
We are a global branded consumer products company with positions in seven major product categories:consumer batteries; pet supplies; home and garden control products; electric shaving and grooming; smallappliances; electric personal care; and portable lighting.
We manage our business in four reportable segments: (i) Global Batteries & Personal Care, which consistsof the Company’s worldwide battery, shaving and grooming, personal care and portable lighting business(“Global Batteries & Personal Care”); (ii) Global Pet Supplies, which consists of our worldwide pet suppliesbusiness (“Global Pet Supplies”); (iii) the Home and Garden Business, which consists of our home and gardencontrol product offerings, including household insecticides, repellants and herbicides (the “Home and GardenBusiness”); and (iv) Small Appliances, which consists of small electrical appliances primarily in the kitchen andhome product categories (“Small Appliances”).
We manufacture and market alkaline, zinc carbon and hearing aid batteries, herbicides, insecticides andrepellants and specialty pet supplies. We design and market rechargeable batteries, battery-powered lighting
42

products, electric shavers and accessories, grooming products and hair care appliances. With the addition ofRussell Hobbs we design, market and distribute a broad range of branded small household appliances andpersonal care products. Our manufacturing and product development facilities are located in the United States,Europe, Latin America and Asia. Substantially all of our rechargeable batteries and chargers, shaving andgrooming products, small household appliances, personal care products and portable lighting products aremanufactured by third-party suppliers, primarily located in Asia.
We sell our products in approximately 120 countries through a variety of trade channels, including retailers,wholesalers and distributors, hearing aid professionals, industrial distributors and original equipmentmanufacturers (“OEMs”) and enjoy strong name recognition in our markets under the Rayovac, VARTA andRemington brands, each of which has been in existence for more than 80 years, and under the Tetra, 8-in-1,Spectracide, Cutter, Black & Decker, George Foreman, Russell Hobbs, Farberware and various other brands.
Global and geographic strategic initiatives and financial objectives are determined at the corporate level.Each business segment is responsible for implementing defined strategic initiatives and achieving certainfinancial objectives and has a general manager responsible for sales and marketing initiatives and the financialresults for all product lines within that business segment.
Our operating performance is influenced by a number of factors including: general economic conditions;foreign exchange fluctuations; trends in consumer markets; consumer confidence and preferences; our overallproduct line mix, including pricing and gross margin, which vary by product line and geographic market; pricingof certain raw materials and commodities; energy and fuel prices; and our general competitive position,especially as impacted by our competitors’ advertising and promotional activities and pricing strategies.
During the second quarter of Fiscal 2008, we determined that in view of the difficulty in predicting thetiming or probability of a sale of the remaining U.S. portion of the Home and Garden Business, the requirementsof Generally Accepted Accounting Principles (“GAAP”) necessary to classify the remaining U.S. portion of theHome and Garden Business as discontinued operations were no longer met and that it was appropriate to presentthe remaining U.S. portion of the Home and Garden Business as held and used in the Company’s continuingoperations as of our second quarter of Fiscal 2008 and going forward. The presentation herein of the results ofcontinuing operations includes the Home and Garden Business excluding the Canadian division, which was soldon November 1, 2007, for all periods presented.
In the third quarter of Fiscal 2008, we entered into a definitive agreement, subject to the consent of ourlenders under our senior credit facilities, to sell the assets related to Global Pet Supplies. We were unable toobtain the consent of the lenders, and on July 13, 2008, we entered into a termination agreement regarding theagreement to sell the assets related to Global Pet Supplies. Pursuant to the termination agreement, as a conditionto the termination, we paid the proposed buyer $3 million as a reimbursement of expenses.
In November 2008, our board of directors committed to the shutdown of the growing products portion of theHome and Garden Business, which includes the manufacturing and marketing of fertilizers, enriched soils, mulchand grass seed, following an evaluation of the historical lack of profitability and the projected input costs andsignificant working capital demands for the growing products portion of the Home and Garden Business forFiscal 2009. We believe the shutdown was consistent with what we have done in other areas of our business toeliminate unprofitable products from our portfolio. As of March 29, 2009, we completed the shutdown of thegrowing products portion of the Home and Garden Business. Accordingly, the presentation herein of the resultsof continuing operations excludes the growing products portion of the Home and Garden Business for all periodspresented. See Note 9, Discontinued Operations, to our Consolidated Financial Statements included in thisAnnual Report on Form 10-K for further details on the disposal of the growing products portion of the Home andGarden Business.
On December 15, 2008, we were advised that our common stock would be suspended from trading on theNYSE prior to the opening of the market on December 22, 2008. We were advised that the decision to suspend
43
our common stock was reached in view of the fact that we had recently fallen below the NYSE’s continuedlisting standard regarding average global market capitalization over a consecutive 30 trading day period of notless than $25 million, the minimum threshold for listing on the NYSE. Our common stock was delisted from theNYSE effective January 23, 2009.
As a result of our Bankruptcy Filing, we were able to significantly reduce our indebtedness. As a result ofthe Merger, we were able to further reduce our outstanding debt leverage ratio. However, we continue to have asignificant amount of indebtedness relative to our competitors and paying down outstanding indebtednesscontinues to be a priority for us. The Bankruptcy Filing is discussed in more detail under “Chapter 11Proceedings.”
Chapter 11 Proceedings
As a result of its substantial leverage, the Company determined that, absent a financial restructuring, itwould be unable to achieve future profitability or positive cash flows on a consolidated basis solely from cashgenerated from operating activities or to satisfy certain of its payment obligations as the same may become dueand be at risk of not satisfying the leverage ratios to which it was subject under its then existing senior securedterm loan facility, which ratios became more restrictive in future periods. Accordingly, on February 3, 2009, weannounced that we had reached agreements with certain noteholders, representing, in the aggregate,approximately 70% of the face value of our then outstanding senior subordinated notes, to pursue a refinancingthat, if implemented as proposed, would significantly reduce our outstanding debt. On the same day, the Debtorsfiled voluntary petitions under Chapter 11 of the Bankruptcy Code, in the Bankruptcy Court (the “BankruptcyFiling”) and filed with the Bankruptcy Court a proposed plan of reorganization (the “Proposed Plan”) thatdetailed the Debtors’ proposed terms for the refinancing. The Chapter 11 cases were jointly administered by theBankruptcy Court as Case No. 09-50455 (the “Bankruptcy Cases”). The Bankruptcy Court entered a writtenorder (the “Confirmation Order”) on July 15, 2009 confirming the Proposed Plan (as so confirmed, the “Plan”).
On the Effective Date the Plan became effective, and the Debtors emerged from Chapter 11 of theBankruptcy Code. Pursuant to and by operation of the Plan, on the Effective Date, all of Old Spectrum’s existingequity securities, including the existing common stock and stock options, were extinguished and deemedcancelled. Reorganized Spectrum Brands, Inc. filed a certificate of incorporation authorizing new shares ofcommon stock. Pursuant to and in accordance with the Plan, on the Effective Date, reorganized SpectrumBrands, Inc. issued a total of 27,030,000 shares of common stock and approximately $218 million in aggregateprincipal amount of 12% Senior Subordinated Toggle Notes due 2019 (the “12% Notes”) to holders of allowedclaims with respect to Old Spectrum’s 81⁄2 % Senior Subordinated Notes due 2013 (the “81⁄2 Notes”), 73⁄8 %Senior Subordinated Notes due 2015 (the “73⁄8 Notes”) and Variable Rate Toggle Senior Subordinated Notes due2013 (the “Variable Rate Notes”) (collectively, the “Senior Subordinated Notes”). For a further discussion of the12% Notes see “Debt Financing Activities—12% Notes.” Also on the Effective Date, reorganized SpectrumBrands, Inc. issued a total of 2,970,000 shares of common stock to supplemental and sub-supplementaldebtor-in-possession credit facility participants in respect of the equity fee earned under the Debtors’debtor-in-possession credit facility.
Accounting for Reorganization
Subsequent to the Petition Date, our financial statements are prepared in accordance with ASC Topic 852:“Reorganizations,” (“ASC 852”). ASC 852 does not change the application of GAAP in the preparation of ourfinancial statements. However, ASC 852 does require that financial statements, for periods including andsubsequent to the filing of a Chapter 11 petition, distinguish transactions and events that are directly associatedwith the reorganization from the ongoing operations of the business. In accordance with ASC 852 we have donethe following:
• On our Consolidated Statements of Financial Position included in this Annual Report on Form 10-K,we have separated liabilities that are subject to compromise from liabilities that are not subject tocompromise;
44
• On our Consolidated Statements of Operations included in this Annual Report on Form 10-K, we havedistinguished transactions and events that are directly associated with the reorganization from theongoing operations of the business;
• On our Consolidated Statements of Cash Flows included in this Annual Report on Form 10-K, we haveseparately disclosed Reorganization items expense (income), net;
• Ceased accruing interest on the Senior Subordinated Notes; and
Fresh-Start Reporting
As required by ASC 852 we adopted fresh-start reporting upon emergence from Chapter 11 of theBankruptcy Code as of our monthly period ended August 30, 2009 as is reflected in this Annual Report onForm 10-K.
Since the reorganization value of the assets of Old Spectrum immediately before the date of confirmation ofthe Plan was less than the total of all post-petition liabilities and allowed claims and the holders of OldSpectrum’s voting shares immediately before confirmation of the Plan received less than 50 percent of the votingshares of the emerging entity the Company adopted fresh-start reporting as of the close of business on August 30,2009 in accordance with ASC 852. The Consolidated Statement of Financial Position as of August 30, 2009gives effect to allocations to the carrying value of assets or amounts and classifications of liabilities that werenecessary when adopting fresh-start reporting.
We analyzed the transactions that occurred during the two-day period from August 29, 2009, the day afterthe Effective Date, through August 30, 2009, the fresh-start reporting date, and concluded that such transactionswere not material individually or in the aggregate as they represented less than one-percent of the total Net salesfor the entire fiscal year ended September 30, 2009. As such, we determined that August 30, 2009, would be anappropriate fresh-start reporting date to coincide with our normal financial period close for the month of August2009. Upon adoption of fresh-start reporting, the recorded amounts of assets and liabilities were adjusted toreflect their estimated fair values. Accordingly, the reported historical financial statements of Old Spectrum priorto the adoption of fresh-start reporting for periods ended prior to August 30, 2009 are not comparable to those ofNew Spectrum.
Cost Reduction Initiatives
We continually seek to improve our operational efficiency, match our manufacturing capacity and productcosts to market demand and better utilize our manufacturing resources. We have undertaken various initiatives toreduce manufacturing and operating costs.
Fiscal 2009. In connection with our announcement to reduce our headcount within each of our segments andthe exit of certain facilities in the U.S. related to the Global Pet Supplies segment, we implemented a number ofcost reduction initiatives (the “Global Cost Reduction Initiatives”). These initiatives also included consultation,legal and accounting fees related to the evaluation of our capital structure.
Fiscal 2008. In connection with our decision to exit our zinc carbon and alkaline battery manufacturing anddistribution facility in Ninghai, China, we undertook cost reduction initiatives (the “Ningbo Exit Plan”). Theseinitiatives include fixed cost savings by integrating production equipment into our remaining production facilitiesand headcount reductions.
Fiscal 2007. In connection with our announcement that we would manage our business in three verticallyintegrated, product-focused reporting segments our costs related to research and development, manufacturingmanagement, global purchasing, quality operations and inbound supply chain, which had previously beenincluded in our corporate reporting segment are now included in each of the operating segments on a direct as
45

incurred basis. In connection with these changes we undertook a number of cost reduction initiatives, primarilyheadcount reductions, at the corporate and operating segment levels (the “Global Realignment Initiatives”),including a headcount reduction of approximately 200 employees.
We also implemented a series of initiatives within our Global Batteries & Personal Care business segment inLatin America to reduce operating costs (the “Latin America Initiatives”). These initiatives include the reductionof certain manufacturing operations in Brazil and the restructuring of management, sales, marketing and supportfunctions. As a result, we reduced headcount in Latin America by approximately 100 employees.
Fiscal 2006. As a result of our continued concern regarding the European economy and the continued shiftby consumers from branded to private label alkaline batteries, we announced a series of initiatives in the GlobalBatteries & Personal Care segment in Europe to reduce operating costs and rationalize our manufacturingstructure (the “European Initiatives”). These initiatives include the reduction of certain operations at ourEllwangen, Germany packaging center and relocating those operations to our Dischingen, Germany battery plant,transferring private label battery production at our Dischingen, Germany battery plant to our manufacturingfacility in China and restructuring the sales, marketing and support functions. As a result, we have reducedheadcount in Europe by approximately 350 employees or 24%.
Meeting Consumer Needs through Technology and Development
We continue to focus our efforts on meeting consumer needs for our products through new productdevelopment and technology innovations. Research and development efforts associated with our electric shavingand grooming products allow us to deliver to the market unique cutting systems. Research and developmentefforts associated with our electric personal care products allow us to deliver to our customers products that savethem time, provide salon alternatives and enhance their in-home personal care options. We are continuouslypursuing new innovations for our shaving, grooming and hair care products including foil and rotary shaverimprovements, trimmer enhancements and technologies that deliver skin and hair care benefits.
During Fiscal 2010, we launched our Rayovac Platinum Nickel Metal Hydride rechargeable batteries. Thesebatteries are ready to use directly out of the package, and stay charged up to 3 times longer than otherrechargeable batteries. We also introduced Instant Ocean aquatic food and chemical products and additionalproducts under the Dingo and Nature’s Miracle brands.
During Fiscal 2009, we introduced the Roughneck Flex 360 flashlight. We also launched a long lastingzero-mercury hearing aid battery. This product provides the same long lasting performance as conventionalhearing aid batteries, but with an environmentally friendly formula. During Fiscal 2009, we also introduced a lineof Tetra marine aquatic products, new dog treat items and enhanced Nature’s Miracle Stain & Odor products.
During Fiscal 2008, we introduced longer lasting alkaline batteries in cell sizes AA and AAA. We alsolaunched several new products targeted at specific niche markets such as Hot Shot Spider Trap, Cutter MosquitoStakes, Spectracide Destroyer Wasp & Hornet and Spectracide Weed Stop. We also introduced a new line ofmen’s rotary shavers with “360° Flex & Pivot Technology.” The flex and pivot technology allows the cuttingblades to follow the contour of a person’s face and neck. In addition, we added Teflon® coated heads to ourblades to reduce redness and irritation from shaving. We also introduced “The Short Cut Clipper.” The product ispositioned as the world’s first clipper with exclusive curved cutting technology. We also launched “ShineTherapy,” a hair straightener with vitamin conditioning technology: Vitamin E, Avocado Oil and conditionersinfused into the ceramic plates.
During Fiscal 2007, advancements in shaver blade coatings continued to be significant with furtherintroductions of Titanium, Nano-Diamond, Nano-Silver and Tourmaline on a variety of products, which allowedus to continue to launch new products or product enhancements into the market place.
46

During Fiscal 2006, in the lawn and garden category, we introduced the only termite killing stakes productfor the do-it-yourself market.
Competitive Landscape
We compete in seven major product categories: consumer batteries; pet supplies; home and garden controlproducts; electric shaving and grooming; small appliances; electric personal care; and portable lighting.
The consumer battery product category consists of non-rechargeable alkaline or zinc carbon batteries in cellsizes of AA, AAA, C, D and 9-volt, and specialty batteries, which include rechargeable batteries, hearing aidbatteries, photo batteries and watch/calculator batteries. Most consumer batteries are marketed under one of thefollowing brands: Rayovac/VARTA, Duracell, Energizer or Panasonic. In addition, some retailers market privatelabel batteries, particularly in Europe. The majority of consumers in North America and Europe purchasealkaline batteries. The Latin America market consists primarily of zinc carbon batteries but is graduallyconverting to higher-priced alkaline batteries as household disposable income grows.
We believe that we are the largest worldwide marketer of hearing aid batteries and that we continue tomaintain a leading global market position. We believe that our close relationship with hearing aid manufacturersand other customers, as well as our product performance improvements and packaging innovations, position usfor continued success in this category.
Our global pet supplies business comprises aquatics equipment (aquariums, filters, pumps, etc.), aquaticsconsumables (fish food, water treatments and conditioners, etc.) and specialty pet products for dogs, cats, birdsand other small domestic animals. The pet supply market is extremely fragmented, with no competitor holding amarket share greater than twenty percent. We believe that our brand positioning, including the leading globalaquatics brand in Tetra, our diverse array of innovative and attractive products and our strong retail relationshipsand global infrastructure will allow us to remain competitive in this fast growing industry.
Products in our home and garden category are sold through the Home and Garden Business. The Home andGarden Business manufactures and markets outdoor and indoor insect control products, rodenticides, herbicidesand plant foods. The Home and Garden Business operates in the U.S. market under the brand names Spectracide,Cutter and Garden Safe. The Home and Garden Business’ marketing position is primarily that of a value brand,enhanced and supported by innovative products and packaging to drive sales at the point of purchase. The Homeand Garden Business’ primary competitors include The Scotts Miracle-Gro Company, Central Garden & PetCompany and S.C. Johnson & Son, Inc.
We also operate in the shaving and grooming and personal care product category, consisting of electricshavers and accessories, electric grooming products and hair care appliances. Electric shavers include men’s andwomen’s shavers (both rotary and foil design) and electric shaver accessories consisting of shaver replacementparts (primarily foils and cutters), pre-shave products and cleaning agents. Electric shavers are marketedprimarily under one of the following global brands: Remington, Braun and Norelco. Electric grooming productsinclude beard and mustache trimmers, nose and ear trimmers, body groomers and haircut kits and relatedaccessories. Hair care appliances include hair dryers, straightening irons, styling irons and hair-setters. Europeand North America account for the majority of our worldwide product category sales. Our major competitors inthe electric personal care product category are Conair Corporation, Wahl Clipper Corporation and Helen of TroyLimited.
Products in our small appliances category consist of small electrical appliances primarily in the kitchen andhome product categories. Primary competitive brands in the small appliance category include Hamilton Beach,Procter Silex, Sunbeam, Mr. Coffee, Oster, General Electric, Rowenta, DeLonghi, Kitchen Aid, Cuisinart, Krups,Braun, Rival, Europro, Kenwood, Philips, Morphy Richards, Breville and Tefal.
47

The following factors contribute to our ability to succeed in these highly competitive product categories:
• Strong Diversified Global Brand Portfolio. We have a global portfolio of well-recognized consumerproduct brands. We believe that the strength of our brands positions us to extend our product lines andprovide our retail customers with strong sell-through to consumers.
• Strong Global Retail Relationships. We have well-established business relationships with many of thetop global retailers, distributors and wholesalers, which have assisted us in our efforts to expand ouroverall market penetration and promote sales.
• Expansive Distribution Network. We distribute our products in approximately 120 countries through avariety of trade channels, including retailers, wholesalers and distributors, hearing aid professionals,industrial distributors and OEMs.
• Innovative New Products, Packaging and Technologies. We have a long history of product andpackaging innovations in each of our seven product categories and continually seek to introduce newproducts both as extensions of existing product lines and as new product categories.
• Experienced Management Team. Our management team has substantial consumer products experience.On average, each senior manager has more than 20 years of experience at Spectrum, VARTA,Remington, Russell Hobbs or other branded consumer product companies such as Newell Rubbermaid,H.J. Heinz and Schering-Plough.
Seasonal Product Sales
On a consolidated basis our financial results are approximately equally weighted between quarters, however,sales of certain product categories tend to be seasonal. Sales in the consumer battery, electric shaving andgrooming and electric personal care product categories, particularly in North America, tend to be concentrated inthe December holiday season (Spectrum’s first fiscal quarter). Demand for pet supplies products remains fairlyconstant throughout the year. Demand for home and garden control products sold though the Home and GardenBusiness typically peaks during the first six months of the calendar year (Spectrum’s second and third fiscalquarters). Small Appliances peaks from July through December primarily due to the increased demand bycustomers in the late summer for “back-to-school” sales and in the fall for the holiday season.
The seasonality of our sales during the last three fiscal years is as follows:
Percentage of Annual Sales
Fiscal Year EndedSeptember 30,
Fiscal Quarter Ended 2010 2009 2008
December . . . . . . . . . . . . . . . . . . . . . . . . . . . . . . . . . . . . . . . . . . . . . . . . . . . . . . . . 23% 25% 24%March . . . . . . . . . . . . . . . . . . . . . . . . . . . . . . . . . . . . . . . . . . . . . . . . . . . . . . . . . . . 21% 23% 22%June . . . . . . . . . . . . . . . . . . . . . . . . . . . . . . . . . . . . . . . . . . . . . . . . . . . . . . . . . . . . 25% 26% 26%September . . . . . . . . . . . . . . . . . . . . . . . . . . . . . . . . . . . . . . . . . . . . . . . . . . . . . . . . 31% 26% 28%
Fiscal Year Ended September 30, 2010 Compared to Fiscal Year Ended September 30, 2009
Fiscal 2009, when referenced within this Management’s Discussion and Analysis of Financial Conditionand Results of Operations included in this Annual Report on Form 10-K, includes the combined results of OldSpectrum for the period from October 1, 2008 through August 30, 2009 and New Spectrum for the period fromAugust 31, 2009 through September 30, 2009.
48

Highlights of Consolidated Operating Results
We have presented the growing products portion of the Home and Garden Business as discontinuedoperations. The board of directors of Old Spectrum committed to the shutdown of the growing products portionof the Home and Garden Business in November 2008 and the shutdown was completed during the second quarterof our Fiscal 2009. See Note 9, Discontinued Operations of Notes to Consolidated Financial Statements, includedin this Annual Report on Form 10-K for additional information regarding the shutdown of the growing productsportion of the Home and Garden Business. As a result, and unless specifically stated, all discussions regardingFiscal 2010 and Fiscal 2009 only reflect results from our continuing operations.
Year over year historical comparisons are influenced by the acquisition of Russell Hobbs, which is includedin our Fiscal 2010 Consolidated Financial Statements of Operations from June 16, 2010, the date of the Merger,through the end of the period. The results of Russell Hobbs are not included in our Fiscal 2009 ConsolidatedFinancial Statements of Operations. See Note 16, Acquisition of Notes to Consolidated Financial Statements,included in this Annual Report on Form 10-K for supplemental pro forma information providing additional yearover year comparisons of the impact of the acquisition.
Net Sales. Net sales for Fiscal 2010 increased to $2,567 million from $2,231 million in Fiscal 2009, a 15.1%increase. The following table details the principal components of the change in net sales from Fiscal 2009 toFiscal 2010 (in millions):
Net Sales
Fiscal 2009 Net Sales . . . . . . . . . . . . . . . . . . . . . . . . . . . . . . . . . . . . . . . . . . . . . . . . $2,231Addition of small appliances . . . . . . . . . . . . . . . . . . . . . . . . . . . . . . . . . . . . . . 238Increase in consumer battery sales . . . . . . . . . . . . . . . . . . . . . . . . . . . . . . . . . . 33Increase in electric shaving and grooming product sales . . . . . . . . . . . . . . . . . 27Increase in home and garden control product sales . . . . . . . . . . . . . . . . . . . . . 19Increase in lighting product sales . . . . . . . . . . . . . . . . . . . . . . . . . . . . . . . . . . . 6Increase in electric personal care product sales . . . . . . . . . . . . . . . . . . . . . . . . 2Decrease in pet supplies sales . . . . . . . . . . . . . . . . . . . . . . . . . . . . . . . . . . . . . . (16)Foreign currency impact, net . . . . . . . . . . . . . . . . . . . . . . . . . . . . . . . . . . . . . . 27
Fiscal 2010 Net Sales . . . . . . . . . . . . . . . . . . . . . . . . . . . . . . . . . . . . . . . . . . . . . . . . $2,567
Consolidated net sales by product line for Fiscal 2010 and 2009 are as follows (in millions):
Fiscal Year
2010 2009
Product line net salesConsumer batteries . . . . . . . . . . . . . . . . . . . . . . . . . . . . . . . . . . . . . . . . . . . . . . . . . . $ 866 $ 819Pet supplies . . . . . . . . . . . . . . . . . . . . . . . . . . . . . . . . . . . . . . . . . . . . . . . . . . . . . . . . 561 574Home and garden control products . . . . . . . . . . . . . . . . . . . . . . . . . . . . . . . . . . . . . . 341 322Electric shaving and grooming products . . . . . . . . . . . . . . . . . . . . . . . . . . . . . . . . . . 257 225Small appliances . . . . . . . . . . . . . . . . . . . . . . . . . . . . . . . . . . . . . . . . . . . . . . . . . . . . 238 —Electric personal care products . . . . . . . . . . . . . . . . . . . . . . . . . . . . . . . . . . . . . . . . . 216 211Portable lighting products . . . . . . . . . . . . . . . . . . . . . . . . . . . . . . . . . . . . . . . . . . . . . 88 80
Total net sales to external customers . . . . . . . . . . . . . . . . . . . . . . . . . . . . . . . . . . . . $2,567 $2,231
Global consumer battery sales during Fiscal 2010 increased $47 million, or 6%, compared to Fiscal 2009,primarily driven by favorable foreign exchange impacts of $15 million coupled with increased sales in NorthAmerica and Latin America. The sales increase in North America was driven by increased volume with a majorcustomer and the increased sales in Latin America were a result of increased specialty battery sales, driven by the
49
successfully leveraging our value proposition, that is, products that work as well as or better than ourcompetitors, at a lower price. These gains were partially offset by decreased consumer battery sales of $22million in Europe, primarily due to our continued exit of low margin private label battery sales.
Pet product sales during Fiscal 2010 decreased $13 million, or 2%, compared to Fiscal 2009. The decreaseof $13 million is attributable to decreased aquatics sales of $11 million and decreased specialty pet products of$6 million. These decreases were partially offset by favorable foreign exchange impacts of $3 million. The $11million decrease in aquatic sales is due to decreases within the United States and Pacific Rim of $6 million and$5 million, respectively, as a result of reduction in demand in this product category due to the macroeconomicslowdown as we maintained our market share in the category. The $6 million decrease in companion animal salesis due to $9 million decline in the United States, primarily driven by a distribution loss of at a major retailer ofcertain dog shampoo products and the impact of a product recall, which was tempered by increases of $3 millionin Europe.
Sales of home and garden control products during Fiscal 2010 versus Fiscal 2009 increased $19 million, or6%. This increase is a result of additional sales to major customers that was driven by incentives to retailers andpromotional campaigns during the year in both lawn and garden control products and household control products.
Electric shaving and grooming product sales during Fiscal 2010 increased $32 million, or 14%, compared toFiscal 2009 primarily due to increased sales within Europe of $25 million coupled with favorable foreignexchange translation of $5 million. The increase in Europe sales is a result of new product launches, pricing andpromotions.
Electric personal care product sales during Fiscal 2010 increased $5 million, or 2%, when compared toFiscal 2009. The increase of $5 million during Fiscal 2010 was attributable to favorable foreign exchangeimpacts of $2 million coupled with modest sales increases within Latin America and North America of $3million and $1 million, respectively. These sales increases were partially offset by modest declines in Europe of$2 million.
Sales of portable lighting products in Fiscal 2010 increased $8 million, or 10%, compared to Fiscal 2009 asa result of increases in North America of $3 million coupled with favorable foreign exchange translation of $2million. Sales of portable lighting products also increased modestly in both Europe and Latin America.
Small appliances contributed $238 million or 9% of total net sales for Fiscal 2010. This represents salesrelated to Russell Hobbs from the date of the consummation of the merger, June 16, 2010 through the close of theFiscal 2010.
Gross Profit. Gross profit for Fiscal 2010 was $921 million versus $816 million for Fiscal 2009. Our grossprofit margin for Fiscal 2010 decreased to 35.9% from 36.6% in Fiscal 2009. The decrease in our gross profitmargin is primarily a result of our adoption of fresh-start reporting upon emergence from Chapter 11 of theBankruptcy Code. Upon the adoption of fresh-start reporting, in accordance with Statement of FinancialAccounting Standards No. 141, “Business Combinations,” (“SFAS 141”), inventory balances were revalued atAugust 30, 2009 resulting in an increase in such inventory balances of $49 million. As a result of the inventoryrevaluation, we recognized $34 million in additional cost of goods sold during Fiscal 2010 compared to $15million of additional cost of goods sold recognized in Fiscal 2009. The impact of the inventory revaluation wasoffset by lower Restructuring and related charges in Cost of goods sold during Fiscal 2010, which included $7million of Restructuring and related charges whereas Fiscal 2009 included $13 million of Restructuring andrelated charges. The Restructuring and related charges incurred in Fiscal 2010 were primarily associated withcost reduction initiatives announced in 2009. The $13 million of Restructuring and related charges incurred inFiscal 2009 primarily related to the shutdown of our Ningbo, China battery manufacturing facility. See“Restructuring and Related Charges” below, as well as Note 14, Restructuring and Related Charges, to ourConsolidated Financial Statements included in this Annual Report on Form 10-K for additional informationregarding our restructuring and related charges.
50

Operating Expense. Operating expenses for Fiscal 2010 totaled $753 million versus $659 million for Fiscal2009. The $94 million increase in operating expenses for Fiscal 2010 versus Fiscal 2009 was partially driven by$38 million of Acquisition and integration related charges as a result of our combination with Russell Hobbspursuant to the Merger. During Fiscal 2010 we also incurred $36 million of selling expense and $16 million ofgeneral and administrative expense incurred by Russell Hobbs, which is included in the Small Appliancessegment, subsequent to the acquisition on June 16, 2010. Also included in Operating expenses for Fiscal 2010was additional depreciation and amortization as a result of the revaluation of our long lived assets in connectionwith our adoption of fresh-start reporting upon emergence from Chapter 11 of the Bankruptcy Code andunfavorable foreign exchange translation of $7 million. This increase was partially offset by the non-recurrenceof the non-cash impairment charge to certain long lived intangible assets of $34 million in Fiscal 2009 and lowerRestructuring and related charges of approximately $15 million as $17 million of such charges were incurred inFiscal 2010 compared to $32 million in Fiscal 2009. See “Restructuring and Related Charges” below, as well asNote 14, Restructuring and Related Charges, to our Consolidated Financial Statements included in this AnnualReport on Form 10-K for additional information regarding our restructuring and related charges.
Adjusted EBITDA.Management believes that certain non-GAAP financial measures may be useful incertain instances to provide additional meaningful comparisons between current results and results in prioroperating periods. Adjusted earnings before interest, taxes, depreciation and amortization (“Adjusted EBITDA”)is a metric used by management and frequently used by the financial community. Adjusted EBITDA providesinsight into an organization’s operating trends and facilitates comparisons between peer companies, sinceinterest, taxes, depreciation and amortization can differ greatly between organizations as a result of differingcapital structures and tax strategies. Adjusted EBITDA can also be a useful measure of a company’s ability toservice debt and is one of the measures used for determining the Company’s debt covenant compliance. AdjustedEBITDA excludes certain items that are unusual in nature or not comparable from period to period. While theCompany’s management believes that non-GAAP measurements are useful supplemental information, suchadjusted results are not intended to replace the Company’s GAAP financial results.
Adjusted EBITDA, which includes the results of Russell Hobbs’ businesses as if it was combined withSpectrum for all periods presented (see reconciliation of GAAP Net Income (Loss) from Continuing Operationsto Adjusted EBITDA by segment below) was $432 million for Fiscal 2010 compared with $391 million forFiscal 2009.
Operating Income. Operating income of approximately $169 million was recognized in Fiscal 2010compared to Fiscal 2009 operating income of $157 million. The increase in operating income is attributable toSmall Appliances income of $13 million, increased sales in our remaining segments and the non-reoccurrence ofthe previously discussed non-cash impairment charge of $34 million in Fiscal 2009. This was partially offset by$39 million Acquisition and integration related charges incurred in Fiscal 2010 related to the Merger.
Segment Results. As discussed above in Item 1, Business, we manage our business in four reportablesegments: (i) Global Batteries & Personal Care, (ii) Global Pet Supplies; (iii) Home and Garden Business; and(iv) Small Appliances.
Operating segment profits do not include restructuring and related charges, acquisition and integrationrelated charges, interest expense, interest income, impairment charges, reorganization items and income taxexpense. Expenses associated with global operations, consisting of research and development, manufacturingmanagement, global purchasing, quality operations and inbound supply chain are included in the determinationof operating segment profits. In addition, certain general and administrative expenses necessary to reflect theoperating segments on a standalone basis have been included in the determination of operating segment profits.Corporate expenses include primarily general and administrative expenses associated with corporate overheadand global long-term incentive compensation plans.
All depreciation and amortization included in income from operations is related to operating segments orcorporate expense. Costs are allocated to operating segments or corporate expense according to the function of
51

each cost center. All capital expenditures are related to operating segments. Variable allocations of assets are notmade for segment reporting.
Global strategic initiatives and financial objectives for each reportable segment are determined at thecorporate level. Each reportable segment is responsible for implementing defined strategic initiatives andachieving certain financial objectives and has a general manager responsible for the sales and marketinginitiatives and financial results for product lines within that segment. Financial information pertaining to ourreportable segments is contained in Note 11, Segment Information, of Notes to Consolidated FinancialStatements included in this Annual Report on Form 10-K.
Below is a reconciliation of GAAP Net Income (Loss) from Continuing Operations to Adjusted EBITDA bysegment for Fiscal 2010 and Fiscal 2009:
Fiscal 2010
GlobalBatteries &
Personal CareGlobal PetSupplies
Home andGardenBusiness
SmallAppliances
Corporate /UnallocatedItems(a)
ConsolidatedSB Holdings
(in millions)
Net Income (loss) . . . . . . . . . . . . . . . . . . . . . . $137 $ 49 $ 40 $— $(416) $(190)Loss from discontinued operations, netof tax . . . . . . . . . . . . . . . . . . . . . . . . . — — 3 — — 3
Income tax expense . . . . . . . . . . . . . . . . — — — — 63 63Interest expense . . . . . . . . . . . . . . . . . . . — — — — 195 195Write-off unamortized discounts andfinancing fees(b) . . . . . . . . . . . . . . . . — — — — 82 82
Pre-acquisition earnings . . . . . . . . . . . . . — — — 66 — 66Restructuring and related charges . . . . . 4 7 8 — 5 24Acquisition and integration relatedcharges . . . . . . . . . . . . . . . . . . . . . . . . — — — 15 24 39
Reorganization items . . . . . . . . . . . . . . . — — — — 3 3Accelerated depreciation andamortization(c) . . . . . . . . . . . . . . . . . . — — (1) — (2) (3)
Fresh-start inventory fair valueadjustment . . . . . . . . . . . . . . . . . . . . . 18 14 2 — — 34
Russell Hobbs inventory fair valueadjustment . . . . . . . . . . . . . . . . . . . . . — — — 3 — 3
Brazilian IPI credit/other . . . . . . . . . . . . (5) — — — — (5)
Adjusted EBIT . . . . . . . . . . . . . . . . . . . . . . . . $154 $ 70 $ 52 $ 84 $ (46) $ 314Depreciation and amortization . . . . . . . . 52 28 15 6 17 118
Adjusted EBITDA . . . . . . . . . . . . . . . . . . . . . $206 $ 98 $ 67 $ 90 $ (29) $ 432
52

Fiscal 2009
GlobalBatteries &
Personal CareGlobal PetSupplies
Home andGardenBusiness
SmallAppliances
Corporate /UnallocatedItems(a)
ConsolidatedSB Holdings
(in millions)
Net Income (loss) . . . . . . . . . . . . . . . . $126 $ 41 $ (52) $— $ 828 $ 943Loss from discontinuedoperations, net of tax . . . . . . . — — 87 — — 87
Income tax expense . . . . . . . . . . — — — — 74 74Interest expense . . . . . . . . . . . . . — — — — 190 190Pre-acquisition earnings . . . . . . . — — — 81 — 81Restructuring and relatedcharges . . . . . . . . . . . . . . . . . . 21 6 6 — 13 46
Reorganization items . . . . . . . . . — — — — (1,139) (1,139)Intangibles impairment . . . . . . . 15 19 — — — 34Fresh-start inventory and otherfair value adjustment . . . . . . . 10 5 1 — 1 17
Accelerated depreciation andamortization(c) . . . . . . . . . . . . (3) — (1) — — (4)
Brazilian IPI credit/other . . . . . . (5) — — — — (5)
Adjusted EBIT . . . . . . . . . . . . . . . . . . $164 $ 71 $ 41 $ 81 $ (33) $ 324Depreciation andamortization . . . . . . . . . . . . . . 29 22 13 — 3 67
Adjusted EBITDA . . . . . . . . . . . . . . . $193 $ 93 $ 54 $ 81 $ (30) $ 391
(a) It is our policy to record Income tax expense (benefit) and interest expense on a consolidated basis.Accordingly, such amounts are not reflected in the operating results of the operating segments.
(b) Adjustment reflects the following: (i) $61 million write-off of unamortized deferred financing fees anddiscounts associated with our restructured capital structure, refinanced on June 16, 2010; (ii) $4 millionrelated to pre-payment premiums associated with the paydown of our old asset based revolving creditfacility and supplemental loan extinguished on June 16, 2010; and (iii) $17 million related to the terminationof interest swaps and commitment fees.
(c) Adjustment reflects restricted stock amortization and accelerated depreciation associated with certainrestructuring initiatives. Inasmuch as this amount is included within Restructuring and related charges, thisadjustment negates the impact of reflecting the add-back of depreciation and amortization.
Global Batteries & Personal Care
2010 2009
(in millions)
Net sales to external customers . . . . . . . . . . . . . . . . . . . . . . . . . . . . . . . . . . . . . . . . . . . . . . . . . . . $1,428 $1,335Segment profit . . . . . . . . . . . . . . . . . . . . . . . . . . . . . . . . . . . . . . . . . . . . . . . . . . . . . . . . . . . . . . . . $ 153 $ 165Segment profit as a % of net sales . . . . . . . . . . . . . . . . . . . . . . . . . . . . . . . . . . . . . . . . . . . . . . . . 10.7% 12.4%Segment Adjusted EBITDA . . . . . . . . . . . . . . . . . . . . . . . . . . . . . . . . . . . . . . . . . . . . . . . . . . . . . $ 206 $ 193Assets as of September 30, . . . . . . . . . . . . . . . . . . . . . . . . . . . . . . . . . . . . . . . . . . . . . . . . . . . . . . $1,629 $1,608
Segment net sales to external customers in Fiscal 2010 increased $93 million to $1,428 million from $1,335million during Fiscal 2009, representing a 7% increase. Favorable foreign currency exchange translationimpacted net sales in Fiscal 2010 by approximately $24 million in comparison to Fiscal 2009. Consumer batterysales for Fiscal 2010 increased to $866 million when compared to Fiscal 2009 sales of $819 million, primarilydue to increased specialty battery sales of $26 million and increased alkaline battery sales of $6 million, coupledwith favorable foreign exchange translation of $15 million. The $26 million increase in specialty battery sales is
53

driven by growth in Latin America driven by the successfully leveraging our value proposition, that is, productsthat work as well as or better than our competitors, at a lower price. The $6 million increase in alkaline sales isdriven by the increased sales in North America, attributable to an increase in market share, as consumers opt forour value proposition during the weakening economic conditions in the U.S, which was tempered by a decline inalkaline battery sales in Europe as we continued efforts to exit from unprofitable or marginally profitable privatelabel battery sales, as well as certain second tier branded battery sales. We are continuing our efforts to promoteprofitable growth and therefore, expect to continue to exit certain low margin business as appropriate to create amore favorable mix of branded versus private label products. Net sales of electric shaving and grooming productsin Fiscal 2010 increased by $32 million, a 14% increase, compare to Fiscal 2009. This increase was primarily dueto an increase of $25 million in Europe, excluding foreign exchange translation, as a result of successfulpromotions and operational execution. Positive foreign exchange translation impacted net sales of electricshaving and grooming products in Fiscal 2010 by $5 million. Electric personal care sales increased by $5 million,an increase of 3%, over Fiscal 2009. Favorable foreign exchange translation impacted net sales by approximately$3 million. Excluding favorable foreign exchange, we experienced modest electric personal care product salesincreases within all geographic regions. Net sales of portable lighting products for Fiscal 2010 increased to $88million as compared to sales of $80 million for Fiscal 2009, an increase of 10%. The portable lighting productsales increase was primarily driven by favorable foreign exchange impact of $2 million, coupled with increasedsales in North America of $3 million, driven by increased sales with a major customer as a result of new productintroductions.
Segment profitability during Fiscal 2010 decreased to $153 million from $165 million in Fiscal 2009.Segment profitability as a percentage of net sales decreased to 10.7% in Fiscal 2010 compared to 12.4% in Fiscal2009. The decrease in segment profitability during Fiscal 2010 was mainly attributable to a $19 million increasein cost of goods sold due to the revaluation of inventory coupled with approximately a $16 million increase inintangible asset amortization due to our adoption of fresh-start reporting upon our emergence from Chapter 11 ofthe Bankruptcy Code. Offsetting this decrease to segment profitability was higher sales, as discussed above, andsavings from our restructuring and related initiatives announced in Fiscal 2009. See “Restructuring and RelatedCharges” below, as well as Note 14, Restructuring and Related Charges, to our Consolidated FinancialStatements included in this Annual Report on Form 10-K for additional information regarding our restructuringand related charges.
Segment Adjusted EBITDA in Fiscal 2010 was $206 million compared to $193 million in Fiscal 2009. Theincrease in Adjusted EBITDA is mainly driven by the efficient cost structure now in place from our costreduction initiatives announced in Fiscal 2009 coupled with increases in market share in certain of our productcategories.
Segment assets at September 30, 2010 increased to $1,629 million from $1,608 million at September 30,2009. Goodwill and intangible assets, which are directly a result of the revaluation impacts of fresh-startreporting, at September 30, 2010 decreased to $881 million from $909 million at September 30, 2009. Thedecrease is mainly due to amortization of definite lived intangible assets of $18 million and foreign exchangeimpacts of $10 million.
Foreign Currency Translation—Venezuela Impacts
The Global Batteries & Personal Care segment does business in Venezuela through a Venezuelansubsidiary. At January 4, 2010, the beginning of our second quarter of Fiscal 2010, we determined thatVenezuela meets the definition of a highly inflationary economy under GAAP. As a result, beginning January 4,2010, the U.S. dollar is the functional currency for our Venezuelan subsidiary. Accordingly, going forward,currency remeasurement adjustments for this subsidiary’s financial statements and other transactional foreignexchange gains and losses are reflected in earnings. Through January 3, 2010, prior to being designated as highlyinflationary, translation adjustments related to the Venezuelan subsidiary were reflected in Shareholders’ equityas a component of AOCI.
54

In addition, on January 8, 2010, the Venezuelan government announced its intention to devalue its currency,the Bolivar fuerte, relative to the U.S. dollar. The official exchange rate for imported goods classified asessential, such as food and medicine, changed from 2.15 to 2.6 to the U.S. dollar, while payments for othernon-essential goods moved to an exchange rate of 4.3 to the U.S. dollar. Some of our imported products fall intothe essential classification and qualify for the 2.6 rate; however, our overall results in Venezuela were reflected atthe 4.3 rate expected to be applicable to dividend repatriations beginning in the second quarter of Fiscal 2010. Asa result, we remeasured the local statement of financial position of our Venezuela entity during the secondquarter of Fiscal 2010 to reflect the impact of the devaluation. Based on actual exchange activity, we determinedon September 30, 2010 that the most likely method of exchanging its Bolivar fuertes for U.S. dollars will be toformally apply with the Venezuelan government to exchange through commercial banks at the SITME ratespecified by the Central Bank of Venezuela. The SITME rate as of September 30, 2010 was quoted at 5.3 Bolivarfuerte per U.S. dollar. Therefore, we changed the rate used to remeasure Bolivar fuerte denominated transactionsas of September 30, 2010 from the official non-essentials exchange rate to the 5.3 SITME rate in accordance withASC 830, “Foreign Currency Matters” as it is the expected rate that exchanges of Bolivar fuerte to U.S. dollarswill be settled. There is also an immaterial ongoing impact related to measuring our Venezuelan statement ofoperations at the new exchange rate of 5.3 to the U.S. dollar.
The designation of our Venezuela entity as a highly inflationary economy and the devaluation of the Bolivarfuerte resulted in a $1 million reduction to our operating income during Fiscal 2010. We also reported a foreignexchange loss in Other expense (income), net, of $10 million during Fiscal 2010.
Global Pet Supplies
2010 2009
(in millions)
Net sales to external customers . . . . . . . . . . . . . . . . . . . . . . . . . . . . . . . . . . . . . . . . . . . . . . . . . . . . . $561 $ 574Segment profit . . . . . . . . . . . . . . . . . . . . . . . . . . . . . . . . . . . . . . . . . . . . . . . . . . . . . . . . . . . . . . . . . . $ 56 $ 65Segment profit as a % of net sales . . . . . . . . . . . . . . . . . . . . . . . . . . . . . . . . . . . . . . . . . . . . . . . . . . . 9.9% 11.3%Segment Adjusted EBITDA . . . . . . . . . . . . . . . . . . . . . . . . . . . . . . . . . . . . . . . . . . . . . . . . . . . . . . . . $ 98 $ 93Assets as of September 30, . . . . . . . . . . . . . . . . . . . . . . . . . . . . . . . . . . . . . . . . . . . . . . . . . . . . . . . . . $826 $ 867
Segment net sales to external customers in Fiscal 2010 decreased to $561 million from $574 million inFiscal 2009, representing a decrease of $13 million or 2%. The $13 million decrease was attributable to loweraquatics sales of $11 million, lower specialty pet product sales of $6 million and favorable foreign exchangeimpacts of $3 million. The decrease in aquatics sales was primarily due to general softness in this category. Thedecrease in specialty pet product sales was driven by a distribution loss at a major retailer of certain dog shampooproducts and the impact of a product recall.
Segment profitability in Fiscal 2010 decreased to $56 million from $65 million in Fiscal 2009. Segmentprofitability as a percentage of sales in Fiscal 2010 also decreased to 9.9% from 11.3% during Fiscal 2009. Thisdecrease in segment profitability and profitability margin was primarily attributable to an increase in cost ofgoods sold due to the revaluation of inventory and the increase in intangible asset amortization in accordancewith SFAS 141, as was required when we adopted fresh-start reporting upon our emergence from Chapter 11 ofthe Bankruptcy Code. The decrease in Fiscal 2010 segment profitability was tempered by improved pricing andlower manufacturing and operating costs as a result of our global cost reduction initiatives announced in Fiscal2009. See “Restructuring and Related Charges” below, as well as Note 14, Restructuring and Related Charges,to our Consolidated Financial Statements included in this Annual Report on Form 10-K for additionalinformation regarding our restructuring and related charges.
Segment Adjusted EBITDA in Fiscal 2010 was $98 million compared to $93 million in Fiscal 2009. Despitedecreased net sales during Fiscal 2010 of $13 million, our successful efforts to create a lower cost structureincluding the closure and consolidation of some of our pet facilities, and improved product mix, resulted in
55

Adjusted EBITDA increase of $5 million. See “Restructuring and Related Charges” below, as well as Note 14,Restructuring and Related Charges, to our Consolidated Financial Statements included in this Annual Report onForm 10-K, for further detail on our Fiscal 2009 initiatives.
Segment assets as of September 30, 2010 decreased to $826 million from $867 million at September 30,2009. Goodwill and intangible assets, which are directly a result of the revaluation impacts of fresh-startreporting, decreased to $589 million at September 30, 2010 from $618 million at September 30, 2009. Thedecrease is mainly due to amortization of definite lived intangible assets of $15 million and foreign exchangeimpacts of $14 million.
Home and Garden Business
2010 2009
(in millions)
Net sales to external customers . . . . . . . . . . . . . . . . . . . . . . . . . . . . . . . . . . . . . . . . . . . . . . . . . . . . . $ 341 $ 322Segment profit . . . . . . . . . . . . . . . . . . . . . . . . . . . . . . . . . . . . . . . . . . . . . . . . . . . . . . . . . . . . . . . . . . $ 51 $ 42Segment profit as a % of net sales . . . . . . . . . . . . . . . . . . . . . . . . . . . . . . . . . . . . . . . . . . . . . . . . . . 14.9% 13.0%Segment Adjusted EBITDA . . . . . . . . . . . . . . . . . . . . . . . . . . . . . . . . . . . . . . . . . . . . . . . . . . . . . . . $ 67 $ 54Assets as of September 30, . . . . . . . . . . . . . . . . . . . . . . . . . . . . . . . . . . . . . . . . . . . . . . . . . . . . . . . . $ 494 $ 504
Segment net sales to external customers of home and garden control products during Fiscal 2010 versusFiscal 2009 increased $19 million, or 6%, was driven by incentives to retailers and promotional campaignsduring the year in both lawn and garden control products and household control products.
Segment profitability in Fiscal 2010 increased to $51 million compared to $42 million in Fiscal 2009.Segment profitability as a percentage of sales in Fiscal 2010 increased to 14.9% from 13.0% in Fiscal 2009. Thisincrease in segment profitability was attributable to savings from our global cost reduction initiatives announcedin Fiscal 2009. See “Restructuring and Related Charges” below, as well as Note 14, Restructuring and RelatedCharges, to our Consolidated Financial Statements included in this Annual Report on Form 10-K for additionalinformation regarding our restructuring and related charges. The increase in profitability during Fiscal 2010 wastempered by a $2 million increase in cost of goods sold due to the revaluation of inventory and increasedintangible asset amortization due to the revaluation of our customer relationships in accordance with SFAS 141as was required when we adopted fresh-start reporting upon our emergence from Chapter 11 of the BankruptcyCode.
Segment Adjusted EBITDA in Fiscal 2010 was $67 million compared to $54 million in Fiscal 2009. Theincrease in Adjusted EBITDA during Fiscal 2010 was mainly driven by expanded promotions at our top retailersand strong sales growth.
Segment assets as of September 30, 2010 decreased to $494 million from $504 million at September 30,2009. Goodwill and intangible assets, which are directly a result of the revaluation impacts of fresh-startreporting, at September 30, 2010 decreased to $410 million from $419 million at September 30, 2009. Thedecrease of $9 million is driven by amortization associated with definite lived intangible assets.
Small Appliances
2010 2009
(in millions)
Net sales to external customers . . . . . . . . . . . . . . . . . . . . . . . . . . . . . . . . . . . . . . . . . . . . . . . . . . . . . . $238 $—Segment profit . . . . . . . . . . . . . . . . . . . . . . . . . . . . . . . . . . . . . . . . . . . . . . . . . . . . . . . . . . . . . . . . . . . $ 13 $—Segment profit as a % of net sales . . . . . . . . . . . . . . . . . . . . . . . . . . . . . . . . . . . . . . . . . . . . . . . . . . . 5.5% —Segment Adjusted EBITDA . . . . . . . . . . . . . . . . . . . . . . . . . . . . . . . . . . . . . . . . . . . . . . . . . . . . . . . . $ 90 $ 81Assets as of September 30, . . . . . . . . . . . . . . . . . . . . . . . . . . . . . . . . . . . . . . . . . . . . . . . . . . . . . . . . . $863 $—
56
Segment net sales to external customers in Fiscal 2010 were $238 million. This represents sales related toRussell Hobbs from the date of the consummation of the Merger, June 16, 2010, through the close of Fiscal 2010.
Segment profitability in Fiscal 2010 was $13 million, which includes an increase to Cost of goods sold as aresult of the inventory write-up in conjunction with the Merger in accordance with ASC Topic 805: “BusinessCombinations,” (“ASC 805”). This represents segment profit from the operations of Russell Hobbs from the dateof the consummation of the Merger, June 16, 2010 through the close of Fiscal 2010.
Segment Adjusted EBITDA in Fiscal 2010 was $90 million compared to $81 million in Fiscal 2009. The $9million increase in Fiscal 2010 is mainly driven by Russell Hobbs’ voluntarily exiting certain non-profitablebrands and stock keeping units and implementing cost reduction initiatives.
ASC 805 requires, among other things, that assets acquired and liabilities assumed be recognized at theirfair values as of the acquisition date. Accordingly, the Company performed a valuation of the assets andliabilities of Russell Hobbs at June 16, 2010. See Note 15, Acquisitions, of Notes to Consolidated FinancialStatements, included in this Annual Report on Form 10-K for additional information regarding the assetsacquired in the Merger. Segment assets at September 30, 2010 were $863 million. At September 30, 2010goodwill and intangible assets recorded in connection with the Merger totaled $489 million.
Corporate Expense. Our corporate expense in Fiscal 2010 increased to $41 million from $34 million inFiscal 2009. Our corporate expense as a percentage of consolidated net sales in Fiscal 2010 increased slightly to1.6% from 1.5%. The increase is primarily due to stock compensation expense of $17 million in Fiscal 2010compared to $3 million of stock compensation expense in Fiscal 2009.
Restructuring and Related Charges. See Note 14, Restructuring and Related Charges, of Notes toConsolidated Financial Statements, included in this Annual Report on Form 10-K for additional informationregarding our restructuring and related charges.
57

The following table summarizes all restructuring and related charges we incurred in Fiscal 2010 and Fiscal2009 (in millions):
2010 2009
Costs included in cost of goods sold:Latin America Initiatives:
Termination benefits . . . . . . . . . . . . . . . . . . . . . . . . . . . . . . . . . . . . . . . $ — $ 0.2Global Realignment Initiatives:
Termination benefits . . . . . . . . . . . . . . . . . . . . . . . . . . . . . . . . . . . . . . . 0.2 0.3Other associated costs . . . . . . . . . . . . . . . . . . . . . . . . . . . . . . . . . . . . . . (0.1) 0.9
Ningbo Exit Plan:Termination benefits . . . . . . . . . . . . . . . . . . . . . . . . . . . . . . . . . . . . . . . — 0.9Other associated costs . . . . . . . . . . . . . . . . . . . . . . . . . . . . . . . . . . . . . . 2.1 8.6
Global Cost Reduction Initiatives:Termination benefits . . . . . . . . . . . . . . . . . . . . . . . . . . . . . . . . . . . . . . . 2.6 0.2Other associated costs . . . . . . . . . . . . . . . . . . . . . . . . . . . . . . . . . . . . . . 2.3 2.3
Total included in cost of goods sold . . . . . . . . . . . . . . . . . . . . . . . . . . . . . . . $ 7.1 $13.4
Costs included in operating expenses:United & Tetra integration:
Termination benefits . . . . . . . . . . . . . . . . . . . . . . . . . . . . . . . . . . . . . . . $ — $ 2.3Other associated costs . . . . . . . . . . . . . . . . . . . . . . . . . . . . . . . . . . . . . . — 0.3
European Initiatives:Termination benefits . . . . . . . . . . . . . . . . . . . . . . . . . . . . . . . . . . . . . . . (0.1) —
Global Realignment Initiatives:Termination benefits . . . . . . . . . . . . . . . . . . . . . . . . . . . . . . . . . . . . . . . 5.4 7.1Other associated costs . . . . . . . . . . . . . . . . . . . . . . . . . . . . . . . . . . . . . . (1.9) 3.5
Ningbo Exit Plan:Other associated costs . . . . . . . . . . . . . . . . . . . . . . . . . . . . . . . . . . . . . . — 1.3
Global Cost Reduction Initiatives:Termination benefits . . . . . . . . . . . . . . . . . . . . . . . . . . . . . . . . . . . . . . . 4.3 6.6Other associated costs . . . . . . . . . . . . . . . . . . . . . . . . . . . . . . . . . . . . . . 9.3 11.3
Total included in operating expenses . . . . . . . . . . . . . . . . . . . . . . . . . . . . . . $17.0 $32.4
Total restructuring and related charges . . . . . . . . . . . . . . . . . . . . . . . . . . . . . $24.1 $45.8
In Fiscal 2007, we began managing our business in three vertically integrated, product-focused reportingsegments; Global Batteries & Personal Care, Global Pet Supplies and the Home and Garden Business. As part ofthis realignment, our global operations organization, which had previously been included in corporate expense,consisting of research and development, manufacturing management, global purchasing, quality operations andinbound supply chain, is now included in each of the operating segments. In connection with these changes weundertook a number of cost reduction initiatives, primarily headcount reductions, at the corporate and operatingsegment levels (the “Global Realignment Initiatives”). We recorded approximately $4 million and $11 million ofpretax restructuring and related charges during Fiscal 2010 and Fiscal 2009, respectively, in connection with theGlobal Realignment Initiatives. Costs associated with these initiatives, which are expected to be incurred throughJune 30, 2011, relate primarily to severance and are projected at approximately $89 million.
During Fiscal 2008, we implemented an initiative within the Global Batteries & Personal Care segment toreduce operating costs and rationalize our manufacturing structure. These initiatives, which are substantiallycomplete, include the exit of our battery manufacturing facility in Ningbo Baowang China (“Ningbo”) (the“Ningbo Exit Plan”). We recorded approximately $2 million and $11 million of pretax restructuring and relatedcharges during Fiscal 2010 and Fiscal 2009, respectively, in connection with the Ningbo Exit Plan. We haverecorded pretax and restructuring and related charges of approximately $29 million since the inception of theNingbo Exit Plan.
58

During Fiscal 2009, we implemented a series of initiatives within the Global Batteries & Personal Caresegment and the Global Pet Supplies segment to reduce operating costs as well as evaluate our opportunities toimprove our capital structure (the “Global Cost Reduction Initiatives”). These initiatives include headcountreductions within all our segments and the exit of certain facilities in the U.S. related to the Global Pet Suppliessegment. These initiatives also included consultation, legal and accounting fees related to the evaluation of ourcapital structure. We recorded $18 million and $20 million of pretax restructuring and related charges duringFiscal 2010 and Fiscal 2009, respectively, related to the Global Cost Reduction Initiatives. Costs associated withthese initiatives, which are expected to be incurred through March 31, 2014, are projected at approximately $65million.
Acquisition and integration related charges. Acquisition and integration related charges reflected inOperating expenses include, but are not limited to transaction costs such as banking, legal and accountingprofessional fees directly related to the acquisition, termination and related costs for transitional and certain otheremployees, integration related professional fees and other post business combination related expenses associatedwith the Merger of Russell Hobbs. We incurred $38 million of Acquisition and integration related charges duringFiscal 2010, which consisted of the following: (i) $25 million of legal and professional fees; (ii) $10 million ofemployee termination charges; and (iii) $4 million of integration costs.
Goodwill and Intangibles Impairment. ASC 350 requires companies to test goodwill and indefinite-livedintangible assets for impairment annually, or more often if an event or circumstance indicates that an impairmentloss may have been incurred. In Fiscal 2010 and 2009, we tested our goodwill and indefinite-lived intangibleassets. As a result of this testing, we recorded a non-cash pretax impairment charge of $34 million in Fiscal 2009.The $34 million non-cash pretax impairment charge incurred in Fiscal 2009 reflects trade name intangible assetimpairments of the following: $18 million related to Global Pet Supplies; $15 million related to the GlobalBatteries and Personal Care segment; and $1 million related to the Home and Garden Business. See Note 3(i),Significant Accounting Policies and Practices—Intangible Assets, of Notes to Consolidated Financial Statementsincluded in this Annual Report on Form 10-K for further details on this impairment charge.
Interest Expense. Interest expense in Fiscal 2010 increased to $277 million from $190 million in Fiscal2009. The increase was driven primarily by the following unusual items: (i) $55 million representing thewrite-off of the unamortized portion of discounts and premiums related to debt that was paid off in conjunctionwith our refinancing, a non-cash charge; (ii) $13 million related to bridge commitment fees while we wererefinancing our debt; (iii) $7 million representing the write-off of the unamortized debt issuance costs related todebt that was paid off, a non-cash charge; (iv) $4 million related to a prepayment premium; and (v) $3 millionrelated to the termination of a Euro-denominated interest rate swap.
Reorganization Items. During Fiscal 2010, we, in connection with our reorganization under Chapter 11 ofthe Bankruptcy Code, recorded Reorganization items expense (income), net of approximately $4 million, whichprimarily consisted of legal and professional fees. During Fiscal 2009 Old Spectrum recorded Reorganizationitems expense (income), net, which represents a gain of approximately $(1,143) million. Reorganization itemsexpense (income), net included the following: (i) gain on cancellation of debt of $(147) million; (ii) gains inconnection with fresh-start reporting adjustments of $(1,088) million; (iii) legal and professional fees of $75million; (iv) write off deferred financing costs related to the Senior Subordinated Notes of $11 million; and (v) aprovision for rejected leases of $6 million. During Fiscal 2009, New Spectrum recorded Reorganization itemsexpense (income), net which represents expense of $4 million related to professional fees. See Note 2, VoluntaryReorganization Under Chapter 11, of Notes to Consolidated Financial Statements included in this Annual Reporton Form 10-K for more information related to our reorganization under Chapter 11 of the Bankruptcy Code.
Income Taxes. Our effective tax rate on income from continuing operations was approximately (50.9)% forFiscal 2010. Our effective tax rate on losses from continuing operations is approximately 2.0% for Old Spectrumand (256)% for New Spectrum during Fiscal 2009. The primary drivers of the effective rate as compared to theU.S. statutory rate of 35% for Fiscal 2010 include tax expense recorded for an increase in the valuationallowance associated with our net U.S. deferred tax asset.
59

As of September 30, 2010, we have U.S. federal and state net operating loss carryforwards of approximately$1,087 million and $936 million, respectively. These net operating loss carryforwards expire through yearsending in 2031, and we have foreign loss carryforwards of approximately $195 million, which will expirebeginning in 2011. Certain of the foreign net operating losses have indefinite carryforward periods. We aresubject to an annual limitation on the use of our U.S. net operating losses that arose prior to our emergence frombankruptcy. We have had multiple changes of ownership, as defined under Internal Revenue Code (“IRC”)Section 382, that subject our U.S. federal and state net operating losses and other tax attributes to certainlimitations. The annual limitation is based on a number of factors including the value of our stock (as defined fortax purposes) on the date of the ownership change, our net unrealized built in gain position on that date, theoccurrence of realized built in gains in years subsequent to the ownership change, and the effects of subsequentownership changes (as defined for tax purposes) if any. In addition, separate return year limitations apply to limitour utilization of the acquired Russell Hobbs U.S. federal and state net operating losses to future income of theRussell Hobbs subgroup. Based on these factors, we project that $296 million of the total U.S. federal and $463million of the state net operating loss will expire unused. In addition, we project that $38 million of the totalforeign net operating loss carryforwards will expire unused. We have provided a full valuation allowance againstthese deferred tax assets.
We recognized income tax expense of approximately $124 million related to the gain on the settlement ofliabilities subject to compromise and the modification of the senior secured credit facility in the period fromOctober 1, 2008 through August 30, 2009. This adjustment, net of a change in valuation allowance is embeddedin Reorganization items expense (income), net. We have, in accordance with the IRC Section 108 reduced ournet operating loss carryforwards for cancellation of debt income that arose from our emergence from Chapter 11of the Bankruptcy Code under IRC Section 382 (1)(6).
The ultimate realization of our deferred tax assets depends on our ability to generate sufficient taxableincome of the appropriate character in the future and in the appropriate taxing jurisdictions. We establishvaluation allowances for deferred tax assets when we estimate it is more likely than not that the tax assets willnot be realized. We base these estimates on projections of future income, including tax planning strategies, incertain jurisdictions. Changes in industry conditions and other economic conditions may impact our ability toproject future income. ASC Topic 740: “Income Taxes” (“ASC 740”) requires the establishment of a valuationallowance when it is more likely than not that some portion or all of the deferred tax assets will not be realized.In accordance with ASC 740, we periodically assess the likelihood that our deferred tax assets will be realizedand determine if adjustments to the valuation allowance are appropriate.
Our total valuation allowance established for the tax benefit of deferred tax assets that may not be realized isapproximately $331 million at September 30, 2010. Of this amount, approximately $300 million relates to U.S.net deferred tax assets and approximately $31 million relates to foreign net deferred tax assets. In connectionwith the Merger, we established an additional valuation allowance of approximately $104 million related toacquired net deferred tax assets as part of acquisition accounting. In 2009, Old Spectrum recorded a reduction inthe valuation allowance against the U.S. net deferred tax asset exclusive of indefinite lived intangible assetsprimarily as a result of utilizing net operating losses to offset the gain on settlement of liabilities subject tocompromise and the impact of the fresh start reporting adjustments. New Spectrum recorded a reduction in thedomestic valuation allowance of $47 million as a reduction to goodwill as a result of New Spectrum income. Ourtotal valuation allowance established for the tax benefit of deferred tax assets that may not be realized isapproximately $133 million at September 30, 2009. Of this amount, approximately $109 million relates to U.S.net deferred tax assets and approximately $24 million relates to foreign net deferred tax assets. We recorded anon-cash deferred income tax charge of approximately $257 million related to a valuation allowance against U.S.net deferred tax assets during Fiscal 2008. Included in the total is a non-cash deferred income tax charge ofapproximately $4 million related to an increase in the valuation allowance against our net deferred tax assets inChina in connection with the Ningbo Exit Plan. We also determined that a valuation allowance was no longerrequired in Brazil and thus recorded a $31 million benefit to reverse the valuation allowance previouslyestablished. Our total valuation allowance, established for the tax benefit of deferred tax assets that may not be
60
realized, is approximately $496 million at September 30, 2008. Of this amount, approximately $468 millionrelates to U.S. net deferred tax assets and approximately $28 million relates to foreign net deferred tax assets.
ASC 350 requires companies to test goodwill and indefinite-lived intangible assets for impairment annually,or more often if an event or circumstance indicates that an impairment loss may have been incurred. DuringFiscal 2009 we recorded a non- cash pretax impairment charge of approximately $34 million. The tax impact,prior to consideration of the current year valuation allowance, of the impairment charges was a deferred taxbenefit of approximately $13 million. See “Goodwill and Intangibles Impairment” above, as well as Note 3(c),Significant Accounting Policies and Practices—Intangible Assets, of Notes to Consolidated Financial Statementsincluded in this Annual Report on Form 10-K for additional information regarding these non-cash impairmentcharges.
In addition, our income tax provision for the year ended September 30, 2010 reflects the correction of aprior period error which increases our income tax provision by approximately $6 million.
ASC 740, which clarifies the accounting for uncertainty in tax positions, requires that we recognize in ourfinancial statements the impact of a tax position, if that position is more likely than not of being sustained onaudit, based on the technical merits of the position. As a result, we recognized no cumulative effect adjustment atthe time of adoption. As of September 30, 2010 and September 30, 2009, the total amount of unrecognized taxbenefits that, if recognized, would affect the effective income tax rate in future periods was $13 million and $8million, respectively. See Note 8, Income Taxes, of Notes to Consolidated Financial Statements included in thisAnnual Report on Form 10-K for additional information.
Discontinued Operations. On November 5, 2008, the board of directors of Old Spectrum committed to theshutdown of the growing products portion of the Home and Garden Business, which included the manufacturingand marketing of fertilizers, enriched soils, mulch and grass seed, following an evaluation of the historical lack ofprofitability and the projected input costs and significant working capital demands for the growing productportion of the Home and Garden Business during Fiscal 2009. We believe the shutdown is consistent with whatwe have done in other areas of our business to eliminate unprofitable products from our portfolio. We completedthe shutdown of the growing products portion of the Home and Garden Business during the second quarter ofFiscal 2009. Accordingly, the presentation herein of the results of continuing operations excludes the growingproducts portion of the Home and Garden Business for all periods presented. See Note 9, DiscontinuedOperations, of Notes to Consolidated Financial Statements included in this Annual Report on Form 10-K forfurther details on the disposal of the growing products portion of the Home and Garden Business. The followingamounts related to the growing products portion of the Home and Garden Business have been segregated fromcontinuing operations and are reflected as discontinued operations during Fiscal 2010 and Fiscal 2009,respectively (in millions):
2010 2009
Net sales . . . . . . . . . . . . . . . . . . . . . . . . . . . . . . . . . . . . . . . . . . . . . . . . . . . . . . . . . . . . $— $ 31.3
Loss from discontinued operations before income taxes . . . . . . . . . . . . . . . . . . . . . . . $(2.5) $(90.9)Provision for income tax benefit . . . . . . . . . . . . . . . . . . . . . . . . . . . . . . . . . . . . . . . . . 0.2 (4.5)
Loss from discontinued operations, net of tax . . . . . . . . . . . . . . . . . . . . . . . . . . . . . . . $(2.7) $(86.4)
Fiscal Year Ended September 30, 2009 Compared to Fiscal Year Ended September 30, 2008
Fiscal 2009, when referenced within this Management’s Discussion and Analysis of Financial Conditionand Results of Operations included in this Annual Report on Form 10-K, includes the combined results of OldSpectrum for the period from October 1, 2008 through August 30, 2009 and New Spectrum for the period fromAugust 31, 2009 through September 30, 2009.
61
Highlights of consolidated operating results
During Fiscal 2009 and Fiscal 2008, we have presented the growing products portion of the Home andGarden Business as discontinued operations. During Fiscal 2008 we have presented the Canadian division of theHome and Garden Business as discontinued operations. Our board of directors of Old Spectrum committed to theshutdown of the growing products portion of the Home and Garden Business in November 2008 and theshutdown was completed during the second quarter of our Fiscal 2009. The Canadian division of the Home andGarden Business was sold on November 1, 2007. See Note 9, Discontinued Operations of Notes to ConsolidatedFinancial Statements, included in this Annual Report on Form 10-K for additional information regarding theshutdown of the growing products portion of the Home and Garden Business and the sale of the Canadiandivision of the Home and Garden Business. As a result, and unless specifically stated, all discussions regardingFiscal 2009 and Fiscal 2008 only reflect results from our continuing operations.
Net Sales. Net sales for Fiscal 2009 decreased to $2,231 million from $2,427 million in Fiscal 2008, an8.1% decrease. The following table details the principal components of the change in net sales from Fiscal 2008to Fiscal 2009 (in millions):
Net Sales
Fiscal 2008 Net Sales . . . . . . . . . . . . . . . . . . . . . . . . . . . . . . . . . . . . . . . . . . . . . . . . $2,427Increase in electric personal care product sales . . . . . . . . . . . . . . . . . . . . . . . . 4Decrease in consumer battery sales . . . . . . . . . . . . . . . . . . . . . . . . . . . . . . . . . (27)Decrease in pet supplies sales . . . . . . . . . . . . . . . . . . . . . . . . . . . . . . . . . . . . . . (14)Decrease in lighting product sales . . . . . . . . . . . . . . . . . . . . . . . . . . . . . . . . . . (14)Decrease in home and garden product sales . . . . . . . . . . . . . . . . . . . . . . . . . . . (13)Decrease in electric shaving and grooming product sales . . . . . . . . . . . . . . . . (3)Foreign currency impact, net . . . . . . . . . . . . . . . . . . . . . . . . . . . . . . . . . . . . . . (129)
Fiscal 2009 Net Sales . . . . . . . . . . . . . . . . . . . . . . . . . . . . . . . . . . . . . . . . . . . . . . . . $2,231
Consolidated net sales by product line for Fiscal 2009 and 2008 are as follows (in millions):
Fiscal Year
2009 2008
Product line net salesConsumer batteries . . . . . . . . . . . . . . . . . . . . . . . . . . . . . . . . . . . . . . . . . . . . . . . . . . $ 819 $ 916Pet supplies . . . . . . . . . . . . . . . . . . . . . . . . . . . . . . . . . . . . . . . . . . . . . . . . . . . . . . . . 574 599Home and garden control products . . . . . . . . . . . . . . . . . . . . . . . . . . . . . . . . . . . . . . 322 334Electric shaving and grooming products . . . . . . . . . . . . . . . . . . . . . . . . . . . . . . . . . . 225 247Electric personal care products . . . . . . . . . . . . . . . . . . . . . . . . . . . . . . . . . . . . . . . . . 211 231Portable lighting products . . . . . . . . . . . . . . . . . . . . . . . . . . . . . . . . . . . . . . . . . . . . . 80 100
Total net sales to external customers . . . . . . . . . . . . . . . . . . . . . . . . . . . . . . . . . . . . $2,231 $2,427
Global consumer battery sales during Fiscal 2009 decreased $97 million, or 11%, compared to Fiscal 2008,primarily driven by unfavorable foreign exchange impacts of $70 million coupled with decreased consumerbattery sales of $50 million and $15 million in Latin America and Europe, respectively. These declines werepartially offset by increased consumer battery sales, mainly alkaline batteries, in North America of $38 million.The alkaline battery sales increase in North America is mainly due to higher volume at a major customer coupledwith new distribution. The decreased consumer battery sales in Latin America continues to be a result of aslowdown in economic conditions in all countries and inventory de-stocking at retailers mainly in Brazil. Zinccarbon batteries decreased $35 million while alkaline battery sales are down $15 million in Latin America. Thedecreased consumer battery sales within Europe are primarily attributable to the decline in alkaline battery salesdue to a slowdown in economic conditions and our continued efforts to exit unprofitable or marginally profitableprivate label battery sales.
62
Pet supplies product sales during Fiscal 2009 decreased $25 million, or 4%, compared to Fiscal 2008. Thedecrease of $25 million is primarily attributable to decreased aquatics sales of $27 million coupled withunfavorable foreign exchange impacts of $11 million. These decreases were partially offset by increases of $13million within specialty pet products. The decrease in aquatics sales of $27 million during Fiscal 2009 wasattributable to declines in the U.S., Europe and Pacific Rim of $14 million, $10 million and $3 million,respectively. The declines in the U.S. were a result of decreased sales of large equipment, such as aquariums,driven by softness in this product category due to the macroeconomic slowdown as we maintained our marketshare in the category. The declines in Europe were due to inventory de-stocking at retailers and weak filtrationproduct sales, both a result of the slowdown in economic conditions. The declines the Pacific Rim were also aresult of the slowdown in economic conditions. The increase of $13 million in specialty pet products is a result ofincreased sales of our Dingo brand dog treats coupled with price increases on select products, primarily inthe U.S.
Sales of home and garden control products during Fiscal 2009 versus Fiscal 2008 decreased $12 million, or4%, primarily due to our retail customers managing their inventory levels to unprecedented low levels, combinedwith such retailers ending their outdoor lawn and garden control season six weeks early as compared to prior yearseasons and our decision to exit certain unprofitable or marginally profitable products. This decrease in saleswithin lawn and garden control products was partially offset by increased sales of household insect controlproducts.
Electric shaving and grooming product sales during Fiscal 2009 decreased $22 million, or 9%, compared toFiscal 2008 primarily due to unfavorable foreign exchange translation of $19 million. The decline of $3 million,excluding unfavorable foreign exchange, was due to a $7 million decrease of sales within North America, whichwas partially offset by slight increases within Europe and Latin America of $3 million and $1 million,respectively. The decreased sales of electric shaving and grooming products within North America were a resultof delayed inventory stocking at certain of our major customers for the 2009 holiday season which in turnresulted in a delay of our product shipments that historically would have been recorded during the fourth quarterof our fiscal year. We anticipate the first quarter sales of Fiscal 2010 to be positively impacted versus ourhistorical results due to this delay. The increases within Europe and Latin America were driven by new productlaunches, pricing and promotions.
Electric personal care product sales during Fiscal 2009 decreased $20 million, or 9%, when compared toFiscal 2008. The decrease of $20 million during Fiscal 2009 was attributable to unfavorable foreign exchangeimpacts of $24 million and declines in North America of $7 million. These decreases were partially offset byincreases within Europe and Latin America of $8 million and $3 million, respectively. Similar to our electricshaving and grooming products sales, the decreased sales of electric personal care products within NorthAmerica was a result of delayed holiday inventory stocking by our customers which in turn resulted in a delay ofour product shipments that historically would have been recorded during the fourth quarter of our fiscal year. Weexpect the first quarter sales of Fiscal 2010 to be positively impacted versus our historical results due to thisdelay. The increased sales within Europe and Latin America were a result of successful product launches, mainlyin women’s hair care.
Sales of portable lighting products in Fiscal 2009 decreased $20 million, or 20%, compared to Fiscal 2008as a result of unfavorable foreign exchange impacts of $5 million coupled with declines in North America, LatinAmerica and Europe of $9 million, $3 million and $1 million, respectively. The decreases across all regions are aresult of the slowdown in economic conditions and decreased market demand.
Gross Profit. Gross profit for Fiscal 2009 was $817 million versus $920 million for Fiscal 2008. Our grossprofit margin for Fiscal 2009 decreased slightly to 36.6% from 37.9% in Fiscal 2008. Gross profit was lower inFiscal 2009 due to unfavorable foreign exchange impacts of $58 million. As a result of our adoption of fresh-startreporting upon emergence from Chapter 11 of the Bankruptcy Code, in accordance with SFAS No. 141,“Business Combinations,” (“SFAS 141”), inventory balances were revalued as of August 30, 2009 resulting in
63

an increase in such inventory balances of $49 million. As a result of the inventory revaluation, New Spectrumrecognized $16 million in additional cost of goods sold in Fiscal 2009. The remaining $33 million of theinventory revaluation was recorded during the first quarter of Fiscal 2010. These inventory revaluationadjustments are non-cash charges. In addition, in connection with our adoption of fresh-start reporting, and inaccordance with ASC 852, we revalued our property, plant and equipment as of August 30, 2009 which resultedin an increase to such assets of $34 million. As a result of the revaluation of property, plant and equipment,during Fiscal 2009 we incurred an additional $2 million of depreciation charges within cost of goods sold. Weanticipate higher cost of goods sold in future years as a result of the revaluation of our property, plant andequipment. Furthermore, as a result of emergence from Chapter 11 of the Bankruptcy Code, we anticipate lowerinterest costs in future years which should enable us to invest more in capital expenditures into our business and,as a result, such higher future capital spending would also increase our depreciation expense in future years. SeeNote 2, Voluntary Reorganization Under Chapter 11, of Notes to Consolidated Financial Statements included inthis Annual Report on Form 10-K for more information related to our reorganization under Chapter 11 of theBankruptcy Code and fresh-start reporting. Offsetting the unfavorable impacts to our gross margin, we incurred$13 million of Restructuring and related charges, within Costs of goods sold, during Fiscal 2009, compared to$16 million in Fiscal 2008. The $13 million in Fiscal 2009 primarily related to the 2009 Cost ReductionInitiatives and the Ningbo Exit Plan, while the Fiscal 2008 charges were primarily related to the Ningbo ExitPlan. See “Restructuring and Related Charges” below, as well as Note 15, Restructuring and Related Charges, ofNotes to Consolidated Financial Statements included in this Annual Report on Form 10-K for additionalinformation regarding our restructuring and related charges.
Operating Expense. Operating expenses for Fiscal 2009 totaled $659 million versus $1,605 million forFiscal 2008. This $946 million decrease in operating expenses for Fiscal 2009 versus Fiscal 2008 was primarilydriven by lower impairment charges recorded in Fiscal 2009 versus Fiscal 2008. During Fiscal 2009 we recordednon-cash impairment charges of $34 million versus $861 million of non-cash impairment charges recorded inFiscal 2008. The Fiscal 2009 impairment charges related to the write down of the carrying value of indefinite-lived intangible assets to fair value while the Fiscal 2008 impairment charges related to the write down of thecarrying value of goodwill and indefinite-lived intangible assets to fair value. These impairment charges wererecorded in accordance with both ASC Topic 350: “Intangibles-Goodwill and Other,” (“ASC 350”) and ASCTopic 360: “Property, Plant and Equipment,” (“ASC 360”). See “Goodwill and Intangibles Impairment” below,as well as Note 3(c), Significant Accounting Policies and Practices—Intangible Assets, of Notes to ConsolidatedFinancial Statements included in this Annual Report on Form 10-K for additional information regarding thesenon-cash impairment charges. The decrease in operating expenses in Fiscal 2009 versus Fiscal 2008 is alsoattributable to the positive impact related to foreign exchange of $37 million in Fiscal 2009 coupled with thenon-recurrence of a charge in Fiscal 2008 of $18 million associated with the depreciation and amortizationrelated to the assets of the Home and Garden Business incurred as a result of our reclassification of the Home andGarden Business from discontinued operations to continuing. See “Introduction” above and “Segment Results—Home and Garden” below, as well as Note 1, Description of Business, of Notes to Consolidated FinancialStatements included in this Annual Report on Form 10-K for additional information regarding the reclassificationof the Home and Garden Business. Tempering the decrease in operating expenses from Fiscal 2008 to Fiscal2009 was an increase in restructuring and related charges. Restructuring and related charges included inoperating expenses were $32 million in Fiscal 2009 and $23 million in Fiscal 2008. The Fiscal 2009Restructuring and related charges are primarily attributable to the 2009 Cost Reduction Initiatives, while theFiscal 2008 charges are primarily attributable to various cost reduction initiatives in connection with our globalrealignment announced in January 2007. See “Restructuring and Related Charges” below, as well as Note 15,Restructuring and Related Charges, of Notes to Consolidated Financial Statements included in this AnnualReport on Form 10-K for additional information regarding our restructuring and related charges.
Operating Income (Loss). Operating income of approximately $157 million was recognized in Fiscal 2009compared to an operating loss in Fiscal 2008 of $685 million. The change in operating income (loss) is directlyattributable to the impact of the previously discussed non-cash impairment charge of $34 million in Fiscal 2009compared to the non-cash impairment charge of $861 million during Fiscal 2008.
64

Segment Results. Operating segment profits do not include restructuring and related charges, interestexpense, interest income, impairment charges, reorganization items and income tax expense. Expenses associatedwith global operations, consisting of research and development, manufacturing management, global purchasing,quality operations and inbound supply chain are included in the determination of operating segment profits. Inaddition, certain general and administrative expenses necessary to reflect the operating segments on a standalonebasis have been included in the determination of operating segment profits. Corporate expenses include primarilygeneral and administrative expenses associated with corporate overhead and global long-term incentivecompensation plans.
All depreciation and amortization included in income from operations is related to operating segments orcorporate expense. Costs are allocated to operating segments or corporate expense according to the function ofeach cost center. All capital expenditures are related to operating segments. Variable allocations of assets are notmade for segment reporting.
Global strategic initiatives and financial objectives for each reportable segment are determined at thecorporate level. Each reportable segment is responsible for implementing defined strategic initiatives andachieving certain financial objectives and has a general manager responsible for the sales and marketinginitiatives and financial results for product lines within that segment. Financial information pertaining to ourreportable segments is contained in Note 12, Segment Information, of Notes to Consolidated FinancialStatements included in this Annual Report on Form 10-K.
Global Batteries & Personal Care
2009 2008
(in millions)
Net sales to external customers . . . . . . . . . . . . . . . . . . . . . . . . . . . . . . . . . . . . . . . . . . . . . . . . . . . $1,335 $1,494Segment profit . . . . . . . . . . . . . . . . . . . . . . . . . . . . . . . . . . . . . . . . . . . . . . . . . . . . . . . . . . . . . . . . $ 165 $ 163Segment profit as a % of net sales . . . . . . . . . . . . . . . . . . . . . . . . . . . . . . . . . . . . . . . . . . . . . . . . 12.4% 10.9%Assets as of September 30, . . . . . . . . . . . . . . . . . . . . . . . . . . . . . . . . . . . . . . . . . . . . . . . . . . . . . . $1,608 $1,183
Segment net sales to external customers in Fiscal 2009 decreased $159 million to $1,335 million from$1,494 million during Fiscal 2008, representing an 11% decrease. Unfavorable foreign currency exchangetranslation impacted net sales in Fiscal 2009 by approximately $118 million in comparison to Fiscal 2008.Consumer battery sales for Fiscal 2009 decreased to $819 million when compared to Fiscal 2008 sales of $916million, principally due to a negative foreign currency impact of $70 million coupled with a decline in zinccarbon battery sales of $32 million. The $32 million decrease in zinc carbon batteries is primarily concentrated inLatin America, as Latin American sales were down $35 million in Fiscal 2009 compared to Fiscal 2008 as aresult of a slowdown in economic conditions and inventory de-stocking at retailers mainly in Brazil. Excludingthe impact of foreign currency exchange translation, sales of alkaline batteries increased $5 million as weexperienced gains in North America of $37 million, which were offset by declines within Europe and LatinAmerica of $17 million and $15 million, respectively. The increased alkaline battery sales in North Americawere driven by an increase in market share, as consumers opt for our value proposition during the weakeningeconomic conditions in the U.S. The decreased alkaline battery sales in Europe were the result of our continuedefforts to exit from unprofitable or marginally profitable private label battery sales, as well as certain second tierbranded battery sales. We are continuing our efforts to promote profitable growth and therefore, expect tocontinue to exit certain low margin business as appropriate to create a more favorable mix of branded versusprivate label products. The decrease in Latin American alkaline battery sales was again due to the slowdown ineconomic activity coupled with inventory de-stocking at retailers mainly in Brazil. Net sales of electric shavingand grooming products in Fiscal 2009 decreased by $21 million, or 8%, primarily as a result of negative foreignexchange impacts of $19 and declines in North America of $7 million. These declines were partially offset byincreases within Europe and Latin America of $3 million and $2 million, respectively. The declines within NorthAmerica are primarily attributable to delayed inventory stocking at certain of our major customers for the 2009holiday season which in turn resulted in a delay of our product shipments that historically would have been
65

recorded during the fourth quarter of our fiscal year. The slight increases in Europe and Latin America are aresult of successful new product launches. Electric personal care sales decreased by $20 million, a decrease of9% over Fiscal 2008. Unfavorable foreign exchange translation impacted net sales by approximately $24 million.Excluding unfavorable foreign exchange, we experienced an increase of $4 million within electric personal careproducts. Europe and Latin America increased $8 million and $3 million, respectively, while North Americanelectric personal care product sales decreased $8 million. Similar to our electric shaving and grooming productssales, the decreased sales of electric personal care products within North America was a result of delayed holidayinventory stocking at certain of our customers which in turn has resulted in a delay of our product shipments thathistorically would have been recorded during the fourth quarter of our fiscal year. The increased sales withinEurope and Latin America were due to strong growth in our women’s hair care products. Net sales of portablelighting products for Fiscal 2009 decreased to $80 million as compared to sales of $100 million for Fiscal 2008.The portable lighting product sales decrease was driven by unfavorable foreign exchange impact of $5 million,coupled with declines in sales in North America, Europe and Latin America of $9 million, $3 million and $2million, respectively. The decrease across all regions was driven by softness in the portable lighting productscategory as a result of the global economic slowdown.
Segment profitability in Fiscal 2009 increased slightly to $165 million from $163 million in Fiscal 2008.Segment profitability as a percentage of net sales increased to 12.4% in Fiscal 2009 as compared with 10.9% inFiscal 2008. The increase in segment profitability during Fiscal 2009 was primarily the result of cost savingsfrom the Ningbo Exit Plan and our global realignment announced in January 2007. See “Restructuring andRelated Charges” below, as well as Note 15, Restructuring and Related Charges, of Notes to ConsolidatedFinancial Statements included in this Annual Report on Form 10-K for additional information regarding ourrestructuring and related charges. Tempering the increase in segment profitability were decreased sales duringFiscal 2009 as compared to Fiscal 2008 which was primarily driven by unfavorable foreign exchange andsoftness in certain product categories due to the global economic slowdown. In addition, as a result of ouradoption of fresh-start reporting upon emergence from Chapter 11 of the Bankruptcy Code, in accordance withSFAS 141, inventory balances were revalued as of August 30, 2009 resulting in an increase in such GlobalBatteries & Personal Care inventory balances of $27 million. As a result of the inventory revaluation, GlobalBatteries & Personal Care recognized $10 million in additional cost of goods sold in Fiscal 2009. The remaining$17 million of the inventory revaluation was recorded during the first quarter of Fiscal 2010. See “Net Sales”above for further discussion on our Fiscal 2009 sales.
Segment assets at September 30, 2009 increased to $1,608 million from $1,183 million at September 30,2008. The increase is primarily a result of the revaluation impacts of fresh-start reporting. See Note 2, VoluntaryReorganization Under Chapter 11, of Notes to Consolidated Financial Statements included in this Annual Reporton Form 10-K for additional information related to fresh-start reporting. Partially offsetting this increase in assetswas a non-cash impairment charge of certain intangible assets in Fiscal 2009 of $15 million. See Note 3(i),Significant Accounting Policies and Practices—Intangible Assets, of Notes to Consolidated Financial Statementsincluded in this Annual Report on Form 10-K for additional information regarding this impairment charge andthe amount attributable to Global Batteries & Personal Care. Goodwill and intangible assets at September 30,2009 totaled approximately $909 million and are directly a result of the revaluation impacts of fresh-startreporting. Goodwill and intangible assets at September 30, 2008 total approximately $416 million and primarilyrelate to the ROV Ltd., VARTA AG, Remington Products Company, L.L.C. (“Remington Products”) andMicrolite S.A. (“Microlite”) acquisitions.
Global Pet Supplies
2009 2008
(in millions)Net sales to external customers . . . . . . . . . . . . . . . . . . . . . . . . . . . . . . . . . . . . . . . . . . . . . . . . . . . . . $ 574 $ 599Segment profit . . . . . . . . . . . . . . . . . . . . . . . . . . . . . . . . . . . . . . . . . . . . . . . . . . . . . . . . . . . . . . . . . . $ 65 $ 69Segment profit as a % of net sales . . . . . . . . . . . . . . . . . . . . . . . . . . . . . . . . . . . . . . . . . . . . . . . . . . 11.3% 11.5%Assets as of September 30, . . . . . . . . . . . . . . . . . . . . . . . . . . . . . . . . . . . . . . . . . . . . . . . . . . . . . . . . $ 867 $ 700
66

Segment net sales to external customers in Fiscal 2009 decreased to $574 million from $599 million inFiscal 2008, representing a decrease of $25 million, or 4%. Unfavorable foreign currency exchange translationimpacted net sales in Fiscal 2009 compared to Fiscal 2008 by approximately $11 million. Worldwide aquaticsales for Fiscal 2009 decreased to $360 million when compared to sales of $398 million in Fiscal 2008. Thedecrease in worldwide aquatic sales was a result of unfavorable foreign exchange impacts of $11 million coupledwith declines of $14 million, $10 million and $3 million in the United States, Europe and the Pacific Rim,respectively. The declines in the U.S. were a result of decreased sales of large equipment, primarily aquariums,due to the slowdown in economic conditions. The declines in Europe were due to inventory de-stocking atretailers and the poor weather season, which impacted our outdoor pond product sales. The declines the PacificRim were as a result of the slowdown in economic conditions. Companion animal net sales increased to $214million in Fiscal 2009 compared to $201 million in Fiscal 2008, an increase of $13 million, or 6%. We continuedto see strong growth, and foresee further growth in Fiscal 2010, in companion animal related product sales in theU.S., driven by our Dingo brand dog treats, coupled with increased volume in Europe and the Pacific Rimassociated with the continued introductions of companion animal products.
Segment profitability in Fiscal 2009 decreased slightly to $65 million from $69 million in Fiscal 2008.Segment profitability as a percentage of sales in Fiscal 2009 also decreased slightly to 11.3% from 11.5% duringFiscal 2008. This decrease in segment profitability and profitability margin was primarily due to decreased sales,as discussed above, coupled with increases in cost of goods sold driven by higher input costs, which negativelyimpacted margins, as price increases lagged behind such cost increases. Tempering the decrease in profitabilityand profitability margin were lower operating expenses, principally selling related expenses. In addition, as aresult of our adoption of fresh-start reporting upon emergence from Chapter 11 of the Bankruptcy Code, inaccordance with SFAS 141, inventory balances were revalued as of August 30, 2009 resulting in an increase insuch Global Pet Supplies inventory balances of $19 million. As a result of the inventory revaluation, Global PetSupplies recognized $5 million in additional cost of goods sold in Fiscal 2009. The remaining $14 million of theinventory revaluation was recorded during the first quarter of Fiscal 2010.
Segment assets as of September 30, 2009 increased to $867 million from $700 million at September 30,2008. The increase is primarily a result of the revaluation impacts of fresh-start reporting. See Note 2, VoluntaryReorganization Under Chapter 11, of Notes to Consolidated Financial Statements included in this Annual Reporton Form 10-K for more information related to fresh-start reporting. Partially offsetting this increase in assets wasa non-cash impairment charge of certain intangible assets in Fiscal 2009 of $19 million. See Note 3(i),Significant Accounting Policies and Practices—Intangible Assets, of Notes to Consolidated Financial Statementsincluded in this Annual Report on Form 10-K for additional information regarding this impairment charge andthe amount attributable to Global Pet Supplies. Goodwill and intangible assets as of September 30, 2009 totalapproximately $618 million and are directly a result of the revaluation impacts of fresh-start reporting. Goodwilland intangible assets as of September 30, 2008 total approximately $447 million and primarily relate to theacquisitions of Tetra and the United Pet Group division of United.
Home and Garden Business
2009 2008
(in millions)
Net sales to external customers . . . . . . . . . . . . . . . . . . . . . . . . . . . . . . . . . . . . . . . . . . . . . . . . . . . . . $ 322 $334Segment profit . . . . . . . . . . . . . . . . . . . . . . . . . . . . . . . . . . . . . . . . . . . . . . . . . . . . . . . . . . . . . . . . . . $ 42 $ 29Segment profit as a % of net sales . . . . . . . . . . . . . . . . . . . . . . . . . . . . . . . . . . . . . . . . . . . . . . . . . . . 13.0% 8.7%Assets as of September 30, . . . . . . . . . . . . . . . . . . . . . . . . . . . . . . . . . . . . . . . . . . . . . . . . . . . . . . . . . $ 504 $290
Segment net sales to external customers of home and garden control products during Fiscal 2009 versusFiscal 2008 decreased $12 million, or 4%, primarily due to our retail customers managing their inventory levelsto unprecedented low levels, combined with such retailers ending their outdoor lawn and garden control seasonsix weeks early as compared to prior year seasons and our decision to exit certain unprofitable or marginally
67
profitable products. This decrease in sales within lawn and garden control products were partially offset byincreased sales of household insect control products, driven by increased sales to a major customer.
Segment profitability in Fiscal 2009 increased to $42 million from $29 million in Fiscal 2008. Segmentprofitability as a percentage of sales in Fiscal 2009 increased to 13.0% from 8.7% in Fiscal 2008. The increase insegment profit for Fiscal 2009 was the result of declining commodity costs associated with our lawn and gardencontrol products and the non-recurrence of a charge incurred during Fiscal 2008 of approximately $11 millionthat related to depreciation and amortization expense related to Fiscal 2007. From October 1, 2006 throughDecember 30, 2007, the Home and Garden Business was designated as discontinued operations. In accordancewith generally excepted accounting principles, while designated as discontinued operations we ceased recordingdepreciation and amortization expense associated with the assets of this business. As a result of ourreclassification of that business to a continuing operation we recorded a catch-up of depreciation andamortization expense, which totaled $14 million, for the five quarters during which this business was designatedas discontinued operations. In addition, as a result of our adoption of fresh-start reporting upon emergence fromChapter 11 of the Bankruptcy Code, in accordance with SFAS 141, inventory balances were revalued as ofAugust 30, 2009 resulting in an increase in such Home and Garden inventory balances of $3 million. As a resultof the inventory revaluation, Home and Garden recognized $1 million in additional cost of goods sold in Fiscal2009. The remaining $2 million of the inventory revaluation was recorded during the first quarter of Fiscal 2010.
Segment assets as of September 30, 2009 increased to $504 million from $290 million at September 30,2008. The increase is primarily a result of the revaluation impacts of fresh-start reporting. See Note 2, VoluntaryReorganization Under Chapter 11, of Notes to Consolidated Financial Statements included in this Annual Reporton Form 10-K for more information related to fresh-start reporting. Goodwill and intangible assets as ofSeptember 30, 2009 total approximately $419 million and are directly a result of the revaluation impacts of fresh-start reporting. Intangible assets as of September 30, 2008 total approximately $115 million and primarily relateto the acquisition of the United Industries division of United.
Corporate Expense. Our corporate expense in Fiscal 2009 decreased to $34 million from $45 million inFiscal 2008. Our corporate expense as a percentage of consolidated net sales in Fiscal 2009 decreased to 1.5%from 1.9%. The decrease in expense is partially a result of the non-recurrence of a $9 million charge incurred inFiscal 2008 to write off professional fees incurred in connection with the termination of substantive negotiationswith a potential purchaser of our Global Pet Supplies business.
Restructuring and Related Charges. See Note 14, Restructuring and Related Charges of Notes toConsolidated Financial Statements, included in this Annual Report on Form 10-K for additional informationregarding our restructuring and related charges.
68

The following table summarizes all restructuring and related charges we incurred in 2009 and 2008(in millions):
2009 2008
Costs included in cost of goods sold:United & Tetra integration:
Other associated costs . . . . . . . . . . . . . . . . . . . . . . . . . . . . . . . . . . . . . . — 0.3European initiatives:
Termination benefits . . . . . . . . . . . . . . . . . . . . . . . . . . . . . . . . . . . . . . . — (0.8)Other associated costs . . . . . . . . . . . . . . . . . . . . . . . . . . . . . . . . . . . . . . — 0.1
Latin America initiatives:Termination benefits . . . . . . . . . . . . . . . . . . . . . . . . . . . . . . . . . . . . . . . 0.2 —Other associated costs . . . . . . . . . . . . . . . . . . . . . . . . . . . . . . . . . . . . . . — 0.3
Global Realignment initiatives:Termination benefits . . . . . . . . . . . . . . . . . . . . . . . . . . . . . . . . . . . . . . . 0.3 0.1Other associated costs . . . . . . . . . . . . . . . . . . . . . . . . . . . . . . . . . . . . . . 0.9 0.1
Ningbo Exit Plan:Termination benefits . . . . . . . . . . . . . . . . . . . . . . . . . . . . . . . . . . . . . . . 0.9 1.2Other associated costs . . . . . . . . . . . . . . . . . . . . . . . . . . . . . . . . . . . . . . 8.6 15.2
Global Cost Reduction Initiatives:Termination benefits . . . . . . . . . . . . . . . . . . . . . . . . . . . . . . . . . . . . . . . 0.2 —Other associated costs . . . . . . . . . . . . . . . . . . . . . . . . . . . . . . . . . . . . . . 2.3 —
Total included in cost of goods sold . . . . . . . . . . . . . . . . . . . . . . . . . . . . . . . $13.4 $16.5
Costs included in operating expenses:United & Tetra integration:
Termination benefits . . . . . . . . . . . . . . . . . . . . . . . . . . . . . . . . . . . . . . . $ 2.3 $ 2.0Other associated costs . . . . . . . . . . . . . . . . . . . . . . . . . . . . . . . . . . . . . . 0.3 0.9
Latin America initiatives:Termination benefits . . . . . . . . . . . . . . . . . . . . . . . . . . . . . . . . . . . . . . . — 0.1
Global Realignment:Termination benefits . . . . . . . . . . . . . . . . . . . . . . . . . . . . . . . . . . . . . . . 7.1 12.3Other associated costs . . . . . . . . . . . . . . . . . . . . . . . . . . . . . . . . . . . . . . 3.5 7.5
Ningbo Exit Plan:Other associated costs . . . . . . . . . . . . . . . . . . . . . . . . . . . . . . . . . . . . . . 1.3 —
Global Cost Reduction Initiatives:Termination benefits . . . . . . . . . . . . . . . . . . . . . . . . . . . . . . . . . . . . . . . 6.6 —Other associated costs . . . . . . . . . . . . . . . . . . . . . . . . . . . . . . . . . . . . . . 11.3 —
Total included in operating expenses . . . . . . . . . . . . . . . . . . . . . . . . . . . . . . $32.4 $22.8
Total restructuring and related charges . . . . . . . . . . . . . . . . . . . . . . . . . . . . . $45.8 $39.3
In connection with the acquisitions of United and Tetra in Fiscal 2005, we implemented a series ofinitiatives to optimize the global resources of the combined companies. These initiatives included: integrating allof United’s home and garden administrative services, sales and customer service functions into our operations inMadison, Wisconsin; converting all information systems to SAP; consolidating United’s home and gardenmanufacturing and distribution locations in North America; rationalizing the North America supply chain; andconsolidating administrative, manufacturing and distribution facilities at our Global Pet Supplies business. Inaddition, certain corporate functions were shifted to our global headquarters in Atlanta, Georgia. We haverecorded approximately $(1) million of restructuring and related charges during Fiscal 2009, to adjust priorestimates and eliminate the accrual, and no charges during Fiscal 2008.
69

Effective October 1, 2006, we suspended initiatives to integrate the activities of the Home and GardenBusiness into our operations in Madison, Wisconsin. We recorded $1 million of restructuring and related chargesduring Fiscal 2009 and de minimis restructuring and related charges in Fiscal 2008 in connection with theintegration of the United home and garden business.
Integration activities within Global Pet Supplies were substantially complete as of September 30, 2007.Global Pet Supplies integration activities consisted primarily of the rationalization of manufacturing facilities andthe optimization of our distribution network. As a result of these integration initiatives, two pet supplies facilitieswere closed in 2005, one in Brea, California and the other in Hazleton, Pennsylvania, one pet supply facility wasclosed in 2006, in Hauppauge, New York and one pet supply facility was closed in 2007 in Moorpark, California.We recorded approximately $2 million and $3 million of pretax restructuring and related charges during Fiscal2009 and Fiscal 2008, respectively.
We have implemented a series of initiatives in the Global Batteries & Personal Care segment in Europe toreduce operating costs and rationalize our manufacturing structure (the “European Initiatives”). In connectionwith the European Initiatives, which are substantially complete, we implemented a series of initiatives within theGlobal Batteries & Personal Care segment in Europe to reduce operating costs and rationalize our manufacturingstructure. These initiatives include the relocation of certain operations at our Ellwangen, Germany packagingcenter to our Dischingen, Germany battery plant, transferring private label battery production at our Dischingen,Germany battery plant to our manufacturing facility in China and restructuring Europe’s sales, marketing andsupport functions. In connection with the European Initiatives, we recorded de minimis pretax restructuring andrelated charges in Fiscal 2009 and approximately $(1) million in pretax restructuring and related charges,representing the true-up of reserve balances, during Fiscal 2008.
We have implemented a series of initiatives within our Global Batteries & Personal Care business segmentin Latin America to reduce operating costs (the “Latin American Initiatives”). In connection with the LatinAmerican Initiatives, which are substantially complete, we implemented a series of initiatives within the GlobalBatteries & Personal Care segment in Latin America to reduce operating costs. The initiatives include thereduction of certain manufacturing operations in Brazil and the restructuring of management, sales, marketingand support functions. We recorded de minimis pretax restructuring and related charges during both Fiscal 2009and Fiscal 2008 in connection with the Latin American Initiatives.
In Fiscal 2007, we began managing our business in three vertically integrated, product-focused reportingsegments; Global Batteries & Personal Care, Global Pet Supplies and the Home and Garden Business. As part ofthis realignment, our global operations organization, which had previously been included in corporate expense,consisting of research and development, manufacturing management, global purchasing, quality operations andinbound supply chain, is now included in each of the operating segments. See also Note 12, Segment Results, ofNotes to Consolidated Financial Statements included in this Annual Report on Form 10-K for additionaldiscussion on the realignment of our operating segments. In connection with these changes we undertook anumber of cost reduction initiatives, primarily headcount reductions, at the corporate and operating segmentlevels (the “Global Realignment Initiatives”). We recorded approximately $11 million and $20 million of pretaxrestructuring and related charges during Fiscal 2009 and Fiscal 2008, respectively, in connection with the GlobalRealignment Initiatives. Costs associated with these initiatives relate primarily to severance.
During Fiscal 2008, we implemented an initiative within the Global Batteries & Personal Care segment toreduce operating costs and rationalize our manufacturing structure. These initiatives, which are substantiallycomplete, include the exit of our battery manufacturing facility in Ningbo Baowang China (“Ningbo”) (the“Ningbo Exit Plan”).
During Fiscal 2009, we implemented a series of initiatives within the Global Batteries & Personal Caresegment and the Global Pet Supplies segment to reduce operating costs as well as evaluate our opportunities toimprove our capital structure (the “Global Cost Reduction Initiatives”). These initiatives include headcount
70

reductions within all our segments and the exit of certain facilities in the U.S. related to the Global Pet Suppliessegment. These initiatives also included consultation, legal and accounting fees related to the evaluation of ourcapital structure.
Goodwill and Intangibles Impairment. ASC 350 requires companies to test goodwill and indefinite-livedintangible assets for impairment annually, or more often if an event or circumstance indicates that an impairmentloss may have been incurred. In Fiscal 2009 and 2008, we tested our goodwill and indefinite-lived intangibleassets. As a result of this testing, we recorded a non-cash pretax impairment charge of $34 million and $861million in Fiscal 2009 and Fiscal 2008, respectively. The $34 million non-cash pretax impairment chargeincurred in Fiscal 2009 reflects trade name intangible asset impairments of the following: $18 million related toGlobal Pet Supplies; $15 million related to the Global Batteries and Personal Care segment; and $1 millionrelated to the Home and Garden Business. The $861 million non-cash pretax impairment charge incurred inFiscal 2008 reflects $602 million related to the impairment of goodwill and $265 million related to theimpairment of trade name intangible assets. Of the $602 million goodwill impairment; $426 million wasassociated with our Global Pet Supplies segment, $160 million was associated with the Home and GardenBusiness and $16 million was associated with our Global Batteries and Personal Care segment. Of the $265million trade name intangible assets impairment; $98 million was within our Global Pet Supplies segment, $86million was within our Global Batteries and Personal Care segment and $81 million was within the Home andGarden segment. See Note 3(i), Significant Accounting Policies and Practices—Intangible Assets, of Notes toConsolidated Financial Statements included in this Annual Report on Form 10-K for further details on theseimpairment charges.
Interest Expense. Interest expense in Fiscal 2009 decreased to $190 million from $229 million in Fiscal2008. The decrease in Fiscal 2009 is primarily due to ceasing the accrual of interest on Old Spectrum’s SeniorSubordinated Notes, partially offset by the accrual of the default interest on our U.S. Dollar Term B Loan andEuro facility and ineffectiveness related to interest rate derivative contracts. Contractual interest not accrued onthe Senior Subordinated Notes during Fiscal 2009 was $56 million. See Liquidity and Capital Resources—DebtFinancing Activities and Note 8, Debt, of Notes to Consolidated Financial Statements included in this AnnualReport on Form 10-K for additional information regarding our outstanding debt.
Reorganization Items. During Fiscal 2009, Old Spectrum, in connection with our reorganization underChapter 11 of the Bankruptcy Code, recorded Reorganization items expense (income), net, which represents again of approximately $(1,143) million. Reorganization items expense (income), net included the following:(i) gain on cancellation of debt of $(147) million; (ii) gains in connection with fresh-start reporting adjustmentsof $(1,088) million; (iii) legal and professional fees of $75 million; (iv) write off deferred financing costs relatedto the Senior Subordinated Notes of $11 million; and (v) a provision for rejected leases of $6 million. DuringFiscal 2009, New Spectrum recorded Reorganization items expense (income), net which represents expense of $4million related to professional fees. See Note 2, Voluntary Reorganization Under Chapter 11, of Notes toConsolidated Financial Statements included in this Annual Report on Form 10-K for more information related toour reorganization under Chapter 11 of the Bankruptcy Code.
Income Taxes. Our effective tax rate on losses from continuing operations is approximately 2.0% for OldSpectrum and (256)% for New Spectrum during Fiscal 2009. Our effective tax rate on income from continuingoperations was approximately 1.0% for Fiscal 2008. The primary drivers of the change in our effective rate forNew Spectrum for Fiscal 2009 as compared to Fiscal 2008 relate to residual income taxes recorded on the actualand deemed distribution of foreign earnings in Fiscal 2009. The change in the valuation allowance related tothese dividends was recorded against goodwill as an adjustment for release of valuation allowance. The primarydrivers for Fiscal 2008 include tax expense recorded for an increase in the valuation allowance associated withour net U.S. deferred tax asset and the tax impact of the impairment charges.
As of September 30, 2009, we had U.S. federal and state net operating loss carryforwards of approximately$598 and $643 million, respectively, which will expire between 2010 and 2029, and we have foreign net
71

operating loss carryforwards of approximately $138 million, which will expire beginning in 2010. Certain of theforeign net operating losses have indefinite carryforward periods. As of September 30, 2008 we had U.S. federal,foreign and state net operating loss carryforwards of approximately $960, $854 and $142 million, respectively,which, at that time, were scheduled to expire between 2009 and 2028. Certain of the foreign net operating losseshave indefinite carryforward periods. We are subject to an annual limitation on the use of our net operating lossesthat arose prior to its emergence from bankruptcy. We have had multiple changes of ownership, as defined underInternal Revenue Code (“IRC”) Section 382, that subject us to U.S. federal and state net operating losses andother tax attributes to certain limitations. The annual limitation is based on a number of factors including thevalue of our stock (as defined for tax purposes) on the date of the ownership change, our net unrealized built ingain position on that date, the occurrence of realized built in gains in years subsequent to the ownership change,and the effects of subsequent ownership changes (as defined for tax purposes) if any. Based on these factors, weproject that $149 million of the total U.S. federal and $311 million of the state net operating loss will expireunused. We have provided a full valuation allowance against the deferred tax asset.
We recognized income tax expense of approximately $124 million related to the gain on the settlement ofliabilities subject to compromise and the modification of the senior secured credit facility in the period fromOctober 1, 2008 through August 30, 2009. This adjustment, net of a change in valuation allowance is embeddedin Reorganization items expense (income), net. We intend to reduce our net operating loss carryforwards for anycancellation of debt income in accordance with IRC Section 108 that arises from our emergence from Chapter 11of the Bankruptcy Code under IRC Section 382 (1)(6).
The ultimate realization of our deferred tax assets depends on our ability to generate sufficient taxableincome of the appropriate character in the future and in the appropriate taxing jurisdictions. We establishvaluation allowances for deferred tax assets when we estimate it is more likely than not that the tax assets willnot be realized. We base these estimates on projections of future income, including tax planning strategies, incertain jurisdictions. Changes in industry conditions and other economic conditions may impact our ability toproject future income. ASC 740 requires the establishment of a valuation allowance when it is more likely thannot that some portion or all of the deferred tax assets will not be realized. In accordance with ASC 740, weperiodically assess the likelihood that our deferred tax assets will be realized and determine if adjustments to thevaluation allowance are appropriate. In 2009, Old Spectrum recorded a reduction in the valuation allowanceagainst the U.S. net deferred tax asset exclusive of indefinite lived intangible assets primarily as a result ofutilizing net operating losses to offset the gain on settlement of liabilities subject to compromise and the impactof the fresh start reporting adjustments. New Spectrum recorded a reduction in the domestic valuation allowanceof $47 million as a reduction to goodwill as a result of the recognition of pre-fresh start deferred tax assets tooffset New Spectrum income. Our total valuation allowance established for the tax benefit of deferred tax assetsthat may not be realized was approximately $133 million at September 30, 2009. Of this amount, approximately$109 million relates to U.S. net deferred tax assets and approximately $24 million related to foreign net deferredtax assets. We recorded a non-cash deferred income tax charge of approximately $257 million related to avaluation allowance against U.S. net deferred tax assets during Fiscal 2008. Included in the total is a non-cashdeferred income tax charge of approximately $4 million related to an increase in the valuation allowance againstour net deferred tax assets in China in connection with the Ningbo Exit Plan. We also determined that a valuationallowance was no longer required in Brazil and thus recorded a $31 million benefit to reverse the valuationallowance previously established. Our total valuation allowance, established for the tax benefit of deferred taxassets that may not be realized, was approximately $496 million at September 30, 2008. Of this amount,approximately $468 million related to U.S. net deferred tax assets and approximately $28 million related toforeign net deferred tax assets.
ASC 350 requires companies to test goodwill and indefinite-lived intangible assets for impairment annually,or more often if an event or circumstance indicates that an impairment loss may have been incurred. DuringFiscal 2009 and Fiscal 2008, we recorded non- cash pretax impairment charges of approximately $34 million and$861 million, respectively. The tax impact, prior to consideration of the current year valuation allowance, of theimpairment charges was a deferred tax benefit of approximately $13 million and $143 million, respectively. See
72

“Goodwill and Intangibles Impairment” above, as well as Note 3(c), Significant Accounting Policies andPractices—Intangible Assets, of Notes to Consolidated Financial Statements included in this Annual Report onForm 10-K for additional information regarding these non-cash impairment charges.
ASC 740, which clarifies the accounting for uncertainty in tax positions, requires that we recognize in ourfinancial statements the impact of a tax position, if that position is more likely than not of being sustained onaudit, based on the technical merits of the position. We adopted this provision on October 1, 2007. As a result ofthe adoption, we recognized no cumulative effect adjustment. As of September 30, 2009, August 30, 2009 andSeptember 30, 2008, the total amount of unrecognized tax benefits that, if recognized, would affect the effectiveincome tax rate in future periods is $8 million, $8 million and $7 million, respectively. See Note 8, IncomeTaxes, of Notes to Consolidated Financial Statements included in this Annual Report on Form 10-K foradditional information.
Discontinued Operations. On November 5, 2008, the board of directors of Old Spectrum committed to theshutdown of the growing products portion of the Home and Garden Business, which includes the manufacturingand marketing of fertilizers, enriched soils, mulch and grass seed, following an evaluation of the historical lack ofprofitability and the projected input costs and significant working capital demands for the growing productportion of the Home and Garden Business during Fiscal 2009. We believe the shutdown is consistent with whatwe have done in other areas of our business to eliminate unprofitable products from our portfolio. We completedthe shutdown of the growing products portion of the Home and Garden Business during the second quarter ofFiscal 2009. Accordingly, the presentation herein of the results of continuing operations excludes the growingproducts portion of the Home and Garden Business for all periods presented. See Note 9, DiscontinuedOperations, of Notes to Consolidated Financial Statements included in this Annual Report on Form 10-K forfurther details on the disposal of the growing products portion of the Home and Garden Business. The followingamounts related to the growing products portion of the Home and Garden Business have been segregated fromcontinuing operations and are reflected as discontinued operations during Fiscal 2009 and Fiscal 2008,respectively (in millions):
2009 2008
Net sales . . . . . . . . . . . . . . . . . . . . . . . . . . . . . . . . . . . . . . . . . . . . . . . . . . . . . . . . . . . $ 31.3 $261.4
Loss from discontinued operations before income taxes . . . . . . . . . . . . . . . . . . . . . . $(90.9) $ (27.1)Provision for income tax benefit . . . . . . . . . . . . . . . . . . . . . . . . . . . . . . . . . . . . . . . . (4.5) (2.1)
Loss from discontinued operations, net of tax . . . . . . . . . . . . . . . . . . . . . . . . . . . . . . $(86.4) $ (25.0)
In accordance with ASC 360, long-lived assets to be disposed of are recorded at the lower of their carryingvalue or fair value less costs to sell. During Fiscal 2008, we recorded a non-cash pretax charge of $6 million indiscontinued operations to reduce the carrying value of intangible assets related to the growing products portionof the Home and Garden Business in order to reflect the estimated fair value of this business.
On November 1, 2007, we sold the Canadian division of the Home and Garden Business, which operatedunder the name Nu-Gro, to a new company formed by RoyCap Merchant Banking Group and Clarke Inc. Cashproceeds received at closing, net of selling expenses, totaled approximately $15 million and was used to reduceoutstanding debt. These proceeds are included in net cash provided by investing activities of discontinuedoperations in our Consolidated Statements of Cash Flows included in this Annual Report on Form 10-K. OnFebruary 5, 2008, we finalized the contractual working capital adjustment in connection with this sale whichincreased our received proceeds by approximately $1 million. As a result of the finalization of the contractualworking capital adjustments we recorded a loss on disposal of approximately $1 million, net of tax benefit.Accordingly, the presentation herein of the results of continuing operations excludes the Canadian division of theHome and Garden Business for all periods presented. See Note 9, Discontinued Operations, of Notes toConsolidated Financial Statements included in this Annual Report on Form 10-K for further details on the sale ofthe Canadian division of the Home and Garden Business.
73

The following amounts related to the Canadian division of the Home and Garden Business have beensegregated from continuing operations and are reflected as discontinued operations during Fiscal 2008:
2008(A)
Net sales . . . . . . . . . . . . . . . . . . . . . . . . . . . . . . . . . . . . . . . . . . . . . . . . . . . . . . . . . . . . . . . . . . . $ 4.7
Loss from discontinued operations before income taxes . . . . . . . . . . . . . . . . . . . . . . . . . . . . . . $(1.9)Provision for income tax benefit . . . . . . . . . . . . . . . . . . . . . . . . . . . . . . . . . . . . . . . . . . . . . . . . (0.7)
Loss from discontinued operations, net of tax . . . . . . . . . . . . . . . . . . . . . . . . . . . . . . . . . . . . . . $(1.2)
(A) Fiscal 2008 represents results from discontinued operations from October 1, 2007 through November 1,2007, the date of sale. Included in the Fiscal 2008 loss is a loss on disposal of approximately $1 million, netof tax benefit.
Liquidity and Capital Resources
Operating Activities. Net cash provided by operating activities was $57 million during Fiscal 2010compared to $77 million during Fiscal 2009. Cash provided by operating activities from continuing operationswas $69 million during Fiscal 2010 compared to $98 million during Fiscal 2009. The $29 million decrease incash provided by operating activities was primarily due to payments of $47 million related to professional feesfrom our Bankruptcy Filing and $25 million of payments related to the Merger. This was partially offset by anincrease in income from continuing operations after adjusting for non-cash items of $40 million in Fiscal 2010compared to Fiscal 2009. Cash used by operating activities from discontinued operations was $11 million inFiscal 2010 compared to a use of $22 million in Fiscal 2009. The operating activities of discontinued operationswere related to the growing products portion of the Home and Garden Business. See “Discontinued Operations,”above, as well as Note 9, Discontinued Operations, of Notes to Consolidated Financial Statements included inthis Annual Report on Form 10-K for further details on the disposal of the growing products portion of the Homeand Garden Business.
We expect to fund our cash requirements, including capital expenditures, interest and principal paymentsdue in Fiscal 2010 through a combination of cash on hand and cash flows from operations and availableborrowings under our ABL Revolving Credit Facility. Going forward our ability to satisfy financial and othercovenants in our senior credit agreements and senior subordinated indenture and to make scheduled payments orprepayments on our debt and other financial obligations will depend on our future financial and operatingperformance. There can be no assurances that our business will generate sufficient cash flows from operations orthat future borrowings under the ABL Revolving Credit Facility will be available in an amount sufficient tosatisfy our debt maturities or to fund our other liquidity needs. In addition, the current economic crisis could havea further negative impact on our financial position, results of operations or cash flows. See Item 1A. RiskFactors, for further discussion of the risks associated with our ability to service all of our existing indebtedness,our ability to maintain compliance with financial and other covenants related to our indebtedness and the impactof the current economic crisis.
Investing Activities. Net cash used by investing activities was $43 million for Fiscal 2010. For Fiscal 2009investing activities used cash of $20 million. The $23 million increase in cash used in Fiscal 2010 was primarilydue to a $30 million increase of capital expenditures during Fiscal 2010 and payments related to the RussellHobbs Merger, net of cash acquired from Russell Hobbs. These items were partially offset by $9 million of cashpaid in Fiscal 2009 related to performance fees from the Microlite acquisition.
Debt Financing Activities
In connection with the Merger, we (i) entered into a new senior secured term loan pursuant to a new seniorcredit agreement (the “Senior Credit Agreement”) consisting of the $750 million Term Loan, (ii) issued $750
74

million in aggregate principal amount of 9.5% Notes and (iii) entered into the $300 million ABL RevolvingCredit Facility. The proceeds from the Senior Secured Facilities were used to repay our then-existing senior termcredit facility (the “Prior Term Facility”) and our then-existing asset based revolving loan facility, to pay fees andexpenses in connection with the refinancing and for general corporate purposes.
The 9.5% Notes and 12% Notes were issued by Spectrum Brands. SB/RH Holdings, LLC, a wholly-ownedsubsidiary of SB Holdings, and the wholly owned domestic subsidiaries of Spectrum Brands are the guarantorsunder the 9.5% Notes. The wholly owned domestic subsidiaries of Spectrum Brands are the guarantors under the12% Notes. SB Holdings is not an issuer or guarantor of the 9.5% Notes or the 12% Notes. SB Holdings is alsonot a borrower or guarantor under the Company’s Term Loan or the ABL Revolving Credit Facility. SpectrumBrands is the borrower under the Term Loan and its wholly owned domestic subsidiaries along with SB/RHHoldings, LLC are the guarantors under that facility. Spectrum Brands and its wholly owned domesticsubsidiaries are the borrowers under the ABL Revolving Credit Facility and SB/RH Holdings, LLC is a guarantorof that facility.
Senior Term Credit Facility
The Term Loan has a maturity date of June 16, 2016. Subject to certain mandatory prepayment events, theTerm Loan is subject to repayment according to a scheduled amortization, with the final payment of all amountsoutstanding, plus accrued and unpaid interest, due at maturity. Among other things, the Term Loan provides for aminimum Eurodollar interest rate floor of 1.5% and interest spreads over market rates of 6.5%.
The Senior Credit Agreement contains financial covenants with respect to debt, including, but not limited to,a maximum leverage ratio and a minimum interest coverage ratio, which covenants, pursuant to their terms,become more restrictive over time. In addition, the Senior Credit Agreement contains customary restrictivecovenants, including, but not limited to, restrictions on our ability to incur additional indebtedness, create liens,make investments or specified payments, give guarantees, pay dividends, make capital expenditures and mergeor acquire or sell assets. Pursuant to a guarantee and collateral agreement, we and our domestic subsidiaries haveguaranteed their respective obligations under the Senior Credit Agreement and related loan documents and havepledged substantially all of their respective assets to secure such obligations. The Senior Credit Agreement alsoprovides for customary events of default, including payment defaults and cross-defaults on other materialindebtedness.
The Term Loan was issued at a 2.00% discount and was recorded net of the $15 million amount incurred.The discount will be amortized as an adjustment to the carrying value of principal with a corresponding charge tointerest expense over the remaining life of the Senior Credit Agreement. During Fiscal 2010, we recorded $26million of fees in connection with the Senior Credit Agreement. The fees are classified as Debt issuance costsand will be amortized as an adjustment to interest expense over the remaining life of the Senior CreditAgreement.
At September 30, 2010, the aggregate amount outstanding under the Term Loan totaled $750 million.
At September 30, 2009, the aggregate amount outstanding under the Prior Term Facility totaled aU.S. Dollar equivalent of $1,391 million, consisting of principal amounts of $973 million under the U.S. DollarTerm B Loan, €255 million under the Euro Facility ($372 million at September 30, 2009) as well as letters ofcredit outstanding under the L/C Facility totaling $46 million.
At September 30, 2010, we were in compliance with all covenants under the Senior Credit Agreement.
9.5% Notes
At September 30, 2010, we had outstanding principal of $750 million under the 9.5% Notes maturingJune 15, 2018.
75

We may redeem all or a part of the 9.5% Notes, upon not less than 30 or more than 60 days notice atspecified redemption prices. Further, the indenture governing the 9.5% Notes (the “2018 Indenture”) requires usto make an offer, in cash, to repurchase all or a portion of the applicable outstanding notes for a specifiedredemption price, including a redemption premium, upon the occurrence of a change of control, as defined insuch indenture.
The 2018 Indenture contains customary covenants that limit, among other things, the incurrence ofadditional indebtedness, payment of dividends on or redemption or repurchase of equity interests, the making ofcertain investments, expansion into unrelated businesses, creation of liens on assets, merger or consolidation withanother company, transfer or sale of all or substantially all assets, and transactions with affiliates.
In addition, the 2018 Indenture provides for customary events of default, including failure to make requiredpayments, failure to comply with certain agreements or covenants, failure to make payments on or acceleration ofcertain other indebtedness, and certain events of bankruptcy and insolvency. Events of default under the 2018Indenture arising from certain events of bankruptcy or insolvency will automatically cause the acceleration of theamounts due under the 9.5% Notes. If any other event of default under the 2018 Indenture occurs and iscontinuing, the trustee for the 2018 Indenture or the registered holders of at least 25% in the then aggregateoutstanding principal amount of the 9.5% Notes may declare the acceleration of the amounts due under thosenotes.
At September 30, 2010, we were in compliance with all covenants under the 2018 Indenture.
The 9.5% Notes were issued at a 1.37% discount and were recorded net of the $10 million amount incurred.The discount will be amortized as an adjustment to the carrying value of principal with a corresponding charge tointerest expense over the remaining life of the 9.5% Notes. During Fiscal 2010, we recorded $21 million of feesin connection with the issuance of the 9.5% Notes. The fees are classified as Debt issuance costs and will beamortized as an adjustment to interest expense over the remaining life of the 9.5% Notes.
12% Notes
On August 28, 2009, in connection with emergence from the voluntary reorganization under Chapter 11 andpursuant to the Plan, we issued $218 million in aggregate principal amount of 12% Notes maturing August 28,2019. Semiannually, at our option, we may elect to pay interest on the 12% Notes in cash or as payment in kind,or “PIK”. PIK interest would be added to principal upon the relevant semi-annual interest payment date. Underthe Prior Term Facility, we agreed to make interest payments on the 12% Notes through PIK for the first threesemi-annual interest payment periods. As a result of the refinancing of the Prior Term Facility we are no longerrequired to make interest payments as payment in kind after the semi-annual interest payment date of August 28,2010. Effective with the payment date of August 28, 2010 we gave notice to the trustee that the interest paymentdue February 28, 2011 would be made in cash. During Fiscal 2010, we reclassified $27 million of accruedinterest from Other long term liabilities to principal in connection with the PIK provision of the 12% Notes.
We may redeem all or a part of the 12% Notes, upon not less than 30 or more than 60 days notice, beginningAugust 28, 2012 at specified redemption prices. Further, the indenture governing the 12% Notes requires us tomake an offer, in cash, to repurchase all or a portion of the applicable outstanding notes for a specifiedredemption price, including a redemption premium, upon the occurrence of a change of control, as defined insuch indenture.
At September 30, 2010 and September 30, 2009, we had outstanding principal of $245 million and $218million, respectively, under the 12% Notes.
The indenture governing the 12% Notes (the “2019 Indenture”), contains customary covenants that limit,among other things, the incurrence of additional indebtedness, payment of dividends on or redemption orrepurchase of equity interests, the making of certain investments, expansion into unrelated businesses, creation of
76

liens on assets, merger or consolidation with another company, transfer or sale of all or substantially all assets,and transactions with affiliates.
In addition, the 2019 Indenture provides for customary events of default, including failure to make requiredpayments, failure to comply with certain agreements or covenants, failure to make payments on or acceleration ofcertain other indebtedness, and certain events of bankruptcy and insolvency. Events of default under theindenture arising from certain events of bankruptcy or insolvency will automatically cause the acceleration of theamounts due under the 12% Notes. If any other event of default under the 2019 Indenture occurs and iscontinuing, the trustee for the indenture or the registered holders of at least 25% in the then aggregateoutstanding principal amount of the 12% Notes may declare the acceleration of the amounts due under thosenotes.
At September 30, 2010, we were in compliance with all covenants under the 12% Notes. We, however, aresubject to certain limitations as a result of our Fixed Charge Coverage Ratio under the 2019 Indenture beingbelow 2:1. Until the test is satisfied, we and certain of our subsidiaries are limited in our ability to makesignificant acquisitions or incur significant additional senior credit facility debt beyond the Senior CreditFacilities. We do not expect our inability to satisfy the Fixed Charge Coverage Ratio test to impair our ability toprovide adequate liquidity to meet the short-term and long-term liquidity requirements of our existing businesses,although no assurance can be given in this regard.
In connection with the Merger, we obtained the consent of the note holders to certain amendments to the2019 Indenture (collectively, the “Supplemental Indenture”). The Supplemental Indenture became effective uponthe closing of the Merger. Among other things, the Supplemental Indenture amended the definition of change incontrol to exclude Harbinger Master Fund and Harbinger Capital Partners Special Situations Fund, L.P.(“Harbinger Special Fund”) and, together with Harbinger Master Fund, the “HCP Funds”) and GlobalOpportunities Breakaway Ltd. (together with the HCP Funds, the “Harbinger Parties”), and their affiliates,including Harbinger Group Inc., and increased the Company’s ability to incur indebtedness up to $1,850 million.
During Fiscal 2010 we recorded $3 million of fees in connection with the consent. The fees are classified asDebt issuance costs and will be amortized as an adjustment to interest expense over the remaining life of the 12%Notes effective with the closing of the Merger.
ABL Revolving Credit Facility
The ABL Revolving Credit Facility is governed by a credit agreement (the “ABL Credit Agreement”) withBank of America as administrative agent (the “Agent”). The ABL Revolving Credit Facility consists of revolvingloans (the “Revolving Loans”), with a portion available for letters of credit and a portion available as swing lineloans, in each case subject to the terms and limits described therein.
The Revolving Loans may be drawn, repaid and reborrowed without premium or penalty. The proceeds ofborrowings under the ABL Revolving Credit Facility are to be used for costs, expenses and fees in connectionwith the ABL Revolving Credit Facility, for working capital requirements of us and our subsidiaries’,restructuring costs, and other general corporate purposes.
The ABL Revolving Credit Facility carries an interest rate, at our option, which is subject to change basedon availability under the facility, of either: (a) the base rate plus currently 2.75% per annum or (b) the reserve-adjusted LIBOR rate (the “Eurodollar Rate”) plus currently 3.75% per annum. No amortization will be requiredwith respect to the ABL Revolving Credit Facility. The ABL Revolving Credit Facility will mature on June 16,2014.
The ABL Credit Agreement contains various representations and warranties and covenants, including,without limitation, enhanced collateral reporting, and a maximum fixed charge coverage ratio. The ABL Credit
77

Agreement also provides for customary events of default, including payment defaults and cross-defaults on othermaterial indebtedness.
At September 30, 2010, we were in compliance with all covenants under the ABL Credit Agreement.
During Fiscal 2010 we recorded $10 million of fees in connection with the ABL Revolving Credit Facility.The fees are classified as Debt issuance costs and will be amortized as an adjustment to interest expense over theremaining life of the ABL Revolving Credit Facility.
As a result of borrowings and payments under the ABL Revolving Credit Facility at September 30, 2010,we had aggregate borrowing availability of approximately $225 million, net of lender reserves of $29 million.
At September 30, 2010, we had an aggregate amount outstanding under the ABL Revolving Credit Facilityof $37 million for outstanding letters of credit of $37 million.
At September 30, 2009, we had an aggregate amount outstanding under our then-existing asset basedrevolving loan facility of $84 million which included a supplemental loan of $45 million and $6 million inoutstanding letters of credit.
Interest Payments and Fees
In addition to principal payments on our Senior Credit Facilities, we have annual interest paymentobligations of approximately $71 million in the aggregate under our 9.5% Notes and annual interest paymentobligations of approximately $29 million in the aggregate under our 12% Notes. We also incur interest on ourborrowings under the Senior Credit Facilities and such interest would increase borrowings under the ABLRevolving Credit Facility if cash were not otherwise available for such payments. Interest on the 9.5% Notes andinterest on the 12% Notes is payable semi-annually in arrears and interest under the Senior Credit Facilities ispayable on various interest payment dates as provided in the Senior Credit Agreement and the ABL CreditAgreement. Interest is payable in cash, except that interest under the 12% Notes is required to be paid byincreasing the aggregate principal amount due under the subject notes unless we elect to make such payments incash. Effective with the payment date of August 28, 2010, we elected to make the semi-annual interest paymentscheduled for February 28, 2011 in cash. Thereafter, we may make the semi-annual interest payments for the12% Notes either in cash or by further increasing the aggregate principal amount due under the notes subject tocertain conditions. Based on amounts currently outstanding under the Senior Credit Facilities, and using marketinterest rates and foreign exchange rates in effect at September 30, 2010, we estimate annual interest payments ofapproximately $61 million in the aggregate under our Senior Credit Facilities would be required assuming nofurther principal payments were to occur and excluding any payments associated with outstanding interest rateswaps. We are required to pay certain fees in connection with the Senior Credit Facilities. Such fees include aquarterly commitment fee of up to 0.75% on the unused portion of the ABL Revolving Credit Facility and certainadditional fees with respect to the letter of credit subfacility under the ABL Revolving Credit Facility.
Equity Financing Activities. During Fiscal 2010, we granted approximately 0.9 million shares of restrictedstock. Of these grants, 0.3 million restricted stock units were granted in conjunction with the Merger and aretime-based and vest over a one year period. The remaining 0.6 million shares are restricted stock grants primarilyvest over a two year period. The total market value of the restricted shares on the date of the grant wasapproximately $23 million. During Fiscal 2009, Old Spectrum granted approximately 0.2 million shares ofrestricted stock. Of these grants, approximately 18% of the shares were time-based and vest on a pro rata basisover a three year period and 82% of the shares were performance-based and vest upon achievement of certainperformance goals. All vesting dates were subject to the recipient’s continued employment with us. The totalmarket value of the restricted stock on the date of the grant was approximately $0.1 million which has beenrecorded as unearned restricted stock compensation. On the Effective Date, all of the existing common stock ofOld Spectrum was extinguished and deemed cancelled. Subsequent to September 30, 2009, we granted an
78

aggregate of approximately 0.6 million shares of restricted common stock of New Spectrum to certain employeesand non-employee directors. All such shares are subject to time-based vesting. All vesting dates are subject to therecipient’s continued employment, or service as a director, with us.
Off-Balance Sheet Arrangements
We do not have any off-balance sheet arrangements that have or are reasonably likely to have a current orfuture effect on our financial condition, changes in financial condition, revenues or expenses, results ofoperations, liquidity, capital expenditures or capital resources that are material to investors.
Contractual Obligations & Other Commercial Commitments
Contractual Obligations
The following table summarizes our contractual obligations as of September 30, 2010 and the effect suchobligations are expected to have on our liquidity and cash flow in future periods. The table excludes otherobligations we have reflected on our Consolidated Statements of Financial Position included in this AnnualReport on Form 10-K, such as pension obligations. See Note 10, Employee Benefit Plans, of Notes toConsolidated Financial Statements included in this Annual Report on Form 10-K for a more complete discussionof our employee benefit plans (in millions):
Contractual Obligations
Payments due by Fiscal Year
2011 2012 2013 2014 2015 Thereafter Total
Debt:Debt, excluding capital lease obligations . . . . . . . . . . . $20 $35 $39 $39 $39 $1,587 $1,759Capital lease obligations(1) . . . . . . . . . . . . . . . . . . . . . . 1 1 1 1 1 7 12
21 36 40 40 40 1,594 1,771Operating lease obligations . . . . . . . . . . . . . . . . . . . . . . . . . . 35 33 27 19 15 49 178
Total Contractual Obligations . . . . . . . . . . . . . . . . . . . . . . . . $56 $69 $67 $59 $55 $1,643 $1,949
(1) Capital lease payments due by fiscal year include executory costs and imputed interest not reflected in theConsolidated Statements of Financial Position included in this Annual Report on Form 10-K.
Other Commercial Commitments
The following table summarizes our other commercial commitments as of September 30, 2010, consistingentirely of standby letters of credit that back the performance of certain of our entities under various creditfacilities, insurance policies and lease arrangements (in millions):
Other Commercial Commitments
Amount of Commitment Expiration by Fiscal Year
2011 2012 2013 2014 2015 Thereafter Total
Letters of credit . . . . . . . . . . . . . . . . . . . . . . . . . . . . . . . . . . $48 $2 $— $— $— $3 $53
Total Other Commercial Commitments . . . . . . . . . . . . . . . . $48 $2 $— $— $— $3 $53
Critical Accounting Policies
Our Consolidated Financial Statements included in this Annual Report on Form 10-K have been prepared inaccordance with GAAP and fairly present our financial position and results of operations. We believe thefollowing accounting policies are critical to an understanding of our financial statements. The application ofthese policies requires management’s judgment and estimates in areas that are inherently uncertain.
79

Valuation of Assets and Asset Impairment
We evaluate certain long-lived assets to be held and used, such as property, plant and equipment anddefinite-lived intangible assets for impairment based on the expected future cash flows or earnings projectionsassociated with such assets. Impairment reviews are conducted at the judgment of management when it believesthat a change in circumstances in the business or external factors warrants a review. Circumstances such as thediscontinuation of a product or product line, a sudden or consistent decline in the sales forecast for a product,changes in technology or in the way an asset is being used, a history of operating or cash flow losses or anadverse change in legal factors or in the business climate, among others, may trigger an impairment review. Anasset’s value is deemed impaired if the discounted cash flows or earnings projections generated do notsubstantiate the carrying value of the asset. The estimation of such amounts requires management’s judgmentwith respect to revenue and expense growth rates, changes in working capital and selection of an appropriatediscount rate, as applicable. The use of different assumptions would increase or decrease discounted futureoperating cash flows or earnings projections and could, therefore, change impairment determinations.
ASC 350 requires companies to test goodwill and indefinite-lived intangible assets for impairment annually,or more often if an event or circumstance indicates that an impairment loss may have been incurred. In Fiscal2010, Fiscal 2009 and Fiscal 2008, we tested our goodwill and indefinite-lived intangible assets. As a result ofthis testing, we recorded no impairment charges in Fiscal 2010 and non-cash pretax impairment charges of $34million and $861 million in Fiscal 2009 and Fiscal 2008, respectively. The $34 million impairment chargeincurred in Fiscal 2009 reflects an impairment of trade name intangible assets consisting of the following: (i) $18million related to the Global Pet Supplies Business; (ii) $15 million related to the Global Batteries and PersonalCare segment; and (iii) $1 million related to the Home and Garden Business. The $861 million impairmentcharge incurred in Fiscal 2008 reflects impaired goodwill of $602 million and impaired trade name intangibleassets of $265 million. The $602 million of impaired goodwill consisted of the following: (i) $426 millionassociated with our Global Pet Supplies reportable segment; (ii) $160 million associated with the Home andGarden Business; and (iii) $16 million related to our Global Batteries & Personal Care reportable segment. The$265 million of impaired trade name intangible assets consisted of the following: (i) $86 million related to ourGlobal Batteries & Personal Care reportable segment; (ii) $98 million related to Global Pet Supplies; and(iii) $81 million related to the Home and Garden Business. Future cash expenditures will not result from theseimpairment charges.
We used a discounted estimated future cash flows methodology, third party valuations and negotiated salesprices to determine the fair value of our reporting units (goodwill). Fair value of indefinite-lived intangibleassets, which represent trade names, was determined using a relief from royalty methodology. Assumptionscritical to our fair value estimates were: (i) the present value factors used in determining the fair value of thereporting units and trade names or third party indicated fair values for assets expected to be disposed; (ii) royaltyrates used in our trade name valuations; (iii) projected average revenue growth rates used in the reporting unitand trade name models; and (iv) projected long-term growth rates used in the derivation of terminal year values.We also tested fair value for reasonableness by comparison to our total market capitalization, which includesboth our equity and debt securities. These and other assumptions are impacted by economic conditions andexpectations of management and will change in the future based on period specific facts and circumstances. Inlight of a sustained decline in market capitalization coupled with the decline of the fair value of our debtsecurities, we also considered these factors in the Fiscal 2008 annual impairment testing.
In accordance with ASC 740, we establish valuation allowances for deferred tax assets when we estimate itis more likely than not that the tax assets will not be realized. We base these estimates on projections of futureincome, including tax-planning strategies, by individual tax jurisdictions. Changes in industry and economicconditions and the competitive environment may impact the accuracy of our projections. In accordance with ASC740, during each reporting period we assess the likelihood that our deferred tax assets will be realized anddetermine if adjustments to the valuation allowance are appropriate. As a result of this assessment, during Fiscal2009 we recorded a reduction in the valuation allowance of approximately $363 million. Of the $363 million
80

total, $314 million was recorded as a non-cash deferred income tax benefit and $49 million as a reduction togoodwill. During Fiscal 2008 we recorded a non-cash deferred income tax charge of approximately $200 millionrelated to increasing the valuation allowance against our net deferred tax assets.
The fair value of our Global Batteries & Personal Care, Global Pet Supplies, Small Appliances and Homeand Garden Business reporting units, which are also our segments, exceeded their carry values by 52%, 49%,13% and 10%, respectively, as of the date of our latest annual impairment testing.
See Note 3(h), Significant Accounting Policies and Practices—Property, Plant and Equipment, Note 3(i),Significant Accounting Policies and Practices—Intangible Assets, Note 5, Property, Plant and Equipment,Note 6, Goodwill and Intangible Assets, Note 8, Income Taxes, and Note 9, Discontinued Operations, of Notes toConsolidated Financial Statements included in this Annual Report on Form 10-K for more information aboutthese assets.
Revenue Recognition and Concentration of Credit Risk
We recognize revenue from product sales generally upon delivery to the customer or the shipping point insituations where the customer picks up the product or where delivery terms so stipulate. This represents the pointat which title and all risks and rewards of ownership of the product are passed, provided that: there are nouncertainties regarding customer acceptance; there is persuasive evidence that an arrangement exists; the price tothe buyer is fixed or determinable; and collectibility is deemed reasonably assured. We are generally notobligated to allow for, and our general policy is not to accept, product returns for battery sales. We do acceptreturns in specific instances related to our electric shaving and grooming, electric personal care, home andgarden, small appliances and pet supply products. The provision for customer returns is based on historical salesand returns and other relevant information. We estimate and accrue the cost of returns, which are treated as areduction of net sales.
We enter into various promotional arrangements, primarily with retail customers, including arrangementsentitling such retailers to cash rebates from us based on the level of their purchases, which require us to estimateand accrue the costs of the promotional programs. These costs are generally treated as a reduction of net sales.
We also enter into promotional arrangements that target the ultimate consumer. Such arrangements aretreated as either a reduction of net sales or an increase in cost of sales, based on the type of promotional program.The income statement presentation of our promotional arrangements complies with ASC Topic 605: “RevenueRecognition.” Cash consideration, or an equivalent thereto, given to a customer is generally classified as areduction of net sales. If we provide a customer anything other than cash, the cost of the consideration isclassified as an expense and included in cost of sales.
For all types of promotional arrangements and programs, we monitor our commitments and use statisticalmeasures and past experience to determine the amounts to be recorded for the estimate of the earned, but unpaid,promotional costs. The terms of our customer-related promotional arrangements and programs are tailored toeach customer and are generally documented through written contracts, correspondence or other communicationswith the individual customers.
We also enter into various arrangements, primarily with retail customers, which require us to make anupfront cash, or “slotting” payment, to secure the right to distribute through such customer. We capitalize slottingpayments, provided the payments are supported by a time or volume based arrangement with the retailer, andamortize the associated payment over the appropriate time or volume based term of the arrangement. Theamortization of slotting payments is treated as a reduction in net sales and a corresponding asset is reported inDeferred charges and other in our Consolidated Statements of Financial Position included in this Annual Reporton Form 10-K.
81

Our trade receivables subject us to credit risk which is evaluated based on changing economic, political andspecific customer conditions. We assess these risks and make provisions for collectibility based on our bestestimate of the risks presented and information available at the date of the financial statements. The use ofdifferent assumptions may change our estimate of collectibility. We extend credit to our customers based upon anevaluation of the customer’s financial condition and credit history and generally do not require collateral. Ourcredit terms generally range between 30 and 90 days from invoice date, depending upon the evaluation of thecustomer’s financial condition and history. We monitor our customers’ credit and financial condition in order toassess whether the economic conditions have changed and adjust our credit policies with respect to anyindividual customer as we determine appropriate. These adjustments may include, but are not limited to,restricting shipments to customers, reducing credit limits, shortening credit terms, requiring cash payments inadvance of shipment or securing credit insurance.
See Note 3(b), Significant Accounting Policies and Practices—Revenue Recognition, Note 3(c), SignificantAccounting Policies and Practices—Use of Estimates and Note 3(e), Significant Accounting Policies andPractices—Concentrations of Credit Risk and Major Customers and Employees, of Notes to ConsolidatedFinancial Statements included in this Annual Report on Form 10-K for more information about our revenuerecognition and credit policies.
Pensions
Our accounting for pension benefits is primarily based on a discount rate, expected and actual return on planassets and other assumptions made by management, and is impacted by outside factors such as equity and fixedincome market performance. Pension liability is principally the estimated present value of future benefits, net ofplan assets. In calculating the estimated present value of future benefits, net of plan assets, we used discount ratesof 4.2 to 13.6% in Fiscal 2010 and 5.0 to 11.8% in Fiscal 2009. In adjusting the discount rates from Fiscal 2009to 2010, we considered the change in the general market interest rates of debt and solicited the advice of ouractuary. We believe the discount rates used are reflective of the rates at which the pension benefits could beeffectively settled.
Pension expense is principally the sum of interest and service cost of the plan, less the expected return onplan assets and the amortization of the difference between our assumptions and actual experience. The expectedreturn on plan assets is calculated by applying an assumed rate of return to the fair value of plan assets. We usedexpected returns on plan assets of 4.5% to 7.8% in Fiscal 2010 and 4.5% to 8.0% in Fiscal 2009. Based on theadvice of our independent actuary, we believe the expected rates of return are reflective of the long-term averagerate of earnings expected on the funds invested. If such expected returns were overstated, it would ultimatelyincrease future pension expense. Similarly, an understatement of the expected return would ultimately decreasefuture pension expense. If plan assets decline due to poor performance by the markets and/or interest ratedeclines our pension liability will increase, ultimately increasing future pension expense.
See Note 10, Employee Benefit Plans, of Notes to Consolidated Financial Statements included in thisAnnual Report on Form 10-K for a more complete discussion of our employee benefit plans.
Restructuring and Related Charges
Restructuring charges are recognized and measured according to the provisions of ASC Topic 420: “Exit orDisposal Cost Obligations,” (“ASC 420”). Under ASC 420, restructuring charges include, but are not limited to,termination and related costs consisting primarily of severance costs and retention bonuses, and contracttermination costs consisting primarily of lease termination costs. Related charges, as defined by us, include, butare not limited to, other costs directly associated with exit and integration activities, including impairment ofproperty and other assets, departmental costs of full-time incremental integration employees, and any other itemsrelated to the exit or integration activities. Costs for such activities are estimated by us after evaluating detailedanalyses of the cost to be incurred. We present restructuring and related charges on a combined basis.
82

Liabilities from restructuring and related charges are recorded for estimated costs of facility closures,significant organizational adjustment and measures undertaken by management to exit certain activities. Costsfor such activities are estimated by management after evaluating detailed analyses of the cost to be incurred.Such liabilities could include amounts for items such as severance costs and related benefits (includingsettlements of pension plans), impairment of property and equipment and other current or long term assets, leasetermination payments and any other items directly related to the exit activities. While the actions are carried outas expeditiously as possible, restructuring and related charges are estimates. Changes in estimates resulting in anincrease to or a reversal of a previously recorded liability may be required as management executes arestructuring plan.
We report restructuring and related charges associated with manufacturing and related initiatives in cost ofgoods sold. Restructuring and related charges reflected in cost of goods sold include, but are not limited to,termination and related costs associated with manufacturing employees, asset impairments relating tomanufacturing initiatives and other costs directly related to the restructuring initiatives implemented.
We report restructuring and related charges associated with administrative functions in operating expenses,such as initiatives impacting sales, marketing, distribution or other non-manufacturing related functions.Restructuring and related charges reflected in operating expenses include, but are not limited to, termination andrelated costs, any asset impairments relating to the administrative functions and other costs directly related to theinitiatives implemented.
The costs of plans to (i) exit an activity of an acquired company, (ii) involuntarily terminate employees ofan acquired company or (iii) relocate employees of an acquired company are measured and recorded inaccordance with the provisions of the ASC 805. Under ASC 805, if certain conditions are met, such costs arerecognized as a liability assumed as of the consummation date of the purchase business combination andincluded in the allocation of the acquisition cost. Costs related to terminated activities or employees of theacquired company that do not meet the conditions prescribed in ASC 805 are treated as restructuring and relatedcharges and expensed as incurred.
See Note 14, Restructuring and Related Charges, of Notes to the Consolidated Financial Statementsincluded in this Annual Report on Form 10-K for a more complete discussion of our restructuring initiatives andrelated costs.
Loss Contingencies
Loss contingencies are recorded as liabilities when it is probable that a loss has been incurred and theamount of the loss can be reasonably estimated. The outcome of existing litigation, the impact of environmentalmatters and pending or potential examinations by various taxing authorities are examples of situations evaluatedas loss contingencies. Estimating the probability and magnitude of losses is often dependent upon management’sjudgment of potential actions by third parties and regulators. It is possible that changes in estimates or anincreased probability of an unfavorable outcome could materially affect our business, financial condition orresults of operations.
See further discussion in Item 3, Legal Proceedings, and Note 12, Commitments and Contingencies, ofNotes to the Consolidated Financial Statements included in this Annual Report on Form 10-K.
Other Significant Accounting Policies
Other significant accounting policies, primarily those with lower levels of uncertainty than those discussedabove, are also critical to understanding the Consolidated Financial Statements included in this Annual Report onForm 10-K. The Notes to the Consolidated Financial Statements included in this Annual Report on Form 10-Kcontain additional information related to our accounting policies, including recent accounting pronouncements,and should be read in conjunction with this discussion.
83

ITEM 7A. QUANTITATIVE AND QUALITATIVE DISCLOSURES ABOUT MARKET RISK
Market Risk Factors
We have market risk exposure from changes in interest rates, foreign currency exchange rates andcommodity prices. We use derivative financial instruments for purposes other than trading to mitigate the riskfrom such exposures.
A discussion of our accounting policies for derivative financial instruments is included in Note 3(r),Significant Accounting Policies and Practices-Derivative Financial Instruments, of Notes to ConsolidatedFinancial Statements included in this Annual Report on Form 10-K.
Interest Rate Risk
We have bank lines of credit at variable interest rates. The general level of U.S. interest rates, LIBOR andEURIBOR affect interest expense. We use interest rate swaps to manage such risk. The net amounts to be paid orreceived under interest rate swap agreements are accrued as interest rates change, and are recognized over the lifeof the swap agreements as an adjustment to interest expense from the underlying debt to which the swap isdesignated. The related amounts payable to, or receivable from, the contract counter-parties are included inaccrued liabilities or accounts receivable.
Foreign Exchange Risk
We are subject to risk from sales and loans to and from our subsidiaries as well as sales to, purchases fromand bank lines of credit with, third-party customers, suppliers and creditors, respectively, denominated in foreigncurrencies. Foreign currency sales and purchases are made primarily in Euro, Pounds Sterling, Canadian Dollars,Australian Dollars and Brazilian Reals. We manage our foreign exchange exposure from anticipated sales,accounts receivable, intercompany loans, firm purchase commitments, accounts payable and credit obligationsthrough the use of naturally occurring offsetting positions (borrowing in local currency), forward foreignexchange contracts, foreign exchange rate swaps and foreign exchange options. The related amounts payable to,or receivable from, the contract counter-parties are included in accounts payable or accounts receivable.
Commodity Price Risk
We are exposed to fluctuations in market prices for purchases of zinc used in the manufacturing process. Weuse commodity swaps and calls to manage such risk. The maturity of, and the quantities covered by, the contractsare closely correlated to our anticipated purchases of the commodities. The cost of calls are amortized over thelife of the contracts and are recorded in cost of goods sold, along with the effects of the swap and call contracts.The related amounts payable to, or receivable from, the counter-parties are included in accounts payable oraccounts receivable.
Sensitivity Analysis
The analysis below is hypothetical and should not be considered a projection of future risks. Earningsprojections are before tax.
As of September 30, 2010, the potential change in fair value of outstanding interest rate derivativeinstruments, assuming a 1 percentage point unfavorable shift in the underlying interest rates would result in a lossof $0.3 million. The net impact on reported earnings, after also including the reduction in one year’s interestexpense on the related debt due to the same shift in interest rates, would be a net loss of $0.3 million. As ofSeptember 30, 2009, there were no interest rate derivative instruments outstanding.
84

As of September 30, 2010, the potential change in fair value of outstanding foreign exchange derivativeinstruments, assuming a 10% unfavorable change in the underlying exchange rates would be a loss of $63.4million. The net impact on reported earnings, after also including the effect of the change in the underlyingforeign currency-denominated exposures, would be a net gain of $8.9 million. The same hypothetical shift inexchange rates as of September 30, 2009, would have resulted in a loss of $10.8 million. The net impact onreported earnings, after also including the effect of the change in the underlying foreign currency-denominatedexposures, would be a net gain of $10.8 million.
As of September 30, 2010, the potential change in fair value of outstanding commodity price derivativeinstruments, assuming a 10% unfavorable change in the underlying commodity prices would be a loss of $3.3million. The net impact on reported earnings, after also including the reduction in cost of one year’s purchases ofthe related commodities due to the same change in commodity prices, would be a net loss of $0.3 million. Thesame hypothetical shift in commodity prices as of September 30, 2009 would have resulted in a loss of $1.5million. The net impact on reported earnings, after also including the reduction in cost of one year’s purchases ofthe related commodities due to the same change in commodity prices, would be a net gain of $0.8 million.
ITEM 8. FINANCIAL STATEMENTS AND SUPPLEMENTARY DATA
The information required for this Item is included in this Annual Report on Form 10-K on pages 70 through133, inclusive and is incorporated herein by reference.
ITEM 9. CHANGES IN AND DISAGREEMENTS WITH ACCOUNTANTS ON ACCOUNTING ANDFINANCIAL DISCLOSURE
None.
ITEM 9A. CONTROLS AND PROCEDURES
Evaluation of Disclosure Controls and Procedures. Our management, with the participation of our principalexecutive officer and principal financial officer, has evaluated the effectiveness of our disclosure controls andprocedures (as such term is defined in Rules 13a-15(e) and 15d-15(e) under the Exchange Act) pursuant to Rule13a-15(b) under the Exchange Act as of the end of the period covered by this Annual Report on Form 10-K.Based on this evaluation, our Chief Executive Officer and Chief Financial Officer have concluded that, as of suchdate, our disclosure controls and procedures are effective to ensure that information required to be disclosed byus in reports that we file or submit under the Exchange Act is recorded, processed, summarized and reportedwithin the time periods specified in applicable SEC rules and forms, and is accumulated and communicated tothe Company’s management, including the Company’s Chief Executive Officer and Chief Financial Officer, asappropriate to allow timely decisions regarding required disclosure.
Management’s Annual Report on Internal Control over Financial Reporting. The Company’s managementis responsible for establishing and maintaining adequate internal control over financial reporting (as defined inRules 13a-15(f) and 15d-15(f) under the Exchange Act). The Company’s management assessed the effectivenessof its internal control over financial reporting as of September 30, 2010. In making this assessment, theCompany’s management used the criteria set forth by the Committee of Sponsoring Organizations of theTreadway Commission (“COSO”) in Internal Control-Integrated Framework. The Company’s management hasconcluded that, as of September 30, 2010, its internal control over financial reporting is effective based on thesecriteria. The Company’s management excluded Russell Hobbs from its assessment of the effectiveness ofinternal control over financial reporting, as the Company may omit an assessment of an acquired business’sinternal control over financial reporting from its assessment of the registrant’s internal control; however, it maynot extend beyond one year from the date of acquisition, nor may such assessment be omitted from more thanone annual management report on internal control over financial reporting. The total assets of $863 million andtotal net sales of $238 million associated with Russell Hobbs are included in the consolidated financial
85

statements of the Company as of and for the year ended September 30, 2010. The Company’s independentregistered public accounting firm, KPMG LLP, has issued an audit report on the Company’s internal control overfinancial reporting, which is included herein.
Changes in Internal Control Over Financial Reporting. There was no change in our internal control overfinancial reporting (as defined in Rules 13a-15(f) and 15d-15(f) under the Securities Exchange Act of 1934, asamended) that occurred during our fourth fiscal quarter that has materially affected, or is reasonably likely tomaterially affect, our internal control over financial reporting.
Limitations on the Effectiveness of Controls. The Company’s management, including our Chief ExecutiveOfficer and Chief Financial Officer, does not expect that the Company’s disclosure controls and procedures orthe Company’s internal controls over financial reporting will prevent all errors and all fraud. A control system,no matter how well conceived and operated, can provide only reasonable, not absolute, assurance that theobjectives of the control system are met. Further, the design of a control system must reflect the fact that thereare resource constraints, and the benefits of controls must be considered relative to their costs. Because of theinherent limitations in all control systems, no evaluation of controls can provide absolute assurance that allcontrol issues and instances of fraud, if any, within the Company have been detected.
ITEM 9B. OTHER INFORMATION
None.
86

PART III
ITEM 10. DIRECTORS, EXECUTIVE OFFICERS AND CORPORATE GOVERNANCE
The information required by Item 401 of Regulation S-K concerning the directors of Spectrum BrandsHoldings, Inc. (“SB Holdings”) and the nominees for re-election as directors of SB Holdings at the AnnualMeeting of Shareholders to be held on March 1, 2011 (the “2011 Annual Meeting”) is incorporated herein byreference from the disclosure which will be included under the caption “PROPOSAL NUMBER 1—ELECTIONOF DIRECTORS” in SB Holdings’ definitive Proxy Statement relating to the 2011 Annual Meeting (the “SBHoldings Definitive Proxy Statement”), which will be filed not later than 120 days after the end of SB Holdings’fiscal year ended September 30, 2010.
Audit Committee Financial Expert and Audit Committee
The information required by Items 407(d)(4) and 407(d)(5) of Regulation S-K is incorporated herein byreference from the disclosure which will be included under the caption “MEETINGS AND COMMITTEES OFTHE BOARD—Committees of the Board—Audit Committee” in the SB Holdings Definitive Proxy Statement.
Section 16(a) Beneficial Ownership Reporting Compliance
The information required by Item 405 of Regulation S-K is incorporated herein by reference from thedisclosure which will be included under the caption “SECTION 16(a) BENEFICIAL OWNERSHIPREPORTING COMPLIANCE” in the SB Holdings Definitive Proxy Statement.
Code of Ethics
We have adopted the Code of Ethics for the Principal Executive Officer and Senior Financial Officers, acode of ethics that applies to our Chief Executive Officer, Chief Financial Officer and other senior financeorganization employees. The Code of Ethics for the Principal Executive Officer and Senior Financial Officers ispublicly available on our website at www.spectrumbrands.com under “Investor Relations—CorporateGovernance.” We intend to disclose amendments to, and, if applicable, waivers of, this code of ethics on thatsection of our website.
We have also adopted the Spectrum Brands Code of Business Conduct and Ethics, a code of ethics thatapplies to all of our directors, officers and employees. The Spectrum Brands Code of Business Conduct andEthics is publicly available on our website at www.spectrumbrands.com under “Investor Relations—CorporateGovernance.” Any amendments to this code of ethics or any waiver of this code of ethics for executive officersor directors may be made only by our Board of Directors as a whole or our Audit Committee and will bepromptly disclosed to our shareholders via that section of our website.
ITEM 11. EXECUTIVE COMPENSATION
Report of the Compensation Committee of the Board of Directors
The information required by Item 407(e)(5) of Regulation S-K is incorporated herein by reference from thedisclosure which will be included under caption “COMPENSATION COMMITTEE REPORT” in SB HoldingsDefinitive Proxy Statement.
Compensation Discussion and Analysis
The information required by Item 402 of Regulation S-K is incorporated herein by reference fromdisclosures which will be included under the captions “EXECUTIVE COMPENSATION” and “NON-EMPLOYEE DIRECTOR COMPENSATION” in SB Holdings Definitive Proxy Statement.
87

Compensation Committee Interlocks and Insider Participation
The information required by Item 407(e)(4) of Regulation S-K is incorporated herein by reference from thedisclosure which will be included under the caption “Compensation Committee Interlocks and InsiderParticipation” in SB Holdings Definitive Proxy Statement.
ITEM 12. SECURITY OWNERSHIP OF CERTAIN BENEFICIAL OWNERS AND MANAGEMENT ANDRELATED STOCKHOLDERMATTERS
Ownership of Common Shares of Spectrum Brands Holdings, Inc.
The information required by Item 403 of Regulation S-K is incorporated herein by reference from thedisclosure which will be included under the caption “BENEFICIAL OWNERSHIP OF SECURITIES OF THECOMPANY” in the SB Holdings Definitive Proxy Statement.
Equity Compensation Plan Information
The information required by Item 201(d) of Regulation S-K is incorporated herein by reference from thedisclosure which will be included under the caption “EQUITY COMPENSATION PLAN INFORMATION” inthe SB Holdings Definitive Proxy Statement.
ITEM 13. CERTAIN RELATIONSHIPS AND RELATED TRANSACTIONS AND DIRECTORINDEPENDENCE
Certain Relationships and Related Person Transactions
The information required by Item 404 of Regulation S-K is incorporated herein by reference from thedisclosures which will be included under the caption “CERTAIN RELATIONSHIPS AND RELATEDTRANSACTIONS” in the SB Holdings Definitive Proxy Statement.
Director Independence
The information required by Item 407(a) of Regulation S-K is incorporated herein by reference from thedisclosures which will be included under the captions “CORPORATE GOVERNANCE—DirectorIndependence” and “MEETINGS AND COMMITTEES OF THE BOARD” in SB Holdings Definitive ProxyStatement.
ITEM 14. PRINCIPAL ACCOUNTING FEES AND SERVICES
The information required by this Item 14 is incorporated herein by reference from the disclosures which willbe included under the captions “AUDIT COMMITTEE MATTERS—Fees of the Independent Registered PublicAccounting Firm” and “AUDIT COMMITTEE MATTERS—Pre-Approval of Services Performed by theIndependent Registered Public Accounting Firm” in the SB Holdings Definitive Proxy Statement.
88

PART IV
ITEM 15. EXHIBITS, FINANCIAL STATEMENTS AND SCHEDULES
(a) The following documents are filed as part of or are included in this Annual Report on Form 10-K:
1. The financial statements listed in the Index to Consolidated Financial Statements and FinancialStatement Schedule, filed as part of this Annual Report on Form 10-K.
2. The financial statement schedule listed in the Index to Consolidated Financial Statements andFinancial Statement Schedule, filed as part of this Annual Report on Form 10-K.
3. The exhibits listed in the Exhibit Index filed as part of this Annual Report on Form 10-K.
89

SPECTRUM BRANDS, INC. AND SUBSIDIARIES
INDEX TOCONSOLIDATED FINANCIAL STATEMENTS AND FINANCIAL STATEMENT SCHEDULE
Page
Reports of Independent Registered Public Accounting Firm . . . . . . . . . . . . . . . . . . . . . . . . . . . . . . . . . . . . . . 91Consolidated Statements of Financial Position . . . . . . . . . . . . . . . . . . . . . . . . . . . . . . . . . . . . . . . . . . . . . . . . 93Consolidated Statements of Operations . . . . . . . . . . . . . . . . . . . . . . . . . . . . . . . . . . . . . . . . . . . . . . . . . . . . . . 94Consolidated Statements of Shareholders’ Equity (Deficit) and Comprehensive Income (Loss) . . . . . . . . . . 95Consolidated Statements of Cash Flows . . . . . . . . . . . . . . . . . . . . . . . . . . . . . . . . . . . . . . . . . . . . . . . . . . . . . 97Notes to Consolidated Financial Statements . . . . . . . . . . . . . . . . . . . . . . . . . . . . . . . . . . . . . . . . . . . . . . . . . . 98Schedule II Valuation and Qualifying Accounts . . . . . . . . . . . . . . . . . . . . . . . . . . . . . . . . . . . . . . . . . . . . . . . 168
90

Report of Independent Registered Public Accounting Firm
The Board of Directors and StockholdersSpectrum Brands Holdings, Inc.:
We have audited the accompanying consolidated statements of financial position of Spectrum Brands Holdings,Inc. and subsidiaries (the Company) as of September 30, 2010 and September 30, 2009 (Successor Company),and the related consolidated statements of operations, shareholders’ equity (deficit) and comprehensive income(loss), and cash flows for the year ended September 30, 2010, the period August 31, 2009 to September 30, 2009(Successor Company), the period October 1, 2008 to August 30, 2009 and the year ended September 30, 2008(Predecessor Company). In connection with our audits of the consolidated financial statements, we have alsoaudited the financial statement schedule II. These consolidated financial statements are the responsibility of theCompany’s management. Our responsibility is to express an opinion on these consolidated financial statementsbased on our audits.
We conducted our audits in accordance with the standards of the Public Company Accounting Oversight Board(United States). Those standards require that we plan and perform the audit to obtain reasonable assurance aboutwhether the financial statements are free of material misstatement. An audit includes examining, on a test basis,evidence supporting the amounts and disclosures in the financial statements. An audit also includes assessing theaccounting principles used and significant estimates made by management, as well as evaluating the overallfinancial statement presentation. We believe that our audits provide a reasonable basis for our opinion.
In our opinion, the consolidated financial statements referred to above present fairly, in all material respects, thefinancial position of the Spectrum Brands Holdings, Inc. and subsidiaries as of September 30, 2010 andSeptember 30, 2009 (Successor Company), and the results of their operations and their cash flows for the yearended September 30, 2010, the period August 31, 2009 to September 30, 2009 (Successor Company), the periodOctober 1, 2008 to August 30, 2009 and the year ended September 30, 2008 (Predecessor Company) inconformity with U.S. generally accepted accounting principles.
We also have audited, in accordance with the standards of the Public Company Accounting Oversight Board(United States), the Company’s internal control over financial reporting as of September 30, 2010, based oncriteria established in Internal Control—Integrated Framework issued by the Committee of SponsoringOrganizations of the Treadway Commission (COSO), and our report dated December 14, 2010 expressed anunqualified opinion on the effectiveness of the Company’s internal control over financial reporting.
As discussed in Note 2 to the consolidated financial statements, the Predecessor Company filed a petition forreorganization under Chapter 11 of the United States Bankruptcy Code on February 3, 2009. The Company’splan of reorganization became effective and the Company emerged from bankruptcy protection on August 28,2009. In connection with their emergence from bankruptcy, the Successor Company Spectrum Brands, Inc.adopted fresh-start reporting in conformity with ASC Topic 852, “Reorganizations” formerly America Instituteof Certified Public Accountants Statement of Position 90-7, “Financial Reporting by Entities in Reorganizationunder the Bankruptcy Code”, effective as of August 30, 2009. Accordingly, the Successor Company’sconsolidated financial statements prior to August 30, 2009 are not comparable to its consolidated financialstatements for periods on after August 30, 2009.
As discussed in Note 10 to the consolidated financial statements, effective September 30, 2009, the SuccessorCompany adopted the measurement date provision of ASC 715, “Compensation-Retirement Benefits” formerlyFAS 158, “Employers’ Accounting for Defined Benefit Pension and other Postretirement Plans”.
/s/ KPMG LLP
Atlanta, GeorgiaDecember 14, 2010
91

Report of Independent Registered Public Accounting Firm
The Board of Directors and StockholdersSpectrum Brands Holdings, Inc.:
We have audited Spectrum Brands Holdings, Inc. and subsidiaries (the Company) internal control over financialreporting as of September 30, 2010, based on criteria established in Internal Control—Integrated Frameworkissued by the Committee of Sponsoring Organizations of the Treadway Commission (COSO). The Company’smanagement is responsible for maintaining effective internal control over financial reporting and for itsassessment of the effectiveness of internal control over financial reporting, included in the accompanyingManagement’s Annual Report on Internal Control Over Financial Reporting. Our responsibility is to express anopinion on the Company’s internal control over financial reporting based on our audit.
We conducted our audit in accordance with the standards of the Public Company Accounting Oversight Board(United States). Those standards require that we plan and perform the audit to obtain reasonable assurance aboutwhether effective internal control over financial reporting was maintained in all material respects. Our auditincluded obtaining an understanding of internal control over financial reporting, assessing the risk that a materialweakness exists, and testing and evaluating the design and operating effectiveness of internal control based onthe assessed risk. Our audit also included performing such other procedures as we considered necessary in thecircumstances. We believe that our audit provides a reasonable basis for our opinion.
A company’s internal control over financial reporting is a process designed to provide reasonable assuranceregarding the reliability of financial reporting and the preparation of financial statements for external purposes inaccordance with generally accepted accounting principles. A company’s internal control over financial reportingincludes those policies and procedures that (1) pertain to the maintenance of records that, in reasonable detail,accurately and fairly reflect the transactions and dispositions of the assets of the company; (2) provide reasonableassurance that transactions are recorded as necessary to permit preparation of financial statements in accordancewith generally accepted accounting principles, and that receipts and expenditures of the company are being madeonly in accordance with authorizations of management and directors of the company; and (3) provide reasonableassurance regarding prevention or timely detection of unauthorized acquisition, use, or disposition of thecompany’s assets that could have a material effect on the financial statements.
Because of its inherent limitations, internal control over financial reporting may not prevent or detectmisstatements. Also, projections of any evaluation of effectiveness to future periods are subject to the risk thatcontrols may become inadequate because of changes in conditions, or that the degree of compliance with thepolicies or procedures may deteriorate.
In our opinion, Spectrum Brands Holdings, Inc. and subsidiaries maintained, in all material respects, effectiveinternal control over financial reporting as of September 30, 2010, based on criteria established in InternalControl—Integrated Framework issued by the Committee of Sponsoring Organizations of the TreadwayCommission.
We have also audited the accompanying consolidated statements of financial position of Spectrum BrandsHoldings, Inc. and subsidiaries as of September 30, 2010 and September 30, 2009 (Successor Company), and therelated consolidated statements of operations, shareholders’ equity (deficit) and comprehensive income (loss),and cash flows for the year ended September 30, 2010, the period August 31, 2009 to September 30, 2009(Successor Company), the period October 1, 2008 to August 30, 2009 and the year ended September 30, 2008(Predecessor Company), along with the financial statement schedule II, and our report dated December 14, 2010expressed an unqualified opinion on those consolidated financial statements.
The Company acquired Russell Hobbs, Inc. and its subsidiaries (Russell Hobbs) on June 16, 2010. Managementexcluded Russell Hobbs from its assessment of the effectiveness of internal control over financial reporting andthe associated total assets of $863,282,000 and total net sales of $237,576,000 included in the consolidatedfinancial statements of the Company as of and for the year ended September 30, 2010. Our audit of internalcontrol over financial reporting of the Company as of September 30, 2010 also excluded Russell Hobbs.
/s/ KPMG LLP
Atlanta, GeorgiaDecember 14, 2010
92

SPECTRUM BRANDS HOLDINGS, INC. AND SUBSIDIARIES
Consolidated Statements of Financial PositionSeptember 30, 2010 and 2009
(In thousands, except per share amounts)
SuccessorCompany
2010 2009
AssetsCurrent assets:
Cash and cash equivalents . . . . . . . . . . . . . . . . . . . . . . . . . . . . . . . . . . . . . . . . . . . . . . . . . . . . . $ 170,614 $ 97,800Receivables:
Trade accounts receivable, net of allowances of $4,351 and $1,011, respectively . . . . . . 365,002 274,483Other . . . . . . . . . . . . . . . . . . . . . . . . . . . . . . . . . . . . . . . . . . . . . . . . . . . . . . . . . . . . . . . . . . 41,445 24,968
Inventories . . . . . . . . . . . . . . . . . . . . . . . . . . . . . . . . . . . . . . . . . . . . . . . . . . . . . . . . . . . . . . . . . 530,342 341,505Deferred income taxes . . . . . . . . . . . . . . . . . . . . . . . . . . . . . . . . . . . . . . . . . . . . . . . . . . . . . . . . 35,735 28,137Assets held for sale . . . . . . . . . . . . . . . . . . . . . . . . . . . . . . . . . . . . . . . . . . . . . . . . . . . . . . . . . . . 12,452 11,870Prepaid expenses and other . . . . . . . . . . . . . . . . . . . . . . . . . . . . . . . . . . . . . . . . . . . . . . . . . . . . . 44,122 39,973
Total current assets . . . . . . . . . . . . . . . . . . . . . . . . . . . . . . . . . . . . . . . . . . . . . . . . . . . 1,199,712 818,736Property, plant and equipment, net . . . . . . . . . . . . . . . . . . . . . . . . . . . . . . . . . . . . . . . . . . . . . . . . . . . 201,164 212,361Deferred charges and other . . . . . . . . . . . . . . . . . . . . . . . . . . . . . . . . . . . . . . . . . . . . . . . . . . . . . . . . . 46,352 34,934Goodwill . . . . . . . . . . . . . . . . . . . . . . . . . . . . . . . . . . . . . . . . . . . . . . . . . . . . . . . . . . . . . . . . . . . . . . . 600,055 483,348Intangible assets, net . . . . . . . . . . . . . . . . . . . . . . . . . . . . . . . . . . . . . . . . . . . . . . . . . . . . . . . . . . . . . . 1,769,360 1,461,945Debt issuance costs . . . . . . . . . . . . . . . . . . . . . . . . . . . . . . . . . . . . . . . . . . . . . . . . . . . . . . . . . . . . . . . 56,961 9,422
Total assets . . . . . . . . . . . . . . . . . . . . . . . . . . . . . . . . . . . . . . . . . . . . . . . . . . . . . . . . . $3,873,604 $3,020,746
Liabilities and Shareholders’ EquityCurrent liabilities:
Current maturities of long-term debt . . . . . . . . . . . . . . . . . . . . . . . . . . . . . . . . . . . . . . . . . . . . . $ 20,710 $ 53,578Accounts payable . . . . . . . . . . . . . . . . . . . . . . . . . . . . . . . . . . . . . . . . . . . . . . . . . . . . . . . . . . . . 332,231 186,235Accrued liabilities:
Wages and benefits . . . . . . . . . . . . . . . . . . . . . . . . . . . . . . . . . . . . . . . . . . . . . . . . . . . . . . . 93,971 88,443Income taxes payable . . . . . . . . . . . . . . . . . . . . . . . . . . . . . . . . . . . . . . . . . . . . . . . . . . . . . 37,118 21,950Restructuring and related charges . . . . . . . . . . . . . . . . . . . . . . . . . . . . . . . . . . . . . . . . . . . . 23,793 26,203Accrued interest . . . . . . . . . . . . . . . . . . . . . . . . . . . . . . . . . . . . . . . . . . . . . . . . . . . . . . . . . 31,652 8,678Other . . . . . . . . . . . . . . . . . . . . . . . . . . . . . . . . . . . . . . . . . . . . . . . . . . . . . . . . . . . . . . . . . . 123,297 109,981
Total current liabilities . . . . . . . . . . . . . . . . . . . . . . . . . . . . . . . . . . . . . . . . . . . . . . . . 662,772 495,068Long-term debt, net of current maturities . . . . . . . . . . . . . . . . . . . . . . . . . . . . . . . . . . . . . . . . . . . . . . 1,723,057 1,529,957Employee benefit obligations, net of current portion . . . . . . . . . . . . . . . . . . . . . . . . . . . . . . . . . . . . . 92,725 55,855Deferred income taxes . . . . . . . . . . . . . . . . . . . . . . . . . . . . . . . . . . . . . . . . . . . . . . . . . . . . . . . . . . . . 277,843 227,498Other . . . . . . . . . . . . . . . . . . . . . . . . . . . . . . . . . . . . . . . . . . . . . . . . . . . . . . . . . . . . . . . . . . . . . . . . . . 70,828 51,489
Total liabilities . . . . . . . . . . . . . . . . . . . . . . . . . . . . . . . . . . . . . . . . . . . . . . . . . . . . . . 2,827,225 2,359,867Commitments and contingenciesShareholders’ equity:
Common stock, $.01 par value, authorized 200,000 shares; issued 51,020 shares; outstanding51,020 shares at September 30, 2010 . . . . . . . . . . . . . . . . . . . . . . . . . . . . . . . . . . . . . . . . . . . 514 —
Common stock, $.01 par value, authorized 150,000 shares; issued 30,000 shares; outstanding30,000 shares at September 30, 2009 . . . . . . . . . . . . . . . . . . . . . . . . . . . . . . . . . . . . . . . . . . . — 300
Additional paid-in capital . . . . . . . . . . . . . . . . . . . . . . . . . . . . . . . . . . . . . . . . . . . . . . . . . . . . . . 1,316,461 724,796Accumulated deficit . . . . . . . . . . . . . . . . . . . . . . . . . . . . . . . . . . . . . . . . . . . . . . . . . . . . . . . . . . (260,892) (70,785)Accumulated other comprehensive (loss) income . . . . . . . . . . . . . . . . . . . . . . . . . . . . . . . . . . . (7,497) 6,568
1,048,586 660,879Less treasury stock, at cost, 81 and 0 shares, respectively . . . . . . . . . . . . . . . . . . . . . . . . . . . . . . . . . (2,207) —
Total shareholders’ equity . . . . . . . . . . . . . . . . . . . . . . . . . . . . . . . . . . . . . . . . . . . . . 1,046,379 660,879
Total liabilities and shareholders’ equity . . . . . . . . . . . . . . . . . . . . . . . . . . . . . . . . . . $3,873,604 $3,020,746
See accompanying notes to consolidated financial statements.
93

SPECTRUM BRANDS HOLDINGS, INC. AND SUBSIDIARIES
Consolidated Statements of Operations(In thousands, except per share amounts)
SuccessorCompany Predecessor Company
Year EndedSeptember 30,
2010
Period fromAugust 31, 2009
throughSeptember 30,
2009
Period fromOctober 1, 2008
throughAugust 30,
2009
Year EndedSeptember 30,
2008
Net sales . . . . . . . . . . . . . . . . . . . . . . . . . . . . . . . . . . . . . . . . $2,567,011 $219,888 $ 2,010,648 $2,426,571Cost of goods sold . . . . . . . . . . . . . . . . . . . . . . . . . . . . . . . . . 1,638,451 155,310 1,245,640 1,489,971Restructuring and related charges . . . . . . . . . . . . . . . . . . . . . 7,150 178 13,189 16,499
Gross profit . . . . . . . . . . . . . . . . . . . . . . . . . . . . . . . . . . . . . . 921,410 64,400 751,819 920,101Operating expenses:
Selling . . . . . . . . . . . . . . . . . . . . . . . . . . . . . . . . . . . . . . 466,813 39,136 363,106 506,365General and administrative . . . . . . . . . . . . . . . . . . . . . . 199,386 20,578 145,235 188,934Research and development . . . . . . . . . . . . . . . . . . . . . . 31,013 3,027 21,391 25,315Acquisition and integration related charges . . . . . . . . . 38,452 — — —Restructuring and related charges . . . . . . . . . . . . . . . . . 16,968 1,551 30,891 22,838Goodwill and intangibles impairment . . . . . . . . . . . . . . — — 34,391 861,234
752,632 64,292 595,014 1,604,686
Operating income (loss) . . . . . . . . . . . . . . . . . . . . . . . . . . . . 168,778 108 156,805 (684,585)Interest expense . . . . . . . . . . . . . . . . . . . . . . . . . . . . . . . . . . . 277,015 16,962 172,940 229,013Other expense (income), net . . . . . . . . . . . . . . . . . . . . . . . . . 12,300 (816) 3,320 1,220
Loss from continuing operations before reorganizationitems and income taxes . . . . . . . . . . . . . . . . . . . . . . . . . . . (120,537) (16,038) (19,455) (914,818)
Reorganization items expense (income), net . . . . . . . . . . . . 3,646 3,962 (1,142,809) —
(Loss) income from continuing operations before incometaxes . . . . . . . . . . . . . . . . . . . . . . . . . . . . . . . . . . . . . . . . . (124,183) (20,000) 1,123,354 (914,818)
Income tax expense (benefit) . . . . . . . . . . . . . . . . . . . . . . . . 63,189 51,193 22,611 (9,460)
(Loss) income from continuing operations . . . . . . . . . . . . . . (187,372) (71,193) 1,100,743 (905,358)(Loss) income from discontinued operations, net of tax . . . (2,735) 408 (86,802) (26,187)
Net (loss) income . . . . . . . . . . . . . . . . . . . . . . . . . . . . . . . . . $ (190,107) $ (70,785) $ 1,013,941 $ (931,545)
Basic net (loss) income per common share:(Loss) income from continuing operations . . . . . . . . . . . . . . $ (5.20) $ (2.37) $ 21.45 $ (17.78)(Loss) income from discontinued operations . . . . . . . . . . . . (0.08) 0.01 (1.69) (0.51)
Net (loss) income . . . . . . . . . . . . . . . . . . . . . . . . . . . . . . . . . $ (5.28) $ (2.36) $ 19.76 $ (18.29)
Weighted average shares of common stock outstanding . . . 36,000 30,000 51,306 50,921Diluted net (loss) income per common share:(Loss) income from continuing operations . . . . . . . . . . . . . . $ (5.20) $ (2.37) $ 21.45 $ (17.78)(Loss) income from discontinued operations . . . . . . . . . . . . (0.08) 0.01 (1.69) (0.51)
Net (loss) income . . . . . . . . . . . . . . . . . . . . . . . . . . . . . . . . . $ (5.28) $ (2.36) $ 19.76 $ (18.29)
Weighted average shares of common stock and equivalentsoutstanding . . . . . . . . . . . . . . . . . . . . . . . . . . . . . . . . . . . . 36,000 30,000 51,306 50,921
See accompanying notes to consolidated financial statements.
94

SPECTRUM BRANDS HOLDINGS, INC. AND SUBSIDIARIES
Consolidated Statements of Shareholders’ Equity (Deficit) and Comprehensive Income (Loss)(In thousands)
Common Stock AdditionalPaid-InCapital
AccumulatedDeficit
AccumulatedOther
ComprehensiveIncome (Loss),
net of taxTreasuryStock
TotalShareholders’
Equity(Deficit)Shares Amount
Balances at September 30, 2007,Predecessor Company . . . . . . . . 52,765 $ 690 $ 669,274 $ (763,370) $ 65,664 $(76,086) $ (103,828)
Net loss . . . . . . . . . . . . . . . . . . . . . . — — — (931,545) — — (931,545)Adjustment of additional minimumpension liability . . . . . . . . . . . . . — — — — 2,459 — 2,459
Valuation allowance adjustment . . . — — — — (4,060) — (4,060)Translation adjustment . . . . . . . . . . — — — — 5,236 — 5,236Other unrealized gains andlosses . . . . . . . . . . . . . . . . . . . . . — — — — 146 — 146
Comprehensive loss . . . . . . . . . . . . (927,764)Issuance of restricted stock . . . . . . . 408 4 (4) — — — —Forfeiture of restricted stock . . . . . (268) (2) 2 — — — —Treasury shares surrendered . . . . . . (130) — — — — (744) (744)Amortization of unearnedcompensation . . . . . . . . . . . . . . . — — 5,098 — — — 5,098
Balances at September 30, 2008,Predecessor Company . . . . . . . . 52,775 $ 692 $ 674,370 $(1,694,915) $ 69,445 $(76,830) $(1,027,238)
Net income . . . . . . . . . . . . . . . . . . . — — — 1,013,941 — — 1,013,941Adjustment of additional minimumpension liability . . . . . . . . . . . . . — — — — (1,160) — (1,160)
Valuation allowance adjustment . . . — — — — 5,104 — 5,104Translation adjustment . . . . . . . . . . — — — — (2,650) — (2,650)Other unrealized gains andlosses . . . . . . . . . . . . . . . . . . . . . — — — — 9,817 — 9,817
Comprehensive income . . . . . . . . . 1,025,052Issuance of restricted stock . . . . . . . 230 (1) 1 — — — —Forfeiture of restricted stock . . . . . (82) — — — — — —Treasury shares surrendered . . . . . . (185) — — — — (61) (61)Amortization of unearnedcompensation . . . . . . . . . . . . . . . — — 2,636 — — — 2,636
Cancellation of PredecessorCompany common stock . . . . . . (52,738) (691) (677,007) — — 76,891 (600,807)
Elimination of PredecessorCompany accumulated deficitand accumulated othercomprehensive income . . . . . . . . — — — 680,974 (80,556) — 600,418
Issuance of new common stock inconnection with emergence fromChapter 11 of the BankruptcyCode . . . . . . . . . . . . . . . . . . . . . . 30,000 300 724,796 — — — 725,096
Balances at August 30, 2009,Successor Company . . . . . . . . . . 30,000 $ 300 $ 724,796 $ — $ — $ — $ 725,096
See accompanying notes to consolidated financial statements.
95
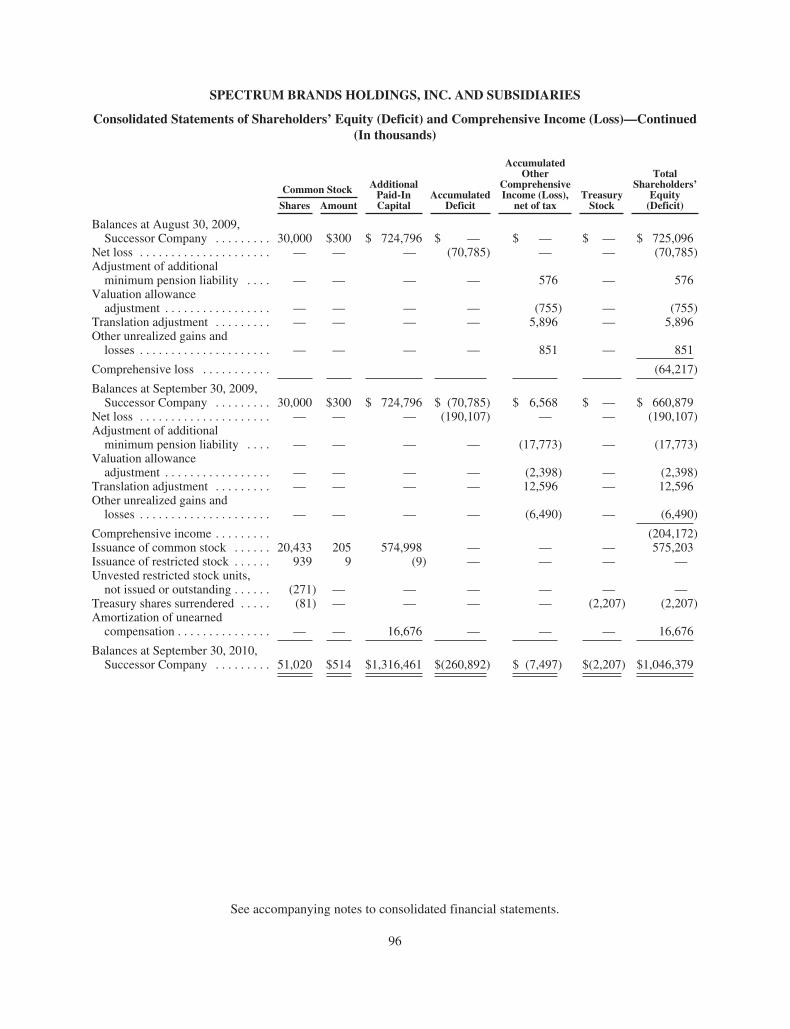
SPECTRUM BRANDS HOLDINGS, INC. AND SUBSIDIARIES
Consolidated Statements of Shareholders’ Equity (Deficit) and Comprehensive Income (Loss)—Continued(In thousands)
Common Stock AdditionalPaid-InCapital
AccumulatedDeficit
AccumulatedOther
ComprehensiveIncome (Loss),
net of taxTreasuryStock
TotalShareholders’
Equity(Deficit)Shares Amount
Balances at August 30, 2009,Successor Company . . . . . . . . . 30,000 $300 $ 724,796 $ — $ — $ — $ 725,096
Net loss . . . . . . . . . . . . . . . . . . . . . — — — (70,785) — — (70,785)Adjustment of additionalminimum pension liability . . . . — — — — 576 — 576
Valuation allowanceadjustment . . . . . . . . . . . . . . . . . — — — — (755) — (755)
Translation adjustment . . . . . . . . . — — — — 5,896 — 5,896Other unrealized gains andlosses . . . . . . . . . . . . . . . . . . . . . — — — — 851 — 851
Comprehensive loss . . . . . . . . . . . (64,217)
Balances at September 30, 2009,Successor Company . . . . . . . . . 30,000 $300 $ 724,796 $ (70,785) $ 6,568 $ — $ 660,879
Net loss . . . . . . . . . . . . . . . . . . . . . — — — (190,107) — — (190,107)Adjustment of additionalminimum pension liability . . . . — — — — (17,773) — (17,773)
Valuation allowanceadjustment . . . . . . . . . . . . . . . . . — — — — (2,398) — (2,398)
Translation adjustment . . . . . . . . . — — — — 12,596 — 12,596Other unrealized gains andlosses . . . . . . . . . . . . . . . . . . . . . — — — — (6,490) — (6,490)
Comprehensive income . . . . . . . . . (204,172)Issuance of common stock . . . . . . 20,433 205 574,998 — — — 575,203Issuance of restricted stock . . . . . . 939 9 (9) — — — —Unvested restricted stock units,not issued or outstanding . . . . . . (271) — — — — — —
Treasury shares surrendered . . . . . (81) — — — — (2,207) (2,207)Amortization of unearnedcompensation . . . . . . . . . . . . . . . — — 16,676 — — — 16,676
Balances at September 30, 2010,Successor Company . . . . . . . . . 51,020 $514 $1,316,461 $(260,892) $ (7,497) $(2,207) $1,046,379
See accompanying notes to consolidated financial statements.
96

SPECTRUM BRANDS HOLDINGS, INC. AND SUBSIDIARIES
Consolidated Statements of Cash Flows(In thousands)
SuccessorCompany Predecessor Company
Year EndedSeptember 30,
2010
Period fromAugust 31, 2009
throughSeptember 30, 2009
Period fromOctober 1, 2008
throughAugust 30, 2009
Year EndedSeptember 30,
2008
Cash flows from operating activities:Net (loss) income . . . . . . . . . . . . . . . . . . . . . . . . . . . . . . . . . . . . . . . . . . . . . . . $ (190,107) $(70,785) $ 1,013,941 $(931,545)Income (loss) from discontinued operations . . . . . . . . . . . . . . . . . . . . . . . . . . (2,735) 408 (86,802) (26,187)(Loss) income from continuing operations . . . . . . . . . . . . . . . . . . . . . . . . . . . (187,372) (71,193) 1,100,743 (905,358)Adjustments to reconcile net (loss) income to net cash provided byoperating activities:
Depreciation . . . . . . . . . . . . . . . . . . . . . . . . . . . . . . . . . . . . . . . . . . . . . . . . . . 54,822 5,158 36,745 52,236Amortization of intangibles . . . . . . . . . . . . . . . . . . . . . . . . . . . . . . . . . . . . . . . 45,920 3,513 19,099 27,687Amortization of debt issuance costs . . . . . . . . . . . . . . . . . . . . . . . . . . . . . . . . 9,030 314 13,338 8,387Amortization of unearned restricted stock compensation . . . . . . . . . . . . . . . . 16,676 — 2,636 5,098Impairment of goodwill and intangibles . . . . . . . . . . . . . . . . . . . . . . . . . . . . . — — 34,391 861,234Non-cash goodwill adjustment due to release of valuation allowance . . . . . . — 47,443 — —Fresh-start reporting adjustments . . . . . . . . . . . . . . . . . . . . . . . . . . . . . . . . . . — — (1,087,566) —Gain on cancelation of debt . . . . . . . . . . . . . . . . . . . . . . . . . . . . . . . . . . . . . . . — — (146,555) —Administrative related reorganization items . . . . . . . . . . . . . . . . . . . . . . . . . . 3,646 3,962 91,312 —Payments for administrative related reorganization items . . . . . . . . . . . . . . . . (47,173) — — —Deferred income taxes . . . . . . . . . . . . . . . . . . . . . . . . . . . . . . . . . . . . . . . . . . . 51,731 3,498 22,046 (37,237)Non-cash increase to cost of goods sold due to inventory valuations . . . . . . . 34,865 — — —Non-cash interest expense on 12% Notes . . . . . . . . . . . . . . . . . . . . . . . . . . . . 24,555 — — —Write off of unamortized discount on retired debt . . . . . . . . . . . . . . . . . . . . . 59,162 — — —Write off of debt issuance costs . . . . . . . . . . . . . . . . . . . . . . . . . . . . . . . . . . . . 6,551 — 2,358 —Non-cash restructuring and related charges . . . . . . . . . . . . . . . . . . . . . . . . . . 16,359 1,299 28,368 29,726Non-cash debt accretion . . . . . . . . . . . . . . . . . . . . . . . . . . . . . . . . . . . . . . . . . 18,302 2,861 — —Changes in assets and liabilities:Accounts receivable . . . . . . . . . . . . . . . . . . . . . . . . . . . . . . . . . . . . . . . . . . . . . 12,702 5,699 68,203 8,655Inventories . . . . . . . . . . . . . . . . . . . . . . . . . . . . . . . . . . . . . . . . . . . . . . . . . . . . (66,127) 48,995 9,004 12,086Prepaid expenses and other current assets . . . . . . . . . . . . . . . . . . . . . . . . . . . . 2,025 1,256 5,131 13,738Accounts payable and accrued liabilities . . . . . . . . . . . . . . . . . . . . . . . . . . . . 86,497 22,438 (80,463) (62,165)Other assets and liabilities . . . . . . . . . . . . . . . . . . . . . . . . . . . . . . . . . . . . . . . . (73,612) (6,565) (88,996) (18,990)
Net cash provided (used) by operating activities of continuing operations . . . . . . 68,559 68,678 29,794 (4,903)Net cash provided (used) by operating activities of discontinued operations . . . . . (11,221) 6,273 (28,187) (5,259)Net cash provided (used) by operating activities . . . . . . . . . . . . . . . . . . . . . . . . 57,338 74,951 1,607 (10,162)Cash flows from investing activities:
Purchases of property, plant and equipment . . . . . . . . . . . . . . . . . . . . . . . . . . (40,316) (2,718) (8,066) (18,928)Proceeds from sale of property, plant and equipment . . . . . . . . . . . . . . . . . . . 388 71 379 285Payments for acquisitions, net of cash acquired . . . . . . . . . . . . . . . . . . . . . . . (2,577) — (8,460) —
Net cash used by investing activities of continuing operations . . . . . . . . . . . . . . . . (42,505) (2,647) (16,147) (18,643)Net cash (used) provided by investing activities of discontinued operations . . . . . — — (855) 12,376Net cash used by investing activities . . . . . . . . . . . . . . . . . . . . . . . . . . . . . . . . . . (42,505) (2,647) (17,002) (6,267)Cash flows from financing activities:
Proceeds from new Senior Credit Facilities, excluding new ABL RevolvingCredit Facility, net of discount . . . . . . . . . . . . . . . . . . . . . . . . . . . . . . . . . . 1,474,755 — — —
Payment of extinguished senior credit facilities, excluding old ABLrevolving credit facility . . . . . . . . . . . . . . . . . . . . . . . . . . . . . . . . . . . . . . . . (1,278,760) — — —
Reduction of other debt . . . . . . . . . . . . . . . . . . . . . . . . . . . . . . . . . . . . . . . . . . (8,456) (4,603) (120,583) (425,073)Proceeds from other debt financing . . . . . . . . . . . . . . . . . . . . . . . . . . . . . . . . . 13,688 — — 477,759Debt issuance costs, net of refund . . . . . . . . . . . . . . . . . . . . . . . . . . . . . . . . . . (55,024) (287) (17,199) (152)Extinguished ABL Revolving Credit Facility . . . . . . . . . . . . . . . . . . . . . . . . . (33,225) (31,775) 65,000 —(Payments of) proceeds on supplemental loan . . . . . . . . . . . . . . . . . . . . . . . . (45,000) — 45,000 —Treasury stock purchases . . . . . . . . . . . . . . . . . . . . . . . . . . . . . . . . . . . . . . . . . (2,207) — (61) (744)
Net cash (used) provided by financing activities . . . . . . . . . . . . . . . . . . . . . . . . 65,771 (36,665) (27,843) 51,790Effect of exchange rate changes on cash and cash equivalents due to Venezuelahyperinflation . . . . . . . . . . . . . . . . . . . . . . . . . . . . . . . . . . . . . . . . . . . . . . . . . . . (8,048) — — —
Effect of exchange rate changes on cash and cash equivalents . . . . . . . . . . . . . . . . 258 1,002 (376) (441)Net increase (decrease) in cash and cash equivalents . . . . . . . . . . . . . . . . . . . . . . . 72,814 36,641 (43,614) 34,920Cash and cash equivalents, beginning of period . . . . . . . . . . . . . . . . . . . . . . . . . . . 97,800 61,159 104,773 69,853Cash and cash equivalents, end of period . . . . . . . . . . . . . . . . . . . . . . . . . . . . . . $ 170,614 $ 97,800 $ 61,159 $ 104,773
Supplemental disclosure of cash flow information:Cash paid for interest . . . . . . . . . . . . . . . . . . . . . . . . . . . . . . . . . . . . . . . . . . . . . . . . $ 136,429 $ 5,828 $ 158,380 $ 227,290Cash paid for income taxes, net . . . . . . . . . . . . . . . . . . . . . . . . . . . . . . . . . . . . . . . . 36,951 1,336 18,768 16,999
See accompanying notes to consolidated financial statements.
97

SPECTRUM BRANDS HOLDINGS, INC. AND SUBSIDIARIES
NOTES TO CONSOLIDATED FINANCIAL STATEMENTS(In thousands, except per share amounts)
(1) Description of Business
Spectrum Brands Holdings, Inc., a Delaware corporation (“SB Holdings” or the “Company”), is a global brandedconsumer products company and was created in connection with the combination of Spectrum Brands, Inc.(“Spectrum Brands”), a global branded consumer products company, and Russell Hobbs, Inc. (“Russell Hobbs”),a global branded small appliance company, to form a new combined company (the “Merger”). The Merger wasconsummated on June 16, 2010. As a result of the Merger, both Spectrum Brands and Russell Hobbs are wholly-owned subsidiaries of SB Holdings and Russell Hobbs is a wholly-owned subsidiary of Spectrum Brands. SBHoldings trades on the New York Stock Exchange under the symbol “SPB.”
In connection with the Merger, Spectrum Brands refinanced its existing senior debt and a portion of RussellHobbs’ existing senior debt through a combination of a new $750,000 United States (“U.S.”) Dollar Term Loandue June 16, 2016, new $750,000 9.5% Senior Secured Notes maturing June 15, 2018 and a new $300,000 ABLrevolving facility due June 16, 2014. (See also Note 7, Debt, for a more complete discussion of the Company’soutstanding debt.)
On February 3, 2009, Spectrum Brands, at the time a Wisconsin corporation, and each of its wholly ownedU.S. subsidiaries (collectively, the “Debtors”) filed voluntary petitions under Chapter 11 of the U.S. BankruptcyCode (the “Bankruptcy Code”), in the U.S. Bankruptcy Court for the Western District of Texas (the “BankruptcyCourt”). On August 28, 2009 (the “Effective Date”), the Debtors emerged from Chapter 11 of the BankruptcyCode. As of the Effective Date and pursuant to the Debtors’ confirmed plan of reorganization, Spectrum Brandsconverted from a Wisconsin corporation to a Delaware corporation.
Unless the context indicates otherwise, the term “Company” is used to refer to both Spectrum Brands and itssubsidiaries prior to the Merger and SB Holdings and its subsidiaries subsequent to the Merger. The term“Predecessor Company” refers only to the Company prior to the Effective Date and the term “SuccessorCompany” refers to the Company subsequent to the Effective Date. The Company’s fiscal year endsSeptember 30. References herein to Fiscal 2010, Fiscal 2009 and Fiscal 2008 refer to the fiscal years endedSeptember 30, 2010, 2009 and 2008, respectively.
Prior to and including August 30, 2009, all operations of the business resulted from the operations of thePredecessor Company. In accordance with ASC Topic 852: “Reorganizations,” (“ASC 852”) the Companydetermined that all conditions required for the adoption of fresh-start reporting were met upon emergence fromChapter 11 of the Bankruptcy Code on the Effective Date. However in light of the proximity of that date to theCompany’s August accounting period close, which was August 30, 2009, the Company elected to adopt aconvenience date of August 30, 2009, (the “Fresh-Start Adoption Date”) for recording fresh-start reporting. TheCompany analyzed the transactions that occurred during the two-day period from August 29, 2009, the day afterthe Effective Date, and August 30, 2009, the Fresh-Start Adoption Date, and concluded that such transactionsrepresented less than one-percent of the total net sales during Fiscal 2009. As a result, the Company determinedthat August 30, 2009 would be an appropriate Fresh-Start Adoption Date to coincide with the Company’s normalfinancial period close for the month of August 2009. As a result, the fair value of the Predecessor Company’sassets and liabilities became the new basis for the Successor Company’s Consolidated Statement of FinancialPosition as of the Fresh-Start Adoption Date, and all operations beginning August 31, 2009 are related to theSuccessor Company. Financial information of the Company’s financial statements prepared for the PredecessorCompany will not be comparable to financial information for the Successor Company. The Company is a globalbranded consumer products company with positions in seven major product categories: consumer batteries; smallappliances; pet supplies; electric shaving and grooming; electric personal care; portable lighting; and home andgarden control.
98

SPECTRUM BRANDS HOLDINGS, INC. AND SUBSIDIARIES
NOTES TO CONSOLIDATED FINANCIAL STATEMENTS—(Continued)(In thousands, except per share amounts)
The Company manages its business in four reportable segments: (i) Global Batteries & Personal Care,which consists of the Company’s worldwide battery, shaving and grooming, personal care and portable lightingbusiness (“Global Batteries & Personal Care”); (ii) Global Pet Supplies, which consists of the Company’sworldwide pet supplies business (“Global Pet Supplies”); (iii) Home and Garden Business, which consists of theCompany’s lawn and garden and insect control businesses (the “Home and Garden Business”); and (iv) SmallAppliances, which resulted from the acquisition of Russell Hobbs and consists of small electrical appliancesprimarily in the kitchen and home product categories (“Small Appliances”).
The Company’s operations include the worldwide manufacturing and marketing of alkaline, zinc carbon andhearing aid batteries, as well as aquariums and aquatic health supplies and the designing and marketing ofrechargeable batteries, battery-powered lighting products, electric shavers and accessories, grooming productsand hair care appliances. The Company’s operations also include the manufacturing and marketing of specialtypet supplies. The Company also manufactures and markets herbicides, insecticides and repellents in NorthAmerica. With the addition of Russell Hobbs the Company designs, markets and distributes a broad range ofbranded small appliances and personal care products. The Company’s operations utilize manufacturing andproduct development facilities located in the U.S., Europe, Asia and Latin America.
The Company sells its products in approximately 120 countries through a variety of trade channels,including retailers, wholesalers and distributors, hearing aid professionals, industrial distributors and originalequipment manufacturers and enjoys name recognition in its markets under the Rayovac, VARTA andRemington brands, each of which has been in existence for more than 80 years, and under the Tetra, 8in1,Spectracide, Cutter, Black & Decker, George Foreman, Russell Hobbs, Farberware and various other brands.
(2) Voluntary Reorganization Under Chapter 11
On February 3, 2009, the Predecessor Company announced that it had reached agreements with certainnoteholders, representing, in the aggregate, approximately 70% of the face value of the Company’s thenoutstanding senior subordinated notes, to pursue a refinancing that, if implemented as proposed, wouldsignificantly reduce the Predecessor Company’s outstanding debt. On the same day, the Debtors filed voluntarypetitions under Chapter 11 of the Bankruptcy Code, in the Bankruptcy Court (the “Bankruptcy Filing”) and filedwith the Bankruptcy Court a proposed plan of reorganization (the “Proposed Plan”) that detailed the Debtors’proposed terms for the refinancing. The Chapter 11 cases were jointly administered by the Bankruptcy Court asCase No. 09-50455 (the “Bankruptcy Cases”).
The Bankruptcy Court entered a written order (the “Confirmation Order”) on July 15, 2009 confirming theProposed Plan (as so confirmed, the “Plan”).
Plan Effective Date
On the Effective Date the Plan became effective, and the Debtors emerged from Chapter 11 of theBankruptcy Code. Pursuant to and by operation of the Plan, on the Effective Date, all of Predecessor Company’sexisting equity securities, including the existing common stock and stock options, were extinguished and deemedcancelled. Spectrum Brands filed a certificate of incorporation authorizing new shares of common stock.Pursuant to and in accordance with the Plan, on the Effective Date, Successor Company issued a total of 27,030shares of common stock and $218,076 of 12% Senior Subordinated Toggle Notes due 2019 (the “12% Notes”) toholders of allowed claims with respect to Predecessor Company’s 81⁄2% Senior Subordinated Notes due 2013(the “81⁄2 Notes”), 73⁄8% Senior Subordinated Notes due 2015 (the “73⁄8 Notes”) and Variable Rate ToggleSenior Subordinated Notes due 2013 (the “Variable Rate Notes”) (collectively, the “Senior SubordinatedNotes”). (See also Note 7, Debt, for a more complete discussion of the 12% Notes.) Also on the Effective Date,
99

SPECTRUM BRANDS HOLDINGS, INC. AND SUBSIDIARIES
NOTES TO CONSOLIDATED FINANCIAL STATEMENTS—(Continued)(In thousands, except per share amounts)
Successor Company issued a total of 2,970 shares of common stock to supplemental and sub-supplementaldebtor-in-possession facility participants in respect of the equity fee earned under the Debtors’debtor-in-possession credit facility.
Accounting for Reorganization
Subsequent to the date of the Bankruptcy Filing (the “Petition Date”), the Company’s financial statementsare prepared in accordance with ASC 852. ASC 852 does not change the application of U.S. Generally AcceptedAccounting Principles (“GAAP”) in the preparation of the Company’s consolidated financial statements.However, ASC 852 does require that financial statements, for periods including and subsequent to the filing of aChapter 11 petition, distinguish transactions and events that are directly associated with the reorganization fromthe ongoing operations of the business. In accordance with ASC 852 the Company has done the following:
• On the four column consolidated statement of financial position as of August 30, 2009, which isincluded in this Note 2, Voluntary Reorganization Under Chapter 11, separated liabilities that aresubject to compromise from liabilities that are not subject to compromise;
• On the accompanying Consolidated Statements of Operations, distinguished transactions and eventsthat are directly associated with the reorganization from the ongoing operations of the business;
• On the accompanying Consolidated Statements of Cash Flows, separately disclosed Reorganizationitems expense (income), net, consisting of the following: (i) Fresh-start reporting adjustments; (ii) Gainon cancelation of debt; and (iii) Administrative related reorganization items; and
• Ceased accruing interest on the Predecessor Company’s then outstanding senior subordinated notes.
Liabilities Subject to Compromise
Liabilities subject to compromise refer to known liabilities incurred prior to the Bankruptcy Filing by thoseentities that filed for Chapter 11 bankruptcy. These liabilities are considered by the Bankruptcy Court to bepre-petition claims. However, liabilities subject to compromise exclude pre-petition claims for which theCompany has received the Bankruptcy Court’s approval to pay, such as claims related to active employees andretirees and claims related to certain critical service vendors. Liabilities subject to compromise are subject tofuture adjustments that may result from negotiations, actions by the Bankruptcy Court and developments withrespect to disputed claims or matters arising out of the proof of claims process whereby a creditor may prove thatthe amount of a claim differs from the amount that the Company has recorded.
Since the Petition Date, and in accordance with ASC 852, the Company ceased accruing interest on itssenior subordinated notes, as such debt and interest would be an allowed claim by the Bankruptcy Court. ThePredecessor Company’s contractual interest on the Senior Subordinated Notes in excess of reported interest wasapproximately $55,654 for the period from October 1, 2008 through August 30, 2009.
Liabilities subject to compromise as of August 30, 2009 for the Predecessor Company were as follows:
August 30,2009
Senior Subordinated Notes . . . . . . . . . . . . . . . . . . . . . . . . . . . . . . . . . . . . . . . . $ 1,049,885Accrued interest on Senior Subordinated Notes . . . . . . . . . . . . . . . . . . . . . . . . 40,497Other accrued liabilities . . . . . . . . . . . . . . . . . . . . . . . . . . . . . . . . . . . . . . . . . . . 15,580(A)
Predecessor Company Balance . . . . . . . . . . . . . . . . . . . . . . . . . . . . . . . . . $ 1,105,962Effects of Plan . . . . . . . . . . . . . . . . . . . . . . . . . . . . . . . . . . . . . . . . . . . . . . . . . . (1,105,962)
Successor Company Balance . . . . . . . . . . . . . . . . . . . . . . . . . . . . . . . . . . . $ —
100

SPECTRUM BRANDS HOLDINGS, INC. AND SUBSIDIARIES
NOTES TO CONSOLIDATED FINANCIAL STATEMENTS—(Continued)(In thousands, except per share amounts)
(A) As discussed below in the four column consolidated statement of financial position as of August 30, 2009“Effects of Plan Adjustments,” note (f), the $15,580 relates to rejected lease obligations that are to be paidby the Successor Company in subsequent periods.
Reorganization Items
In accordance with ASC 852, reorganization items are presented separately in the accompanyingConsolidated Statements of Operations and represent expenses, income, gains and losses that the Company hasidentified as directly relating to the Bankruptcy Cases. Reorganization items expense (income), net during Fiscal2010 and during the period from August 31, 2009 through September 30, 2009 and the period from October 1,2008 through August 30, 2009 are summarized as follows:
Successor Company Predecessor Company
Year EndedSeptember 30,
2010
Period fromAugust 31,
2009 throughSeptember 30,
2009
Period fromOctober 1,
2008 throughAugust 30,
2009
Legal and professional fees . . . . . . . . . . . . . . $3,536 $3,962 $ 74,624Deferred financing costs . . . . . . . . . . . . . . . . . — — 10,668Provision for rejected leases . . . . . . . . . . . . . . 110 — 6,020
Administrative related reorganizationitems . . . . . . . . . . . . . . . . . . . . . . . . . . . . . . $3,646 $3,962 $ 91,312
Gain on cancellation of debt . . . . . . . . . . . . . . — — (146,555)Fresh-start reporting adjustments . . . . . . . . . . — — (1,087,566)
Reorganization items expense (income),net . . . . . . . . . . . . . . . . . . . . . . . . . . . . . . . . $3,646 $3,962 $(1,142,809)
Fresh-Start Reporting
The Company, in accordance with ASC 852, adopted fresh-start reporting as of the close of business onAugust 30, 2009 since the reorganization value of the assets of the Predecessor Company immediately before thedate of confirmation of the Plan was less than the total of all post-petition liabilities and allowed claims, and theholders of the Predecessor Company’s voting shares immediately before confirmation of the Plan received lessthan 50 percent of the voting shares of the emerging entity. The four-column consolidated statement of financialposition as of August 30, 2009, included herein, applies effects of the Plan and fresh-start reporting to thecarrying values and classifications of assets or liabilities that were necessary.
The Company analyzed the transactions that occurred during the two-day period from August 29, 2009, theday after the Effective Date, and August 30, 2009, the fresh-start reporting date, and concluded that suchtransactions were not material individually or in the aggregate as such transactions represented less thanone-percent of the total net sales for the fiscal year ended September 30, 2009. As a result, the Companydetermined that August 30, 2009, would be an appropriate fresh-start reporting date to coincide with theCompany’s normal financial period close for the month of August 2009. Upon adoption of fresh-start reporting,the recorded amounts of assets and liabilities were adjusted to reflect their estimated fair values. Accordingly, thereported historical financial statements of the Predecessor Company prior to the adoption of fresh-start reportingfor periods ended on or prior to August 30, 2009 are not comparable to those of the Successor Company.
101

SPECTRUM BRANDS HOLDINGS, INC. AND SUBSIDIARIES
NOTES TO CONSOLIDATED FINANCIAL STATEMENTS—(Continued)(In thousands, except per share amounts)
The four-column consolidated statement of financial position as of August 30, 2009 reflects theimplementation of the Plan as if the Plan had been effective on August 30, 2009. Reorganization adjustmentshave been recorded within the consolidated statement of financial position as of August 30, 2009 to reflecteffects of the Plan, including the discharge of Liabilities subject to compromise and the adoption of fresh-startreporting in accordance with ASC 852. The Bankruptcy Court confirmed the Plan based upon a reorganizationvalue of the Company between $2,200,000 and $2,400,000, which was estimated using various valuationmethods including: (i) publicly traded company analysis, (ii) discounted cash flow analysis; and (iii) a reviewand analysis of several recent transactions of companies in similar industries to the Company. These threevaluation methods were equally weighted in determining the final range of reorganization value as confirmed bythe Bankruptcy Court. Based upon the factors used in determining the range of reorganization value, theCompany concluded that $2,275,000 should be used for fresh-start reporting purposes as it most closelyapproximated fair value.
The basis of the discounted cash flow analysis used in developing the reorganization value was based onCompany prepared projections which included a variety of estimates and assumptions. While the Companyconsiders such estimates and assumptions reasonable, they are inherently subject to significant business,economic and competitive uncertainties, many of which are beyond the Company’s control and, therefore, maynot be realized. Changes in these estimates and assumptions may have had a significant effect on thedetermination of the Company’s reorganization value. The assumptions used in the calculations for thediscounted cash flow analysis included projected revenue, costs, and cash flows, for the fiscal years endingSeptember 30, 2009, 2010, 2011, 2012 and 2013 and represented the Company’s best estimates at the time theanalysis was prepared. The Company’s estimates implicit in the cash flow analysis included net sales growth ofapproximately 1.5% for the fiscal year ending September 30, 2010 and 4.0% per year for each of the fiscal yearsending September 30, 2011, 2012 and 2013. In addition, selling, general and administrative expenses, excludingdepreciation and amortization, were projected to grow at rates relative to net sales, however, certain expensecategories for each of the fiscal years ending September 30, 2010, 2011, 2012 and 2013 were reduced for theprojected impact of various cost reduction initiatives implemented by the Company during Fiscal 2009 whichincluded lower trade spending, salary freezes, reduced marketing expenses, furloughs, suspension of theCompany’s match to its 401(k) and reductions in salaries of certain members of management. The analysis alsoincluded anticipated levels of reinvestment in the Company’s operations through capital expenditures ofapproximately $25,000 per year. The Company did not include in its estimates the potential effects of litigation,either on the Company or the industry. The foregoing estimates and assumptions are inherently subject touncertainties and contingencies beyond the control of the Company. Accordingly, there can be no assurance thatthe estimates, assumptions, and values reflected in the valuations will be realized, and actual results could varymaterially.
The publicly traded company analysis identified a group of comparable companies giving consideration tolines of business, business risk, scale and capitalization and leverage. This analysis involved the selection of theappropriate earnings before interest, taxes, depreciation and amortization (“EBITDA”) market multiples bysegment deemed to be the most relevant when analyzing the peer group. A range of valuation multiples was thenidentified and applied to the Company’s Fiscal 2009 and Fiscal 2010 projections by segment to determine anestimate of reorganization values. The market multiple ranges used by segment were as follows: (i) GlobalBatteries and Personal Care used a range of 7.0x-8.0x for Fiscal 2009 and 6.5x-7.5x for Fiscal 2010; (ii) GlobalPet Supplies used a range of 7.5x-8.5x for Fiscal 2009 and 7.0x-8.0x for Fiscal 2010; and (iii) the Home andGarden Business used a range of 9.0x-10.0x for Fiscal 2009 and 8.0x-9.0x for Fiscal 2010. Theses multiples werebased on estimated EBITDA adjusted for certain non-recurring initiatives, as mentioned above.
102

SPECTRUM BRANDS HOLDINGS, INC. AND SUBSIDIARIES
NOTES TO CONSOLIDATED FINANCIAL STATEMENTS—(Continued)(In thousands, except per share amounts)
The recent transactions of companies in similar industries analysis identified transactions of similarcompanies giving consideration to lines of business, business risk, scale and capitalization and leverage. Theanalysis considered the business, financial and market environment for which the transactions took place,circumstances surrounding the transaction including the financial position of the buyers and the perceivedsynergies and benefits that the buyers could obtain from the transaction. This analysis involved the determinationof historical acquisition EBITDA multiples by examining public merger and acquisition transactions. A range ofvaluation multiples was then identified and applied to historical EBITDA by segment to determine an estimate ofreorganization values. The multiple ranges used by segment were as follows: (i) Global Batteries and PersonalCare used a range of 6.5x-7.5x; (ii) Global Pet Supplies used a range of 9.5x-10.5x; and (iii) the Home andGarden Business used a range of 8.0x-9.0x. These multiples were based on Fiscal 2009 estimated EBITDAadjusted for certain non-recurring initiatives, as mentioned above.
Fresh-start adjustments reflect the allocation of fair value to the Successor Company’s long-lived assets andthe present value of liabilities to be paid as calculated by the Company.
In applying fresh-start reporting, the Company followed these principles:
• The reorganization value of the entity was allocated to the entity’s assets in conformity with theprocedures specified by SFAS No. 141, “Business Combinations” (“SFAS 141”). The reorganizationvalue exceeded the sum of the amounts assigned to assets and liabilities. This excess was recorded asSuccessor Company goodwill as of August 30, 2009.
• Each liability existing as of the fresh-start reporting date, other than deferred taxes, has been stated atthe present value of the amounts to be paid, determined at appropriate risk adjusted interest rates.
• Deferred taxes were reported in conformity with applicable income tax accounting standards,principally ASC Topic 740: “Income Taxes,” formerly SFAS No. 109, “Accounting for Income Taxes”(“ASC 740”). Deferred tax assets and liabilities have been recognized for differences between theassigned values and the tax basis of the recognized assets and liabilities.
• Adjustment of all of the property, plant and equipment assets to fair value and eliminating all of theaccumulated depreciation.
• Adjustment of the Company’s pension plans projected benefit obligation by recognition of allpreviously unamortized actuarial gains and losses.
103

SPECTRUM BRANDS HOLDINGS, INC. AND SUBSIDIARIES
NOTES TO CONSOLIDATED FINANCIAL STATEMENTS—(Continued)(In thousands, except per share amounts)
The following four-column consolidated statement of financial position table identifies the adjustmentsrecorded to the Predecessor Company’s August 30, 2009 consolidated statement of financial position as a resultof implementing the Plan and applying fresh-start reporting:
PredecessorCompany
SuccessorCompany
August 30, 2009 Effects of PlanFresh-StartValuation August 30, 2009
ASSETSCurrent assets:
Cash and cash equivalents . . . . . . . . . . . . . . . . . . . . . . $ 86,710 $ (25,551)(a) $ — $ 61,159Receivables:
Trade accounts receivable . . . . . . . . . . . . . . . . . . 270,657 — — 270,657Other . . . . . . . . . . . . . . . . . . . . . . . . . . . . . . . . . . 34,594 — — 34,594
Inventories . . . . . . . . . . . . . . . . . . . . . . . . . . . . . . . . . . 341,738 — 48,762(m) 390,500Deferred income taxes . . . . . . . . . . . . . . . . . . . . . . . . 12,644 1,707(h) 9,330(n) 23,681Assets held for sale . . . . . . . . . . . . . . . . . . . . . . . . . . . 10,813 — 1,978(m) 12,791Prepaid expenses and other . . . . . . . . . . . . . . . . . . . . . 40,448 — (116)(m) 40,332
Total current assets . . . . . . . . . . . . . . . . . . . 797,604 (23,844) 59,954 833,714Property, plant and equipment, net . . . . . . . . . . . . . . . . . . . 178,786 — 34,699(m) 213,485Deferred charges and other . . . . . . . . . . . . . . . . . . . . . . . . . 42,068 — (6,046)(m) 36,022Goodwill . . . . . . . . . . . . . . . . . . . . . . . . . . . . . . . . . . . . . . . 238,905 — 289,155(o) 528,060Intangible assets, net . . . . . . . . . . . . . . . . . . . . . . . . . . . . . . 677,050 — 782,450(o) 1,459,500Debt issuance costs . . . . . . . . . . . . . . . . . . . . . . . . . . . . . . . 18,457 8,949(b) (17,957)(p) 9,449
Total assets . . . . . . . . . . . . . . . . . . . . . . . . . $ 1,952,870 $ (14,895) $1,142,255 $3,080,230
LIABILITIES AND SHAREHOLDERS’ EQUITYCurrent liabilities:
Current maturities of long-term debt . . . . . . . . . . . . . $ 93,313 $ (3,445)(c) $ (4,329)(m)$ 85,539Accounts payable . . . . . . . . . . . . . . . . . . . . . . . . . . . . 159,370 (204)(d) — 159,166Accrued liabilities:
Wages and benefits . . . . . . . . . . . . . . . . . . . . . . . 80,247 — — 80,247Income taxes payable . . . . . . . . . . . . . . . . . . . . . 20,059 — — 20,059Restructuring and related charges . . . . . . . . . . . . 26,100 — — 26,100Accrued interest . . . . . . . . . . . . . . . . . . . . . . . . . 59,724 (59,581)(e) — 143Other . . . . . . . . . . . . . . . . . . . . . . . . . . . . . . . . . . 118,949 9,133(f) (3,503)(m) 124,579
Total current liabilities . . . . . . . . . . . . . . . . 557,762 (54,097) (7,832) 495,833Long-term debt, net of current maturities . . . . . . . . . . . . . . 1,329,047 271,806(g) (75,329)(m) 1,525,524Employee benefit obligations, net of current portion . . . . . 41,385 — 18,712(m) 60,097Deferred income taxes . . . . . . . . . . . . . . . . . . . . . . . . . . . . 106,853 1,707(h) 114,211(n) 222,771Other . . . . . . . . . . . . . . . . . . . . . . . . . . . . . . . . . . . . . . . . . . 45,982 — 4,927(m) 50,909
Total liabilities . . . . . . . . . . . . . . . . . . . . . . 2,081,029 219,416 54,689 2,355,134Liabilities subject to compromise . . . . . . . . . . . . . . . . . . . . 1,105,962 (1,105,962)(i) — —Commitments and contingenciesShareholders’ (deficit) equity:
Common stock-Old (Predecessor Company) . . . . . . . 691 (691)(j) — —Common stock-New (Successor Company) . . . . . . . . — 300(j) — 300Additional paid-in capital . . . . . . . . . . . . . . . . . . . . . . 677,007 47,789(j) — 724,796Accumulated (deficit) equity . . . . . . . . . . . . . . . . . . . (1,915,484) 747,362(k) 1,168,122(q) —Accumulated other comprehensive income . . . . . . . . 80,556 — (80,556)(q) —
(1,157,230) 794,760 1,087,566 725,096Less treasury stock . . . . . . . . . . . . . . . . . . . . . . . . . . . . . . . (76,891) 76,891(l) — —
Total shareholders’ (deficit) equity . . . . . . . (1,234,121) 871,651 1,087,566 725,096
Total liabilities and shareholders’ (deficit)equity . . . . . . . . . . . . . . . . . . . . . . . . . . . . $ 1,952,870 $ (14,895) $1,142,255 $3,080,230
104

SPECTRUM BRANDS HOLDINGS, INC. AND SUBSIDIARIES
NOTES TO CONSOLIDATED FINANCIAL STATEMENTS—(Continued)(In thousands, except per share amounts)
Effects of Plan Adjustments
(a) The Plan’s impact resulted in a net decrease of $25,551 on cash and cash equivalents. The significantsources and uses of cash were as follows:
Sources:Amounts borrowed under the exit facility . . . . . . . . . . . . . . . . . . . . . . . . . . . . . . . $ 65,000Amounts borrowed under new supplemental loan agreement . . . . . . . . . . . . . . . . 45,000
Total Sources . . . . . . . . . . . . . . . . . . . . . . . . . . . . . . . . . . . . . . . . . . . . . . . . . $110,000
Uses:Repayment of un-reimbursed letters of credit . . . . . . . . . . . . . . . . . . . . . . . . . . . . $ 20,005Repayment of supplemental loans . . . . . . . . . . . . . . . . . . . . . . . . . . . . . . . . . . . . . 45,000Repayment of certain amounts under the term loan agreement, currentportion . . . . . . . . . . . . . . . . . . . . . . . . . . . . . . . . . . . . . . . . . . . . . . . . . . . . . . . . 3,440
Repayment of certain amounts under the term loan agreement, net of currentportion . . . . . . . . . . . . . . . . . . . . . . . . . . . . . . . . . . . . . . . . . . . . . . . . . . . . . . . . 3,440
Payment of pre-petition foreign exchange contracts recorded in accountspayable . . . . . . . . . . . . . . . . . . . . . . . . . . . . . . . . . . . . . . . . . . . . . . . . . . . . . . . . 204
Payment of lender cure payments, terminated derivative contracts and other . . . . 48,066Payment of debt issuance costs on exit facility . . . . . . . . . . . . . . . . . . . . . . . . . . . 8,949Payment of other accrued liabilities . . . . . . . . . . . . . . . . . . . . . . . . . . . . . . . . . . . . 6,447
Total Uses . . . . . . . . . . . . . . . . . . . . . . . . . . . . . . . . . . . . . . . . . . . . . . . . . . . . $135,551
Net Cash Uses . . . . . . . . . . . . . . . . . . . . . . . . . . . . . . . . . . . . . . . . . . . . . . . . $ (25,551)
(b) The Company incurred $8,949 of debt issuance costs under the exit facility. These debt issuance costs areclassified as long-term assets and are amortized over the life of the exit facility.
(c) The adjustment to current maturities of long-term debt reflects the $20,005 payment of the PredecessorCompany’s un-reimbursed letters of credit, the $45,000 repayment of the Predecessor Company’ssupplemental loan, and the $3,440 payment of certain amounts under the term loan agreement. Theadjustment to current maturities of long-term debt also reflects the $65,000 funding from the exit facility.The adjustment to the current maturities of long-term debt are:
Repayment of unreimbursed letters of credit . . . . . . . . . . . . . . . . . . . . . . . . . . . . . $ 20,005Repayment of supplemental loan . . . . . . . . . . . . . . . . . . . . . . . . . . . . . . . . . . . . . . 45,000Repayment of certain amounts under the term loan agreement, current portion . . 3,440Amounts borrowed under the exit facility . . . . . . . . . . . . . . . . . . . . . . . . . . . . . . . (65,000)
$ 3,445
(d) Reflects payment of $204 related to pre-petition foreign exchange derivative contracts.(e) Total adjustment of $59,581 reflects term lender cure payments of $33,995, terminated interest rate swap
derivative contract payments of $12,068 and other accrued interest of $2,003. Additionally, this adjustmentincludes $11,515 of accrued default interest as provided in the August 2009 amendment of the Senior TermCredit Facility, which was assumed by the Successor Company and included in the principal balance of theloans at emergence (See Note 7, Debt, for additional information).
(f) Reflects the payment of professional fees related to the reorganization in the amount of $6,447 offset by thereclassification of $15,580 related to rejected lease obligations previously recorded as liabilities subject tocompromise (see note(i)). These rejected lease obligations were paid by the Successor Company insubsequent periods. As of September 30, 2009, the Company’s rejected lease obligation was reduced to$6,181.
105

SPECTRUM BRANDS HOLDINGS, INC. AND SUBSIDIARIES
NOTES TO CONSOLIDATED FINANCIAL STATEMENTS—(Continued)(In thousands, except per share amounts)
(g) The adjustment to long-term debt represents the issuance of the 12% Notes at a fair value of $218,731 (facevalue of $218,076) used, in part, to extinguish the Senior Subordinated Notes of the debtors that wererecorded in liabilities subject to compromise (see note (i)), the issuance of the new supplemental loan in theamount of $45,000, offset by the payment of the non-current portion of the term loan in the amount of$3,440 (see note (a)). The excess of fair value over face value of the 12% Notes is recorded in long-termdebt and will be accreted as a reduction to interest expense over the life of the note.
Issuance of the 12% Notes (fair value) . . . . . . . . . . . . . . . . . . . . . . . . . . . . . . . . . $218,731Amounts borrowed under the new supplemental loan agreement . . . . . . . . . . . . . 45,000Accrued default interest . . . . . . . . . . . . . . . . . . . . . . . . . . . . . . . . . . . . . . . . . . . . . 11,515Repayment of certain amounts under the term loan agreement, net of currentportion . . . . . . . . . . . . . . . . . . . . . . . . . . . . . . . . . . . . . . . . . . . . . . . . . . . . . . . . (3,440)
$271,806
(h) Gain on the cancellation of debt from the extinguishment of the senior subordinated notes as well as themodification of the senior term credit facility, for tax purposes, resulted in a $124,054 reduction in the U.S.net deferred tax asset, exclusive of indefinite-lived intangibles. Due to the Company’s full valuationallowance position as of August 30, 2009 on the U.S. net deferred tax asset, exclusive of indefinite-livedintangibles, the tax effect of these items is offset by a corresponding adjustment to the valuation allowanceof $124,054. Due to changes in the relative current versus non-current deferred tax asset balances and thecorresponding allocation of the domestic valuation allowance, a net $1,707 deferred tax balancereclassification occurred between current and non-current as a result of the effects of the Plan.
(i) The adjustment to liabilities subject to compromise relates to the extinguishment of the Senior SubordinatedNotes balance of $1,049,885 and the accrued interest of $40,497 associated with the Senior SubordinatedNotes. Additionally, rejected lease obligations of $15,580 were reclassified to other current liabilities (seenote (f)).
(j) Pursuant to the Plan, the debtor’s common stock was canceled and new common stock of the reorganizeddebtors was issued. The adjustments eliminated Predecessor Company’s common stock and additionalpaid-in capital of $691 and $677,007, respectively, and recorded Successor Company’s common stock andadditional paid-in capital of $300 and $724,796, respectively, which represents the fair value of the newlyissued common stock. The fair value of the newly issued common stock was not separately valued. A fairvalue of $725,096 was determined by subtracting the fair value of net debt (total debt less cash and cashequivalents), or $1,549,904 from the enterprise value of $2,275,000. The Company issued 30,000 shares atemergence, consisting of 27,030 shares to holders of the Senior Subordinated Notes allowed note holderclaims and 2,970 shares in accordance with the terms of the Debtors’ debtor-in-possession credit facility.
(k) As a result of the Plan, the adjustment to accumulated (deficit) equity recorded the elimination of thePredecessor Company’s common stock, additional paid in capital and treasury stock in the amount of$600,807 and recorded the pre-tax gain on the cancellation of debt in the amount of $146,555. Theelimination of the Predecessor Company’s common stock, additional paid in capital and treasury stock wascalculated as follows:
Elimination of Predecessor Company’s common stock (see note (j)) . . . . . . . . . . . $ 691Elimination of Predecessor Company’s additional paid in capital (see note (j)) . . . 677,007Elimination of Predecessor Company’s treasury stock (see note (l)) . . . . . . . . . . . (76,891)
Elimination of Predecessor Company’s common stock . . . . . . . . . . . . . . . . . . . . . . $600,807
106

SPECTRUM BRANDS HOLDINGS, INC. AND SUBSIDIARIES
NOTES TO CONSOLIDATED FINANCIAL STATEMENTS—(Continued)(In thousands, except per share amounts)
The pre-tax gain on the cancellation of debt was calculated as follows:
Extinguishment of Predecessor Company senior subordinated notes . . . . . . . . . $1,049,885Extinguishment of Predecessor Company accrued interest on seniorsubordinated notes . . . . . . . . . . . . . . . . . . . . . . . . . . . . . . . . . . . . . . . . . . . . . . 40,497
Issuance of Successor Company 12% Notes (fair value) . . . . . . . . . . . . . . . . . . (218,731)Issuance of Successor Company common stock . . . . . . . . . . . . . . . . . . . . . . . . . (725,096)
Pre-tax gain on the cancellation of debt . . . . . . . . . . . . . . . . . . . . . . . . . . . . . . . $ 146,555
(l) Pursuant to the Plan, the adjustment eliminates treasury stock of $76,891 of the Predecessor Company.
Fresh-Start Valuation Adjustments
(m) Reflects the adjustment of assets and liabilities to estimated fair value, or other measurement specified bySFAS 141, in conjunction with the adoption of fresh-start reporting. Significant adjustments are summarizedas followed:
• Inventories – An adjustment of $48,762 was recorded to adjust inventory to fair value. Raw materialswere valued at current replacement cost, work-in-process was valued at estimated selling prices offinished goods less the sum of costs to complete, cost of disposal and a reasonable profit allowance forcompleting and selling effort based on profit for similar finished goods. Finished goods were valued atestimated selling prices less the sum of costs of disposal and a reasonable profit allowance for theselling effort.
• Property, plant and equipment, net – An adjustment of $34,699 was recorded to adjust the net bookvalue of property, plant and equipment to fair value giving consideration to their highest and best use.Key assumptions used in the valuation of the Company’s property, plant and equipment were based ona combination of the cost or market approach, depending on whether market data was available.
• Current maturities of long-term debt and Long-term debt, net of current maturities – An adjustment of$79,658 ($4,329 to Current maturities of long-term debt and $75,329 to Long-term debt, net of currentmaturities) was recorded to adjust the book value of debt to fair value. This adjustment included adecrease of $84,001 which was based on quoted market prices of certain debt instruments as of theEffective Date, offset by an increase of $4,343 related to debt instruments not traded which wascalculated giving consideration to the terms of the underlying agreements, using a risk adjusted interestrate of 12%.
• Employee benefit obligations, net of current portion – An adjustment of $18,712 was recorded tomeasure the employee benefit obligations as of the Effective Date. This adjustment primarily reflectsthe difference between the expected return on plan assets as compared to the fair value of the planassets as of the Effective Date and the change in the duration weighted discount rate associated with thepayment of the benefit obligations from the prior measurement date and the Effective Date. Theweighted average discount rate change from 6.75% at September 30, 2008 to 5.75% at August 30,2009.
(n) Reflects the tax effects of the fresh-start adjustments at statutory tax rates applicable to such adjustments,net of adjustments to the valuation allowance.
107

SPECTRUM BRANDS HOLDINGS, INC. AND SUBSIDIARIES
NOTES TO CONSOLIDATED FINANCIAL STATEMENTS—(Continued)(In thousands, except per share amounts)
(o) Adjustment eliminated the balance of goodwill and other unamortized intangible assets of the PredecessorCompany and records Successor Company intangible assets, including reorganization value in excess ofamounts allocated to identified tangible and intangible assets, also referred to as Successor Companygoodwill. (See Note 6, Goodwill and Intangible Assets, for additional information regarding the Company’sgoodwill and other intangible assets). The Successor Company’s August 30, 2009 statement of financialposition reflects the allocation of the business enterprise value to assets and liabilities immediatelyfollowing emergence as follows:
Business enterprise value . . . . . . . . . . . . . . . . . . . . . . . . . . . . . . . . . . . . . . . . . . $ 2,275,000Add: Fair value of non-interest bearing liabilities (non-debt liabilities) . . . . . . 744,071Less: Fair value of tangible assets, excluding cash . . . . . . . . . . . . . . . . . . . . . . (1,031,511)Less: Fair value of identified intangible assets . . . . . . . . . . . . . . . . . . . . . . . . . (1,459,500)
Reorganization value of assets in excess of amounts allocated to identifiedtangible and intangible assets (Successor Company goodwill) . . . . . . . . . . . $ 528,060
The following represent the methodologies and significant assumptions used in determining the fair value ofintangible assets, other than goodwill.
Certain indefinite-lived intangible assets which include trade names, trademarks and technology, werevalued using a relief from royalty methodology. Customer relationships were valued using a multi-period excessearnings method. Certain intangible assets are subject to sensitive business factors of which only a portion arewithin control of the Company’s management. A summary of the key inputs used in the valuation of these assetsare as follows:
• The Company valued customer relationships using the income approach, specifically the multi-periodexcess earnings method. In determining the fair value of the customer relationship, the multi-periodexcess earnings approach values the intangible asset at the present value of the incremental after-taxcash flows attributable only to the customer relationship after deducting contributory asset charges. Theincremental after-tax cash flows attributable to the subject intangible asset are then discounted to theirpresent value. Only expected sales from current customers were used which included an expectedgrowth rate of 3%. The Company assumed a customer retention rate of 95% which was supported byhistorical retention rates. Income taxes were estimated at a rate of 35% and amounts were discountedusing rates between 12%-14%. The customer relationships were valued at $708,000 under thisapproach.
• The Company valued trade names and trademarks using the income approach, specifically the relieffrom royalty method. Under this method, the asset values were determined by estimating thehypothetical royalties that would have to be paid if the trade name was not owned. Royalty rates wereselected based on consideration of several factors, including consumer product industry practices, theexistence of licensing agreements (licensing in and licensing out), and importance of the trademark andtrade name and profit levels, among other considerations. Royalty rates used in the determination of thefair values of trade names and trademarks ranged from 1% to 5% of expected net sales related to therespective trade names and trademarks. The Company anticipates using the majority of the trade namesand trademarks for an indefinite period. In estimating the fair value of the trademarks and trade names,nets sales were estimated to grow at a rate of (7)%-10% annually with a terminal year growth rate of2%-6%. Income taxes were estimated at a rate of 35% and amounts were discounted using ratesbetween 12%-14%. Trade name and trademarks were valued at $688,000 under this approach.
108

SPECTRUM BRANDS HOLDINGS, INC. AND SUBSIDIARIES
NOTES TO CONSOLIDATED FINANCIAL STATEMENTS—(Continued)(In thousands, except per share amounts)
• The Company valued technology using the income approach, specifically the relief from royaltymethod. Under this method, the asset value was determined by estimating the hypothetical royaltiesthat would have to be paid if the technology was not owned. Royalty rates were selected based onconsideration of several factors including industry practices, the existence of licensing agreements(licensing in and licensing out), and importance of the technology and profit levels, among otherconsiderations. Royalty rates used in the determination of the fair values of technologies ranged from7%-8% of expected net sales related to the respective technology. The Company anticipates using thesetechnologies through the legal life of the underlying patent and therefore the expected life of thesetechnologies was equal to the remaining legal life of the underlying patents ranging from 8 to 17 years.In estimating the fair value of the technologies, nets sales were estimated to grow at a rate of 0%-14%annually. Income taxes were estimated at 35% and amounts were discounted using rates between12%-13%. The technology assets were valued at $63,500 under this approach.
(p) The fresh-start adjustment of $17,957 eliminates the debt issuance costs related to assumed debt, that is, the(senior secured term credit facility).
(q) The Predecessor Company’s accumulated deficit and accumulated other comprehensive income iseliminated in conjunction with the adoption of fresh-start reporting. The Predecessor Company recognized again of $1,087,566 related to the fresh-start reporting adjustments as follows:
Gain on fresh-startreporting
adjustments
Establishment of Successor Company’s goodwill . . . . . . . . . . . . . . . . . . . $ 528,060Elimination of Predecessor Company’s goodwill . . . . . . . . . . . . . . . . . . . . (238,905)Establishment of Successor Company’s other intangible assets . . . . . . . . . 1,459,500Elimination of Predecessor Company’s other intangible assets . . . . . . . . . (677,050)Debt fair value adjustments . . . . . . . . . . . . . . . . . . . . . . . . . . . . . . . . . . . . . 79,658Elimination of debt issuance costs . . . . . . . . . . . . . . . . . . . . . . . . . . . . . . . (17,957)Property, plant and equipment fair value adjustment . . . . . . . . . . . . . . . . . 34,699Deferred tax adjustment . . . . . . . . . . . . . . . . . . . . . . . . . . . . . . . . . . . . . . . (104,881)Inventory fair value adjustment . . . . . . . . . . . . . . . . . . . . . . . . . . . . . . . . . 48,762Employee benefit obligations fair value adjustment . . . . . . . . . . . . . . . . . . (18,712)Other fair value adjustments . . . . . . . . . . . . . . . . . . . . . . . . . . . . . . . . . . . . (5,608)
$1,087,566
(3) Significant Accounting Policies and Practices
(a) Principles of Consolidation and Fiscal Year End
The consolidated financial statements include the financial statements of Spectrum Brands Holdings, Inc. and itssubsidiaries and are prepared in accordance with GAAP. All intercompany transactions have been eliminated.The Company’s fiscal year ends September 30. References herein to Fiscal 2010, 2009 and 2008 refer to thefiscal years ended September 30, 2010, 2009 and 2008, respectively.
(b) Revenue Recognition
The Company recognizes revenue from product sales generally upon delivery to the customer or the shippingpoint in situations where the customer picks up the product or where delivery terms so stipulate. This representsthe point at which title and all risks and rewards of ownership of the product are passed, provided that: there are
109
SPECTRUM BRANDS HOLDINGS, INC. AND SUBSIDIARIES
NOTES TO CONSOLIDATED FINANCIAL STATEMENTS—(Continued)(In thousands, except per share amounts)
no uncertainties regarding customer acceptance; there is persuasive evidence that an arrangement exists; the priceto the buyer is fixed or determinable; and collectibility is deemed reasonably assured. The Company is notobligated to allow for, and the Company’s general policy is not to accept, product returns associated with batterysales. The Company does accept returns in specific instances related to its shaving, grooming, personal care,home and garden, small appliances and pet products. The provision for customer returns is based on historicalsales and returns and other relevant information. The Company estimates and accrues the cost of returns, whichare treated as a reduction of Net sales.
The Company enters into various promotional arrangements, primarily with retail customers, includingarrangements entitling such retailers to cash rebates from the Company based on the level of their purchases,which require the Company to estimate and accrue the estimated costs of the promotional programs. These costsare treated as a reduction of Net sales.
The Company also enters into promotional arrangements that target the ultimate consumer. Sucharrangements are treated as either a reduction of Net sales or an increase of Cost of goods sold, based on the typeof promotional program. The income statement presentation of the Company’s promotional arrangementscomplies with ASC Topic 605: “Revenue Recognition.” For all types of promotional arrangements and programs,the Company monitors its commitments and uses various measures, including past experience, to determineamounts to be recorded for the estimate of the earned, but unpaid, promotional costs. The terms of theCompany’s customer-related promotional arrangements and programs are tailored to each customer and aredocumented through written contracts, correspondence or other communications with the individual customers.
The Company also enters into various arrangements, primarily with retail customers, which require theCompany to make upfront cash, or “slotting” payments, to secure the right to distribute through such customers.The Company capitalizes slotting payments; provided the payments are supported by a time or volume basedarrangement with the retailer, and amortizes the associated payment over the appropriate time or volume basedterm of the arrangement. The amortization of slotting payments is treated as a reduction in Net sales and acorresponding asset is reported in Deferred charges and other in the accompanying Consolidated Statements ofFinancial Position.
(c) Use of Estimates
The preparation of financial statements in conformity with GAAP requires management to make estimates andassumptions that affect the reported amounts of assets and liabilities and disclosure of contingent assets andliabilities at the date of the financial statements and the reported amounts of revenues and expenses during thereporting period. Actual results could differ from those estimates.
(d) Cash Equivalents
For purposes of the accompanying Consolidated Statements of Cash Flows, the Company considers all highlyliquid debt instruments purchased with original maturities of three months or less to be cash equivalents.
(e) Concentrations of Credit Risk, Major Customers and Employees
Trade receivables subject the Company to credit risk. Trade accounts receivable are carried at net realizablevalue. The Company extends credit to its customers based upon an evaluation of the customer’s financialcondition and credit history, but generally does not require collateral. The Company monitors its customers’
110

SPECTRUM BRANDS HOLDINGS, INC. AND SUBSIDIARIES
NOTES TO CONSOLIDATED FINANCIAL STATEMENTS—(Continued)(In thousands, except per share amounts)
credit and financial condition based on changing economic conditions and will make adjustments to creditpolicies as required. Provision for losses on uncollectible trade receivables are determined principally on thebasis of past collection experience applied to ongoing evaluations of the Company’s receivables and evaluationsof the risks of nonpayment for a given customer.
The Company has a broad range of customers including many large retail outlet chains, one of whichaccounts for a significant percentage of its sales volume. This major customer represented approximately 22%and 23% of the Successor Company’s Net sales during Fiscal 2010 and the period from August 31, 2009 throughSeptember 30, 2009, respectively, and approximately 23% and 20% of Net sales during the PredecessorCompany’s period from October 1, 2008 through August 30, 2009 and Fiscal 2008, respectively. This majorcustomer also represented approximately 15% and 14% of the Successor Company’s Trade account receivables,net as of September 30, 2010 and September 30, 2009, respectively.
Approximately 44% and 48% of the Successor Company’s Net sales during Fiscal 2010 and the period fromAugust 31, 2009 through September 30, 2009, respectively, occurred outside of the United States andapproximately 42% and 48% of the Predecessor Company’s Net sales during the period from October 1, 2008through August 30, 2009 and Fiscal 2008, respectively, occurred outside of the United States. These sales andrelated receivables are subject to varying degrees of credit, currency, and political and economic risk. TheCompany monitors these risks and makes appropriate provisions for collectibility based on an assessment of therisks present.
(f) Displays and Fixtures
Temporary displays are generally disposable cardboard displays shipped to customers to facilitate display of theCompany’s products. Temporary displays are generally disposed of after a single use by the customer.
Permanent fixtures are permanent in nature, generally made from wire or other permanent racking, whichare shipped to customers for display of the Company’s products. These permanent fixtures are restocked with theCompany’s product multiple times over the fixture’s useful life.
The costs of both temporary and permanent displays are capitalized as a prepaid asset and are included inPrepaid expenses and other in the accompanying Consolidated Statements of Financial Position. The costs oftemporary displays are expensed in the period in which they are shipped to customers and the costs of permanentfixtures are amortized over an estimated useful life of one to two years once they are shipped to customers andare reflected in Deferred charges and other in the accompanying Consolidated Statements of Financial Position.
(g) Inventories
The Company’s inventories are valued at the lower of cost or market. Cost of inventories is determined using thefirst-in, first-out (FIFO) method.
(h) Property, Plant and Equipment
Property, plant and equipment are recorded at cost or at fair value if acquired in a purchase business combination.Depreciation on plant and equipment is calculated on the straight-line method over the estimated useful lives ofthe assets. Depreciable lives by major classification are as follows:
Building and improvements . . . . . . . . . . . . . . . . . . . . . . . . . . . . . . . . . . . . . . . . 20-40 yearsMachinery, equipment and other . . . . . . . . . . . . . . . . . . . . . . . . . . . . . . . . . . . . 2-15 years
111

SPECTRUM BRANDS HOLDINGS, INC. AND SUBSIDIARIES
NOTES TO CONSOLIDATED FINANCIAL STATEMENTS—(Continued)(In thousands, except per share amounts)
Plant and equipment held under capital leases are amortized on a straight-line basis over the shorter of thelease term or estimated useful life of the asset.
The Company reviews long-lived assets for impairment whenever events or changes in circumstancesindicate that the carrying amount of an asset may not be recoverable. The Company evaluates recoverability ofassets to be held and used by comparing the carrying amount of an asset to future net cash flows expected to begenerated by the asset. If such assets are considered to be impaired, the impairment to be recognized is measuredby the amount by which the carrying amount of the assets exceeds the fair value of the assets. Assets to bedisposed of are reported at the lower of the carrying amount or fair value less costs to sell.
(i) Intangible Assets
Intangible assets are recorded at cost or at fair value if acquired in a purchase business combination. Inconnection with fresh-start reporting, Intangible Assets were recorded at their estimated fair value on August 30,2009. Customer lists, proprietary technology and certain trade name intangibles are amortized, using the straight-line method, over their estimated useful lives of approximately 4 to 20 years. Excess of cost over fair value of netassets acquired (goodwill) and indefinite-lived intangible assets (certain trade name intangibles) are notamortized. Goodwill is tested for impairment at least annually, at the reporting unit level with such groupingsbeing consistent with the Company’s reportable segments. If impairment is indicated, a write-down to fair value(normally measured by discounting estimated future cash flows) is recorded. Indefinite-lived trade nameintangibles are tested for impairment at least annually by comparing the fair value, determined using a relief fromroyalty methodology, with the carrying value. Any excess of carrying value over fair value is recognized as animpairment loss in income from operations. ASC Topic 350: “Intangibles-Goodwill and Other,” (“ASC 350”)requires that goodwill and indefinite-lived intangible assets be tested for impairment annually, or more often if anevent or circumstance indicates that an impairment loss may have been incurred. During Fiscal 2010, the periodfrom October 1, 2008 through August 30, 2009 and Fiscal 2008, the Company’s goodwill and trade nameintangibles were tested for impairment as of the Company’s August financial period end, the annual testing datefor the Company, as well as certain interim periods where an event or circumstance occurred that indicated animpairment loss may have been incurred.
Intangibles with Indefinite Lives
In accordance with ASC 350, the Company conducts impairment testing on the Company’s goodwill. Todetermine fair value during Fiscal 2010, the period from October 1, 2008 through August 30, 2009 and Fiscal2008 the Company used the discounted estimated future cash flows methodology, third party valuations andnegotiated sales prices. Assumptions critical to the Company’s fair value estimates under the discountedestimated future cash flows methodology are: (i) the present value factors used in determining the fair value ofthe reporting units and trade names; (ii) projected average revenue growth rates used in the reporting unit; and(iii) projected long-term growth rates used in the derivation of terminal year values. These and other assumptionsare impacted by economic conditions and expectations of management and will change in the future based onperiod specific facts and circumstances. The Company also tested fair value for reasonableness by comparison tothe total market capitalization of the Company, which includes both its equity and debt securities. In addition, inaccordance with ASC 350, as part of the Company’s annual impairment testing, the Company tested itsindefinite-lived trade name intangible assets for impairment by comparing the carrying amount of such tradenames to their respective fair values. Fair value was determined using a relief from royalty methodology.Assumptions critical to the Company’s fair value estimates under the relief from royalty methodology were:(i) royalty rates; and (ii) projected average revenue growth rates.
112

SPECTRUM BRANDS HOLDINGS, INC. AND SUBSIDIARIES
NOTES TO CONSOLIDATED FINANCIAL STATEMENTS—(Continued)(In thousands, except per share amounts)
In connection with the Company’s annual goodwill impairment testing performed during Fiscal 2010 thefirst step of such testing indicated that the fair value of the Company’s reporting segments were in excess of theircarrying amounts and, accordingly, no further testing of goodwill was required.
In connection with the Predecessor Company’s annual goodwill impairment testing performed during Fiscal2009, which was completed on the Predecessor Company before applying fresh-start reporting, the first step ofsuch testing indicated that the fair value of the Predecessor Company’s reporting segments were in excess oftheir carrying amounts and, accordingly, no further testing of goodwill was required.
In connection with its annual goodwill impairment testing in Fiscal 2008 the Predecessor Company firstcompared the fair value of its reporting units with their carrying amounts, including goodwill. This first stepindicated that the fair value of the Predecessor Company’s Global Pet Supplies and Home and Garden Businesswas less than the Predecessor Company’s carrying amount of those reporting units and, accordingly, furthertesting of goodwill was required to determine the impairment charge required by ASC 350. Accordingly, thePredecessor Company then compared the carrying amount of the Global Pet Supplies and the Home and GardenBusiness goodwill to the respective implied fair value of their goodwill. The carrying amounts of the Global PetSupplies and the Home and Garden Business goodwill exceeded their implied fair values and, therefore, duringFiscal 2008 the Predecessor Company recorded a non-cash pretax impairment charge equal to the excess of thecarrying amount of the respective reporting unit’s goodwill over the implied fair value of such goodwill of which$270,811 related to Global Pet Supplies and $49,801 related to the Home and Garden Business.
Furthermore, during Fiscal 2010 the Company, in connection with its annual impairment testing, concludedthat the fair value of its intangible assets exceeded is carrying value. During the period from October 1, 2008through August 30, 2009 and Fiscal 2008, in connection with its annual impairment testing, the Companyconcluded that the fair values of certain trade name intangible assets were less than the carrying amounts of thoseassets. As a result, during the period from October 1, 2008 through August 30, 2009 and Fiscal 2008 theCompany recorded non-cash pretax impairment charges of approximately $34,391 and $224,100, respectively,equal to the excess of the carrying amounts of the intangible assets over the fair value of such assets.
In accordance with ASC 360, “Property, Plant and Equipment” (“ASC 360”) and ASC 350, in addition toits annual impairment testing the Company conducts goodwill and trade name intangible asset impairment testingif an event or circumstance (“triggering event”) occurs that indicates an impairment loss may have been incurred.The Company’s management uses its judgment in assessing whether assets may have become impaired betweenannual impairment tests. Indicators such as unexpected adverse business conditions, economic factors,unanticipated technological change or competitive activities, loss of key personnel, and acts by governments andcourts may signal that an asset has become impaired. Several triggering events occurred during Fiscal 2008which required the Company to test its indefinite-lived intangible assets for impairment between annualimpairment test dates. On May 20, 2008, the Predecessor Company entered into a definitive agreement for thesale of Global Pet Supplies, which was subsequently terminated. The Company’s intent to dispose of Global PetSupplies constituted a triggering event for impairment testing. The Company estimated the fair value of GlobalPet Supplies, and the resultant estimated impairment charge of goodwill, based on the negotiated sales price ofGlobal Pet Supplies, which management deemed the best indication of fair value at that time. Accordingly, theCompany recorded a non-cash pretax charge of $154,916 to reduce the carrying value of goodwill related toGlobal Pet Supplies to reflect the estimated fair value of the business during the third quarter of Fiscal 2008.Goodwill and trade name intangible assets of the Home and Garden Business were tested during the third quarterof Fiscal 2008, as a result of lower forecasted profits from this business. This decrease in profitability wasprimarily due to significant cost increases in certain raw materials used in the production of many of the lawn
113

SPECTRUM BRANDS HOLDINGS, INC. AND SUBSIDIARIES
NOTES TO CONSOLIDATED FINANCIAL STATEMENTS—(Continued)(In thousands, except per share amounts)
fertilizer and growing media products manufactured by the Company at that time as well as more conservativegrowth rates to reflect the current and expected future economic conditions for this business. The Company firstcompared the fair value of this reporting unit with its carrying amounts, including goodwill. This first stepindicated that the fair value of the Home and Garden Business was less than the Company’s carrying amount ofthis reporting unit and, accordingly, further testing of goodwill was required to determine the impairment charge.Accordingly, the Company then compared the carrying amount of the Home and Garden Business goodwillagainst the implied fair value of such goodwill. The carrying amount of the Home and Garden Business goodwillexceeded its implied fair value and, therefore, during Fiscal 2008 the Company recorded a non-cash pretaximpairment charge equal to the excess of the carrying amount of the reporting unit’s goodwill over the impliedfair value of such goodwill of approximately $110,213. In addition, during the third quarter of Fiscal 2008, theCompany concluded that the implied fair values of certain trade name intangible assets related to the Home andGarden Business were less that the carrying amounts of those assets and, accordingly, during Fiscal 2008recorded a non-cash pretax impairment charge of $22,000. Goodwill and trade name intangibles of the Home andGarden Business were tested during the first quarter of Fiscal 2008 in conjunction with the Company’sreclassification of that business from an asset held for sale to an asset held and used. The Company firstcompared the fair value of this reporting unit with its carrying amounts, including goodwill. This first stepindicated that the fair value of the Home and Garden Business was in excess of its carrying amounts and,accordingly, no further testing of goodwill was required. In addition, during the first quarter of Fiscal 2008, theCompany concluded that the implied fair values of certain trade name intangible assets related to the Home andGarden Business were less than the carrying amounts of those assets and, accordingly, during Fiscal 2008recorded a non-cash pretax impairment charge of $12,400.
The above impairments of goodwill and trade name intangible assets was primarily attributed to lowercurrent and forecasted profits, reflecting more conservative growth rates versus those assumed by the Companyat the time of acquisition, as well as due to a sustained decline in the total market capitalization of the Company.
During the third quarter of Fiscal 2008, the Company developed and initiated a plan to phase down, andultimately curtail, manufacturing operations at its Ningbo, China battery manufacturing facility. The Companycompleted the shutdown of Ningbo during the fourth quarter of Fiscal 2008. In connection with the Company’sstrategy to exit operations in Ningbo, China, the Predecessor Company recorded a non-cash pretax charge of$16,193 to reduce the carrying value of goodwill related to the Ningbo, China battery manufacturing facility.
The recognition of the $34,391 and $861,234 non-cash impairment of goodwill and trade name intangibleassets during the period from October 1, 2008 through August 30, 2009 and Fiscal 2008, respectively, has beenrecorded as a separate component of Operating expenses and has had a material negative effect on thePredecessor Company’s financial condition and results of operations during the period from October 1, 2008through August 30, 2009 and Fiscal 2008. These impairments will not result in future cash expenditures.
Intangibles with Definite or Estimable Useful Lives
The triggering events discussed above under ASC 350 also indicated a triggering event in accordance withASC 360. Management conducted an analysis in accordance with ASC 360 of intangibles with definite orestimable useful lives in conjunction with the ASC 350 testing of intangibles with indefinite lives.
The Company assesses the recoverability of intangible assets with definite or estimable useful lives inaccordance with ASC 360 by determining whether the carrying value can be recovered through projectedundiscounted future cash flows. If projected undiscounted future cash flows indicate that the unamortizedcarrying value of intangible assets with finite useful lives will not be recovered, an adjustment would be made toreduce the carrying value to an amount equal to projected future cash flows discounted at the Company’s
114

SPECTRUM BRANDS HOLDINGS, INC. AND SUBSIDIARIES
NOTES TO CONSOLIDATED FINANCIAL STATEMENTS—(Continued)(In thousands, except per share amounts)
incremental borrowing rate. The cash flow projections used are based on trends of historical performance andmanagement’s estimate of future performance, giving consideration to existing and anticipated competitive andeconomic conditions.
Impairment reviews are conducted at the judgment of management when it believes that a change incircumstances in the business or external factors warrants a review. Circumstances such as the discontinuation ofa product or product line, a sudden or consistent decline in the sales forecast for a product, changes in technologyor in the way an asset is being used, a history of operating or cash flow losses, or an adverse change in legalfactors or in the business climate, among others, may trigger an impairment review. The Company’s initialimpairment review to determine if an impairment test is required is based on an undiscounted cash flow analysisfor asset groups at the lowest level for which identifiable cash flows exist. The analysis requires managementjudgment with respect to changes in technology, the continued success of product lines and future volume,revenue and expense growth rates, and discount rates.
In accordance with ASC 360, long-lived assets to be disposed of are recorded at the lower of their carryingvalue or fair value less costs to sell. During Fiscal 2008, the Predecessor Company recorded a non-cash pretaxcharge of $5,700 in discontinued operations to reduce the carrying value of intangible assets related to thegrowing products portion of the Home and Garden Business in order to reflect the estimated fair value of thisbusiness. (See also Note 9, Discontinued Operations, for additional information regarding this impairmentcharge).
(j) Debt Issuance Costs
Debt issuance costs are capitalized and amortized to interest expense using the effective interest method over thelives of the related debt agreements.
(k) Accounts Payable
Included in accounts payable are bank overdrafts, net of deposits on hand, on disbursement accounts that arereplenished when checks are presented for payment.
(l) Income Taxes
Income taxes are accounted for under the asset and liability method. Deferred tax assets and liabilities arerecognized for the future tax consequences attributable to differences between the financial statement carryingamounts of existing assets and liabilities and their respective tax bases and operating loss and tax credit carryforwards. Deferred tax assets and liabilities are measured using enacted tax rates expected to apply to taxableincome in the years in which those temporary differences are expected to be recovered or settled. The effect ondeferred tax assets and liabilities of a change in tax rates is recognized in income in the period of the enactmentdate.
(m) Foreign Currency Translation
Assets and liabilities of the Company’s foreign subsidiaries are translated at the rate of exchange existing at year-end, with revenues, expenses, and cash flows translated at the average of the monthly exchange rates.Adjustments resulting from translation of the financial statements are recorded as a component of Accumulatedother comprehensive income (loss) (“AOCI”). Also included in AOCI are the effects of exchange rate changes onintercompany balances of a long-term nature.
115

SPECTRUM BRANDS HOLDINGS, INC. AND SUBSIDIARIES
NOTES TO CONSOLIDATED FINANCIAL STATEMENTS—(Continued)(In thousands, except per share amounts)
As of September 30, 2010 and September 30, 2009, foreign currency translation adjustment balances of$18,492 and $5,896, respectively, were reflected in the accompanying Consolidated Statements of FinancialPosition in AOCI.
Successor Company exchange losses (gains) on foreign currency transactions aggregating $13,336 and$(726) for Fiscal 2010 and the period from August 31, 2009 through September 30, 2009, respectively, areincluded in Other expense (income), net, in the accompanying Consolidated Statements of Operations.Predecessor Company exchange losses (gains) on foreign currency transactions aggregating $4,440 and $3,466for the period from October 1, 2008 through August 30, 2009 and Fiscal 2008, respectively, are included in Otherexpense (income), net, in the accompanying Consolidated Statements of Operations.
(n) Shipping and Handling Costs
The Successor Company incurred shipping and handling costs of $161,148 and $12,866 during Fiscal 2010 andthe period from August 31, 2009 through September 30, 2009, respectively. The Predecessor Company incurredshipping and handling costs of $135,511 and $183,676 during the period from October 1, 2008 throughAugust 30, 2009 and Fiscal 2008, respectively. Shipping and handling costs, which are included in Sellingexpenses in the accompanying Consolidated Statements of Operations, include costs incurred with third-partycarriers to transport products to customers and salaries and overhead costs related to activities to prepare theCompany’s products for shipment at the Company’s distribution facilities.
(o) Advertising Costs
The Successor Company incurred advertising costs of $37,520 and $3,166 during Fiscal 2010 and the periodfrom August 31, 2009 through September 30, 2009, respectively. The Predecessor Company incurred expensesfor advertising of $25,813 and $46,417during the period from October 1, 2008 through August 30, 2009 andFiscal 2008, respectively. Such advertising costs are included in Selling expenses in the accompanyingConsolidated Statements of Operations.
(p) Research and Development Costs
Research and development costs are charged to expense in the period they are incurred.
(q) Net (Loss) Income Per Common Share
Basic net (loss) income per common share is computed by dividing net (loss) income available to commonshareholders by the weighted-average number of common shares outstanding for the period. Basic net (loss)income per common share does not consider common stock equivalents. Diluted net (loss) income per commonshare reflects the dilution that would occur if employee stock options and restricted stock awards were exercisedor converted into common shares or resulted in the issuance of common shares that then shared in the net (loss)income of the entity. The computation of diluted net (loss) income per common share uses the “if converted” and“treasury stock” methods to reflect dilution. The difference between the basic and diluted number of shares is dueto the effects of restricted stock and assumed conversion of employee stock options awards.
As discussed in Note 2, Voluntary Reorganization under Chapter 11, the Predecessor Company commonstock was cancelled as a result of the Company’s emergence from Chapter 11 of the Bankruptcy Code on theEffective Date. The Successor Company common stock began trading on September 2, 2009. As such, theearnings per share information for the Predecessor Company is not meaningful to shareholders of the SuccessorCompany’s common shares, or to potential investors in such common shares.
116
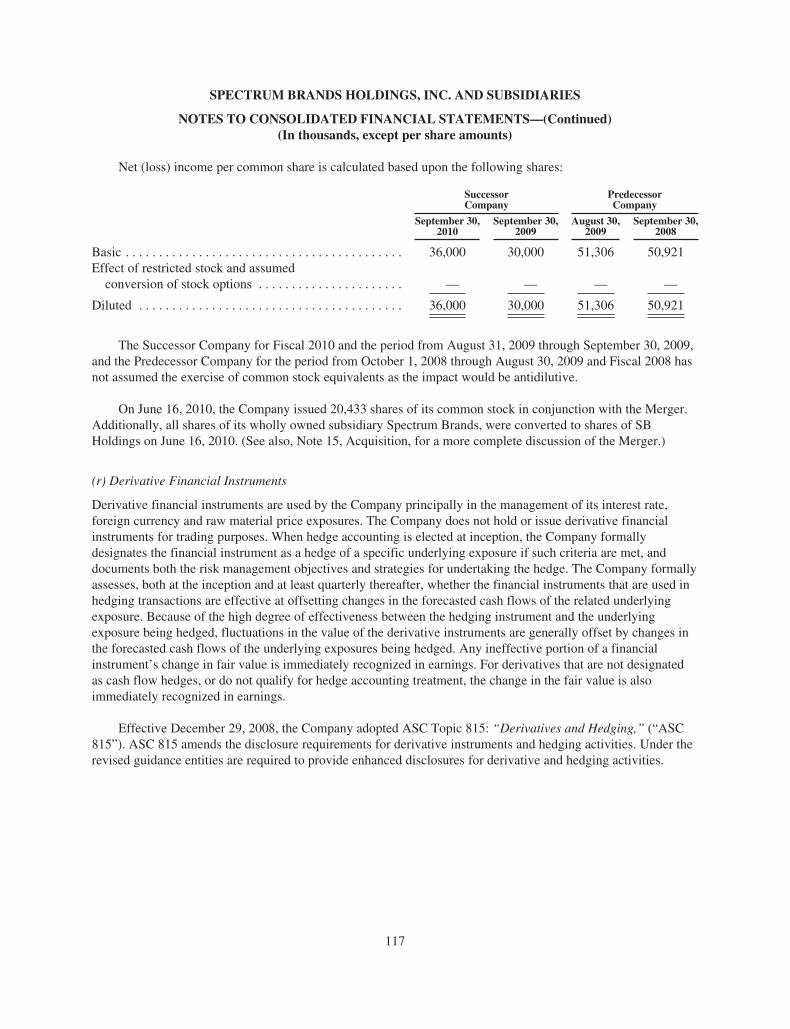
SPECTRUM BRANDS HOLDINGS, INC. AND SUBSIDIARIES
NOTES TO CONSOLIDATED FINANCIAL STATEMENTS—(Continued)(In thousands, except per share amounts)
Net (loss) income per common share is calculated based upon the following shares:
SuccessorCompany
PredecessorCompany
September 30,2010
September 30,2009
August 30,2009
September 30,2008
Basic . . . . . . . . . . . . . . . . . . . . . . . . . . . . . . . . . . . . . . . . . . 36,000 30,000 51,306 50,921Effect of restricted stock and assumedconversion of stock options . . . . . . . . . . . . . . . . . . . . . . — — — —
Diluted . . . . . . . . . . . . . . . . . . . . . . . . . . . . . . . . . . . . . . . . 36,000 30,000 51,306 50,921
The Successor Company for Fiscal 2010 and the period from August 31, 2009 through September 30, 2009,and the Predecessor Company for the period from October 1, 2008 through August 30, 2009 and Fiscal 2008 hasnot assumed the exercise of common stock equivalents as the impact would be antidilutive.
On June 16, 2010, the Company issued 20,433 shares of its common stock in conjunction with the Merger.Additionally, all shares of its wholly owned subsidiary Spectrum Brands, were converted to shares of SBHoldings on June 16, 2010. (See also, Note 15, Acquisition, for a more complete discussion of the Merger.)
(r) Derivative Financial Instruments
Derivative financial instruments are used by the Company principally in the management of its interest rate,foreign currency and raw material price exposures. The Company does not hold or issue derivative financialinstruments for trading purposes. When hedge accounting is elected at inception, the Company formallydesignates the financial instrument as a hedge of a specific underlying exposure if such criteria are met, anddocuments both the risk management objectives and strategies for undertaking the hedge. The Company formallyassesses, both at the inception and at least quarterly thereafter, whether the financial instruments that are used inhedging transactions are effective at offsetting changes in the forecasted cash flows of the related underlyingexposure. Because of the high degree of effectiveness between the hedging instrument and the underlyingexposure being hedged, fluctuations in the value of the derivative instruments are generally offset by changes inthe forecasted cash flows of the underlying exposures being hedged. Any ineffective portion of a financialinstrument’s change in fair value is immediately recognized in earnings. For derivatives that are not designatedas cash flow hedges, or do not qualify for hedge accounting treatment, the change in the fair value is alsoimmediately recognized in earnings.
Effective December 29, 2008, the Company adopted ASC Topic 815: “Derivatives and Hedging,” (“ASC815”). ASC 815 amends the disclosure requirements for derivative instruments and hedging activities. Under therevised guidance entities are required to provide enhanced disclosures for derivative and hedging activities.
117
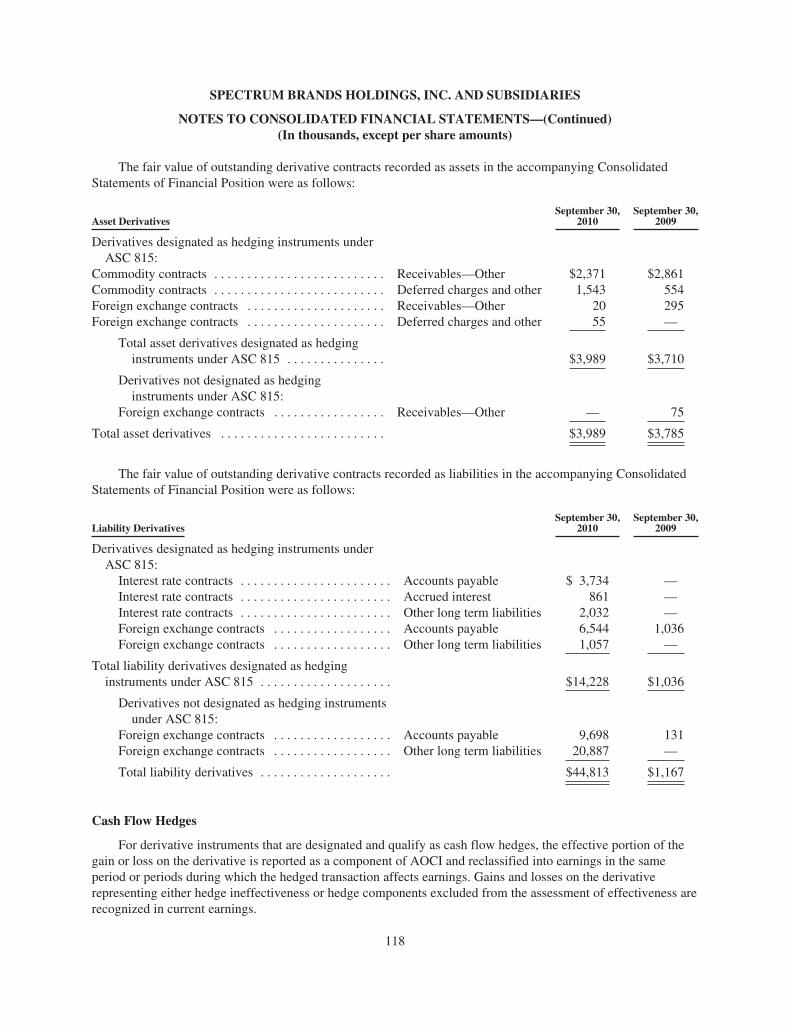
SPECTRUM BRANDS HOLDINGS, INC. AND SUBSIDIARIES
NOTES TO CONSOLIDATED FINANCIAL STATEMENTS—(Continued)(In thousands, except per share amounts)
The fair value of outstanding derivative contracts recorded as assets in the accompanying ConsolidatedStatements of Financial Position were as follows:
Asset DerivativesSeptember 30,
2010September 30,
2009
Derivatives designated as hedging instruments underASC 815:
Commodity contracts . . . . . . . . . . . . . . . . . . . . . . . . . . Receivables—Other $2,371 $2,861Commodity contracts . . . . . . . . . . . . . . . . . . . . . . . . . . Deferred charges and other 1,543 554Foreign exchange contracts . . . . . . . . . . . . . . . . . . . . . Receivables—Other 20 295Foreign exchange contracts . . . . . . . . . . . . . . . . . . . . . Deferred charges and other 55 —
Total asset derivatives designated as hedginginstruments under ASC 815 . . . . . . . . . . . . . . . $3,989 $3,710
Derivatives not designated as hedginginstruments under ASC 815:
Foreign exchange contracts . . . . . . . . . . . . . . . . . Receivables—Other — 75
Total asset derivatives . . . . . . . . . . . . . . . . . . . . . . . . . $3,989 $3,785
The fair value of outstanding derivative contracts recorded as liabilities in the accompanying ConsolidatedStatements of Financial Position were as follows:
Liability DerivativesSeptember 30,
2010September 30,
2009
Derivatives designated as hedging instruments underASC 815:Interest rate contracts . . . . . . . . . . . . . . . . . . . . . . . Accounts payable $ 3,734 —Interest rate contracts . . . . . . . . . . . . . . . . . . . . . . . Accrued interest 861 —Interest rate contracts . . . . . . . . . . . . . . . . . . . . . . . Other long term liabilities 2,032 —Foreign exchange contracts . . . . . . . . . . . . . . . . . . Accounts payable 6,544 1,036Foreign exchange contracts . . . . . . . . . . . . . . . . . . Other long term liabilities 1,057 —
Total liability derivatives designated as hedginginstruments under ASC 815 . . . . . . . . . . . . . . . . . . . . $14,228 $1,036
Derivatives not designated as hedging instrumentsunder ASC 815:
Foreign exchange contracts . . . . . . . . . . . . . . . . . . Accounts payable 9,698 131Foreign exchange contracts . . . . . . . . . . . . . . . . . . Other long term liabilities 20,887 —
Total liability derivatives . . . . . . . . . . . . . . . . . . . . $44,813 $1,167
Cash Flow Hedges
For derivative instruments that are designated and qualify as cash flow hedges, the effective portion of thegain or loss on the derivative is reported as a component of AOCI and reclassified into earnings in the sameperiod or periods during which the hedged transaction affects earnings. Gains and losses on the derivativerepresenting either hedge ineffectiveness or hedge components excluded from the assessment of effectiveness arerecognized in current earnings.
118
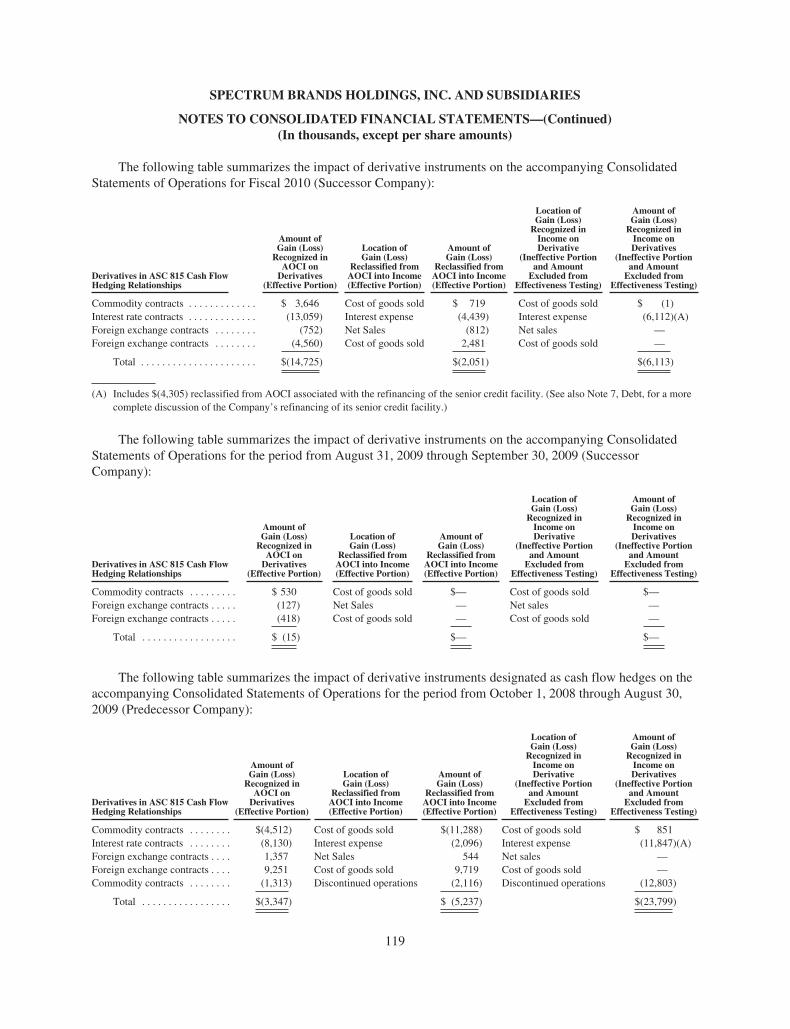
SPECTRUM BRANDS HOLDINGS, INC. AND SUBSIDIARIES
NOTES TO CONSOLIDATED FINANCIAL STATEMENTS—(Continued)(In thousands, except per share amounts)
The following table summarizes the impact of derivative instruments on the accompanying ConsolidatedStatements of Operations for Fiscal 2010 (Successor Company):
Derivatives in ASC 815 Cash FlowHedging Relationships
Amount ofGain (Loss)Recognized in
AOCI onDerivatives
(Effective Portion)
Location ofGain (Loss)
Reclassified fromAOCI into Income(Effective Portion)
Amount ofGain (Loss)
Reclassified fromAOCI into Income(Effective Portion)
Location ofGain (Loss)Recognized inIncome onDerivative
(Ineffective Portionand AmountExcluded from
Effectiveness Testing)
Amount ofGain (Loss)Recognized inIncome onDerivatives
(Ineffective Portionand AmountExcluded from
Effectiveness Testing)
Commodity contracts . . . . . . . . . . . . . $ 3,646 Cost of goods sold $ 719 Cost of goods sold $ (1)Interest rate contracts . . . . . . . . . . . . . (13,059) Interest expense (4,439) Interest expense (6,112)(A)Foreign exchange contracts . . . . . . . . (752) Net Sales (812) Net sales —Foreign exchange contracts . . . . . . . . (4,560) Cost of goods sold 2,481 Cost of goods sold —
Total . . . . . . . . . . . . . . . . . . . . . . $(14,725) $(2,051) $(6,113)
(A) Includes $(4,305) reclassified from AOCI associated with the refinancing of the senior credit facility. (See also Note 7, Debt, for a morecomplete discussion of the Company’s refinancing of its senior credit facility.)
The following table summarizes the impact of derivative instruments on the accompanying ConsolidatedStatements of Operations for the period from August 31, 2009 through September 30, 2009 (SuccessorCompany):
Derivatives in ASC 815 Cash FlowHedging Relationships
Amount ofGain (Loss)Recognized in
AOCI onDerivatives
(Effective Portion)
Location ofGain (Loss)
Reclassified fromAOCI into Income(Effective Portion)
Amount ofGain (Loss)
Reclassified fromAOCI into Income(Effective Portion)
Location ofGain (Loss)Recognized inIncome onDerivative
(Ineffective Portionand AmountExcluded from
Effectiveness Testing)
Amount ofGain (Loss)Recognized inIncome onDerivatives
(Ineffective Portionand AmountExcluded from
Effectiveness Testing)
Commodity contracts . . . . . . . . . $ 530 Cost of goods sold $— Cost of goods sold $—Foreign exchange contracts . . . . . (127) Net Sales — Net sales —Foreign exchange contracts . . . . . (418) Cost of goods sold — Cost of goods sold —
Total . . . . . . . . . . . . . . . . . . $ (15) $— $—
The following table summarizes the impact of derivative instruments designated as cash flow hedges on theaccompanying Consolidated Statements of Operations for the period from October 1, 2008 through August 30,2009 (Predecessor Company):
Derivatives in ASC 815 Cash FlowHedging Relationships
Amount ofGain (Loss)Recognized in
AOCI onDerivatives
(Effective Portion)
Location ofGain (Loss)
Reclassified fromAOCI into Income(Effective Portion)
Amount ofGain (Loss)
Reclassified fromAOCI into Income(Effective Portion)
Location ofGain (Loss)Recognized inIncome onDerivative
(Ineffective Portionand AmountExcluded from
Effectiveness Testing)
Amount ofGain (Loss)Recognized inIncome onDerivatives
(Ineffective Portionand AmountExcluded from
Effectiveness Testing)
Commodity contracts . . . . . . . . $(4,512) Cost of goods sold $(11,288) Cost of goods sold $ 851Interest rate contracts . . . . . . . . (8,130) Interest expense (2,096) Interest expense (11,847)(A)Foreign exchange contracts . . . . 1,357 Net Sales 544 Net sales —Foreign exchange contracts . . . . 9,251 Cost of goods sold 9,719 Cost of goods sold —Commodity contracts . . . . . . . . (1,313) Discontinued operations (2,116) Discontinued operations (12,803)
Total . . . . . . . . . . . . . . . . . $(3,347) $ (5,237) $(23,799)
119
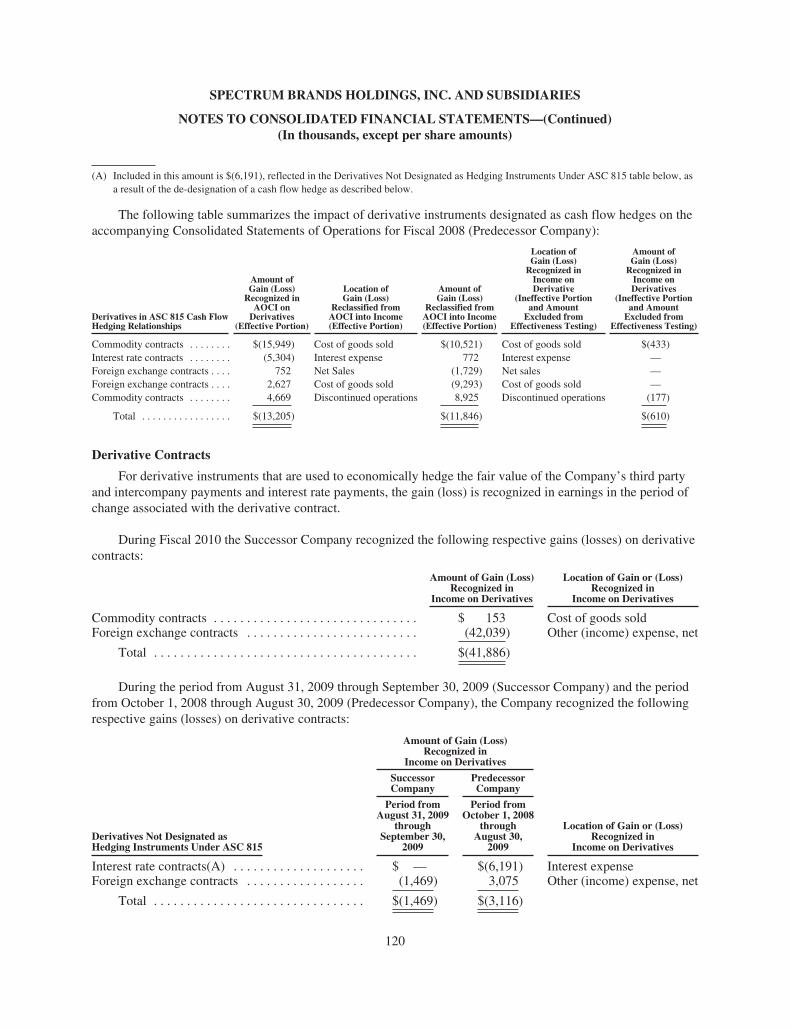
SPECTRUM BRANDS HOLDINGS, INC. AND SUBSIDIARIES
NOTES TO CONSOLIDATED FINANCIAL STATEMENTS—(Continued)(In thousands, except per share amounts)
(A) Included in this amount is $(6,191), reflected in the Derivatives Not Designated as Hedging Instruments Under ASC 815 table below, asa result of the de-designation of a cash flow hedge as described below.
The following table summarizes the impact of derivative instruments designated as cash flow hedges on theaccompanying Consolidated Statements of Operations for Fiscal 2008 (Predecessor Company):
Derivatives in ASC 815 Cash FlowHedging Relationships
Amount ofGain (Loss)Recognized in
AOCI onDerivatives
(Effective Portion)
Location ofGain (Loss)
Reclassified fromAOCI into Income(Effective Portion)
Amount ofGain (Loss)
Reclassified fromAOCI into Income(Effective Portion)
Location ofGain (Loss)Recognized inIncome onDerivative
(Ineffective Portionand AmountExcluded from
Effectiveness Testing)
Amount ofGain (Loss)Recognized inIncome onDerivatives
(Ineffective Portionand AmountExcluded from
Effectiveness Testing)
Commodity contracts . . . . . . . . $(15,949) Cost of goods sold $(10,521) Cost of goods sold $(433)Interest rate contracts . . . . . . . . (5,304) Interest expense 772 Interest expense —Foreign exchange contracts . . . . 752 Net Sales (1,729) Net sales —Foreign exchange contracts . . . . 2,627 Cost of goods sold (9,293) Cost of goods sold —Commodity contracts . . . . . . . . 4,669 Discontinued operations 8,925 Discontinued operations (177)
Total . . . . . . . . . . . . . . . . . $(13,205) $(11,846) $(610)
Derivative Contracts
For derivative instruments that are used to economically hedge the fair value of the Company’s third partyand intercompany payments and interest rate payments, the gain (loss) is recognized in earnings in the period ofchange associated with the derivative contract.
During Fiscal 2010 the Successor Company recognized the following respective gains (losses) on derivativecontracts:
Amount of Gain (Loss)Recognized in
Income on Derivatives
Location of Gain or (Loss)Recognized in
Income on Derivatives
Commodity contracts . . . . . . . . . . . . . . . . . . . . . . . . . . . . . . . $ 153 Cost of goods soldForeign exchange contracts . . . . . . . . . . . . . . . . . . . . . . . . . . (42,039) Other (income) expense, net
Total . . . . . . . . . . . . . . . . . . . . . . . . . . . . . . . . . . . . . . . . $(41,886)
During the period from August 31, 2009 through September 30, 2009 (Successor Company) and the periodfrom October 1, 2008 through August 30, 2009 (Predecessor Company), the Company recognized the followingrespective gains (losses) on derivative contracts:
Derivatives Not Designated asHedging Instruments Under ASC 815
Amount of Gain (Loss)Recognized in
Income on Derivatives
SuccessorCompany
PredecessorCompany
Period fromAugust 31, 2009
throughSeptember 30,
2009
Period fromOctober 1, 2008
throughAugust 30,
2009
Location of Gain or (Loss)Recognized in
Income on Derivatives
Interest rate contracts(A) . . . . . . . . . . . . . . . . . . . . $ — $(6,191) Interest expenseForeign exchange contracts . . . . . . . . . . . . . . . . . . (1,469) 3,075 Other (income) expense, net
Total . . . . . . . . . . . . . . . . . . . . . . . . . . . . . . . . $(1,469) $(3,116)
120

SPECTRUM BRANDS HOLDINGS, INC. AND SUBSIDIARIES
NOTES TO CONSOLIDATED FINANCIAL STATEMENTS—(Continued)(In thousands, except per share amounts)
(A) Amount represents portion of certain future payments related to interest rate contracts that werede-designated as cash flow hedges during the pendency of the Bankruptcy Cases.
During Fiscal 2008 the Predecessor Company recognized the following respective gains (losses) onderivative contracts:
Amount of Gain (Loss)Recognized in
Income on Derivatives
Location of Gain or (Loss)Recognized in
Income on Derivatives
Foreign exchange contracts . . . . . . . . . . . . . . . . . . . . . . . . . . (9,361) Other (income) expense, net
Total . . . . . . . . . . . . . . . . . . . . . . . . . . . . . . . . . . . . . . . . $(9,361)
Credit Risk
The Company is exposed to the default risk of the counterparties with which the Company transacts. TheCompany monitors counterparty credit risk on an individual basis by periodically assessing each suchcounterparty’s credit rating exposure. The maximum loss due to credit risk equals the fair value of the gross assetderivatives which are primarily concentrated with a foreign financial institution counterparty. The Companyconsiders these exposures when measuring its credit reserve on its derivative assets, which was $75 and $32,respectively, at September 30, 2010 and September 30, 2009. Additionally, the Company does not requirecollateral or other security to support financial instruments subject to credit risk.
The Company’s standard contracts do not contain credit risk related contingencies whereby the Companywould be required to post additional cash collateral as a result of a credit event. However, as a result of theCompany’s current credit profile, the Company is typically required to post collateral in the normal course ofbusiness to offset its liability positions. At September 30, 2010 and September 30, 2009, the Company had postedcash collateral of $2,363 and $1,943, respectively, related to such liability positions. In addition, atSeptember 30, 2010 and September 30, 2009, the Successor Company had posted standby letters of credit of$4,000 and $0, respectively, related to such liability positions. The cash collateral is included in Receivables—Other within the accompanying Consolidated Statements of Financial Position.
Derivative Financial Instruments
Cash Flow Hedges
The Company uses interest rate swaps to manage its interest rate risk. The swaps are designated as cash flowhedges with the changes in fair value recorded in AOCI and as a derivative hedge asset or liability, as applicable.The swaps settle periodically in arrears with the related amounts for the current settlement period payable to, orreceivable from, the counter-parties included in accrued liabilities or receivables, respectively, and recognized inearnings as an adjustment to interest expense from the underlying debt to which the swap is designated. AtSeptember 30, 2010, the Company had a portfolio of U.S. dollar-denominated interest rate swaps outstandingwhich effectively fixes the interest on floating rate debt, exclusive of lender spreads as follows: 2.25% for anotional principal amount of $300,000 through December 2011 and 2.29% for a notional principal amount of$300,000 through January 2012 (the “U.S. dollar swaps”). During Fiscal 2010, in connection with the refinancingof its senior credit facilities, the Company terminated a portfolio of Euro-denominated interest rate swaps at acash loss of $3,499 which was recognized as an adjustment to interest expense. The derivative net (loss) on theU.S. dollar swaps contracts recorded in AOCI by the Company at September 30, 2010 was $(2,675), net of taxbenefit of $1,640.
121

SPECTRUM BRANDS HOLDINGS, INC. AND SUBSIDIARIES
NOTES TO CONSOLIDATED FINANCIAL STATEMENTS—(Continued)(In thousands, except per share amounts)
The derivative net gain (loss) on these contracts recorded in AOCI by the Company at September 30, 2009 was$0. The derivative net (loss) on these contracts recorded in AOCI by the Predecessor Company at September 30,2008 was $(3,604), net of tax benefit of $2,209. At September 30, 2010, the portion of derivative net (losses)estimated to be reclassified from AOCI into earnings by the Successor Company over the next 12 months is$(1,416), net of tax.
In connection with the Company’s merger with Russell Hobbs and the refinancing of the Company’sexisting senior credit facilities associated with the closing of the Merger, the Company assessed the prospectiveeffectiveness of its interest rate cash flow hedges during fiscal 2010. As a result, during fiscal 2010, theCompany ceased hedge accounting and recorded a loss of ($1,451) as an adjustment to interest expense for thechange in fair value of its U.S. dollar swaps from the date of de-designation until the U.S. dollar swaps were re-designated. The Company also evaluated whether the amounts recorded in AOCI associated with the forecastedU.S. dollar swap transactions were probable of not occurring and determined that occurrence of the transactionswas still reasonably possible. Upon the refinancing of the existing senior credit facility associated with theclosing of the Merger, the Company re-designated the U.S. dollar swaps as cash flow hedges of certain scheduledinterest rate payments on the new $750,000 U.S. Dollar Term Loan expiring June 16, 2016. At September 30,2010, the Company believes that all forecasted interest rate swap transactions designated as cash flow hedges areprobable of occurring.
The Company’s interest rate swap derivative financial instruments at September 30, 2010, September 30,2009 and September 30, 2008 are summarized as follows:
2010 2009 2008
NotionalAmount
RemainingTerm
NotionalAmount
NotionalAmount
RemainingTerm
Interest rate swaps-fixed . . . . . . . . . . . . . . . . . . . . . . . . $300,000 1.28 years $— $267,029 0.07 yearsInterest rate swaps-fixed . . . . . . . . . . . . . . . . . . . . . . . . $300,000 1.36 years $— $170,000 0.11 yearsInterest rate swaps-fixed . . . . . . . . . . . . . . . . . . . . . . . . $ — — $— $225,000 1.52 yearsInterest rate swaps-fixed . . . . . . . . . . . . . . . . . . . . . . . . $ — — $— $ 80,000 1.62 years
The Company periodically enters into forward foreign exchange contracts to hedge the risk from forecastedforeign denominated third party and intercompany sales or payments. These obligations generally require theCompany to exchange foreign currencies for U.S. Dollars, Euros, Pounds Sterling, Australian Dollars, BrazilianReals, Canadian Dollars or Japanese Yen. These foreign exchange contracts are cash flow hedges of fluctuatingforeign exchange related to sales or product or raw material purchases. Until the sale or purchase is recognized,the fair value of the related hedge is recorded in AOCI and as a derivative hedge asset or liability, as applicable.At the time the sale or purchase is recognized, the fair value of the related hedge is reclassified as an adjustmentto Net sales or purchase price variance in Cost of goods sold.
At September 30, 2010 the Successor Company had a series of foreign exchange derivative contractsoutstanding through June 2012 with a contract value of $299,993. At September 30, 2009 the SuccessorCompany had a series of foreign exchange derivative contracts outstanding through September 2010 with acontract value of $92,963. At September 30, 2008 the Predecessor Company had a series of such derivativecontracts outstanding through September 2010 with a contract value of $144,776. The derivative net (loss) onthese contracts recorded in AOCI by the Successor Company at September 30, 2010 was $(5,322), net of taxbenefit of $2,204. The derivative net (loss) on these contracts recorded in AOCI by the Successor Company atSeptember 30, 2009 was $(378), net of tax benefit of $167. The derivative net gain on these contracts recorded inAOCI by the Predecessor Company at September 30, 2008 was $3,591, net of tax expense of $1,482. AtSeptember 30, 2010, the portion of derivative net (losses) estimated to be reclassified from AOCI into earningsby the Company over the next 12 months is $(4,596), net of tax.
122

SPECTRUM BRANDS HOLDINGS, INC. AND SUBSIDIARIES
NOTES TO CONSOLIDATED FINANCIAL STATEMENTS—(Continued)(In thousands, except per share amounts)
The Company is exposed to risk from fluctuating prices for raw materials, specifically zinc used in itsmanufacturing processes. The Company hedges a portion of the risk associated with these materials through theuse of commodity swaps. The hedge contracts are designated as cash flow hedges with the fair value changesrecorded in AOCI and as a hedge asset or liability, as applicable. The unrecognized changes in fair value of thehedge contracts are reclassified from AOCI into earnings when the hedged purchase of raw materials also affectsearnings. The swaps effectively fix the floating price on a specified quantity of raw materials through a specifieddate. At September 30, 2010 the Successor Company had a series of such swap contracts outstanding throughSeptember 2012 for 15 tons with a contract value of $28,897. At September 30, 2009 the Successor Companyhad a series of such swap contracts outstanding through September 2011 for 8 tons with a contract value of$11,830. At September 30, 2008, the Predecessor Company had a series of such swap contracts outstandingthrough September 2010 for 13 tons with a contract value of $31,030. The derivative net gain on these contractsrecorded in AOCI by the Successor Company at September 30, 2010 was $2,256, net of tax expense of $1,201.The derivative net gain on these contracts recorded in AOCI by the Successor Company at September 30, 2009was $347, net of tax expense of $183. The derivative net (loss) on these contracts recorded in AOCI by theSuccessor Company at September 30, 2008 was $(5,396), net of tax benefit of $2,911. At September 30, 2010,the portion of derivative net gains estimated to be reclassified from AOCI into earnings by the Company over thenext 12 months is $1,251, net of tax.
The Company was also exposed to fluctuating prices of raw materials, specifically urea and di-ammoniumphosphates (“DAP”), used in its manufacturing processes in the growing products portion of the Home andGarden Business. During the period from October 1, 2008 through August 30, 2009 (Predecessor Company)$(2,116) of pretax derivative gains (losses) were recorded as an adjustment to Loss from Discontinuedoperations, net of tax, for swap or option contracts settled at maturity. During Fiscal 2008, $8,925 of pretaxderivative gains were recorded as an adjustment to Loss from discontinued operations, by the PredecessorCompany for swap or option contracts settled at maturity. The hedges are generally highly effective; however,during the period from October 1, 2008 through August 30, 2009 and Fiscal 2008, $(12,803) and $(177),respectively, of pretax derivative gains (losses), were recorded as an adjustment to Loss from discontinuedoperations, net of tax, by the Predecessor Company. The amount recorded during the period from October 1,2008 through August 30, 2009, was due to the shutdown of the growing products portion of the Home andGarden Business and a determination that the forecasted transactions were probable of not occurring. TheSuccessor Company had no such swap contracts outstanding as of September 30, 2009 and no related gain (loss)recorded in AOCI.
Derivative Contracts
The Company periodically enters into forward and swap foreign exchange contracts to economically hedgethe risk from third party and intercompany payments resulting from existing obligations. These obligationsgenerally require the Company to exchange foreign currencies for U.S. Dollars, Euros or Australian Dollars.These foreign exchange contracts are economic hedges of a related liability or asset recorded in theaccompanying Consolidated Statements of Financial Position. The gain or loss on the derivative hedge contractsis recorded in earnings as an offset to the change in value of the related liability or asset at each period end. AtSeptember 30, 2010 and September 30, 2009 the Company had $333,562 and $37,478, respectively, of suchforeign exchange derivative notional value contracts outstanding.
During the Predecessor Company’s eleven month period ended August 30, 2009, as a result of theBankruptcy Cases, the Company determined that previously designated cash flow hedge relationships associatedwith interest rate swaps became ineffective as of the Company’s Petition Date. Further, the Company’s seniorsecured term credit agreement was amended in connection with the implementation of the Plan, and accordingly
123

SPECTRUM BRANDS HOLDINGS, INC. AND SUBSIDIARIES
NOTES TO CONSOLIDATED FINANCIAL STATEMENTS—(Continued)(In thousands, except per share amounts)
the underlying transactions did not occur as originally forecasted. As a result, the Predecessor Companyreclassified approximately $(6,191), pretax, of (losses) from AOCI as an adjustment to Interest expense duringthe period from October 1, 2008 through August 30, 2009. As a result, the portion of derivative net losses to bereclassified from AOCI into earnings over the next 12 months was $0. The Predecessor Company’s relatedderivative contracts were terminated during the pendency of the Bankruptcy Cases and settled at a loss on theEffective Date.
(s) Fair Value of Financial Instruments
ASC Topic 820: “Fair Value Measurements and Disclosures,” (“ASC 820”), establishes a new framework formeasuring fair value and expands related disclosures. Broadly, the ASC 820 framework requires fair value to bedetermined based on the exchange price that would be received for an asset or paid to transfer a liability (an exitprice) in the principal or most advantageous market for the asset or liability in an orderly transaction betweenmarket participants. ASC 820 establishes market or observable inputs as the preferred source of values, followedby assumptions based on hypothetical transactions in the absence of market inputs. The Company utilizesvaluation techniques that attempt to maximize the use of observable inputs and minimize the use of unobservableinputs. The determination of the fair values considers various factors, including closing exchange orover-the-counter market pricing quotations, time value and credit quality factors underlying options andcontracts. The fair value of certain derivative financial instruments is estimated using pricing models based oncontracts with similar terms and risks. Modeling techniques assume market correlation and volatility, such asusing prices of one delivery point to calculate the price of the contract’s different delivery point. The nominalvalue of interest rate transactions is discounted using applicable forward interest rate curves. In addition, byapplying a credit reserve which is calculated based on credit default swaps or published default probabilities forthe actual and potential asset value, the fair value of the Company’s derivative financial instruments assetsreflects the risk that the counterparties to these contracts may default on the obligations. Likewise, by assessingthe requirements of a reserve for non-performance which is calculated based on the probability of default by theCompany, the Company adjusts its derivative contract liabilities to reflect the price at which a potential marketparticipant would be willing to assume the Company’s liabilities. The Company has not changed its valuationtechniques in measuring the fair value of any financial assets and liabilities during the year.
The valuation techniques required by ASC 820 are based upon observable and unobservable inputs.Observable inputs reflect market data obtained from independent sources, while unobservable inputs reflectmarket assumptions made by the Company. These two types of inputs create the following fair value hierarchy:
Level 1 Unadjusted quoted prices for identical instruments in active markets.
Level 2 Quoted prices for similar instruments in active markets; quoted prices for identical orsimilar instruments in markets that are not active; and model-derived valuations whoseinputs are observable or whose significant value drivers are observable.
Level 3 Significant inputs to the valuation model are unobservable.
The Company maintains policies and procedures to value instruments using the best and most relevant dataavailable. In certain cases, the inputs used to measure fair value may fall into different levels of the fair valuehierarchy. In such cases, the level in the fair value hierarchy within which the fair value measurement in itsentirety falls must be determined based on the lowest level input that is significant to the fair value measurement.The Company’s assessment of the significance of a particular input to the fair value measurement in its entiretyrequires judgment, and considers factors specific to the asset or liability. In addition, the Company has riskmanagement teams that review valuation, including independent price validation for certain instruments. Further,in other instances, the Company retains independent pricing vendors to assist in valuing certain instruments.
124

SPECTRUM BRANDS HOLDINGS, INC. AND SUBSIDIARIES
NOTES TO CONSOLIDATED FINANCIAL STATEMENTS—(Continued)(In thousands, except per share amounts)
The Company’s derivatives are valued on a recurring basis using internal models, which are based onmarket observable inputs including interest rate curves and both forward and spot prices for currencies andcommodities.
The Company’s net derivative portfolio as of September 30, 2010, contains Level 2 instruments andrepresents commodity, interest rate and foreign exchange contracts.
Level 1 Level 2 Level 3 Total
Assets:Commodity contracts . . . . . . . . . . . . . . . . . . . . . . . . . $— $ 3,914 $— $ 3,914
Total Assets . . . . . . . . . . . . . . . . . . . . . . . . . . . . . . . . . . . . . $— $ 3,914 $— $ 3,914
Liabilities:Interest rate contracts . . . . . . . . . . . . . . . . . . . . . . . . . $— $ (6,627) $— $ (6,627)Foreign exchange contracts, net . . . . . . . . . . . . . . . . . — (38,111) $— (38,111)
Total Liabilities . . . . . . . . . . . . . . . . . . . . . . . . . . . . . . . . . . $— $(44,738) $— $(44,738)
The Company’s net derivative portfolio as of September 30, 2009, contains Level 2 instruments andrepresents commodity and foreign exchange contracts.
Level 1 Level 2 Level 3 Total
Assets:Commodity contracts . . . . . . . . . . . . . . . . . . . . . . . . . . . . . $— $3,415 $— $3,415
Total Assets . . . . . . . . . . . . . . . . . . . . . . . . . . . . . . . . . . . . . . . . $— $3,415 $— $3,415
Liabilities:Foreign exchange contracts, net . . . . . . . . . . . . . . . . . . . . $— $ (797) $— $ (797)
Total Liabilities . . . . . . . . . . . . . . . . . . . . . . . . . . . . . . . . . . . . . $— $ (797) $— $ (797)
The carrying values of cash and cash equivalents, accounts and notes receivable, accounts payable andshort-term debt approximate fair value. The fair values of long-term debt and derivative financial instruments aregenerally based on quoted or observed market prices.
Goodwill, intangible assets and other long-lived assets are also tested annually or if a triggering eventoccurs that indicates an impairment loss may have been incurred using fair value measurements withunobservable inputs (Level 3). The Company did not record any impairment charges related to goodwill,intangible assets or other long-lived assets during Fiscal 2010. (See also Note 3(i), Significant AccountingPolicies—Intangible Assets, for further details on impairment testing.)
The carrying amounts and fair values of the Company’s financial instruments are summarized as follows((liability)/asset):
September 30, 2010 September 30, 2009
CarryingAmount Fair Value
CarryingAmount Fair Value
Total debt . . . . . . . . . . . . . . . . . . . . . . . . . . . . . . . . . . . . $(1,743,767) $(1,868,754) $(1,583,535) $(1,592,987)Interest rate swap agreements . . . . . . . . . . . . . . . . . . . . (6,627) (6,627) — —Commodity swap and option agreements . . . . . . . . . . . 3,914 3,914 3,415 3,415Foreign exchange forward agreements . . . . . . . . . . . . . (38,111) (38,111) (797) (797)
(t) Environmental ExpendituresEnvironmental expenditures that relate to current ongoing operations or to conditions caused by past operationsare expensed or capitalized as appropriate. The Company determines its liability on a site-by-site basis and
125

SPECTRUM BRANDS HOLDINGS, INC. AND SUBSIDIARIES
NOTES TO CONSOLIDATED FINANCIAL STATEMENTS—(Continued)(In thousands, except per share amounts)
records a liability at the time when it is probable that a liability has been incurred and such liability can bereasonably estimated. The estimated liability is not reduced for possible recoveries from insurance carriers.Estimated environmental remediation expenditures are included in the determination of the net realizable valuerecorded for assets held for sale.
(u) Reclassifications
Certain prior year amounts have been reclassified to conform to the current year presentation. Thesereclassifications had no effect on previously reported results of operations or accumulated deficit.
(v) Comprehensive Income
Comprehensive income includes foreign currency translation of assets and liabilities of foreign subsidiaries,effects of exchange rate changes on intercompany balances of a long-term nature and transactions designated as ahedge of net foreign investments, derivative financial instruments designated as cash flow hedges and additionalminimum pension liabilities associated with the Company’s pension. Except for the currency translation impactof the Company’s intercompany debt of a long-term nature, the Company does not provide income taxes oncurrency translation adjustments, as earnings from international subsidiaries are considered to be permanentlyreinvested.
Amounts recorded in AOCI on the accompanying Consolidated Statements of Shareholders’ Equity(Deficit) and Comprehensive Income (Loss) for Fiscal 2010, Fiscal 2009 and Fiscal 2008 are net of the followingtax (benefit) expense amounts:
PensionAdjustment
CashFlow Hedges
TranslationAdjustment Total
2010 (Successor Company) . . . . . . . . . . . . . . . . . . . . . . . . . . . $(6,141) $(2,659) $(1,566) $(10,366)2009 (Successor Company) . . . . . . . . . . . . . . . . . . . . . . . . . . . $ 247 $ 16 $ 319 $ 5822009 (Predecessor Company) . . . . . . . . . . . . . . . . . . . . . . . . . . $ (497) $ 5,286 $ (40) $ 4,7492008 (Predecessor Company) . . . . . . . . . . . . . . . . . . . . . . . . . . $(1,139) $(4,765) $ (318) $ (6,222)
(w) Stock Compensation
In 1996, the Predecessor Company’s board of directors (“Predecessor Board”) approved the RayovacCorporation 1996 Stock Option Plan (“1996 Plan”). Under the 1996 Plan, stock options to acquire up to 2,318shares of common stock, in the aggregate, could be granted to select employees and non-employee directors ofthe Predecessor Company under either or both a time-vesting or a performance-vesting formula at an exerciseprice equal to the market price of the common stock on the date of grant. The 1996 Plan expired onSeptember 12, 2006.
In 1997, the Predecessor Board adopted the 1997 Rayovac Incentive Plan (“1997 Plan”). Under the 1997Plan, the Predecessor Company could grant to employees and non-employee director’s stock options, stockappreciation rights (“SARs”), restricted stock, and other stock-based awards, as well as cash-based annual andlong-term incentive awards. Accelerated vesting will occur in the event of a change in control, as defined in the1997 Plan. Up to 5,000 shares of common stock could have been issued under the 1997 Plan. The 1997 Planexpired in August 31, 2007.
In 2004, the Predecessor Board adopted the 2004 Rayovac Incentive Plan (“2004 Plan”). The 2004 Plansupplements the 1997 Plan. Under the 2004 Plan, the Predecessor Company could grant to employees and
126

SPECTRUM BRANDS HOLDINGS, INC. AND SUBSIDIARIES
NOTES TO CONSOLIDATED FINANCIAL STATEMENTS—(Continued)(In thousands, except per share amounts)
non-employee directors stock options, SARs, restricted stock, and other stock-based awards, as well as cash-based annual and long-term incentive awards. Accelerated vesting would occur in the event of a change incontrol, as defined in the 2004 Plan. Up to 3,500 shares of common stock, net of forfeitures and cancellations,could have been issued under the 2004 Plan. The 2004 Plan would have expired on July 31, 2014.
On the Effective Date all of the existing common stock of the Predecessor Company was extinguished anddeemed cancelled. The Successor Company had no stock options, SARs, restricted stock or other stock-basedawards outstanding as of September 30, 2009.
In September 2009, the Successor Company’s board of directors (the “Board”) adopted the 2009 SpectrumBrands Inc. Incentive Plan (the “2009 Plan”). In conjunction with the Merger the 2009 Plan was assumed by SBHoldings. As of September 30, 2010, up to 3,333 shares of common stock, net of forfeitures and cancellations,could have been issued under the 2009 Plan. After October 21, 2010, no further awards may be made under the2009 Plan, provided that a majority of the holders of the common stock of the Company eligible to vote thereonapprove the Spectrum Brands Holdings, Inc. 2011 Omnibus Equity Award Plan (“2011 Plan”) prior toOctober 21, 2011.
In conjunction with the Merger, the Company adopted the Spectrum Brands Holdings, Inc. 2007 OmnibusEquity Award Plan (formerly known as the Russell Hobbs Inc. 2007 Omnibus Equity Award Plan, as amendedon June 24, 2008) (the “2007 RH Plan”). As of September 30, 2010, up to 600 shares of common stock, net offorfeitures and cancellations, could have been issued under the RH Plan. After October 21, 2010, no furtherawards may be made under the 2007 RH Plan, provided that a majority of the holders of the common stock of theCompany eligible to vote thereon approve the 2011 Plan prior to October 21, 2011.
On October 21, 2010, the Company’s Board of Directors adopted the 2011 Plan, subject to shareholderapproval prior to October 21, 2011 and the Company intends to submit the 2011 Plan for shareholder approval inconnection with its next Annual Meeting. Upon such shareholder approval, no further awards will be grantedunder the 2009 Plan and the 2007 RH Plan. 4,626 shares of common stock of the Company, net of cancellations,may be issued under the 2011 Plan. While the Company has begun granting awards under the 2011 Plan, the2011 Plan (and awards granted thereunder) are subject to the approval by a majority of the holders of thecommon stock of the Company eligible to vote thereon prior to October 21, 2011.
Under ASC Topic 718: “Compensation-Stock Compensation,” (“ASC 718”), the Company is required torecognize expense related to the fair value of its employee stock awards.
Total stock compensation expense associated with restricted stock awards recognized by the SuccessorCompany during Fiscal 2010 was $16,676 or $10,839, net of taxes. The amounts before tax are included inGeneral and administrative expenses and Restructuring and related charges in the accompanying ConsolidatedStatements of Operations, of which $2,141 or $1,392 net of taxes, was included in Restructuring and relatedcharges primarily related to the accelerated vesting of certain awards related to terminated employees. TheSuccessor Company recorded no stock compensation expense during the period from August 31, 2009 throughSeptember 30, 2009.
Total stock compensation expense associated with both stock options and restricted stock awards recognizedby the Predecessor Company during the period from October 1, 2008 through August 30, 2009 and Fiscal 2008was $2,636 and $5,098 or $1,642 and $3,141, net of taxes, respectively. The amounts before tax are included inGeneral and administrative expenses and Restructuring and related charges in the accompanying ConsolidatedStatements of Operations, of which $0 and $433 or $0 and $267, net of taxes, was included in Restructuring and
127

SPECTRUM BRANDS HOLDINGS, INC. AND SUBSIDIARIES
NOTES TO CONSOLIDATED FINANCIAL STATEMENTS—(Continued)(In thousands, except per share amounts)
related charges during the period from October 1, 2008 through August 30, 2009 and Fiscal 2008, respectively,primarily related to the accelerated vesting of certain awards related to terminated employees.
The Successor Company granted approximately 939 shares of restricted stock during Fiscal 2010. Of thesegrants, 271 restricted stock units were granted in conjunction with the Merger and are time-based and vest over aone year period. The remaining 668 shares are restricted stock grants that are time based and vest as follows:(i) 18 shares vest over a one year period; (ii) 611 shares vest over a two year period; and (iii) 39 shares vest overa three year period. The total market value of the restricted shares on the date of the grant was approximately$23,299.
The Predecessor Company granted approximately 229 shares of restricted stock during Fiscal 2009. Of thesegrants, 42 were time-based and would vest on a pro rata basis over a three year period and 187 shares werepurely performance-based and would vest only upon achievement of certain performance goals. All vesting dateswere subject to the recipient’s continued employment with the Company, except as otherwise permitted by thePredecessor Board or if the employee was terminated without cause. The total market value of the restrictedshares on the date of grant was approximately $150. Upon the Effective Date, by operation of the Plan, therestricted stock granted by the Predecessor Company was extinguished and deemed cancelled.
The Predecessor Company granted approximately 408 shares of restricted stock during Fiscal 2008. Of thesegrants, 158 shares were time-based and would vest on a pro rata basis over a three year period and 250 werepurely performance-based and would vest only upon achievement of certain performance goals. All vesting dateswere subject to the recipient’s continued employment with the Company, except as otherwise permitted by thePredecessor Board or if the employee was terminated without cause. The total market value of the restrictedshares on the date of grant was approximately $2,165. Upon the Effective Date, by operation of the Plan, therestricted stock granted by the Predecessor Company was extinguished and deemed cancelled.
The fair value of restricted stock is determined based on the market price of the Company’s shares on thegrant date. A summary of the status of the Successor Company’s non-vested restricted stock as of September 30,2010 is as follows:
Restricted Stock Shares
WeightedAverage
Grant DateFair Value Fair Value
Restricted stock at September 30, 2009 . . . . . . . . . . . . . . . . . . . . . . — $ — $ —Granted . . . . . . . . . . . . . . . . . . . . . . . . . . . . . . . . . . . . . . . . . . . . . . . 939 24.82 23,299Vested . . . . . . . . . . . . . . . . . . . . . . . . . . . . . . . . . . . . . . . . . . . . . . . . (244) 23.59 (5,763)
Restricted stock at September 30, 2010 . . . . . . . . . . . . . . . . . . . . . . 695 $25.23 $17,536
(x) Restructuring and Related Charges
Restructuring charges are recognized and measured according to the provisions of ASC Topic 420: “Exit orDisposal Cost Obligations,” (“ASC 420”). Under ASC 420, restructuring charges include, but are not limited to,termination and related costs consisting primarily of one-time termination benefits such as severance costs andretention bonuses, and contract termination costs consisting primarily of lease termination costs. Related charges,as defined by the Company, include, but are not limited to, other costs directly associated with exit andintegration activities, including impairment of property and other assets, departmental costs of full-timeincremental integration employees, and any other items related to the exit or integration activities. Costs for suchactivities are estimated by management after evaluating detailed analyses of the cost to be incurred. The
128

SPECTRUM BRANDS HOLDINGS, INC. AND SUBSIDIARIES
NOTES TO CONSOLIDATED FINANCIAL STATEMENTS—(Continued)(In thousands, except per share amounts)
Company presents restructuring and related charges on a combined basis. (See also Note 14, Restructuring andRelated Charges, for a more complete discussion of restructuring initiatives and related costs).
(y) Acquisition and Integration Related Charges
Acquisition and integration related charges reflected in Operating expenses include, but are not limited totransaction costs such as banking, legal and accounting professional fees directly related to the acquisition,termination and related costs for transitional and certain other employees, integration related professional feesand other post business combination related expenses associated with the Merger of Russell Hobbs.
The following table summarizes acquisition and integration related charges incurred by the Company duringFiscal 2010:
2010
Legal and professional fees . . . . . . . . . . . . . . . . . . . . . . . . . . . . . . . . . . . $24,962Employee termination charges . . . . . . . . . . . . . . . . . . . . . . . . . . . . . . . . . 9,713Integration costs . . . . . . . . . . . . . . . . . . . . . . . . . . . . . . . . . . . . . . . . . . . . 3,777
Total Acquisition and integration related charges . . . . . . . . . . . . . . . . . . $38,452
(z) Adoption of New Accounting Pronouncements
Business Combinations
In December 2007, the Financial Accounting Standards Board (the “FASB”) issued new accountingguidance on business combinations and noncontrolling interests in consolidated financial statements. Theobjective is to improve the relevance, representational faithfulness and comparability of the information that areporting entity provides in its financial reports about a business combination and its effects. The guidanceapplies to all transactions or other events in which an entity (the “acquirer”) obtains control of one or morebusinesses (the “acquiree”), including those sometimes referred to as “true mergers” or “mergers of equals” andcombinations achieved without the transfer of consideration. The guidance, among other things, requirescompanies to provide disclosures relating to the gross amount of goodwill and accumulated goodwill impairmentlosses. In April 2009, the FASB issued additional guidance which addresses application issues arising fromcontingencies in a business combination. The Company adopted the new guidance beginning October 1, 2009.The Company merged with Russell Hobbs during Fiscal 2010. (See Note 15, Acquisition, for informationrelating to the Merger with Russell Hobbs.)
Employers’ Disclosures about Postretirement Benefit Plan Assets
In December 2008, the FASB issued new accounting guidance on employers’ disclosures about assets of adefined benefit pension or other postretirement plan. It requires employers to disclose information about fairvalue measurements of plan assets. The objectives of the disclosures are to provide an understanding of: (a) howinvestment allocation decisions are made, including the factors that are pertinent to an understanding ofinvestment policies and strategies; (b) the major categories of plan assets; (c) the inputs and valuation techniquesused to measure the fair value of plan assets; (d) the effect of fair value measurements using significantunobservable inputs on changes in plan assets for the period; and (e) significant concentrations of risk withinplan assets. The Company adopted this new guidance at September 30, 2010, the fair value measurement date ofits defined benefit pension and retiree medical plans. (See Note 10, Employee Benefit Plans, for the applicabledisclosures.)
129
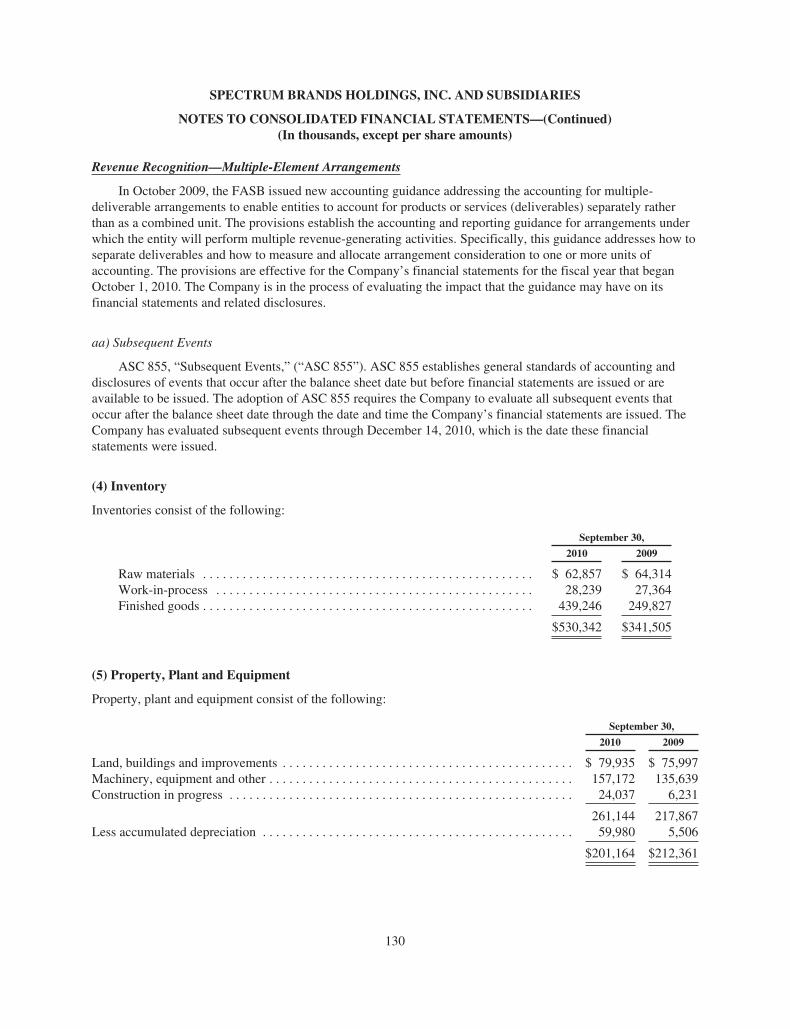
SPECTRUM BRANDS HOLDINGS, INC. AND SUBSIDIARIES
NOTES TO CONSOLIDATED FINANCIAL STATEMENTS—(Continued)(In thousands, except per share amounts)
Revenue Recognition—Multiple-Element Arrangements
In October 2009, the FASB issued new accounting guidance addressing the accounting for multiple-deliverable arrangements to enable entities to account for products or services (deliverables) separately ratherthan as a combined unit. The provisions establish the accounting and reporting guidance for arrangements underwhich the entity will perform multiple revenue-generating activities. Specifically, this guidance addresses how toseparate deliverables and how to measure and allocate arrangement consideration to one or more units ofaccounting. The provisions are effective for the Company’s financial statements for the fiscal year that beganOctober 1, 2010. The Company is in the process of evaluating the impact that the guidance may have on itsfinancial statements and related disclosures.
aa) Subsequent Events
ASC 855, “Subsequent Events,” (“ASC 855”). ASC 855 establishes general standards of accounting anddisclosures of events that occur after the balance sheet date but before financial statements are issued or areavailable to be issued. The adoption of ASC 855 requires the Company to evaluate all subsequent events thatoccur after the balance sheet date through the date and time the Company’s financial statements are issued. TheCompany has evaluated subsequent events through December 14, 2010, which is the date these financialstatements were issued.
(4) Inventory
Inventories consist of the following:
September 30,
2010 2009
Raw materials . . . . . . . . . . . . . . . . . . . . . . . . . . . . . . . . . . . . . . . . . . . . . . . . . . $ 62,857 $ 64,314Work-in-process . . . . . . . . . . . . . . . . . . . . . . . . . . . . . . . . . . . . . . . . . . . . . . . . 28,239 27,364Finished goods . . . . . . . . . . . . . . . . . . . . . . . . . . . . . . . . . . . . . . . . . . . . . . . . . . 439,246 249,827
$530,342 $341,505
(5) Property, Plant and Equipment
Property, plant and equipment consist of the following:
September 30,
2010 2009
Land, buildings and improvements . . . . . . . . . . . . . . . . . . . . . . . . . . . . . . . . . . . . . . . . . . . . $ 79,935 $ 75,997Machinery, equipment and other . . . . . . . . . . . . . . . . . . . . . . . . . . . . . . . . . . . . . . . . . . . . . . 157,172 135,639Construction in progress . . . . . . . . . . . . . . . . . . . . . . . . . . . . . . . . . . . . . . . . . . . . . . . . . . . . 24,037 6,231
261,144 217,867Less accumulated depreciation . . . . . . . . . . . . . . . . . . . . . . . . . . . . . . . . . . . . . . . . . . . . . . . 59,980 5,506
$201,164 $212,361
130

SPECTRUM BRANDS HOLDINGS, INC. AND SUBSIDIARIES
NOTES TO CONSOLIDATED FINANCIAL STATEMENTS—(Continued)(In thousands, except per share amounts)
(6) Goodwill and Intangible Assets
Intangible assets consist of the following:
Global Batteries &Personal Care
Home and GardenBusiness
Global PetSupplies
SmallAppliances Total
Goodwill:Balance at September 30, 2008 (PredecessorCompany) . . . . . . . . . . . . . . . . . . . . . . . . . . . . . . . . . . . $117,649 $ — $117,819 $ — $ 235,468
Additions . . . . . . . . . . . . . . . . . . . . . . . . . . . . . . . . . . . . . 2,762 — — — 2,762Effect of translation . . . . . . . . . . . . . . . . . . . . . . . . . . . . . 369 — 306 — 675
Balance at August 30, 2009 (Predecessor Company) . . . $120,780 $ — $118,125 $ — $ 238,905Fresh-start adjustments . . . . . . . . . . . . . . . . . . . . . . . . . . . 60,029 187,887 41,239 — 289,155
Balance at August 30, 2009 (Successor Company) . . . . . $180,809 $187,887 $159,364 $ — $ 528,060Adjustments for release of valuation allowance . . . . . . . (30,363) (17,080) — — (47,443)Effect of translation . . . . . . . . . . . . . . . . . . . . . . . . . . . . . 1,847 — 884 — 2,731
Balance at September 30, 2009 (Successor Company) . . $152,293 $170,807 $160,248 $ — $ 483,348Additions due to Russell Hobbs Merger . . . . . . . . . . . . . — — — 120,079 120,079Effect of translation . . . . . . . . . . . . . . . . . . . . . . . . . . . . . (2,715) — (2,892) 2,235 (3,372)
Balance at September 30, 2010 (Successor Company) . . $149,578 $170,807 $157,356 $122,314 $ 600,055
Intangible Assets:Trade names Not Subject to AmortizationBalance at September 30, 2008 (PredecessorCompany) . . . . . . . . . . . . . . . . . . . . . . . . . . . . . . . . . . . $286,260 $ 57,000 $218,345 $ — $ 561,605
Reclassification(A) . . . . . . . . . . . . . . . . . . . . . . . . . . . . . . — (12,000) — — (12,000)Impairment charge . . . . . . . . . . . . . . . . . . . . . . . . . . . . . . (15,391) (500) (18,500) — (34,391)Effect of translation . . . . . . . . . . . . . . . . . . . . . . . . . . . . . (240) — (214) — (454)
Balance at August 30, 2009 (Predecessor Company) . . . $270,629 $ 44,500 $199,631 $ — $ 514,760Fresh-start adjustments . . . . . . . . . . . . . . . . . . . . . . . . . . . 130,371 31,500 10,869 — 172,740
Balance at August 30, 2009 (Successor Company) . . . . . $401,000 $ 76,000 $210,500 $ — $ 687,500Effect of translation . . . . . . . . . . . . . . . . . . . . . . . . . . . . . 983 — 1,753 — 2,736
Balance at September 30, 2009 (Successor Company) . . $401,983 $ 76,000 $212,253 $ — $ 690,236Additions due to Russell Hobbs Merger . . . . . . . . . . . . . — — — 170,930 170,930Effect of translation . . . . . . . . . . . . . . . . . . . . . . . . . . . . . (3,878) — (6,920) 7,110 (3,688)
Balance at September 30, 2010 (Successor Company) . . $398,105 $ 76,000 $205,333 $178,040 $ 857,478
Intangible Assets Subject to AmortizationBalance at September 30, 2008, net (PredecessorCompany) . . . . . . . . . . . . . . . . . . . . . . . . . . . . . . . . . . . $ 11,829 $ 58,357 $111,018 $ — $ 181,204
Additions(A) . . . . . . . . . . . . . . . . . . . . . . . . . . . . . . . . . . . 500 12,000 32 — 12,532Disposals(B) . . . . . . . . . . . . . . . . . . . . . . . . . . . . . . . . . . . — (11,595) — — (11,595)Amortization during period . . . . . . . . . . . . . . . . . . . . . . . (975) (6,297) (11,827) — (19,099)Effect of translation . . . . . . . . . . . . . . . . . . . . . . . . . . . . . (129) — (623) — (752)
Balance at August 30, 2009, net (PredecessorCompany) . . . . . . . . . . . . . . . . . . . . . . . . . . . . . . . . . . . $ 11,225 $ 52,465 $ 98,600 $ — $ 162,290
Fresh-start adjustments . . . . . . . . . . . . . . . . . . . . . . . . . . . 342,775 120,535 146,400 — 609,710
Balance at August 30, 2009, net (SuccessorCompany) . . . . . . . . . . . . . . . . . . . . . . . . . . . . . . . . . . . $354,000 $173,000 $245,000 $ — $ 772,000
Amortization during period . . . . . . . . . . . . . . . . . . . . . . . (1,528) (729) (1,256) — (3,513)Effect of translation . . . . . . . . . . . . . . . . . . . . . . . . . . . . . 1,961 — 1,261 — 3,222
Balance at September 30, 2009, net (SuccessorCompany) . . . . . . . . . . . . . . . . . . . . . . . . . . . . . . . . . . . $354,433 $172,271 $245,005 $ — $ 771,709
Additions due to Russell Hobbs Merger . . . . . . . . . . . . . — — — 192,397 192,397Amortization during period . . . . . . . . . . . . . . . . . . . . . . . (17,755) (8,750) (14,861) (4,554) (45,920)Effect of translation . . . . . . . . . . . . . . . . . . . . . . . . . . . . . (3,562) — (3,876) 1,134 (6,304)
Balance at September 30, 2010, net (SuccessorCompany) . . . . . . . . . . . . . . . . . . . . . . . . . . . . . . . . . . . $333,116 $163,521 $226,268 $188,977 $ 911,882
Total Intangible Assets, net at September 30, 2010(Successor Company) . . . . . . . . . . . . . . . . . . . . . . . . . . $731,221 $239,521 $431,601 $367,017 $1,769,360
131

SPECTRUM BRANDS HOLDINGS, INC. AND SUBSIDIARIES
NOTES TO CONSOLIDATED FINANCIAL STATEMENTS—(Continued)(In thousands, except per share amounts)
(A) During the first quarter of Fiscal 2009, the Company reclassified $12,000 of trade names intangible assets not subject to amortizationrelated to the growing products portion of the Home and Garden Business to intangible assets subject to amortization as such tradenames had been assigned a useful life through the term of the shutdown period. The Company completed the shutdown of thegrowing products portion of the Home and Garden Business during the second quarter of Fiscal 2009. (See Note 9, DiscontinuedOperations, for further details on the shutdown of the growing products portion of the Home and Garden Business).
(B) During the second quarter of Fiscal 2009, the Company reclassified the growing products portion of the Home and Garden Businessto discontinued operations as the Company completed the shutdown of the business during that period. The Company disposed of allintangible assets related to the growing products portion of the Home and Garden Business. (See Note 9, Discontinued Operations,for further details on the shutdown of the growing products portion of the Home and Garden Business).
Intangible assets subject to amortization include proprietary technology, customer relationships and certaintrade names. The carrying value of technology assets was $60,792, net of accumulated amortization of $6,305 atSeptember 30, 2010 and $62,985, net of accumulated amortization of $515 at September 30, 2009. The Companytrade names subject to amortization relate to the valuation under fresh-start reporting and the Merger with RussellHobbs. The carrying value of these trade names was $145,939, net of accumulated amortization of $3,750 atSeptember 30, 2010 and $490, net of accumulated amortization of $10 at September 30, 2009. Remainingintangible assets subject to amortization include customer relationship intangibles. The carrying value ofcustomer relationships was $705,151, net of accumulated amortization of $35,865 at September 30, 2010 and$708,234, net of accumulated amortization of $2,988 at September 30, 2009. The useful life of the Company’sintangible assets subject to amortization are 8 years for technology assets related to the Global Pet Suppliessegment, 9 to 11 years for technology assets related to the Small Appliances segment, 17 years for technologyassets associated with the Global Batteries & Personal Care segment, 20 years for customer relationships ofGlobal Batteries & Personal Care, Home and Garden and Global Pet Supplies, 15 years for Small Appliancescustomer relationships, 12 years for a trade name within the Small Appliances segment and 4 years for a tradename within the Home and Garden segment.
ASC 350 requires companies to test goodwill and indefinite-lived intangible assets for impairment annually,or more often if an event or circumstance indicates that an impairment loss may have been incurred. DuringFiscal 2010, the period from October 1, 2008 through August 30, 2009 and Fiscal 2008 the Company conductedimpairment testing of goodwill and indefinite-lived intangible assets. As a result of this testing the Companyrecorded non-cash pretax impairment charges of approximately $34,391 and $861,234 in the period fromOctober 1, 2008 through August 30, 2009 and Fiscal 2008, respectively. The $34,391 recorded during the periodfrom October 1, 2008 through August 30, 2009 related to impaired trade name intangible assets. Of the Fiscal2008 impairment, approximately $601,934 of the charge related to impaired goodwill and $259,300 related toimpaired trade name intangible assets. (See also Note 3(i), Significant Accounting Policies—Intangible Assets,for further details on the impairment charges).
The Company has designated the growing products portion of the Home and Garden Business and theCanadian division of the Home and Garden Business as discontinued operations. In accordance with ASC 360,long-lived assets to be disposed are recorded at the lower of their carrying value or fair value less costs to sell.During Fiscal 2008, the Company recorded a non-cash pretax charge of $5,700 in discontinued operations toreduce the carrying value of intangible assets related to the growing products portion of the Home and GardenBusiness in order to reflect the estimated fair value of this business. (See also Note 9, Discontinued Operations,for additional information relating to this impairment charge).
132

SPECTRUM BRANDS HOLDINGS, INC. AND SUBSIDIARIES
NOTES TO CONSOLIDATED FINANCIAL STATEMENTS—(Continued)(In thousands, except per share amounts)
The amortization expense related to intangibles subject to amortization for the Successor Company forFiscal 2010 and the period from August 31, 2009 through September 30, 2009, and the Predecessor Company forthe period from October 1, 2008 through August 30, 2009 and Fiscal 2008 is as follows:
SuccessorCompany Predecessor Company
2010
Period fromAugust 31, 2009
throughSeptember 30,
2009
Period fromOctober 1, 2008
throughAugust 30,
2009 2008(A)
Proprietary technology amortization . . . . . . . . . . . . . . . . . . . $ 6,305 $ 515 $ 3,448 $ 3,934Customer list amortization . . . . . . . . . . . . . . . . . . . . . . . . . . . 35,865 2,988 14,920 23,327Trade names amortization . . . . . . . . . . . . . . . . . . . . . . . . . . . 3,750 10 731 426
$45,920 $3,513 $19,099 $27,687
(A) Fiscal 2008 includes amortization expense related to the year ended September 30, 2007 (“Fiscal 2007”), asa result of the reclassification of the Home and Garden Business as a continuing operation during Fiscal2008. (See also Note 11, Segment Results, for further details on amortization expense related to the Homeand Garden Business).
The Company estimates annual amortization expense for the next five fiscal years will approximate $55,630per year.
(7) Debt
Debt consists of the following:
September 30, 2010 September 30, 2009
Amount Rate Amount Rate
Term Loan, U.S. Dollar, expiring June 16, 2016 . . . . . . . . . . . . . . . . . . . $ 750,000 8.1%$ — —9.5% Senior Secured Notes, due June 15, 2018 . . . . . . . . . . . . . . . . . . . . 750,000 9.5% — —Term Loan B, U.S. Dollar . . . . . . . . . . . . . . . . . . . . . . . . . . . . . . . . . . . . . — — 973,125 8.1%Term Loan, Euro . . . . . . . . . . . . . . . . . . . . . . . . . . . . . . . . . . . . . . . . . . . . — — 371,874 8.6%12% Notes, due August 28, 2019 . . . . . . . . . . . . . . . . . . . . . . . . . . . . . . . 245,031 12.0% 218,076 12.0%ABL Revolving Credit Facility, expiring June 16, 2014 . . . . . . . . . . . . . — 4.1% — —Old ABL revolving credit facility . . . . . . . . . . . . . . . . . . . . . . . . . . . . . . . — — 33,225 6.6%Supplemental Loan . . . . . . . . . . . . . . . . . . . . . . . . . . . . . . . . . . . . . . . . . . — — 45,000 17.7%Other notes and obligations . . . . . . . . . . . . . . . . . . . . . . . . . . . . . . . . . . . . 13,605 10.8% 5,919 6.2%Capitalized lease obligations . . . . . . . . . . . . . . . . . . . . . . . . . . . . . . . . . . . 11,755 5.2% 12,924 4.9%
1,770,391 1,660,143Original issuance discounts on debt . . . . . . . . . . . . . . . . . . . . . . . . . . . . . (26,624) —Fair value adjustment as a result of fresh-start reporting valuation . . . . . — (76,608)Less current maturities . . . . . . . . . . . . . . . . . . . . . . . . . . . . . . . . . . . . . . . 20,710 53,578
Long-term debt . . . . . . . . . . . . . . . . . . . . . . . . . . . . . . . . . . . . . . . . . . . . . $1,723,057 $1,529,957
133

SPECTRUM BRANDS HOLDINGS, INC. AND SUBSIDIARIES
NOTES TO CONSOLIDATED FINANCIAL STATEMENTS—(Continued)(In thousands, except per share amounts)
The Successor Company’s aggregate scheduled maturities of debt as of September 30, 2010 are as follows:
2011 . . . . . . . . . . . . . . . . . . . . . . . . . . . . . . . . . . . . . . . . . . . . . . . . . . . . . . . . . . . $ 20,7102012 . . . . . . . . . . . . . . . . . . . . . . . . . . . . . . . . . . . . . . . . . . . . . . . . . . . . . . . . . . . 35,2542013 . . . . . . . . . . . . . . . . . . . . . . . . . . . . . . . . . . . . . . . . . . . . . . . . . . . . . . . . . . . 39,9022014 . . . . . . . . . . . . . . . . . . . . . . . . . . . . . . . . . . . . . . . . . . . . . . . . . . . . . . . . . . . 39,9072015 . . . . . . . . . . . . . . . . . . . . . . . . . . . . . . . . . . . . . . . . . . . . . . . . . . . . . . . . . . . 39,970Thereafter . . . . . . . . . . . . . . . . . . . . . . . . . . . . . . . . . . . . . . . . . . . . . . . . . . . . . . 1,594,648
$1,770,391
The Company’s aggregate capitalized lease obligations included in the amounts above are payable ininstallments of $990 in 2011, $745 in 2012, $725 in 2013, $740 in 2014, $803 in 2015 and $7,752 thereafter.
In connection with the combination of Spectrum Brands and Russell Hobbs, Spectrum Brands (i) enteredinto a new senior secured term loan pursuant to a new senior credit agreement (the “Senior Credit Agreement”)consisting of a $750,000 U.S. Dollar Term Loan due June 16, 2016 (the “Term Loan”), (ii) issued $750,000 inaggregate principal amount of 9.5% Senior Secured Notes maturing June 15, 2018 (the “9.5% Notes”) and(iii) entered into a $300,000 U.S. Dollar asset based revolving loan facility due June 16, 2014 (the “ABLRevolving Credit Facility” and together with the Senior Credit Agreement, the “Senior Credit Facilities” and theSenior Credit Facilities together with the 9.5% Notes, the “Senior Secured Facilities”). The proceeds from theSenior Secured Facilities were used to repay Spectrum Brands’ then-existing senior term credit facility (the“Prior Term Facility”) and Spectrum Brands’ then-existing asset based revolving loan facility, to pay fees andexpenses in connection with the refinancing and for general corporate purposes.
The 9.5% Notes and 12% Notes were issued by Spectrum Brands. SB/RH Holdings, LLC, a wholly-ownedsubsidiary of SB Holdings, and the wholly owned domestic subsidiaries of Spectrum Brands are the guarantorsunder the 9.5% Notes. The wholly owned domestic subsidiaries of Spectrum Brands are the guarantors under the12% Notes. SB Holdings is not an issuer or guarantor of the 9.5% Notes or the 12% Notes. SB Holdings is alsonot a borrower or guarantor under the Company’s Term Loan or the ABL Revolving Credit Facility. SpectrumBrands is the borrower under the Term Loan and its wholly owned domestic subsidiaries along with SB/RHHoldings, LLC are the guarantors under that facility. Spectrum Brands and its wholly owned domesticsubsidiaries are the borrowers under the ABL Revolving Credit Facility and SB/RH Holdings, LLC is a guarantorof that facility.
Senior Term Credit Facility
The Term Loan has a maturity date of June 16, 2016. Subject to certain mandatory prepayment events, the TermLoan is subject to repayment according to a scheduled amortization, with the final payment of all amountsoutstanding, plus accrued and unpaid interest, due at maturity. Among other things, the Term Loan provides for aminimum Eurodollar interest rate floor of 1.5% and interest spreads over market rates of 6.5%.
The Senior Credit Agreement contains financial covenants with respect to debt, including, but not limited to,a maximum leverage ratio and a minimum interest coverage ratio, which covenants, pursuant to their terms,become more restrictive over time. In addition, the Senior Credit Agreement contains customary restrictivecovenants, including, but not limited to, restrictions on the Company’s ability to incur additional indebtedness,create liens, make investments or specified payments, give guarantees, pay dividends, make capital expenditures
134

SPECTRUM BRANDS HOLDINGS, INC. AND SUBSIDIARIES
NOTES TO CONSOLIDATED FINANCIAL STATEMENTS—(Continued)(In thousands, except per share amounts)
and merge or acquire or sell assets. Pursuant to a guarantee and collateral agreement, the Company and itsdomestic subsidiaries have guaranteed their respective obligations under the Senior Credit Agreement and relatedloan documents and have pledged substantially all of their respective assets to secure such obligations. TheSenior Credit Agreement also provides for customary events of default, including payment defaults and cross-defaults on other material indebtedness.
The Term Loan was issued at a 2.00% discount and was recorded net of the $15,000 amount incurred. Thediscount will be amortized as an adjustment to the carrying value of principal with a corresponding charge tointerest expense over the remaining life of the Senior Credit Agreement. During Fiscal 2010, the Companyrecorded $25,968 of fees in connection with the Senior Credit Agreement. The fees are classified as Debtissuance costs within the accompanying Consolidated Statement of Financial Position as of September 30, 2010and will be amortized as an adjustment to interest expense over the remaining life of the Senior CreditAgreement.
At September 30, 2010, the aggregate amount outstanding under the Term Loan totaled $750,000.
At September 30, 2009, the aggregate amount outstanding under the Prior Term Facility totaled aU.S. Dollar equivalent of $1,391,459, consisting of principal amounts of $973,125 under the U.S. Dollar Term BLoan, €254,970 under the Euro Facility (USD $371,874 at September 30, 2009) as well as letters of creditoutstanding under the L/C Facility totaling $46,460.
9.5% Notes
At September 30, 2010, the Company had outstanding principal of $750,000 under the 9.5% Notes maturingJune 15, 2018.
The Company may redeem all or a part of the 9.5% Notes, upon not less than 30 or more than 60 daysnotice at specified redemption prices. Further, the indenture governing the 9.5% Notes (the “2018 Indenture”)requires the Company to make an offer, in cash, to repurchase all or a portion of the applicable outstanding notesfor a specified redemption price, including a redemption premium, upon the occurrence of a change of control ofthe Company, as defined in such indenture.
The 2018 Indenture contains customary covenants that limit, among other things, the incurrence ofadditional indebtedness, payment of dividends on or redemption or repurchase of equity interests, the making ofcertain investments, expansion into unrelated businesses, creation of liens on assets, merger or consolidation withanother company, transfer or sale of all or substantially all assets, and transactions with affiliates.
In addition, the 2018 Indenture provides for customary events of default, including failure to make requiredpayments, failure to comply with certain agreements or covenants, failure to make payments on or acceleration ofcertain other indebtedness, and certain events of bankruptcy and insolvency. Events of default under the 2018Indenture arising from certain events of bankruptcy or insolvency will automatically cause the acceleration of theamounts due under the 9.5% Notes. If any other event of default under the 2018 Indenture occurs and iscontinuing, the trustee for the 2018 Indenture or the registered holders of at least 25% in the then aggregateoutstanding principal amount of the 9.5% Notes may declare the acceleration of the amounts due under thosenotes.
The 9.5% Notes were issued at a 1.37% discount and were recorded net of the $10,245 amount incurred.The discount will be amortized as an adjustment to the carrying value of principal with a corresponding charge to
135

SPECTRUM BRANDS HOLDINGS, INC. AND SUBSIDIARIES
NOTES TO CONSOLIDATED FINANCIAL STATEMENTS—(Continued)(In thousands, except per share amounts)
interest expense over the remaining life of the 9.5% Notes. During Fiscal 2010, the Company recorded $20,823of fees in connection with the issuance of the 9.5% Notes. The fees are classified as Debt issuance costs withinthe accompanying Consolidated Statement of Financial Position as of September 30, 2010 and will be amortizedas an adjustment to interest expense over the remaining life of the 9.5% Notes.
12% Notes
On August 28, 2009, in connection with emergence from the voluntary reorganization under Chapter 11 andpursuant to the Plan, the Company issued $218,076 in aggregate principal amount of 12% Notes maturingAugust 28, 2019. Semiannually, at its option, the Company may elect to pay interest on the 12% Notes in cash oras payment in kind, or “PIK”. PIK interest would be added to principal upon the relevant semi-annual interestpayment date. Under the Prior Term Facility, the Company agreed to make interest payments on the 12% Notesthrough PIK for the first three semi-annual interest payment periods. As a result of the refinancing of the PriorTerm Facility the Company is no longer required to make interest payments as payment in kind after the semi-annual interest payment date of August 28, 2010. Effective with the payment date of August 28, 2010 theCompany gave notice to the trustee that the interest payment due February 28, 2011 would be made in cash.During Fiscal 2010, the Company reclassified $26,955 of accrued interest from Other long term liabilities toprincipal in connection with the PIK provision of the 12% Notes.
The Company may redeem all or a part of the 12% Notes, upon not less than 30 or more than 60 daysnotice, beginning August 28, 2012 at specified redemption prices. Further, the indenture governing the 12%Notes require the Company to make an offer, in cash, to repurchase all or a portion of the applicable outstandingnotes for a specified redemption price, including a redemption premium, upon the occurrence of a change ofcontrol of the Company, as defined in such indenture.
At September 30, 2010 and September 30, 2009, the Company had outstanding principal of $245,031 and$218,076, respectively, under the 12% Notes.
The indenture governing the 12% Notes (the “2019 Indenture”), contains customary covenants that limit,among other things, the incurrence of additional indebtedness, payment of dividends on or redemption orrepurchase of equity interests, the making of certain investments, expansion into unrelated businesses, creation ofliens on assets, merger or consolidation with another company, transfer or sale of all or substantially all assets,and transactions with affiliates.
In addition, the 2019 Indenture provides for customary events of default, including failure to make requiredpayments, failure to comply with certain agreements or covenants, failure to make payments on or acceleration ofcertain other indebtedness, and certain events of bankruptcy and insolvency. Events of default under the indenturearising from certain events of bankruptcy or insolvency will automatically cause the acceleration of the amounts dueunder the 12% Notes. If any other event of default under the 2019 Indenture occurs and is continuing, the trustee forthe indenture or the registered holders of at least 25% in the then aggregate outstanding principal amount of the 12%Notes may declare the acceleration of the amounts due under those notes.
The Company is subject to certain limitations as a result of the Company’s Fixed Charge Coverage Ratiounder the 2019 Indenture being below 2:1. Until the test is satisfied, Spectrum Brands and certain of itssubsidiaries are limited in their ability to make significant acquisitions or incur significant additional senior creditfacility debt beyond the Senior Credit Facilities. The Company does not expect its inability to satisfy the FixedCharge Coverage Ratio test to impair its ability to provide adequate liquidity to meet the short-term and long-term liquidity requirements of its existing businesses, although no assurance can be given in this regard.
136

SPECTRUM BRANDS HOLDINGS, INC. AND SUBSIDIARIES
NOTES TO CONSOLIDATED FINANCIAL STATEMENTS—(Continued)(In thousands, except per share amounts)
In connection with the Merger, the Company obtained the consent of the note holders to certain amendmentsto the 2019 Indenture (the “Supplemental Indenture”). The Supplemental Indenture became effective upon theclosing of the Merger. Among other things, the Supplemental Indenture amended the definition of change incontrol to exclude the Harbinger Capital Partners Master Fund I, Ltd. (“Harbinger Master Fund”) and HarbingerCapital Partners Special Situations Fund, L.P. (“Harbinger Special Fund”) and, together with Harbinger MasterFund, the “HCP Funds”) and Global Opportunities Breakaway Ltd. (together with the HCP Funds, the“Harbinger Parties”) and increased the Company’s ability to incur indebtedness up to $1,850,000.
During Fiscal 2010 the Company recorded $2,966 of fees in connection with the consent. The fees areclassified as Debt issuance costs within the accompanying Consolidated Statement of Financial Position as ofSeptember 30, 2010 and will be amortized as an adjustment to interest expense over the remaining life of the12% Notes effective with the closing of the Merger.
ABL Revolving Credit Facility
The ABL Revolving Credit Facility is governed by a credit agreement (the “ABL Credit Agreement”) with Bankof America as administrative agent (the “Agent”). The ABL Revolving Credit Facility consists of revolving loans(the “Revolving Loans”), with a portion available for letters of credit and a portion available as swing line loans,in each case subject to the terms and limits described therein.
The Revolving Loans may be drawn, repaid and reborrowed without premium or penalty. The proceeds ofborrowings under the ABL Revolving Credit Facility are to be used for costs, expenses and fees in connectionwith the ABL Revolving Credit Facility, for working capital requirements of the Company and its subsidiaries’,restructuring costs, and other general corporate purposes.
The ABL Revolving Credit Facility carries an interest rate, at the Company’s option, which is subject tochange based on availability under the facility, of either: (a) the base rate plus currently 2.75% per annum or(b) the reserve-adjusted LIBOR rate (the “Eurodollar Rate”) plus currently 3.75% per annum. No amortizationwill be required with respect to the ABL Revolving Credit Facility. The ABL Revolving Credit Facility willmature on June 16, 2014. Pursuant to the credit and security agreement, the obligations under the ABL creditagreement are secured by certain current assets of the guarantors, including, but not limited to, deposit accounts,trade receivables and inventory.
The ABL Credit Agreement contains various representations and warranties and covenants, including,without limitation, enhanced collateral reporting, and a maximum fixed charge coverage ratio. The ABL CreditAgreement also provides for customary events of default, including payment defaults and cross-defaults on othermaterial indebtedness.
During Fiscal 2010 the Company recorded $9,839 of fees in connection with the ABL Revolving CreditFacility. The fees are classified as Debt issuance costs within the accompanying Consolidated Statement ofFinancial Position as of September 30, 2010 and will be amortized as an adjustment to interest expense over theremaining life of the ABL Revolving Credit Facility.
As a result of borrowings and payments under the ABL Revolving Credit Facility at September 30, 2010,the Company had aggregate borrowing availability of approximately $225,255, net of lender reserves of $28,972.
At September 30, 2010, the Company had outstanding letters of credit of $36,969 under the ABL RevolvingCredit Facility.
137
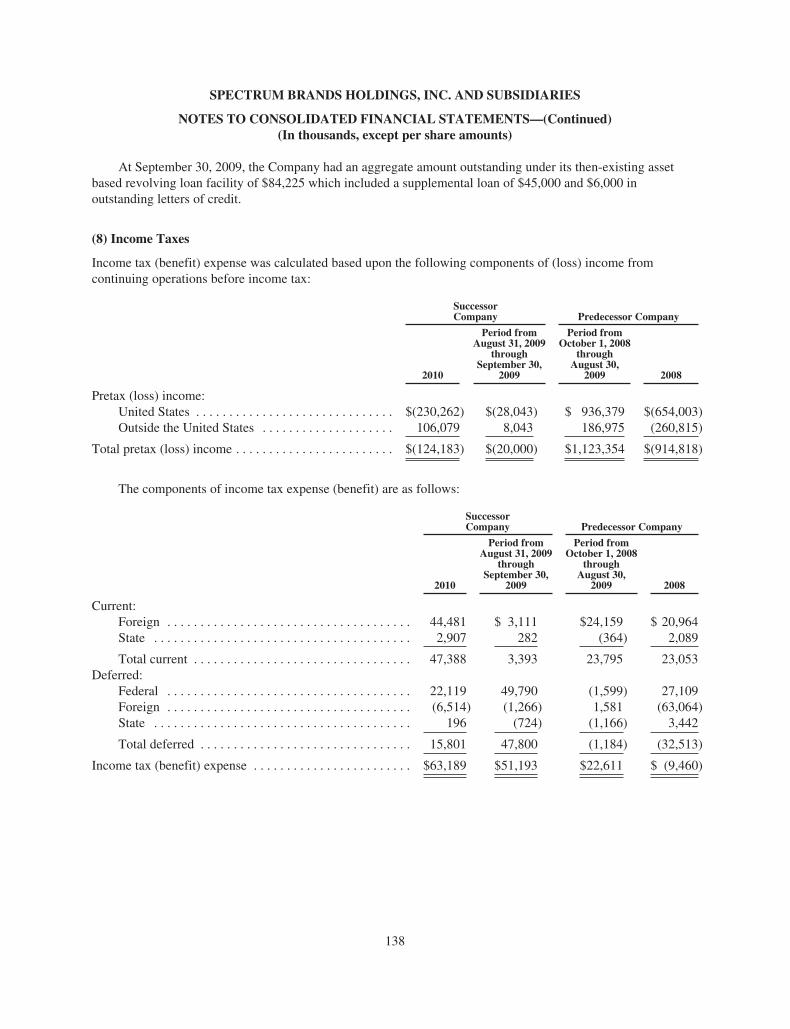
SPECTRUM BRANDS HOLDINGS, INC. AND SUBSIDIARIES
NOTES TO CONSOLIDATED FINANCIAL STATEMENTS—(Continued)(In thousands, except per share amounts)
At September 30, 2009, the Company had an aggregate amount outstanding under its then-existing assetbased revolving loan facility of $84,225 which included a supplemental loan of $45,000 and $6,000 inoutstanding letters of credit.
(8) Income Taxes
Income tax (benefit) expense was calculated based upon the following components of (loss) income fromcontinuing operations before income tax:
SuccessorCompany Predecessor Company
2010
Period fromAugust 31, 2009
throughSeptember 30,
2009
Period fromOctober 1, 2008
throughAugust 30,
2009 2008
Pretax (loss) income:United States . . . . . . . . . . . . . . . . . . . . . . . . . . . . . . $(230,262) $(28,043) $ 936,379 $(654,003)Outside the United States . . . . . . . . . . . . . . . . . . . . 106,079 8,043 186,975 (260,815)
Total pretax (loss) income . . . . . . . . . . . . . . . . . . . . . . . . $(124,183) $(20,000) $1,123,354 $(914,818)
The components of income tax expense (benefit) are as follows:
SuccessorCompany Predecessor Company
2010
Period fromAugust 31, 2009
throughSeptember 30,
2009
Period fromOctober 1, 2008
throughAugust 30,
2009 2008
Current:Foreign . . . . . . . . . . . . . . . . . . . . . . . . . . . . . . . . . . . . . 44,481 $ 3,111 $24,159 $ 20,964State . . . . . . . . . . . . . . . . . . . . . . . . . . . . . . . . . . . . . . . 2,907 282 (364) 2,089
Total current . . . . . . . . . . . . . . . . . . . . . . . . . . . . . . . . . 47,388 3,393 23,795 23,053Deferred:
Federal . . . . . . . . . . . . . . . . . . . . . . . . . . . . . . . . . . . . . 22,119 49,790 (1,599) 27,109Foreign . . . . . . . . . . . . . . . . . . . . . . . . . . . . . . . . . . . . . (6,514) (1,266) 1,581 (63,064)State . . . . . . . . . . . . . . . . . . . . . . . . . . . . . . . . . . . . . . . 196 (724) (1,166) 3,442
Total deferred . . . . . . . . . . . . . . . . . . . . . . . . . . . . . . . . 15,801 47,800 (1,184) (32,513)
Income tax (benefit) expense . . . . . . . . . . . . . . . . . . . . . . . . $63,189 $51,193 $22,611 $ (9,460)
138

SPECTRUM BRANDS HOLDINGS, INC. AND SUBSIDIARIES
NOTES TO CONSOLIDATED FINANCIAL STATEMENTS—(Continued)(In thousands, except per share amounts)
The following reconciles the Federal statutory income tax rate with the Company’s effective tax rate:
SuccessorCompany Predecessor Company
2010
Period fromAugust 31, 2009
throughSeptember 30,
2009
Period fromOctober 1, 2008
throughAugust 30,
2009 2008
Statutory federal income tax rate . . . . . . . . . . . . . . . . . . . . . . . . . . 35.0% 35.0% 35.0% 35.0%Permanent items . . . . . . . . . . . . . . . . . . . . . . . . . . . . . . . . . . . . . . . (2.1) 5.9 1.0 (0.7)Foreign statutory rate vs. U.S. statutory rate . . . . . . . . . . . . . . . . . . 8.1 3.6 (0.8) (1.8)State income taxes, net of federal benefit . . . . . . . . . . . . . . . . . . . . 4.0 3.9 (0.6) 1.4Net nondeductible (deductible) interest expense . . . . . . . . . . . . . . — — — 0.2ASC 350 Impairment . . . . . . . . . . . . . . . . . . . . . . . . . . . . . . . . . . . — — — (11.2)Fresh-start reporting valuation adjustment(A) . . . . . . . . . . . . . . . . — — (33.9) —Gain on settlement of liabilities subject to compromise . . . . . . . . . — — 4.5 —Professional fees incurred in connection with BankruptcyFiling . . . . . . . . . . . . . . . . . . . . . . . . . . . . . . . . . . . . . . . . . . . . . . — — 1.4 —
Residual tax on foreign earnings . . . . . . . . . . . . . . . . . . . . . . . . . . . (7.5) (284.7) — (0.5)Valuation allowance(B) . . . . . . . . . . . . . . . . . . . . . . . . . . . . . . . . . (73.3) (7.4) (4.6) (23.5)Reorganization items . . . . . . . . . . . . . . . . . . . . . . . . . . . . . . . . . . . . (6.1) — — —Unrecognized tax benefits . . . . . . . . . . . . . . . . . . . . . . . . . . . . . . . . (2.6) (9.3) — (0.1)Inflationary adjustments . . . . . . . . . . . . . . . . . . . . . . . . . . . . . . . . . (2.7) (1.1) — —Deferred tax correction of immaterial prior period error . . . . . . . . (4.8) — — —Other . . . . . . . . . . . . . . . . . . . . . . . . . . . . . . . . . . . . . . . . . . . . . . . . 1.1 (1.9) — 2.2
(50.9)% (256.0)% 2.0% 1.0%
(A) Includes the adjustment to the valuation allowance resulting from fresh-start reporting.(B) Includes the adjustment to the valuation allowance resulting from the Plan.
139

SPECTRUM BRANDS HOLDINGS, INC. AND SUBSIDIARIES
NOTES TO CONSOLIDATED FINANCIAL STATEMENTS—(Continued)(In thousands, except per share amounts)
The tax effects of temporary differences, which give rise to significant portions of the deferred tax assetsand deferred tax liabilities, are as follows:
SuccessorCompany
September 30,
2010 2009
Current deferred tax assets:Employee benefits . . . . . . . . . . . . . . . . . . . . . . . . . . . . . . . . . . . . . . . . . . . . . . . . . . . $ 21,770 $ 20,908Restructuring . . . . . . . . . . . . . . . . . . . . . . . . . . . . . . . . . . . . . . . . . . . . . . . . . . . . . . . 6,486 11,396Inventories and receivables . . . . . . . . . . . . . . . . . . . . . . . . . . . . . . . . . . . . . . . . . . . . 13,484 9,657Marketing and promotional accruals . . . . . . . . . . . . . . . . . . . . . . . . . . . . . . . . . . . . . 5,783 5,458Other . . . . . . . . . . . . . . . . . . . . . . . . . . . . . . . . . . . . . . . . . . . . . . . . . . . . . . . . . . . . . . 22,712 13,107Valuation allowance . . . . . . . . . . . . . . . . . . . . . . . . . . . . . . . . . . . . . . . . . . . . . . . . . . (28,668) (16,413)
Total current deferred tax assets . . . . . . . . . . . . . . . . . . . . . . . . . . . . . . . . . . . . . . . . . . . . . 41,567 44,113Current deferred tax liabilities:
Inventory . . . . . . . . . . . . . . . . . . . . . . . . . . . . . . . . . . . . . . . . . . . . . . . . . . . . . . . . . . . (1,947) (11,560)Other . . . . . . . . . . . . . . . . . . . . . . . . . . . . . . . . . . . . . . . . . . . . . . . . . . . . . . . . . . . . . . (3,885) (4,416)
Total current deferred tax liabilities . . . . . . . . . . . . . . . . . . . . . . . . . . . . . . . . . . . . . . . . . . (5,832) (15,976)
Net current deferred tax assets . . . . . . . . . . . . . . . . . . . . . . . . . . . . . . . . . . . . . . . . . . . . . . $ 35,735 $ 28,137
Noncurrent deferred tax assets:Employee benefits . . . . . . . . . . . . . . . . . . . . . . . . . . . . . . . . . . . . . . . . . . . . . . . . . . . $ 17,599 $ 3,564Restructuring and purchase accounting . . . . . . . . . . . . . . . . . . . . . . . . . . . . . . . . . . . 20,541 26,921Marketing and promotional accruals . . . . . . . . . . . . . . . . . . . . . . . . . . . . . . . . . . . . . 1,311 845Net operating loss and credit carry forwards . . . . . . . . . . . . . . . . . . . . . . . . . . . . . . . 513,779 291,642Prepaid royalty . . . . . . . . . . . . . . . . . . . . . . . . . . . . . . . . . . . . . . . . . . . . . . . . . . . . . . 9,708 14,360Property, plant and equipment . . . . . . . . . . . . . . . . . . . . . . . . . . . . . . . . . . . . . . . . . . 3,207 2,798Unrealized losses . . . . . . . . . . . . . . . . . . . . . . . . . . . . . . . . . . . . . . . . . . . . . . . . . . . . 4,202 —Other . . . . . . . . . . . . . . . . . . . . . . . . . . . . . . . . . . . . . . . . . . . . . . . . . . . . . . . . . . . . . . 14,335 17,585Valuation allowance . . . . . . . . . . . . . . . . . . . . . . . . . . . . . . . . . . . . . . . . . . . . . . . . . . (302,268) (116,275)
Total noncurrent deferred tax assets . . . . . . . . . . . . . . . . . . . . . . . . . . . . . . . . . . . . . . . . . . 282,414 241,440Noncurrent deferred tax liabilities:
Property, plant, and equipment . . . . . . . . . . . . . . . . . . . . . . . . . . . . . . . . . . . . . . . . . . (13,862) (19,552)Unrealized gains . . . . . . . . . . . . . . . . . . . . . . . . . . . . . . . . . . . . . . . . . . . . . . . . . . . . . — (15,275)Intangibles . . . . . . . . . . . . . . . . . . . . . . . . . . . . . . . . . . . . . . . . . . . . . . . . . . . . . . . . . (544,478) (430,815)Other . . . . . . . . . . . . . . . . . . . . . . . . . . . . . . . . . . . . . . . . . . . . . . . . . . . . . . . . . . . . . . (1,917) (3,296)
Total noncurrent deferred tax liabilities . . . . . . . . . . . . . . . . . . . . . . . . . . . . . . . . . . . . . . . (560,257) (468,938)
Net noncurrent deferred tax liabilities . . . . . . . . . . . . . . . . . . . . . . . . . . . . . . . . . . . . . . . . $(277,843) $(227,498)
Net current and noncurrent deferred tax liabilities . . . . . . . . . . . . . . . . . . . . . . . . . . . . . . . $(242,108) $(199,361)
During Fiscal 2010, the Company recorded residual U.S. and foreign taxes on approximately $26,600 ofdistributions of foreign earnings resulting in an increase in tax expense of approximately $9,312. Thedistributions were primarily non-cash deemed distributions under U.S. tax law. During the period fromAugust 31, 2009 through September 30, 2009, the Successor Company recorded residual U.S. and foreign taxes
140

SPECTRUM BRANDS HOLDINGS, INC. AND SUBSIDIARIES
NOTES TO CONSOLIDATED FINANCIAL STATEMENTS—(Continued)(In thousands, except per share amounts)
on approximately $165,937 of actual and deemed distributions of foreign earnings resulting in an increase in taxexpense of approximately $58,295. The Company made these distributions, which were primarily non-cash, toreduce the U.S. tax loss for Fiscal 2009 as a result of Section 382 considerations. Remaining undistributedearnings of the Company’s foreign operations amounting to approximately $302,447 and $156,270 atSeptember 30, 2010 and September 2009, respectively, are intended to remain permanently invested.Accordingly, no residual income taxes have been provided on those earnings at September 30, 2010 andSeptember 30, 2009. If at some future date, these earnings cease to be permanently invested the Company may besubject to U.S. income taxes and foreign withholding and other taxes on such amounts. If such earnings were notconsidered permanently reinvested, a deferred tax liability of approximately $109,189 would be required.
The Company, as of September 30, 2010, has U.S. federal and state net operating loss carryforwards ofapproximately $1,087,489 and $936,208, respectively. These net operating loss carryforwards expire throughyears ending in 2031. The Company has foreign loss carryforwards of approximately $195,456 which will expirebeginning in 2011. Certain of the foreign net operating losses have indefinite carryforward periods. TheCompany is subject to an annual limitation on the use of its net operating losses that arose prior to its emergencefrom bankruptcy. The Company has had multiple changes of ownership, as defined under IRC Section 382, thatsubject the Company’s U.S. federal and state net operating losses and other tax attributes to certain limitations.The annual limitation is based on a number of factors including the value of the Company’s stock (as defined fortax purposes) on the date of the ownership change, its net unrealized built in gain position on that date, theoccurrence of realized built in gains in years subsequent to the ownership change, and the effects of subsequentownership changes (as defined for tax purposes) if any. Based on these factors, the Company projects that$296,160 of the total U.S. federal and $462,837 of the state net operating loss carryforwards will expire unused.In addition, separate return year limitations apply to limit the Company’s utilization of the acquired RussellHobbs U.S. federal and state net operating losses to future income of the Russell Hobbs subgroup. The Companyalso projects that $37,542 of the total foreign loss carryforwards will expire unused. The Company has provideda full valuation allowance against these deferred tax assets.
The Predecessor Company recognized income tax expense of approximately $124,054 related to the gain onthe settlement of liabilities subject to compromise and the modification of the senior secured credit facility in theperiod from October 1, 2008 through August 30, 2009. The Company, has, in accordance with the IRCSection 108 reduced its net operating loss carryforwards for cancellation of debt income that arose from itsemergence from Chapter 11 of the Bankruptcy Code, under IRC Section 382(1)(6).
A valuation allowance is recorded when it is more likely than not that some portion or all of the deferred taxassets will not be realized. The ultimate realization of the deferred tax assets depends on the ability of the Companyto generate sufficient taxable income of the appropriate character in the future and in the appropriate taxingjurisdictions. As of September 30, 2010 and September 30, 2009, the Company’s valuation allowance, establishedfor the tax benefit that may not be realized, totaled approximately $330,936 and $132,688, respectively. As ofSeptember 30, 2010 and September 30, 2009, approximately $299,524 and $108,493, respectively related to U.S.net deferred tax assets, and approximately $31,412 and $24,195, respectively, related to foreign net deferred taxassets. The increase in the allowance during Fiscal 2010 totaled approximately $198,248, of which approximately$191,031 related to an increase in the valuation allowance against U.S. net deferred tax assets, and approximately$7,217 related to a decrease in the valuation allowance against foreign net deferred tax assets. In connection withthe Merger, the Company established additional valuation allowance of approximately $103,790 related to acquirednet deferred tax assets as part of purchase accounting. This amount is included in the $198,248 above.
The total amount of unrecognized tax benefits on the Successor Company’s Consolidated Statements ofFinancial Position at September 30, 2010 and September 30, 2009 are $12,808 and $7,765, respectively, that ifrecognized will affect the effective tax rate. The Company recognizes interest and penalties related to uncertain
141

SPECTRUM BRANDS HOLDINGS, INC. AND SUBSIDIARIES
NOTES TO CONSOLIDATED FINANCIAL STATEMENTS—(Continued)(In thousands, except per share amounts)
tax positions in income tax expense. The Successor Company as of September 30, 2009 and September 30, 2010had approximately $3,021 and $5,860, respectively, of accrued interest and penalties related to uncertain taxpositions. The impact related to interest and penalties on the Consolidated Statements of Operations for theperiod from October 1, 2008 through August 30, 2009 (Predecessor Company) and the period from August 31,2009 through September 30, 2009 (Successor Company) was not material. The impact related to interest andpenalties on the Consolidated Statement of Operations for Fiscal 2010 was a net increase to income tax expenseof $1,527. In connection with the Merger, the Company recorded additional unrecognized tax benefits ofapproximately $3,299 as part of purchase accounting.
As of September 30, 2010, certain of the Company’s Canadian, German, and Hong Kong legal entities areundergoing tax audits. The Company cannot predict the ultimate outcome of the examinations; however, it isreasonably possible that during the next 12 months some portion of previously unrecognized tax benefits couldbe recognized.
The following table summarizes the changes to the amount of unrecognized tax benefits of the PredecessorCompany for the period from October 1, 2008 through August 30, 2009 and the Successor Company for theperiod from August 31, 2009 through September 30, 2009 and Fiscal 2010:
Unrecognized tax benefits at September 30, 2008 (Predecessor Company) . . . . . . $ 6,755Gross increase – tax positions in prior period . . . . . . . . . . . . . . . . . . . . . . . . . 26Gross decrease – tax positions in prior period . . . . . . . . . . . . . . . . . . . . . . . . . (11)Gross increase – tax positions in current period . . . . . . . . . . . . . . . . . . . . . . . 1,673Lapse of statutes of limitations . . . . . . . . . . . . . . . . . . . . . . . . . . . . . . . . . . . . (807)
Unrecognized tax benefits at August 30, 2009 (Predecessor Company) . . . . . . . . . $ 7,636Gross decrease – tax positions in prior period . . . . . . . . . . . . . . . . . . . . . . . . . (15)Gross increase – tax positions in current period . . . . . . . . . . . . . . . . . . . . . . . 174Lapse of statutes of limitations . . . . . . . . . . . . . . . . . . . . . . . . . . . . . . . . . . . . (30)
Unrecognized tax benefits at September 30, 2009 (Successor Company) . . . . . . . . $ 7,765Russell Hobbs acquired unrecognized tax benefits . . . . . . . . . . . . . . . . . . . . . 3,251Gross decrease – tax positions in prior period . . . . . . . . . . . . . . . . . . . . . . . . . (904)Gross increase – tax positions in current period . . . . . . . . . . . . . . . . . . . . . . . 3,390Lapse of statutes of limitations . . . . . . . . . . . . . . . . . . . . . . . . . . . . . . . . . . . . (694)
Unrecognized tax benefits at September 30, 2010 (Successor Company) . . . . . . . . $12,808
The Company files income tax returns in the U.S. federal jurisdiction and various state, local and foreignjurisdictions and is subject to ongoing examination by the various taxing authorities. The Company’s majortaxing jurisdictions are the U.S., United Kingdom, and Germany. In the U.S., federal tax filings for years prior toand including the Company’s fiscal year ended September 30, 2006 are closed. However, the federal netoperating loss carryforwards from the Company’s fiscal years ended September 30, 2006 and prior are subject toInternal Revenue Service (“IRS”) examination until the year that such net operating loss carryforwards areutilized and those years are closed for audit. The Company’s fiscal years ended September 30, 2007, 2008 and2009 remain open to examination by the IRS. Filings in various U.S. state and local jurisdictions are also subjectto audit and to date no significant audit matters have arisen.
In the U.S., federal tax filings for years prior to and including Russell Hobbs year ended June 30, 2008 areclosed. However, the federal net operating loss carryforward for Russell Hobbs fiscal year ended June 30, 2008 issubject to examination by the IRS until the year that such net operating losses are utilized and those years areclosed for audit.
142

SPECTRUM BRANDS HOLDINGS, INC. AND SUBSIDIARIES
NOTES TO CONSOLIDATED FINANCIAL STATEMENTS—(Continued)(In thousands, except per share amounts)
ASC 350 requires companies to test goodwill and indefinite-lived intangible assets for impairment annually,or more often if an event or circumstance indicates that an impairment loss may have been incurred. During theperiod from October 1, 2008 through August 30, 2009 and Fiscal 2008, the Predecessor Company, as a result ofits testing, recorded non-cash pre tax impairment charges of $34,391 and $861,234, respectively. The tax impact,prior to consideration of the current year valuation allowance, of the impairment charges was a deferred taxbenefit of $12,965 and $142,877 during the period from October 1, 2008 through August 30, 2009 and Fiscal2008, respectively, as a result of a significant portion of the impaired assets not being deductible for tax purposesin 2008.
During Fiscal 2010 we recorded the correction of an immaterial prior period error in our consolidatedfinancial statements related to deferred taxes in certain foreign jurisdictions. We believe the correction of thiserror to be both quantitatively and qualitatively immaterial to our annual results for fiscal 2010 or to any of ourpreviously issued financial statements. The impact of the correction was an increase to income tax expense and adecrease to deferred tax assets of approximately $5,900.
(9) Discontinued Operations
On November 1, 2007, the Predecessor Company sold the Canadian division of the Home and Garden Business,which operated under the name Nu-Gro, to a new company formed by RoyCap Merchant Banking Group andClarke Inc. Cash proceeds received at closing, net of selling expenses, totaled $14,931 and were used to reduceoutstanding debt. These proceeds are included in net cash provided by investing activities of discontinuedoperations in the accompanying Consolidated Statements of Cash Flows. On February 5, 2008, the PredecessorCompany finalized the contractual working capital adjustment in connection with this sale which increasedproceeds received by the Predecessor Company by $500. As a result of the finalization of the contractualworking capital adjustments the Predecessor Company recorded a loss on disposal of $1,087, net of tax benefit.
On November 11, 2008, the Predecessor Board approved the shutdown of the growing products portion ofthe Home and Garden Business, which included the manufacturing and marketing of fertilizers, enriched soils,mulch and grass seed. The decision to shutdown the growing products portion of the Home and Garden Businesswas made only after the Predecessor Company was unable to successfully sell this business, in whole or in part.The shutdown of the growing products portion of the Home and Garden Business was completed during thesecond quarter of Fiscal 2009.
The presentation herein of the results of continuing operations has been changed to exclude the growingproducts portion of the Home and Garden Business for all periods presented. The following amounts have beensegregated from continuing operations and are reflected as discontinued operations for Fiscal 2010, the periodfrom August 31, 2009 through September 30, 2009, the period from October 1, 2008 through August 30, 2009and Fiscal 2008, respectively:
SuccessorCompany
PredecessorCompany
2010
Period FromAugust 31, 2009
throughSeptember 30,
2009
Period fromOctober 1, 2008
throughAugust 30,
2009 2008
Net sales . . . . . . . . . . . . . . . . . . . . . . . . . . . . . . . . . . . . . . . . $ — $— $ 31,306 $261,439
Income (loss) from discontinued operations before incometaxes . . . . . . . . . . . . . . . . . . . . . . . . . . . . . . . . . . . . . . . . . $(2,512) $408 $(91,293) $ (27,124)
Provision for income tax expense (benefit) . . . . . . . . . . . . . 223 — (4,491) (2,182)
Income (loss) from discontinued operations, net of tax . . . . $(2,735) $408 $(86,802) $ (24,942)
143

SPECTRUM BRANDS HOLDINGS, INC. AND SUBSIDIARIES
NOTES TO CONSOLIDATED FINANCIAL STATEMENTS—(Continued)(In thousands, except per share amounts)
The presentation herein of the results of continuing operations has been changed to exclude the Canadiandivision of the Home and Garden Business for all periods presented. The following amounts have beensegregated from continuing operations and are reflected as discontinued operations for Fiscal 2008:
PredecessorCompany
2008
Net sales . . . . . . . . . . . . . . . . . . . . . . . . . . . . . . . . . . . . . . . . . . . . . . . . . . . . . . . . $ 4,732
Loss from discontinued operations before income taxes . . . . . . . . . . . . . . . . . . . $(1,896)Provision for income tax benefit . . . . . . . . . . . . . . . . . . . . . . . . . . . . . . . . . . . . . . (651)
Loss from discontinued operations (including loss on disposal of $1,087 in2008), net of tax . . . . . . . . . . . . . . . . . . . . . . . . . . . . . . . . . . . . . . . . . . . . . . . . $(1,245)
In accordance with ASC 360, long-lived assets to be disposed of by sale are recorded at the lower of theircarrying value or fair value less costs to sell. During Fiscal 2008 the Predecessor Company recorded a non-cashpretax charge of $5,700 in discontinued operations to reduce the carrying value of intangible assets related to thegrowing products portion of the Home and Garden Business in order to reflect such intangible assets at theirestimated fair value.
(10) Employee Benefit Plans
Pension Benefits
The Company has various defined benefit pension plans covering some of its employees in the United States andcertain employees in other countries, primarily the United Kingdom and Germany. Plans generally providebenefits of stated amounts for each year of service. The Company funds its U.S. pension plans in accordance withthe requirements of the defined benefit pension plans and, where applicable, in amounts sufficient to satisfy theminimum funding requirements of applicable laws. Additionally, in compliance with the Company’s fundingpolicy, annual contributions to non-U.S. defined benefit plans are equal to the actuarial recommendations orstatutory requirements in the respective countries.
The Company also sponsors or participates in a number of other non-U.S. pension arrangements, includingvarious retirement and termination benefit plans, some of which are covered by local law or coordinated withgovernment-sponsored plans, which are not significant in the aggregate and therefore are not included in theinformation presented below. The Company also has various nonqualified deferred compensation agreementswith certain of its employees. Under certain of these agreements, the Company has agreed to pay certain amountsannually for the first 15 years subsequent to retirement or to a designated beneficiary upon death. It ismanagement’s intent that life insurance contracts owned by the Company will fund these agreements. Under theremaining agreements, the Company has agreed to pay such deferred amounts in up to 15 annual installmentsbeginning on a date specified by the employee, subsequent to retirement or disability, or to a designatedbeneficiary upon death.
Other Benefits
Under the Rayovac postretirement plan the Company provides certain health care and life insurance benefits toeligible retired employees. Participants earn retiree health care benefits after reaching age 45 over the next 10succeeding years of service and remain eligible until reaching age 65. The plan is contributory; retiree
144

SPECTRUM BRANDS HOLDINGS, INC. AND SUBSIDIARIES
NOTES TO CONSOLIDATED FINANCIAL STATEMENTS—(Continued)(In thousands, except per share amounts)
contributions have been established as a flat dollar amount with contribution rates expected to increase at theactive medical trend rate. The plan is unfunded. The Company is amortizing the transition obligation over a20-year period.
Under the Tetra U.S. postretirement plan the Company provides postretirement medical benefits to full-timeemployees who meet minimum age and service requirements. The plan is contributory with retiree contributionsadjusted annually and contains other cost-sharing features such as deductibles, coinsurance and copayments.
The recognition and disclosure provisions of ASC Topic 715: “Compensation-Retirement Benefits,” (“ASC715”) requires recognition of the overfunded or underfunded status of defined benefit pension and postretirementplans as an asset or liability in the statement of financial position, and to recognize changes in that funded statusin AOCI in the year in which the adoption occurs. The measurement date provisions of ASC 715, becameeffective during Fiscal 2009 and the Company now measures all of its defined benefit pension and postretirementplan assets and obligations as of September 30, which is the Company’s fiscal year end.
The following tables provide additional information on the Company’s pension and other postretirementbenefit plans:
Pension and DeferredCompensation Benefits Other Benefits
2010 2009 2010 2009
Change in benefit obligationBenefit obligation, beginning of year . . . . . . . . . . . . . . . . . $ 132,752 $ 112,444 $ 476 $ 402Obligations assumed from Merger with Russell Hobbs . . . 54,468 — — —Service cost . . . . . . . . . . . . . . . . . . . . . . . . . . . . . . . . . . . . . 2,479 2,279 9 6Interest cost . . . . . . . . . . . . . . . . . . . . . . . . . . . . . . . . . . . . . 8,239 7,130 26 26Actuarial (gain) loss . . . . . . . . . . . . . . . . . . . . . . . . . . . . . . 25,140 17,457 25 51Participant contributions . . . . . . . . . . . . . . . . . . . . . . . . . . . 495 334 — —Benefits paid . . . . . . . . . . . . . . . . . . . . . . . . . . . . . . . . . . . . (6,526) (6,353) (9) (9)Foreign currency exchange rate changes . . . . . . . . . . . . . . (2,070) (539) — —
Benefit obligation, end of year . . . . . . . . . . . . . . . . . . . . . . $ 214,977 $ 132,752 $ 527 $ 476
Change in plan assetsFair value of plan assets, beginning of year . . . . . . . . . . . . $ 78,345 $ 70,412 $ — $ —Assets acquired from Merger with Russell Hobbs . . . . . . . 38,458 — — —Actual return on plan assets . . . . . . . . . . . . . . . . . . . . . . . . 7,613 1,564 — —Employer contributions . . . . . . . . . . . . . . . . . . . . . . . . . . . 6,234 9,749 9 9Employee contributions . . . . . . . . . . . . . . . . . . . . . . . . . . . 2,127 3,626 — —Benefits paid . . . . . . . . . . . . . . . . . . . . . . . . . . . . . . . . . . . . (6,526) (6,353) (9) (9)Plan expenses paid . . . . . . . . . . . . . . . . . . . . . . . . . . . . . . . (237) (222) — —Foreign currency exchange rate changes . . . . . . . . . . . . . . (448) (431) — —
Fair value of plan assets, end of year . . . . . . . . . . . . . . . . . $ 125,566 $ 78,345 $ — $ —
Accrued Benefit Cost . . . . . . . . . . . . . . . . . . . . . . . . . . . . . . . . $ (89,411) $ (54,407) $ (527) $ (476)
Weighted-average assumptions:Discount rate . . . . . . . . . . . . . . . . . . . . . . . . . . . . . . . . . . . . 4.2%-13.6% 5.0%-11.8% 5.0% 5.5%Expected return on plan assets . . . . . . . . . . . . . . . . . . . . . . 4.5%-8.8% 4.5%-8.0% N/A N/ARate of compensation increase . . . . . . . . . . . . . . . . . . . . . . 0%-5.5% 0%-4.6% N/A N/A
145

SPECTRUM BRANDS HOLDINGS, INC. AND SUBSIDIARIES
NOTES TO CONSOLIDATED FINANCIAL STATEMENTS—(Continued)(In thousands, except per share amounts)
The net underfunded status as of September 30, 2010 and September 30, 2009 of $89,411 and $54,407,respectively, is recognized in the accompanying Consolidated Statements of Financial Position within Employeebenefit obligations, net of current portion. Included in the Successor Company’s AOCI as of September 30, 2010and September 30, 2009 are unrecognized net (losses) gains of $(17,197), net of tax benefit (expense) of $5,894and $576 net of tax benefit (expense) of $(247), respectively, which have not yet been recognized as componentsof net periodic pension cost. The net loss in AOCI expected to be recognized during Fiscal 2011 is $(388).
At September 30, 2010, the Company’s total pension and deferred compensation benefit obligation of$214,977 consisted of $62,126 associated with U.S. plans and $152,851 associated with international plans. Thefair value of the Company’s assets of $125,566 consisted of $44,284 associated with U.S. plans and $81,282associated with international plans. The weighted average discount rate used for the Company’s domestic planswas approximately 5% and approximately 4.8% for its international plans. The weighted average expected returnon plan assets used for the Company’s domestic plans was approximately 7.5% and approximately 3.3% for itsinternational plans.
At September 30, 2009, the Company’s total pension and deferred compensation benefit obligation of$132,752 consisted of $44,842 associated with U.S. plans and $87,910 associated with international plans. Thefair value of the Company’s assets of $78,345 consisted of $33,191 associated with U.S. plans and $45,154associated with international plans. The weighted average discount rate used for the Company’s domestic andinternational plans was approximately 5.5%. The weighted average expected return on plan assets used for theCompany’s domestic plans was approximately 8.0% and approximately 5.4% for its international plans.
Pension and Deferred Compensation Benefits Other Benefits
SuccessorCompany Predecessor Company
SuccessorCompany Predecessor Company
2010
Period fromAugust 31, 2009
throughSeptember 30,
2009
Period fromOctober 1, 2008
throughAugust 30,
2009 2008 2010
Period fromAugust 31, 2009
throughSeptember 30,
2009
Period fromOctober 1, 2008
throughAugust 30,
2009 2008
Components of net periodicbenefit costService cost . . . . . . . . . . . . . . $ 2,479 $ 211 $ 2,068 $ 2,616 $ 9 $ 1 $ 8 $ 13Interest cost . . . . . . . . . . . . . . 8,239 612 6,517 6,475 26 2 24 27Expected return on assets . . . (5,774) (417) (4,253) (4,589) — — — —Amortization of prior servicecost . . . . . . . . . . . . . . . . . . 535 — 202 371 — — — —
Amortization of transitionobligation . . . . . . . . . . . . . 207 — — — — — — —
Curtailment loss . . . . . . . . . . — — 300 11 — — — —Recognized net actuarial loss(gain) . . . . . . . . . . . . . . . . . 613 — 37 136 (58) (5) (53) (61)
Net periodic cost (benefit) . . $ 6,299 $ 406 $ 4,871 $ 5,020 $ (23) $ (2) $ (21) $ (21)
The discount rate is used to calculate the projected benefit obligation. The discount rate used is based on therate of return on government bonds as well as current market conditions of the respective countries where suchplans are established.
146

SPECTRUM BRANDS HOLDINGS, INC. AND SUBSIDIARIES
NOTES TO CONSOLIDATED FINANCIAL STATEMENTS—(Continued)(In thousands, except per share amounts)
Below is a summary allocation of all pension plan assets along with expected long-term rates of return byasset category as of the measurement date.
Weighted AverageAllocation
Target Actual
Asset Category 2010 2010 2009
Equity Securities . . . . . . . . . . . . . . . . . . . . . . . . . . . . . . . . . . . . . . . . . . . . . . . . . . . . . . . . . . 0-60% 43% 46%Fixed Income Securities . . . . . . . . . . . . . . . . . . . . . . . . . . . . . . . . . . . . . . . . . . . . . . . . . . . . 0-40% 22% 16%Other . . . . . . . . . . . . . . . . . . . . . . . . . . . . . . . . . . . . . . . . . . . . . . . . . . . . . . . . . . . . . . . . . . . 0-100% 35% 38%
Total . . . . . . . . . . . . . . . . . . . . . . . . . . . . . . . . . . . . . . . . . . . . . . . . . . . . . . . . . . . . . . . . . . . 100% 100% 100%
The weighted average expected long-term rate of return on total assets is 6.5%.
The Company has established formal investment policies for the assets associated with these plans. Policyobjectives include maximizing long-term return at acceptable risk levels, diversifying among asset classes, ifappropriate, and among investment managers, as well as establishing relevant risk parameters within each assetclass. Specific asset class targets are based on the results of periodic asset liability studies. The investmentpolicies permit variances from the targets within certain parameters. The weighted average expected long-termrate of return is based on a Fiscal 2010 review of such rates. The plan assets currently do not include holdings ofSB Holdings common stock.
The Company’s Fixed Income Securities portfolio is invested primarily in commingled funds and managedfor overall return expectations rather than matching duration against plan liabilities; therefore, debt maturities arenot significant to the plan performance.
The Company’s Other portfolio consists of all pension assets, primarily insurance contracts, in the UnitedKingdom, Germany and the Netherlands.
The Company’s expected future pension benefit payments for Fiscal 2011 through its fiscal year 2020 are asfollows:
2011 . . . . . . . . . . . . . . . . . . . . . . . . . . . . . . . . . . . . . . . . . . . . . . . . . . . . . . . . . . . . . $ 6,9792012 . . . . . . . . . . . . . . . . . . . . . . . . . . . . . . . . . . . . . . . . . . . . . . . . . . . . . . . . . . . . . 7,3842013 . . . . . . . . . . . . . . . . . . . . . . . . . . . . . . . . . . . . . . . . . . . . . . . . . . . . . . . . . . . . . 7,7162014 . . . . . . . . . . . . . . . . . . . . . . . . . . . . . . . . . . . . . . . . . . . . . . . . . . . . . . . . . . . . . 8,0092015 . . . . . . . . . . . . . . . . . . . . . . . . . . . . . . . . . . . . . . . . . . . . . . . . . . . . . . . . . . . . . 8,3662016 to 2020 . . . . . . . . . . . . . . . . . . . . . . . . . . . . . . . . . . . . . . . . . . . . . . . . . . . . . . . 50,826
147
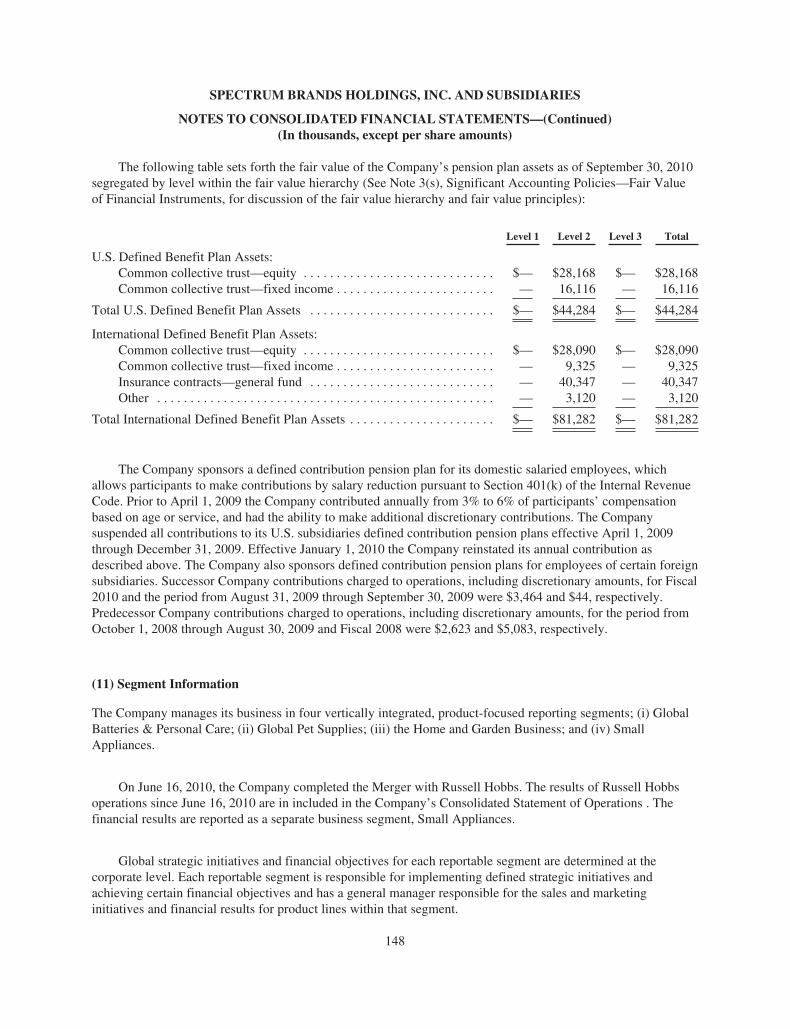
SPECTRUM BRANDS HOLDINGS, INC. AND SUBSIDIARIES
NOTES TO CONSOLIDATED FINANCIAL STATEMENTS—(Continued)(In thousands, except per share amounts)
The following table sets forth the fair value of the Company’s pension plan assets as of September 30, 2010segregated by level within the fair value hierarchy (See Note 3(s), Significant Accounting Policies—Fair Valueof Financial Instruments, for discussion of the fair value hierarchy and fair value principles):
Level 1 Level 2 Level 3 Total
U.S. Defined Benefit Plan Assets:Common collective trust—equity . . . . . . . . . . . . . . . . . . . . . . . . . . . . . $— $28,168 $— $28,168Common collective trust—fixed income . . . . . . . . . . . . . . . . . . . . . . . . — 16,116 — 16,116
Total U.S. Defined Benefit Plan Assets . . . . . . . . . . . . . . . . . . . . . . . . . . . . $— $44,284 $— $44,284
International Defined Benefit Plan Assets:Common collective trust—equity . . . . . . . . . . . . . . . . . . . . . . . . . . . . . $— $28,090 $— $28,090Common collective trust—fixed income . . . . . . . . . . . . . . . . . . . . . . . . — 9,325 — 9,325Insurance contracts—general fund . . . . . . . . . . . . . . . . . . . . . . . . . . . . — 40,347 — 40,347Other . . . . . . . . . . . . . . . . . . . . . . . . . . . . . . . . . . . . . . . . . . . . . . . . . . . — 3,120 — 3,120
Total International Defined Benefit Plan Assets . . . . . . . . . . . . . . . . . . . . . . $— $81,282 $— $81,282
The Company sponsors a defined contribution pension plan for its domestic salaried employees, whichallows participants to make contributions by salary reduction pursuant to Section 401(k) of the Internal RevenueCode. Prior to April 1, 2009 the Company contributed annually from 3% to 6% of participants’ compensationbased on age or service, and had the ability to make additional discretionary contributions. The Companysuspended all contributions to its U.S. subsidiaries defined contribution pension plans effective April 1, 2009through December 31, 2009. Effective January 1, 2010 the Company reinstated its annual contribution asdescribed above. The Company also sponsors defined contribution pension plans for employees of certain foreignsubsidiaries. Successor Company contributions charged to operations, including discretionary amounts, for Fiscal2010 and the period from August 31, 2009 through September 30, 2009 were $3,464 and $44, respectively.Predecessor Company contributions charged to operations, including discretionary amounts, for the period fromOctober 1, 2008 through August 30, 2009 and Fiscal 2008 were $2,623 and $5,083, respectively.
(11) Segment Information
The Company manages its business in four vertically integrated, product-focused reporting segments; (i) GlobalBatteries & Personal Care; (ii) Global Pet Supplies; (iii) the Home and Garden Business; and (iv) SmallAppliances.
On June 16, 2010, the Company completed the Merger with Russell Hobbs. The results of Russell Hobbsoperations since June 16, 2010 are in included in the Company’s Consolidated Statement of Operations . Thefinancial results are reported as a separate business segment, Small Appliances.
Global strategic initiatives and financial objectives for each reportable segment are determined at thecorporate level. Each reportable segment is responsible for implementing defined strategic initiatives andachieving certain financial objectives and has a general manager responsible for the sales and marketinginitiatives and financial results for product lines within that segment.
148

SPECTRUM BRANDS HOLDINGS, INC. AND SUBSIDIARIES
NOTES TO CONSOLIDATED FINANCIAL STATEMENTS—(Continued)(In thousands, except per share amounts)
Net sales and Cost of goods sold to other business segments have been eliminated. The gross contribution ofintersegment sales is included in the segment selling the product to the external customer. Segment net sales arebased upon the segment from which the product is shipped.
The operating segment profits do not include restructuring and related charges, acquisition and integrationrelated charges, interest expense, interest income, impairment charges and income tax expense. Corporateexpenses include primarily general and administrative expenses associated with corporate overhead and globallong-term incentive compensation plans. All depreciation and amortization included in income from operations isrelated to operating segments or corporate expense. Costs are identified to operating segments or corporateexpense according to the function of each cost center.
All capital expenditures are related to operating segments. Variable allocations of assets are not made forsegment reporting.
Segment information for the Successor Company for Fiscal 2010 and the period from August 31, 2009through September 30, 2009 and the Predecessor Company for the period from October 1, 2008 throughAugust 30, 2009 and Fiscal 2008 is as follows:
Net sales to external customers
SuccessorCompany Predecessor Company
2010
Period fromAugust 31, 2009
throughSeptember 30,
2009
Period fromOctober 1, 2008
throughAugust 30,
2009 2008
Global Batteries & Personal Care . . . . . . . . . . . . . . . . $1,427,870 $146,139 $1,188,902 $1,493,736Global Pet Supplies . . . . . . . . . . . . . . . . . . . . . . . . . . . 560,501 56,270 517,601 598,618Home and Garden Business . . . . . . . . . . . . . . . . . . . . . 341,064 17,479 304,145 334,217Small Appliances . . . . . . . . . . . . . . . . . . . . . . . . . . . . . 237,576 — — —
Total segments . . . . . . . . . . . . . . . . . . . . . . . . . . . . . . . $2,567,011 $219,888 $2,010,648 $2,426,571
Depreciation and amortization
SuccessorCompany Predecessor Company
2010
Period fromAugust 31, 2009
throughSeptember 30,
2009
Period fromOctober 1, 2008
throughAugust 30,
2009 2008
Global Batteries & Personal Care . . . . . . . . . . . . . . . . . . . . $ 51,374 $4,728 $21,933 $32,535Global Pet Supplies . . . . . . . . . . . . . . . . . . . . . . . . . . . . . . . 28,303 2,580 19,832 22,891Home and Garden Business(A) . . . . . . . . . . . . . . . . . . . . . . 14,418 1,320 11,073 21,636Small Appliances . . . . . . . . . . . . . . . . . . . . . . . . . . . . . . . . . 6,418 — — —
Total segments . . . . . . . . . . . . . . . . . . . . . . . . . . . . . . . . . . . 100,513 8,628 52,838 77,062Corporate . . . . . . . . . . . . . . . . . . . . . . . . . . . . . . . . . . . . . . . 16,905 43 5,642 7,959
Total Depreciation and amortization . . . . . . . . . . . . . . . . . . $117,418 $8,671 $58,480 $85,021
149

SPECTRUM BRANDS HOLDINGS, INC. AND SUBSIDIARIES
NOTES TO CONSOLIDATED FINANCIAL STATEMENTS—(Continued)(In thousands, except per share amounts)
(A) Fiscal 2008 includes depreciation and amortization expense of $10,821 related to Fiscal 2007 as a result ofthe reclassification of the Home and Garden Business as a continuing operation during Fiscal 2008.
Segment profit
SuccessorCompany Predecessor Company
2010
Period fromAugust 31, 2009
throughSeptember 30,
2009
Period fromOctober 1, 2008
throughAugust 30,
2009 2008
Global Batteries & Personal Care . . . . . . . . . . . . . . . . . . $ 152,757 $ 5,675 $159,400 $ 162,889Global Pet Supplies . . . . . . . . . . . . . . . . . . . . . . . . . . . . . 55,646 3,178 61,455 68,885Home and Garden Business(A) . . . . . . . . . . . . . . . . . . . . 50,881 (4,573) 46,458 29,458Small Appliances . . . . . . . . . . . . . . . . . . . . . . . . . . . . . . 13,081 — — —
Total segments . . . . . . . . . . . . . . . . . . . . . . . . . . . . . . . . 272,365 4,280 267,313 261,232Corporate expenses . . . . . . . . . . . . . . . . . . . . . . . . . . . . . 41,017 2,442 32,037 45,246Acquisition and integration related charges . . . . . . . . . . 38,452 — — —Restructuring and related charges . . . . . . . . . . . . . . . . . . 24,118 1,729 44,080 39,337Goodwill and intangibles impairment . . . . . . . . . . . . . . . — — 34,391 861,234Interest expense . . . . . . . . . . . . . . . . . . . . . . . . . . . . . . . . 277,015 16,962 172,940 229,013Other (income) expense, net . . . . . . . . . . . . . . . . . . . . . . 12,300 (815) 3,320 1,220
Loss from continuing operations before reorganizationitems income taxes . . . . . . . . . . . . . . . . . . . . . . . . . . . $(120,537) $(16,038) $ (19,455) $(914,818)
(A) Fiscal 2008 includes depreciation and amortization expense of $10,821 related to Fiscal 2007 as a result ofthe reclassification of the Home and Garden Business from a discontinued operation to a continuingoperation during Fiscal 2008.
The Global Batteries & Personal Care segment does business in Venezuela through a Venezuelansubsidiary. At January 4, 2010, the beginning of the Company’s second quarter of Fiscal 2010, the Companydetermined that Venezuela meets the definition of a highly inflationary economy under GAAP. As a result,beginning January 4, 2010, the U.S. dollar is the functional currency for the Company’s Venezuelan subsidiary.Accordingly, going forward, currency remeasurement adjustments for this subsidiary’s financial statements andother transactional foreign exchange gains and losses are reflected in earnings. Through January 3, 2010, prior tobeing designated as highly inflationary, translation adjustments related to the Venezuelan subsidiary werereflected in Shareholders’ equity as a component of AOCI.
In addition, on January 8, 2010, the Venezuelan government announced its intention to devalue its currency,the Bolivar fuerte, relative to the U.S. dollar. The official exchange rate for imported goods classified asessential, such as food and medicine, changed from 2.15 to 2.6 to the U.S. dollar, while payments for othernon-essential goods moved to an exchange rate of 4.3 to the U.S. dollar. Some of the Company’s importedproducts fall into the essential classification and qualify for the 2.6 rate; however, the Company’s overall resultsin Venezuela were reflected at the 4.3 rate expected to be applicable to dividend repatriations beginning in thesecond quarter of Fiscal 2010. As a result, the Company remeasured the local statement of financial position ofits Venezuela entity during the second quarter of Fiscal 2010 to reflect the impact of the devaluation. Based on
150

SPECTRUM BRANDS HOLDINGS, INC. AND SUBSIDIARIES
NOTES TO CONSOLIDATED FINANCIAL STATEMENTS—(Continued)(In thousands, except per share amounts)
actual exchange activity, the Company determined on September 30, 2010 that the most likely method ofexchanging its Bolivar fuertes for U.S. dollars will be to formally apply with the Venezuelan government toexchange through commercial banks at the SITME rate specified by the Central Bank of Venezuela. The SITMErate as of September 30, 2010 was quoted at 5.3 Bolivar fuerte per U.S. dollar. Therefore, the Company changedthe rate used to remeasure Bolivar fuerte denominated transactions as of September 30, 2010 from the officialnon-essentials exchange rate to the 5.3 SITME rate in accordance with ASC 830, “Foreign Currency Matters” asit is the expected rate that exchanges of Bolivar fuerte to U.S. dollars will be settled. There is also an ongoingimmaterial impact related to measuring the Company’s Venezuelan statement of operations at the new exchangerate of 5.3 to the U.S. dollar.
The designation of the Company’s Venezuela entity as a highly inflationary economy and the devaluation ofthe Bolivar fuerte resulted in a $1,486 reduction to the Company’s operating income during Fiscal 2010. TheCompany also reported a foreign exchange loss in Other expense (income), net, of $10,102 during Fiscal 2010.
Segment total assets
September 30,
2010 2009
Global Batteries & Personal Care . . . . . . . . . . . . . . . . . . . . . . . . . . . . . . . . $1,629,250 $1,608,269Global Pet Supplies . . . . . . . . . . . . . . . . . . . . . . . . . . . . . . . . . . . . . . . . . . . 826,382 866,901Home and Garden Business . . . . . . . . . . . . . . . . . . . . . . . . . . . . . . . . . . . . 493,511 504,448Small Appliances . . . . . . . . . . . . . . . . . . . . . . . . . . . . . . . . . . . . . . . . . . . . . 863,282 —
Total segments . . . . . . . . . . . . . . . . . . . . . . . . . . . . . . . . . . . . . . . . . . . . . . . 3,812,425 2,979,618Corporate . . . . . . . . . . . . . . . . . . . . . . . . . . . . . . . . . . . . . . . . . . . . . . . . . . . 61,179 41,128
Total assets at year end . . . . . . . . . . . . . . . . . . . . . . . . . . . . . . . . . . . . . . . . $3,873,604 $3,020,746
Segment long-lived assets
September 30,
2010 2009
Global Batteries & Personal Care . . . . . . . . . . . . . . . . . . . . . . . . . . . . . . . . . . . . . . . . . . $1,042,670 $1,052,907Global Pet Supplies . . . . . . . . . . . . . . . . . . . . . . . . . . . . . . . . . . . . . . . . . . . . . . . . . . . . . 641,934 679,009Home and Garden Business . . . . . . . . . . . . . . . . . . . . . . . . . . . . . . . . . . . . . . . . . . . . . . 421,891 432,200Small Appliances . . . . . . . . . . . . . . . . . . . . . . . . . . . . . . . . . . . . . . . . . . . . . . . . . . . . . . . 511,282 —
Total segments . . . . . . . . . . . . . . . . . . . . . . . . . . . . . . . . . . . . . . . . . . . . . . . . . . . . . . . . . 2,617,777 2,164,116Corporate . . . . . . . . . . . . . . . . . . . . . . . . . . . . . . . . . . . . . . . . . . . . . . . . . . . . . . . . . . . . . 56,115 37,894
Long-lived assets at year end . . . . . . . . . . . . . . . . . . . . . . . . . . . . . . . . . . . . . . . . . . . . . $2,673,892 $2,202,010
151

SPECTRUM BRANDS HOLDINGS, INC. AND SUBSIDIARIES
NOTES TO CONSOLIDATED FINANCIAL STATEMENTS—(Continued)(In thousands, except per share amounts)
Capital expenditures
SuccessorCompany Predecessor Company
2010
Period fromAugust 31, 2009
throughSeptember 30,
2009
Period fromOctober 1, 2008
throughAugust 30,
2009 2008
Global Batteries & Personal Care . . . . . . . . . . . . . . . . . . . . . $25,015 $2,311 $6,642 $ 8,198Global Pet Supplies . . . . . . . . . . . . . . . . . . . . . . . . . . . . . . . . 7,920 288 1,260 8,231Home and Garden Business . . . . . . . . . . . . . . . . . . . . . . . . . . 3,890 119 164 2,102Russell Hobbs . . . . . . . . . . . . . . . . . . . . . . . . . . . . . . . . . . . . 3,481 — — —
Total segments . . . . . . . . . . . . . . . . . . . . . . . . . . . . . . . . . . . . 40,306 2,718 8,066 $18,531Corporate . . . . . . . . . . . . . . . . . . . . . . . . . . . . . . . . . . . . . . . . 10 — — 397
Total Capital expenditures . . . . . . . . . . . . . . . . . . . . . . . . . . . $40,316 $2,718 $8,066 $18,928
Geographic Disclosures—Net sales to external customers
SuccessorCompany Predecessor Company
2010
Period fromAugust 31, 2009
throughSeptember 30,
2009
Period fromOctober 1, 2008
throughAugust 30,
2009 2008
United States . . . . . . . . . . . . . . . . . . . . . . . . . . . . . . . . $1,444,779 $113,407 $1,166,920 $1,272,100Outside the United States . . . . . . . . . . . . . . . . . . . . . . . 1,122,232 106,481 843,728 1,154,471
Total net sales to external customers . . . . . . . . . . . . . . $2,567,011 $219,888 $2,010,648 $2,426,571
Geographic Disclosures—Long-lived assets
SuccessorCompany
PredecessorCompany
September 30,
2010 2009
United States . . . . . . . . . . . . . . . . . . . . . . . . . . . . . . . . . . . . . . . . . . . . . . . . $1,884,995 $1,410,459Outside the United States . . . . . . . . . . . . . . . . . . . . . . . . . . . . . . . . . . . . . . 788,897 791,551
Long-lived assets at year end . . . . . . . . . . . . . . . . . . . . . . . . . . . . . . . . . . . $2,673,892 $2,202,010
(12) Commitments and Contingencies
The Company has provided for the estimated costs associated with environmental remediation activities at someof its current and former manufacturing sites. The Company believes that any additional liability in excess of theamounts provided of approximately $9,648, which may result from resolution of these matters, will not have amaterial adverse effect on the financial condition, results of operations or cash flows of the Company.
152
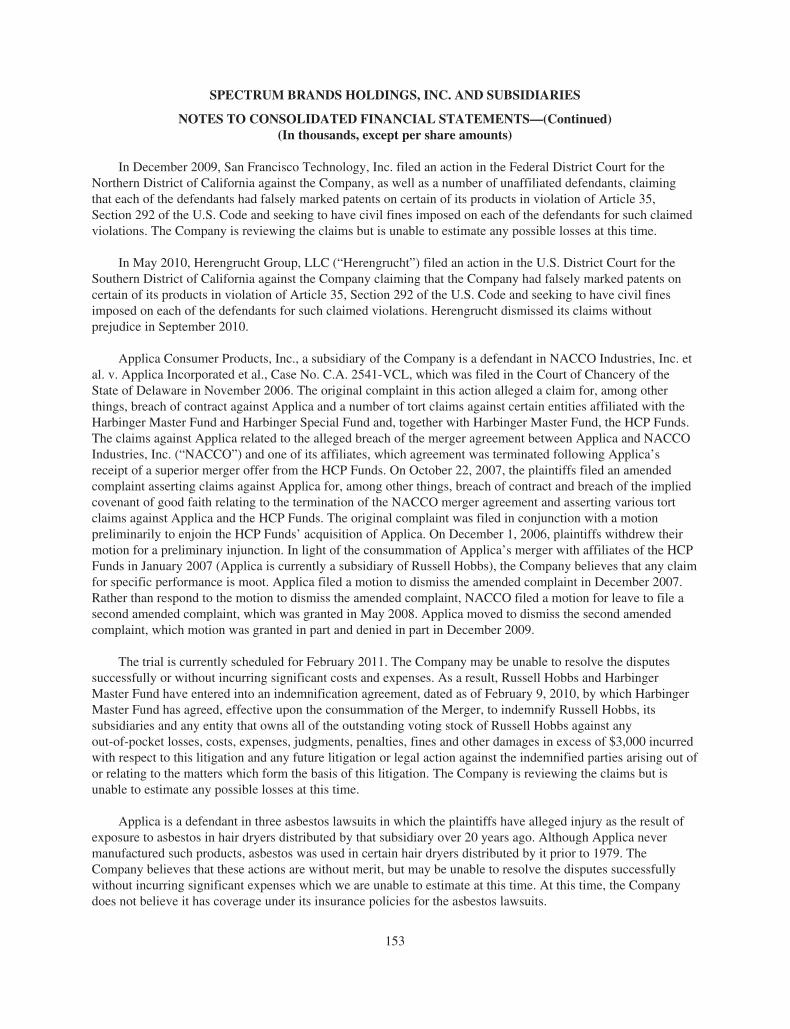
SPECTRUM BRANDS HOLDINGS, INC. AND SUBSIDIARIES
NOTES TO CONSOLIDATED FINANCIAL STATEMENTS—(Continued)(In thousands, except per share amounts)
In December 2009, San Francisco Technology, Inc. filed an action in the Federal District Court for theNorthern District of California against the Company, as well as a number of unaffiliated defendants, claimingthat each of the defendants had falsely marked patents on certain of its products in violation of Article 35,Section 292 of the U.S. Code and seeking to have civil fines imposed on each of the defendants for such claimedviolations. The Company is reviewing the claims but is unable to estimate any possible losses at this time.
In May 2010, Herengrucht Group, LLC (“Herengrucht”) filed an action in the U.S. District Court for theSouthern District of California against the Company claiming that the Company had falsely marked patents oncertain of its products in violation of Article 35, Section 292 of the U.S. Code and seeking to have civil finesimposed on each of the defendants for such claimed violations. Herengrucht dismissed its claims withoutprejudice in September 2010.
Applica Consumer Products, Inc., a subsidiary of the Company is a defendant in NACCO Industries, Inc. etal. v. Applica Incorporated et al., Case No. C.A. 2541-VCL, which was filed in the Court of Chancery of theState of Delaware in November 2006. The original complaint in this action alleged a claim for, among otherthings, breach of contract against Applica and a number of tort claims against certain entities affiliated with theHarbinger Master Fund and Harbinger Special Fund and, together with Harbinger Master Fund, the HCP Funds.The claims against Applica related to the alleged breach of the merger agreement between Applica and NACCOIndustries, Inc. (“NACCO”) and one of its affiliates, which agreement was terminated following Applica’sreceipt of a superior merger offer from the HCP Funds. On October 22, 2007, the plaintiffs filed an amendedcomplaint asserting claims against Applica for, among other things, breach of contract and breach of the impliedcovenant of good faith relating to the termination of the NACCO merger agreement and asserting various tortclaims against Applica and the HCP Funds. The original complaint was filed in conjunction with a motionpreliminarily to enjoin the HCP Funds’ acquisition of Applica. On December 1, 2006, plaintiffs withdrew theirmotion for a preliminary injunction. In light of the consummation of Applica’s merger with affiliates of the HCPFunds in January 2007 (Applica is currently a subsidiary of Russell Hobbs), the Company believes that any claimfor specific performance is moot. Applica filed a motion to dismiss the amended complaint in December 2007.Rather than respond to the motion to dismiss the amended complaint, NACCO filed a motion for leave to file asecond amended complaint, which was granted in May 2008. Applica moved to dismiss the second amendedcomplaint, which motion was granted in part and denied in part in December 2009.
The trial is currently scheduled for February 2011. The Company may be unable to resolve the disputessuccessfully or without incurring significant costs and expenses. As a result, Russell Hobbs and HarbingerMaster Fund have entered into an indemnification agreement, dated as of February 9, 2010, by which HarbingerMaster Fund has agreed, effective upon the consummation of the Merger, to indemnify Russell Hobbs, itssubsidiaries and any entity that owns all of the outstanding voting stock of Russell Hobbs against anyout-of-pocket losses, costs, expenses, judgments, penalties, fines and other damages in excess of $3,000 incurredwith respect to this litigation and any future litigation or legal action against the indemnified parties arising out ofor relating to the matters which form the basis of this litigation. The Company is reviewing the claims but isunable to estimate any possible losses at this time.
Applica is a defendant in three asbestos lawsuits in which the plaintiffs have alleged injury as the result ofexposure to asbestos in hair dryers distributed by that subsidiary over 20 years ago. Although Applica nevermanufactured such products, asbestos was used in certain hair dryers distributed by it prior to 1979. TheCompany believes that these actions are without merit, but may be unable to resolve the disputes successfullywithout incurring significant expenses which we are unable to estimate at this time. At this time, the Companydoes not believe it has coverage under its insurance policies for the asbestos lawsuits.
153

SPECTRUM BRANDS HOLDINGS, INC. AND SUBSIDIARIES
NOTES TO CONSOLIDATED FINANCIAL STATEMENTS—(Continued)(In thousands, except per share amounts)
The Company is a defendant in various other matters of litigation generally arising out of the ordinarycourse of business.
The Company does not believe that any other matters or proceedings presently pending will have a materialadverse effect on its results of operations, financial condition, liquidity or cash flows.
The Company’s minimum rent payments under operating leases are recognized on a straight-line basis overthe term of the lease. Future minimum rental commitments under non-cancelable operating leases, principallypertaining to land, buildings and equipment, are as follows:
2011 . . . . . . . . . . . . . . . . . . . . . . . . . . . . . . . . . . . . . . . . . . . . . . . . . . . . . . . . . . . . $ 34,6652012 . . . . . . . . . . . . . . . . . . . . . . . . . . . . . . . . . . . . . . . . . . . . . . . . . . . . . . . . . . . . 32,8242013 . . . . . . . . . . . . . . . . . . . . . . . . . . . . . . . . . . . . . . . . . . . . . . . . . . . . . . . . . . . . 27,0422014 . . . . . . . . . . . . . . . . . . . . . . . . . . . . . . . . . . . . . . . . . . . . . . . . . . . . . . . . . . . . 19,4892015 . . . . . . . . . . . . . . . . . . . . . . . . . . . . . . . . . . . . . . . . . . . . . . . . . . . . . . . . . . . . 15,396Thereafter . . . . . . . . . . . . . . . . . . . . . . . . . . . . . . . . . . . . . . . . . . . . . . . . . . . . . . . . 48,553
Total minimum lease payments . . . . . . . . . . . . . . . . . . . . . . . . . . . . . . . . . . . . . . . $177,969
All of the leases expire between Fiscal 2011 through January 2030. Successor Company’s total rent expensewas $30,218 and $2,351 during Fiscal 2010 and the period from August 31, 2009 through September 30, 2009,respectively. Predecessor Company’s total rent expense was $22,132 and $37,068 for the period from October 1,2008 through August 30, 2009 and Fiscal 2008, respectively.
(13) Related Party Transactions
Merger Agreement and Exchange Agreement
On June 16, 2010 (the “Closing Date”), SB Holdings completed a business combination transactionpursuant to the Agreement and Plan of Merger (the “Mergers”), dated as of February 9, 2010, as amended onMarch 1, 2010, March 26, 2010 and April 30, 2010, by and among SB Holdings, Russell Hobbs, SpectrumBrands, Battery Merger Corp., and Grill Merger Corp. (the “Merger Agreement”). As a result of the Mergers,each of Spectrum Brands and Russell Hobbs became a wholly-owned subsidiary of SB Holdings. At the effectivetime of the Mergers, (i) the outstanding shares of Spectrum Brands common stock were canceled and convertedinto the right to receive shares of SB Holdings common stock, and (ii) the outstanding shares of Russell Hobbscommon stock and preferred stock were canceled and converted into the right to receive shares of SB Holdingscommon stock.
Pursuant to the terms of the Merger Agreement, on February 9, 2010, Spectrum Brands entered into supportagreements with Harbinger Capital Partners Master Fund I, Ltd. (“Harbinger Master Fund”), Harbinger CapitalPartners Special Situations Fund, L.P. and Global Opportunities Breakaway Ltd. (collectively, the “HarbingerParties”) and Avenue International Master, L.P. and certain of its affiliates (the “Avenue Parties”), in which theHarbinger Parties and the Avenue Parties agreed to vote their shares of Spectrum Brands common stock acquiredbefore the date of the Merger Agreement in favor of the Mergers and against any alternative proposal that wouldimpede the Mergers.
Immediately following the consummation of the Mergers, the Harbinger Parties owned approximately 64%of the outstanding SB Holdings common stock and the stockholders of Spectrum Brands (other than the
154

SPECTRUM BRANDS HOLDINGS, INC. AND SUBSIDIARIES
NOTES TO CONSOLIDATED FINANCIAL STATEMENTS—(Continued)(In thousands, except per share amounts)
Harbinger Parties) owned approximately 36% of the outstanding SB Holdings common stock. Harbinger Group,Inc. (“HRG”) and the Harbinger Parties are parties to a Contribution and Exchange Agreement (the “ExchangeAgreement”), pursuant to the terms of which the Harbinger Parties will contribute 27,757 shares of SB Holdingscommon stock to HRG and received in exchange for such shares an aggregate of 119,910 shares of HRGcommon stock (the “Share Exchange”). Immediately following the consummation of the Share Exchange,(i) HRG will own 27,757 shares of SB Holdings common stock and the Harbinger Parties will own 6,500 sharesof SB Holdings common stock, approximately 54.4% and 12.7% of the outstanding shares of SB Holdingscommon stock, respectively, and (ii) the Harbinger Parties will own 129,860 shares of HRG common stock, orapproximately 93.3% of the outstanding HRG common stock.
In connection with the Mergers, the Harbinger Parties and SB Holdings entered into a stockholderagreement, dated February 9, 2010 (the “Stockholder Agreement”), which provides for certain protectiveprovisions in favor of minority stockholders and provides certain rights and imposes certain obligations on theHarbinger Parties, including:
• for so long as the Harbinger Parties own 40% or more of the outstanding voting securities of SBHoldings, the Harbinger Parties and HRG will vote their shares of SB Holdings common stock to effectthe structure of the SB Holdings board of directors as described in the Stockholder Agreement;
• the Harbinger Parties will not effect any transfer of equity securities of SB Holdings to any person thatwould result in such person and its affiliates owning 40% or more of the outstanding voting securitiesof SB Holdings, unless specified conditions are met; and
• the Harbinger Parties will be granted certain access and informational rights with respect to SBHoldings and its subsidiaries.
On September 10, 2010, the Harbinger Parties and HRG entered into a joinder to the StockholderAgreement, pursuant to which, effective upon the consummation of the Share Exchange, HRG will become aparty to the Stockholder Agreement, subject to all of the covenants, terms and conditions of the StockholderAgreement to the same extent as the Harbinger Parties were bound thereunder prior to giving effect to the ShareExchange.
Certain provisions of the Stockholder Agreement terminate on the date on which the Harbinger Parties orHRG no longer constitutes a Significant Stockholder (as defined in the Stockholder Agreement). The StockholderAgreement terminates when any person (including the Harbinger Parties or HRG) acquires 90% or more of theoutstanding voting securities of SB Holdings.
Also in connection with the Mergers, the Harbinger Parties, the Avenue Parties and SB Holdings enteredinto a registration rights agreement, dated as of February 9, 2010 (the “SB Holdings Registration RightsAgreement”), pursuant to which the Harbinger Parties and the Avenue Parties have, among other things andsubject to the terms and conditions set forth therein, certain demand and so-called “piggy back” registrationrights with respect to their shares of SB Holdings common stock. On September 10, 2010, the Harbinger Partiesand HRG entered into a joinder to the SB Holdings Registration Rights Agreement, pursuant to which, effectiveupon the consummation of the Share Exchange, HRG will become a party to the SB Holdings RegistrationRights Agreement, entitled to the rights and subject to the obligations of a holder thereunder.
Other Agreements
On August 28, 2009, in connection with Spectrum Brands’ emergence from Chapter 11 reorganizationproceedings, Spectrum Brands entered into a registration rights agreement with the Harbinger Parties, the
155

SPECTRUM BRANDS HOLDINGS, INC. AND SUBSIDIARIES
NOTES TO CONSOLIDATED FINANCIAL STATEMENTS—(Continued)(In thousands, except per share amounts)
Avenue Parties and D.E. Shaw Laminar Portfolios, L.L.C. (“D.E. Shaw”), pursuant to which the HarbingerParties, the Avenue Parties and D.E. Shaw have, among other things and subject to the terms and conditions setforth therein, certain demand and so-called “piggy back” registration rights with respect to their SpectrumBrands’ 12% Senior Subordinated Toggle Notes due 2019.
In connection with the Mergers, Russell Hobbs and Harbinger Master Fund entered into an indemnificationagreement, dated as of February 9, 2010 (the “Indemnification Agreement”), by which Harbinger Master Fundagreed, among other things and subject to the terms and conditions set forth therein, to guarantee the obligationsof Russell Hobbs to pay (i) a reverse termination fee to Spectrum Brands under the merger agreement and(ii) monetary damages awarded to Spectrum Brands in connection with any willful and material breach byRussell Hobbs of the Merger Agreement. The maximum amount payable by Harbinger Master Fund under theIndemnification Agreement was $50,000 less any amounts paid by Russell Hobbs or the Harbinger Parties, orany of their respective affiliates as damages under any documents related to the Mergers. No such amountsbecame due under the Indemnification Agreement. Harbinger Master Fund also agreed to indemnify RussellHobbs, SB Holdings and their subsidiaries for out-of-pocket costs and expenses above $3,000 in the aggregatethat become payable after the consummation of the Mergers and that relate to the litigation arising out of RussellHobbs’ business combination transaction with Applica Incorporated.
(14) Restructuring and Related Charges
The Company reports restructuring and related charges associated with manufacturing and related initiatives inCost of goods sold. Restructuring and related charges reflected in Cost of goods sold include, but are not limitedto, termination and related costs associated with manufacturing employees, asset impairments relating tomanufacturing initiatives, and other costs directly related to the restructuring or integration initiativesimplemented.
The Company reports restructuring and related charges relating to administrative functions in Operatingexpenses, such as initiatives impacting sales, marketing, distribution, or other non-manufacturing relatedfunctions. Restructuring and related charges reflected in Operating expenses include, but are not limited to,termination and related costs, any asset impairments relating to the functional areas described above, and othercosts directly related to the initiatives implemented as well as consultation, legal and accounting fees related tothe evaluation of the Predecessor Company’s capital structure incurred prior to the Bankruptcy Filing.
156

SPECTRUM BRANDS HOLDINGS, INC. AND SUBSIDIARIES
NOTES TO CONSOLIDATED FINANCIAL STATEMENTS—(Continued)(In thousands, except per share amounts)
The following table summarizes restructuring and related charges incurred by segment:
SuccessorCompany Predecessor Company
2010
Period fromAugust 31, 2009
throughSeptember 30,
2009
Period fromOctober 1, 2008
throughAugust 30,
2009 2008
Cost of goods sold:Global Batteries & Personal Care . . . . . . . . . . . . . . . . . . . . . $ 3,275 $ 173 $11,857 $16,159Global Pet Supplies . . . . . . . . . . . . . . . . . . . . . . . . . . . . . . . . 3,837 5 1,332 340Home and Garden Business . . . . . . . . . . . . . . . . . . . . . . . . . . 38 — — —
Total restructuring and related charges in cost of goodssold . . . . . . . . . . . . . . . . . . . . . . . . . . . . . . . . . . . . . . . . . . . 7,150 178 13,189 16,499
Operating expense:Global Batteries & Personal Care . . . . . . . . . . . . . . . . . . . . . 251 370 8,393 12,012Global Pet Supplies . . . . . . . . . . . . . . . . . . . . . . . . . . . . . . . . 2,917 35 4,411 2,702Home and Garden Business . . . . . . . . . . . . . . . . . . . . . . . . . . 8,419 993 5,323 3,770Corporate . . . . . . . . . . . . . . . . . . . . . . . . . . . . . . . . . . . . . . . . 5,381 153 12,764 4,354
Total restructuring and related charges in operatingexpense . . . . . . . . . . . . . . . . . . . . . . . . . . . . . . . . . . . . . . . . 16,968 1,551 30,891 22,838
Total restructuring and related charges . . . . . . . . . . . . . . . . . $24,118 $1,729 $44,080 $39,337
157

SPECTRUM BRANDS HOLDINGS, INC. AND SUBSIDIARIES
NOTES TO CONSOLIDATED FINANCIAL STATEMENTS—(Continued)(In thousands, except per share amounts)
The following table summarizes restructuring and related charges incurred by type of charge:
SuccessorCompany Predecessor Company
2010
Period fromAugust 31, 2009
throughSeptember 30,
2009
Period fromOctober 1, 2008
throughAugust 30,
2009 2008
Costs included in cost of goods sold:United & Tetra integration:
Termination benefits . . . . . . . . . . . . . . . . . . . . . . . . . . . $ — $ — $ 6 $ 30Other associated costs . . . . . . . . . . . . . . . . . . . . . . . . . . — — — 299
European initiatives:Termination benefits . . . . . . . . . . . . . . . . . . . . . . . . . . . — — — (830)Other associated costs . . . . . . . . . . . . . . . . . . . . . . . . . . — 7 11 88
Latin America initiatives:Termination benefits . . . . . . . . . . . . . . . . . . . . . . . . . . . — — 207 —Other associated costs . . . . . . . . . . . . . . . . . . . . . . . . . . — — — 253
Global Realignment initiatives:Termination benefits . . . . . . . . . . . . . . . . . . . . . . . . . . . 187 — 333 106Other associated costs . . . . . . . . . . . . . . . . . . . . . . . . . . (102) — 869 154
Ningbo Exit Plan:Termination benefits . . . . . . . . . . . . . . . . . . . . . . . . . . . 14 — 857 1,230Other associated costs . . . . . . . . . . . . . . . . . . . . . . . . . . 2,148 165 8,461 15,169
Global Cost Reduction initiatives:Termination benefits . . . . . . . . . . . . . . . . . . . . . . . . . . . 2,630 — 200 —Other associated costs . . . . . . . . . . . . . . . . . . . . . . . . . . 2,273 6 2,245 —
Total included in cost of goods sold . . . . . . . . . . . . . . . . . . . 7,150 178 13,189 16,499Costs included in operating expenses:Breitenbach, France facility closure:
Other associated costs . . . . . . . . . . . . . . . . . . . . . . . . . . — — (7) —United & Tetra integration:
Termination benefits . . . . . . . . . . . . . . . . . . . . . . . . . . . — — 2,297 1,954Other associated costs . . . . . . . . . . . . . . . . . . . . . . . . . . — (132) 427 883
European initiatives:Termination benefits . . . . . . . . . . . . . . . . . . . . . . . . . . . (92) — — —Other associated costs . . . . . . . . . . . . . . . . . . . . . . . . . . — — — 35
Latin America initiatives:Termination benefits . . . . . . . . . . . . . . . . . . . . . . . . . . . — — — 64
Global Realignment:Termination benefits . . . . . . . . . . . . . . . . . . . . . . . . . . . 5,361 94 6,994 12,338Other associated costs . . . . . . . . . . . . . . . . . . . . . . . . . . (1,841) 45 3,440 7,564
Ningbo Exit Plan:Termination benefits . . . . . . . . . . . . . . . . . . . . . . . . . . . — — — —Other associated costs . . . . . . . . . . . . . . . . . . . . . . . . . . — — 1,334 —
Global Cost Reduction initiatives:Termination benefits . . . . . . . . . . . . . . . . . . . . . . . . . . . 4,268 866 5,690 —Other associated costs . . . . . . . . . . . . . . . . . . . . . . . . . . 9,272 678 10,716 —
Total included in operating expenses . . . . . . . . . . . . . . . . . . . 16,968 1,551 30,891 22,838
Total restructuring and related charges . . . . . . . . . . . . . . . . . $24,118 $1,729 $44,080 $39,337
158
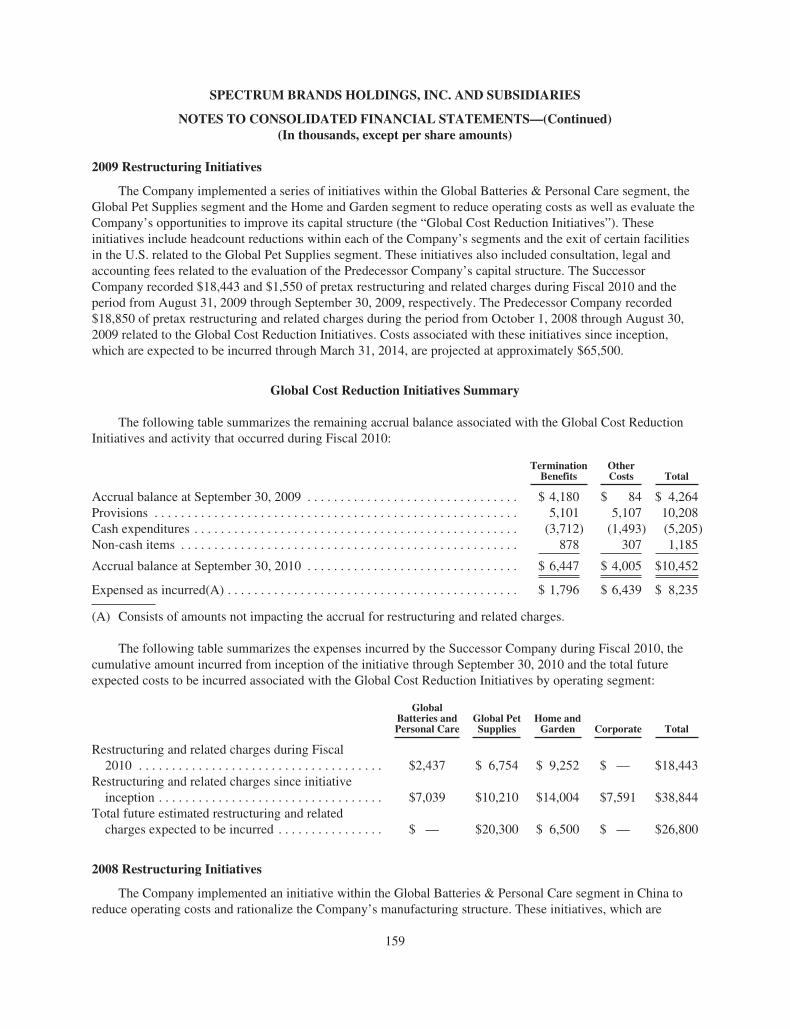
SPECTRUM BRANDS HOLDINGS, INC. AND SUBSIDIARIES
NOTES TO CONSOLIDATED FINANCIAL STATEMENTS—(Continued)(In thousands, except per share amounts)
2009 Restructuring Initiatives
The Company implemented a series of initiatives within the Global Batteries & Personal Care segment, theGlobal Pet Supplies segment and the Home and Garden segment to reduce operating costs as well as evaluate theCompany’s opportunities to improve its capital structure (the “Global Cost Reduction Initiatives”). Theseinitiatives include headcount reductions within each of the Company’s segments and the exit of certain facilitiesin the U.S. related to the Global Pet Supplies segment. These initiatives also included consultation, legal andaccounting fees related to the evaluation of the Predecessor Company’s capital structure. The SuccessorCompany recorded $18,443 and $1,550 of pretax restructuring and related charges during Fiscal 2010 and theperiod from August 31, 2009 through September 30, 2009, respectively. The Predecessor Company recorded$18,850 of pretax restructuring and related charges during the period from October 1, 2008 through August 30,2009 related to the Global Cost Reduction Initiatives. Costs associated with these initiatives since inception,which are expected to be incurred through March 31, 2014, are projected at approximately $65,500.
Global Cost Reduction Initiatives Summary
The following table summarizes the remaining accrual balance associated with the Global Cost ReductionInitiatives and activity that occurred during Fiscal 2010:
TerminationBenefits
OtherCosts Total
Accrual balance at September 30, 2009 . . . . . . . . . . . . . . . . . . . . . . . . . . . . . . . . $ 4,180 $ 84 $ 4,264Provisions . . . . . . . . . . . . . . . . . . . . . . . . . . . . . . . . . . . . . . . . . . . . . . . . . . . . . . . 5,101 5,107 10,208Cash expenditures . . . . . . . . . . . . . . . . . . . . . . . . . . . . . . . . . . . . . . . . . . . . . . . . . (3,712) (1,493) (5,205)Non-cash items . . . . . . . . . . . . . . . . . . . . . . . . . . . . . . . . . . . . . . . . . . . . . . . . . . . 878 307 1,185
Accrual balance at September 30, 2010 . . . . . . . . . . . . . . . . . . . . . . . . . . . . . . . . $ 6,447 $ 4,005 $10,452
Expensed as incurred(A) . . . . . . . . . . . . . . . . . . . . . . . . . . . . . . . . . . . . . . . . . . . . $ 1,796 $ 6,439 $ 8,235
(A) Consists of amounts not impacting the accrual for restructuring and related charges.
The following table summarizes the expenses incurred by the Successor Company during Fiscal 2010, thecumulative amount incurred from inception of the initiative through September 30, 2010 and the total futureexpected costs to be incurred associated with the Global Cost Reduction Initiatives by operating segment:
GlobalBatteries andPersonal Care
Global PetSupplies
Home andGarden Corporate Total
Restructuring and related charges during Fiscal2010 . . . . . . . . . . . . . . . . . . . . . . . . . . . . . . . . . . . . . $2,437 $ 6,754 $ 9,252 $ — $18,443
Restructuring and related charges since initiativeinception . . . . . . . . . . . . . . . . . . . . . . . . . . . . . . . . . . $7,039 $10,210 $14,004 $7,591 $38,844
Total future estimated restructuring and relatedcharges expected to be incurred . . . . . . . . . . . . . . . . $ — $20,300 $ 6,500 $ — $26,800
2008 Restructuring Initiatives
The Company implemented an initiative within the Global Batteries & Personal Care segment in China toreduce operating costs and rationalize the Company’s manufacturing structure. These initiatives, which are
159

SPECTRUM BRANDS HOLDINGS, INC. AND SUBSIDIARIES
NOTES TO CONSOLIDATED FINANCIAL STATEMENTS—(Continued)(In thousands, except per share amounts)
complete, include the plan to exit the Company’s Ningbo battery manufacturing facility in China (the “NingboExit Plan”). The Successor Company recorded $2,162 and $165 of pretax restructuring and related chargesduring Fiscal 2010 and the period from August 31, 2009 through September 30, 2009, respectively. ThePredecessor Company recorded $10,652 and $16,399 of pretax restructuring and related charges during theperiod from October 1, 2008 through August 30, 2009 and Fiscal 2008, respectively, in connection with theNingbo Exit Plan. The Company has recorded pretax restructuring and related charges of $29,378 since theinception of the Ningbo Exit Plan.
The following table summarizes the remaining accrual balance associated with the Ningbo Exit Plan andactivity that occurred during Fiscal 2010:
Ningbo Exit Plan Summary
Other Costs
Accrual balance at September 30, 2009 . . . . . . . . . . . . . . . . . . . . . . . . . . . . . . . . $ 308Provisions . . . . . . . . . . . . . . . . . . . . . . . . . . . . . . . . . . . . . . . . . . . . . . . . . . . . . . . 461Cash expenditures . . . . . . . . . . . . . . . . . . . . . . . . . . . . . . . . . . . . . . . . . . . . . . . . . (278)
Accrual balance at September 30, 2010 . . . . . . . . . . . . . . . . . . . . . . . . . . . . . . . . $ 491
Expensed as incurred(A) . . . . . . . . . . . . . . . . . . . . . . . . . . . . . . . . . . . . . . . . . . . . $1,701
(A) Consists of amounts not impacting the accrual for restructuring and related charges.
2007 Restructuring Initiatives
The Company has implemented a series of initiatives within the Global Batteries & Personal Care segmentin Latin America to reduce operating costs (the “Latin American Initiatives”). These initiatives, which aresubstantially complete, include the reduction of certain manufacturing operations in Brazil and the restructuringof management, sales, marketing and support functions. The Successor Company recorded no pretaxrestructuring and related charges during Fiscal 2010 and the period from August 31, 2009 through September 30,2009 related to the Latin American Initiatives. The Predecessor Company recorded $207 and $317 of pretaxrestructuring and related charges during the period from October 1, 2008 through August 30, 2009 and Fiscal2008, respectively, in connection with the Latin American Initiatives. The Company has recorded pretaxrestructuring and related charges of $11,447 since the inception of the Latin American Initiatives.
The following table summarizes the accrual balance associated with the Latin American Initiatives andactivity that occurred during Fiscal 2010:
Latin American Initiatives Summary
TerminationBenefits
OtherCosts Total
Accrual balance at September 30, 2009 . . . . . . . . . . . . . . . . . . . . . . . . . . . . . . . . . . . $(282) $ 613 $ 331Non-cash items . . . . . . . . . . . . . . . . . . . . . . . . . . . . . . . . . . . . . . . . . . . . . . . . . . . . . . 282 (613) (331)
Accrual balance at September 30, 2010 . . . . . . . . . . . . . . . . . . . . . . . . . . . . . . . . . . . $ — $ — $ —
In Fiscal 2007, the Company began managing its business in three vertically integrated, product-focusedreporting segments; Global Batteries & Personal Care, Global Pet Supplies and the Home and Garden Business.
160

SPECTRUM BRANDS HOLDINGS, INC. AND SUBSIDIARIES
NOTES TO CONSOLIDATED FINANCIAL STATEMENTS—(Continued)(In thousands, except per share amounts)
As part of this realignment, the Company’s Global Operations organization, previously included in corporateexpense, consisting of research and development, manufacturing management, global purchasing, qualityoperations and inbound supply chain, is now included in each of the operating segments. In connection with thesechanges the Company undertook a number of cost reduction initiatives, primarily headcount reductions, at thecorporate and operating segment levels (the “Global Realignment Initiatives”). The Successor Company recorded$3,605 and $138 of restructuring and related charges during Fiscal 2010 and the period from August 31, 2009through September 30, 2009, respectively. The Predecessor Company recorded $11,635 and $20,161 of pretaxrestructuring and related charges during the period from October 1, 2008 through August 30, 2009 and Fiscal2008, respectively, related to the Global Realignment Initiatives. Costs associated with these initiatives sinceinception, which are expected to be incurred through June 30, 2011, relate primarily to severance and areprojected at approximately $89,000, the majority of which are cash costs.
The following table summarizes the remaining accrual balance associated with the Global RealignmentInitiatives and activity that have occurred during Fiscal 2010:
Global Realignment Initiatives Summary
TerminationBenefits
OtherCosts Total
Accrual balance at September 30, 2009 . . . . . . . . . . . . . . . . . . . . . . . . . . . . . . . . $14,581 $ 3,678 $18,259Provisions . . . . . . . . . . . . . . . . . . . . . . . . . . . . . . . . . . . . . . . . . . . . . . . . . . . . . . . 1,720 (1,109) 611Cash expenditures . . . . . . . . . . . . . . . . . . . . . . . . . . . . . . . . . . . . . . . . . . . . . . . . . (7,657) (319) (7,976)Non-cash items . . . . . . . . . . . . . . . . . . . . . . . . . . . . . . . . . . . . . . . . . . . . . . . . . . . 77 31 108
Accrual balance at September 30, 2010 . . . . . . . . . . . . . . . . . . . . . . . . . . . . . . . . $ 8,721 $ 2,281 $11,002
Expensed as incurred(A) . . . . . . . . . . . . . . . . . . . . . . . . . . . . . . . . . . . . . . . . . . . . $ 3,828 $ (834) $ 2,994
(A) Consists of amounts not impacting the accrual for restructuring and related charges.
The following table summarizes the expenses incurred by the Successor Company during Fiscal 2010, thecumulative amount incurred from inception of the initiative through September 30, 2010 and the total futureexpected costs to be incurred associated with the Global Realignment Initiatives by operating segment:
GlobalBatteries andPersonal Care
Home andGarden Corporate Total
Restructuring and related charges during Fiscal 2010 . . . . . . . . . . $ (981) $ (796) $ 5,382 $ 3,605Restructuring and related charges since initiative inception . . . . . $46,669 $6,762 $35,156 $88,587Total future restructuring and related charges expected . . . . . . . . $ — $ — $ 350 $ 350
2006 Restructuring Initiatives
The Company implemented a series of initiatives within the Global Batteries & Personal Care segment inEurope to reduce operating costs and rationalize the Company’s manufacturing structure (the “EuropeanInitiatives”). These initiatives, which are substantially complete, include the relocation of certain operations atthe Ellwangen, Germany packaging center to the Dischingen, Germany battery plant, transferring private labelbattery production at the Company’s Dischingen, Germany battery plant to the Company’s manufacturing facilityin China and restructuring its sales, marketing and support functions. The Company recorded $(92) and $7 ofpretax restructuring and related charges during Fiscal 2010 and the period from August 31, 2009 through
161
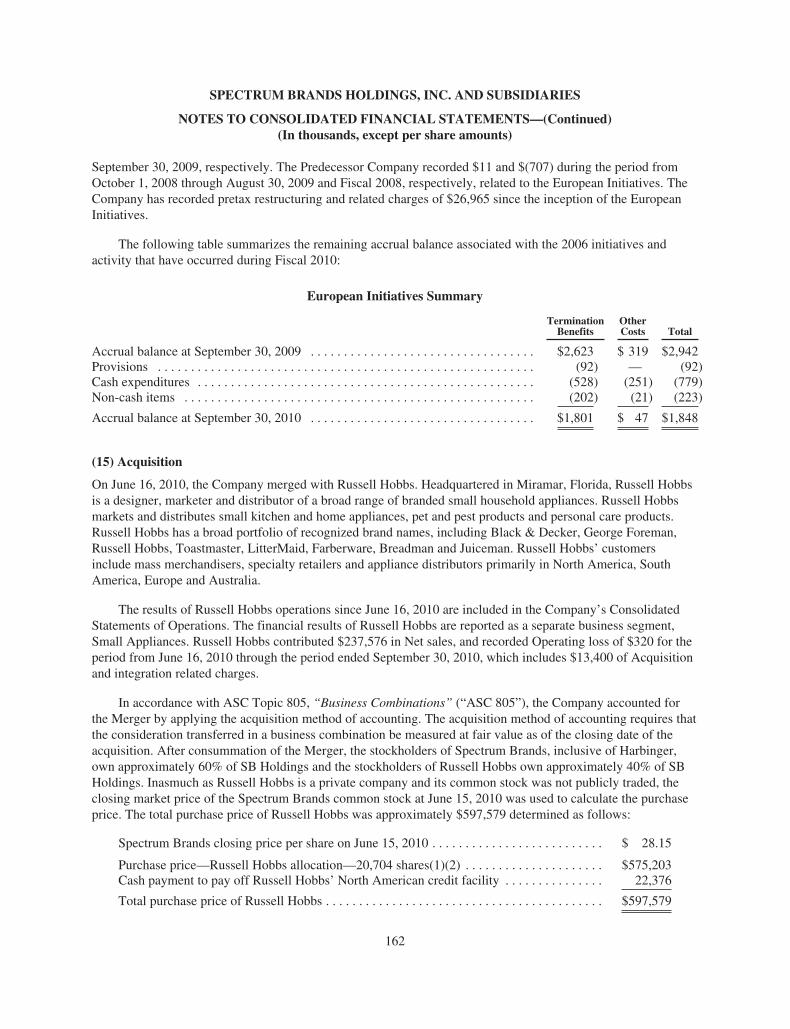
SPECTRUM BRANDS HOLDINGS, INC. AND SUBSIDIARIES
NOTES TO CONSOLIDATED FINANCIAL STATEMENTS—(Continued)(In thousands, except per share amounts)
September 30, 2009, respectively. The Predecessor Company recorded $11 and $(707) during the period fromOctober 1, 2008 through August 30, 2009 and Fiscal 2008, respectively, related to the European Initiatives. TheCompany has recorded pretax restructuring and related charges of $26,965 since the inception of the EuropeanInitiatives.
The following table summarizes the remaining accrual balance associated with the 2006 initiatives andactivity that have occurred during Fiscal 2010:
European Initiatives Summary
TerminationBenefits
OtherCosts Total
Accrual balance at September 30, 2009 . . . . . . . . . . . . . . . . . . . . . . . . . . . . . . . . . . $2,623 $ 319 $2,942Provisions . . . . . . . . . . . . . . . . . . . . . . . . . . . . . . . . . . . . . . . . . . . . . . . . . . . . . . . . . (92) — (92)Cash expenditures . . . . . . . . . . . . . . . . . . . . . . . . . . . . . . . . . . . . . . . . . . . . . . . . . . . (528) (251) (779)Non-cash items . . . . . . . . . . . . . . . . . . . . . . . . . . . . . . . . . . . . . . . . . . . . . . . . . . . . . (202) (21) (223)
Accrual balance at September 30, 2010 . . . . . . . . . . . . . . . . . . . . . . . . . . . . . . . . . . $1,801 $ 47 $1,848
(15) Acquisition
On June 16, 2010, the Company merged with Russell Hobbs. Headquartered in Miramar, Florida, Russell Hobbsis a designer, marketer and distributor of a broad range of branded small household appliances. Russell Hobbsmarkets and distributes small kitchen and home appliances, pet and pest products and personal care products.Russell Hobbs has a broad portfolio of recognized brand names, including Black & Decker, George Foreman,Russell Hobbs, Toastmaster, LitterMaid, Farberware, Breadman and Juiceman. Russell Hobbs’ customersinclude mass merchandisers, specialty retailers and appliance distributors primarily in North America, SouthAmerica, Europe and Australia.
The results of Russell Hobbs operations since June 16, 2010 are included in the Company’s ConsolidatedStatements of Operations. The financial results of Russell Hobbs are reported as a separate business segment,Small Appliances. Russell Hobbs contributed $237,576 in Net sales, and recorded Operating loss of $320 for theperiod from June 16, 2010 through the period ended September 30, 2010, which includes $13,400 of Acquisitionand integration related charges.
In accordance with ASC Topic 805, “Business Combinations” (“ASC 805”), the Company accounted forthe Merger by applying the acquisition method of accounting. The acquisition method of accounting requires thatthe consideration transferred in a business combination be measured at fair value as of the closing date of theacquisition. After consummation of the Merger, the stockholders of Spectrum Brands, inclusive of Harbinger,own approximately 60% of SB Holdings and the stockholders of Russell Hobbs own approximately 40% of SBHoldings. Inasmuch as Russell Hobbs is a private company and its common stock was not publicly traded, theclosing market price of the Spectrum Brands common stock at June 15, 2010 was used to calculate the purchaseprice. The total purchase price of Russell Hobbs was approximately $597,579 determined as follows:
Spectrum Brands closing price per share on June 15, 2010 . . . . . . . . . . . . . . . . . . . . . . . . . . $ 28.15
Purchase price—Russell Hobbs allocation—20,704 shares(1)(2) . . . . . . . . . . . . . . . . . . . . . $575,203Cash payment to pay off Russell Hobbs’ North American credit facility . . . . . . . . . . . . . . . 22,376
Total purchase price of Russell Hobbs . . . . . . . . . . . . . . . . . . . . . . . . . . . . . . . . . . . . . . . . . . $597,579
162

SPECTRUM BRANDS HOLDINGS, INC. AND SUBSIDIARIES
NOTES TO CONSOLIDATED FINANCIAL STATEMENTS—(Continued)(In thousands, except per share amounts)
(1) Number of shares calculated based upon conversion formula, as defined in the Merger Agreement, usingbalances as of June 16, 2010.
(2) The fair value of 271 shares of unvested restricted stock units as they relate to post combination serviceswill be recorded as operating expense over the remaining service period and were assumed to have no fairvalue for the purchase price.
Preliminary Purchase Price Allocation
The total purchase price for Russell Hobbs was allocated to the preliminary net tangible and intangibleassets based upon their preliminary fair values at June 16, 2010 as set forth below. The excess of the purchaseprice over the preliminary net tangible assets and intangible assets was recorded as goodwill. The preliminaryallocation of the purchase price was based upon a valuation for which the estimates and assumptions are subjectto change within the measurement period (up to one year from the acquisition date). The primary areas of thepreliminary purchase price allocation that are not yet finalized relate to the certain legal matters, amounts forincome taxes including deferred tax accounts, amounts for uncertain tax positions, and net operating losscarryforwards inclusive of associated limitations, and the final allocation of goodwill. The Company expects tocontinue to obtain information to assist it in determining the fair values of the net assets acquired at theacquisition date during the measurement period. The preliminary purchase price allocation for Russell Hobbs isas follows:
Current assets . . . . . . . . . . . . . . . . . . . . . . . . . . . . . . . . . . . . . . . . . . . . . . . . . . . . . . . . . . . . $ 307,809Property, plant and equipment . . . . . . . . . . . . . . . . . . . . . . . . . . . . . . . . . . . . . . . . . . . . . . . 15,150Intangible assets . . . . . . . . . . . . . . . . . . . . . . . . . . . . . . . . . . . . . . . . . . . . . . . . . . . . . . . . . . 363,327Goodwill (A) . . . . . . . . . . . . . . . . . . . . . . . . . . . . . . . . . . . . . . . . . . . . . . . . . . . . . . . . . . . . . 120,079Other assets . . . . . . . . . . . . . . . . . . . . . . . . . . . . . . . . . . . . . . . . . . . . . . . . . . . . . . . . . . . . . . 15,752
Total assets acquired . . . . . . . . . . . . . . . . . . . . . . . . . . . . . . . . . . . . . . . . . . . . . . . . . . . . . . . $ 822,117Current liabilities . . . . . . . . . . . . . . . . . . . . . . . . . . . . . . . . . . . . . . . . . . . . . . . . . . . . . . . . . . 142,046Total debt . . . . . . . . . . . . . . . . . . . . . . . . . . . . . . . . . . . . . . . . . . . . . . . . . . . . . . . . . . . . . . . . 18,970Long-term liabilities . . . . . . . . . . . . . . . . . . . . . . . . . . . . . . . . . . . . . . . . . . . . . . . . . . . . . . . 63,522
Total liabilities assumed . . . . . . . . . . . . . . . . . . . . . . . . . . . . . . . . . . . . . . . . . . . . . . . . . . . . $ 224,538
Net assets acquired . . . . . . . . . . . . . . . . . . . . . . . . . . . . . . . . . . . . . . . . . . . . . . . . . . . . . . . . $ 597,579
(A) Consists of $25,426 of tax deductible Goodwill.
Preliminary Pre-Acquisition Contingencies Assumed
The Company has evaluated and continues to evaluate pre-acquisition contingencies relating to RussellHobbs that existed as of the acquisition date. Based on the evaluation to date, the Company has preliminarilydetermined that certain pre-acquisition contingencies are probable in nature and estimable as of the acquisitiondate. Accordingly, the Company has preliminarily recorded its best estimates for these contingencies as part ofthe preliminary purchase price allocation for Russell Hobbs. The Company continues to gather informationrelating to all pre-acquisition contingencies that it has assumed from Russell Hobbs. Any changes to thepre-acquisition contingency amounts recorded during the measurement period will be included in the purchaseprice allocation. Subsequent to the end of the measurement period any adjustments to pre-acquisitioncontingency amounts will be reflected in the Company’s results of operations.
163

SPECTRUM BRANDS HOLDINGS, INC. AND SUBSIDIARIES
NOTES TO CONSOLIDATED FINANCIAL STATEMENTS—(Continued)(In thousands, except per share amounts)
Certain estimated values are not yet finalized and are subject to change, which could be significant. TheCompany will finalize the amounts recognized as it obtains the information necessary to complete its analysisduring the measurement period. The following items are provisional and subject to change:
• amounts for legal contingencies, pending the finalization of the Company’s examination and evaluationof the portfolio of filed cases;
• amounts for income taxes including deferred tax accounts, amounts for uncertain tax positions, and netoperating loss carryforwards inclusive of associated limitations; and
• the final allocation of Goodwill.
ASC 805 requires, among other things, that most assets acquired and liabilities assumed be recognized attheir fair values as of the acquisition date. Accordingly, the Company performed a preliminary valuation of theassets and liabilities of Russell Hobbs at June 16, 2010. Significant adjustments as a result of that preliminaryvaluation are summarized as followed:
• Inventories—An adjustment of $1,721 was recorded to adjust inventory to fair value. Finished goodswere valued at estimated selling prices less the sum of costs of disposal and a reasonable profitallowance for the selling effort.
• Deferred tax liabilities, net—An adjustment of $43,086 was recorded to adjust deferred taxes for thepreliminary fair value allocations.
• Property, plant and equipment, net—An adjustment of $(455) was recorded to adjust the net book valueof property, plant and equipment to fair value giving consideration to their highest and best use. Keyassumptions used in the valuation of the Company’s property, plant and equipment were based on thecost approach.
• Certain indefinite-lived intangible assets were valued using a relief from royalty methodology.Customer relationships and certain definite-lived intangible assets were valued using a multi-periodexcess earnings method. Certain intangible assets are subject to sensitive business factors of whichonly a portion are within control of the Company’s management. The total fair value of indefinite anddefinite lived intangibles was $363,327 as of June 16, 2010. A summary of the significant key inputswere as follows:
• The Company valued customer relationships using the income approach, specifically the multi-period excess earnings method. In determining the fair value of the customer relationship, themulti-period excess earnings approach values the intangible asset at the present value of theincremental after-tax cash flows attributable only to the customer relationship after deductingcontributory asset charges. The incremental after-tax cash flows attributable to the subjectintangible asset are then discounted to their present value. Only expected sales from currentcustomers were used which included an expected growth rate of 3%. The Company assumed acustomer retention rate of approximately 93% which was supported by historical retention rates.Income taxes were estimated at 36% and amounts were discounted using a rate of 15.5%. Thecustomer relationships were valued at $38,000 under this approach.
• The Company valued trade names and trademarks using the income approach, specifically therelief from royalty method. Under this method, the asset value was determined by estimating thehypothetical royalties that would have to be paid if the trade name was not owned. Royalty rates
164

SPECTRUM BRANDS HOLDINGS, INC. AND SUBSIDIARIES
NOTES TO CONSOLIDATED FINANCIAL STATEMENTS—(Continued)(In thousands, except per share amounts)
were selected based on consideration of several factors, including prior transactions of RussellHobbs related trademarks and trade names, other similar trademark licensing and transactionagreements and the relative profitability and perceived contribution of the trademarks and tradenames. Royalty rates used in the determination of the fair values of trade names and trademarksranged from 2.0% to 5.5% of expected net sales related to the respective trade names andtrademarks. The Company anticipates using the majority of the trade names and trademarks for anindefinite period as demonstrated by the sustained use of each subjected trademark. In estimatingthe fair value of the trademarks and trade names, Net sales for significant trade names andtrademarks were estimated to grow at a rate of 1%-14% annually with a terminal year growth rateof 3%. Income taxes were estimated at a range of 30%-38% and amounts were discounted usingrates between 15.5%-16.5%. Trade name and trademarks were valued at $170,930 under thisapproach.
• The Company valued a trade name license agreement using the income approach, specifically themulti-period excess earnings method. In determining the fair value of the trade name licenseagreement, the multi-period excess earnings approach values the intangible asset at the presentvalue of the incremental after-tax cash flows attributable only to the trade name license agreementafter deducting contributory asset charges. The incremental after-tax cash flows attributable to thesubject intangible asset are then discounted to their present value. In estimating the fair value ofthe trade name license agreement net sales were estimated to grow at a rate of (3)%-1% annually.The Company assumed a twelve year useful life of the trade name license agreement. Incometaxes were estimated at 37% and amounts were discounted using a rate of 15.5%. The trade namelicense agreement was valued at $149,200 under this approach.
• The Company valued technology using the income approach, specifically the relief from royaltymethod. Under this method, the asset value was determined by estimating the hypotheticalroyalties that would have to be paid if the technology was not owned. Royalty rates were selectedbased on consideration of several factors including prior transactions of Russell Hobbs relatedlicensing agreements and the importance of the technology and profit levels, among otherconsiderations. Royalty rates used in the determination of the fair values of technologies were 2%of expected net sales related to the respective technology. The Company anticipates using thesetechnologies through the legal life of the underlying patent and therefore the expected life of thesetechnologies was equal to the remaining legal life of the underlying patents ranging from 9 to 11years. In estimating the fair value of the technologies, net sales were estimated to grow at a rate of3%-12% annually. Income taxes were estimated at 37% and amounts were discounted using therate of 15.5%. The technology assets were valued at $4,100 under this approach.
165

SPECTRUM BRANDS HOLDINGS, INC. AND SUBSIDIARIES
NOTES TO CONSOLIDATED FINANCIAL STATEMENTS—(Continued)(In thousands, except per share amounts)
Supplemental Pro Forma Information (unaudited)
The following reflects the Company’s pro forma results had the results of Russell Hobbs been included forall periods beginning after September 30, 2007.
Successor Company Predecessor Company
2010
Period fromAugust 31, 2009
throughSeptember 30,
2009
Period fromOctober 1, 2008
throughAugust 30,
2009 2008
Net sales:Reported Net sales . . . . . . . . . . . . . . . . . . . . . . . . . . . . $2,567,011 $219,888 $2,010,648 $2,426,571Russell Hobbs adjustment . . . . . . . . . . . . . . . . . . . . . . 543,952 64,641 711,046 909,426
Pro forma Net sales . . . . . . . . . . . . . . . . . . . . . . . . . . . $3,110,963 $284,529 $2,721,694 $3,335,997
(Loss) income from continuing operations:Reported (Loss) income from continuingoperations . . . . . . . . . . . . . . . . . . . . . . . . . . . . . . . . . $ (187,372) $ (71,193) $1,100,743 $ (905,358)
Russell Hobbs adjustment . . . . . . . . . . . . . . . . . . . . . . (5,504) (2,284) (25,121) (43,480)
Pro forma Loss from continuing operations . . . . . . . . $ (192,876) $ (73,477) $1,075,622 $ (948,838)
Basic and Diluted earnings per share fromcontinuing operations(A) :
Reported Basic and Diluted earnings per share fromcontinuing operations . . . . . . . . . . . . . . . . . . . . . . . . $ (5.20) $ (2.37) $ 21.45 $ (17.78)
Russell Hobbs adjustment . . . . . . . . . . . . . . . . . . . . . . (0.16) (0.08) (0.49) (0.85)
Pro forma basic and diluted earnings per share fromcontinuing operations . . . . . . . . . . . . . . . . . . . . . . . . $ (5.36) $ (2.45) $ 20.96 $ (18.63)
(A) The Company has not assumed the exercise of common stock equivalents as the impact would beantidilutive.
(16) Quarterly Results (unaudited)
Successor Company
Quarter Ended
September 30,2010
July 4,2010
April 4,2010
January 3,2010
Net sales . . . . . . . . . . . . . . . . . . . . . . . . . . . . . . . . . . . . . . . . . . . $788,999 $653,486 $532,586 $591,940Gross profit . . . . . . . . . . . . . . . . . . . . . . . . . . . . . . . . . . . . . . . . . 274,499 252,869 209,580 184,462Net loss . . . . . . . . . . . . . . . . . . . . . . . . . . . . . . . . . . . . . . . . . . . . (24,317) (86,507) (19,034) (60,249)Basic net loss per common share . . . . . . . . . . . . . . . . . . . . . . . . $ (0.48) $ (2.53) $ (0.63) $ (2.01)Diluted net loss per common share . . . . . . . . . . . . . . . . . . . . . . . $ (0.48) $ (2.53) $ (0.63) $ (2.01)
166

SPECTRUM BRANDS HOLDINGS, INC. AND SUBSIDIARIES
NOTES TO CONSOLIDATED FINANCIAL STATEMENTS—(Continued)(In thousands, except per share amounts)
Successor Company Predecessor Company
Period fromAugust 31, 2009
throughSeptember 30,
2009
Period fromJune 29, 2009
throughAugust 30,
2009
Quarter Ended
June 28,2009
March 29,2009
December 28,2008
Net sales . . . . . . . . . . . . . . . . . . . . . . . . . . $219,888 $ 369,522 $589,361 $503,262 $ 548,503Gross profit . . . . . . . . . . . . . . . . . . . . . . . . 64,400 146,817 230,297 184,834 189,871Net (loss) income . . . . . . . . . . . . . . . . . . . (70,785) 1,223,568 (36,521) (60,449) (112,657)Basic net (loss) income per commonshare . . . . . . . . . . . . . . . . . . . . . . . . . . . $ (2.36) $ 23.85 $ (0.71) $ (1.18) $ (2.19)
Diluted net (loss) income per commonshare . . . . . . . . . . . . . . . . . . . . . . . . . . . $ (2.36) $ 23.85 $ (0.71) $ (1.18) $ (2.19)
167
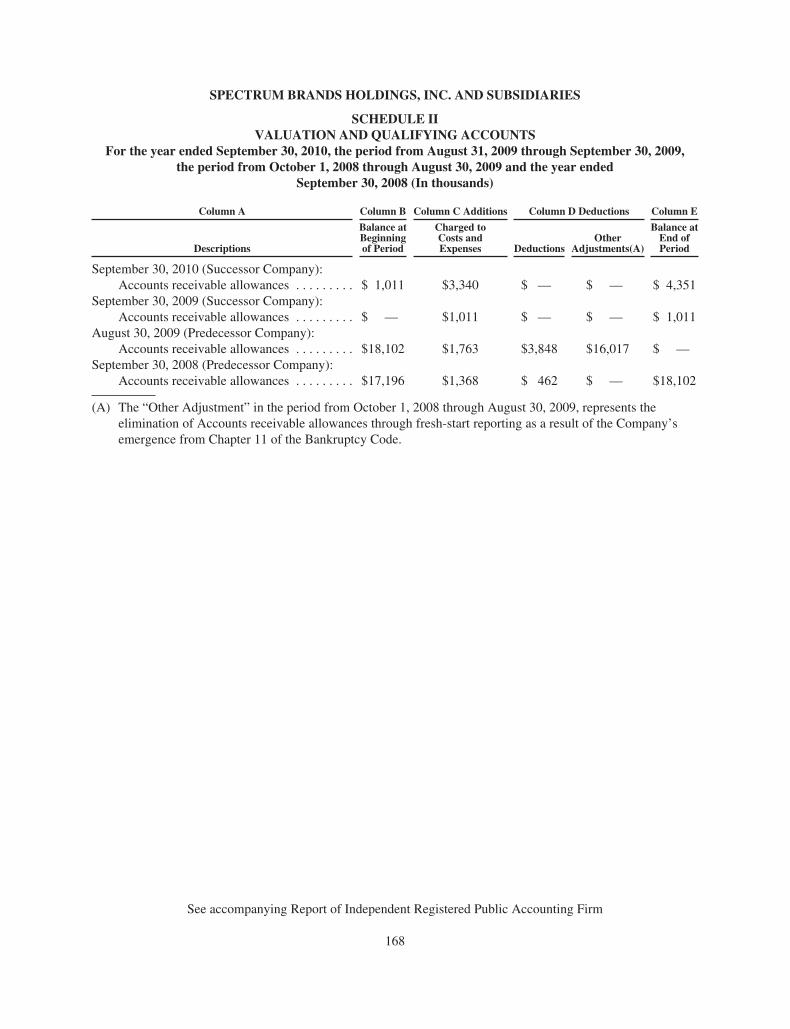
SPECTRUM BRANDS HOLDINGS, INC. AND SUBSIDIARIES
SCHEDULE IIVALUATION AND QUALIFYING ACCOUNTS
For the year ended September 30, 2010, the period from August 31, 2009 through September 30, 2009,the period from October 1, 2008 through August 30, 2009 and the year ended
September 30, 2008 (In thousands)
Column A Column B Column C Additions Column D Deductions Column E
Descriptions
Balance atBeginningof Period
Charged toCosts andExpenses Deductions
OtherAdjustments(A)
Balance atEnd ofPeriod
September 30, 2010 (Successor Company):Accounts receivable allowances . . . . . . . . . $ 1,011 $3,340 $ — $ — $ 4,351
September 30, 2009 (Successor Company):Accounts receivable allowances . . . . . . . . . $ — $1,011 $ — $ — $ 1,011
August 30, 2009 (Predecessor Company):Accounts receivable allowances . . . . . . . . . $18,102 $1,763 $3,848 $16,017 $ —
September 30, 2008 (Predecessor Company):Accounts receivable allowances . . . . . . . . . $17,196 $1,368 $ 462 $ — $18,102
(A) The “Other Adjustment” in the period from October 1, 2008 through August 30, 2009, represents theelimination of Accounts receivable allowances through fresh-start reporting as a result of the Company’semergence from Chapter 11 of the Bankruptcy Code.
See accompanying Report of Independent Registered Public Accounting Firm
168

Signatures
Pursuant to the requirements of Section 13 or 15(d) of the Securities Exchange Act of 1934, the registranthas duly caused this report to be signed on its behalf by the undersigned thereunto duly authorized.
SPECTRUM BRANDS HOLDINGS, INC.
By: /s/ David R. Lumley
David R. LumleyChief Executive Officer
DATE: December 14, 2010
Pursuant to the requirements of the Securities Exchange Act of 1934, this report has been signed below bythe following persons on behalf of the registrant and in the capacities indicated and on the above-stated date.
Signature Title
/s/ David R. LumleyDavid R. Lumley
Chief Executive Officer(Principal Executive Officer)
/s/ Anthony L. GenitoAnthony L. Genito
Executive Vice President, Chief Financial Officerand Chief Accounting Officer(Principal Financial Officer andPrincipal Accounting Officer)
/s/ David M. MauraDavid M. Maura
Chairman of the Board
/s/ Kenneth C. AmbrechtKenneth C. Ambrecht
Director
/s/ Eugene I. DavisEugene I. Davis
Director
/s/ Marc S. KirschnerMarc S. Kirschner
Director
/s/ Norman S. MatthewsNorman S. Matthews
Director
/s/ Terry L. PolistinaTerry L. Polistina
Director
/s/ Hugh R. RovitHugh R. Rovit
Director
/s/ Robin RogerRobin Roger
Director
/s/ Virginia A. KamskyVirginia A. Kamsky
Director
169

EXHIBIT INDEX
Exhibit 2.1 Purchase Agreement, dated February 21, 2004, by and among Rayovac Corporation, ROVHolding, Inc., VARTA AG, Interelectrica Adminstração e Participações Ltda., and Tabriza BrasilEmpreendimentos Ltda. (filed by incorporation by reference to Exhibit 2.1 to Spectrum Brands,Inc.’s Current Report on Form 8-K filed with the SEC by Spectrum Brands, Inc. on June 14,2004).
Exhibit 2.2 Joint Plan of Reorganization of Spectrum Jungle Labs Corporation, et al., Debtors (filed byincorporation by reference to Exhibit 99.T3E.2 to Spectrum Brands, Inc.’s Form T-3, filed withthe SEC by Spectrum Brands, Inc. on April 28, 2009).
Exhibit 2.3 First Modification to Joint Plan of Reorganization (filed by incorporation by reference toExhibit 99.2 to Spectrum Brands, Inc.’s Current Report on Form 8-K, filed with the SEC bySpectrum Brands, Inc. on July 16, 2009).
Exhibit 2.4 Second Modification to Joint Plan of Reorganization (filed by incorporation by reference toExhibit 99.3 to Spectrum Brands, Inc.’s Current Report on Form 8-K, filed with the SEC bySpectrum Brands, Inc. on July 16, 2009).
Exhibit 2.5 Agreement and Plan of Merger by and among SB/RH Holdings, Inc., Battery Merger Corp.,Grill Merger Corp., Spectrum Brands, Inc. and Russell Hobbs, Inc. dated as of February 9, 2010(filed by incorporation by reference to Exhibit 2.1 to the Current Report on Form 8-K filed withthe SEC by Spectrum Brands, Inc. on February 12, 2010).
Exhibit 2.6 Amendment to Agreement and Plan of Merger dated as of March 1, 2010 by and among SB/RHHoldings, Inc., Battery Merger Corp., Grill Merger Corp., Spectrum Brands, and Russell Hobbs,Inc. (filed by incorporation by reference to Exhibit 10.2 to the Current Report on Form 8-K filedwith the SEC by Spectrum Brands, Inc. on March 2, 2010).
Exhibit 2.7 Second Amendment to Agreement and Plan of Merger dated as of March 26, 2010 by and amongSpectrum Brands Holdings, Inc., Battery Merger Corp., Grill Merger Corp., Spectrum Brands,Inc., and Russell Hobbs, Inc. (filed by incorporation by reference to Exhibit 10.1 to the CurrentReport on Form 8-K filed with the SEC by Spectrum Brands, Inc. on March 29, 2010).
Exhibit 2.8 Third Amendment to Agreement and Plan of Merger dated as of April 30, 2010 by and amongSpectrum Brands Holdings, Inc., Battery Merger Corp., Grill Merger Corp., Spectrum Brands,Inc., and Russell Hobbs, Inc. (filed by incorporation by reference to Exhibit 10.1 to the CurrentReport on Form 8-K filed with the SEC by Spectrum Brands, Inc. on May 3, 2010).
Exhibit 3.1 Restated Certificate of Incorporation of Spectrum Brands Holdings, Inc., dated June 16, 2010(incorporated by reference to Exhibit 3.1 to the Registration Statement on Form S-8 filed withthe SEC on June 16, 2010).
Exhibit 3.2 Amended and Restated Bylaws of Spectrum Brands Holdings, Inc., adopted as of June 16, 2010(incorporated by reference to the Registration Statement on Form S-8 filed with the SEC onJune 16, 2010).
Exhibit 4.1 Specimen certificate for shares of common stock (filed by incorporation by reference toExhibit 4.1 to the Registration Statement on Form 8-A filed with the SEC on May 27, 2010).
Exhibit 4.2 Indenture governing Spectrum Brands, Inc.’s 12% Senior Subordinated Toggle Notes due 2019,dated as of August 28, 2009, among Spectrum Brands, Inc., certain subsidiaries of SpectrumBrands, Inc., as guarantors, and U.S. Bank National Association, as trustee (filed byincorporation by reference to Exhibit 4.1 to the Current Report on Form 8-K filed with the SECby Spectrum Brands, Inc. on August 31, 2009).
170

Exhibit 4.3 Supplemental Indenture, dated March 15, 2010, to the Indenture governing Spectrum Brands,Inc.’s 12% Senior Subordinated Toggle Notes due 2019, dated August 28, 2009, by and amongSpectrum Brands, Inc. the guarantors named therein and U.S. Bank National Association, astrustee (filed by incorporation by reference to Exhibit 4.1 to the Current Report on Form 8-Kfiled with the SEC by Spectrum Brands, Inc. on March 16, 2010).
Exhibit 4.4 Second Supplemental Indenture, dated June 15, 2010, to the Indenture governing SpectrumBrands, Inc.’s 12% Senior Subordinated Toggle Notes due 2019, dated as of August 28, 2009,by and among Spectrum Brands, Inc., Battery Merger Corp. and U.S. Bank NationalAssociation, as trustee (filed by incorporation by reference to Exhibit 4.4 to the QuarterlyReport on Form 10-Q filed with the SEC by Spectrum Brands, Inc. on August 18, 2010).
Exhibit 4.5 Third Supplemental Indenture, dated June 16, 2010, to the Indenture governing SpectrumBrands, Inc.’s 12% Senior Subordinated Toggle Notes due 2019, dated as of August 28, 2009,by and among Spectrum Brands, Inc., Russell Hobbs, Inc. and U.S. Bank National Association,as trustee (filed by incorporation by reference to Exhibit 4.5 to the Quarterly Report onForm 10-Q filed with the SEC by Spectrum Brands, Inc. on August 18, 2010).
Exhibit 4.6 Fourth Supplemental Indenture, dated December 13, 2010, to the Indenture governing SpectrumBrands, Inc.’s 12% Senior Subordinated Toggle Notes due 2019, dated as of August 28, 2009,by and among Spectrum Brands, Inc., Russell Hobbs, Inc. and U.S. Bank National Association,as trustee (filed by incorporation by reference to Exhibit 4.6 to the Annual Report on Form 10-K filed with the SEC by Spectrum Brands, Inc. on December 14, 2010).
Exhibit 4.7 Indenture governing Spectrum Brands, Inc.’s 9.5% Senior Secured Notes due 2018, dated as ofJune 16, 2010, among Spectrum Brands, Inc., the guarantors named therein and US Bank NationalAssociation, as trustee (filed by incorporation by reference to Exhibit 4.6 to the Quarterly Reporton Form 10-Q filed with the SEC by Spectrum Brands, Inc. on August 18, 2010).
Exhibit 4.8 Supplemental Indenture, dated December 13, 2010, to the Indenture governing SpectrumBrands, Inc.’s 9.5% Senior Secured Notes due 2018, dated as of June 16, 2010, amongSpectrum Brands, Inc., the guarantors named therein and US Bank National Association, astrustee (filed by incorporation by reference to Exhibit 4.8 to the Annual Report on Form 10-Kfiled with the SEC by Spectrum Brands, Inc. on December 14, 2010).
Exhibit 10.1 Amended and Restated Employment Agreement, entered into as of October 22, 2009, by andbetween Spectrum Brands, Inc. and Kent J. Hussey (filed by incorporation by reference toExhibit 10.1 to the Current Report on Form 8-K filed with the SEC by Spectrum Brands, Inc. onOctober 28, 2009).
Exhibit 10.2 2009 Spectrum Brands, Inc. Incentive Plan (filed by incorporation by reference to Exhibit 10.1to the Current Report on Form 8-K filed with the SEC by Spectrum Brands, Inc. on August 31,2009).
Exhibit 10.3 Registration Rights Agreement, dated as of August 28, 2009, by and among Spectrum Brands,Inc. and the investors listed on the signature pages thereto, with respect to Spectrum BrandsInc.’s 12% Senior Subordinated Toggle Notes due 2019 (filed by incorporation by reference toExhibit 4.2 to the Current Report on Form 8-K filed with the SEC by Spectrum Brands, Inc. onAugust 31, 2009).
Exhibit 10.4 Registration Rights Agreement, dated as of August 28, 2009, by and among Spectrum Brands,Inc. and the investors listed on the signature pages thereto, with respect to Spectrum Brands,Inc.’s equity (filed by incorporation by reference to Exhibit 4.3 to the Current Report onForm 8-K filed with the SEC by Spectrum Brands, Inc. on August 31, 2009).
Exhibit 10.5 Form of Spectrum Brands, Inc. Restricted Stock Award Agreement under the 2009 IncentivePlan (filed by incorporation by reference to Exhibit 10.2 to the Current Report on Form 8-Kfiled with the SEC by Spectrum Brands, Inc. on October 28, 2009).
171

Exhibit 10.6 Support Agreement, dated as of February 9, 2010 by and among Avenue International Master,L.P., Avenue Investments, L.P., Avenue Special Situations Fund IV, L.P., Avenue SpecialSituations Fund V, L.P., Avenue-CDP Global Opportunities Fund, L.P. and Spectrum Brands,Inc. (filed by incorporation by reference to Exhibit 10.1 to the Current Report on form 8-Kfiled with the SEC by Spectrum Brands, Inc. on February 12, 2010).
Exhibit 10.7 Support Agreement, dated as of February 9, 2010 by and among Harbinger Capital PartnersMaster Fund I, Ltd., Harbinger Capital Partners Special Situations Fund, L.P., GlobalOpportunities Breakaway Ltd. and Spectrum Brands, Inc. (filed by incorporation by referenceto Exhibit 10.2 to the Current Report on form 8-K filed with the SEC by Spectrum Brands,Inc. on February 12, 2010).
Exhibit 10.8 Stockholder Agreement, dated as of February 9, 2010, by and among Harbinger CapitalPartners Master Fund I, Ltd., Harbinger Capital Partners Special Situations Funds, L.P., GlobalOpportunities Breakaway Ltd., and SB/RH Holdings, Inc. (filed by incorporation by referenceto Exhibit 10.5 to the Current Report on form 8-K filed with the SEC by Spectrum Brands,Inc. on February 12, 2010).
Exhibit 10.9 Registration Rights Agreement, dated as of February 9, 2010, by and among Spectrum BrandsHoldings, Inc., Harbinger Capital Partners Master Fund I, Ltd., Harbinger Capital PartnersSpecial Situations Fund, L.P., Global Opportunities Breakaway Ltd., Avenue InternationalMaster, L.P., Avenue Investments, L.P., Avenue Special Situations Fund IV, L.P., AvenueSpecial Situations Fund V, L.P. and Avenue-CDP Global Opportunities Fund, L.P. (filed byincorporation by reference to Exhibit 4.1 to the Registration Statement on Form S-4 filed withthe SEC by Spectrum Brands Holdings, Inc. on March 29, 2010).
Exhibit 10.10 Letter Agreement dated as of March 1, 2010 by and among Harbinger Capital Partners MasterFund I, Ltd., Harbinger Capital Partners Special Situations Fund, L.P., Global OpportunitiesBreakaway Ltd., and Spectrum Brands (filed by incorporation by reference to Exhibit 10.1 tothe Current Report on form 8-K filed with the SEC by Spectrum Brands, Inc. on March 2,2010).
Exhibit 10.11 Separation and Consulting Agreement between Spectrum Brands, Inc. and Kent J. Hussey,dated April 14, 2010 (filed by incorporation by reference to Exhibit 10.1 to the Current Reporton form 8-K filed with the SEC by Spectrum Brands, Inc. on April 15, 2010).
Exhibit 10.12 Credit Agreement dated as of June 16, 2010, by and among Spectrum Brands, Inc. and certainof its domestic subsidiaries, as borrowers, the lenders party thereto and Credit Suisse AG, asadministrative agent (filed by incorporation by reference to Exhibit 10.12 to the QuarterlyReport on Form 10-Q filed with the SEC by Spectrum Brands, Inc. on August 18, 2010).
Exhibit 10.13 Subsidiary Guaranty dated as of June 16, 2010, by and among the subsidiaries of SpectrumBrands, Inc. party thereto, certain additional subsidiary guarantors described therein andCredit Suisse AG, as administrative agent (filed by incorporation by reference to Exhibit 10.13to the Quarterly Report on Form 10-Q filed with the SEC by Spectrum Brands, Inc. onAugust 18, 2010).
Exhibit 10.14 Subsidiary Guaranty Supplement dated as of December 13, 2010, by and among SeedResources, L.L.C. and Credit Suisse AG, as administrative agent (filed by incorporation byreference to Exhibit 10.14 to the Annual Report on Form 10-K filed with the SEC by SpectrumBrands, Inc. on December 14, 2010).
Exhibit 10.15 Guaranty dated as of June 16, 2010, by and among SB/RH Holdings, LLC and Credit SuisseAG, as administrative agent (filed by incorporation by reference to Exhibit 10.14 to theQuarterly Report on Form 10-Q filed with the SEC by Spectrum Brands, Inc. on August 18,2010).
172

Exhibit 10.16 Security Agreement dated as of June 16, 2010, by and among Spectrum Brands, Inc., SB/RHHoldings, LLC, the other grantors party thereto and Wells Fargo Bank, National Association,as collateral trustee (filed by incorporation by reference to Exhibit 10.15 to the QuarterlyReport on Form 10-Q filed with the SEC by Spectrum Brands, Inc. on August 18, 2010).
Exhibit 10.17 Security Agreement Supplement dated as of December 13, 2010, by and among SeedResources, L.L.C. and Wells Fargo Bank, National Association, as collateral trustee (filed byincorporation by reference to Exhibit 10.17 to the Annual Report on Form 10-K filed with theSEC by Spectrum Brands, Inc. on December 14, 2010).
Exhibit 10.18 Loan and Security Agreement dated as of June 16, 2010, by and among Spectrum Brands, Inc.and certain of its domestic subsidiaries, as borrowers, the lenders party thereto and Bank ofAmerica, N.A., as administrative agent (filed by incorporation by reference to Exhibit 10.16 tothe Quarterly Report on Form 10-Q filed with the SEC by Spectrum Brands, Inc. onAugust 18, 2010).
Exhibit 10.19 Joinder Agreement to Loan and Security Agreement and Other Loan Documents dated as ofDecember 13, 2010, by and among Seed Resources, L.L.C., Spectrum Brands, Inc., RussellHobbs, Inc., the subsidiaries of Spectrum Brands, Inc. party to the Loan and SecurityAgreement as borrowers, SB/RH Holdings, LLC and Bank of America, N.A. (filed byincorporation by reference to Exhibit 10.19 to the Annual Report on Form 10-K filed with theSEC by Spectrum Brands, Inc. on December 14, 2010).
Exhibit 10.20 Guaranty dated as of June 16, 2010, by and among the guarantors described therein andBank of America, N.A., as administrative agent (filed by incorporation by reference toExhibit 10.17 to the Quarterly Report on Form 10-Q filed with the SEC by Spectrum Brands,Inc. on August 18, 2010).
Exhibit 10.21 Collateral Trust Agreement dated as of June 16, 2010, by and among Spectrum Brands, Inc.,SB/RH Holdings, LLC, the other grantors party thereto, Credit Suisse AG, Cayman IslandsBranch, as administrative agent, U.S. Bank National Association, as indenture trustee, andWells Fargo Bank, National Association, as collateral trustee (filed by incorporation byreference to Exhibit 10.18 to the Quarterly Report on Form 10-Q filed with the SEC bySpectrum Brands, Inc. on August 18, 2010).
Exhibit 10.22 Intercreditor Agreement dated as of June 16, 2010, by and among Spectrum Brands, Inc., SB/RH Holdings, LLC, the other grantors party thereto, Bank of America, N.A., as ABL agent,and Wells Fargo Bank, National Association, as term/notes agent (filed by incorporation byreference to Exhibit 10.19 to the Quarterly Report on Form 10-Q filed with the SEC bySpectrum Brands, Inc. on August 18, 2010).
Exhibit 10.23 Joinder and Supplement to Intercreditor Agreement dated as of December 13, 2010, by andamong Seed Resources, L.L.C., Spectrum Brands, Inc., Bank of America, N.A., as collateralagent and administrative agent, and Wells Fargo Bank, National Association, as collateralagent and trustee (filed by incorporation by reference to Exhibit 10.23 to the Annual Report onForm 10-K filed with the SEC by Spectrum Brands, Inc. on December 14, 2010).
Exhibit 10.24 Trademark Security Agreement dated as of June 16, 2010, by and among the loan parties partythereto and Wells Fargo Bank, National Association, as collateral trustee (filed byincorporation by reference to Exhibit 10.20 to the Quarterly Report on Form 10-Q filed withthe SEC by Spectrum Brands, Inc. on August 18, 2010).
Exhibit 10.25 Trademark Security Agreement dated as of December 13, 2010, by and among SeedResources, L.L.C. and Wells Fargo Bank, National Association, as collateral trustee (filed byincorporation by reference to Exhibit 10.25 to the Annual Report on Form 10-K filed with theSEC by Spectrum Brands, Inc. on December 14, 2010).
173

Exhibit 10.26 Trademark Security Agreement dated as of December 13, 2010, by and among SeedResources, L.L.C. and Bank of America, N.A., as collateral agent and administrative agent(filed by incorporation by reference to Exhibit 10.26 to the Annual Report on Form 10-K filedwith the SEC by Spectrum Brands, Inc. on December 14, 2010).
Exhibit 10.27 Copyright Security Agreement dated as of June 16, 2010, by and among the loan parties partythereto and Wells Fargo Bank, National Association, as collateral trustee (filed byincorporation by reference to Exhibit 10.21 to the Quarterly Report on Form 10-Q filed withthe SEC by Spectrum Brands, Inc. on August 18, 2010).
Exhibit 10.28 Patent Security Agreement dated as of June 16, 2010, by and among the loan parties partythereto and Wells Fargo Bank, National Association, as collateral trustee (filed byincorporation by reference to Exhibit 10.22 to the Quarterly Report on Form 10-Q filed withthe SEC by Spectrum Brands, Inc. on August 18, 2010).
Exhibit 10.29 Patent Security Agreement dated as of December 13, 2010, by and among Seed Resources,L.L.C. and Wells Fargo Bank, National Association, as collateral trustee (filed byincorporation by reference to Exhibit 10.29 to the Annual Report on Form 10-K filed with theSEC by Spectrum Brands, Inc. on December 14, 2010).
Exhibit 10.30 Patent Security Agreement dated as of December 13, 2010, by and among Seed Resources,L.L.C. and Bank of America, N.A., as collateral agent and administrative agent (filed byincorporation by reference to Exhibit 10.30 to the Annual Report on Form 10-K filed with theSEC by Spectrum Brands, Inc. on December 14, 2010).
Exhibit 10.31 Amended and Restated Employment Agreement, entered into as of August 11, 2010, by andamong Spectrum Brands, Inc., Spectrum Brands Holdings, Inc. and David R. Lumley (filed byincorporation by reference to Exhibit 10.1 to the Current Report on Form 8-K filed with theSEC by Spectrum Brands Holdings, Inc. on August 17, 2010).
Exhibit 10.32 First Amendment, dated as of November 16, 2010, to the Employment Agreement, dated as ofAugust 11, 2010, by and among Spectrum Brands, Inc., Spectrum Brands Holdings, Inc. andDavid R. Lumley (filed by incorporation by reference to Exhibit 10.1 to the Current Report onForm 8-K filed with the SEC by Spectrum Brands Holdings, Inc. on November 22, 2010).
Exhibit 10.33 Retention Agreement, entered into as of August 11, 2010, by and between Spectrum Brands, Inc.and Anthony Genito (filed by incorporation by reference to Exhibit 10.2 to the Current Report onForm 8-K filed with the SEC by Spectrum Brands Holdings, Inc. on August 17, 2010).
Exhibit 10.34 Employment Agreement, effective June 9, 2008, by and between Spectrum Brands, Inc. andAnthony L. Genito (filed by incorporation by reference to Exhibit 10.15 to the QuarterlyReport on Form 10-Q for the quarterly period ended June 29, 2008, filed with the SEC bySpectrum Brands, Inc. on August 8, 2008).
Exhibit 10.35 Amendment to the Employment Agreement, effective as of February 24, 2009, by andbetween Spectrum Brands, Inc. and Anthony L. Genito (filed by incorporation by reference toExhibit 10.22 to the Annual Report on Form 10-K for the fiscal year ended September 30,2009, filed with the SEC by Spectrum Brands, Inc. on December 29, 2009).
Exhibit 10.36 Description of Second Amendment to the Employment Agreement, effective as of August 28,2009, by and between Spectrum Brands, Inc. and Anthony L. Genito (filed by incorporation byreference to Exhibit 10.23 to the Annual Report on Form 10-K filed with the SEC by SpectrumBrands, Inc. on December 29, 2009).
Exhibit 10.37 Third Amendment, dated as of November 16, 2010, to the Employment Agreement, dated asof June 9, 2008, by and among Spectrum Brands, Inc. and Anthony L. Genito (filed byincorporation by reference to Exhibit 10.3 to the Current Report on Form 8-K filed with theSEC by Spectrum Brands Holdings, Inc. on November 22, 2010).
174

Exhibit 10.38 Employment Agreement, entered into as of August 16, 2010, by and between SpectrumBrands, Inc. and Terry L. Polistina (filed by incorporation by reference to Exhibit 10.25 to theQuarterly Report on Form 10-Q filed with the SEC by Spectrum Brands Holdings, Inc. onAugust 18, 2010).
Exhibit 10.39 First Amendment, dated as of November 16, 2010, to the Employment Agreement, dated as ofAugust 16, 2010, by and among Spectrum Brands, Inc. and Terry L. Polistina (filed byincorporation by reference to Exhibit 10.2 to the Current Report on Form 8-K filed with theSEC by Spectrum Brands Holdings, Inc. on November 22, 2010).
Exhibit 10.40 Amended and Restated Employment Agreement, effective as of January 16, 2007, by andbetween Spectrum Brands, Inc. and John A. Heil (filed by incorporation by reference toExhibit 10.1 to the Current Report on Form 8-K filed with the SEC by Spectrum Brands, Inc.on January 19, 2007).
Exhibit 10.41 Amendment to the Amended and Restated Employment Agreement, dated as of November 10,2008, by and between Spectrum Brands, Inc. and John A. Heil (filed by incorporation byreference to Exhibit 10.7 to the Annual Report on Form 10-K filed with the SEC by SpectrumBrands, Inc. on December 10, 2008).
Exhibit 10.42 Second Amendment to the Amended and Restated Employment Agreement, effective as ofFebruary 24, 2009, by and between Spectrum Brands, Inc. and John A. Heil (filed byincorporation by reference to Exhibit 10.11 to the Annual Report on Form 10-K filed with theSEC by Spectrum Brands, Inc. on December 29, 2009).
Exhibit 10.43 Description of Third Amendment to the Amended and Restated Employment Agreement ofJohn A. Heil, effective as of August 28, 2009 (filed by incorporation by reference toExhibit 10.12 to the Annual Report on Form 10-K filed with the SEC by Spectrum Brands,Inc. on December 29, 2009).
Exhibit 10.44 Fourth Amendment, dated as of November 16, 2010, to the Amended and RestatedEmployment Agreement, dated as of January 16, 2007, by and among Spectrum Brands, Inc.and John A. Heil (filed by incorporation by reference to Exhibit 10.4 to the Current Report onForm 8-K filed with the SEC by Spectrum Brands Holdings, Inc. on November 22, 2010).
Exhibit 10.45 Spectrum Brands Holdings, Inc. 2007 Omnibus Equity Award Plan (formerly known as theRussell Hobbs, Inc. 2007 Omnibus Equity Award Plan) (filed by incorporation by reference toExhibit 10.1 to the Registration Statement on Form S-8 filed with the SEC by SpectrumBrands Holdings, Inc. on June 16, 2010).
Exhibit 21.1 Subsidiaries of Registrant.*
Exhibit 23.1 Consent of Independent Registered Public Accounting Firm.*
Exhibit 31.1 Certification of Chief Executive Officer required by Rule 13a-14(a) or Rule 15d-14(a) of theSecurities and Exchange Act of 1934, as adopted pursuant to Section 302 of the Sarbanes-Oxley Act of 2002.*
Exhibit 31.2 Certification of Chief Financial Officer required by Rule 13a-14(a) or Rule 15d-14(a) of theSecurities and Exchange Act of 1934, as adopted pursuant to Section 302 the Sarbanes-OxleyAct of 2002.*
Exhibit 32.1 Certification of Chief Executive Officer pursuant to 18 U.S.C. Section 1350, as adoptedpursuant to Section 906 of the Sarbanes-Oxley Act of 2002.*
Exhibit 32.2 Certification of the Chief Financial Officer pursuant to 18 U.S.C. Section 1350, as adoptedpursuant to Section 906 of the Sarbanes-Oxley Act of 2002.*
* Filed herewith
175

[THIS PAGE INTENTIONALLY LEFT BLANK]
[THIS PAGE INTENTIONALLY LEFT BLANK]

[THIS PAGE INTENTIONALLY LEFT BLANK]

SHAREHOLDER INFORMATION
INVESTOR AND SHAREHOLDER CONTACTDavid A. PrichardVice President, Investor Relationsand Corporate [email protected]
COMPANY INFORMATIONCopies of the Annual Report, the Annual Report on Form 10-K and quarterly reports on Form 10-Q may be obtained, without charge, by writing to Investor Relations at the corporate headquarters address, by calling 608.275.3340, by email at [email protected] or by visiting our Company’s web site atspectrumbrands.com.
BUSINESS UNIT WEB SITESrayovac.comvarta-consumer.comremingtonproducts.comunitedindustries.comunitedpetgroup.comrussellhobbsinc.com
ANNUAL MEETING OF SHAREHOLDERSThe 2011 Annual Meeting of Shareholders will be held on Tuesday, March 1, 2011 at 8:00 a.m. local time at Paul, Weiss, Rifkind, Wharton & Garrison LLP, 1285 Avenue of the Americas, New York City, NY 10019. A formal notice of that meeting, proxy state-ment and proxy voting card are being made available to shareholders in accordance with U.S. Securities and Exchange Commission regulations.
INDEPENDENT REGISTERED PUBLIC ACCOUNTING FIRMKPMG LLP303 Peachtree Street, N.E.Suite 2000Atlanta, GA 30303404.222.3000
BOARD COMMUNICATIONInterested parties may communicate directly with any member of our Board of Directors by writing in care of Corporate Secretary, Spectrum Brands Holdings, Inc., 601 Rayovac Drive, Madison, WI 53711.
NEW YORK STOCK EXCHANGE COMPLIANCEOn June 16, 2010, we submitted to the New York Stock Exchange an interim written affi rmation stating that we are in compliance with the NYSE corporate governance listing standards. Within 30 days following the date of our Annual Meeting of Shareholders, we will also submit a certifi cation signed by our Chief Executive Offi cer stating that he is not aware of any violation by us of the NYSE corporate governance listing standards. In addition, the certifi cations signed by our Chief Executive Offi cer and our Chief Financial Offi cer required under Section 302 of the Sarbanes-Ox-ley Act of 2002 were fi led as exhibits to our Annual Report on Form 10-K for the year ended September 30, 2010.
SAFE HARBORCertain statements in this Annual Re-port that are neither reported fi nancial results nor other historical information are forward-looking statements. Such forward-looking statements are not guarantees of future performance and are subject to risks and uncertainties that could cause actual results and Company plans and objectives to differ materially from those expressed in the forward-looking statements.
Copyright ©2011 Spectrum Brands Holdings, Inc. All Rights Reserved.
CORPORATE HEADQUARTERSSpectrum Brands Holdings, Inc.601 Rayovac DriveMadison, WI 53711608.275.3340608.288.4518 faxspectrumbrands.com
STOCK EXCHANGEThe common shares of Spectrum Brands Holdings, Inc. trade on the New York Stock Exchange under the ticker symbol SPB. Our Company is a member of the Russell 2000 Index.
SHAREHOLDERSAs of December 31, 2010, there were 17 shareholders of record. Our Company estimates there were approximately 1,890 benefi cial shareholders.
TRANSFER AGENT AND REGISTRARThe Bank of New York Mellon 877.419.8543 or 201.680.6685 (outside the U.S. and Canada) or 800.231.5469 (hearing impaired – TTY phone) [email protected] www.bnymellon.com/shareowner/isd
SHAREHOLDER ASSISTANCEGeneral shareholder inquiries: Spectrum Brands Holdings, Inc. c/o BNY Mellon Shareowner Services 480 Washington Boulevard Jersey City, NJ 07310-1900
Send certifi cates for transfer and address changes to: Spectrum Brands Holdings, Inc.c/o BNY Mellon Shareowner Services P.O. Box 358015 Pittsburgh, PA 15252-8015
This annual report was printed on FSC®-certifi ed NewPage Sterling Ultra matte cover and text, and Domtar Opaque, which contain 10% post-consumer waste.

601 Rayovac Drive, Madison, WI 53711608.275.3340
spectrumbrands.com