spectrum-line analysis magnesium spinel/ sapphire€¦ · 1 spectrum-line profile analysis of a...
TRANSCRIPT
1
Spectrum-Line Profile Analysis of a Magnesium Aluminate Spinel/Sapphire Interface
John Bruley, Ming-Wei Tseng and David B. Williams
Whitaker Laboratory 5 packes Av., Department of Materials Science and Engineering, Lehigh Uni-versity,Bethlehem, Pa 18017
(Received November 16,1994; accepted February 10,1995)
Abstract. 2014 Spatially resolved chemical composition and spectroscopic line profiles have been gath-ered from the space charge region across a spinel/sapphire interface using a dedicated scanning trans-mission electron microscope. The electron energy-loss spectra reveal an excess of Mg (relative tostoichiometric spinel) along with Cr segregated to the interfacial zone. A quantitative least squaresdecomposition of a spectrum-line profile of the Al L2, 3 absorption edge fine structures into two stan-dard components clearly highlights the transition from sapphire into spinel; further analysis indicatesthat the degree of site inversion, which is the fractional occupancy of tetrahedral sites by trivalent Al,increases within 5 nm of the boundary. The overall charge neutrality at the interface is maintained bythe increased concentration of negative charge, probably interstitial O anions which are also presentin excess quantity relative to stoichiometric spinel and sapphire.
Microsc. Microanal. Microstruct. 6 (1995) 1-18 FEBRUARY 1995, PAGE
Classification
Physics Abstracts61.70W - 68.48 - 78.70D - 73.40L - 68.22
1. Introduction
The transient liquid phase bonding of a Haynes 230 nickel based superalloy and sapphire fibercomposite, processed at a temperature of 1200 ° C and a pressure of 14 MPa, results in significantinterfacial chemical reaction between the components. The high temperature creep and fractureproperties of such composites are strongly influenced by the product phases and their interfacesto both the ceramic and metal matrix [1-5]. To aid future material development, characteriza-tion of these interfacial regions is therefore considered important. Trace amounts of magnesiumdissolved in an alloy will react with the sapphire to form a stoichiometric magnesium aluminatespinel phase [6-8]; and this is observed in the aforementioned composite. In the vicinity of thespinel/sapphire interface the environment will deviate substantially from bulk equilibrium valuesdue to the build up of charged defects and segregation of impurities which occurs during nu-cleation and growth [9]. It is upon this boundary which we have chosen to focus our attention,using the spectrum-line profile technique of spatially resolved electron energy-loss spectroscopy(SREELS).The nature of the interface between sapphire (a-A1203) and spinel (MgO.nA1203) is of gen-
Article available at http://mmm.edpsciences.org or http://dx.doi.org/10.1051/mmm:1995103
2
eral interest because of its widespread occurrence in many structural materials systems. Throughchanges in its stoichiometry and exchange in cation sites, spinel is able to accommodate ratherlarge concentrations of charged point defects. This is in contrast to a-A1203, whose defectstructure is mostly extrinsic. Atomic transport and interface energy are clearly related to de-fect chemistry but a correlation between the detailed atomic structure, the chemical bonding, thestoichiometry, cation disorder, and impurity solute segregation is still poorly understood becauseof the difficulty of getting informative data. Chiang and co-workers [10,11] have shown there tobe a strong influence of chemical composition and space charge on the grain boundary mobilityof magnesium aluminate spinels during heat treatments and a number of groups (for example [3,12-19]) have paid attention to elucidating the detailed atomic structures at various ceramic-oxideinterfaces and grain boundaries. In particular, Li et al. [20] have recently described the atomicstructure of the magnèsium aluminate/sapphire boundary formed between a MgO / Alz 03 coupleby a solid state interdiffusion process that had been activated by the irradiation of the electronmicroscope. To date, there has not been much work focused on determining the chemical andelectronic properties of these interfaces at (or near) the atomic level [21, 22].The current studies were conducted to examine the extent to which SREELS can be used to
map point defect distributions. We investigate whether the technique can be used to extract thedegree of inversion of a spinel and to what extent this information can be used to map the siteoccupancy across the spinel/sapphire boundary. The preliminary assessment is carried out withthe Al L2,3 absorption edge recorded from a series of spinel standards, selected for their knownrange of tetrahedral and octahedral occupancies. The same data analysis is applied to standardspectra as to those acquired in a linescan across the heterophase interface.
2. Background
2.1 CRYSTAL STRUCTURES AND POINT DEFECTS. - The crystal structure of spinel is cubic(ao= 0.808 nm) with a unit cell containing a close packed array of 32 oxygen anions or 8 formulaunits. In normal spinel one half of the 32 six-fold coordination interstices (the B or octahedralsites), are occupied by trivalent Al cations and 8 of the four-fold coordination positions (the A ortetrahedral sites) are occupied by divalent Mg cations. At elevated temperatures the cations mayexchange sites, leading to partially inverse spinel. The degree of cation inversion, i, is defined asthe fraction of tetrahedral sites occupied by the trivalent Al. For natural spinels this fraction issmall « 0.05 [23, 24]) since they have cooled and equilibrated over geological time-scales. An in-version parameter of 1 corresponds to inverse spinel, where substitution of half of the Al ions withthe Mg ions occurs. A statistically random distribution of cations leads to an inversion parameterof two thirds. Synthetic spinels held at room temperature have been reported to exhibit i rangingbetween 0.1 and 0.3 [23-30]. There has been a great deal of discussion over the space group ofspinel, namely whether it is Fd3m or F43m [29-33]. The controversy concerns small cation dis-placements which remove the center of inversion at the B-sites. Since any cation displacementsare expected to be rather small they will have, at most, a rather modest effect on the chemicalbonding and therefore the electron energy-loss spectra. No further attention is paid to this issuehere.
The solubility of A1203 in spinel increases as temperature rises over about 1 000 °C [34]. Dis-solution of A1203 leads to significant non-stoichiometry with Al3+ cations occupying tetrahedralsites (designated as Al2022Mg in Kroger-Vink notation [35]). In the bulk, the excess unit positive chargeof each trivalent cation occupying a bivalent site is compensated by the accompanying formationof a suitable number of negatively charged cation vacancies which may be either on octahedral(V’’’Al, with a formai net charge of 3-) or tetrahedral sites (V"Mg, with formai net charge of 2-). From

3
NMR measurements, it was concluded that the vacancies predominantly occupy the octahedralB sites even though there is only a very slight difference in energy between the two possibilities[36]. There is also a strong possibility of significant ordering of the cation vacancies, evidenced bycalorimetric measurements [24, 26]. Concerning the presence of cation interstitial defects, unpub-lished calculations by Mackrodt (reported in Ref. [11]) indicate that formation energies are high(3 - 6 eV) so that there will be insignificant concentrations of these defects under standard tem-peratures and pressures. In contrast to the solubility of A1203, there is only moderate solubility ofMgO into spinel even at high temperatures. In this case, accommodation of the excess negativecharge of bivalent Mg occupying octahedral sites (Mg’Al) is accomplished either by creation of 0vacancies (vs) or cation interstitials (Mg" or Al.7.).
Sapphire (or a-AI203) possesses the corundum structure, being composed of an hexagonalclose packed array of oxygen ions, with trivalent Al cations occupying two thirds of the availableoctahedral sites between the basal planes. The very high vacancy and interstitial formation ener-gies of a-A1203 result in very low point defect concentrations at standard temperatures [37].The composition and structure of A1203 surfaces and interfaces have been the topic of numer-
ous studies and are found to be strongly dependent upon the ambient environment [3, 16, 38-45].In conditions of high oxygen partial pressure, most surfaces are believed to be oxygen terminated.When bonded directly to a metal, the oxygen can form direct localized metal-oxide bonds and,if present as excess charge ionic defects, they can lead to electrostatic-images in the metal whichgenerate attractive forces [46, 47]. The growth of an ionic spinel in the presence of the electro-static potential of such interface charge will most likely generate a space charge region dependentupon the nucleation conditions.
2.2 ELECTRON SPECTROSCOPIC CHARACTERIZATION OF SPINELS. - Previous electron energy-loss studies of mineral standards led to the identification of characteristic Al and Mg-K near-edgestructures as chemical fingerprints of octahedral and tetrahedral coordination [48]. This concepthas been extensively developed by Brydson and others in the characterization of Al and Si oxides[49-55]. The site occupancy of spinel was investigated by making use of electron channeling andoff-axis collection to increase site-selection specificity of the energy-loss signal [56-59]. These
experiments all used broad beam techniques and, therefore, are difficult to apply to interfaces.Atom location by channeling enhanced microanalysis using X-ray spectroscopy has likewise
been used to characterize normal and inverse spinels, although again without high spatial res-olution [60]. Typically three atoms, one of known site occupancy, are required to identify siteinversion. A recent application to magnesium aluminate spinel using the 0, Mg and Al signals isdescribed by Qian et al. [59, 61]. It is also possible, in theory, to distinguish inverse from normalspinel by quantitative analysis and refinement of diffraction patterns. In practice however, thescattering power of Al and Mg are similar, making it rather difficult. A spatially resolved series ofelectron nanodiffraction patterns across a spinel/MgO interface was presented though no detailsof inversion were investigated at that time [62].The current work relies heavily on the premise that the local symmetry and nearest neighbor
coordination dominates the Al L2,3 energy-loss near edge fine structure (ELNES). In the smallangle or dipole limit, the L2,3 ELNES corresponds to transitions of bound electrons from inner-shell p orbitals into vacant states of s- and d-like symmetry. Brydson and co-workers have studiedthe edge structures of numerous minerals where the cation sites are believed to be well known[49-54]. From these systematic studies "fingerprints " were identified for 6-fold, 5-fold and 4-foldcoordination of Al and Si each’surrounded by 0 (the electronic structures of Al, Mg, and Si ox-ides are all very similar). Real-space multiple scattering calculations to simulate edge shapes forsingle shell clusters provides a reasonable agreement between the theory and experiment. 6-foldcoordination is marked by an intense, relatively sharp peak at onset consisting primarily of Al s

4
states whereas 4-fold coordination gives rise to a much broader resonance. If the chemical bond-ing in spinel was localized to nearest neighbor interactions only, the mixed coordination exhibitedby partially inverse spinels would be expected to yield a doublet edge structure. Recently, Tanakaet al. [63] performed a first principles discrete variational Xa molecular orbital calculation of asmall cluster of Si02 involving a central tetrahedrally coordinated Si ion surrounded by 4 simi-larly coordinated tetrahedra. Results suggest that whilst the first coordination shell (i.e. Si - 04)dominates the structure, next-nearest neighbor interactions do introduce neighboring cation siteband hybridization which broadens and lifts state degeneracies in the conduction bands, therebyexplaining the multiplicity of peaks in the edge structure. Other electron structure calculationshave been carried out for MgA1204 [64] and A1203 [64-69], and for molecules and small clus-ters [70-73]. However, symmetry and site projections of the density of states are either not yetavailable or do not provide a good fit to the data. An added complication to the interpretationof the near edge structure of oxides is the relatively strong many electron core-hole excitonic in-teraction. This removes the translational symmetry at the central atom and makes a one-to-onecorrespondence between one-electron band structure and the experimental near edge structurerather unlikely [74, 75]. For the purpose of the current study however, localization brought aboutby the tightly bound exciton probably enhances the sought after site selectivity.
3. Methods
3.1 THE SPINEL/SAPPHIRE INTERFACE. - During of the transient liquid bonding process of aHaynes 230 nickel based superalloy matrix-sapphire fiber composite, micron sized stoichiometricspinel protrusions were formed over a large fraction of the sapphire fiber surfaces. One suchprotrusion is illustrated in Figure 1. The fabrication process was carried out at 1 200 °C, undera pressure of 14 MPa for 2 hours. Whilst Haynes 230 and its additives contains a wide range ofelements, including Ni, Cr, W, Mo, Co, Fe, C, Si, La, B, Mn, Mg and Cu only Mg, Al, Cr and 0were observed within these spinel zones and there was no evidence for preferential segregation ofother impurities to the spinel/fiber interface. The typical sensitivity limit of the EDX spectroscopysurveying technique used is estimated to be about 0.5 at.% for most elements. A more completeaccount of the chemistry of this complex metal/ceramic composite system is given in a Ph. D.Thesis by one of these authors (M.WT). Here we are concerned only with the nature of themagnesium aluminate spinel and its interface to the sapphire substrate. The sample was preparedfor TEM observation using standard techniques of mechanical grinding followed by ion-milling.
3.2 STANDARDS. - To examine the effects of defects and cation inversions on the near edgestructures, two natural spinel crystals, one synthetic stoichiometric (MgO.AlZ03) and one syn-thetic non-stoichiometric (Mg0.2A1203) magnesium aluminate crystals, and a 1’-AlZ03 samplewere studied. All standards were examined in powdered form, prepared by crushing small piecesof the spinel into a suspension of acetone and collecting on a lacy carbon film. In the microscope,only thin areas of crystal suspended over holes in the support were studied.
3.3 MICROSCOPY. - The samples were examined in a VG. Microscopes’ HB501 dedicatedscanning transmission electron microscope operating at 100 keV The spectra were acquired witha Gatan model 666 parallel electron energy loss spectrometer, controlled by a Mac II computerrunning Gatan’s proprietary EL/P software. The conditions for collecting the Mg and Al L2,3 andthe 0 K edges were such that the beam semi-angle incident on the sample was about 8 mrad andthe spectrometer collection semi-angle was about 16 mrad. This provided an incident probe-sizeof about 1 nm and a beam current of about 0.3 nA. For the Mg and Al K edges, the incident beam

5
Fig. 1. - Low magnification bright field image of the spinel protrusion resulting from reaction during thetransient liquid phase bonding of Haynes 230 superalloy/sapphire fiber composite. Back area in bottom leftcorner is due poor electron transmission through the significant mass thickness of the metal matrix.
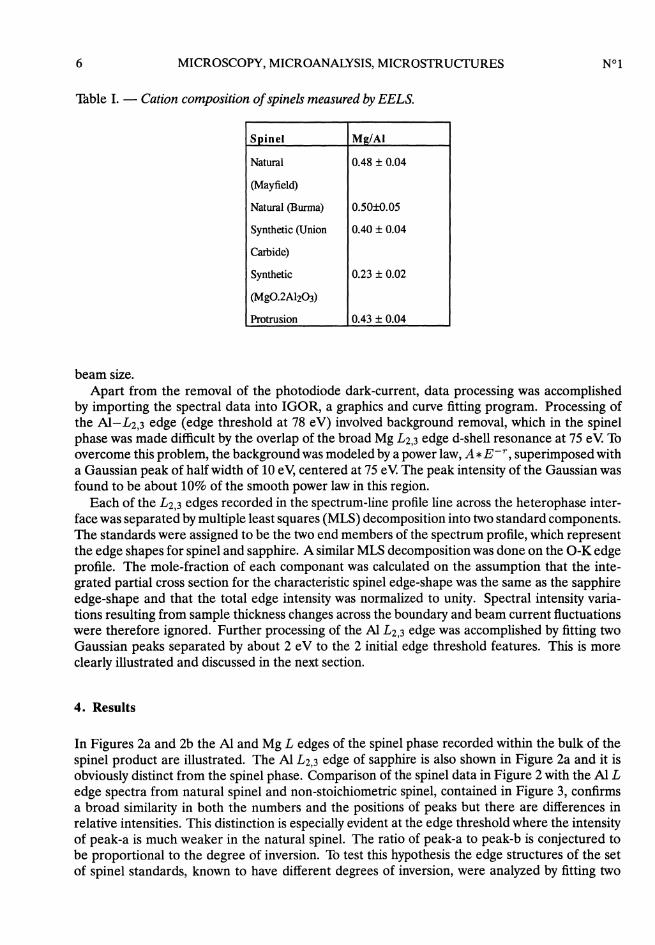
and collection semi-angles were increased to 16 and 32 mrad, respectively, and the beam currentwas increased to about 1 nA. The probe size on the sample in this instance was of the order ofseveral nanometers. The stoichiometry of the bulk spinel phases were measured using the 0, Aland Mg K edges. Since this did not require high spatial resolution, the beam was scanned over an100 nm2 area to minimize the possibility of artifacts due to beam damage. The measured intensityratios were converted to atomic ratios using the hydrogenic cross-sections, available within EL/P.The results are tabulated in Table I.
Spectrum-line profiles were made with the aid of a custom function written for EL/P by Duscher,of the Max-Planck-Institut für Metallforschung in Stuttgart. Using this function, a series of spec-tra can be acquired with the electron beam scanning across the interface. The spectra are storeddirectly to the computer memory. The speed of the electron beam crossing the interface was con-trolled using the microscope’s time base. Both the number of spectra and the read-out time perspectrum were adjusted so that the total acquisition time matched the time taken for the beamto scan across the microscope screen which was usually set to be 80 s. The distance traveled bythe beam is controlled by the microscope magnification. At 10 million times magnification thewidth of the full screen corresponds to about 13 nm. The individual spectra in the series can besubsequently analyzed using conventional data analysis routines. The accumulation time for eachspectrum was typically 3 s with approximately 10 thousand counts per readout. Each spectrum inthe profiles presented here corresponds to a lateral pixel size of 0.5 nm, which is smaller than the
6
Table 1. - Cation composition of spinels measured by EELS.
beam size.
Apart from the removal of the photodiode dark-current, data processing was accomplishedby importing the spectral data into IGOR, a graphics and curve fitting program. Processing ofthe Al-L2,3 edge (edge threshold at 78 eV) involved background removal, which in the spinelphase was made difficult by the overlap of the broad Mg L2,3 edge d-shell resonance at 75 eV Toovercome this problem, the background was modeled by a power law, A * E - r, superimposed witha Gaussian peak of half width of 10 eV, centered at 75 eV The peak intensity of the Gaussian wasfound to be about 10% of the smooth power law in this region.
Each of the L2,3 edges recorded in the spectrum-line profile line across the heterophase inter-face was separated by multiple least squares (MLS) decomposition into two standard components.The standards were assigned to be the two end members of the spectrum profile, which representthe edge shapes for spinel and sapphire. A similar MLS decomposition was done on the O-K edgeprofile. The mole-fraction of each componant was calculated on the assumption that the inte-grated partial cross section for the characteristic spinel edge-shape was the same as the sapphireedge-shape and that the total edge intensity was normalized to unity. Spectral intensity varia-tions resulting from sample thickness changes across the boundary and beam current fluctuationswere therefore ignored. Further processing of the Al L2,3 edge was accomplished by fitting twoGaussian peaks separated by about 2 eV to the 2 initial edge threshold features. This is moreclearly illustrated and discussed in the next section.
4. Results
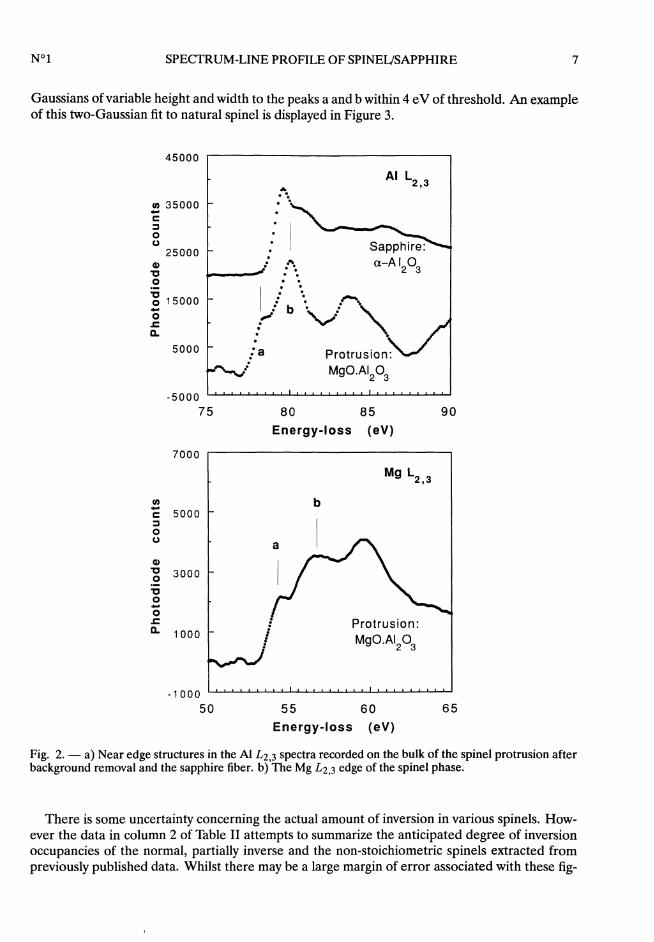
In Figures 2a and 2b the Al and Mg L edges of the spinel phase recorded within the bulk of thespinel product are illustrated. The Al L2,3 edge of sapphire is also shown in Figure 2a and it isobviously distinct from the spinel phase. Comparison of the spinel data in Figure 2 with the Al Ledge spectra from natural spinel and non-stoichiometric spinel, contained in Figure 3, confirmsa broad similarity in both the numbers and the positions of peaks but there are differences inrelative intensities. This distinction is especially evident at the edge threshold where the intensityof peak-a is much weaker in the natural spinel. The ratio of peak-a to peak-b is conjectured tobe proportional to the degree of inversion. To test this hypothesis the edge structures of the setof spinel standards, known to have different degrees of inversion, were analyzed by fitting two
7
Gaussians of variable height and width to the peaks a and b within 4 eV of threshold. An exampleof this two-Gaussian fit to natural spinel is displayed in Figure 3.
Fig. 2. - a) Near edge structures in the Al L2,3 spectra recorded on the bulk of the spinel protrusion afterbackground removal and the sapphire fiber. b) The Mg L2,3 edge of the spinel phase.
There is some uncertainty concerning the actual amount of inversion in various spinels. How-ever the data in column 2 of Table II attempts to summarize the anticipated degree of inversionoccupancies of the normal, partially inverse and the non-stoichiometric spinels extracted frompreviously published data. Whilst there may be a large margin of error associated with these fig-

8
Fig. 3. - a) Near edge structures of the Al L2,3 spectra of natural spinel (Mayfield) and non-stoichiometricspinel (MgO.2Alz03)’ b) The Mg L2,3 edge of natural spinel.
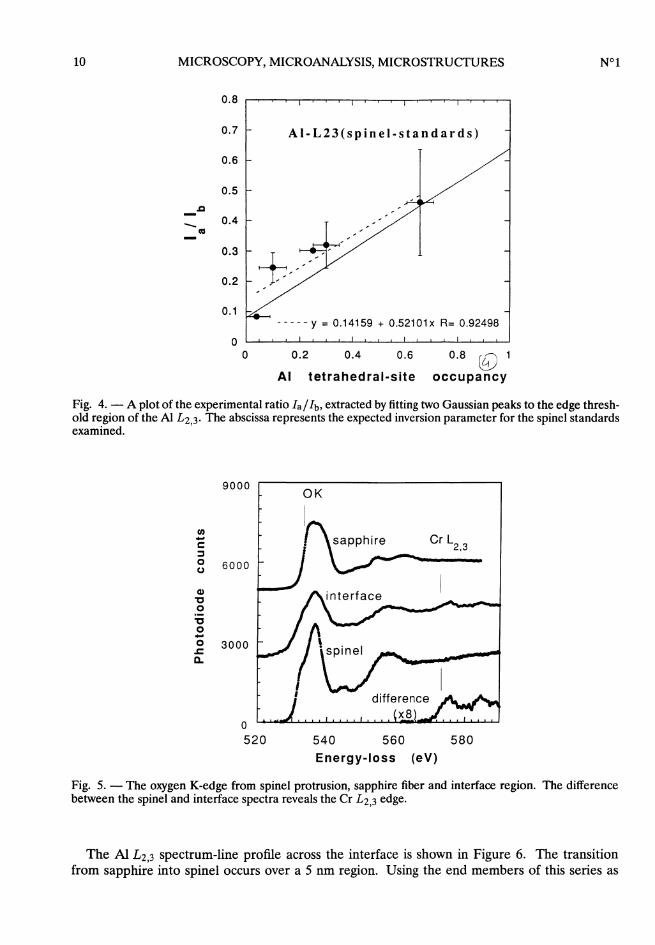
ures the relative trend should be correct. The results of the peak-a to peak-b intensity ratios,Ia/Ib, are given in Table II and plotted against the expected inversion parameter for the stan-dard spinel, show in Figure 4. The dashed line is the linear regression fit to the data and gives(Ia/Ib)meas. = 0.52 i+0.14. To draw the solid line it was assumed that the ratio varied linearly be-tween the extrema of normal and inverse spinel. These end points were determined as follows:Instead of the nominal inversion of 0.05 (given in Tab. II), the assumption is made that naturalspinel is perfectly normal, i.e. the Mg ions occupy only tetrahedral sites, and Al ions only octahe-dral sites. Accordingly, the Mg L2,3 edge shape and its experimental Ia/Ib ratio which is found to

9
be equal to 0.64, represents 100% tetrahedral occupancy and the Ia/Ib value for the Al L2,3 edge(equal to 0.08) represents 100% octahedral occupancy. Two observations are made: The firstconcems the small but finite intensity of peak-a in natural spinel despite a presumed inversion pa-rameter close to zero. We note this peak is absent in a-A1203. A likely explanation for this stemsfrom orbital overlap of an octahedral Al site with neighboring tetrahedral cation sites (in normalspinel there are 6 tetrahedrally bound Mg ions at a distance of 0.33 nm). Another reason maylie in a modification in the symmetry defined selection rules or in excitonic interactions in spinelwith respect to corundum. The second observation concerns the slope of the fit. If the proposedsimple model correlating bimodal site occupancy with electronic state density were correct, onemight have expected the extreme limits of the peak intensity ratio to be set by the atomic fractionof Al on tetrahedral sites. In stoichiometric spinel an inverse parameter, i, equal to 1 correspondsto an atomic fraction on tetrahedral sites of 1/2 and the ratio (Ia/Ib)meas. should thus vary accord-ing the relationship (la/lb)meas. = 0.56 i/2 + 0.08 and not (Ia/Ib)meas. = 0.56 i+0.08 as shown bythe solid line in Figure 4. A reason for this discrepancy may again lie in next-nearest neighbor in-teractions, or be due to ordered clustering of point defects which affect the local density of states.A full explanation awaits simulation of these edge structures in normal and defect spinels. For thepresent, we ignore these distinctions and assume the empirical linear proportionality from normalto inverse spinel.
Table II. - Expected inversion parameters for standard spinels.
The 0 K-edge, at 530 eV, also exhibits near edge structures characteristic of either spinel orsapphire. Figure 5 shows the two edge shapes recorded in bulk regions of the spinel and fiber.Detailed examination of the edge at 570 eV indicates the presence of a small concentration ofdissolved Cr in the spinel, which is clearly resolved in the difference spectrum. Magnesium chro-mate spinel forms a complete solid solution with magnesium aluminate spinel. The Mg and AlK-edges (not shown) were recorded in the bulk spinel phase and confirmed the stoichiometry ofthe spinel. These edges also have characteristic near-edge structures which could be useful forelectron structure analysis across interfaces. So far no such analysis has been carried out.
10
Fig. 4. - A plot of the experimental ratio Ia/Ib, extracted by fitting two Gaussian peaks to the edge thresh-old region of the Al L2,3. The abscissa represents the expected inversion parameter for the spinel standardsexamined.
Fig. 5. - The oxygen K-edge from spinel protrusion, sapphire fiber and interface region. The differencebetween the spinel and interface spectra reveals the Cr L2,3 edge.
The Al LZ,3 spectrum-line profile across the interface is shown in Figure 6. The transitionfrom sapphire into spinel occurs over a 5 nm region. Using the end members of this series as

11
the principal components, the MLS decomposition provides spinel and sapphire mole fractionprofiles. These are shown in the lower window of Figure 7, and are superimposed with the profilesobtained by similar decomposition of the characteristic O-K edges.
Fig. 6. - Individual spectra extracted from the spectrum-line profile measured across the spinel/sapphireinterface recorded at 0.5 nm steps (consecutive spectra vertically off set for viewing purposes).
Composition profiles across the spinel/sapphire interface were generated from the spectrum-line profiles by integrating the Cr, Mg and Al L2,3, and 0 K edge intensities. These profiles areshown in Figure 7. The Cr/Al and Mg/Al ratios indicate segregation of Cr and a slight increase inMg relative to Al at the spinel/sapphire interface. The driving force for Cr segregation is presum-ably through atomic size misfit strain energy contributions. Increased free volume at the interfacewill yield preferred segregation. The increase in Mg at a distance z from the interface, 0 (Mg/Al)zis most clearly evident when the mole fraction of spinel, Xspin (derived by the MLS fitting of stan-dard edge), normalized to the value of (Mg/Al)z within the stoichiometric spinel, is subtracted,
The signal 0(Mg/Al)Z, labeled as excess Mg in Figure 7, corresponds to the amount of Mg ex-

12
Fig. 7. - Line profiles of Cr/Al (upper window), Mg/Al (2nd window), 0/A! (3rd window), and mole frac-tions determined by MLS decomposition to 0 and Al edges (lower window). The excess curves, derivedaccording to manner described in the text, illustrate segregation of Mg and 0 relative to the average stoi-chiometric background.
ceeding that expected for MgO.AlZ03 stoichiometric spinel and assumes there is little overlapwith the neighboring sapphire crystal. After similar normalization on either side of the bound-ary, subtraction of the mole fraction profiles of spinel and sapphire from the 0 signal reveals theexcess amount of oxygen relative to the two standard oxides, i.e.
Inspection of the individual Al spectra close to the interface in Figure 6 gives the impression thatthe intensity ratio (7a/7b) increases at the interface then drops to zero in the sapphire. This viewis validated by the quantitative fitting of two Gaussians to the edge structures. The line profileof (Ia/Ib)z is plotted in Figure 8. The curve labeled as (7a/7b)* was derived by subtracting fromthe profile the spinel mole fraction, normalized to the average ratio in the bulk spinel region,(Ia/Ib)spin, i.e.
As with the excess Mg signal, this represents an increase in (7a/7b) relative to the nearby spinelphase. Taking (I,,IIb) as a measure of the site inversion, the profiles provide a vivid picture of theAl site inversion.
The Gaussian fit analysis also indicates that the half width of peak-a increases at the interface.This presumably reflects the considerable lattice distortion and therefore band broadening at the

13
Fig. 8. - Line profiles derived by quantitative fitting of 2 Gaussians of variable width and height to thepeaks a and b at the AI L2,3 edge threshold. The width of peak-a increases at the boundary, probably dueto lattice strain. The ratio Ia/Ib increases at the interface, over the same region that the composition varies.This provides a picture of Al site inversion in the space charge layer.
interface. There are no systematic chemical shifts observed across the interface, other than a 1 eVshift of the L edge onset in spinel (78 eV) relative to the sapphire onset at (79 eV). A downwardshift of the "octahedral" peak b from spinel to sapphire is attributed to changes in the excitonbinding energy [72, 74]. How this effect varies across the interface has not yet been investigated.Any band bending due to interfacial charge distributions will not be visible because of similarbending of both the core and conduction bands. No defect or interface states could be observedwithin the band-gap region. Such states might have been evident if a concentration of danglingbonds or vacancy defects were present.
5. Discussion
We begin the discussion by considering the interfacial chemical distributions and how they mightaffect the space charge region. To guide the discussion a schematic of the possible elemental dis-tribution at the interface is illustrated in Figure 9, but this should not be taken to represent theactual distributions which are convoluted into the measured profiles. The profiles in Figure 7 sug-gest that the Cr content increases relative to Al at the boundary. The Cr/Al atomic ratio rises to

14
a maximum peak height of 0.1 with 90% of this distribution within a width of 5 nm (assuming anormal distribution). Without knowledge of the Cr’s real distribution it is assumed that the Cr issegregated to the interface and that the observed width reflects a rough or tilted boundary. It isnoted that the spatial distribution is not required for the purpose of a quantitative compositionalanalysis and determination of the the electrostatic charge balance. Of course, the atomic structureand mechanical properties of the boundary will depend strongly on the details of the elementaldistributions. The effect of beam broadening will spread the measured profile but for a foil thick-ness of about 50 nm the finite spectrometer entrance aperture collects only those scattering eventsoccurring within about 0.8 um of the probe position. If we further assume the Al atomic density isuniform up to and across the interface, the amount of Cr segregated to the interface is given by theintegral of its distribution in Figure 7. In making this assumption we neglect the 11 at.% increasein Al in the sapphire with respect to spinel and any decrease in Al due to the presence of excessCr and Mg. To a rough approximation, we can assume the fractional coverage of the interface isgiven by the number of available cation sites occupied by Cr. Taking the cube or (400) plane asan example, there are 8 octahedral sites per unit cell. In normal stoichiometric spinel there aretwo formula units per (400) plane, thus 4 octahedral sites are occupied giving a fractional cov-erage of 1/2. The (400) interplanar spacing is 0.2 nm. If the integrated Cr content in Figure 7were condensed into this narrow width, the Cr/Al atomic ratio would increase to 0.1 x (5/0.2) orabout 2.5. Accordingly, Cr may occupy either 2.5 lattice planes in substitutional sites (CrAl) or1.25 monolayers, filling all 4 of the substitutional sites per unit cell plus the remaining interstitialsites which are charged, (Cr"’)i. An alternative would be for Cr to fill tetrahedral sites, thoughwith excess Mg also present this option seems unlikely. These estimates will be a little higher orlower according to the actual density of the interface planes. Since MgCr204 spinel is completelysoluble in magnesium aluminate spinel, the equivalent of 2 planes could be easily accomodatedwithin the structure. Since Cr is isovalent with Al, Cr accommodation within the substitutionalsites is the most likely since such defects will not contribute directly to the space charge layer [9].
Fig. 9. - Schematic of segregation profile to illustrate a possible space-charge distribution model.
The excess Mg distribution is of similar shape and width as Cr, and rises to a maximum peak in-tensity equal to 0.3. There are 16 tetrahedral sites per unit cell area on the (400) plane of spinel, ofwhich 2 are normally occupied, giving a fractional coverage of 1/8. Following similar assumptionsas before, we estimate an excess Mg/Al of about 0.3 x (5/0.2) or 7.5. The normal Mg/Al ratio is0.5, therefore the results suggest that there is 15 times as much Mg or 30 atoms of Mg per unit cell

15
area to be accommodated in the interfacial region. 5 of these could be accounted for by forma-tion of the equivalent of 2.5 (400) layers of MgCr204 spinel. The remaining 25 amounts to about1.5 fully occupied monolayers. By occupying interstitial sites, the excess Mg2+ leads to a surfacecharge density of 8 x 10-18 C/nm2 which, if uncompensated by negatively charged species, wouldgenerate extremely high stresses of the order of 106 MPa (the tensile strength of sapphire is about150 MPa). This charge density is too large for the system to be physically stable. The stress wouldbe moderated somewhat if the excess Mg is distributed over the full 5 nm wide region. The localexcess amounts to about a 20% Mg per unit cell which may be organized by substitution for Al(i.e., Mg2022Al), and occupation of interstitial sites (i.e., Mg"i). The driving force for accumulation ofsuch large concentrations of Mg may be the attraction to a negatively charged fiber surface. Apossible source of error which may account for an overestimation of Mg observation is poor back-ground fitting. The Mg L2,3 is certainly difficult to extract from the intense background, howeverthe systematic uniformity in the bulk spinel region of the profile gives confidence that the methodused is stable. An underestimate of the Al content at the boundary may also result in the ob-served Mg excess. This option seems unlikely since beam spreading and overlap of sapphire willincrease the apparent Al content. There was no evidence for preferential Al etching due to beamdamage. This observation is in contrast to that made by Chiang et al. on the grain boundaries ofvarious magnesium aluminate spinels [10,11]. The difference may lie in details of the electrostaticscreening in the metal phase that occurs during nucleation of this spinel on the sapphire.
To avoid the large surface stresses, excess positive charge in the spinel must be balanced by anapproximately equal amount of excess negative charge. Negatively charged defects in undopedspinel and sapphire include anion interstitials, cation vacancies, and cation site inversion. The 0profile in Figure 7 gives some insight into the 0 excess at the boundary. The O/Al has a peakmaximum equal to about 0.5. Following the same analysis as above for the (400) spinel plane,the 0 excess translates to 25 extra Oz- anions per unit cell. 20 of the 25 can be accounted forby the formation of 2.5 layers of MgCr204. The remaining 5 anions are probably segregated asinterstitial charged defects at the interface. The site density for a monolayer of 0 on the cubeplane is 8 per unit cell area, which indicates that 0.6 monolayer of 02- is present. A negativecharge on the sapphire surface would compensate some of the charge carried by interstitial Mg2+.The remainder of the excess positive charge due to Mg build up could be compensated by creationof Al vacancies.
An estimate of the Al3+ site inversion is provided by the Al L2,3 near edge peak intensity ratiogiven by (7a/7b) in Figure 8. Qualitatively, the increased ratio at the boundary indicates greaterAl site inversion. The ratio increases from 0.18 in the bulk spinel phase to 0.28 at the boundary.Subtracting the spinel background ratio accentuates the interfacial increase. With reference toFigure 4 and the regression analysis, the measured Ia/Ib ratios correspond to an inversion pa-rameter of 0.1, increasing to 0.3 at the interface. This suggests that an extra 10% of the Al ionsoccupy tetrahedral positions. Cation site exchange results in zero net charge creation, and there-fore would not directly contribute to charge imbalance compensation. However, in the electricfield created by the excess Oz- and Mg2+, redistribution of the inverted cations will take place.The Mg2022Al will be attracted to the Mg"i, and the Ali towards the O20222022i. Confirmation of this effectawaits improved spatial resolution.
In the above discussion we have chosen to ignore variations in the Al density across the inter-face. Obviously this will modify slightly the estimates given, however, the description given aboveis meant only to provide a plausible picture of the elemental and defect site distributions. We havealso ignored the possibility of aliovalent impurities, which are known to greatly influence spacecharge at very low concentration levels and we have made assumptions concerning interface struc-ture. Greater insight will undoubtedly be obtained with a cleaner, more well defined system with

16
a clearer picture of the atomic structure. In the future, it would be useful to examine the effectof substrate orientation and the role of oxygen partial pressure on the nature of the space chargeregion.
These measurements illustrate that a physically reasonable picture can be built up by quanti-tative analysis of spectrum-line profile data. Very large data sets can now be accumulated in veryshort times, putting stringent demands upon the speed and accuracy of data handling and pro-cessing. In this paper no attempt has been made to quantify or interpret the near edge structureson the Mg L2,3 and K and Al K edges. Clearly further work is necessary to better understand thedetailed near edge structures if they are to be used in this quantitative way, to extract electronicstructure information of ceramic interfaces.
6. Conclusions
Spectrum-line profiles have been acquired across the interface between magnesium aluminatespinel and sapphire. The conventional integrated intensity line profiles provide a picture of theelemental distributions, whilst quantitative near edge structure analysis highlights electronic struc-ture variations. Since the bonding in these oxides is highly localized, the near edge structure is ableto provide information concerning the site symmetry of the cations. A set of standard spinels wasused to generate an empirical relationship between edge intensity and spinel inversion parameter.A spectrum-line profile is analyzed to yield a picture of the Al site inversion across the interface.The principal observations of this investigation are that Mg and Cr segregate to the interface, ac-companied by Al site inversion. A simple model is envisioned, whereby Oz- anions terminatingon the surface of the substrate, influence the earliest stages of nucleation and growth. InterstitialMg accumulates near the boundary under the influence of electrostatic attractive forces, Cr isattracted to the interface to minimize strain energy and the degree of site inversion is affected bythe electric fields at the interface.
Acknowledgements
We wish to thank R. French of DuPont Research Center, Wilmington DE, and R. Raj of CornellUniversity, Ithaca N.Y., for providing the spinel standards and C.C. Bampton and J.R. Porter ofRockwell International, Thousand Oaks CA, for the provision of the transient liquid phase bondedcomposite. G. Duscher of the Max-Plank-Institut für Metallforschung, Stuttgart and M. Tencé ofthe Université Paris-Sud, Orsay Paris, are achnowledged for the supply of their custom functionsthat enable the spectrum-line profile acquisition. The research was supported through NSF grantsDMR 9111839 and DMR 930625.
References
[1] Lewis M.H. and Murthy VS.R., Compos. Sci. Technol. 42 (1991) 221.[2] Coble R.L., J. Appl. Phys. 34 (1963) 1679.[3] Rühle M. and Evans A.G., Mater. Sci. Eng. A 107 (1989) 187.[4] Venkatachari K.R. and Raj R., J. Am. Ceram. Soc. 69 (1986) 135.[5] Wang H.F., Gerberich W.W. and Skowronek C.J., Acta Metall. Mater. 41 (1993) 2425.[6] Wang N., Wang Z. and Weatherly G.C., Metall. Trans. A 23A (1992) 1423.[7] Molins R. and Bartout J.D., Coll. Phys. C1 51 (1990) 891.

17
[8] Weinrauch D.A., J. Mater. Res. 3 (1988) 729.[9] Yan M.F., Cannon R.M. and Bowen H.K., J. Appl. Phys. 54 (1983) 764.
[10] Chiang Y.-M. and Peng C.J., Adv. Cer. 23 (1987) 361.[11] Chiang Y.-M. and Kingery W.D., J. Am. Ceram. Soc. 73 (1990) 1153.[12] Carter G.B. and Morrissey K.J., IAdv. Cer. 12 (1984) 303.[13] Carter C.B. and Schmalzried H., Phil. Mag. A 52 (1985) 207.[14] Carter C.B. and Rasmussen Y.K., Acta Metall. Matr. 42 (1994) 2741.[15] Carter C.B. and Rasmussen Y.K., Acta Metall. Mater. 42 (1994) 2729.[16] Höche T, Kenway P.R., Kleebe H.J., Rühle M. and Morris P.A., J. Am. Ceram. Soc. 77 (1994) 339.[17] Merkle K. L. and Smith D.J., Phys. Rev. Lett. 59 (1987) 2887.[18] Sun C.P. and Balluffi R.W., Scripta Metall. 13 (1979) 757.[19] Sunitzky D.W. and Carter C.B., J. Am. Ceram. Soc. 73 (1990) 2485.[20] Li D.X., Pirouz P., Heuer A.H., Yadavalli S. and Flynn C.P., Phil. Mag. A 65 (1992) 403.[21] Bruley J., Micrasc., Microanal., Microstruct. 4 (1993) 23.[22] Bruley J., Höche T, Kleebe H.J. and Rühle M., J. Am. Ceram. Soc. 77 (1994) 2273.[23] Navrotsky A. and Kleppa O.J., J. Inorg. Nucl. Chem. 29 (1967) 2701.[24] Wood B.J., Kirkpatrick R.J. and Montez, Amer. Mineralogist 71 (1986) 999.[25] Gobbi G.C., Christofferson R., Otten M.T, Miner B., Buseck P.R., Kennedy G.J. and Fyfe C.A., Chem.
Letts. 6 (1985) 771.[26] Navrotsky A., Wechsler B.A., Geisinger K. and Seifert F., J. Am. Ceram. Soc. 69 (1986) 418.[27] Jayaram V and Levi C.G., Acta Metall. 37 (1989) 569.[28] Schmocker U., Boesch H.R. and Waldner F., Phys. Letts. 40A (1972) 237.[29] Schmocker U. and Waldner F., J. Phys. C: Solid State Phys. 9 (1976) L235.[30] Rouse K.D., Thomas M.W. and Willis B.T.M., J. Phys. C: Solid State Phys. 9 (1976) L231.[31] Heuer A.H. and Mitchell TE., J. Phys. C: Solid State Phys. 8 (1975) L541.[32] Grimes N.W., Thompson P. and Kay H.F., Proc. Roy. Soc. (Lond.) A 386 (1983) 333.[33] Mishra R.K. and Thomas G., Acta Cryst. A 33 (1977) 678.[34] Hallstedt B., J. Am. Ceram. Soc. 75 (1992) 1497.[35] Kingery W.D., Bowen H.K. and Uhlmann D.R., in Introduction to Ceramics. 2nd. ed., John Wiley and
Sons: New York 4 (1976) p. 125.[36] Dupree R., Lewis M.H. and Smith M.E., Phil. Mag. A 53 (1986) L17.[37] Grimes R.W., J. Am. Ceram. Soc. 77 (1994) 378. [38] Bianconi A., Bachrach R.Z., Hagstrom S.B.M. and Flodström S.A., Phys. Rev. B 19 (1979) 2837.[39] Bursill L.A. and Lin P.J., Phil. Mag. 60 (1989) 307.[40] Huang X.Y., Mader W. and Kirchheim R., Acta Metall. Mater. 39 (1991) 893.[41] Knauss D. and Mader W., Ultramicroscopy 37 (1991) 247.[42] Baik S., Fowler D.E., Blakely J.M. and Raj R., J. Am. Ceram. Soc. 68 (1985) 281.[43] Trumble K.P. and Rühle M., in Metal-Ceramic Interfaces, M. Rühle et al., Ed. Pergamon Press: New
York (1989) p. 144.[44] Bruley J., Brydson R., Müllejans H., Meyer J., Gutekunst G., Knauss M.W.D. and Rühle M., J. Mater.
Res. 9 (1994) 2574.[45] Gautier M., Renaud G., Van L.P., Villette B., Pollak M., Thromat N., Jollet F. and Duraud J.P., J. Am.
Ceram. Soc. 77 (1994) 323.[46] Finnis M.W., Acta Metall. Mater. 40 (1992) S25.[47] Duffy D.M., Harding J.H. and Stoneham A.M., Acta Metall. Mater. 40 (1992) S11.[48] Taftø J. and Zhu J., Ultramicroscopy 9 (1982) 349.[49] Brydson R., Sauer H., Engel W., Thomas J.M. and Zeitler E., J. Chem. Soc. Chem. Commun. 15
(1989) 1010.[50] Brydson R., EMSA Bulletin 21 (1991) 57.[51] Brydson R., Sauer H., Engel W. and Zeitler E., Microsc. Microanal. Microstr. 2 (1991) 159.[52] Brydson R., Garvie L.A.J., Craven A.J., Sauer H. and Hofer F., J. Phys.: Condens. Matter 5 (1993)
9379.
[53] Hansen P.L., McComb D.W., Brydson R. and Richardson I., private communication.[54] McComb D.W., Brydson R. and Hansen P.L., J. Phys.: Condens. Matter 4 (1993) 8363.[55] Brytov I.A. and Romaschenko Y.N., Sov. Phys. Solid State 20 (1978) 384.[56] Taftø J. and Krivanek O.L., Phys. Rev. Lett. 48 (1982) 560.[57] Taftø J., Nuc. Inst. Meth. Phys. Res. B 2 (1984) 733.[58] Krivanek O.L., Disko M.M., Taftø J. and Spence J.C.H., Ultramicroscopy 9 (1982) 249.

18
[59] Spence J.C.H., Krivanek O., Taftø J. and Disko M., in EMAG (1982) Institute of Physics.[60] Tafto J., J. Appl. Crystallogr. 15 (1982) 378.[61] Qian W., Tötdal B., Hoier R. and Spence J.C.H., Ultramicroscopy 41 (1992) 147.[62] Zhang S.-Y. and Cowley J.M., Thin Solid Films 148 (1987) 3011.[63] Tanaka I., Kawai J. and Adachi H., Phys. Rev. B Submitted (1994).[64] Xu Y.-N. and Ching W.Y., Phys. Rev. B 43 (1991) 4461.[65] Abramov V.N., Karin M.G., Kuznetsov A.I. and Sidorin K.K., Sov. Phys. Solid State 21 (1979) 47.[66] Batra I.P., J. Phys. C. (Solid State Phys.) 15 (1982) 5399.[67] Ciraci S. and Batra I.P., Phys. Rev. B 28 (1983) 982.[68] Shangda X., Chandxin G., Libin L. and Ellis D.E., Phys. Rev. B 35 (1987) 7671.[69] Guo J., Ellis D.E. and Lam D.J., Phys. Rev. B 45 (1992) 13647.[70] Tossell J.A., J. Phys. Chem. Sol. 36 (1975) 1273.[71] Tossell J.A., J. Am. Ceram. Soc. 97 (1975) 4840.[72] Balzorotti A., Antonangeli F., Girlanda R. and Martino, Phys. Rev. B 29 (1984) 5903.[73] Hong S.Y., Anderson A.B. and Smialek J.L.., Surf. Sci. 230 (1990) 175.[74] Balzorotti A., Antonangeli F., Girlanda R. and Martino G., Solid State Comm. 44 (1982) 275.[75] Pantelides S.T and Harrison W.A., Phys. Rev. B 13 (1976) 2667.