spectrum security manager 3ehealth-spectrum.ca.com/support/secure/products/spectrum...how it all...
TRANSCRIPT

SPECTRUMSecurity Manager 3.3
Reporting System Installation and Configuration Guide
Document 5104-00
Security Management
Titlepage

Reporting System Installation
Copyright Notice
Document 5104-00. Copyright © May 2002 by Aprisma Management Technologies, Inc. All rights reserved worldwide. Use, duplication, or disclosure by the United States government is subject to the restrictions set forth in DFARS 252.227-7013(c)(1)(ii) and FAR 52.227-19.
Liability Disclaimer
Aprisma Management Technologies, Inc. (“Aprisma”) reserves the right to make changes in specifications and other information contained in this document without prior notice. In all cases, the reader should contact Aprisma to inquire if any changes have been made.
The hardware, firmware, or software described in this manual is subject to change without notice.
IN NO EVENT SHALL APRISMA, ITS EMPLOYEES, OFFICERS, DIRECTORS, AGENTS, OR AFFILIATES BE LIABLE FOR ANY INCIDENTAL, INDIRECT, SPECIAL, OR CONSEQUENTIAL DAMAGES WHATSOEVER (INCLUDING BUT NOT LIMITED TO LOST PROFITS) ARISING OUT OF OR RELATED TO THIS MANUAL OR THE INFORMATION CONTAINED IN IT, EVEN IF APRISMA HAS BEEN ADVISED OF, HAS KNOWN, OR SHOULD HAVE KNOWN, THE POSSIBILITY OF SUCH DAMAGES.
Trademark, Service Mark, and Logo Information
SPECTRUM, IMT, and the SPECTRUM IMT/VNM logo are registered trademarks of Aprisma Management Technologies, Inc., or its affiliates. APRISMA, APRISMA MANAGEMENT TECHNOLOGIES, the APRISMA MANAGEMENT TECHNOLOGIES logo, MANAGE WHAT MATTERS, DCM, VNM, SpectroGRAPH, SpectroSERVER, Inductive Modeling Technology, Device Communications Manager, SPECTRUM Security Manager, and Virtual Network Machine are unregistered trademarks of Aprisma Management Technologies, Inc., or its affiliates. For a complete list of Aprisma trademarks, service marks, and trade names, go tohttp://www.aprisma.com/manuals/trademark-list.htm.
All referenced trademarks, service marks, and trade names identified in this document, whether registered or unregistered, are the intellectual property of their respective owners. No rights are granted by Aprisma Management Technologies, Inc., to use such marks, whether by implication, estoppel, or otherwise. If you have comments or concerns about trademark or copyright references, please send an e-mail to [email protected]; we will do our best to help.

Reporting System Installation
Restricted Rights Notice
(Applicable to licenses to the United States government only.)
This software and/or user documentation is/are provided with RESTRICTED AND LIMITED RIGHTS. Use, duplication, or disclosure by the government is subject to restrictions as set forth in FAR 52.227-14 (June 1987) Alternate III(g)(3) (June 1987), FAR 52.227-19 (June 1987), or DFARS 52.227-7013(c)(1)(ii) (June 1988), and/or in similar or successor clauses in the FAR or DFARS, or in the DOD or NASA FAR Supplement, as applicable. Contractor/manufacturer is Aprisma Management Technologies, Inc. In the event the government seeks to obtain the software pursuant to standard commercial practice, this software agreement, instead of the noted regulatory clauses, shall control the terms of the government's license.
Virus Disclaimer
Aprisma makes no representations or warranties to the effect that the licensed software is virus-free.
Aprisma has tested its software with current virus-checking technologies. However, because no antivirus system is 100 percent effective, we strongly recommend that you write-protect the licensed software and verify (with an antivirus system in which you have confidence) that the licensed software, prior to installation, is virus-free.
Contact Information
Aprisma Management Technologies, Inc.
273 Corporate Drive
Portsmouth, NH 03801
Phone: 603-334-2100
U.S. toll-free: 877-468-1448
Web site: http://www.aprisma.com
Contents
About the documentation.................................................................................................... 10
Document Feedback........................................................................................... 10
Online Documents ............................................................................................. 11
Conventions Used in This Guide ........................................................................................ 11
Text conventions ................................................................................................ 11
Icons.................................................................................................................... 11
CHAPTER 1: ABOUT THE REPORTING SYSTEM
Overview .............................................................................................................................. 14
The Reporting System interface ......................................................................................... 15
The Reporting System components .................................................................................... 18
The database ...................................................................................................... 18
The Reporting System software ........................................................................ 19
The Jakarta-Tomcat Web server....................................................................... 19
The Web browser ............................................................................................... 20
How the Reporting System creates reports ....................................................................... 21
The reports.xml file............................................................................................ 22
The building_blocks.xml file.............................................................................. 23
The hyperdrill.xml file....................................................................................... 25
The reportset.xml file ........................................................................................ 33
How it all comes together .................................................................................. 34

5 Reporting System Installation and Configuration Guide
CHAPTER 2: INSTALLING THE REPORTING SYSTEM (WINDOWS)System Requirements ......................................................................................................... 36
Server requirements .......................................................................................... 36
Client requirements........................................................................................... 37
Installing the Software........................................................................................................ 37
To install the Reporting System on Windows .................................................. 38
Connecting to a Database ................................................................................................... 38
To use a native driver to connect to the database............................................ 38
To use an SQL ODBC driver to connect to the database................................. 39
To configure the ODBC driver to recognize your password ............................ 40
Setting the Maximum Number of Users ............................................................................ 40
To change the maximum number of users ....................................................... 41
Securing Connections Using SSL ....................................................................................... 41
Using SSL certificates ....................................................................................... 41
Setting up SSL ................................................................................................... 42
Launching the Reporting System ....................................................................................... 43
Starting and stopping Jakarta-Tomcat ............................................................ 43
Using a Web browser to access the Reporting System .................................... 43
Using SSM to access the Reporting System..................................................... 44
Removing the Software ....................................................................................................... 45
To remove the Reporting System...................................................................... 46
CHAPTER 3: INSTALLING THE REPORTING SYSTEM (SOLARIS)System Requirements ......................................................................................................... 48
Server requirements .......................................................................................... 48
Client requirements........................................................................................... 49
Installing the Software........................................................................................................ 49
To install the Reporting System on Solaris...................................................... 49
Connecting to a Database ................................................................................................... 50
To use a native driver to connect to the database............................................ 50
Setting the Maximum Number of Users ............................................................................ 51
To change the maximum number of users ....................................................... 51

Table of Contents 6
Securing Connections Using SSL ....................................................................................... 52
Using SSL certificates ....................................................................................... 52
Setting up SSL ................................................................................................... 53
Launching the Reporting System ....................................................................................... 54
Starting and stopping Jakarta-Tomcat ............................................................ 54
Using a Web browser to access the Reporting System .................................... 54
Using SSM to access the Reporting System..................................................... 55
Removing the Software ....................................................................................................... 57
To remove the Reporting System...................................................................... 57
CHAPTER 4: SETTING UP USERS AND GROUPS
Overview .............................................................................................................................. 58
Creating Access Levels........................................................................................................ 60
To create a new access level .............................................................................. 60
Creating Groups .................................................................................................................. 61
To create a new group........................................................................................ 61
Adding Users to Groups ...................................................................................................... 62
To create a new user .......................................................................................... 62
Assigning Passwords to Users ............................................................................................ 63
To assign a password to a user ......................................................................... 63
To change a user�s password ............................................................................. 64
Removing users.................................................................................................................... 65
To delete a user�s account.................................................................................. 65
Disabling authentication..................................................................................................... 66
To disable authentication .................................................................................. 66
CHAPTER 5: USING THE REPORTING SYSTEM
Logging Into and Out of the Reporting System ................................................................. 68
The default user name and password............................................................... 69
To log into the Reporting System...................................................................... 70
To log out of the Reporting System................................................................... 71

7 Reporting System Installation and Configuration Guide
Running a Basic Report ...................................................................................................... 71
To run a basic report.......................................................................................... 72
Repeating a basic report.................................................................................... 72
Querying the Database ....................................................................................................... 73
To run a search .................................................................................................. 73
Repeating a search............................................................................................. 74
To repeat a search.............................................................................................. 74
Hyperdrilling: Getting Details on a Report ....................................................................... 75
Getting information on a column...................................................................... 75
Getting information on a row............................................................................ 77
CHAPTER 6: USING THE MAKEXML UTILITY
Overview .............................................................................................................................. 80
How MakeXML merges files ............................................................................. 81
Using special characters in XML files................................................................................ 86
Quotation marks ................................................................................................ 86
Greater-than and less-than symbols ................................................................ 87
Setting up MakeXML .......................................................................................................... 88
To set up MakeXML .......................................................................................... 88
Using MakeXML.................................................................................................................. 89
To use MakeXML............................................................................................... 89
CHAPTER 7: CUSTOMIZING THE REPORTING SYSTEM
Overview .............................................................................................................................. 90
Editing the Reporting System stylesheet........................................................................... 91
To edit the Reporting System stylesheet.......................................................... 91
Reporting System styles .................................................................................... 92
Changing the system�s title bar information ..................................................................... 96
To change the system�s title bar information................................................... 97

Table of Contents 8
Adding a header to reports ................................................................................................. 98
To add a header or footer to a report ................................................................ 99
Changing the Login Screen and Process .......................................................................... 100
Login screen attributes.................................................................................... 102
To change the number of allowed login attempts .......................................... 103
To change the appearance of the Login screen .............................................. 104
To change the Reporting System login prompts ............................................ 105
Changing the Reporting System images .......................................................................... 106
Replacing Reporting System images .............................................................. 108
Changing the appearance of the navigation tree............................................................. 109
Navigation tree attributes............................................................................... 111
To change the navigation tree�s appearance .................................................. 112
Changing the number of rows in a report ........................................................................ 113
Changing the number of displayed results for all reports............................. 115
Changing the number of displayed results for a specific report ................... 116
Adding custom classes to the Reporting System ............................................................. 117
CHAPTER 8: CREATING CUSTOM REPORTS
Overview ............................................................................................................................ 118
Creating a Report .............................................................................................................. 119
To define a custom report................................................................................ 119
Setting up Hyperdrilling Relationships ........................................................................... 124
To set up a new hyperdrilling definition ........................................................ 125
Adding a Report to the System Navigation Tree............................................................. 126
To add a report to the navigation tree............................................................ 126
Interpreting error codes .................................................................................................... 128
Using the Reporting System�s logs ................................................................................... 133
To turn on logging............................................................................................ 133
Troubleshooting common problems .................................................................................. 134
The Jakarta-Tomcat console disappears ........................................................ 134
�Error: 500� message ....................................................................................... 134
�You have exceeded your tries� message ........................................................ 135

9 Reporting System Installation and Configuration Guide

Preface
About the documentation
This guide is part of the SPECTRUM Security Manager (SSM) documentation set.
The full documentation set includes:
� SPECTRUM Security Manager Basics Guide
� SPECTRUM Security Manager Installation Guide for Windows
� SPECTRUM Security Manager Installation Guide for Solaris
� SPECTRUM Security Manager Reporting System Installation and Configuration
Guide
� Installing and Using SPECTRUM Security Manager with SPECTRUM
� Normalizer Pack online help
� SSM online help
� release notes for SSM, the Reporting System, and the Normalizer Pack
Document Feedback
Please send feedback regarding SPECTRUM documents to the following e-mail
address:
Thank you for helping us improve our documentation.

11 Reporting System Installation and Configuration Guide
Online Documents
SPECTRUM documents are available online at:
http://www.aprisma.com/manuals
Check this site for the latest updates and additions.
Conventions Used in This Guide
Text conventions
This guide uses various typefaces to differentiate between coded and regular text, as
well as to help you identify important concepts:
� Text that you type and text that appears on screen is presented in Lucinda
Console type.
� Placeholders for variables and expressions appear in [square brackets].
� User interface labels, such as dialog box titles and button names, appear in bold.
� Italics are used for references to other guides in the documentation set, and to
introduce new terms.
Icons
This guide also uses Note, Tip, and Caution icons to call attention to important
information.
The Note icon indicates essential information related to the surrounding overview or
procedure.
The Tip icon indicates a recommendation. Many tips introduce �best practice�
concepts.
12
The Caution icon indicates a warning. Cautions advise you about potential problems,
and offer advice for avoiding these problems.

13 Reporting System Installation and Configuration Guide

1About the Reporting System
Overview
The Reporting System is an application that lets you create text- and graphic-based
reports from information stored in an event database. The Reporting System
� uses a web-based interface
� provides standard, pre-configured reports
� allows users to search for specific information and create reports based on their
search results
� supports multiple simultaneous users with different access rights
� lets administrators modify existing reports and add new, custom reports
15 Reporting System Installation and Configuration Guide
The Reporting System interface
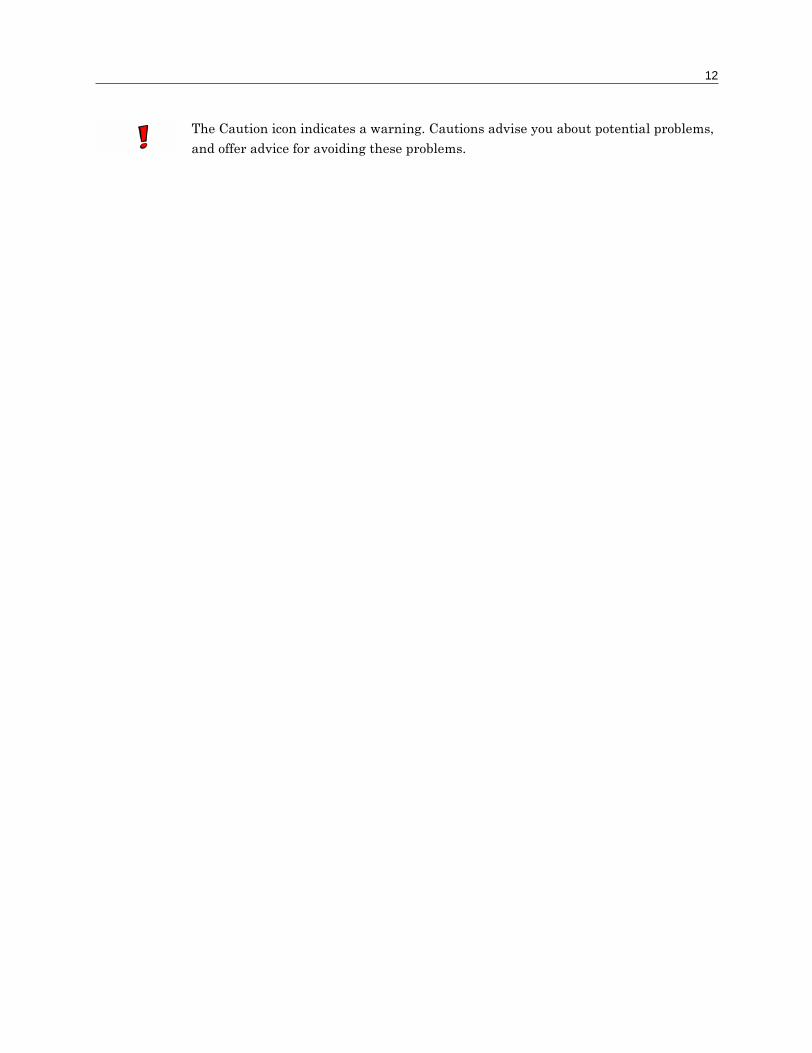
The Reporting System uses a browser-based interface. The interface consists of two
main areas � a navigation tree and a display area.
The navigation tree lists all of the reports that you can run, grouped into categories.
Clicking on a report makes the Reporting System run the report.
Navigation tree Display area
Chapter 1: About the Reporting System 16
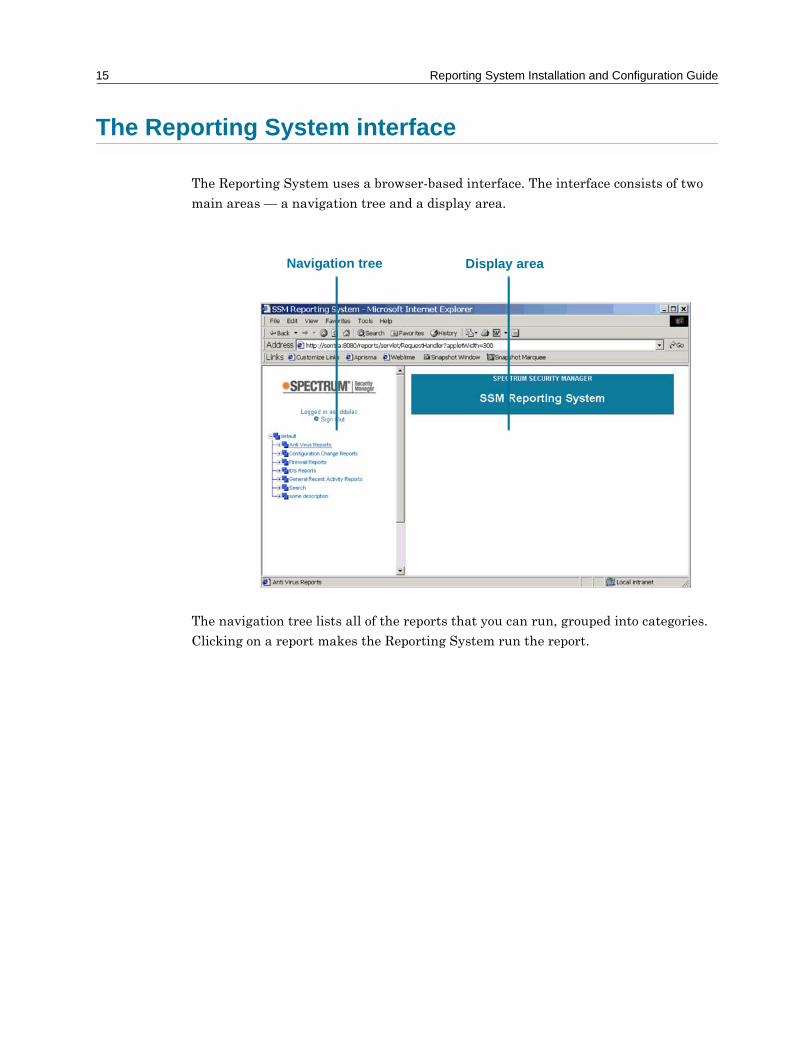
The display area changes depending on the report you select. This area generally
displays either the results of a report, or a set of search fields that let you specify the
types of information that you want to base a report on.
If you run several reports, the Reporting System keeps track of them for you in a list
at the top of the display area. You can re-run a previous report by selecting its name
from the list. When you re-run a previous report, you do not return to the original
results. Those results could be out of date, so the Reporting System retrieves a new
set of results from its database, using the parameters of the previous report.
Report results Search fields
List of previous reports

17 Reporting System Installation and Configuration Guide
Most reports produce results in table form. Each row in the results table corresponds
to a single event in the database. You will see different columns of information,
depending on the report you selected.
If the Reporting System finds more results than it can display at once, it breaks the
results into several pages and provides links to these pages at the top and bottom of
the results table.
You are not limited to the results you see when you run a standard report or a custom
search. The Reporting System supports hyperdrilling, which is the process of moving
from general summary information to more detailed information. This feature means
that once you run a report, you can:
� view the details of a specific event in the results table
� summarize the results of a particular column in the results table
� filter your results to see more precise information
� run another report based on the current results (rather than on all the events in
the database)
For more information on hyperdrilling and running reports, see Chapter 5 ("Using the
Reporting System").
Events matching the report criteria
Links to more results
Report columns
Chapter 1: About the Reporting System 18
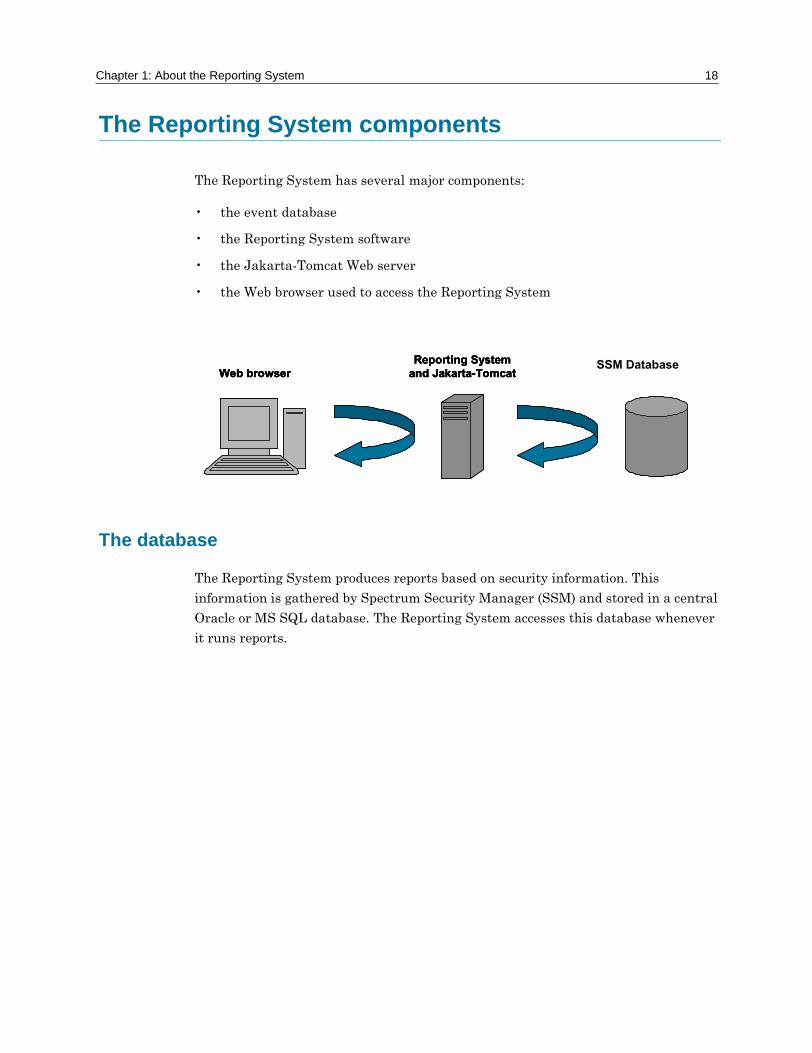
The Reporting System components
The Reporting System has several major components:
� the event database
� the Reporting System software
� the Jakarta-Tomcat Web server
� the Web browser used to access the Reporting System
The database
The Reporting System produces reports based on security information. This
information is gathered by Spectrum Security Manager (SSM) and stored in a central
Oracle or MS SQL database. The Reporting System accesses this database whenever
it runs reports.
Web browserReporting System
and Jakarta-TomcatNSM / SSMdatabaseWeb browserWeb browser
Reporting System and Jakarta-TomcatReporting System
and Jakarta-TomcatNSM / SSMdatabase
NSM / SSMdatabase
SSM Database

19 Reporting System Installation and Configuration Guide
The Reporting System software
The Reporting System software consists of several program files and a set of XML
files.
You can customize the Reporting System by editing these XML files. There are
several important XML files that you may need to work with:
� users.xml
� groups.xml
� reports.xml
� building_blocks.xml
� reportset.xml
� hyperdrill.xml
� layout.xml
For more information on how the Reporting System uses its XML files, see "How the
Reporting System creates reports" on page 21.
If you decide to customize the Reporting System by editing its XML files, you must
use the MakeXML utility provided with the system. This utility merges your XML
changes with the main system XML files. For more information, see Chapter 6
("Using the MakeXML utility").
The Jakarta-Tomcat Web server
Jakarta-Tomcat is an application that the Reporting System uses to deliver
Java-based web pages to users. It acts as an intermediary between your Web browser
and the Reporting System. Your Web browser sends information to Jakarta-Tomcat,
and displays the web pages that it provides. Jakarta-Tomcat transmits browser
information to the Reporting System, and creates web pages to send back.
The Reporting System automatically installs Jakarta-Tomcat for you.

Chapter 1: About the Reporting System 20
The Web browser
You use a Web browser to access the Reporting System. This means that you can
access the Reporting System from almost any location, providing that you know the IP
address of the computer running the system.
The Web browser
� displays web pages produced by Jakarta-Tomcat
� collects information from you, such as your user name and password (for logging
into the system), or the name of the report you want to run, or search criteria that
you enter
� sends your information to the Reporting System, via Jakarta-Tomcat
� retrieves search results and displays them

21 Reporting System Installation and Configuration Guide
How the Reporting System creates reports
Understanding how the Reporting System creates reports is important if you plan to
add your own custom reports to the system, or modify any of the existing reports.
The Reporting System gets its instructions for building a report from its XML files.
Several XML files contribute to a finished report:
� reports.xml
� building_blocks.xml
� hyperdrill.xml
� reportset.xml
Chapter 1: About the Reporting System 22
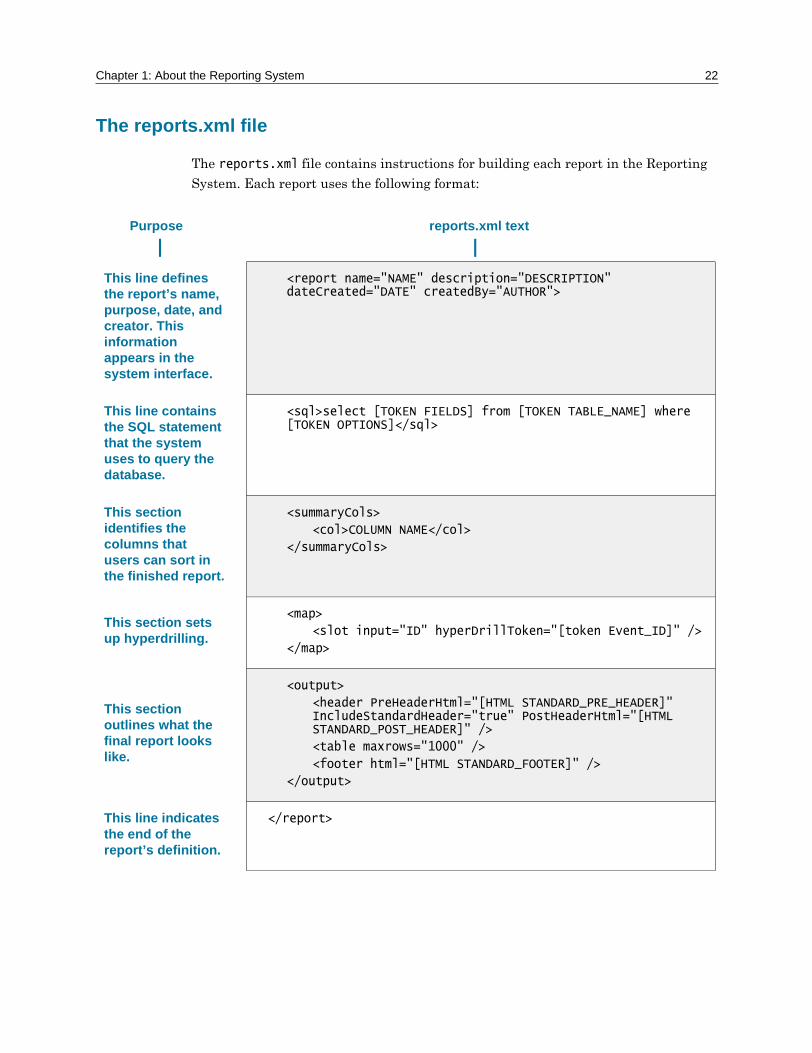
The reports.xml file
The reports.xml file contains instructions for building each report in the Reporting
System. Each report uses the following format:
This line defines the report’s name, purpose, date, and creator. This information appears in the system interface.
<report name="NAME" description="DESCRIPTION" dateCreated="DATE" createdBy="AUTHOR">
This line contains the SQL statement that the system uses to query the database.
<sql>select [TOKEN FIELDS] from [TOKEN TABLE_NAME] where [TOKEN OPTIONS]</sql>
This section identifies the columns that users can sort in the finished report.
<summaryCols>
<col>COLUMN NAME</col>
</summaryCols>
This section sets up hyperdrilling.
<map>
<slot input="ID" hyperDrillToken="[token Event_ID]" />
</map>
This section outlines what the final report looks like.
<output>
<header PreHeaderHtml="[HTML STANDARD_PRE_HEADER]" IncludeStandardHeader="true" PostHeaderHtml="[HTML STANDARD_POST_HEADER]" />
<table maxrows="1000" />
<footer html="[HTML STANDARD_FOOTER]" />
</output>
This line indicates the end of the report’s definition.
</report>
Purpose reports.xml text

23 Reporting System Installation and Configuration Guide
Most reports use variables (called �tokens�) in their definitions. These variables are
listed in a separate file � the building_blocks.xml file.
The building_blocks.xml file
The building_blocks.xml file is a lookup table. It contains lists of variables (called
�tokens�) that are used in the reports.xml file. Each token has a value. When the
Reporting System encounters a token in the reports.xml file, it searches the

Chapter 1: About the Reporting System 24
building_blocks.xml file for the value of that token. It then replaces the token in the
report with the value listed in the building_blocks.xml file.
Tokens in the building_blocks.xml file can also reference other tokens. For instance:
<key name="[FIELDS STANDARD_EVENT_DETAIL]" value="ID, [FIELDS STANDARD_EVENT_DETAIL_NO_ID]" />
The Reporting System reads reports.xml and finds a SQL statement that contains tokens
It searches building_blocks.xml to find the associated tokens
It takes the token’s value and uses it to replace the token in reports.xml
<sql>
select [FIELDS STANDARD_EVENT_DETAIL] from [TABLE EVENT] where
[INPUTGUI DATERANGE STANDARD] and [SECURITY DATARESTRICTION]
order by ID
</sql>
<key name="[TABLE EVENT]" value="event" />
<sql>
select [FIELDS STANDARD_EVENT_DETAIL] from event where
[INPUTGUI DATERANGE STANDARD] and [SECURITY DATARESTRICTION]
order by ID
</sql>
reports.xml
reports.xml
building_blocks.xml

25 Reporting System Installation and Configuration Guide
The value of this token contains a reference to another token �
[FIELDS STANDARD_EVENT_DETAIL_NO_ID]. This second token is also defined in the
building_blocks.xml file:
<key name="[FIELDS STANDARD_EVENT_DETAIL_NO_ID]" value="ID_timestamp, facility_ip, type, message" />
When the Reporting System reads the value of the first token, it has to resolve the
second token. The combined value becomes:
value=�ID, ID_timestamp, facility_ip, type, message�
The hyperdrill.xml file
The Reporting System uses the hyperdrill.xml file to
� create links from standard reports to hyperdrilling reports
� look up information that the system needs in order to build a selected
hyperdrilling report
Hyperdrilling is the process of moving from general summary information to more
detailed information. This feature means that once you run a report, you can then
create a new report based on the results. When you create a report based on another
report�s results, you create a hyperdrilling report.
The Reporting System interface incorporates three items that relate to hyperdrilling:
� hyperdrill links
� the hyperdrill screen
� hyperdrill reports
Hyperdrill links are web links that appear in result tables. These links appear in row
and column headers. When you click on a hyperdrill link, the Reporting System either
runs a hyperdrill report, or provides you with a list of hyperdrill reports to choose
from. This list of reports is the hyperdrill screen. Once you select a report, the

Chapter 1: About the Reporting System 26
Reporting System runs a database query based on your existing results, and produces
a hyperdrill report.
The Reporting System comes with several hyperdrilling reports:
� Full Detail For This Record
� Track Suspicious Source IP Address
� Track Facility IP Address
� Track Target IP Address
You can also add your own, custom hyperdrilling reports. For more information, see
Chapter 8 ("Creating Custom Reports").
Structure of the hyperdrill.xml file
The hyperdrill.xml file consists of a series of hyperdrilling definitions. Each
definition sets up links between a standard report and a specific hyperdrilling report.
Hyperdrilling definitions use the following format:
Hyperdrill links appear next to some rows
Some column names are hyperdrill links

27 Reporting System Installation and Configuration Guide
This line provides the name of the hyperdrilling definition.
<hyperdrill name=�FullDetailForThisRecord�>
This line describes the associated hyperdrilling report. When you click on a hyperdrill link, this text appears in the list of available hyperdrill reports.
<title> Full Detail For This Record </title>
This section lists the tokens that a standard report must use in order to link to the hyperdrilling report.
<inputs>
<buildingBlock>[token Event_ID]</buildingBlock>
</inputs>
This section contains a token that the Reporting System inserts into the base report’s SQL query (which is defined in reports.xml).
<outputs>
<slot input="[input event_id fieldType=Text validation=numeric]" output="[token Event_ID]"/>
</outputs>
This line names the hyperdrilling report that this definition provides links to.
<report>event-detail</report>
This line indicates the end of the definition.
</hyperdrill>
Purpose hyperdrill.xml text
Chapter 1: About the Reporting System 28
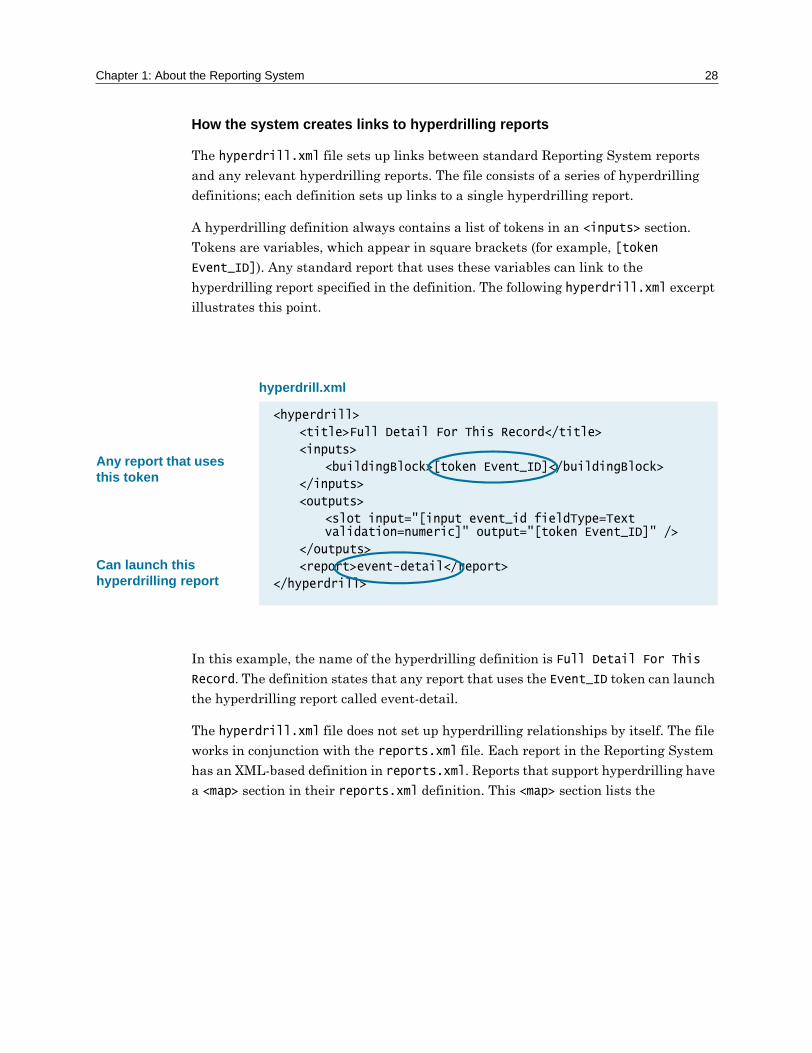
How the system creates links to hyperdrilling reports
The hyperdrill.xml file sets up links between standard Reporting System reports
and any relevant hyperdrilling reports. The file consists of a series of hyperdrilling
definitions; each definition sets up links to a single hyperdrilling report.
A hyperdrilling definition always contains a list of tokens in an <inputs> section.
Tokens are variables, which appear in square brackets (for example, [token
Event_ID]). Any standard report that uses these variables can link to the
hyperdrilling report specified in the definition. The following hyperdrill.xml excerpt
illustrates this point.
In this example, the name of the hyperdrilling definition is Full Detail For This
Record. The definition states that any report that uses the Event_ID token can launch
the hyperdrilling report called event-detail.
The hyperdrill.xml file does not set up hyperdrilling relationships by itself. The file
works in conjunction with the reports.xml file. Each report in the Reporting System
has an XML-based definition in reports.xml. Reports that support hyperdrilling have
a <map> section in their reports.xml definition. This <map> section lists the
Any report that uses this token
hyperdrill.xml
<hyperdrill>
<title>Full Detail For This Record</title>
<inputs>
<buildingBlock>[token Event_ID]</buildingBlock>
</inputs>
<outputs>
<slot input="[input event_id fieldType=Text validation=numeric]" output="[token Event_ID]" />
</outputs>
<report>event-detail</report>
</hyperdrill>
Can launch this hyperdrilling report

29 Reporting System Installation and Configuration Guide
hyperdrilling tokens that the report can use. The following excerpt from reports.xml
shows the definition of the keyword-search report.
In this case, the keyword-search report supports three different types of hyperdrilling
tokens � Event_ID, IPAddress, and dateRange. Since the Full Detail For This
Record hyperdrilling definition also used the Event_ID token, the Reporting System
can link the keyword-search report to the event-detail hyperdrilling report.
The <map> section lists any hyperdrilling tokens that the report can use
reports.xml
<report name="keyword-search" description="Search for keywords">
<sql>select [FIELDS STANDARD_SEARCHABLE_COLUMNS] from [TABLEEVENT] where [input column fieldType=Select options=[FIELDS STANDARD_SEARCHABLE_COLUMNS] defaultValue=type] like '%[inpukeyword fieldType=Text]%' and [INPUTGUI DATERANGE STANDARD] and [SECURITY DATARESTRICTION] order by ID</sql>
<summaryCols>
<col>type</col>
<col>facility_ip</col>
<col>priority</col>
<col>s_ip</col>
<col>t_ip</col>
<col>zone</col>
</summaryCols>
<map>
<slot input="ID" hyperDrillToken="[token Event_ID]" />
<slot input="facility_ip" hyperDrillToken="[token IPAddress]" />
<slot input="s_ip" hyperDrillToken="[token IPAddress]" /
<slot input="t_ip" hyperDrillToken="[token IPAddress]" /
<slot input="[INPUTGUI DATERANGE STANDARD]" hyperDrillToken="[token dateRange]" />
</map>
<output>
<header PreHeaderHtml="[HTML STANDARD_PRE_HEADER]" IncludeStandardHeader="true" PostHeaderHtml="[HTML STANDARD_POST_HEADER]" />
<table maxrows="1000" />
<footer html="[HTML STANDARD_FOOTER]" />
</output>
</report>

Chapter 1: About the Reporting System 30
How the system creates hyperdrilling reports
When you run a standard report, the Reporting System inserts links to any relevant
hyperdrilling reports. If you click on one of these links, the system builds the
appropriate hyperdrilling report.
To build the hyperdrilling report, the Reporting System first looks up the name of the
hyperdrilling report in hyperdrill.xml. The report name appears in the <report>
line.
The Reporting System also takes note of any information in the <outputs> section.
The <outputs> section consists of one or more lines. Each line lists an input variable,
and an output token.
The Reporting System gets the name of the hyperdrilling report
hyperdrill.xml
<hyperdrill>
<title>Full Detail For This Record</title>
<inputs>
<buildingBlock>[token Event_ID]</buildingBlock>
</inputs>
<outputs>
<slot input="[input event_id fieldType=Text validation=numeric]" output="[token Event_ID]" />
</outputs>
<report>event-detail</report>
</hyperdrill>
input variable
<outputs>
<slot input="[input event_id fieldType=Text]" output="[token Event_ID]" />
</outputs>
output token

31 Reporting System Installation and Configuration Guide
The Reporting System then looks up the hyperdrilling report in reports.xml. This file
tells the Reporting System how to build the finished report.
Once the Reporting System finds the report�s definition, it uses the information it
found in the <outputs> section of the hyperdrill.xml file to complete the report�s
The Reporting System looks up the instructions for building the hyperdrilling report
reports.xml
<report name="event-detail" description="Detail for Single Event">
<sql>select * from [TABLE EVENT] where ID = [input event_id fieldType=Text] and [SECURITY DATARESTRICTION]</sql>
<output>
<header PreHeaderHtml="[HTML STANDARD_PRE_HEADER]" IncludeStandardHeader="true" PostHeaderHtml="[HTML STANDARD_POST_HEADER]" />
<table maxrows="1000" />
<footer html="[HTML STANDARD_FOOTER]" />
</output>
</report>

Chapter 1: About the Reporting System 32
SQL query. The system finds the input variable in the report�s SQL query, and
replaces it with the value of the output token.
Once the Reporting System inserts the output token(s) from the hyperdrill.xml file,
it finishes building the report in the same way it would build any standard report.
<report name="event-detail" description="Detail for Single
Event">
<sql>select * from [TABLE EVENT] where
ID = [token Event_ID] and [SECURITY
DATARESTRICTION]</sql>
reports.xml
<report name="event-detail" description="Detail for Single
Event">
<sql>select * from [TABLE EVENT] where
ID = [input event_id fieldType=Text] and
[SECURITY DATARESTRICTION]</sql>
<outputs>
<slot input="[input event_id fieldType=Text]"
output="[token Event_ID]" />
</outputs>
hyperdrill.xml
It then replaces the input variable with the output token
reports.xml
The Reporting System reads reports.xml and finds a hyperdrilling input variable in the SQL statement
It searches hyperdrill.xml to find the associated output token

33 Reporting System Installation and Configuration Guide
The reportset.xml file
The reportset.xml file provides the list of reports and categories that make up the
navigation tree in the Reporting System interface.
reportset.xml
<category name=�Search� description=�Search�>
<report name=�keyword-search� description=�Search for keywords�></report>
<report name=�keyword-search-sum� description=�Search for keywords (Summary)�></report>
<report name=�date-search� description=�Simple Search by Date Range�></report>
<report name=�event-detail� description=�Detail for Single Event�></report>
</category>
The reportset.xml file creates the navigation tree
navigation tree

Chapter 1: About the Reporting System 34
How it all comes together
reportset.xml reports.xml
building_blocks.xml
hyperdrill.xml
The system builds the navigation tree from the list of reports and categories in reportset.xml
The system looks up the report in reports.xml, and gets the SQL query and formatting information it needs to build the report
The system looks up any tokens that appear in the report
The system identifies any links it needs to create between the finished report and other reports
The user selects a report
The system builds and displays the report

35 Reporting System Installation and Configuration Guide
2Installing the Reporting System (Windows)
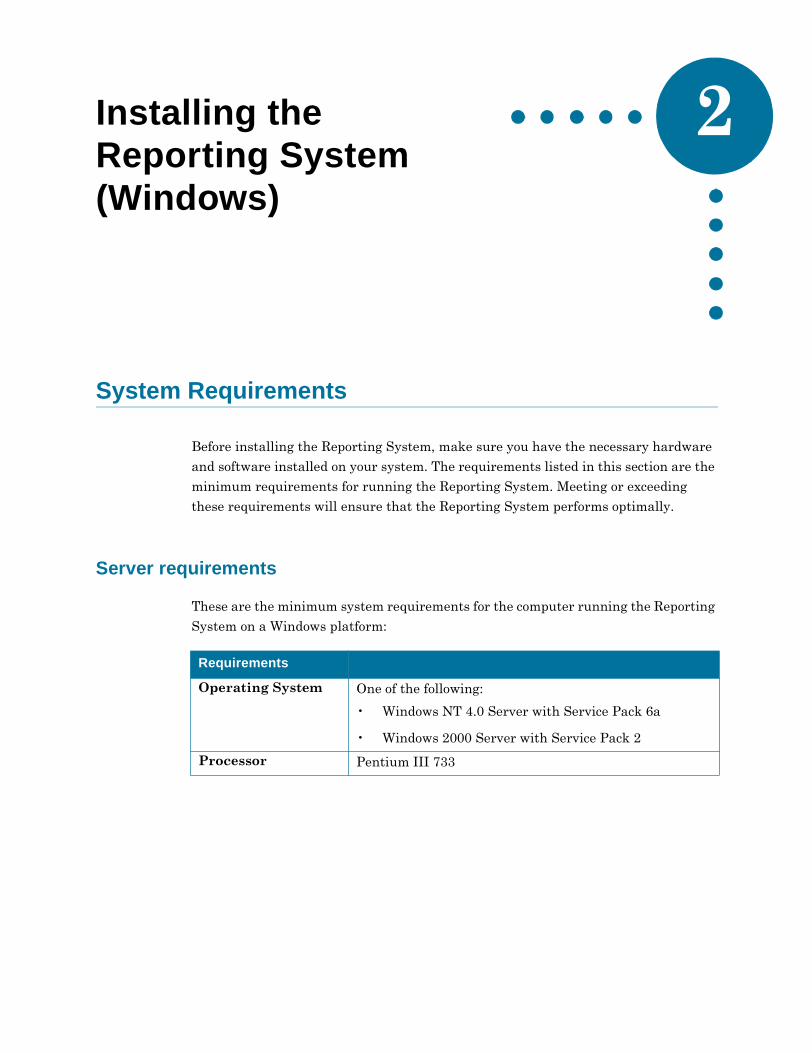
System Requirements
Before installing the Reporting System, make sure you have the necessary hardware
and software installed on your system. The requirements listed in this section are the
minimum requirements for running the Reporting System. Meeting or exceeding
these requirements will ensure that the Reporting System performs optimally.
Server requirements
These are the minimum system requirements for the computer running the Reporting
System on a Windows platform:
Requirements
Operating System One of the following:
� Windows NT 4.0 Server with Service Pack 6a
� Windows 2000 Server with Service Pack 2
Processor Pentium III 733

37 Reporting System Installation and Configuration Guide
Client requirements
You can access the Reporting System using a Web browser, providing that you know
the IP address of the computer running the system.
To access the Reporting System and run reports, you need to have one of the following
Web browsers installed:
� Internet Explorer 5.x
� Netscape 4.7
You must enable your Web browser for the following:
� Cookies
� Java
� JavaScript
Installing the Software
You must have an extraction key to install the Reporting System. If your software did
not come with an extraction key, or if you lose this information, please contact
Customer Support.
If you are installing the Reporting System with SPECTRUM�s Web Operator, refer to
the Installing and Using SPECTRUM Security Manager 3.3 with SPECTRUM guide
for installation instructions.
Memory 200 MB hard drive space
512 MB RAM
Database One of the following:
� MS SQL Server 7 with Service Pack 2
� Oracle 8i
Requirements

Chapter 2: Installing the Reporting System (Windows) 38
To install the Reporting System on Windows
1. Insert the Reporting System CD into your CD-ROM drive.
The Reporting System InstallShield starts.
If you do not have autorun enabled on your computer, go to Start > Run, type
D:/Reporting_System/Reporting_System.exe (change this path if your
CD-ROM uses a different drive letter), then click OK.
2. Follow the InstallShield instructions to install the Reporting System.
Connecting to a Database
To use a native driver to connect to the database
1. Navigate to <root>/webapps/reports/WEB-INF/etc/properties, and with any
text editor, open reports.properties.
2. Search for the paragraph labelled Database.
3. Edit the values of dbURL, driverName, user, and password to match the values of
your database and driver. Look for this information in the documentation for the
driver you are adding.
If you are installing the Reporting System on an SSM computer and you want to
use the same database driver for both the Reporting System and SSM itself, you
can copy the driver information from SSM's JDBC Configuration Wizard. Go to
Start > Programs >Spectrum Security Manager> Administration Tools >
Driver Configuration.
4. Save and close reports.properties.
5. Navigate to the location of the driver that you are adding, copy the driver and add
it to <root>/lib.
6. Navigate to <root>/bin, and open tomcat.bat with any text editor.
7. Locate the group of lines that resemble the following:
set CLASSPATH=%CLASSPATH%;%TOMCAT_HOME%\lib\<driver_name>.jar
8. Add the following line:
39 Reporting System Installation and Configuration Guide
set CLASSPATH=%CLASSPATH%;%TOMCAT_HOME%\lib\<new_driver>.jar
Where <new_driver> is the name of the driver that you are adding.
9. Save your changes and quit the text editor.
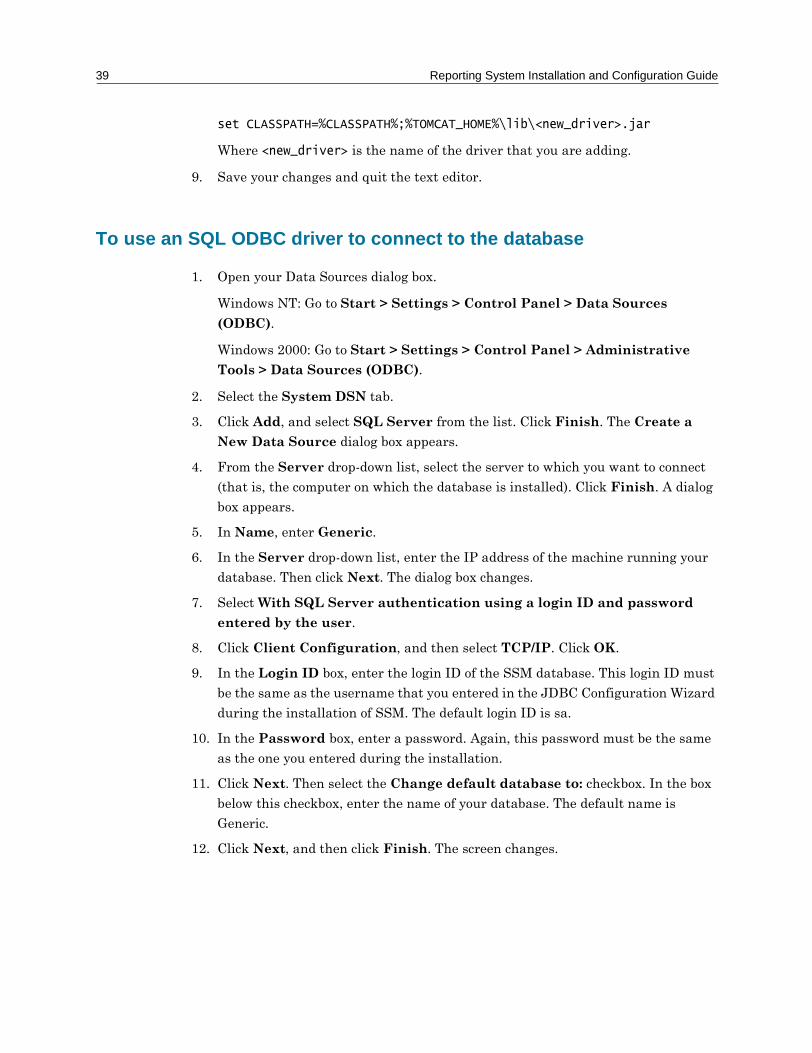
To use an SQL ODBC driver to connect to the database
1. Open your Data Sources dialog box.
Windows NT: Go to Start > Settings > Control Panel > Data Sources
(ODBC).
Windows 2000: Go to Start > Settings > Control Panel > Administrative
Tools > Data Sources (ODBC).
2. Select the System DSN tab.
3. Click Add, and select SQL Server from the list. Click Finish. The Create a
New Data Source dialog box appears.
4. From the Server drop-down list, select the server to which you want to connect
(that is, the computer on which the database is installed). Click Finish. A dialog
box appears.
5. In Name, enter Generic.
6. In the Server drop-down list, enter the IP address of the machine running your
database. Then click Next. The dialog box changes.
7. Select With SQL Server authentication using a login ID and password
entered by the user.
8. Click Client Configuration, and then select TCP/IP. Click OK.
9. In the Login ID box, enter the login ID of the SSM database. This login ID must
be the same as the username that you entered in the JDBC Configuration Wizard
during the installation of SSM. The default login ID is sa.
10. In the Password box, enter a password. Again, this password must be the same
as the one you entered during the installation.
11. Click Next. Then select the Change default database to: checkbox. In the box
below this checkbox, enter the name of your database. The default name is
Generic.
12. Click Next, and then click Finish. The screen changes.

Chapter 2: Installing the Reporting System (Windows) 40
13. Click Test Data Source. If the connection is successful, you can proceed to the
next step. If the test is not successful, you must review the process, confirm each
step, and test again. Click OK to finish.
To configure the ODBC driver to recognize your password
1. Navigate to <root>/webapps/reports/WEB-INF/etc/properties, and with any
text editor, open reports.properties.
2. In the reports.properties file, search for the section labeled Database.
3. Find the line password=.
4. To the right of password=, type the same password that you set in the previous
procedure.
5. Save your changes and quit the text editor.
Setting the Maximum Number of Users
The number of users that can simultaneously access the Reporting System depends on
the number of database connections that the system allows. The reports.properties
file sets the number of allowed database connections. By default, the Reporting
System supports four connections. Since each user takes up two connections, this
default means that only two users can access the Reporting System at the same time.
If you need to increase the number of users who can access the Reporting System at
the same time, edit the reports.properties file.
Some database manufacturers license their software based on a set number of
database connections. Before increasing the Reporting System�s number of allowed
connections, make certain that your database license covers the additional
connections.

41 Reporting System Installation and Configuration Guide
To change the maximum number of users
1. On the Reporting System server, navigate to <root>/webapps/reports/WEB-
INF/etc/properties.
2. Open the reports.properties file in any text editor.
3. Search for the paragraph labelled Database.
4. Edit the value of poolMaxSize to correspond to the maximum number of
connections that you want to have to the database.
5. Save your changes and quit the text editor.
Securing Connections Using SSL
Secure Sockets Layer (SSL) is a protocol for transmitting documents securely over the
Internet, using encryption. Web sites that use SSL generally have URLs that start
with https instead of http. You can use SSL to secure the web connections between
your users and the Reporting System.
If you decide to use SSL, you must disable port 8080 on your Reporting System server.
(For instructions, see "Setting up SSL".) Port 8080 is the port that you typically use to
access the Reporting System; SSL uses port 8443. If you do not disable port 8080,
users will be able to bypass SSL and access the Reporting System normally.
The Reporting System must be installed and working properly before you set up SSL.
Using SSL certificates
The Reporting System comes with a default SSL certificate. This certificate remains
valid until March, 2004. You can use this certificate, or replace it with your own SSL
certificate. The certificate file is named .keystore file, and is located in <root>/conf.
To use your own certificate, replace this file with a certificate of the same name.
For information on generating SSL certificates, see
http://jakarta.apache.org/tomcat/tomcat-3.2-doc/tomcat-ssl-howto.html#s62

Chapter 2: Installing the Reporting System (Windows) 42
Setting up SSL
1. On the Reporting System server, navigate to <root>/conf.
2. Open the server.xml file in any text editor.
3. Locate the following lines:
<!--Connector className="org.apache.tomcat.service.PoolTcpConnector">
<Parameter name="handler" value="org.apache.tomcat.service.http.HttpConnectionHandler"/>
<Parameter name="port" value="8443"/>
<Parameter name="socketFactory" value="org.apache.tomcat.net.SSLSocketFactory" />
<Parameter name="keystore" value="..\conf\.keystore" />
<Parameter name="keypass" value="password"/>
</Connector-->
4. Uncomment the lines.
Remove the �!--� that appears at the start of the text block (so that
<!--Connector becomes <Connector), and the �--� that appears at the end of the
text block (so that </Connector--> becomes </Connector>).
5. Locate the following lines:
<Connector className="org.apache.tomcat.service.PoolTcpConnector">
<Parameter name="handler" value="org.apache.tomcat.service.http.HttpConnectionHandler" />
<Parameter name="port" value="8080" />
</Connector>
6. Comment out the lines to disable port 8080.
To comment out the lines, replace <Connector with <!--Connector, and
</Connector> with </Connector-->.
7. Save your changes and quit the text editor.
Your Reporting System is now set up to use SSL. When you use SSL, you must
use a different URL to launch the Reporting System. See "Using a Web browser to
access the Reporting System" on page 43.

43 Reporting System Installation and Configuration Guide
Launching the Reporting System
You can launch the Reporting System from any Web browser, or you can launch the
Reporting System from within SSM or a Remote Console.
You must start Jakarta-Tomcat (on the Reporting System server) before you launch
the Reporting System.
Starting and stopping Jakarta-Tomcat
1. On the Reporting System server, double-click the Start Jakarta-Tomcat icon
(located on the Windows desktop).
Jakarta-Tomcat initializes the webapps in the WEB-INF directory. A DOS window
appears, showing this activity.
2. When you finish using the Reporting System, double-click the Stop Jakarta-
Tomcat icon on the desktop.
The DOS window disappears.
Using a Web browser to access the Reporting System
1. Open your Web browser.
2. Enter the URL of your reporting system.
By default, the URL uses the following format:
http://<IP address of computer running Jakarta-
Tomcat>:8080/reports/StartReportsStandalone.htm
If your Reporting System uses SSL, the URL uses the following format:
https://<IP address of computer running Jakarta-
Tomcat>:8443/reports/StartReportsStandalone.htm
The Reporting System web page appears, prompting you to log in.
Chapter 2: Installing the Reporting System (Windows) 44
Using SSM to access the Reporting System
You can access the Reporting System from an SSM Central Server or Remote Console.
These products provide a CS Reports button on their Main Console. Clicking this
button launches the Reporting System in a separate Web browser window.
Before you can use the CS Reports button, you must
� configure SSM so that it can launch an external Web browser
� configure the CS Reports button
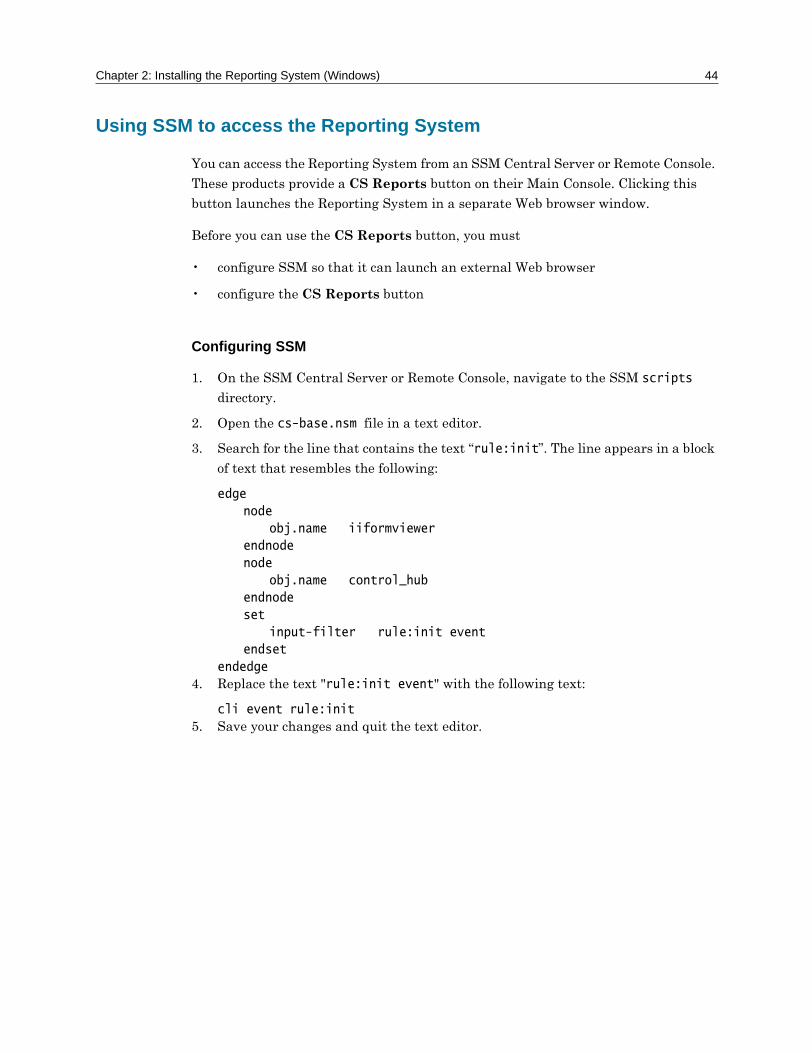
Configuring SSM
1. On the SSM Central Server or Remote Console, navigate to the SSM scripts
directory.
2. Open the cs-base.nsm file in a text editor.
3. Search for the line that contains the text �rule:init�. The line appears in a block
of text that resembles the following:
edge
node
obj.name iiformviewer
endnode
node
obj.name control_hub
endnode
set
input-filter rule:init event
endset
endedge
4. Replace the text "rule:init event" with the following text:
cli event rule:init
5. Save your changes and quit the text editor.

45 Reporting System Installation and Configuration Guide
Configuring the CS Reports button in SSM
1. On the SSM Central Server or Remote Console, navigate to the SSM scripts
directory.
1. Open the cs-mainpanel.nsm file in a text editor.
2. Search for the line that contains the text �key1�.
The line appears in a block of text that resembles the following:
message
on selection
cli
command key1
args key2
method execute
endcli
endmessage
3. Replace the text "key1" with the path and executable name of your Web browser.
For example: C:\Progra~1\Intern~1\IEXPLORE.EXE
4. Replace the text "key2" with the URL of your reporting system.
By default, the URL uses the following format:
http://<IP address of computer running Jakarta-
Tomcat>:8080/reports/StartReportsStandalone.htm
If your Reporting System uses SSL, the URL uses the following format:
https://<IP address of computer running Jakarta-
Tomcat>:8443/reports/StartReportsStandalone.htm
5. Save your changes.
The CS Reports button will work the next time you start SSM.
Removing the Software
If you plan to reinstall the Reporting System and you have created or modified any
reports, make certain that you back up your customized XML files before you remove
the software.

Chapter 2: Installing the Reporting System (Windows) 46
To remove the Reporting System
1. Navigate to Start > Settings > Control Panel, and double-click Add/Remove
Programs. The Add/Remove Programs Properties dialog box appears.
2. Select Reporting System from the list of currently installed programs.
3. Click Add/Remove. The Reporting System Uninstaller launches.
4. Follow the Uninstaller instructions to remove the Reporting System files.
5. Click Close to exit the Add/Remove Programs Properties dialog box.
The Reporting System uninstaller does not delete the directory where you
installed the application. You must delete this directory manually. The default
directory is /Reporting_System.

47 Reporting System Installation and Configuration Guide

3Installing the Reporting System (Solaris)
System Requirements
Before installing the Reporting System, make sure you have the necessary hardware
and software installed on your system. The requirements listed in this section are the
minimum requirements for running the Reporting System. Meeting or exceeding
these requirements will ensure that the Reporting System performs optimally.
Server requirements
These are the minimum system requirements for the computer running the Reporting
System on a Solaris platform:
Requirements
Operating System Solaris 8 with Solaris Common Desktop Environment (CDE)
Processor Sun Ultra 10 Model 440 1x440MHz UltraSPARC-lli
Database Oracle 8i
49 Reporting System Installation and Configuration Guide
Client requirements
You can access the Reporting System using a Web browser, providing that you know
the IP address of the computer running the system.
The Reporting System supports the following Web browser on the Solaris platform:
� Netscape 4.7
You must enable your Web browser for the following:
� Cookies
� Java
� JavaScript
Installing the Software
You must have an extraction key to install the Reporting System. If your software did
not come with an extraction key, or if you lose this information, please contact
Customer Support.
If you are installing the Reporting System with SPECTRUM�s Web Operator, refer to
the Installing and Using SPECTRUM Security Manager 3.3 with SPECTRUM guide
for installation instructions.
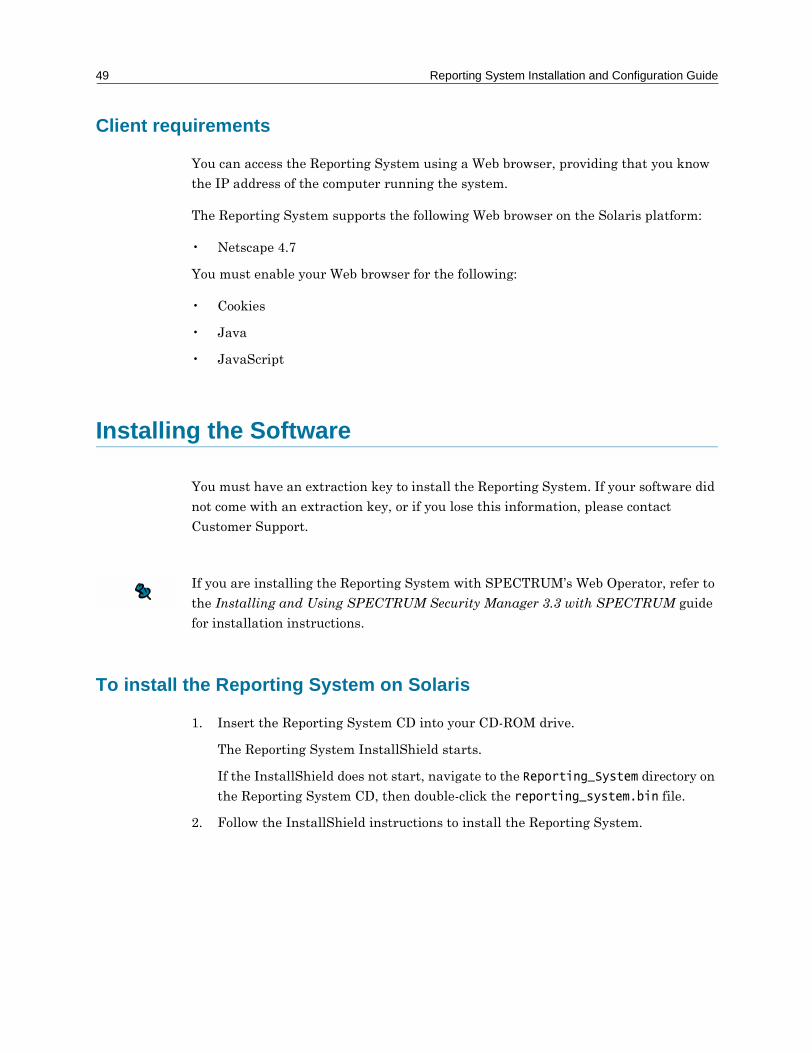
To install the Reporting System on Solaris
1. Insert the Reporting System CD into your CD-ROM drive.
The Reporting System InstallShield starts.
If the InstallShield does not start, navigate to the Reporting_System directory on
the Reporting System CD, then double-click the reporting_system.bin file.
2. Follow the InstallShield instructions to install the Reporting System.

Chapter 3: Installing the Reporting System (Solaris) 50
Connecting to a Database
To use a native driver to connect to the database
1. Go to <root>/webapps/reports/WEB-INF/etc/properties, and with any text
editor, open reports.properties.
2. Search for the paragraph labelled Database.
3. Edit the values of dbURL, driverName, user, and password to match the values of
your database and driver. Look for this information in the documentation for the
driver you are adding.
If you use the same database driver for the Reporting System as you use for SSM
itself, you can copy this information from SSM's JDBC Configuration Wizard. On
your SSM computer, go to the /opt/SSM/classes/Wizards directory, and double-
click JDBCWizard.bin.
4. Save and close reports.properties.
5. Navigate to the location of the driver that you are adding, copy the driver and add
it to <root>/lib.
6. Navigate to <root>/bin, and open tomcat.bat with any text editor.
7. Locate the group of lines that resemble the following:
set CLASSPATH=%CLASSPATH%;%TOMCAT_HOME%\lib\<driver_name>.jar
8. Add the following line:
set CLASSPATH=%CLASSPATH%;%TOMCAT_HOME%\lib\<new_driver>.jar
Where <new_driver> is the name of the driver that you are adding.
9. Save your changes and quit the text editor.
51 Reporting System Installation and Configuration Guide
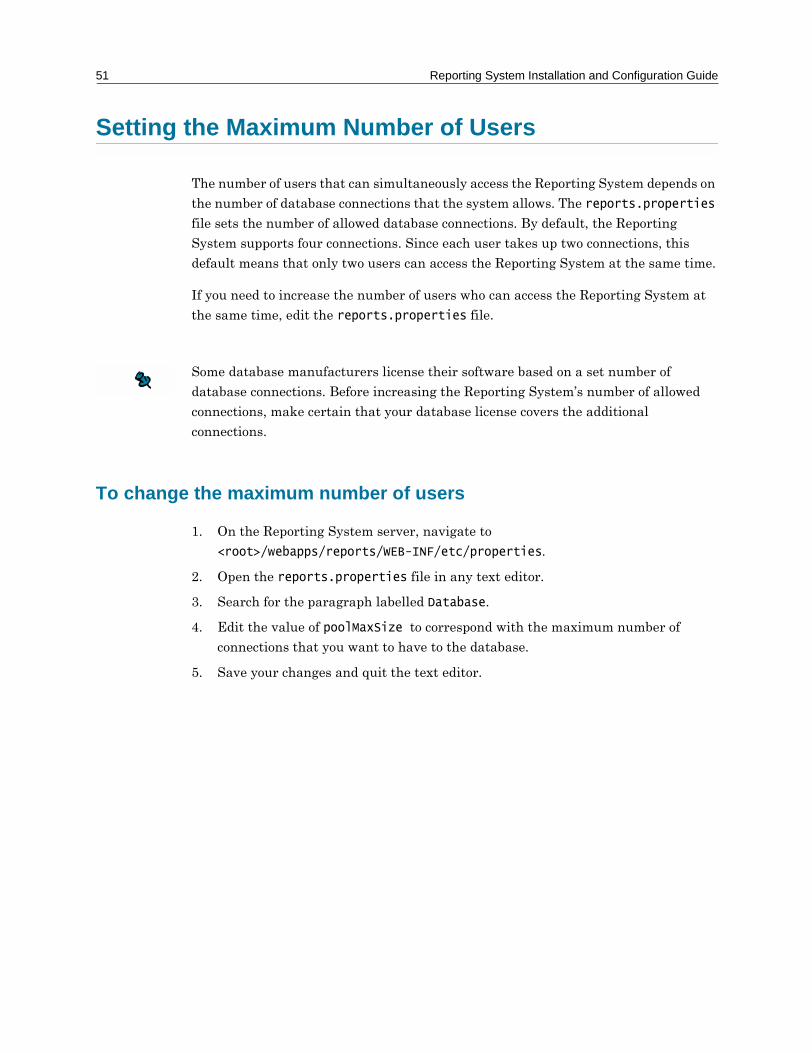
Setting the Maximum Number of Users
The number of users that can simultaneously access the Reporting System depends on
the number of database connections that the system allows. The reports.properties
file sets the number of allowed database connections. By default, the Reporting
System supports four connections. Since each user takes up two connections, this
default means that only two users can access the Reporting System at the same time.
If you need to increase the number of users who can access the Reporting System at
the same time, edit the reports.properties file.
Some database manufacturers license their software based on a set number of
database connections. Before increasing the Reporting System�s number of allowed
connections, make certain that your database license covers the additional
connections.
To change the maximum number of users
1. On the Reporting System server, navigate to
<root>/webapps/reports/WEB-INF/etc/properties.
2. Open the reports.properties file in any text editor.
3. Search for the paragraph labelled Database.
4. Edit the value of poolMaxSize to correspond with the maximum number of
connections that you want to have to the database.
5. Save your changes and quit the text editor.

Chapter 3: Installing the Reporting System (Solaris) 52
Securing Connections Using SSL
Secure Sockets Layer (SSL) is a protocol for transmitting documents securely over the
Internet, using encryption. Web sites that use SSL generally have URLs that start
with https instead of http. You can use SSL to secure the web connections between
your users and the Reporting System.
If you decide to use SSL, you must disable port 8080 on your Reporting System server.
(For instructions, see "Setting up SSL".) Port 8080 is the port that you typically use to
access the Reporting System; SSL uses port 8443. If you do not disable port 8080,
users will be able to bypass SSL and access the Reporting System normally.
The Reporting System must be installed and working properly before you set up SSL.
Using SSL certificates
The Reporting System comes with a default SSL certificate. This certificate remains
valid until March, 2004. You can use this certificate, or replace it with your own SSL
certificate. The certificate file is named .keystore file, and is located in <root>/conf.
To use your own certificate, replace this file with a certificate of the same name.
For information on generating SSL certificates, see
http://jakarta.apache.org/tomcat/tomcat-3.2-doc/tomcat-ssl-howto.html#s62

53 Reporting System Installation and Configuration Guide
Setting up SSL
1. On the Reporting System server, navigate to <root>/conf.
2. Open the server.xml file in any text editor.
3. Locate the following lines:
<!--Connector className="org.apache.tomcat.service.PoolTcpConnector">
<Parameter name="handler"
value="org.apache.tomcat.service.http.HttpConnectionHandler"/>
<Parameter name="port"
value="8443"/>
<Parameter name="socketFactory"
value="org.apache.tomcat.net.SSLSocketFactory" />
<Parameter name="keystore" value="../conf/.keystore" />
<Parameter name="keypass" value="password"/>
</Connector-->
4. Uncomment the lines.
Remove the �!--� that appears at the start of the text block (so that
<!--Connector becomes <Connector), and the �--� that appears at the end of the
text block (so that </Connector--> becomes </Connector>).
5. Locate the following lines:
<Connector className="org.apache.tomcat.service.PoolTcpConnector">
<Parameter name="handler" value="org.apache.tomcat.service.http.HttpConnectionHandler" />
<Parameter name="port" value="8080" />
</Connector>
6. Comment out the lines to disable port 8080.
To comment out the lines, replace <Connector with <!--Connector, and
</Connector> with </Connector-->.
7. Save your changes and quit the text editor.
Your Reporting System is now set up to use SSL. When you use SSL, you must
use a different URL to launch the Reporting System. See "Using a Web browser to
access the Reporting System" on page 54.

Chapter 3: Installing the Reporting System (Solaris) 54
Launching the Reporting System
You can launch the Reporting System from any Web browser, or you can launch the
Reporting System from within SSM or a Remote Console.
You must start Jakarta-Tomcat (on the Reporting System server) before you launch
the Reporting System.
Starting and stopping Jakarta-Tomcat
1. On the Reporting System server, navigate to <root>/bin.
2. Double-click startup.sh.
Jakarta-Tomcat starts, and a script window appears. Do not close this window.
3. When you finish using the Reporting System, navigate to <root>/bin/tomcat.sh
and type stop.
The script window closes.
Using a Web browser to access the Reporting System
1. Open your Web browser.
2. Enter the URL of your reporting system.
By default, the URL uses the following format:
http://<IP address of computer running Jakarta-
Tomcat>:8080/reports/StartReportsStandalone.htm
If your Reporting System uses SSL, the URL uses the following format:
https://<IP address of computer running Jakarta-
Tomcat>:8443/reports/StartReportsStandalone.htm
The Reporting System web page appears, prompting you to log in.

55 Reporting System Installation and Configuration Guide
Using SSM to access the Reporting System
You can access the Reporting System from an SSM Central Server or Remote Console.
These products provide a CS Reports button on their Main Console. Clicking this
button launches the Reporting System in a separate Web browser window.
Before you can use the CS Reports button, you must
� configure SSM so that it can launch an external Web browser
� configure the CS Reports button
Configuring SSM
1. On the SSM Central Server or Remote Console, navigate to the SSM scripts
directory.
2. Open the cs-base.nsm file in a text editor.
3. Search for the line that contains the text �rule:init�. The line appears in a block
of text that resembles the following:
edge
node
obj.name iiformviewer
endnode
node
obj.name control_hub
endnode
set
input-filter rule:init event
endset
endedge
4. Replace the text "rule:init event" with the following text:
cli event rule:init
5. Save your changes and quit the text editor.

Chapter 3: Installing the Reporting System (Solaris) 56
Configuring the CS Reports button in SSM
1. Navigate to your cs-mainpanel.nsm file, and open the file in a text editor.
This file is located in the SSM scripts directory.
2. Search for the line that contains the text �key1�.
The line appears in a block of text that resembles the following:
message
on selection
cli
command key1
args key2
method execute
endcli
endmessage
3. Replace the text "key1" with the path and executable name of your Web browser.
For example: /usr/dt/bin/netscape.
4. Replace the text "key2" with the URL of your reporting system.
By default, the URL uses the following format:
http://<IP address of computer running Jakarta-
Tomcat>:8080/reports/StartReportsStandalone.htm
If your Reporting System uses SSL, the URL uses the following format:
https://<IP address of computer running Jakarta-
Tomcat>:8443/reports/StartReportsStandalone.htm
5. Save your changes.
The CS Reports button will work the next time you start SSM.
57 Reporting System Installation and Configuration Guide
Removing the Software
If you plan to reinstall the Reporting System and you have created or modified any
reports, make certain that you back up your customized XML files before you remove
the software.
To remove the Reporting System
� To remove the Reporting System, delete the Reporting System directory
manually.
4Setting Up Users and Groups
Overview
The Reporting System lets you control who has access to the system. If you decide to
restrict access, you:
� create user accounts
� create groups of users
� assign passwords to users
� assign access rights to groups
The Reporting System then authenticates users when they log in.
If your system is secure enough, or the information you are dealing with isn�t
sensitive, you can disable the Reporting System�s authentication feature.
When you add a user to the Reporting System, you must associate them with a group,
so that you can assign an access level to them. Access levels allow you to define how
you want to restrict a user�s access to information through the Reporting System. You
define an access level according to any combination of the fields in your SSM
database.

59 Reporting System Installation and Configuration Guide
The Reporting System comes set up with the following defaults:
� group: administrator
� access level: adminstrator_level
� user: administrator
To set up additional users and groups you must modify the following files:
� building_blocks.xml
� groups.xml
� users.xml
When you install the Reporting System, XML configuration files are placed in the
Reporting System <root>/lib/itactics/report/conf/dist. However, service pack
releases of the Reporting System overwrite the files in the dist directory, so you must
work with a separate version of these files. See "Using MakeXML" on page 89 for more
information.
When you add users and groups, you must make changes to your working XML files
in the following order:
1. Set up the MakeXML utility. See "To set up MakeXML" on page 88.
2. Create new access levels (building_blocks.xml).
3. Create new groups and assign access levels to them (groups.xml).
4. Create new users and associate them with a group (users.xml).
5. Run the passwd batch file to assign passwords to the new users.
6. Run MakeXML to update the cust directory. See "To use MakeXML" on page 89.

Chapter 4: Setting Up Users and Groups 60
Creating Access Levels
You can restrict a user�s access to information according to any combination of the
fields in your SSM database. Users can only see report results that meet the
conditions defined by their access level.
You must configure your MakeXML utility before you create new access levels. See
"Setting up MakeXML" on page 88.
To create a new access level
1. Navigate to your working XML directory.
This is usually <root>/lib/itactics/report/conf/mycust.
2. Open the building_blocks.xml file in any text editor.
3. Add a new data restriction using the following syntax:
<key name="<[DATARESTRICTION access_level]>" value="<some_value>" />
Where <[DATARESTRICTION access_level]> is the name of the new data
restriction and <some_value> is the conditions under which users can access
information.
4. Save your changes and quit the text editor.
Your changes will not take effect until you run MakeXML to merge your working
XML files with the default XML files (see "Using MakeXML" on page 89). If you
intend to add users and groups, make those changes before running MakeXML.

61 Reporting System Installation and Configuration Guide
Creating Groups
You must configure your MakeXML utility before you create new groups. See "Setting
up MakeXML" on page 88.
To create a new group
1. Navigate to your working XML directory.
This is usually <root>/lib/itactics/report/conf/mycust.
1. Open the groups.xml file in any text editor.
2. Add a new group definition at the end of the file, using the following syntax:
<groups>
<group name="<group_name>" data_restriction="<access_level>">
</groups>
Where <group_name> is the name of the new group and <access_level> is the
name of an access level defined in the in the building_blocks.xml file.
3. Save your changes and quit the text editor.
Your changes will not take effect until you run MakeXML to merge your working
XML files with the default XML files (see "Using MakeXML" on page 89). If you
intend to add users or new access levels, make those changes before running
MakeXML.

Chapter 4: Setting Up Users and Groups 62
Adding Users to Groups
You must configure your MakeXML utility before you create new users. See "Setting
up MakeXML" on page 88.
To create a new user
1. Navigate to your working XML directory.
This is usually <root>/lib/itactics/report/conf/mycust.
2. Open the users.xml file in any text editor.
3. Add a new user definition at the end of the file, using the following syntax:
<users>
<user name="user_name" group="group_name" />
</users>
Replace <user_name> with the name of the new user (remember that the
Reporting System is case-sensitive). Replace <group_name> with the name of a
group defined in the in the groups.xml file.
4. Save your changes and quit the text editor.
Your changes will not take effect until you run MakeXML to merge your working
XML files with the default XML files (see "Using MakeXML" on page 89). If you
intend to add groups or new access levels, make those changes before running
MakeXML.

63 Reporting System Installation and Configuration Guide
Assigning Passwords to Users
When you add a user to the Reporting System, they are not automatically assigned a
password. You must assign a password to each user you create, using the system�s
passwd utility. If you do not, the user will not be able to access the Reporting System.
The Reporting System stores passwords in:
<root>/webapps/reports/WEB-INF/etc/bin/passwd.
The password file is encrypted using MD5.
If you use the passwd utility to create a user that already exists, the utility does not
warn you. The utility changes the existing user�s password. Check your users.xml file
before creating a new user, to verify that you do not re-use an existing user name.
To assign a password to a user
1. Using a command-line, navigate to <root>/webapps/reports/WEB-INF/etc/bin.
You should have a file called passwd.bat.
2. Type:
passwd -c <NewUserName> ../passwd
Where <NewUserName> is the name of a user that is listed in your users.xml file.
Remember that the Reporting System is case-sensitive; the user name you enter
must match the users.xml entry exactly.
You will be prompted to create a password.
3. Enter the password that you want to assign the user.
You will be prompted to reenter the password.
4. Reenter the password.
A message appears informing you that the user�s password has been added.

Chapter 4: Setting Up Users and Groups 64
To change a user’s password
1. Using a command-line, navigate to <root>/webapps/reports/WEB-INF/etc/bin.
You should have a file called passwd.bat.
2. Type:
passwd -c <UserName> ../passwd
Where <UserName> is the name of the user whose password you want to change.
When entering the user name and password, remember that the Reporting
System is case-sensitive.
You will be prompted to enter a new password for the user.
3. Enter the password that you want to assign the user.
You will be prompted to reenter the password.
4. Reenter the password.
The Reporting System changes the user�s password.

65 Reporting System Installation and Configuration Guide
Removing users
To completely remove a user from the Reporting System, you must delete them from:
� the system�s password file
� your working users.xml file
To delete a user’s account
1. Using a command-line, navigate to <root>/webapps/reports/WEB-INF/etc/bin.
You should have a file called passwd.bat.
2. Type:
passwd -d <UserName> ../passwd
The passwd utility asks you to confirm that you want to delete the user.
3. Type yes, then press Enter.
The passwd utility confirms that it deleted the user�s password.
4. Navigate to your working XML directory.
This is usually <root>/lib/itactics/report/conf/mycust.
5. Open the users.xml file in a text editor.
6. Locate and delete the user�s entry.
The user�s entry uses the following syntax:
<users>
<user name="UserName" group="GroupName" />
</users>
7. Save your changes and quit the text editor.
8. Navigate to the makexml.bat file and double-click it. The MakeXML utility
merges your changes with the main system files.
The makexml.bat file is located in <root>/webapps/reports/WEB-INF/etc/bin.
You have deleted the user�s Reporting System account.
Chapter 4: Setting Up Users and Groups 66
Disabling authentication
By default, the Reporting System tries to authenticate users when they log in. If your
system is secure enough, or the information you are dealing with isn�t sensitive, you
can disable the Reporting System�s authentication feature.
To disable authentication
1. Quit the Reporting System and shut down Jakarta Tomcat.
Windows users: Close your Reporting System Web browser, and double-click the
Stop Jakarta-Tomcat icon on your Windows desktop.
Solaris users: Close your Reporting System Web browser, then navigate to
<root>/bin/tomcat.sh and type stop.
2. Navigate to <root>/webapps/reports/WEB-INF/etc/properties.
3. Open the reports.properties file in a text editor.
4. Add the following line to the end of the file:
authenticationType=bypass
5. Save your changes and quit the text editor.
You have disabled authentication. When users access the Reporting System, they
will not have to log in.

67 Reporting System Installation and Configuration Guide

5Using the Reporting System
Logging Into and Out of the Reporting System
When you access the Reporting System, the Login page appears in your Web browser
window. Your Reporting System administrator must assign you a user name and
password before you can log in. The Reporting System uses your user name and password to verify that you have the right to access the system.
If you do not see a Login page when you start the Reporting System, your Reporting
System administrator may have disabled authentication. You will not need to log in or
out of the Reporting System.
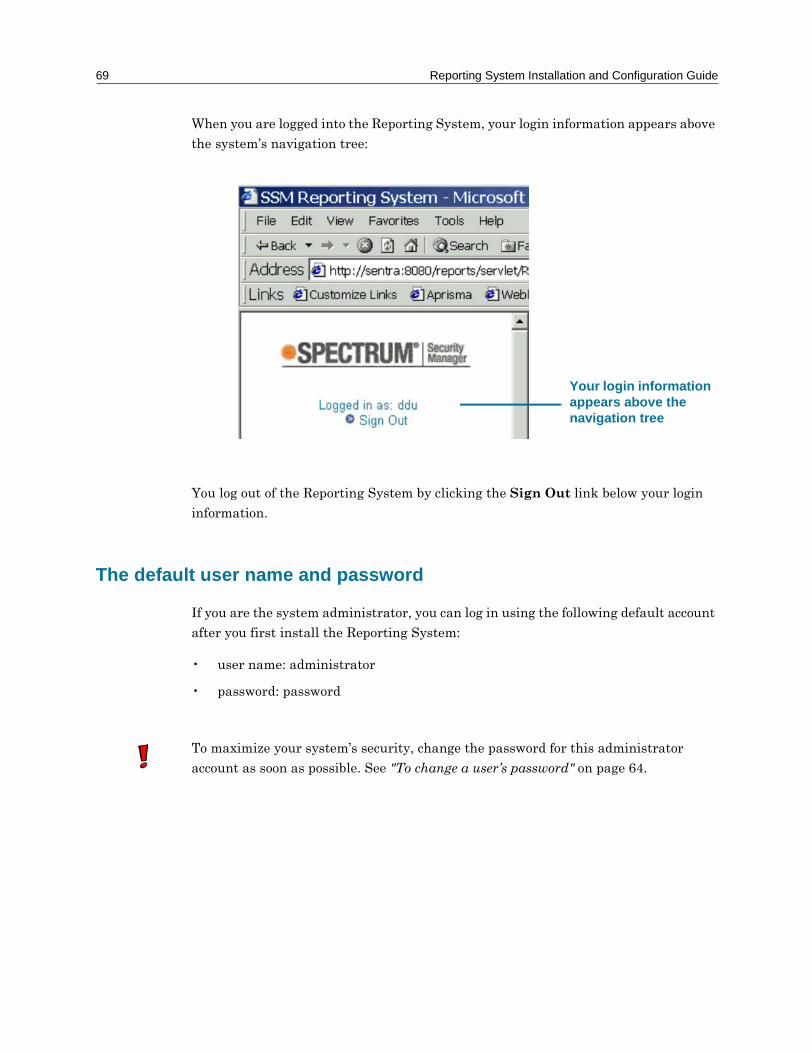
69 Reporting System Installation and Configuration Guide
When you are logged into the Reporting System, your login information appears above
the system�s navigation tree:
You log out of the Reporting System by clicking the Sign Out link below your login
information.
The default user name and password
If you are the system administrator, you can log in using the following default account
after you first install the Reporting System:
� user name: administrator
� password: password
To maximize your system�s security, change the password for this administrator
account as soon as possible. See "To change a user�s password" on page 64.
Your login information appears above the navigation tree

Chapter 5: Using the Reporting System 70
To log into the Reporting System
1. Launch the Reporting System.
You can launch the Reporting System by entering its URL in your Web browser,
or by clicking the CS Reports button in the SSM Central Server or Remote
Console. See "Using a Web browser to access the Reporting System" on page 43.
The Login page includes two fields: User Name and Password.
2. Type your user name and password.
The Reporting System is case-sensitive.
3. Click Submit.
The Reporting System verifies your user information.
If you enter your user name or password incorrectly, the Login page appears
again and displays an error message. If you fail to log in three times, the system
may not let you try again. If this happens, contact the Reporting System
administrator and verify your user name and password. The administrator must
restart Jakarta-Tomcat before you can try launching the Reporting System again.

71 Reporting System Installation and Configuration Guide
To log out of the Reporting System
� Click the Sign Out link in the Reporting System�s navigation tree.
Running a Basic Report
Many of the reports in the Reporting System do not require any input from you. You
select the report�s name from the navigation list, and the Reporting System runs it.
By default, these reports are listed under the following categories:
Category Type of Information
General Recent Activity Reports
The reports in this category provide information about events which have occurred in a certain period of time.
IDS Reports The reports in this category provide information about IDS events. This includes recent activity, trends and categorization of the types of IDS events which occur.
Anti Virus Reports The reports in this category provide information about anti virus events. This includes recent activity, virus scans, virus detection and anti virus system information.
Firewall Reports The reports in this category provide information about firewall events. This includes recent activity, firewall traffic and authentication.
Configuration Change Reports
The reports in this category provide information about system configuration changes. This includes recent activity, user changes, group changes and audit log changes.

Chapter 5: Using the Reporting System 72
To run a basic report
1. In the navigation tree, click the name of the category that contains the report you
want to run.
The navigation tree expands to list all subcategories and reports that belong in
that category.
2. Click the name of the report that you want to run.
The report results are displayed in the display area.
Repeating a basic report
If you run several reports, the Reporting System keeps track of them for you in a list
at the top of the display area. You can re-run a previous report by selecting its name
from the list. When you re-run a previous report, you do not return to the original
results. Those results could be out of date, so the Reporting System retrieves a new
set of results from its database, using the parameters of the previous report.
To repeat a basic report
� In the display area, choose the name of the report that you want to run in the
Recently Run Reports drop-down menu.
The report results are displayed in the display area.

73 Reporting System Installation and Configuration Guide
Querying the Database
You can query the database by running a search report. You can search according to
the following criteria:
� Keyword
� Date Range
� Event ID
� IP Address
The Reporting System is case-sensitive. This means, for instance, that a keyword
search for �firewall� will generate different results than a search for �Firewall�. If you
do not see the results you expect after running a search, check the capitalization of
your search criteria.
To run a search
1. In the navigation tree, click Search.
The navigation tree expands to list all of the search types.
If your administrator has added custom search reports, they may appear in other
categories.
2. Click the name of the search report that you want to run.
The the search setup screen appears.
3. Enter your search criteria.
The Reporting System is case-sensitive.
4. Click the Generate this Report button.
The report results are displayed in the display area.

Chapter 5: Using the Reporting System 74
Repeating a search
If you run several reports, the Reporting System keeps track of them for you in a list
at the top of the display area. You can re-run a previous report by selecting its name
from the list. When you re-run a previous report, you do not return to the original
results. Those results could be out of date, so the Reporting System retrieves a new
set of results from its database, using the parameters of the previous report.
To repeat a search
1. In the reports screen, choose the name of the search that you want to run from the
Recently Run Reports list.
The search setup screen appears with the criteria that was last entered for the
search.
2. Do one of the following:
� If you want to search according to the criteria of a previous search, select the
timestamp for the search that you want to rerun from the drop-down menu.
� If you want to search according to new criteria, enter the new search criteria.
3. Click the Generate this Report button.
The report results are displayed in the display area.
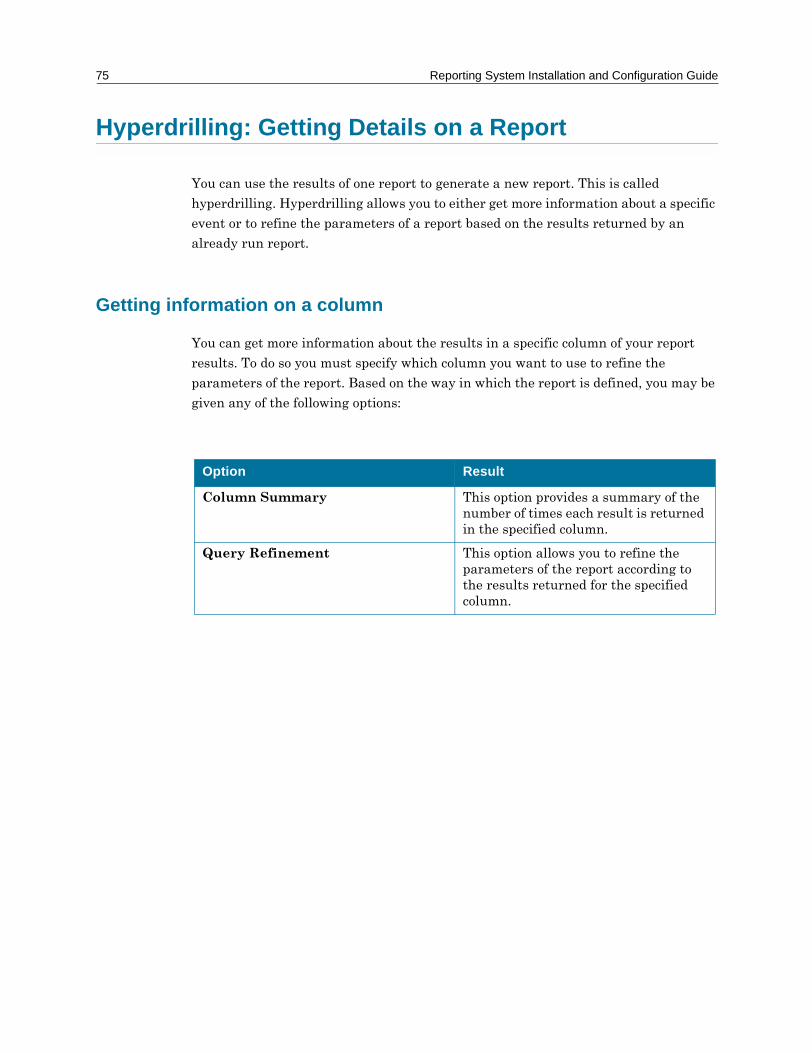
75 Reporting System Installation and Configuration Guide
Hyperdrilling: Getting Details on a Report
You can use the results of one report to generate a new report. This is called
hyperdrilling. Hyperdrilling allows you to either get more information about a specific
event or to refine the parameters of a report based on the results returned by an
already run report.
Getting information on a column
You can get more information about the results in a specific column of your report
results. To do so you must specify which column you want to use to refine the
parameters of the report. Based on the way in which the report is defined, you may be
given any of the following options:
Option Result
Column Summary This option provides a summary of the number of times each result is returned in the specified column.
Query Refinement This option allows you to refine the parameters of the report according to the results returned for the specified column.

Chapter 5: Using the Reporting System 76
To run a Column Summary report
1. On the report result page, click the heading link of the column that you want to
get more information about.
The Column Hyper Drilling Options page appears in the reports screen and
lists the ways in which you can generate new reports.
2. Click Column Summary.
If the column that you selected to summarize is the only column from which you
can generate a summary, the report results page for the column summary
appears.
If there are multiple columns from which you can generate summary reports, the
Column Hyper Drilling Options page appears again and displays a Results
may additionally be grouped by: message with a list of columns that you can
group the results by.
3. Select the columns that you want to use to group the results.
4. Click the Create Column Summary button.
The report results page for the column summary appears.
To run a Query Refinement
1. On the report result page, click the heading link of the column that you want to
get more information about.
The Column Hyper Drilling Options page appears in the reports screen and
lists the ways in which you can generate new reports.
2. Click Query Refinement.
The Query Refinement Options page appears.
3. Select the way in which you want to refine the query in the operator drop-down
menu.
Operator Query Refinement
LIKE Returns all results that contain the information you are using as the basis for your query refinement.
NOT_LIKE Returns all results that do not contain the information you are using as the basis for your query refinement.

77 Reporting System Installation and Configuration Guide
4. Type the information that you want to use as the basis for you query refinement
in the query refinement field.
5. Click the Submit Query Refinement button.
The report results page for the query refinement appears.
Getting information on a row
You can navigate to reports related to the data in a given row. To do so you must
specify which row you want to use to refine the parameters of the report. Based on
the way in which the report is defined, you may be given any of the following
options:
= Returns all results that are an exact match with the information you are using as the basis of your query refinement.
!= Returns all results that are not an exact match with the information you are using as the basis of your query refinement.
Operator Query Refinement
Option Result
View record details for this report grouping
This option applies to rows in a summary report. It generates the individual results for the events summarized in the row.
Full Detail For This Record This option applies to rows which describe individual events. It generates the event-detail report for the event which corresponds to the row�s event ID.
Track Facility IPAddress This option generates the individual results for the events which have an IP address that corresponds with the specified Facility IP Address.
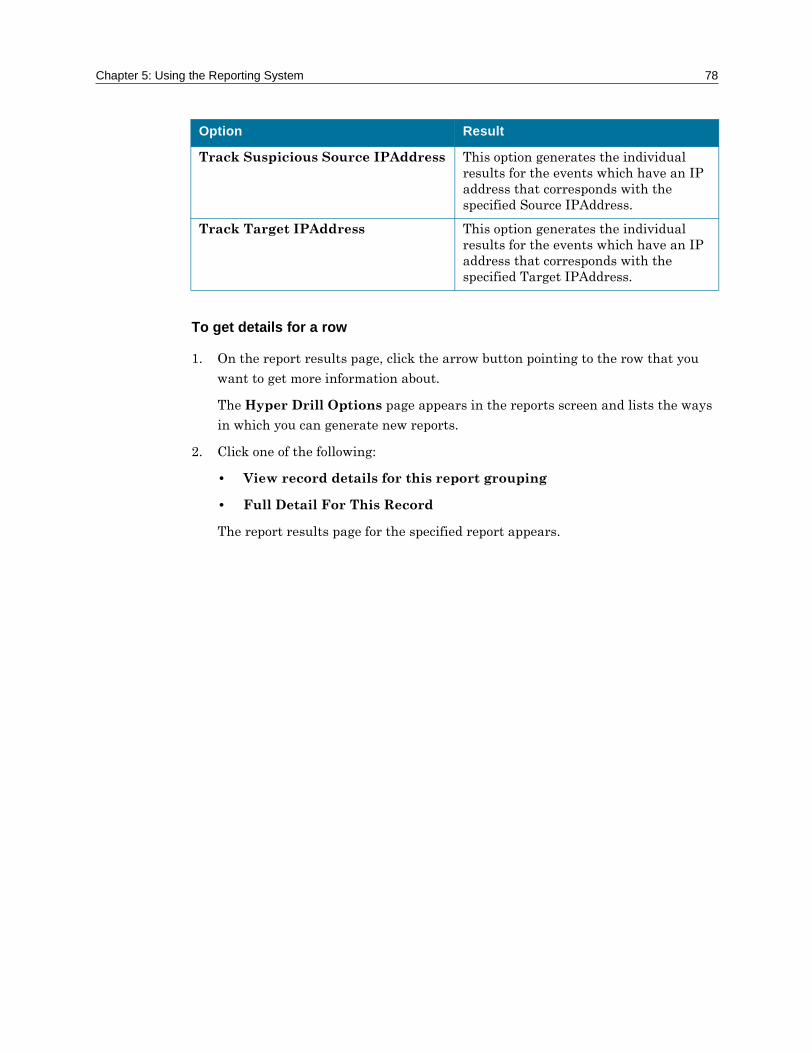
Chapter 5: Using the Reporting System 78
To get details for a row
1. On the report results page, click the arrow button pointing to the row that you
want to get more information about.
The Hyper Drill Options page appears in the reports screen and lists the ways
in which you can generate new reports.
2. Click one of the following:
� View record details for this report grouping
� Full Detail For This Record
The report results page for the specified report appears.
Track Suspicious Source IPAddress This option generates the individual results for the events which have an IP address that corresponds with the specified Source IPAddress.
Track Target IPAddress This option generates the individual results for the events which have an IP address that corresponds with the specified Target IPAddress.
Option Result

79 Reporting System Installation and Configuration Guide
To track an IP address
1. On the report results page, click the arrow button pointing to the row that you
want to get more information about.
The Hyper Drill Options page appears in the reports screen and lists the ways
in which you can generate new reports.
2. Click one of the following:
� Track Facility IPAddress
� Track Suspicious Source IPAddress
� Track Target IPAddress
The Multi Mapped Token Select page may appear.
3. Select the IP address column that you want to compare with the specified IP
address.
The report results page for the specified report appears.

6Using the MakeXML utility
Overview
Most of the Reporting System�s critical information is stored in XML files. You can
customize the Reporting System by editing these XML files.
The default XML files are located in <root>\lib\itactics\report\conf\dist,
but you should never edit these files directly. Reporting System upgrades and service
releases overwrite this directory. To avoid losing your customized files, you must work
in a separate, working directory with your own versions of the system XML files. The
Reporting System automatically creates a working directory for you when you install
the software. This working directory is located in <root>\lib\itactics\report\
conf\mycust. The mycust directory contains template versions of each system XML
file for you to edit.
The Reporting System provides a utility that automatically merges your working
XML files with the default XML files. This utility is called MakeXML. The merged
files are stored in a third directory, called cust. The Reporting System uses the files in
the cust directory.
If the Reporting System cannot find a cust directory, it uses the files in your dist
directory.

81 Reporting System Installation and Configuration Guide
How MakeXML merges files
MakeXML uses two configuration files to identify and merge XML files:
� confdrs
� conffls
The Reporting System stores these files in the <root>\webapps\reports\WEB-INF\
etc directory.
The confdrs file lists your working XML directory or directories. This file lists your
mycust working directory by default. If you create any other working directories, you
must add their names to this file.
The conffls file lists any XML files that you want MakeXML to merge. MakeXML
looks for these files in the directories specified in the confdrs file. When you run
MakeXML, the utility compares each file listed in conffls to the equivalent file in the
Reporting System�s dist directory.
When MakeXML finds differences, it tries to create a merged version of the files. The
utility places the merged versions in the Reporting System�s cust directory. The
conffls
building_blocks.xml
hyperdrill.xml
reports.xml
reportset.xml
users.xml
groups.xml
confdrs
mycust
MakeXML compares the files in its dist directory to these files...
...in this directory

Chapter 6: Using the MakeXML utility 82
Reporting System uses the files in your cust directory. If the system does not find a
cust directory, it uses the unmerged files in your dist directory instead.
working directory
XML
XML XML
XML
XML
XML
dist directory
XML
XML XML
XML
XML
XML
cust directory
XML
XML XML
XML
XML
XML
MakeXML compares the files in your working directory to the files in the dist directory...
...and creates a merged version of each file in the cust directory

83 Reporting System Installation and Configuration Guide
When MakeXML compares files in your working directory to files in the dist
directory, it looks for parallel entries.
If MakeXML finds parallel entries, it decides which copy to use in the merged version
of the file:
� An entry in your working XML files always overrides an entry in the dist XML
file;
� If you have multiple working directories, MakeXML uses the entry in the last file
it reads. MakeXML reads files and directories in the order in which they are
listed in confdrs and conffls.
If MakeXML finds information in one file that does not exist in the other, the utility
includes the information in the merged version of the file.
The merged version of a file contains
� all unchanged information from the original XML file (in the dist directory)
� all new material from your working XML file(s)
� any changed information from your working XML file(s)
When comparing MakeXML looks for
building_blocks.xml Lines using the same key name attribute
reports.xml Report definitions that use the same report name attribute
hyperdrill.xml Hyperdrill definitions that use the same title attribute
reportset.xml Lines that use either the same report name, or the same category name attribute
users.xml Lines using the same user name attribute
groups.xml Lines using the same group name attribute

Chapter 6: Using the MakeXML utility 84
The following graphic illustrates how MakeXML merges files.
Your working files always override any system files. This means that if you ever
upgrade the Reporting System, your working files could override the newer system
MakeXML then creates a merged file in the cust directory
MakeXML compares the original copy of the XML file (in the dist directory) to your working file
<category name=�Search� description=�Search�>
<report name=�keyword-search�
description=�Search for keywords�></report>
</category>
<category name=�Search� description=�Search Reports�>
<report name=�date-search�
description=�Simple Search by Date Range�></report>
</category>
<category name=�Search� description=�Search Reports�>
<report name=�keyword-search�
description=�Search for keywords�></report>
<report name=�date-search�
description=�Simple Search by Date Range�></report>
</category>
original file (in the dist directory)
merged file (in the cust directory)
your version of the file (in mycust or another working directory)
The utility finds any changes and additions
85 Reporting System Installation and Configuration Guide
files. Never copy the entire contents of the default system files into your working files.
Your working XML files should only contain changes and additions to the system
XML files.

Chapter 6: Using the MakeXML utility 86
Using special characters in XML files
When you edit the Reporting System XML files, you must be aware of character
restrictions that apply to your use of
� quotation marks
� greater-than and less-than symbols
Quotation marks
Version 1.0 of the Reporting System used single quotes (') in files like
building_blocks.xml. Later versions of the Reporting System use standard
quotation marks ("). MakeXML can parse both versions, but the system may generate
an error 80 message if you use nested quotes within an XML file. The error 80
message indicates that the Reporting System couldn�t resolve a token.
For instance, the following token would cause an error 80 message because it uses a
nested ' symbol:
<key name='[HTML STANDARD_FOOTER]'
value='Company's name.'>
</key>
If you need to use nested quotes within an XML file, you can avoid errors by using
HTML codes for the nested symbols:
� a normal quotation mark (") is " or "
� a single quote or apostrophe (') is '
Using these symbols, the previous example becomes:
<key name='[HTML STANDARD_FOOTER]'
value='Company's name.'>
</key>

87 Reporting System Installation and Configuration Guide
Greater-than and less-than symbols
MakeXML cannot parse any nested greater-than and less-than symbols (> and <) that
you use to add HTML tags to tokens and reports. For instance, MakeXML cannot
parse the greater-than and less-than symbols around the HTML tag in the following
token:
<key name='[HTML STANDARD_FOOTER]'
value='<IMG src="images/logo.gif">'>
</key>
You can avoid system errors by replacing the nested < and > symbols with their
HTML codes:
� a less-than symbol (<) is <
� a greater-than symbol (>) is >
Using these HTML codes, the previous example becomes:
<key name='[HTML STANDARD_FOOTER]'
value='<IMG src="images/logo.gif">'>
</key>

Chapter 6: Using the MakeXML utility 88
Setting up MakeXML
Before you create or modify reports, you must set up MakeXML. This involves
configuring MakeXML with the name of the XML files you plan to work with.
To set up MakeXML
1. Navigate to <root>/webapps/reports/WEB-INF/etc, and open the file conffls in
a text editor.
2. At the end of the file, type the name of each XML file that you intend to modify.
List each file on a separate line. If you are not certain which files you intend to
edit, list all of the major Reporting System XML files:
� building_blocks.xml
� groups.xml
� hyperdrill.xml
� reports.xml
� reportset.xml
� users.xml
3. Save your changes and exit the text editor.
The MakeXML utility is now configured properly.
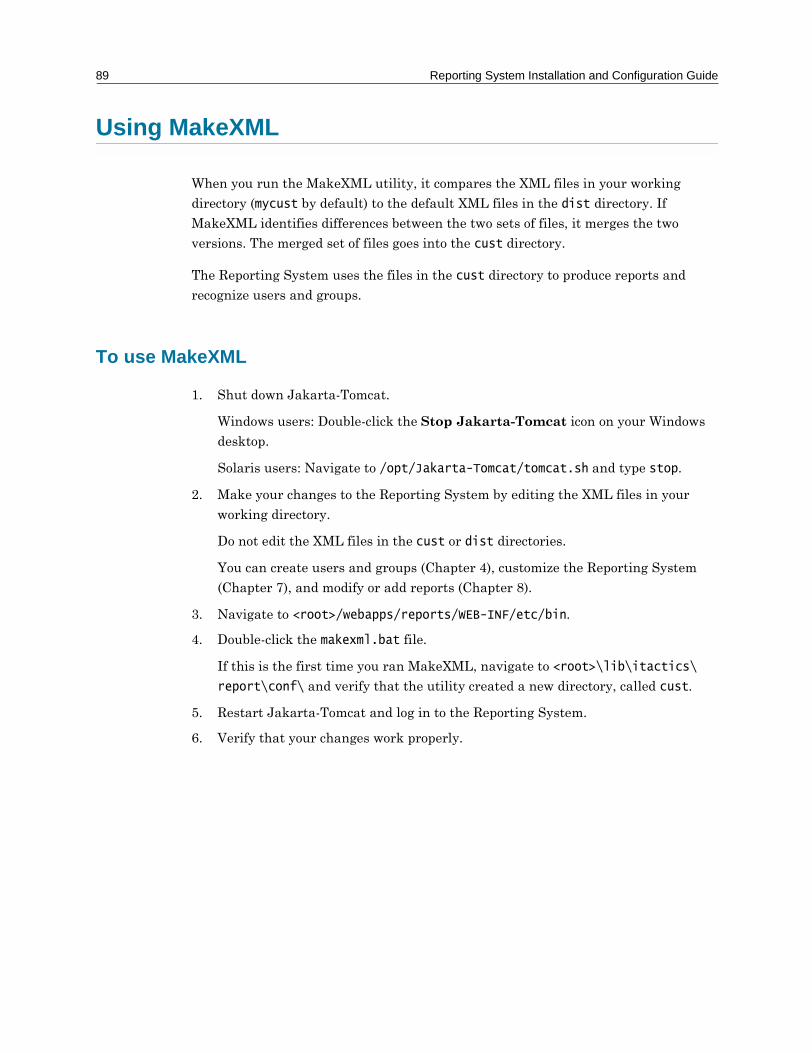
89 Reporting System Installation and Configuration Guide
Using MakeXML
When you run the MakeXML utility, it compares the XML files in your working
directory (mycust by default) to the default XML files in the dist directory. If
MakeXML identifies differences between the two sets of files, it merges the two
versions. The merged set of files goes into the cust directory.
The Reporting System uses the files in the cust directory to produce reports and
recognize users and groups.
To use MakeXML
1. Shut down Jakarta-Tomcat.
Windows users: Double-click the Stop Jakarta-Tomcat icon on your Windows
desktop.
Solaris users: Navigate to /opt/Jakarta-Tomcat/tomcat.sh and type stop.
2. Make your changes to the Reporting System by editing the XML files in your
working directory.
Do not edit the XML files in the cust or dist directories.
You can create users and groups (Chapter 4), customize the Reporting System
(Chapter 7), and modify or add reports (Chapter 8).
3. Navigate to <root>/webapps/reports/WEB-INF/etc/bin.
4. Double-click the makexml.bat file.
If this is the first time you ran MakeXML, navigate to <root>\lib\itactics\
report\conf\ and verify that the utility created a new directory, called cust.
5. Restart Jakarta-Tomcat and log in to the Reporting System.
6. Verify that your changes work properly.
7Customizing the Reporting System
Overview
You can customize the Reporting System in several ways. You can:
� change some of the system�s colors, fonts, font sizes, and other web page elements,
by editing the HTML stylesheet that defines these elements
(reportingStyles.css);
� edit the text that appears in the title bar on each report;
� add a header and footer to reports, by customizing the [HTML STANDARD_FOOTER],
[HTML STANDARD_POST_HEADER], and [HTML STANDARD_PRE_HEADER] building
blocks in the building_blocks.xml file;
� change the Reporting System login screen, and the number of login attempts you
want users to have;
� change the default images that the Reporting System uses;
� change the default appearance of the Reporting System navigation tree;
� change the number of rows that the Reporting System displays on a report screen;
� add custom input, output, or function classes to the Reporting System.
You can also customize existing reports, or create new reports. For more information,
see Chapter 8.
91 Reporting System Installation and Configuration Guide
Editing the Reporting System stylesheet
You can change some aspects of the Reporting System interface by modifying the
HTML stylesheet that controls colors, font sizes, and other standard web page
elements. The stylesheet is called reportingStyles.css, and is located in
<root>/webapps/reports/scripts.
Editing stylesheets is outside the scope of this document. For overviews of stylesheet
structure and use, try one of the following resources:
� The Webmonkey Stylesheets Guide:
http://hotwired.lycos.com/webmonkey/reference/stylesheet_guide/
� CNET�s guide to stylesheets:
http://builder.cnet.com/webbuilding/pages/Authoring/CSS/
� CNET�s CSS Reference Table:
http://builder.cnet.com/webbuilding/pages/Authoring/CSS/table.html
� CSS Pocket Reference, by Eric Meyer (O�Reilly, May 2001,
ISBN 0-596-00120-7)
To edit the Reporting System stylesheet
1. Quit the Reporting System and shut down Jakarta Tomcat.
Windows users: Close your Reporting System Web browser, and double-click the
Stop Jakarta-Tomcat icon on your Windows desktop.
Solaris users: Close your Reporting System Web browser, then navigate to
<root>/bin/tomcat.sh and type stop.
2. Navigate to your scripts directory.
The directory is located in <root>/webapps/reports/scripts.
3. Create a backup copy of the reportingStyles.css file, and store it in another
location.
4. Return to your scripts directory and open reportingStyles.css in a text editor.
5. Edit any styles that control the web page elements you want to change.
See "Reporting System styles" on page 92 for a table that describes the major
stylesheet styles.

Chapter 7: Customizing the Reporting System 92
6. Save your changes and exit the text editor.
7. Start the Reporting System and verify that your changes took effect.
Reporting System styles
The following table shows which screen elements are controlled by which styles in the
Reporting System stylesheet.
To modify Edit Details
Screen headings Table.standard
TD.top2
TD.headerFrameCol
The screen headings are the areas that read �SSM Reporting System�at the top of each report.
Use these styles to set the background color, font, and font color for the screen headings. You must edit all three styles.
Table headings TD.top2 Most reports consist of tables. This style controls the appearance of table headings. On some screens, like the Hyper Drill Options screen, the table heading also serves as the screen heading.
Use this style to set the background color, font, and font color for your table headings.
Table entries TD.bodyCenter_SmallFontA
TD.bodyCenter_SmallFontB
These styles work together to create alternating white and shaded rows in tables. The alternating shading makes reading the tables easier.
Edit the TD.bodyCenter_SmallFontA style to set the background color, font, and font color for white rows.
Edit the TD.bodyCenter_SmallFontB style to set the background color, font, and font color for shaded rows.

93 Reporting System Installation and Configuration Guide
Default text BODY.basic This style controls the default appearance of text in the Reporting System.
Edit the BODY.basic style to set the default font, font size, and font color for reports.
Note that other styles can override this default.
Search screen fields TD.inputLabel
TD.inputGUI
The Search fields include the text boxes and lists that appear on Search screens. You use these fields to create a customized database query.
The TD.inputLabel style controls the appearance of field names (that is, the name of each text box or list). Edit this style to change the background colour, text alignment, or column width.
The TD.inputGUI style controls the appearance of the actual text boxes and lists. Edit this style to change the alignment of the search fields.
Search screen validation messages
DIV.errMsg When you run a search, you enter search criteria on a search screen. The Reporting System can check the information you enter in certain fields, and make certain that the information is valid. If the information is not valid, the Reporting System displays a validation error message beneath the problem field.
The DIV.errMsg style controls the appearance of validation messages. Edit this style to change the font color and size of validation errors.
To modify Edit Details
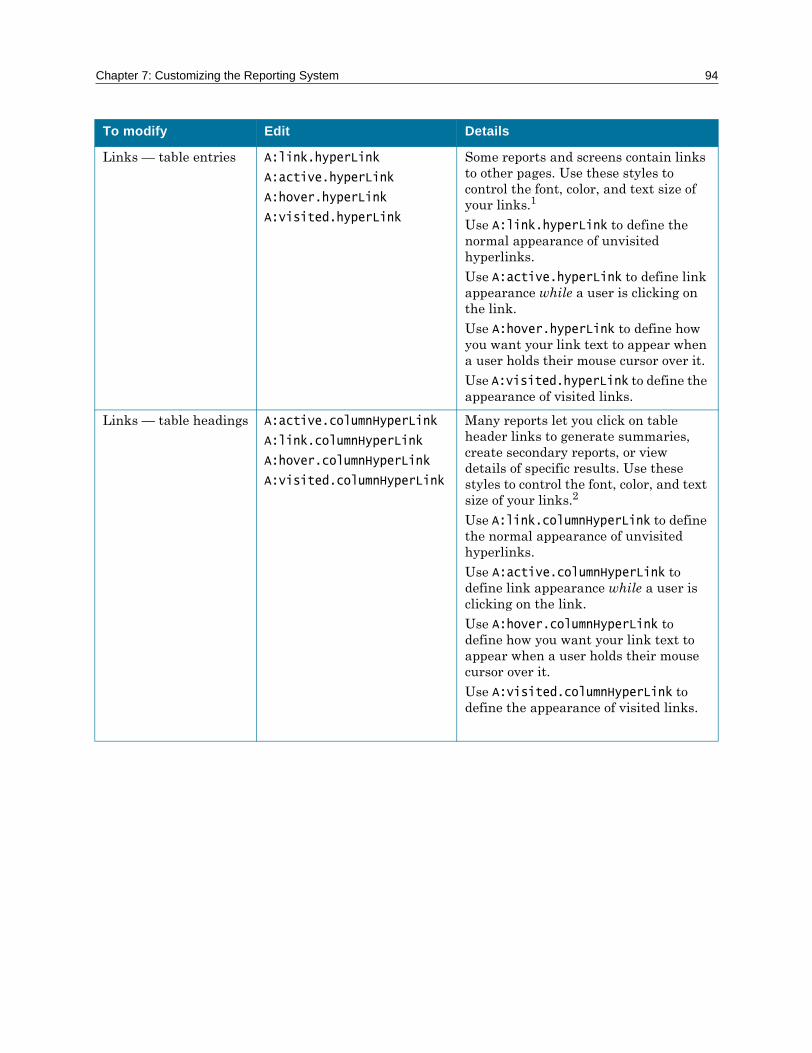
Chapter 7: Customizing the Reporting System 94
Links � table entries A:link.hyperLink
A:active.hyperLink
A:hover.hyperLink
A:visited.hyperLink
Some reports and screens contain links to other pages. Use these styles to control the font, color, and text size of your links.1
Use A:link.hyperLink to define the normal appearance of unvisited hyperlinks.
Use A:active.hyperLink to define link appearance while a user is clicking on the link.
Use A:hover.hyperLink to define how you want your link text to appear when a user holds their mouse cursor over it.
Use A:visited.hyperLink to define the appearance of visited links.
Links � table headings A:active.columnHyperLink
A:link.columnHyperLink
A:hover.columnHyperLink
A:visited.columnHyperLink
Many reports let you click on table header links to generate summaries, create secondary reports, or view details of specific results. Use these styles to control the font, color, and text size of your links.2
Use A:link.columnHyperLink to define the normal appearance of unvisited hyperlinks.
Use A:active.columnHyperLink to define link appearance while a user is clicking on the link.
Use A:hover.columnHyperLink to define how you want your link text to appear when a user holds their mouse cursor over it.
Use A:visited.columnHyperLink to define the appearance of visited links.
To modify Edit Details

95 Reporting System Installation and Configuration Guide
Links � page numbers A:link.pgNum
A:active.pgNum
When a report produces a large number of results, the Reporting System splits the results into multiple pages. Links to these pages appear as a series of page numbers at the top and bottom of each report. (This is the Result Page area.) You can navigate to a different page by clicking on one of the page numbers.
Use the A:link.pgNum and A:active.pgNum styles to set the background color, font, and font color for your Result Page links.
A:link.pgNum defines the normal appearance of unvisited hyperlinks. A:active.pgNum defines link appearance while a user is clicking on the link.
1.Not all Web browsers support these HTML tags.2.Not all Web browsers support these HTML tags.
To modify Edit Details

Chapter 7: Customizing the Reporting System 96
Changing the system’s title bar information
Every report and search screen includes a title bar. By default, this title bar identifies
the name and version number of the Reporting System. The logos.properties file
controls this information; you can change the title bar by editing this file.
The system�s title bar can contain one or two lines of text:
� the main logo (controlled by the main_logo attribute in logos.properties)
� the system name (controlled by the rs_logo attribute in logos.properties)
The main logo appears only on the first screen of the Reporting System. This screen is
the one you see when you start the system
The system name appears on every screen of the Reporting System.
You can edit title bar text
main_logors_logo

97 Reporting System Installation and Configuration Guide
To change the system’s title bar information
1. Shut down the Reporting System and Jakarta-Tomcat.
Windows users: Close your Reporting System Web browser, and double-click the
Stop Jakarta-Tomcat icon on your Windows desktop.
Solaris users: Close your Reporting System Web browser, then navigate to
<root>/bin/tomcat.sh and type stop.
2. Navigate to <root>/webapps/reports/WEB-INF/etc/logo.
3. Open the logos.properties file in a text editor.
4. Edit the value of one or both of the following attributes:
5. Save your changes and quit the text editor.
6. Restart the system and verify that your changes took effect.
Attribute Default Value Description
main_logo SPECTRUM SECURITY MANAGER
This text appears only when you first start the Reporting System.
rs_logo SSM Reporting System 1.1
This text appears on every screen in the Reporting System.

Chapter 7: Customizing the Reporting System 98
Adding a header to reports
You can add a header or footer to each report in the Reporting System. A header is an
image or text that appears in the title bar of each report.A footer appears at the
bottom of each report, and can also be either text or an image. The system supports
two types of headers:
� Pre headers
� Post headers
Pre headers appear at the top of the title bar. Post headers appear at the bottom of the
title bar.
Pre header
Post header
FooterThis is a footer

99 Reporting System Installation and Configuration Guide
To add a header to the Reporting System, you edit the [HTML STANDARD_POST_HEADER]
and [HTML STANDARD_PRE_HEADER] tokens in the building_blocks.xml file. To add a
footer, you edit the [HTML STANDARD_FOOTER] token.
To add a header or footer to a report
This procedure involves editing your Reporting System XML files. You must configure
the system�s MakeXML utility before performing these steps. See Chapter 6 for more
information.
1. Shut down the Reporting System and Jakarta-Tomcat.
Windows users: Close your Reporting System Web browser, and double-click the
Stop Jakarta-Tomcat icon on your Windows desktop.
Solaris users: Close your Reporting System Web browser, then navigate to
<root>/bin/tomcat.sh and type stop.
2. Navigate to your working XML directory.
This is usually <root>/lib/itactics/report/conf/mycust.
3. Open the building_blocks.xml file in a text editor.
4. Do one of the following:
To Locate the following lines
Add a pre header to the Reporting System
<key name="[HTML STANDARD_PRE_HEADER]" value="">
</key>
Add a post header to the Reporting System
<key name="[HTML STANDARD_POST_HEADER]" value="">
</key>
Add a footer to the Reporting System
<key name="[HTML STANDARD_FOOTER]" value="">
</key>

Chapter 7: Customizing the Reporting System 100
5. In the value= quotation marks, insert the item that you want to use as a header.
Please see "Using special characters in XML files" on page 86 for information on
character restrictions.
If you insert a line of text, you can use HTML tags to format the text.
If you wish to use an image, insert an HTML img src tag containing the URL of
that image. The image must be accessible to the Reporting System (for example,
on a shared network drive).
6. Save your changes and exit the text editor.
7. Navigate to the makexml.bat file and double-click it. The MakeXML utility
merges your changes with the main system files.
The makexml.bat file is located in <root>/webapps/reports/WEB-INF/etc/bin.
8. Start the Reporting System, and run any report to see your new header or footer.
Changing the Login Screen and Process
The Login screen is where users enter their user name and password to gain access to
the Reporting System. You can modify the appearance of this screen, and the number
of login attempts you want users to have.
Login formLogin screen
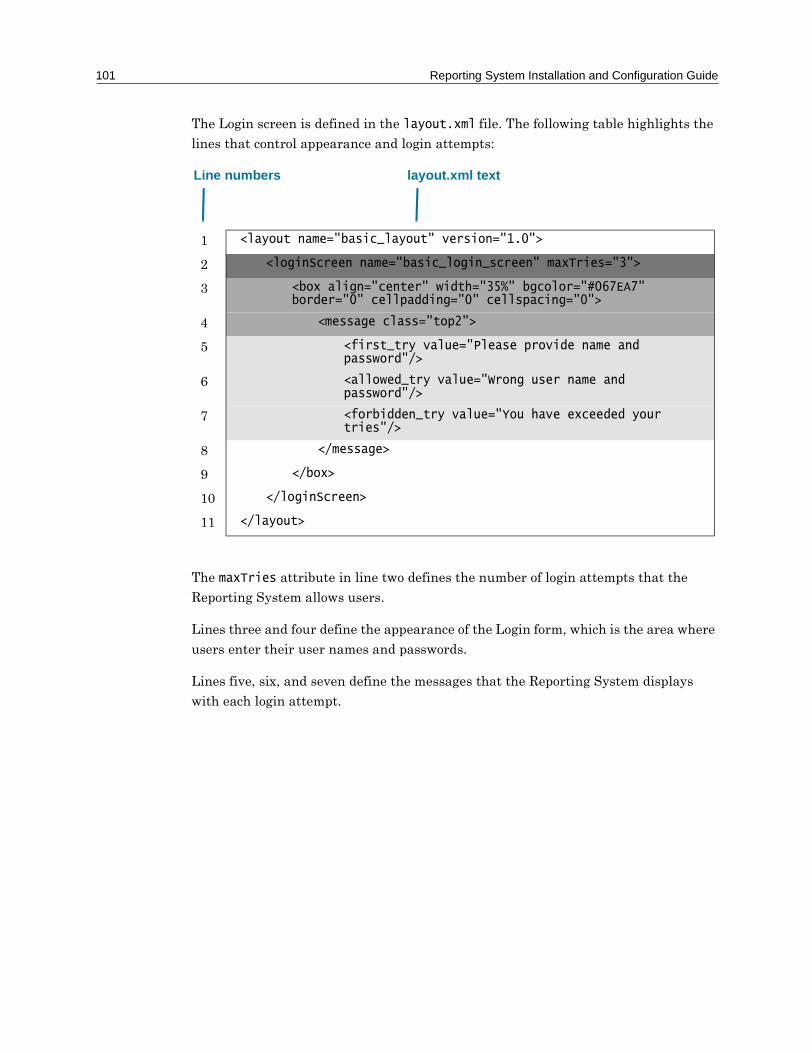
101 Reporting System Installation and Configuration Guide
The Login screen is defined in the layout.xml file. The following table highlights the
lines that control appearance and login attempts:
The maxTries attribute in line two defines the number of login attempts that the
Reporting System allows users.
Lines three and four define the appearance of the Login form, which is the area where
users enter their user names and passwords.
Lines five, six, and seven define the messages that the Reporting System displays
with each login attempt.
1 <layout name="basic_layout" version="1.0">
2 <loginScreen name="basic_login_screen" maxTries="3">
3 <box align="center" width="35%" bgcolor="#067EA7" border="0" cellpadding="0" cellspacing="0">
4 <message class="top2">
5 <first_try value="Please provide name and password"/>
6 <allowed_try value="Wrong user name and password"/>
7 <forbidden_try value="You have exceeded your tries"/>
8 </message>
9 </box>
10 </loginScreen>
11 </layout>
Line numbers layout.xml text

Chapter 7: Customizing the Reporting System 102
Login screen attributes
The following table shows which Login screen elements are controlled by which attributes in the layout.xml file.
Attribute Sets Accepted values
align="center" The alignment of the Login form with respect to the rest of the screen.
�left�
�right�
�center�
width="35%" The width of the Login form, with respect to the rest of the screen.
Widths in percent (%)
Widths in pixels (px)
bgcolor="#067EA7" The background color used for the Login form.
Standard HTML color names, like �Black� or �White�
Hex color codes, like �#ffffff� or �#000000�
border="0" The width of the border that surrounds each line of text in the Login form.
Widths in pixels
cellpadding="0" The amount of space between a line of text and the border that surrounds it.
Measurements in pixels
cellspacing="0" The amount of space between lines of text in the Login form.
Measurements in pixels
class="top2" The style that controls the font, text color, and background color of any text in the Login form.
The name of any style that is defined in the reportingStyles.css file

103 Reporting System Installation and Configuration Guide
To change the number of allowed login attempts
This procedure involves editing your Reporting System XML files. You must configure
the system�s MakeXML utility before performing these steps. See Chapter 6 for more
information.
1. Shut down the Reporting System and Jakarta-Tomcat.
Windows users: Close your Reporting System Web browser, and double-click the
Stop Jakarta-Tomcat icon on your Windows desktop.
Solaris users: Close your Reporting System Web browser, then navigate to
<root>/bin/tomcat.sh and type stop.
2. Navigate to your working XML directory.
This is usually <root>/lib/itactics/report/conf/mycust.
3. Open the layout.xml file in a text editor.
4. Locate the following line:
<loginScreen name="basic_login_screen" maxTries="3">
5. Replace the maxTries value with the number of login attempts that you want the
Reporting System to allow.
6. Save your changes and exit the text editor.
7. Navigate to the makexml.bat file and double-click it. The MakeXML utility
merges your changes with the main system files.
The makexml.bat file is located in <root>/webapps/reports/WEB-INF/etc/bin.

Chapter 7: Customizing the Reporting System 104
To change the appearance of the Login screen
This procedure involves editing your Reporting System XML files. You must configure
the system�s MakeXML utility before performing these steps. See Chapter 6 for more
information.
1. Shut down the Reporting System and Jakarta-Tomcat.
Windows users: Close your Reporting System Web browser, and double-click the
Stop Jakarta-Tomcat icon on your Windows desktop.
Solaris users: Close your Reporting System Web browser, then navigate to
<root>/bin/tomcat.sh and type stop.
2. Navigate to your working XML directory.
This is usually <root>/lib/itactics/report/conf/mycust.
3. Open the layout.xml file in a text editor.
4. Locate the following lines:
<box align="center" width="35%" bgcolor="#067EA7" border="0" cellpadding="0" cellspacing="0">
<message class="top2">
5. Edit any attributes that control the Login screen elements you want to change.
See "Login screen attributes" on page 102 for a table that describes each attribute.
6. Save your changes and exit the text editor.
7. Navigate to the makexml.bat file and double-click it. The MakeXML utility
merges your changes with the main system files.
The makexml.bat file is located in <root>/webapps/reports/WEB-INF/etc/bin.

105 Reporting System Installation and Configuration Guide
To change the Reporting System login prompts
This procedure involves editing your Reporting System XML files. You must configure
the system�s MakeXML utility before performing these steps. See Chapter 6 for more
information.
1. Shut down the Reporting System and Jakarta-Tomcat.
Windows users: Close your Reporting System Web browser, and double-click the
Stop Jakarta-Tomcat icon on your Windows desktop.
Solaris users: Close your Reporting System Web browser, then navigate to
<root>/bin/tomcat.sh and type stop.
2. Navigate to your working XML directory.
This is usually <root>/lib/itactics/report/conf/mycust.
3. Open the layout.xml file in a text editor.
4. Locate and edit the login prompts that you want to change:
5. Save your changes and exit the text editor.
6. Navigate to the makexml.bat file and double-click it. The MakeXML utility
merges your changes with the main system files.
The makexml.bat file is located in <root>/webapps/reports/WEB-INF/etc/bin.
Line containing the prompt Prompt description
<first_try value="Please provide name and password"/>
This prompt appears when users first launch the Reporting System.
<allowed_try value="Wrong user name and password"/>
This prompt appears after users attempt to log in using an incorrect user name or password.
<forbidden_try value="You have exceeded your tries"/>
This prompt appears after users reach their login attempt limit. The Reporting System locks the users out until they restart Jakarta-Tomcat and the Reporting System.

Chapter 7: Customizing the Reporting System 106
Changing the Reporting System images
The Reporting System uses several default images. You can replace these images with
your own graphics. The images are located in two directories. The following table
shows the images located in <root>/webapps/reports/images:
Image File name Details
main_logo.gif This image appears at the top of the navigation tree (that is, the list of reports at the left side of the Reporting System window).
The default image is 151 pixels wide, and 82 pixels high. The resolution is 72 dpi.
arrow.gif This image appears next to rows in result tables, to indicate that you can get more information on a specific item in the table.
The default image is 11 pixels wide, and 11 pixels high. The resolution is 72 dpi.
arrow_up.gif These images appear at the top of columns in result tables, to indicate that you can sort the columns in either ascending order or descending order.
The default images are 11 pixels wide, and 11 pixels high. The resolution is 72 dpi.
arrow_down.gif

107 Reporting System Installation and Configuration Guide
The following table shows the icons located in
<root>/webapps/reports/helper_classes/treeApplet:
Image File name Details
icon-form.gif These images appear in the navigation tree (that is, the list of reports at the left side of the Reporting System window).
The icon-form.gif image appears beside the name of an individual report. If users click on the report name, the Reporting System runs the report.
The default icon-form.gif image is 16 pixels wide, and 16 pixels high. The resolution is 72 dpi.
The icon-folder-open.gif image appears beside the name of a category of reports. This icon indicates that list of related reports is visible to users. If users click on the category name, the list of reports disappears.
The icon-folder-closed.gif image appears beside the name of a category of reports. This icon indicates that users can click on the category name to view a list of related reports.
The default icon-folder images are 25 pixels wide, by 16 pixels high. The resolution is 72 dpi.
icon-folder-open.gif
icon-folder-closed.gif

Chapter 7: Customizing the Reporting System 108
Replacing Reporting System images
It is highly recommended that your replacement images match the original Reporting
System images in size and resolution.
1. Shut down the Reporting System and Jakarta-Tomcat.
Windows users: Close your Reporting System Web browser, and double-click the
Stop Jakarta-Tomcat icon on your Windows desktop.
Solaris users: Close your Reporting System Web browser, then navigate to
<root>/bin/tomcat.sh and type stop.
2. Navigate to the directory containing the image you want to replace.
The directory will be either:
<root>/webapps/reports/images
or
<root>/webapps/reports/helper_classes/treeApplet
See "Changing the Login Screen and Process" for more information.
3. Identify the image that you want to replace.
4. Change the image�s file extension from .gif to .old.
5. Place a copy of your replacement image in the directory.
6. Change the name of the replacement image to the name of the original Reporting
System image.
7. Start the Reporting System and verify that your image has replaced the default.

109 Reporting System Installation and Configuration Guide
Changing the appearance of the navigation tree
The navigation tree is an area of the Reporting System screen that lists all of the
available reports. These reports are grouped into categories. Clicking on a report
makes the Reporting System run the report.
When you start the Reporting System, all of the report categories are �collapsed,�
meaning that individual reports do not appear in the navigation tree�s list. To see
individual reports, you must click on a category to �expand� it (that is, display the
category�s list of reports).
Navigation tree

Chapter 7: Customizing the Reporting System 110
The reports.properties file controls the appearance of the navigation tree. The
following file excerpt shows the section of the file that controls the navigation tree.
By editing this file, you can change:
� whether the navigation tree is expanded or collapsed when you start the
Reporting System
� the graphics used to indicate reports and categories (both expanded and
collapsed)
� the color of text, links, lines, and the navigation tree�s background
� the amount of space between graphics and text
reports.properties
# Tree Applet Customization
# ==============
treeApplet.expanded=FIRST
treeApplet.openIcon=icon-folder-open.gif
treeApplet.closedIcon=icon-folder-closed.gif
treeApplet.reportIcon=icon-form.gif
treeApplet.background=#FFFFFF
treeApplet.textColor=#067EA7
treeApplet.connColor=#000077
treeApplet.linkColor=#888888
treeApplet.textSpacing=10
treeApplet.target=right

111 Reporting System Installation and Configuration Guide
Navigation tree attributes
The following table shows which navigation tree elements are controlled by which
attributes in the reports.properties file.
Attribute Sets Accepted values
treeApplet.expanded The appearance of the navigation tree when you start the Reporting System.
�YES� means that the tree will always be expanded when you start the system.
�NO� means that the tree will always be collapsed.
�FIRST� means that the tree will only be fully expanded the first time you use the Reporting System.
�YES�
�NO�
�FIRST�
treeApplet.openIcon The icon that appears next to a category that you have expanded (a category with all its reports showing).
The name of any GIF or JPEG file stored in <root>/webapps/reports/helper_classes/treeApplet
treeApplet.closedIcon The icon that appears next to a category that you have collapsed (a category with no reports showing).
treeApplet.reportIcon The icon that appears next to the name of a report.
treeApplet.background The background color of the navigation tree.
Hex color codes, like �#ffffff� or �#000000�
treeApplet.textColor The color of report and category names.
treeApplet.connColor The color of the lines that connect report and category names.
treeApplet.linkColor The color of the line that appears below a report or category name, when you hold your mouse over it.
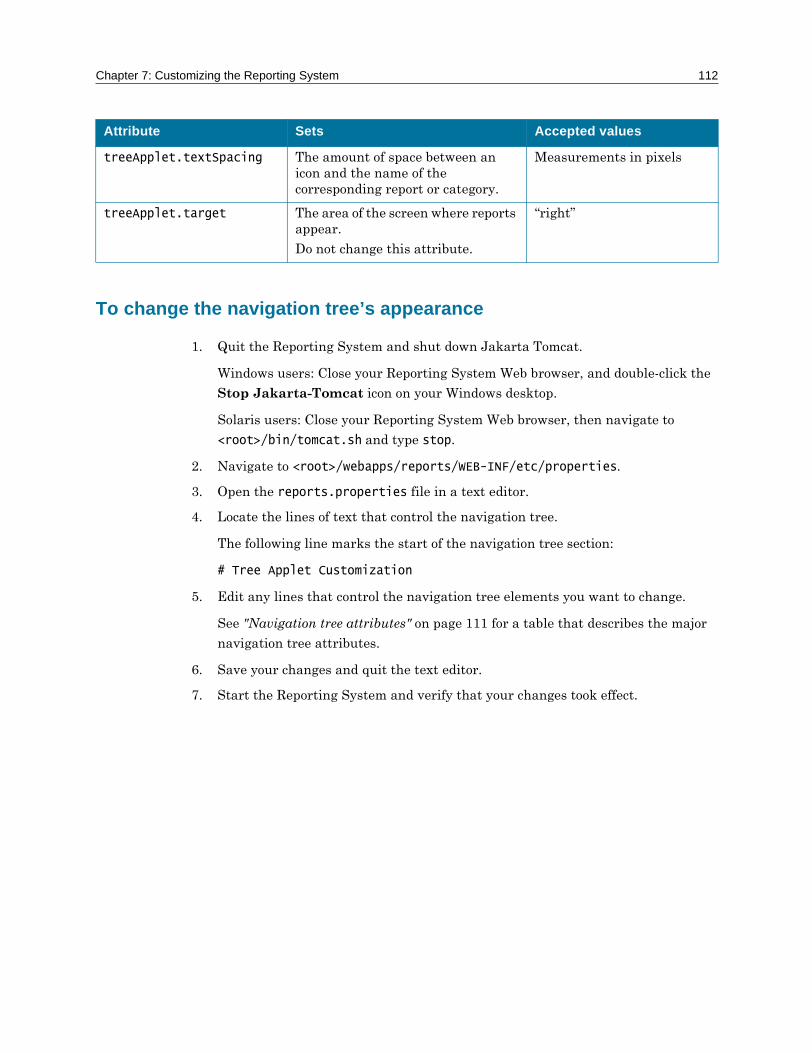
Chapter 7: Customizing the Reporting System 112
To change the navigation tree’s appearance
1. Quit the Reporting System and shut down Jakarta Tomcat.
Windows users: Close your Reporting System Web browser, and double-click the
Stop Jakarta-Tomcat icon on your Windows desktop.
Solaris users: Close your Reporting System Web browser, then navigate to
<root>/bin/tomcat.sh and type stop.
2. Navigate to <root>/webapps/reports/WEB-INF/etc/properties.
3. Open the reports.properties file in a text editor.
4. Locate the lines of text that control the navigation tree.
The following line marks the start of the navigation tree section:
# Tree Applet Customization
5. Edit any lines that control the navigation tree elements you want to change.
See "Navigation tree attributes" on page 111 for a table that describes the major
navigation tree attributes.
6. Save your changes and quit the text editor.
7. Start the Reporting System and verify that your changes took effect.
treeApplet.textSpacing The amount of space between an icon and the name of the corresponding report or category.
Measurements in pixels
treeApplet.target The area of the screen where reports appear.
Do not change this attribute.
�right�
Attribute Sets Accepted values

113 Reporting System Installation and Configuration Guide
Changing the number of rows in a report
When you run a report, the Reporting System displays your results in a table. If the
Reporting System finds more results than it can display at once, it breaks the results
into several pages and provides links to these pages at the top and bottom of the
results table.
The Reporting System determines how many results it can display by checking a
report�s definition. The reports.xml file defines all of the reports in the Reporting
System. Each report�s definition contains an <output> section, which provides
instructions for presenting report results. This section includes a
Links to more results

Chapter 7: Customizing the Reporting System 114
<table rowsPerPage> setting, which determines the number of results that the
system displays on a single page when you run the report.
By default, the <table rowsPerPage> setting uses a token to set the number of
displayed results. This token ([TABLE pageSize]) is a placeholder for a value stored
in the building_blocks.xml file. To determine the actual number of results that it
can display, the Reporting System looks up the token in the building_blocks.xml
file.
reports.xml
<output>
<header PreHeaderHtml="[HTML STANDARD_PRE_HEADER]" IncludeStandardHeader="true" PostHeaderHtml="[HTML STANDARD_POST_HEADER]" />
<table rowsPerPage="[TABLE pageSize]" />
<footer html="[HTML STANDARD_FOOTER]" />
</output>
The <table rowsPerPage> setting determines how many results the system displays
building_blocks.xml
<key name="[TABLE pageSize]" value="10" />
The Reporting System replaces the [TABLE pageSize] token with the value listed in building_blocks.xml

115 Reporting System Installation and Configuration Guide
To change the number of results that the Reporting System displays, you can:
� make a global change by editing the value of the [TABLE pageSize] token
� make a specific change by editing the <table rowsPerPage> setting of an
individual report
Changing the number of displayed results for all reports
This procedure involves editing your Reporting System XML files. You must configure
the system�s MakeXML utility before performing these steps. See Chapter 6 for more
information.
1. Quit the Reporting System and shut down Jakarta Tomcat.
Windows users: Close your Reporting System Web browser, and double-click the
Stop Jakarta-Tomcat icon on your Windows desktop.
Solaris users: Close your Reporting System Web browser, then navigate to
<root>/bin/tomcat.sh and type stop.
2. Navigate to <root>/lib/itactics/report/conf/mycust.
3. Open the building_blocks.xml file in a text editor.
4. At the end of the file, add the following line:
<key name="[TABLE pageSize]" value="10" />
5. Replace the value with the number of results you want to see when you run a
report.
For example, value=�25�.
6. Save your changes and quit the text editor.
7. Navigate to the makexml.bat file and double-click it. The MakeXML utility
merges your changes with the main system files.
The makexml.bat file is located in <root>/webapps/reports/WEB-INF/etc/bin.

Chapter 7: Customizing the Reporting System 116
Changing the number of displayed results for a specific report
This procedure involves editing your Reporting System XML files. You must configure
the system�s MakeXML utility before performing these steps. See Chapter 6 for more
information.
1. Quit the Reporting System and shut down Jakarta Tomcat.
Windows users: Close your Reporting System Web browser, and double-click the
Stop Jakarta-Tomcat icon on your Windows desktop.
Solaris users: Close your Reporting System Web browser, then navigate to
<root>/bin/tomcat.sh and type stop.
2. Navigate to <root>/lib/itactics/report/conf/dist.
3. Open the reports.xml file in a text editor.
4. Locate the definition of the report you want to change.
5. Copy the definition.
Copy all the text between the <report> and </report> XML tags.
6. Quit the text editor.
7. Navigate to <root>/lib/itactics/report/conf/mycust.
8. Open the reports.xml file in a text editor.
9. At the end of the file, paste your report definition.
10. In the report�s <output> section, find the following line:
<table rowsPerPage="[TABLE pageSize]" />
11. Replace the [TABLE pageSize] token with the number of results you want to see
when you run this report.
For example, value=�25�.
12. Save your changes and quit the text editor.
13. Navigate to the makexml.bat file and double-click it. The MakeXML utility
merges your changes with the main system files.
The makexml.bat file is located in <root>/webapps/reports/WEB-INF/etc/bin.
117 Reporting System Installation and Configuration Guide
Adding custom classes to the Reporting System
If necessary, you can create your own Reporting System:
� input classes
� output classes
� function classes
All of the Reporting System classes are Java classes.
Input classes provide ways of getting user input. The Reporting System uses several
inputs in the reports in its Search category. These inputs include Keyword fields,
Source_IP fields, Year selection lists, and event_id fields.
Output classes define ways of presenting results to users. The Reporting System uses
charts and tables; these are examples of output classes.
Function classes automatically perform a calculation for users. Functions take the
place of inputs in certain reports. For example, all of the Last 10 minutes reports use
a function that calculates a start time based on the current time. The function uses a
simple formula: the start time equals the current time, minus ten minutes. Once the
function provides a start and end time, the report can query the database for any
events that were entered during that time period.
Function classes go in <root>/webapps/reports/WEB-
INF/classes/itactics/report/function.
Output classes go in <root>/webapps/reports/WEB-
INF/classes/itactics/report/formatter/output.
Input classes go in <root>\webapps\reports\WEB-
INF\classes\itactics\report\formatter\input.
Once the classes are in place, you can reference them in the reports.xml and
building_blocks.xml files.
There is no API guide for developing custom Reporting System classes. If you need to
create a custom class, please contact Customer Support for assistance.

8Creating Custom Reports
Overview
The Reporting System comes set up with a wide range of pre-packaged reports.
However, you may want to create custom reports.
To create custom reports you must modify the following files:
� reportset.xml
� reports.xml
� hyperdrill.xml
When you install the Reporting System, the system places XML configuration files in
<root>/lib/itactics/report/conf/dist. However, service pack releases of the
Reporting System overwrite the files in the dist directory, so you must work with a
separate version of these files. See "Using MakeXML" on page 89 for more
information.
To create a new, custom report you must:
1. Set up the MakeXML utility. See "To set up MakeXML" on page 88.
2. Create the new report (reports.xml).
3. Create any required hyperdrill relationships (hyperdrill.xml).
4. Add the report to the system�s navigation tree (reportset.xml).
5. Run MakeXML to merge your XML changes with the main system XML files. See
"To use MakeXML" on page 89.

119 Reporting System Installation and Configuration Guide
Creating a Report
You define new reports in the reports.xml file. This file contains the specifications
for all of the reports, including search criteria, hyperdrill mappings and output
descriptions.
You must configure your MakeXML utility before you create a new report. See
"Setting up MakeXML" on page 88.
Creating a new report involves setting up an SQL database query. Do not create a
new report unless you have previous SQL experience.
To define a custom report
1. Navigate to your working XML directory.
This directory is <root>/lib/itactics/report/conf/mycust by default.
2. Open the reports.xml file in any text editor.
3. Create a new report tag using the following syntax:
<report name="<new-report>" description="<New Report>" dateCreated="<dd-mm-yyyy>" createdBy="<Name>"> </report>
Replace With
"<new-report>" The name of the report as it appears in the main frame of the Reporting System and in the drop-down menu of recently run reports.
"<New Report>" The description of the report as it appears in the Reporting System menu.
"<dd-mm-yyyy>" The date on which the report was created.
"<Name>" The name of the report�s creator.

Chapter 8: Creating Custom Reports 120
4. Insert a SQL query within <sql> </sql> tags, using the following syntax:
<sql>SELECT selectField FROM someTable</sql>
If you are creating a summary-style report, you must include as num in the first
part of your SQL statement. For instance, the following SQL statement would not
work:
<sql>SELECT s_ip, count (s_ip) as num FROM event</sql>
But the following SQL statement would work:
<sql>SELECT count (s_ip) as num, s_ip FROM event</sql>
5. To generate summary reports using the output from the new report, create a new
summary columns tag using the following syntax:
<summaryCols>
<col><column_name></col>
</summaryCols>
Where <col> indicates that the text between the tags is the name of a column
from which users can generate summary reports, and <column n> is the column
name.
6. To use the results of the new report as input for another report, create a new map
tag using the following syntax:
<map>
<slot input="<field>" hyperDrillToken="<[token name]>" />
</map>
To create a report that uses the input from one report to generate another report, you
may need to create a new hyperdrill node in hyperdrill.xml ("Setting up
Hyperdrilling Relationships" on page 124).
Replace With
"<field>" The name of a field which can be used as input for a hyperdrill.
"<[token name]>" The name of a hyperdrill token. The Reporting System looks for any hyperdrilling definitions (in hyperdrill.xml) that use this token. If it finds a matching definition, the system creates a link between your report and the relevant hyperdrilling report.

121 Reporting System Installation and Configuration Guide
7. Create a new output tag using the following syntax:
<output>
<header PreHeaderHtml="<HTML PreHeader>" IncludeStandardHeader="<header: true/false>" PostHeaderHtml="<HTML PostHeader>" />
<table maxrows="<max number of rows>" />
<footer html="<HTML Footer>" />
</output>
Replace With
<header> This tag indicates that the report has a header associated with it. The header includes information about both the Reporting System and the report.
"<HTML PreHeader>" The text that will appear at the top of the Reporting System report header, when a report is generated.
There is a building block, �[HTML STANDARD_PRE_HEADER]�, associated with this tag that leaves it blank by default. You can either change it for all reports by changing the buiding block, or for one report by editing the individual report.
"<header: true/false>" The Reporting System standard report header that includes the Reporting System product name and version number and the Recently Run Reports list.
"<HTML PostHeader>" The text that will appear at the bottom of the Reporting System report header, when a report is generated.
There is a building block, �[HTML STANDARD_POST_HEADER]�, associated with this tag that leaves it blank by default. You can either change it for all reports by changing the buiding block, or for one report by editing the individual report.
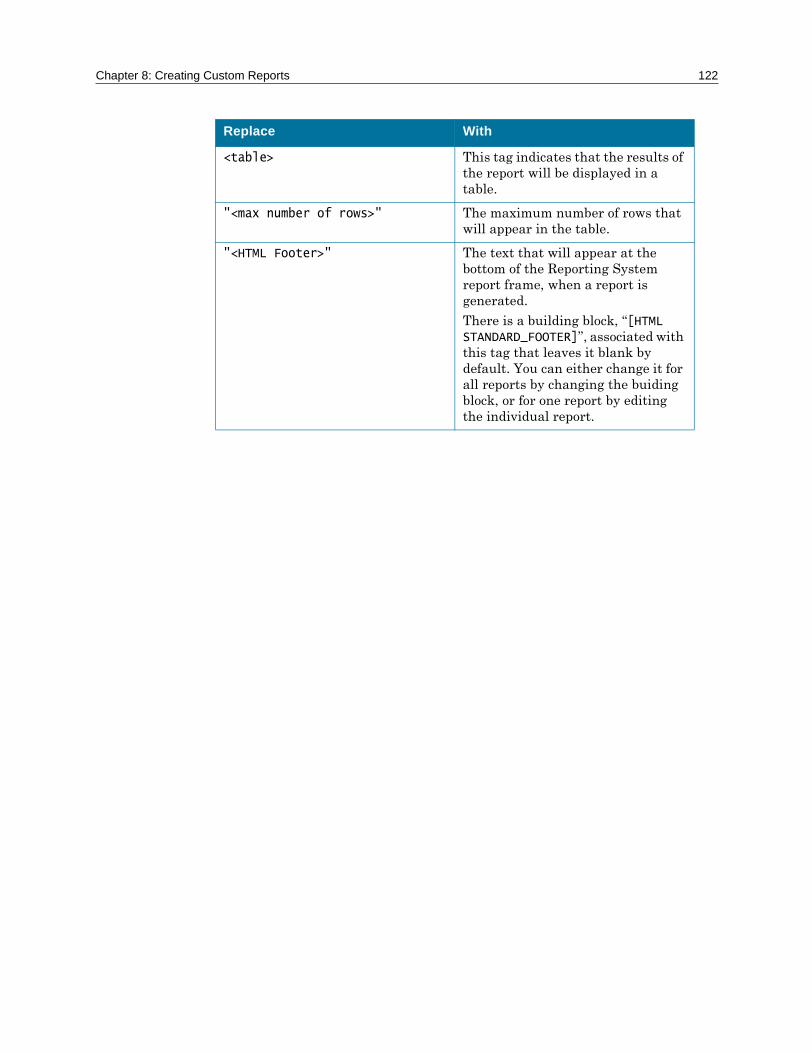
Chapter 8: Creating Custom Reports 122
<table> This tag indicates that the results of the report will be displayed in a table.
"<max number of rows>" The maximum number of rows that will appear in the table.
"<HTML Footer>" The text that will appear at the bottom of the Reporting System report frame, when a report is generated.
There is a building block, �[HTML STANDARD_FOOTER]�, associated with this tag that leaves it blank by default. You can either change it for all reports by changing the buiding block, or for one report by editing the individual report.
Replace With

123 Reporting System Installation and Configuration Guide
8. If you are creating a summary report, insert a chart tag within
<output> and </output> tags. The output tag should use the following syntax:
<output>
<header PreHeaderHtml="<HTML PreHeader>" IncludeStandardHeader="<header: true/false>" PostHeaderHtml="<HTML PostHeader>" />
<table maxrows="<max number of rows>" />
<chart type="<type: pie/vbar/hbar/line/quant h>"
appletWindowPopup="<popup: true/false>"
title="<chart title>" subtitle="<chart subtitle>"
chartValueColumns="<chart value>"
chartLegendColumns="<list of legend elements>" chartShowupColumns="<list of chart elements>" popupXCoordinate="<x-coordinate>"
popupYCoordinate="<y-coordinate>" />
<footer html="<HTML Footer>" />
</output>
Replace With
<chart> This tag indicates that the results of the report will be displayed in a chart.
It should only be included when defining summary reports.
"<type: pie/vbar/hbar/line/quant h>"
The type of chart that will be displayed as the result of the report.
You can choose more than one type of chart by using a comma-separated list.
"<popup: true/false>" The place where the chart will appear.
If the value is true, then the chart appears in a popup window.
If the value is false, then the chart appears in the body of the report.
"<chart title>" The main title that will appear at the top of the chart.
"<chart value>" This tag specifies the value which is the basis for how the Reporting System generates the chart.
It is recommended that you always set this value to �num�.

Chapter 8: Creating Custom Reports 124
9. Save your changes and quit the text editor.
Your changes will not take effect until you run MakeXML to merge your working
XML files with the default XML files. See "Using MakeXML" on page 89.
Setting up Hyperdrilling Relationships
Hyperdrilling allows you to use the results of one report as the input for another
report (a hyperdrilling report).
The hyperdrill.xml file sets up links to specific hyperdrilling reports. Each
hyperdrilling report has one or more hyperdrilling tokens associated with it. These
tokens are listed in hyperdrill.xml. (See "The hyperdrill.xml file" on page 25 for
more information.) Any regular report that also uses these tokens can link to the
hyperdrilling report. When you define a regular report in reports.xml, you list
hyperdrilling tokens in the report�s <map> section.
If you create a new hyperdrilling report in reports.xml, you must also add an entry
for it to the hyperdrill.xml file. The Reporting System uses this information to
determine which reports can link to the new hyperdrilling report.
You must configure your MakeXML utility before you create a new hyperdrilling
definition. See "Setting up MakeXML" on page 88.
"<list of legend elements>" The result elements that will appear in the legend.
"<list of chart elements>" The result elements that will appear in the chart.
"<x-coordinate>" The horizontal location where the chart window will open.
"<y-coordinate>" The vertical location where the chart window will open.
Replace With
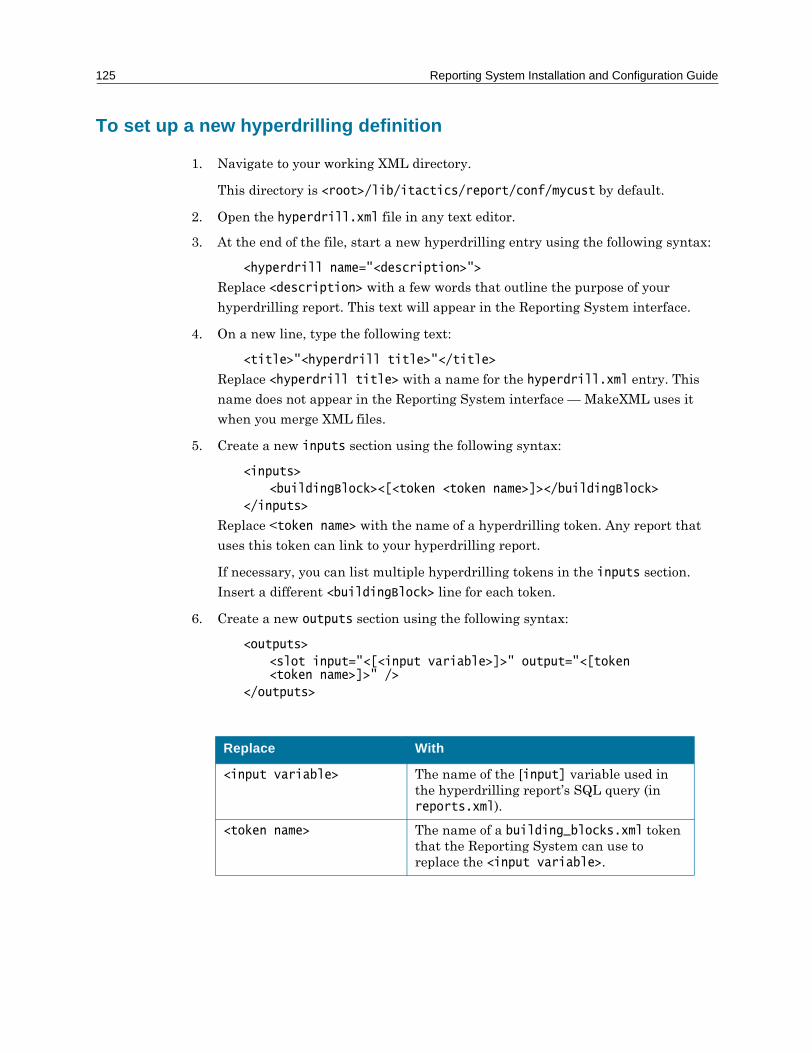
125 Reporting System Installation and Configuration Guide
To set up a new hyperdrilling definition
1. Navigate to your working XML directory.
This directory is <root>/lib/itactics/report/conf/mycust by default.
2. Open the hyperdrill.xml file in any text editor.
3. At the end of the file, start a new hyperdrilling entry using the following syntax:
<hyperdrill name="<description>">
Replace <description> with a few words that outline the purpose of your
hyperdrilling report. This text will appear in the Reporting System interface.
4. On a new line, type the following text:
<title>"<hyperdrill title>"</title>
Replace <hyperdrill title> with a name for the hyperdrill.xml entry. This
name does not appear in the Reporting System interface � MakeXML uses it
when you merge XML files.
5. Create a new inputs section using the following syntax:
<inputs>
<buildingBlock><[<token <token name>]></buildingBlock>
</inputs>
Replace <token name> with the name of a hyperdrilling token. Any report that
uses this token can link to your hyperdrilling report.
If necessary, you can list multiple hyperdrilling tokens in the inputs section.
Insert a different <buildingBlock> line for each token.
6. Create a new outputs section using the following syntax:
<outputs>
<slot input="<[<input variable>]>" output="<[token <token name>]>" />
</outputs>
Replace With
<input variable> The name of the [input] variable used in the hyperdrilling report�s SQL query (in reports.xml).
<token name> The name of a building_blocks.xml token that the Reporting System can use to replace the <input variable>.

Chapter 8: Creating Custom Reports 126
For more information on the outputs section, see "How the system creates
hyperdrilling reports" on page 30.
7. Create a new report tag with the following syntax:
<report><report name></report>
Where <report name> is the name of the hyperdrilling report that this
hyperdrill.xml definition creates links to. The name you enter must exactly
match one of the report names in reports.xml (remember that the Reporting
System is case-sensitive).
8. End your hyperdrilling definition by entering the following line:
</hyperdrill>
This line indicates the end of the hyperdrilling entry.
9. Save your changes and quit the text editor.
Your changes will not take effect until you run MakeXML to merge your working
XML files with the default XML files. See "Using MakeXML" on page 89.
Adding a Report to the System Navigation Tree
You must configure your MakeXML utility before you add a report to the navigation
tree. See "Setting up MakeXML" on page 88.
To add a report to the navigation tree
1. Navigate to your working XML directory.
This directory is <root>/lib/itactics/report/conf/mycust by default.
2. Open the reportset.xml file in any text editor.
3. Select the category under which you will list the name of the new report, add the
following text to the end of the category:
<category name="<category>" description="<Category>" />
<report name="<new-report>" description="<New Report>" />
</category>
Where <category> is the name of the category that you are adding the report to,
<Category> is the description of the category that appears in the Reporting

127 Reporting System Installation and Configuration Guide
System menu, <new-report> is the name of the new report, and <New Report> is
the description of the report that appears in the menu.
4. Save your changes and quit the text editor.
Your changes will not take effect until you run MakeXML to merge your working
XML files with the default XML files. See "Using MakeXML" on page 89.

9Troubleshooting Reporting System Problems
Interpreting error codes
The following table describes the most common errors you may encounter while using
the Reporting System.
Error Meaning
35 REPORT NOT AVAILABLE
This error indicates that the Reporting System encountered an exception that it could not assign a more specific error code to.
You may encounter this error if you tried to re-run a report that does not exist, because your Web browser is using old cached data
If none of these situations caused the error, you may need to examine the Reporting System log file to identify the cause. The log file is a plain text file, located in <root>/logs/reports.log.
41TABLE NOT AVAILABLE
This error indicates that the report you tried to access does not contain two required XML tags � <table> and </table>. This means that the report is not set up properly in the reports.xml file.
You may encounter the error if you recently modified an existing report, or created a new report.
51CHART NOT AVAILABLE
This error indicates that the report you tried to access does not contain two required XML tags � <chart> and </chart>. This means that the report is not set up properly in the reports.xml file.
You may encounter the error if you recently modified an existing report, or created a new report.

129 Reporting System Installation and Configuration Guide
52CHART NOT AVAILABLE
This error indicates that the report you tried to access does not contain a properly formatted chart description, and so the Reporting System cannot display the chart.
You may encounter the error if you recently modified an existing report, or created a new report.
To resolve the problem, locate the report�s chart definition (in reports.xml) and make certain that all the chart attributes have values. If any of the values are left blank, the Reporting System will generate an error 52 message. You must run MakeXML and restart Jakarta-Tomcat for any changes to take effect.
53CHART NOT AVAILABLE
This error is similar to error 52. It indicates that the report you tried to access does not contain a properly formatted chartValueColumns attribute in its reports.xml chart description. The Reporting System cannot display the chart without this attribute.
You may encounter the error if you recently modified an existing report, or created a new report.
To resolve the problem, locate the report�s chart definition in reports.xml, and enter a value in the chartValueColumns attribute. You must run MakeXML and restart Jakarta-Tomcat for your changes to take effect.
60PROCESS_TOKEN
The Reporting System could not process an [INPUT] or [FUNCTION] token in the building_blocks.xml file. This error can have several causes.
To resolve the problem, first try running the report again.
If the Reporting System returns an error 60 again, restart Jakarta-Tomcat, log back into the Reporting System, and run the report again.
If you continue to see error 60 messages, the error may be caused by a token that is not configured properly in the building_blocks.xml file. Open your reports.xml file. Locate the lines of text that define the report you used. Identify any tokens used in the report. (Token names appear in square brackets, [ ] .) Next open the building_blocks.xml file and locate those tokens. Make certain that none of the tokens are missing attributes, and that all the tokens are properly configured. You must run MakeXML and restart Jakarta-Tomcat for any changes to take effect.
70MALFORMED_TOKEN
This error indicates that the Reporting System could not process one of the tokens in the building_blocks.xml file. You may encounter the error if you recently modified tokens in that file.
To resolve the problem, open the reports.xml file. Locate the lines of text that define the report you used. Identify any tokens used in the report. (Token names appear in square brackets, [ ] .) Next open the building_blocks.xml file and locate those tokens. Make certain that none of the tokens are missing attributes, and that all the tokens are properly configured. You must run MakeXML and restart Jakarta-Tomcat for any changes to take effect.
Error Meaning
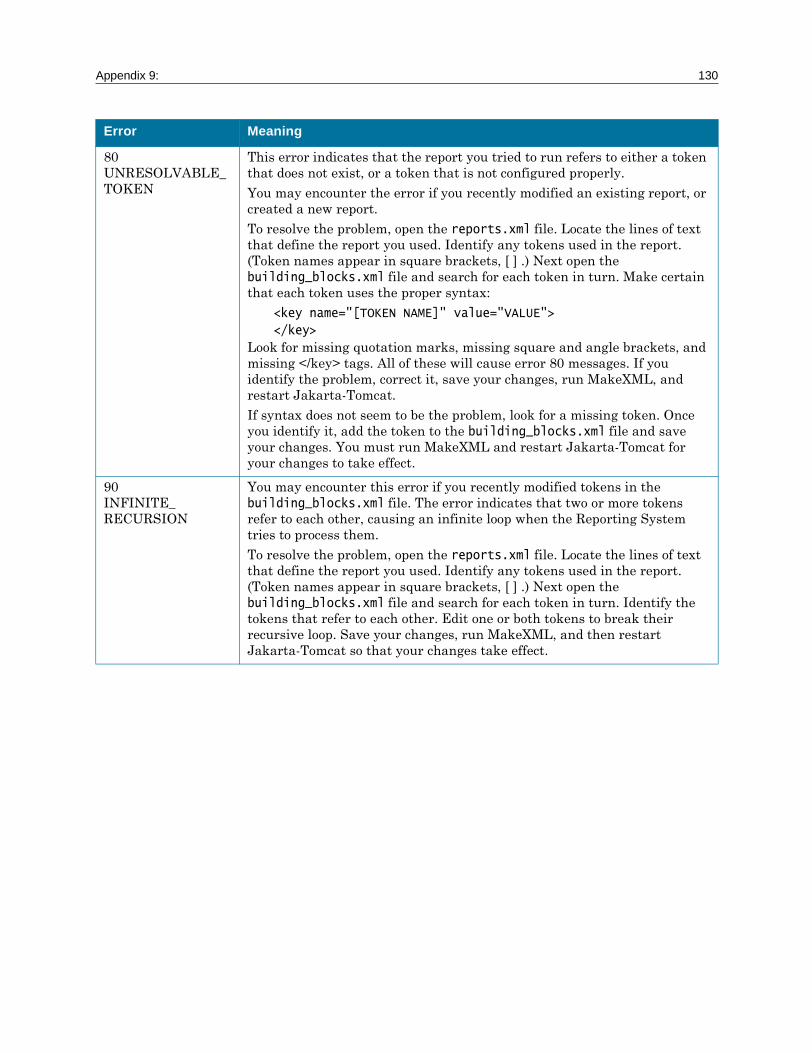
Appendix 9: 130
80UNRESOLVABLE_TOKEN
This error indicates that the report you tried to run refers to either a token that does not exist, or a token that is not configured properly.
You may encounter the error if you recently modified an existing report, or created a new report.
To resolve the problem, open the reports.xml file. Locate the lines of text that define the report you used. Identify any tokens used in the report. (Token names appear in square brackets, [ ] .) Next open the building_blocks.xml file and search for each token in turn. Make certain that each token uses the proper syntax:
<key name="[TOKEN NAME]" value="VALUE">
</key>
Look for missing quotation marks, missing square and angle brackets, and missing </key> tags. All of these will cause error 80 messages. If you identify the problem, correct it, save your changes, run MakeXML, and restart Jakarta-Tomcat.
If syntax does not seem to be the problem, look for a missing token. Once you identify it, add the token to the building_blocks.xml file and save your changes. You must run MakeXML and restart Jakarta-Tomcat for your changes to take effect.
90INFINITE_RECURSION
You may encounter this error if you recently modified tokens in the building_blocks.xml file. The error indicates that two or more tokens refer to each other, causing an infinite loop when the Reporting System tries to process them.
To resolve the problem, open the reports.xml file. Locate the lines of text that define the report you used. Identify any tokens used in the report. (Token names appear in square brackets, [ ] .) Next open the building_blocks.xml file and search for each token in turn. Identify the tokens that refer to each other. Edit one or both tokens to break their recursive loop. Save your changes, run MakeXML, and then restart Jakarta-Tomcat so that your changes take effect.
Error Meaning

131 Reporting System Installation and Configuration Guide
105FAILED_DB_QUERY
This error indicates that a database query failed.
This error can occur when your database is undergoing maintenance, or is offline for some reason.
You may also encounter this error if you recently modified an existing report, or created a new report. In this case, the error indicates that the report�s SQL query contains an error.
To resolve the problem, first verify whether your database is working properly. If the database is online and accessible, check your reports.xml file. Open the file and locate the lines of text that define the report you used. Verify that the report uses a valid SQL query (listed within <sql> and </sql> tags). If the SQL query looks correct, identify any tokens used in the query. (Token names appear in square brackets, [ ] .) Next open the building_blocks.xml file and search for each token in turn. Make certain that none of the tokens are missing attributes, and that all the tokens are properly configured. Once you identify and correct the problem, save your changes, run MakeXML, and restart Jakarta-Tomcat.
130USER_NOT_FOUND
This error indicates that the Reporting System cannot let a user run a report, because that user is not set up properly. The user does not exist in the system�s users.xml file. The Reporting System uses the information in users.xml to determine what database information the user is allowed to see.
You may encounter the error if you recently added new users to the system.
To resolve the problem, add the user to the users.xml file. Also verify that you have associated the user with one of the groups in your groups.xml file, or the system will generate an error 140 message. See Chapter 4 for more information on setting up users and groups. Run MakeXML and restart Jakarta-Tomcat so that your changes take effect.
Error Meaning
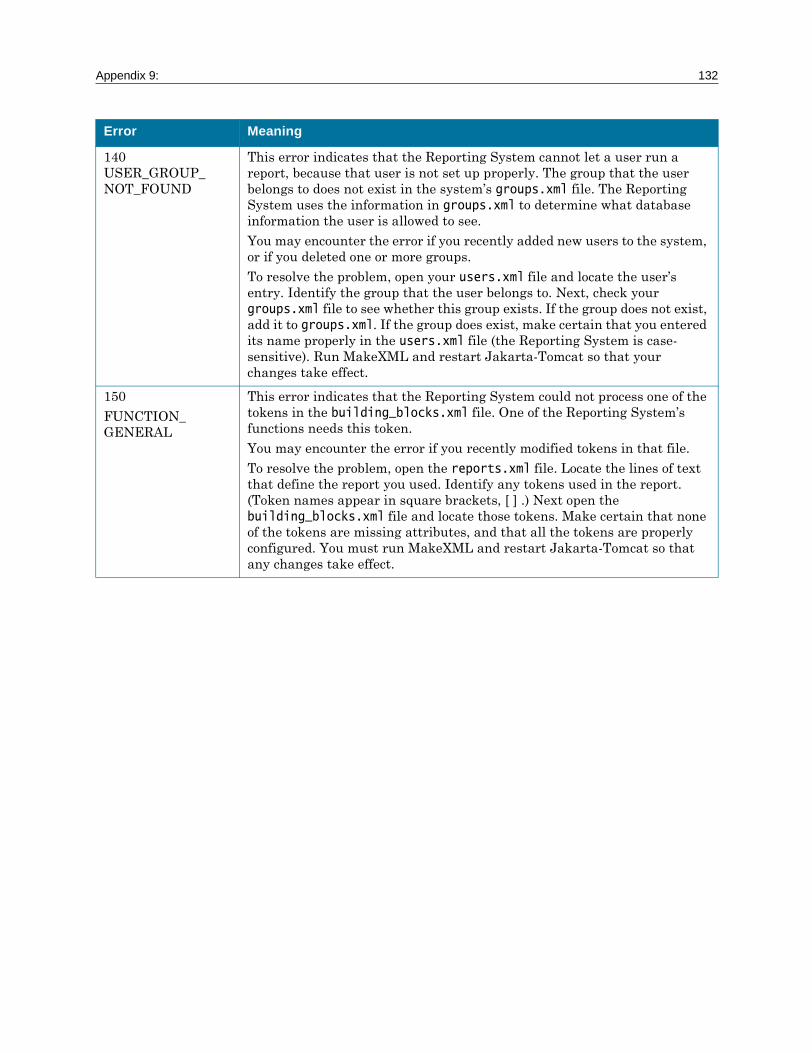
Appendix 9: 132
140USER_GROUP_NOT_FOUND
This error indicates that the Reporting System cannot let a user run a report, because that user is not set up properly. The group that the user belongs to does not exist in the system�s groups.xml file. The Reporting System uses the information in groups.xml to determine what database information the user is allowed to see.
You may encounter the error if you recently added new users to the system, or if you deleted one or more groups.
To resolve the problem, open your users.xml file and locate the user�s entry. Identify the group that the user belongs to. Next, check your groups.xml file to see whether this group exists. If the group does not exist, add it to groups.xml. If the group does exist, make certain that you entered its name properly in the users.xml file (the Reporting System is case-sensitive). Run MakeXML and restart Jakarta-Tomcat so that your changes take effect.
150
FUNCTION_GENERAL
This error indicates that the Reporting System could not process one of the tokens in the building_blocks.xml file. One of the Reporting System�s functions needs this token.
You may encounter the error if you recently modified tokens in that file.
To resolve the problem, open the reports.xml file. Locate the lines of text that define the report you used. Identify any tokens used in the report. (Token names appear in square brackets, [ ] .) Next open the building_blocks.xml file and locate those tokens. Make certain that none of the tokens are missing attributes, and that all the tokens are properly configured. You must run MakeXML and restart Jakarta-Tomcat so that any changes take effect.
Error Meaning
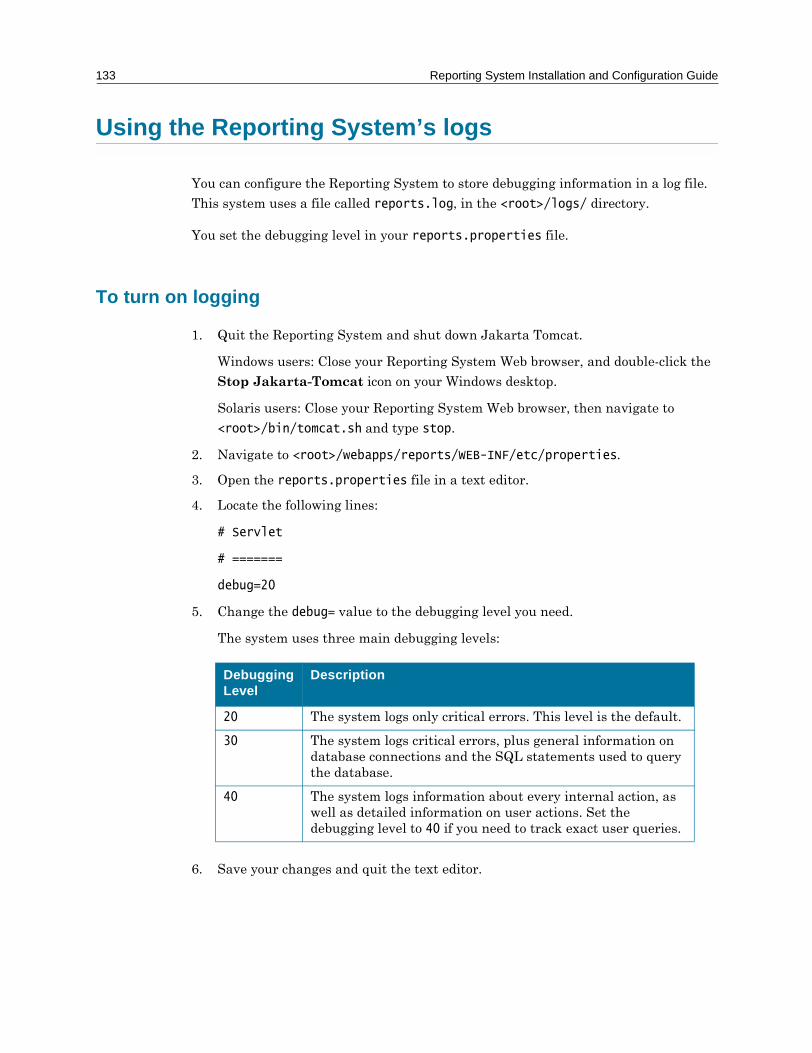
133 Reporting System Installation and Configuration Guide
Using the Reporting System’s logs
You can configure the Reporting System to store debugging information in a log file.
This system uses a file called reports.log, in the <root>/logs/ directory.
You set the debugging level in your reports.properties file.
To turn on logging
1. Quit the Reporting System and shut down Jakarta Tomcat.
Windows users: Close your Reporting System Web browser, and double-click the
Stop Jakarta-Tomcat icon on your Windows desktop.
Solaris users: Close your Reporting System Web browser, then navigate to
<root>/bin/tomcat.sh and type stop.
2. Navigate to <root>/webapps/reports/WEB-INF/etc/properties.
3. Open the reports.properties file in a text editor.
4. Locate the following lines:
# Servlet
# =======
debug=20
5. Change the debug= value to the debugging level you need.
The system uses three main debugging levels:
6. Save your changes and quit the text editor.
Debugging Level
Description
20 The system logs only critical errors. This level is the default.
30 The system logs critical errors, plus general information on database connections and the SQL statements used to query the database.
40 The system logs information about every internal action, as well as detailed information on user actions. Set the debugging level to 40 if you need to track exact user queries.

Appendix 9: 134
7. Start the Reporting System.
When your users access the system and run reports, the Reporting System will
store relevant log messages in the reports.log file (located in <root>/logs/).
Troubleshooting common problems
The Jakarta-Tomcat console disappears
You must start Jakarta-Tomcat before launching the Reporting System. Jakarta-
Tomcat runs in a console window in the background. If the console window flickers
and then disappears after you start Jakarta-Tomcat, another application may be
using the same port (by default, port 80). Identify and exit the conflicting application.
“Error: 500” message
If your database settings are incorrect in the reports.properties file, your web
browser will create an error similar to the following when you try to launch the
Reporting System:
Error: 500
Location: /reports/servlet/RequestHandler
Internal Servlet Error:
java.lang.NullPointerException
To resolve the problem, check your database settings in the reports.properties file.
This file is located in <root>\lib\itactics\report\etc\properties. The database
properties are defined in a series of lines similar to the following:
# Database
# ========
dbURL=jdbc:oracle:thin:@10.0.0.1:1521:nsm2000
driverName= oracle.jdbc.driver.OracleDriver
user=username
password=password
poolMinSize=2

135 Reporting System Installation and Configuration Guide
poolMaxSize=4
table=Event
“You have exceeded your tries” message
The Reporting System lets you attempt to log in a set number of times. If you fail to
provide a correct user name and password combination each time, the system displays
the message �You have exceeded your tries.�
To log in again, verify your user name and password, then restart both Jakarta-
Tomcat and the Reporting System.

Index
A
Access Levels 58, 59, 61Creating 60
ApplicationsConflicting 134
B
building_blocks.xml 19, 21, 23, 24, 59, 60, 61,90, 99, 117, 129, 130, 131, 132
C
Category 126Charts 129Classes
Custom 117Function 90, 117Input 90, 117Java 117Output 90, 117
Referencing 117Components 18
Jakarta-Tomcat 19Software 19Web Browser 20
confdrs 81, 83conffls 81, 83cs-base.nsm 44, 55cs-mainpanel.nsm 45, 56cust directory 59, 80, 81, 82Custom Reports. See Reports
CustomCustomizing 19, 80, 90
D
Data Restrictions. See Access LevelsDatabase 18, 131, 134
Connecting 38, 50Connections 40, 41, 51Incorrect Settings 134ODBC 39, 40Oracle 18Querying 73, 131SQL 18, 39

137 Reporting System Installation and Configuration Guide
dist directory 59, 80, 81, 82, 83, 89, 118
E
Error Codes 128Error 105 131Error 35 128Error 41 128Error 500 134Error 51 128Error 52 129Error 53 129Error 60 129Error 70 129Error 80 130Error 90 130
Errors. See Error Codes
G
Groups 58, 59Adding Users 62Creating 61
groups.xml 19, 59, 61, 62
H
Headers 98, 121Adding 98Post Headers 98, 121Pre Headers 98, 121
hyperdrill.xml 19, 21, 25, 26, 118, 120, 124,125Hyperdrilling 17, 25, 75, 120, 124, 125
Column 75, 76Row 77, 78
I
Icons. See ImagesImages
Changing 106, 108Default 106Location 107, 108Replacing. See Images
ChangingResolution 108Size 108
InstallingSolaris 37, 48, 49Windows 36, 38
Interface 15Display Area 15, 16, 72, 73Navigation Tree 15, 72, 73, 109Screen Elements 91, 92, 112
IP AddressTracking 79
J
Jakarta-Tomcat 18, 19, 20, 43, 54, 105, 129,130, 131, 134, 135
Disappearing 134Starting 43, 54Stopping 43, 54
JDBC Configuration Wizard 38, 50

Index 138
L
Launching 43, 54, 134SSM Main Console 44, 55Web Browser 43, 54, 70
layout.xml 19, 101, 102, 103, 104, 105Logging In 68, 70, 90, 129, 135Login
Attempts 101, 103Failure 70Prompts 105Screen 68, 70, 90, 100, 101, 104
M
MakeXML 19, 59, 80, 81, 83, 84, 88, 99, 118
P
passwd.bat 59, 63, 64, 65Passwords 38, 39, 40, 50, 59, 63, 64, 68, 70,101, 135
Assigning 63
R
Removing. See UninstallingreportingStyles.cs 90reportingStyles.css 91Reports
Adding 126, 128, 129, 130Basic 71, 72Custom 73, 118, 128, 129, 130Defining 119, 128
Hyperdrilling 25, 26, 120Output 120, 121, 123, 124Repeating 16, 72, 74, 129Re-running. See Reports
RepeatingRunning 16, 71, 72, 73Search 73, 74Summary 120, 123
reports.properties 38, 40, 41, 42, 50, 51, 53,134reports.xml 19, 21, 22, 23, 117, 118, 119, 124,125, 128, 129, 130, 131, 132reportset.xml 19, 21, 118, 126Requirements 36, 48
Client 37, 49Server 36, 48
S
ScreensLogin 100
Search ReportRunning 73
server.xml 42, 53Software 57SQL 131SQL. See also Databases
SQL 120SSL 41, 42, 52, 53Styles 92Stylesheets 90, 91, 92
Editing 91
T
Tokens 23, 24, 99, 129, 130, 131, 132Hyperdrilling 125

139 Reporting System Installation and Configuration Guide
tomcat.bat 38, 50Troubleshooting 128, 134
U
Uninstalling 45, 57User Name 70, 101, 135Users 41, 58, 59, 63
Creating 62Maximum Number 40, 51
users.xml 19, 59, 62
W
Working Directory 80, 81, 83
X
XML Files 19, 21, 59, 80, 81, 83, 99, 118