spectrum sharing and tariffs - tt · adrian foster spectrum sharing and tariffs impact of sharing...
TRANSCRIPT
Adrian Foster
Spectrum Sharing and TariffsImpact of Sharing on Prices
Regional Seminar - economic and financial
aspects of telecommunications Study Group 3
Regional Group for Latin America and
Caribbean (SG3RG-LAC)
SG3RG - LAC – El Salvador 2011
2
References
ICT Regulation Toolkit: Module V –
Spectrum Management, Section 5 on
Spectrum Pricing (revised)
ITU Trends 2008 – Spectrum Sharing,
Adrian Foster.
The Economics of Pricing Radio
Spectrum, Chris Doyle, Martin Cave,
Warwick Business School, March 2004
http://www.ictregulationtoolkit.org
http://www.itu.int/ITU-
D/study_groups/SGP_2002-2006/SF-
Database/index.asp
http://www.ictregulationtool
kit.org/en/Publication.2451.
html

Outline
3
1• Introduction – Scarcity and Spectrum Sharing• Introduction – Scarcity and Spectrum Sharing
2• Implications of Sharing on Tariffs and Prices• Implications of Sharing on Tariffs and Prices
3• Spectrum Valuation Methods• Spectrum Valuation Methods
4• Conclusions• Conclusions
Central Questions
Questions about sharing and tariffs. Two
concepts with multiple dimensions and
relationships:
First is Spectrum Sharing – what is it and why do
we do it? Here we will briefly review:— Types of Spectrum Sharing
Second is Tariffs – there are two aspects:— Do higher spectrum prices lead to higher end user prices? –
this is the operators argument. We will look at this at closer
level of detail.
— How does sharing affect spectrum prices and end user prices.
Regulators are interested in valuing spectrum.
We will look at some of the ways to do that:
Administrative and market means.
4
Spectrum Sharing
Spectrum sharing encompasses several techniques –
some administrative, some technical, and some
market-based.
Spectrum can be shared in several dimensions:
time, space, and geography.
Limiting transmission power is also a way to permit
sharing among low-power devices operating in the
spectrum ―commons, dynamic spectrum access,
which takes advantage of power and interference
reduction techniques. Use of whites spaces.
Sharing can also be accomplished through licensing
and/or commercial arrangements involving
spectrum leasing and trading.
5
Sharing Whitespaces
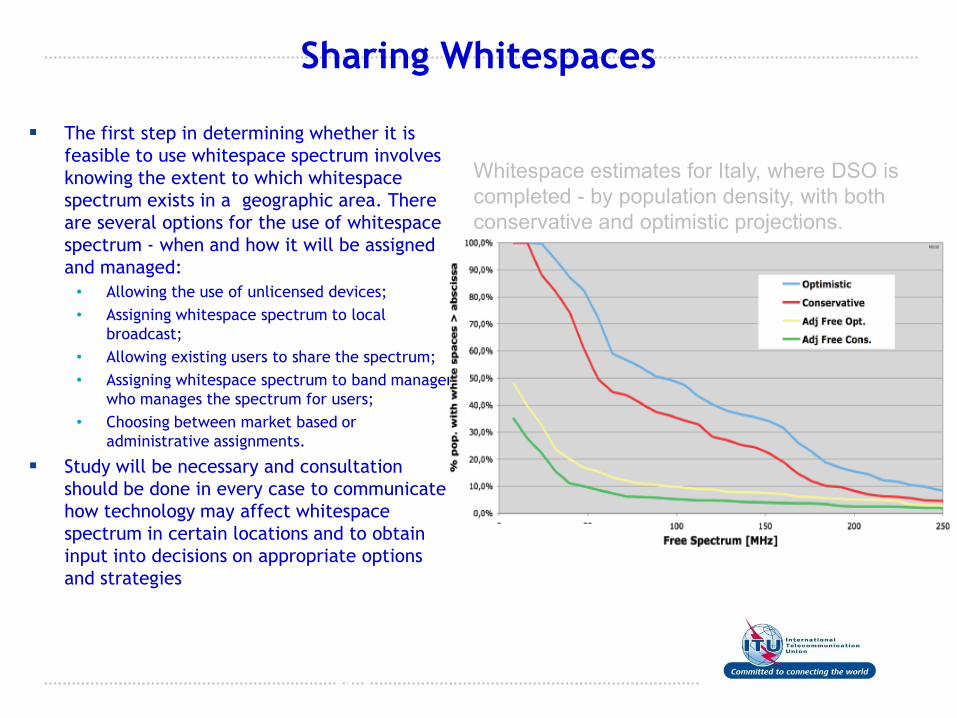
The first step in determining whether it is
feasible to use whitespace spectrum involves
knowing the extent to which whitespace
spectrum exists in a geographic area. There
are several options for the use of whitespace
spectrum - when and how it will be assigned
and managed:
• Allowing the use of unlicensed devices;
• Assigning whitespace spectrum to local
broadcast;
• Allowing existing users to share the spectrum;
• Assigning whitespace spectrum to band manager
who manages the spectrum for users;
• Choosing between market based or
administrative assignments.
Study will be necessary and consultation
should be done in every case to communicate
how technology may affect whitespace
spectrum in certain locations and to obtain
input into decisions on appropriate options
and strategies
ANRCETI 2010, Chisinau,
Moldova
Whitespace estimates for Italy, where DSO is
completed - by population density, with both
conservative and optimistic projections.
When is Spectrum Sharing Needed? It should be conceptually straightforward to answer
the question of when sharing is required?
Essentially, spectrum sharing may be needed when: Demand for spectrum exceeds the supply;
There is congestion and the potential for harmful interference;
The technical means exist to permit different users to share; and
Other means for adjusting spectrum use and assignment (such as
re-farming) have become burdensome and costly, undermining
the goals of economic and technical efficiency;
The bigger implication is that spectrum
management policies are evolving towards more
flexibility and market-oriented models to increase
opportunities for efficient spectrum use.
7
Sources of Scarcity
There are three ‖causes‖ of spectrum scarcity: Increased demand;
Administrative processes; and
Technical issues, such as interference management and technical
obsolescence.
It is important to note that spectrum scarcity is a
relative term – scarcity can vary within a country
and from one country to another.
When examining various spectrum management approaches
for spectrum sharing it is important to keep in mind that
differences do exist between countries and between urban,
rural, and remote regions.
8

Which bands can be shared?
The bottom line is that all bands potentially can be
shared. In fact, many bands remain underutilized
and could be shared using a combination of:
Administrative rules -- time, geographic, and interference-
management constraints; and
Technical solutions – filters, smart antenna, smart
transmitters (such as SDR and cognitive radio) and transmit
power limitations.
An important exception to sharing may result from a policy
decision to maintain exclusive bands and assignments for
public safety and security services.
9
Connection Between Scarcity and Prices
Improving access to spectrum has a powerful
influence on both spectrum prices and end
user prices – they both will fall:
Limiting spectrum decreases competition. Ways
this can be done (creating administrative
scarcity) include:— Reserving or holding back spectrum;
— Use of spectrum caps when not warranted;
— Restrictive frequency band and channelling plans (failed 2.6
GHz. OFTA auction in 2009);
— Excessive transaction costs reduce sharing by impeding
trading (Ofcom suspects this is a primary reason for low levels
of trades)
10
Spectrum Prices and Tariffs
Do high spectrum prices lead to higher end user
prices?
OECD Study on Telecom 2009 – telecom expenditures as a %
of household disposable income is steady at 2% and in some
cases declining. Getting more for less.
Several regulators monitor post auction consumer prices –
ACMA and Ofcom have seen no impact.
Independent Study - based on analysis of retail prices in
different regions with different underlying spectrum,
license costs show prices are not different and there is no
statistical correlation between auction prices and retail
prices.
11
Spectrum Prices and Tariffs
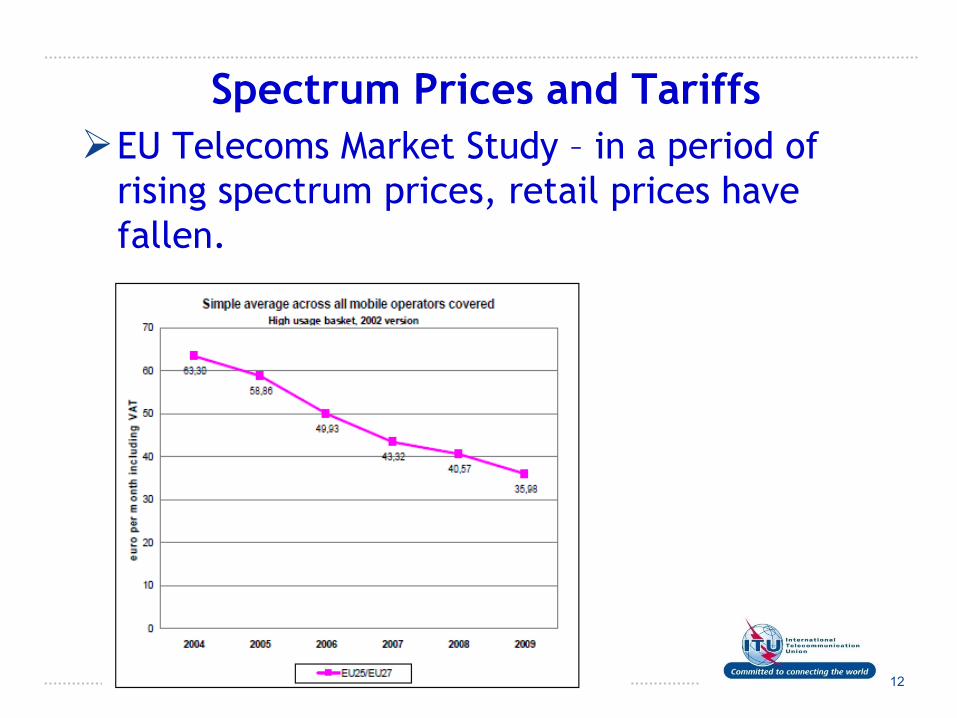
EU Telecoms Market Study – in a period of
rising spectrum prices, retail prices have
fallen.
12

13
Equilibrium prices
These examples lead us back to the Theory of
Prices:
Equilibrium prices are generally set in a
competitive market when relative prices have
been established for the cost of good X in terms
of the cost of good Y reflecting consumers
willingness to pay for the transformation.
economic efficiency and price equilibrium are
related. The right # goods are created at the
price in a competitive market place equating
supply and demand which is efficient.
Supports the view that spectrum prices are
sunk costs and do not determine end user
prices.
Spectrum Sharing and Tariffs
Now we can come back to the question of
how does spectrum sharing impact tariffs.
The simple answer is that sharing reduces
spectrum prices but these prices don‘t have
an impact on retail prices.
The most important influences on high retail
prices are 1:
Competition or the lack of it;
Interconnection and termination rates.
141. EU Market Study 2009.
Spectrum Prices and SharingSpectrum sharing reduces the spectrum
rights of the users sharing the band or the
frequencies. What is worth more?
An exclusive assignment of a band or range of
frequencies? Example Cellular bands and email.
A shared assignment?
Caution - There can be unintended
consequences of sharing which could impact
retail prices for consumers:
Collusion between operators sharing frequencies,
other infrastructure;
Loss of innovation and service evolution.
15
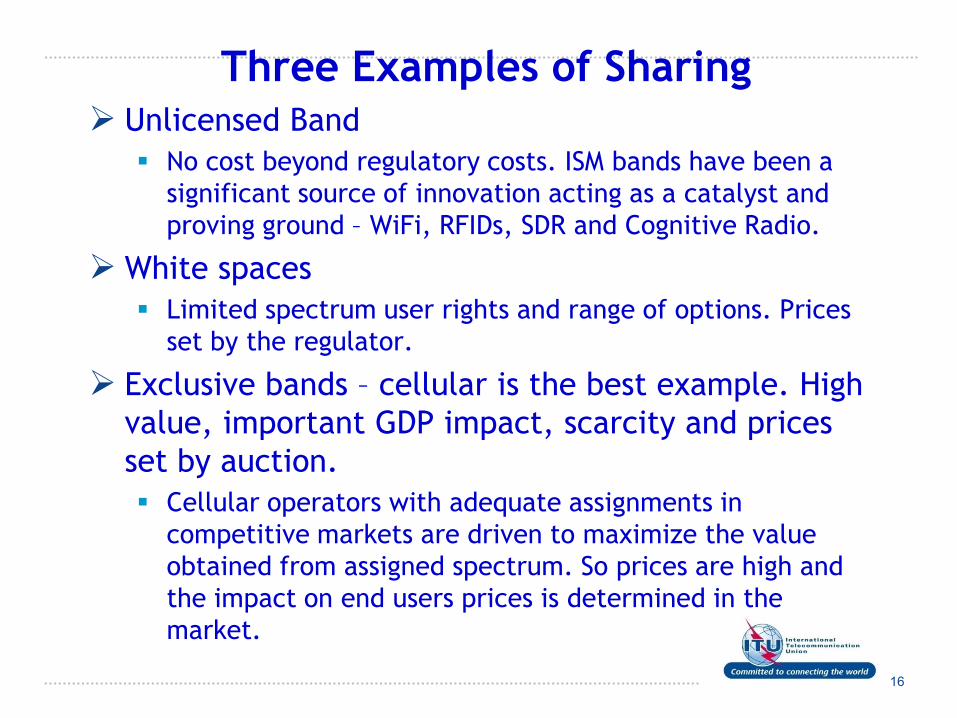
Three Examples of Sharing Unlicensed Band
No cost beyond regulatory costs. ISM bands have been a
significant source of innovation acting as a catalyst and
proving ground – WiFi, RFIDs, SDR and Cognitive Radio.
White spaces
Limited spectrum user rights and range of options. Prices
set by the regulator.
Exclusive bands – cellular is the best example. High
value, important GDP impact, scarcity and prices
set by auction.
Cellular operators with adequate assignments in
competitive markets are driven to maximize the value
obtained from assigned spectrum. So prices are high and
the impact on end users prices is determined in the
market.
16

Spectrum Valuation
Why of interest?
Not all regulators are in a position to nor do
markets appear to support readiness for market-
based prices for new licenses established by way
of an auction.
Licenses are up for renewal and license values
need to be reset.
Need to understand values to support refarming
initiatives.
Spectrum user charges need to be sufficiently
high to properly act as an incentive encouraging
efficient utilization and technology choice.
17
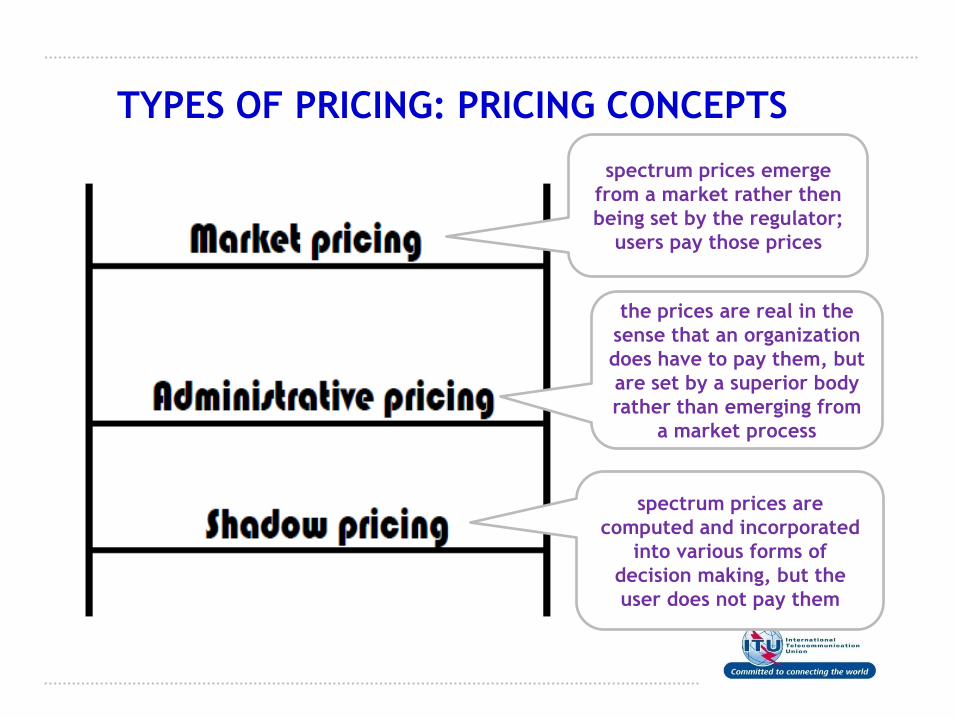
TYPES OF PRICING: PRICING CONCEPTS
spectrum prices emerge
from a market rather then
being set by the regulator;
users pay those prices
the prices are real in the
sense that an organization
does have to pay them, but
are set by a superior body
rather than emerging from
a market process
spectrum prices are
computed and incorporated
into various forms of
decision making, but the
user does not pay them
ADMINISTRATIVE PRICING PRINCIPLES
Should aim at producing an estimate of the
opportunity cost of each frequency;
Should focus on possibilities for technical
substitution between the given frequency and
other frequencies or other inputs;
The resulting input prices for spectrum should
encourage inefficient uses and inefficient
users of spectrum.
Approaches to setting administrative
spectrum prices
The ‘individual band’ approach: It involves the examination of use of a given band for a
particular purpose.
The ‘across the board’ approach: it involves establishing a declining sequence of prices for
frequency bands arrayed in ascending order, with the
sequence of prices being independent of the specific uses
made of the frequencies.
Becomes increasingly difficult to implement as the number of
competing uses of spectrum gets large
21
Definitions Marginal Benefits: refer to the value resources saved or
foregone when resources allocations are changed between
factors of production. Marginal benefits typically decline due to
decreasing returns to scale. In other words, as the number of
units increase the benefit attributed to each additional unit
decreases.
Opportunity Cost: is found by estimating what other resources
which will be saved if the same spectrum is redeployed to
produce another service; or what are the extra costs which will
be incurred if the spectrum not available (i.e. less spectrum is
available) to provide the service for which it is currently
employed.
Spectrum should be priced in any use, at its opportunity cost which will
then apply the right level of price pressure.
Prices should not be too high to force excessive economies which will
leave valuable spectrum unused .
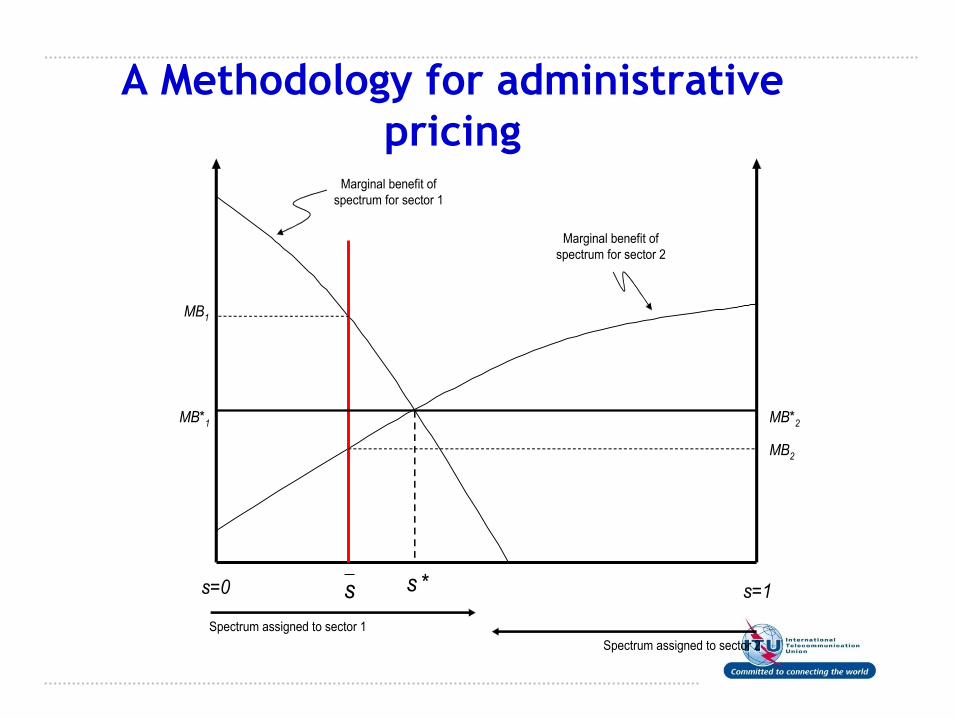
A Methodology for administrative
pricing
s=0 s=1
Spectrum assigned to sector 2
Spectrum assigned to sector 1
Marginal benefit of
spectrum for sector 1
Marginal benefit of
spectrum for sector 2
MB1
MB2
s *s
MB*1 MB*2
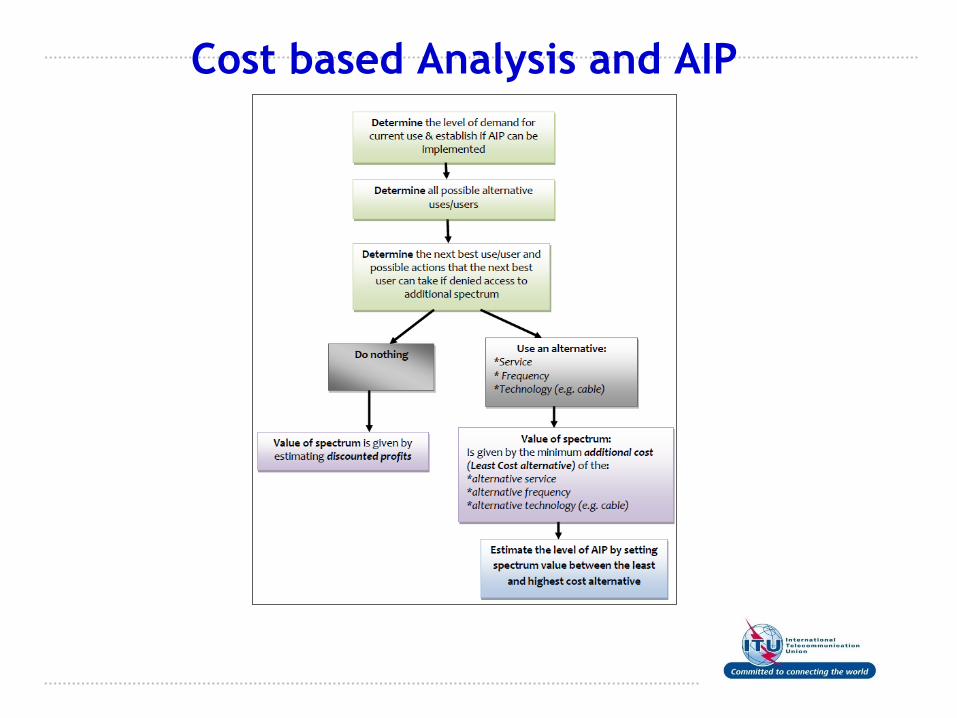
Cost based Analysis and AIP
Spectrum Pricing Methodology: Summary
1. For a given frequency band identify the current and
other potential uses of the band.
2. Calculate the opportunity cost of spectrum for the
current use of the band and other uses until a use is
found which has a higher marginal value than the
current use.
3. If there is a use with a marginal value higher than the
current use of the band then set the valuation
between the two values, but towards the bottom end
of the range of values.
4. If there is no use with an opportunity cost higher than
the current use of the band then set the valuation
equal to the opportunity for the current use.
Adminstrative costs should be recovered.
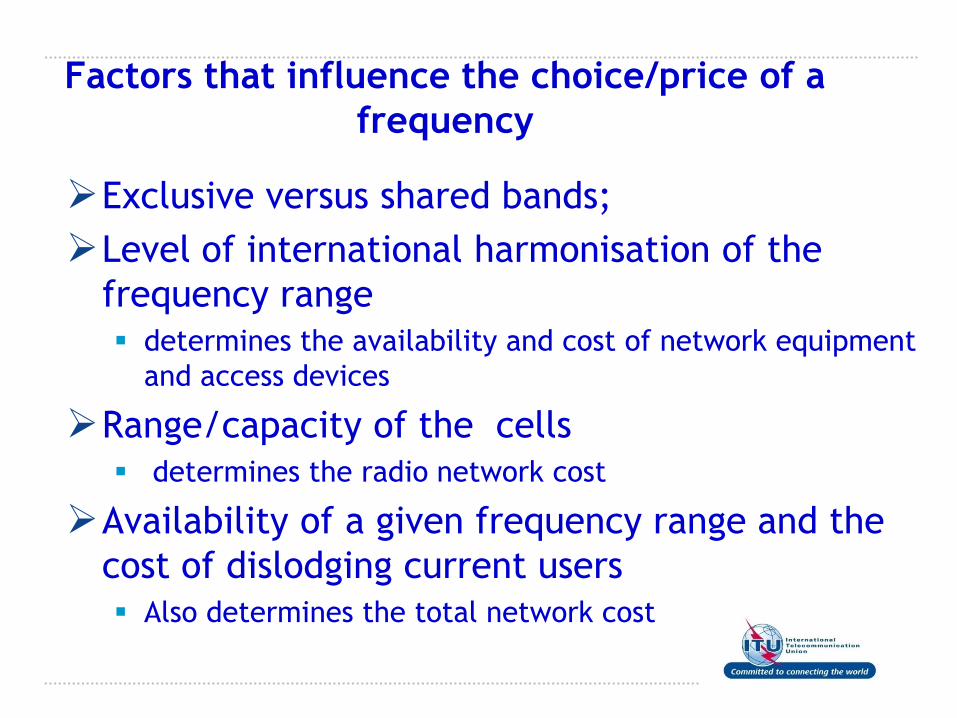
Factors that influence the choice/price of a
frequency
Exclusive versus shared bands;
Level of international harmonisation of the
frequency range
determines the availability and cost of network equipment
and access devices
Range/capacity of the cells
determines the radio network cost
Availability of a given frequency range and the
cost of dislodging current users
Also determines the total network cost
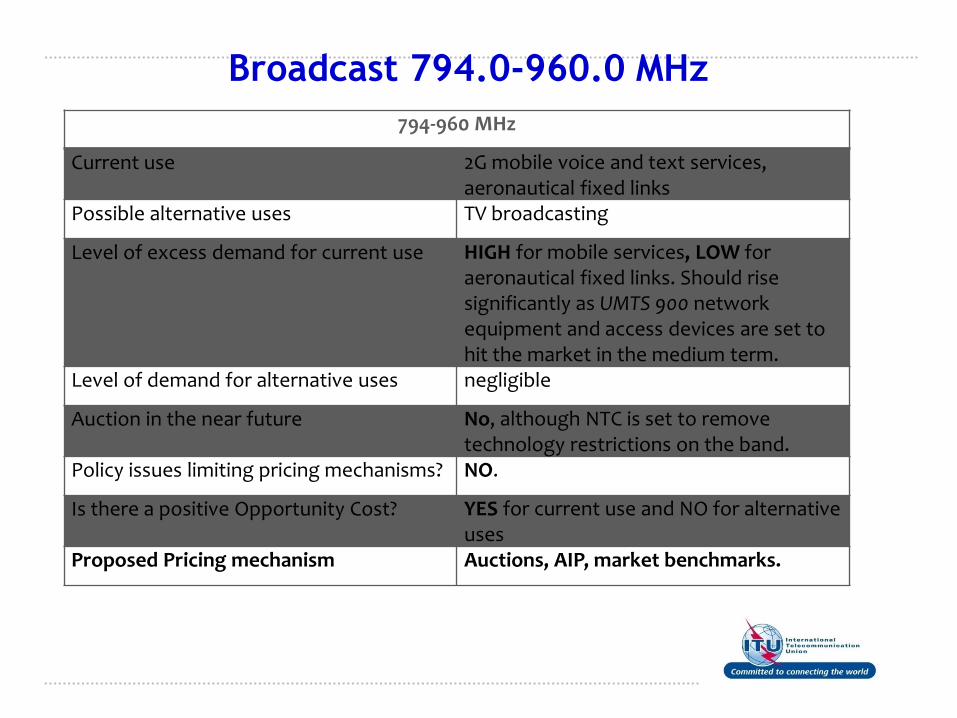
Broadcast 794.0-960.0 MHz
794-960 MHz
Current use 2G mobile voice and text services, aeronautical fixed links
Possible alternative uses TV broadcasting
Level of excess demand for current use HIGH for mobile services, LOW for aeronautical fixed links. Should rise significantly as UMTS 900 network equipment and access devices are set to hit the market in the medium term.
Level of demand for alternative uses negligible
Auction in the near future No, although NTC is set to remove technology restrictions on the band.
Policy issues limiting pricing mechanisms? NO.
Is there a positive Opportunity Cost? YES for current use and NO for alternative uses
Proposed Pricing mechanism Auctions, AIP, market benchmarks.
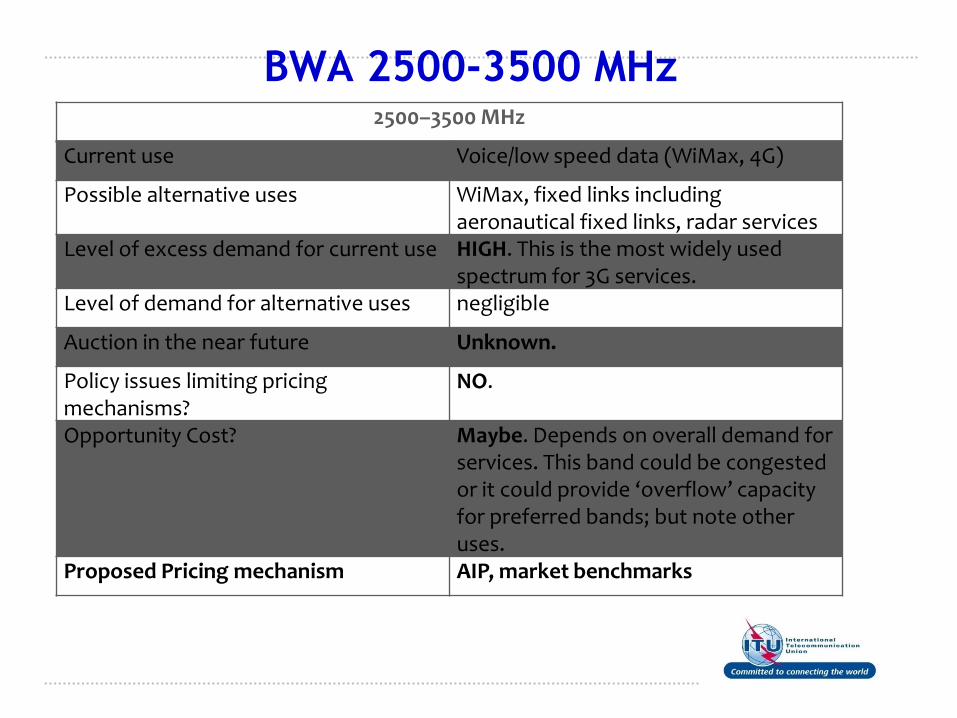
BWA 2500-3500 MHz2500–3500 MHz
Current use Voice/low speed data (WiMax, 4G)
Possible alternative uses WiMax, fixed links including aeronautical fixed links, radar services
Level of excess demand for current use HIGH. This is the most widely used spectrum for 3G services.
Level of demand for alternative uses negligible
Auction in the near future Unknown.
Policy issues limiting pricing mechanisms?
NO.
Opportunity Cost? Maybe. Depends on overall demand for services. This band could be congested or it could provide ‘overflow’ capacity for preferred bands; but note other uses.
Proposed Pricing mechanism AIP, market benchmarks
Assessing marginal value of mobile
communications spectrum
The opportunity cost of a given frequency used for
mobile communications spectrum is the cost saved as a
result of using that frequency rather than its next best
alternative.
This ‗cost saving‘ hinges on the fact that base stations
using lower frequencies have a longer range, hence a
network using them can be constructed.
This consideration is the basis of our approach to valuing
and pricing spectrum fro mobile communications.
Because we are using theoretical cost models to
calculate differences in the cost of networks using
different frequencies, there is risk of overestimating the
value of spectrum. Hence the regulator should adjust the
valuations derived, probably downwards, before use.
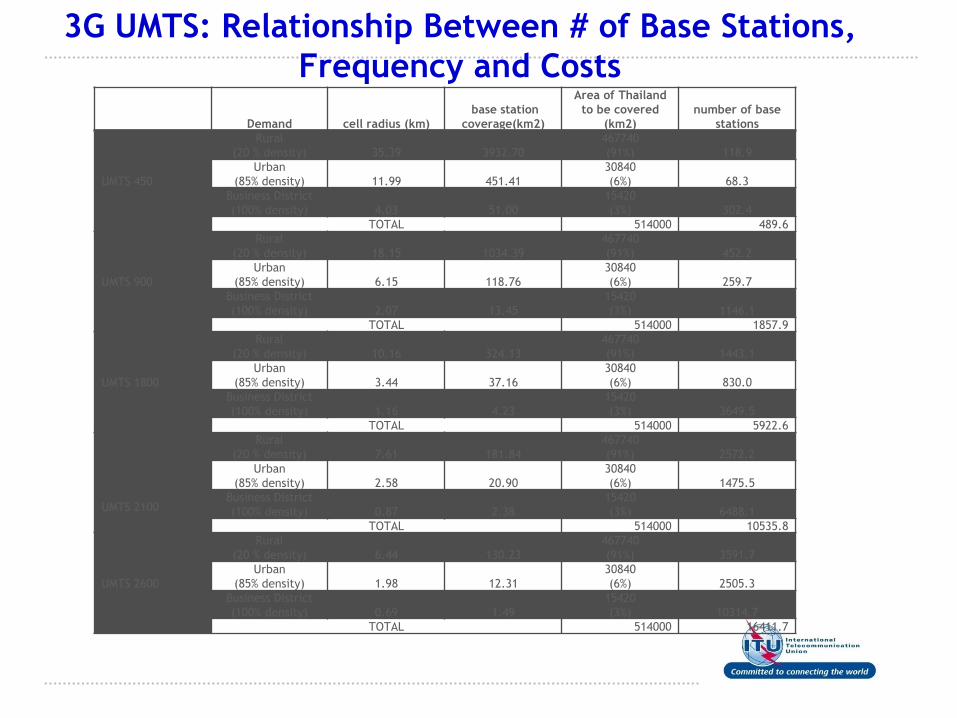
3G UMTS: Relationship Between # of Base Stations,
Frequency and Costs
Demand cell radius (km)
base station
coverage(km2)
Area of Thailand
to be covered
(km2)
number of base
stations
UMTS 450
Rural
(20 % density) 35.39 3932.70
467740
(91%) 118.9
Urban
(85% density) 11.99 451.41
30840
(6%) 68.3
Business District
(100% density) 4.03 51.00
15420
(3%) 302.4
TOTAL 514000 489.6
UMTS 900
Rural
(20 % density) 18.15 1034.39
467740
(91%) 452.2
Urban
(85% density) 6.15 118.76
30840
(6%) 259.7
Business District
(100% density) 2.07 13.45
15420
(3%) 1146.1
TOTAL 514000 1857.9
UMTS 1800
Rural
(20 % density) 10.16 324.13
467740
(91%) 1443.1
Urban
(85% density) 3.44 37.16
30840
(6%) 830.0
Business District
(100% density) 1.16 4.23
15420
(3%) 3649.5
TOTAL 514000 5922.6
UMTS 2100
Rural
(20 % density) 7.61 181.84
467740
(91%) 2572.2
Urban
(85% density) 2.58 20.90
30840
(6%) 1475.5
Business District
(100% density) 0.87 2.38
15420
(3%) 6488.1
TOTAL 514000 10535.8
UMTS 2600
Rural
(20 % density) 6.44 130.23
467740
(91%) 3591.7
Urban
(85% density) 1.98 12.31
30840
(6%) 2505.3
Business District
(100% density) 0.69 1.49
15420
(3%) 10314.7
TOTAL 514000 16411.7
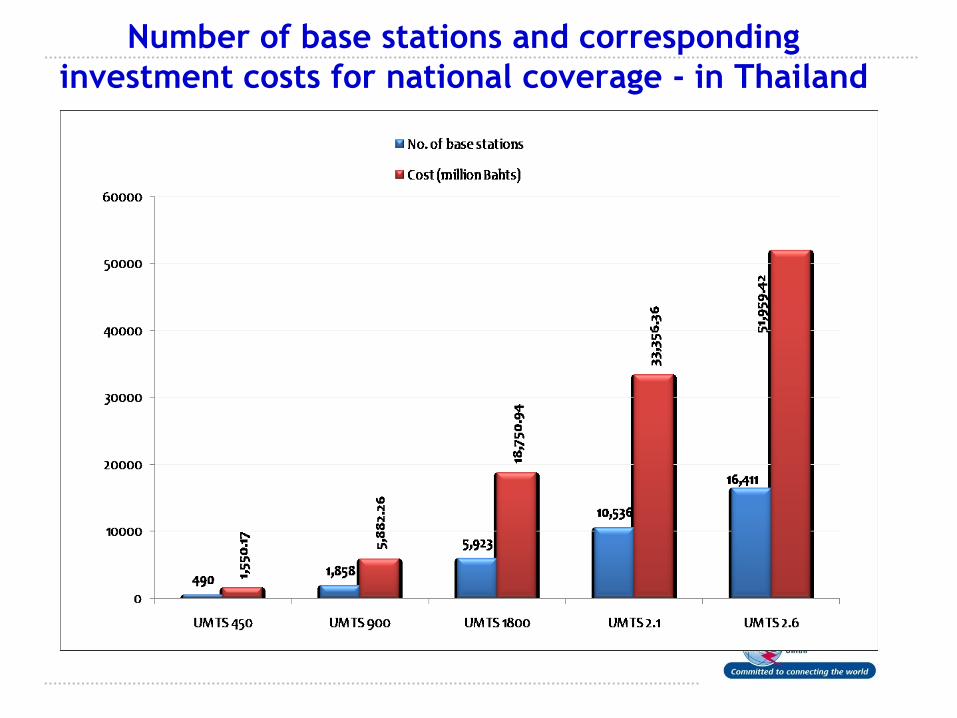
Number of base stations and corresponding
investment costs for national coverage - in Thailand
Number of base stations and corresponding
investment costs for national coverage
Example for Thailand
According to the slide above, there are substantial cost
implications on the choice of the spectrum on which to
deploy mobile telephone services on a commercial scale.
It is approximately 13 times cheaper to build a mobile
telephone network using UMTS 450 compared to using
UMTS 2100 if only the radio frequency costs are taken
into consideration. Also, a UMTS 900-based network can
actually provide the same quality of services as a UMTS
2100-based network at a cost lower by 11089.44 million
THBs.
Costs included in determining AIP
The costs noted above are investment or capital costs of
constructing and the costs of operating the base stations for
a network of specified capacity. In order to use these as a
basis for spectrum prices, a conversion an annual cost per
MHz. is requires. This is done by:
assuming a base station life of 20 years;
estimating the cost of installing and operating the network for the first
half of this period as a net present value in year one, using a real
discount rate of 10%.
The net present value is then re-expressed as a sequence of
equal annual costs over the ten year period, and divided by
the number of MHz deployed to yield a price or value in THB
million per MHz per year. The residual values of any assets at
the end of the ten year period count as a negative cost.
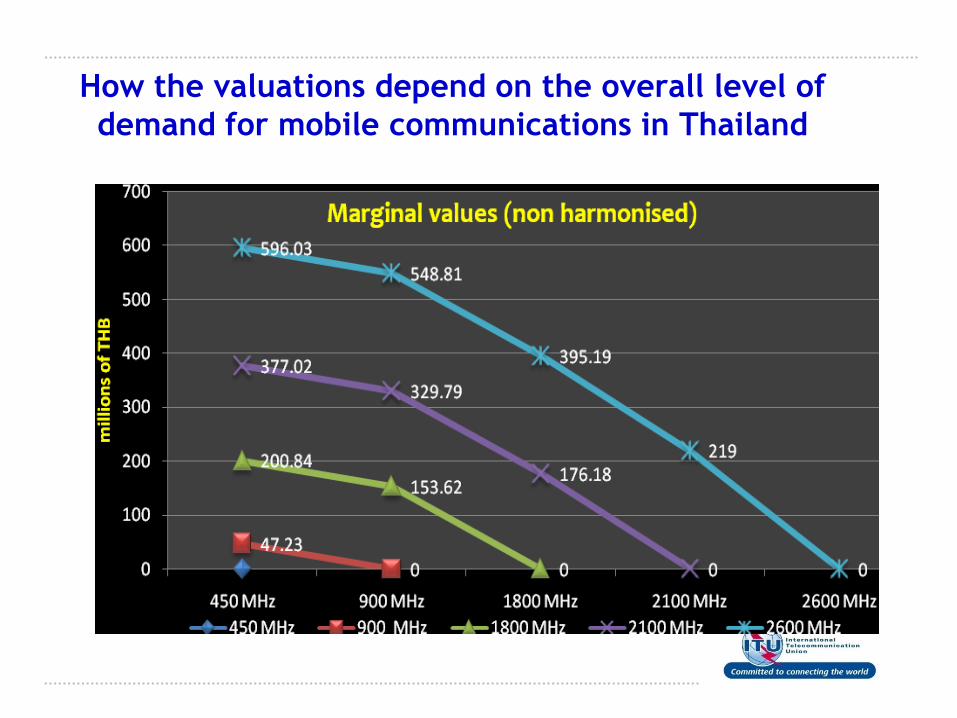
How the valuations depend on the overall level of
demand for mobile communications in Thailand
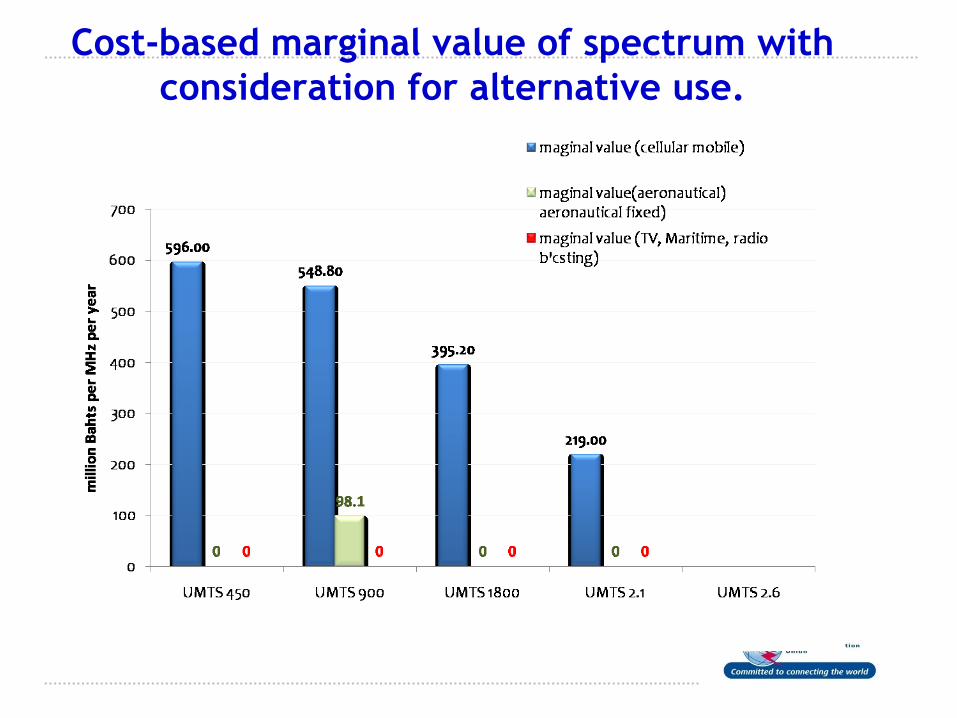
Cost-based marginal value of spectrum with
consideration for alternative use.
AIP Valuations
Requires ongoing modelling and refinement and
judgemental adjustment.
This should done in conjunction with the choice of
how they are to be used:
as guides to decision taking by spectrum users (for
example, by assisting in procurement decisions by
government departments);
as guides to decision taking by the NTC (for example ,
by assisting refarming decisions);
as prices charged to spectrum users.
each of these uses requires a different approach to
setting a value for or price of the frequency.
36
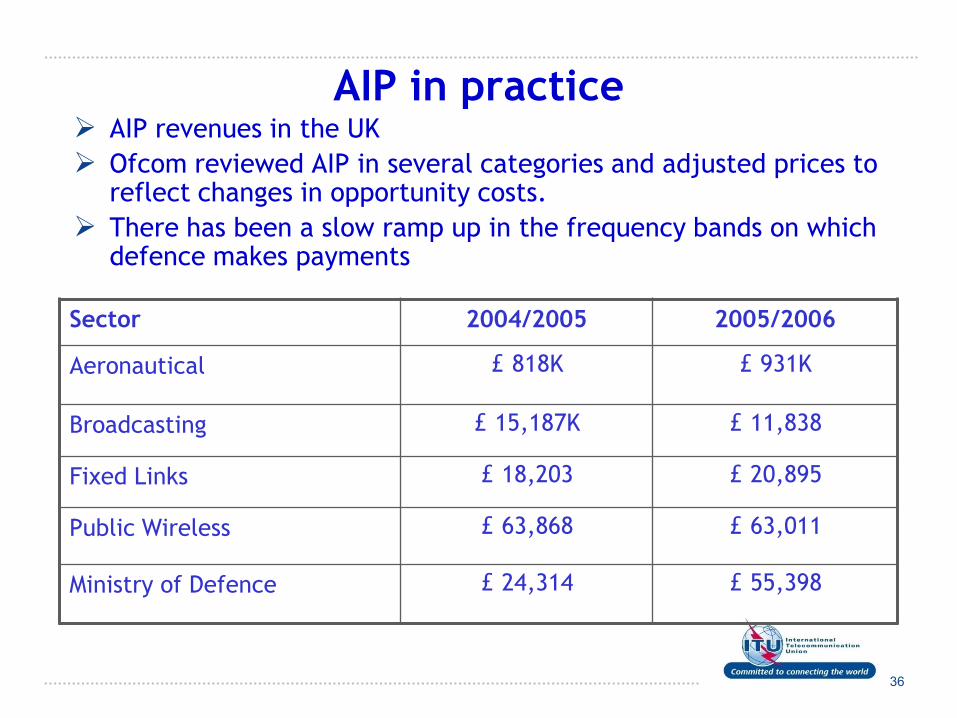
AIP in practice AIP revenues in the UK
Ofcom reviewed AIP in several categories and adjusted prices to reflect changes in opportunity costs.
There has been a slow ramp up in the frequency bands on which defence makes payments
Sector 2004/2005 2005/2006
Aeronautical £ 818K £ 931K
Broadcasting £ 15,187K £ 11,838
Fixed Links £ 18,203 £ 20,895
Public Wireless £ 63,868 £ 63,011
Ministry of Defence £ 24,314 £ 55,398
Other Methods of Spectrum Valuation
Economic Modelling Approach
Business-based Valuation Approach
37
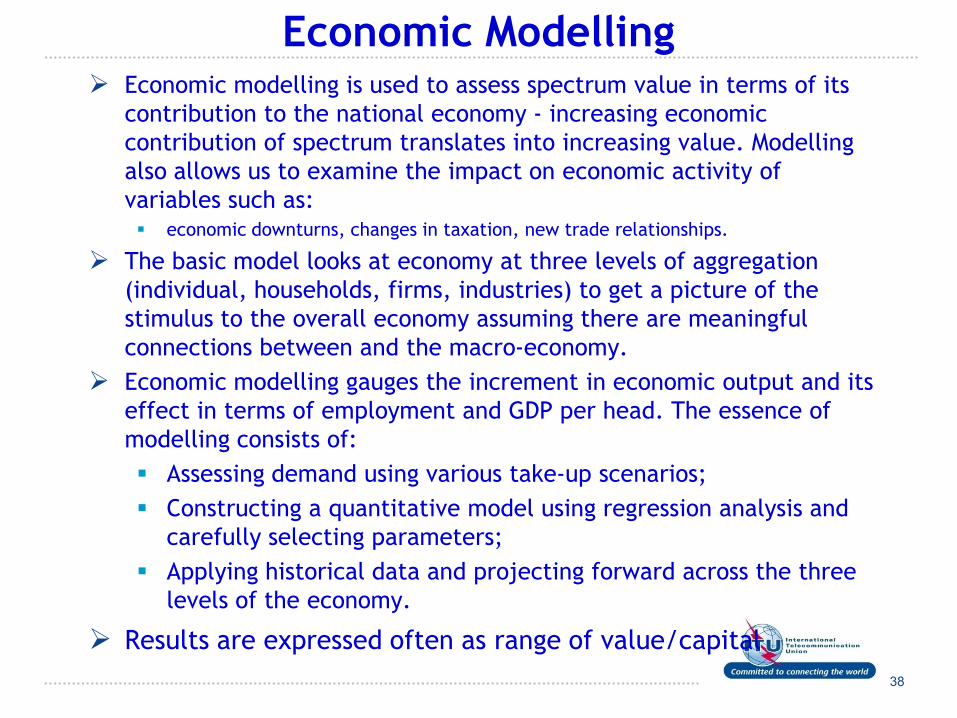
Economic Modelling Economic modelling is used to assess spectrum value in terms of its
contribution to the national economy - increasing economic
contribution of spectrum translates into increasing value. Modelling
also allows us to examine the impact on economic activity of
variables such as: economic downturns, changes in taxation, new trade relationships.
The basic model looks at economy at three levels of aggregation
(individual, households, firms, industries) to get a picture of the
stimulus to the overall economy assuming there are meaningful
connections between and the macro-economy.
Economic modelling gauges the increment in economic output and its
effect in terms of employment and GDP per head. The essence of
modelling consists of:
Assessing demand using various take-up scenarios;
Constructing a quantitative model using regression analysis and
carefully selecting parameters;
Applying historical data and projecting forward across the three
levels of the economy.
Results are expressed often as range of value/capital
38
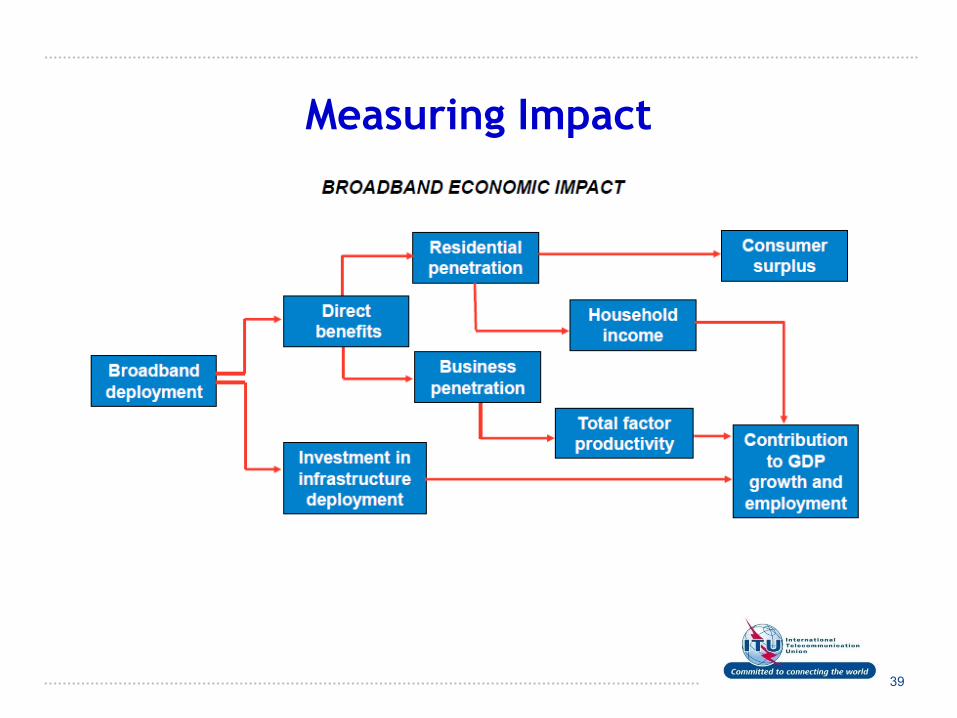
Measuring Impact
39
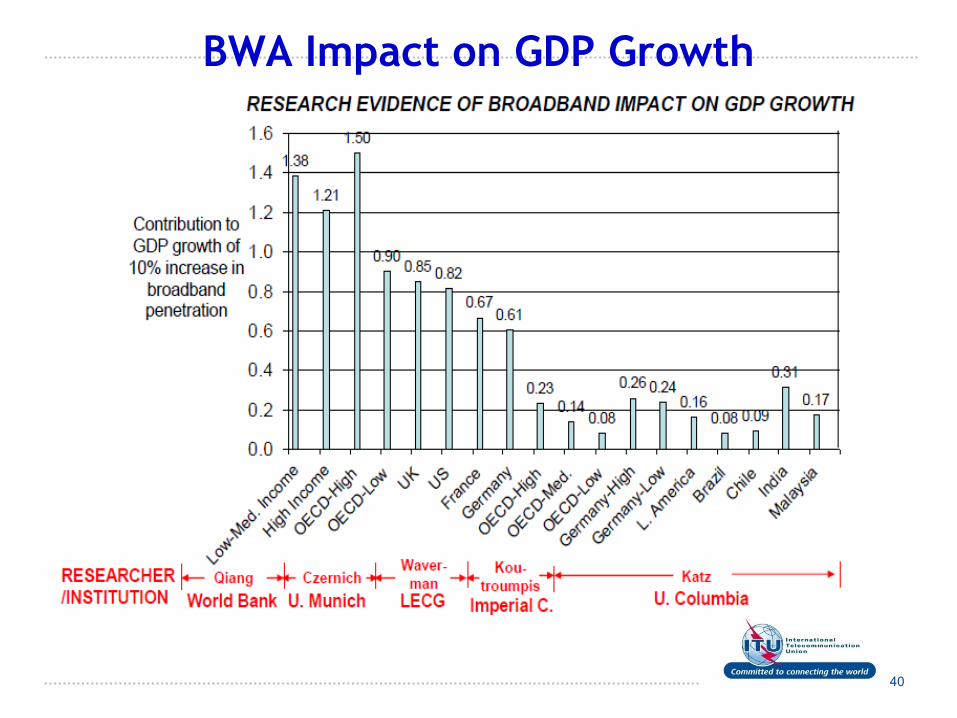
BWA Impact on GDP Growth
40
Business-based Modelling
A business-based valuation model assesses the value
of spectrum from a commercial perspective. The
objectives of both regulator and operator converge
at the point when the spectrum is optimally priced.
The RA is interested in economic and technical
efficiency while the operator is interested in
exploiting the profit potential of the assigned
frequencies. The principles of the business-based
valuation approach involve understanding how much
profit the spectrum in question will generate.
41
Conclusion The following list the main points (+/-‘s)with
traditional administrative spectrum price:
determination:
At best they can only reflect the scarcity of the bands to
which they apply;
They emerge from a computational process by the
regulator not from the interaction of firms in a market
place;
The computational process is inevitably inaccurate and
subjective. It is however better than adopting a zero price,
which we know is incorrect;
A risk assessment process (consultation or a study such as
this one) is required to establish the harm imposed by
making them too high and too low;
Applying economic and business valuation modelling
techniques brings much needed rigor to the exercise of
valuing spectrum. 42
Contact
Adrian Foster CMC
PartnerMcLean Foster & Co.+1 613 256 [email protected]
Prof. Martin Cave
London School of Economics
Tel +44(0)7958483709www.martincave.org.uk