speech analysis and synthesis using an am–fm modulation...
TRANSCRIPT

Speech analysis and synthesis using an AM±FM modulationmodel 1
Alexandros Potamianos a,*, Petros Maragos b
a Bell Laboratories, Lucent Technologies, 600 Mountain Ave., Room 2D-463, Murray Hill, NJ 07974-0636, USAb Department of ECE, National Technical University of Athens, Zografou 15773, Athens, Greece
Received 20 November 1997; received in revised form 25 October 1998; accepted 26 January 1999
Abstract
In this paper, the AM±FM modulation model is applied to speech analysis, synthesis and coding. The AM±FM
model represents the speech signal as the sum of formant resonance signals each of which contains amplitude and
frequency modulation. Multiband ®ltering and demodulation using the energy separation algorithm are the basic tools
used for speech analysis. First, multiband demodulation analysis (MDA) is applied to the problem of fundamental
frequency estimation using the average instantaneous frequency as estimates of pitch harmonics. The MDA pitch
tracking algorithm is shown to produce smooth and accurate fundamental frequency contours. Next, the AM±FM
modulation vocoder is introduced, which represents speech as the sum of resonance signals. A time-varying ®lterbank is
used to extract the formant bands and then the energy separation algorithm is used to demodulate the resonance signals
into the amplitude envelope and instantaneous frequency signals. E�cient modeling and coding (at 4.8±9.6 kbits/sec)
algorithms are proposed for the amplitude envelope and instantaneous frequency of speech resonances. Finally, the
perceptual importance of modulations in speech resonances is investigated and it is shown that amplitude modulation
patterns are both speaker and phone dependent. Ó 1999 Elsevier Science B.V. All rights reserved.
Zusammenfassung
In diesem Artikel wird das AM±FM Modulationsmodel f�ur Sprachanalyse, Sprachsynthese und Sprachkodierung
angewendet. Das AM±FM Modulationsmodel repr�asentiert das Sprachsignal als Summe von Formantresonanzen,
welche jeweils Amplituden- und Frequenzmodulation enthalten. Multiband®lterung und Demodulation, basierend auf
dem Energie-Trennungsalgorithmus, sind die wesentlichen Hilfsmittel f�ur die Sprachanalyse. Zuerst wird die Multi-
band-Demodulationsanalyse (MDA), basierend auf der Sch�atzung von Harmonischen der Grundfrequenz mittels
durchschnittlicher Frequenz, auf das Problem der Grundfrequenzbestimmung angewandt. Der MDA-Algorithmus zur
Bestimmung der Grundfrequenz erzeugt glatte und genaue Grundfrequenzverla�ufe. Anschliessend wird der AM±FM-
Modulationsvocoder, der Sprache als eine Summe von Resonanzsignalen darstellt, vorgestellt. Eine zeitlich variable
Filterbank wird zur Extraktion der Formantb�ander und der Energie-Trennungsalgorithmus zur Demodulation des
Resonanzsignals in die Einh�ullende der Amplitude und die zugrundeliegende Frequenz verwendet. Eine e�ziente
Modellierung und ein Kodierungsalgorithmus (4.8±9.6 kbits/sec) f�ur die Einh�ullende der Amplitude und
die zugrundeliegende Frequenz der Sprachresonanzen werden vorgeschlagen. Abschliessend wird die perzeptuelle
Speech Communication 28 (1999) 195±209www.elsevier.nl/locate/specom
* Corresponding author. Tel.: +1 908 582 4203; fax: +1 908 582 7308; e-mail: [email protected] Most of this work was performed while the authors were with the School of E.C.E, Georgia Institute of Technology, Atlanta, GA,
USA. It was partially supported by the US National Science Foundation under Grants MIP-9396301 and MIP-9421677.
0167-6393/99/$ ± see front matter Ó 1999 Elsevier Science B.V. All rights reserved.
PII: S 0 1 6 7 - 6 3 9 3 ( 9 9 ) 0 0 0 1 2 - 6
Bedeutung der Modulation von Sprachresonanzen untersucht und es wird gezeigt, dass die Muster der Amplituden-
modulation von Sprecher und Phonem abh�angen. Ó 1999 Elsevier Science B.V. All rights reserved.
ReÂsumeÂ
Cet article pr�esente un mod�ele de modulation AM±FM pour l'analyse, la synth�ese, et le codage de la parole. Le
mod�ele AM±FM d�ecrit le signal de parole comme la somme de di��erents signaux repr�esentant les fr�equences form-
antiques, modul�es en fr�equence et amplitude. Un ®ltrage multibandes et une d�emodulation bas�ee sur un algorithme de
s�eparation d'�energie sont utilis�es pour analyser le signal. Une analyse par d�emodulation multibandes (ADM) est tout
d'abord employ�ee a®n d'estimer la fr�equence fondamentale du signal, en se basant sur la fr�equence instantan�ee mo-
yenne comme estimation des harmoniques du pitch. Cet algorithme de suivi du pitch conduit �a une estimation lisse et
pr�ecise de la fr�equence fondamentale. Un vocoder utilisant une modulation AM±FM est ensuite mis en oeuvre pour
mod�eliser le signal par la somme de ses harmoniques. Un banc de ®ltres adaptatif permet d'extraire les bandes de
fr�equence formantiques et un algorithme fond�e sur la s�eparation d'�energie est utilis�e pour d�emoduler les harmoniques
des formats en signaux instantan�es modul�es en amplitude et en fr�equence. Di��erents algorithmes sont propos�es con-
duisant �a un codage e�cace �a 4.8±9.6 kbits/sec de l'enveloppe et la fr�equence instantan�ee des r�esonances formantiques.
En®n, l'importance perceptive de la modulation des r�esonances du signal de parole est �etudi�ee et d�emontre que la
modulation d'amplitude ainsi obtenue est ind�ependante du locuteur et du phon�eme. Ó 1999 Elsevier Science B.V. All
rights reserved.
Keywords: Multiband demodulation; Energy separation algorithm; AM±FM modulation model; Pitch tracking; AM±FM vocoder;
Speech synthesis
1. Introduction
Despite the well-known existence of nonlinearand time-varying phenomena during speech pro-duction the linear source-®lter model is extensivelyused as the foundation of speech modeling. Devi-ations from these linear assumptions are mathe-matically modeled, often with little concern aboutthe underlying physical phenomena. Such modelshave had some success in reproducing and syn-thesizing speech using concatenative methods, butthey have not been equally successful in trans-forming speaker characteristics and speaking stylesin a controlled way.
Motivated by nonlinear and time-varying phe-nomena 2 during speech production and the need
for a better understanding of the speech produc-tion process, Maragos et al. (1993a) proposed anonlinear model that describes a speech resonanceas a signal with a combined amplitude modula-tion (AM) and frequency modulation (FM)structure
r�t� � a�t�cos 2p fct
240@ �Zt
0
q�s� ds
35� h
1A; �1�
where fc , F is the `center value' of the formantfrequency, q�t� is the frequency modulating signal,and a�t� is the time-varying amplitude. The in-stantaneous formant frequency signal is de®ned asf �t� � fc � q�t�. The speech signal s�t� is modeledas the sum s�t� �PK
k�1 rk�t� of K such AM±FMsignals, one for each formant. Modeling formantresonance signals as AM±FM signals relates bothto formant models and to the phase vocoder (seeSection 3 for a comparison).
The use of a nonlinear model for speech reso-nances was motivated by the work of Teager andTeager (1990). Kaiser (1990) formally introducedthe energy operator as a signal analysis tool. In aseries of papers Maragos et al. (1991, 1993a, b)laid down the groundwork for applying the
2 Evidence for the existence of speech modulations has been
provided in (Maragos et al., 1993a). For instance, as Teager's
experiments have demonstrated, the air jet ¯owing through the
vocal tract during speech production is highly unstable and
oscillates between its walls, attaching or detaching itself, and
thereby changing the e�ective cross-sectional areas and air
masses. This can cause instantaneous modulations of the
amplitude and frequency of a speech resonance as explained
in (Maragos et al., 1993a) using time-varying oscillators.
196 A. Potamianos, P. Maragos / Speech Communication 28 (1999) 195±209
AM±FM model and energy operators to demod-ulation of speech resonances. Multiband ®lteringand demodulation using the energy operator wasformalized by Bovik et al. (1993). Original work inthe areas of signal processing, speech analysis,synthesis and recognition, music processingand image processing motivated or based on theAM±FM modulation model and the energy sepa-ration algorithm can be found in the literature(Potamianos, 1995; Lu and Doerschuk, 1996; Rao,1996; Sussman, 1996; Jankowski, 1996 Havlicek,1996; Potamianos and Maragos, 1997). Harmonicmodeling using AM±FM models has also attractedsome interest (Ramalho, 1994; Stylianou, 1996) asa generalization of the short-time invariant sinu-soidal model (McAulay and Quatieri, 1986). Fi-nally, the need of demodulating a sum of AM±FMsignals with overlapping spectra was the motiva-tion for Santhanam (1998).
In this paper, the AM±FM modulation model isapplied to speech analysis, synthesis and coding.The ®rst part of this paper continues the work ofPotamianos and Maragos (1996) on multibanddemodulation for speech analysis applications.Speci®cally, multiband demodulation is applied tofundamental frequency estimation: the averageinstantaneous frequency in each band is used as aharmonic frequency estimate (i.e., fundamentalfrequency multiple) and the fundamental fre-quency is calculated from the harmonic frequen-cies by functional minimization. The second partof this paper focuses on the AM±FM modulationvocoder as a means to model and study the per-ceptual importance of modulations in speech. Thevocoder models speech as a sum of formant reso-nance signals (see Eq. (1)) extracted from thespeech signal through time-varying ®ltering. E�-cient algorithms are proposed for modeling andcoding of the amplitude envelope and instanta-neous frequency signals of each resonance. Themodeling provides ¯exibility in controlling theamount of amplitude and frequency modulationsin the synthesized resonance signals. The proposedanalysis±synthesis system provides the means formeasuring the amount and perceptual importanceof amplitude and frequency modulation in speechresonances. Overall, the paper o�ers a compre-hensive collection of algorithms that can be used
for the analysis and synthesis of nonlinear phe-nomena in speech production.
The organization of this paper is as follows.First multiband demodulation is introduced, theanalysis tool used extensively in this paper. InSection 4 the application of the AM±FM modu-lation model and multiband demodulation analy-sis to the problem of fundamental frequencyestimation is presented. In Section 3, the AM±FManalysis±synthesis system is presented and e�cientcoding algorithms are proposed for the amplitudeand frequency modulating signals of each reso-nance. Finally, the perceptual importance ofmodulations is discussed in Section 4.
2. Speech analysis
In this section, the main tools used throughoutthe paper are introduced namely multiband ®lter-ing and demodulation analysis. Short-time in-stantaneous frequency estimates are proposed andtheir relative merits are discussed for formant andfundamental frequency estimation. Next, themultiband demodulation formant tracking algo-rithm introduced (Potamianos and Maragos,1996) is outlined. Finally, multiband ®ltering anddemodulation are applied to the problem of fun-damental frequency estimation.
2.1. Multiband demodulation analysis
A speech resonance (or, in general, speech fre-quency band) signal r�t� is extracted from thespeech signal x�t� through bandpass ®ltering. Areal Gabor ®lter is used for this purpose. TheGabor ®lter, by being maximally smooth and op-timally concentrated both in the time and fre-quency domain, provides smooth amplitude andfrequency estimates in the demodulation stage thatfollows. The amplitude envelope ja�t�j and in-stantaneous frequency f �t� signals are obtained byapplying the energy separation algorithm (which isan AM±FM demodulation algorithm) on thespeech resonance signal r�t�. A formal discussionon using Gabor wavelets for multiband demodu-lation analysis (MDA) can be found in (Boviket al., 1993).
A. Potamianos, P. Maragos / Speech Communication 28 (1999) 195±209 197
The energy separation algorithm (ESA) (Mar-agos et al., 1993a) is based on the nonlinear dif-ferential Teager±Kaiser energy operator (Kaiser,1990). The energy operator tracks the energy ofthe source producing an oscillation signal r�t� andis de®ned as W�r�t�� � � _r�t��2 ÿ r�t��r�t�; where_r � dr=dt. The ESA frequency and amplitude es-timates are (Maragos et al., 1993a)
1
2p
��������������W� _r�t��W�r�t��
s� f �t�; W�r�t����������������
W� _r�t��p � ja�t�j: �2�
Similar equations and algorithms exist in discretetime. An alternative way to estimate ja�t�j, f �t� isthe Hilbert transform demodulation (HTD) algo-rithm, i.e., as the modulus and the phase derivativeof the Gabor analytic signal (see (Potamianos andMaragos, 1994) for an ESA versus HTD com-parison).
2.2. Short-time frequency estimates
Short-time estimates of the average instanta-neous frequency have been proposed in (Pota-mianos and Maragos, 1996) in the context of anMDA-based formant tracking application. Spe-ci®cally, the unweighted Fu and weighted averageinstantaneous frequency Fw estimates were de®nedas (see also (Cohen and Lee, 1992))
Fu � 1
T
Zt0�T
t0
f �t� dt; �3�
Fw �R t0�T
t0f �t� �a�t��2 dtR t0�T
t0�a�t��2 dt
; �4�
where ja�t�j, f �t� are the amplitude envelope andthe instantaneous frequency signals of resonancesignal r�t�, t0 and T are the start and duration ofthe analysis frame.
To illustrate the behavior of the two short-timeestimators we assume that a speech signal can bemodeled as a sum of sinusoids with slowly time-varying amplitudes and frequencies (McAulayandQuatieri, 1986) in particular, a speech reso-nance can be modeled as a sum of a few sinusoidsrepresenting the harmonics in the formant band,i.e.,
r�t� �X
n
an cos �2pfnt � hn�; �5�
where an, fn, hn are the harmonic amplitudes, fre-quencies and phases. Using this simple sinusoidalmodel it can be shown (see Appendix A) that Fu
locks on the harmonic frequency with the greatestamplitude in the formant band, while Fw weightseach harmonic frequency in the formant band byits squared amplitude, i.e.,
Fu � fM ; Fw �P
n fna2nP
n a2n
; �6�
where fM is the frequency of the most prominentharmonic in the spectrum band (aM � maxk�ak�).As a result, the unweighted estimate Fu is a goodharmonic frequency estimate, i.e., a multiple kF0 ofthe fundamental frequency F0. The accuracy of theharmonic estimate improves as the bandwidth ofthe resonance signal r�t� decreases. The weightedestimate Fw provides an amplitude weighted har-monic frequency average which is a natural for-mant frequency estimate. For that reason Fw wasused for formant tracking (Potamianos and Mar-agos, 1996). A visualization of the properties of Fu,Fw for the sum of two amplitude modulated sinu-soids can be found in (Potamianos and Maragos,1996).
2.3. Formant tracking
In (Potamianos and Maragos, 1996), multibanddemodulation analysis and the weighted frequencyestimate Fw were applied to formant tracking. TheMDA formant tracking algorithm is brie¯y re-viewed next.
The speech signal is ®ltered through a ®xedbank of Gabor bandpass ®lters, uniformly spacedin frequency (typical e�ective RMS Gabor ®lterbandwidth is 400 Hz and spacing is 50 Hz). Theamplitude envelope ja�t�j and instantaneous fre-quency f �t� signals are estimated for each Gabor®lter output using the ESA. The short-timeweighted instantaneous frequency Fw�t; m� is com-puted (every 10 ms) for each speech frame locatedaround time t and for each Gabor ®lter centeredat frequency m. The time-frequency distributionFw�t; m� is used to determine the raw formanttracks. Finally, the tracks are re®ned using global
198 A. Potamianos, P. Maragos / Speech Communication 28 (1999) 195±209
continuity constraints. For a detailed explanationof the MDA formant tracker, results and com-parisons with other formant tracking algorithmssee (Potamianos and Maragos, 1996).
2.4. Fundamental frequency estimation
As discussed in Section 2.2 and shown in Ap-pendix A, the short-time average of the instanta-neous frequency Fu is an accurate estimate of themost dominant frequency in the signal's spectrum(for narrowband signals r�t�). Next, a multibanddemodulation pitch tracking algorithm is pro-posed using Fu as a harmonic frequency estimate. 3
Similarly to MDA formant tracking, the speechsignal is ®ltered through a bank of Gabor band-pass ®lters and then each ®ltered signal isdemodulated to amplitude envelope and instanta-neous frequency signals. Typical e�ective RMSGabor ®lter bandwidth is 200 Hz and the ap-
proximate spacing is 100 Hz following a mel fre-quency scale (by using a non-uniform ®lter spacingharmonic frequency estimation errors are averagedout). The short-time average of the instantaneousfrequency signal Fu is computed and is used as anestimate of the most prominent harmonic in eachband. The resulting time-frequency average in-stantaneous frequency distribution Fu�t; m� is usedin a functional minimization procedure to estimatethe pitch contour.
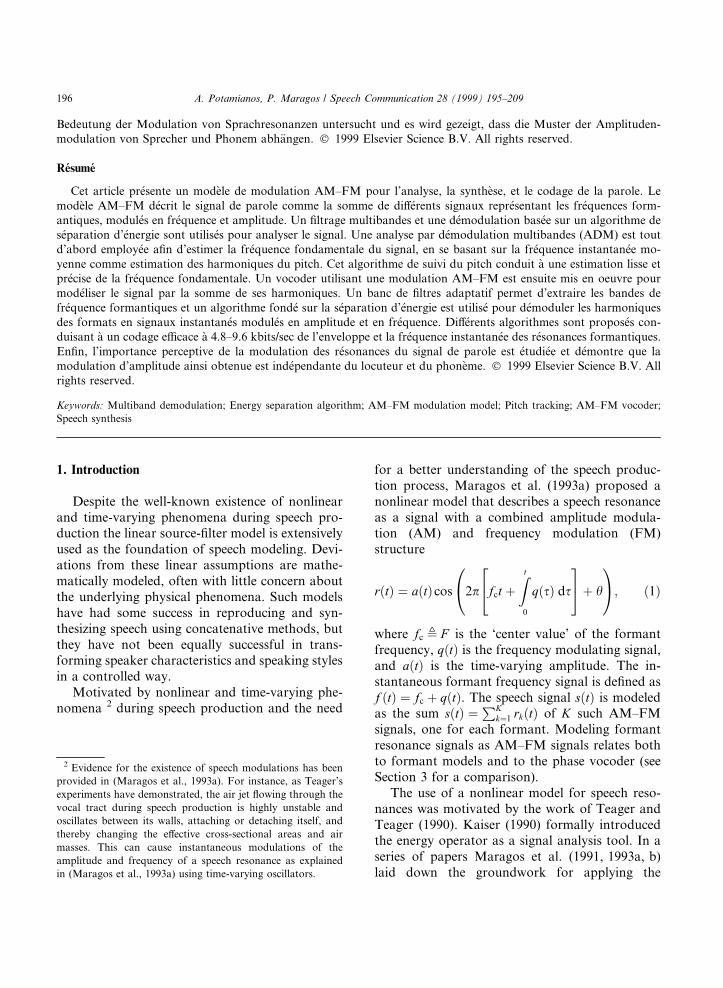
A typical Gabor ®lterbank is shown inFig. 1(a). The harmonic frequency estimates for a20 ms speech frame are shown as dotted lines su-perimposed on the Fourier spectrum of the speechsignal in Fig. 1(b). Note that certain harmonicshave no corresponding Fu estimates while othershave more than one estimates depending on theposition of the ®lters, i.e., MDA is a non-para-metric analysis method. The time-frequency dis-tribution of Fu�t; m� is shown in Fig. 2(c) for asentence from the TIMIT database. The harmonictracks are clearly visible and directly correspond tothe harmonic regions in the narrowband speechspectrogram shown in Fig. 2(b).
The fundamental frequency of a voiced speechsegment is determined from the minimization ofthe weighted error sum E�F0� over all possiblefundamental frequency candidates F0:
3 Alternatively, the slope of the phase signal
S/ � 1
2p
R t0�Tt0
t/�t� dtR t0�Tt0
t2 dtcomputed from linear regression can provide more noise-robust
estimates (the phase signal is the integral of the instantaneous
frequency signal: /�t� � 2pR tÿ1 f �s� ds) (Potamianos, 1995).
Fig. 1. (a) The Mel-spaced ``dense'' Gabor ®lterbank used for MDA and (b) the average instantaneous frequency Fu�m� estimates for
each frequency band m shown superimposed on the Fourier spectrum for a 20 ms speech frame (/aa/ from ``dog'').
A. Potamianos, P. Maragos / Speech Communication 28 (1999) 195±209 199

Fig. 2. (a) Speech signal: ``Cats and dogs each hate the other''. (b) Narrowband speech spectrogram. (c) Time-frequency average
instantaneous frequency distribution (20 ms window). (d) MDA fundamental frequency contour.
200 A. Potamianos, P. Maragos / Speech Communication 28 (1999) 195±209

E�F0� � 1
F0
XN
n�1
a�mn� Fu�mn����� ÿ Fu�mn�
F0
��0:5
�F0
����;�7�
where b�c denotes truncation of the decimal partand b� � 0:5c is the rounding operator, mn is thecenter frequency of the nth Gabor ®lter in the ®l-terbank, N is the total number of ®lters and Fu�mn�is the average instantaneous frequency for the bandcentered at frequency mn. The weighting factorsa�mn� � ha2�t; mn�iT measure the relative promi-nence of the estimated harmonic Fu�mn�. In the errorsum of Eq. (7), deviations of the harmonic estimatefrom the nearest multiple of the fundamentalfrequency candidate are penalized. The estimatedfundamental frequency F0 provides the best matchbetween the short-time harmonic estimatesFu�mn�; n � 1; 2; . . . and the fundamental frequencymultiples kF0, k � 1; 2; . . .. The algorithm producesvery detailed and smooth fundamental frequencycontours as shown in the example of Fig. 2(d)for the speech signal in Fig. 2(a).
The pitch contours are ®ltered by a median ®l-ter to correct few occurrences of `pitch-halving'.Alternatively, a global error functional can bede®ned for each voiced region that explicitly pe-nalizes pitch discontinuities. The global error EG
to be minimized over all possible pitch paths F0�t�is de®ned as
EG �Zt2t1
E�F0�t�� dt � kZt2t1
dF0�t�dt
� �2
dt; �8�
for each voiced region �t1; t2�. E is the error crite-rion of Eq. (7) and k is a scalar that weights therelative importance of the error terms. Smootherpitch contours are obtained for large values of k.
The pitch estimates can be further re®ned (error� 1 Hz) with a small increase in computationalcomplexity by pitch-synchronous averaging of theinstantaneous frequency signal f �t� in a secondpass of the pitch tracking algorithm. Speci®cally, itis shown in Appendix A that when the analysiswindow duration T is a multiple of the pitch pe-riod the accuracy of the Fu estimate is
Fu � fM �O��4�; � � maxk 6�M�ak=aM�; �9�
where fM is the most prominent harmonic in thespectrum band (aM � maxk�ak�) and ak is the am-plitude of the kth harmonic fk. Note that the erroris at worst O��� for arbitrary window duration T .Pitch-synchronous re®nement of fundamentalfrequency contours was shown to eliminate pitchestimation errors for synthetic speech signals.
The MDA pitch tracker is related to pitchtrackers based on the sinusoidal model (McAulayand Quatieri, 1986). Both algorithms estimate themost prominent harmonics in the speech spectrumand use a functional minimization approach todetermine the pitch contour (McAulay and Qua-tieri, 1990; George, 1991). The MDA pitch trackeris also related to auditory ®lterbank processing. In(McEachern, 1992), McEachern speculates thatthe fundamental frequency is perceived as aweighted sum of the harmonic frequencies esti-mated for each auditory ®lter through demodula-tion. Quatieri et al. (1997) propose perceptually-motivated demodulation algorithms that use theoutput of two ®lters with overlapping frequencyresponses.
The pitch tracker was evaluated on 37 utter-ances from the TIMIT database. Each sentencewas spoken from a di�erent speaker (23 male, 14female speakers). The MDA pitch tracker ®lter-bank (as tested) consisted of 20 mel-spaced ®ltersspanning the 0±2000 Hz range. The MDA pitchestimates were compared to the pitch estimatescomputed by the ESPS signal processing package(of Entropic Research Laboratory) based on(Secrest and Doddington, 1983). A 40 ms analysiswindow (updated every 10 ms) was used for bothpitch trackers. The following were the main resultsfrom visual inspection of the tracks and from de-tailed numerical comparisons:· The tracks of the ESPS tracker were over-
smoothed, especially in the voiced±unvoicedtransition regions.
· The total number of segments where the esti-mated pitch was approximately half or doublethe actual value were twelve for the ESPS track-er versus ®ve for the MDA pitch tracker (a seg-ment includes at least four consecutive frameswith halving or doubling errors).
· The mean and standard deviation of the di�er-ences in fundamental frequency estimates
A. Potamianos, P. Maragos / Speech Communication 28 (1999) 195±209 201

between the ESPS and MDA pitch trackers(pitch doublings and halvings excluded) com-puted over all sentences was 0.7 Hz (ESPS mi-nus MDA) and 3.1 Hz, respectively. For eachsentence, the range for the mean di�erencewas 0±1.9 Hz and for the standard deviation1.6±5.9 Hz.
Overall, the multiband ®ltering and demodulationpitch tracking algorithm is simple, and producessmooth and accurate fundamental frequency con-tours.
3. The AM±FM modulation vocoder
The AM±FM modulation analysis±synthesissystem extracts three or four time-varying formantbands rk�t� from the spectrum by ®ltering thespeech signal s�t� along the formant tracks. Theformant tracks are obtained from the multibanddemodulation formant tracking algorithm (seeSection 2.3). Filtering is performed by a bank ofGabor ®lters with time-varying center frequenciesthat follow the formant tracks. Next, the reso-nance signals are demodulated to amplitude en-velope jak�t�j and instantaneous frequency fk�t�signals using the ESA. The information signalsjak�t�j, fk�t� have typical bandwidths of 400±600 Hz and are decimated by a factor of 20:1 (for16 kHz sampling frequency). Finally, the deci-mated information signals are modeled and coded(see Section 3.1). To synthesize the speech signal,the phase is obtained as the running integral of theinstantaneous frequency, and the formant bandsrk�t� are reconstructed from the amplitude andphase signals. The synthetic speech signal s�t� isthe sum of the reconstructed formant bands. Theblock diagram of the AM±FM modulation anal-ysis±synthesis system is shown in Fig. 3.
Both the AM±FM vocoder and the parallelformant vocoder (Holmes, 1983; Klatt, 1980)model the speech signal as a superposition of for-mant resonance signals. The important di�erenceis that instead of making the quasi±stationarityassumption, the AM±FM vocoder describes eachformant resonance by two signals (amplitude andfrequency) that are allowed to vary instantaneouslywith time. As a result, the AM±FM vocoder breaks
free of the source-linear ®lter assumption and cane�ciently represent and model any general speechresonance signal. Further, by retaining the cou-pling between the excitation and vocal tract, theAM±FM modulation model allows us more free-dom to investigate nonlinear speech productionphenomena not modeled by the source-linear ®ltermodel. The representation of a speech band by theamplitude envelope and instantaneous frequencysignals is common ground between the AM±FMvocoder and the phase vocoder (Flanagan,1972, 1980). The main di�erence is that the AM±FM vocoder uses a time-varying ®lterbank to ex-tract the formant bands, while the phase vocoderuses a bank of ®lters ®xed in frequency. In addi-tion, most implementations of the phase vocoderuse narrow frequency bands that span one or twoharmonics, while each frequency band of the AM±FM vocoder contains a formant spectral peak thattypically comprises of six to seven harmonics. As aresult, the structure of the information signals isalso di�erent, and novel algorithms have to bedevised to e�ciently capture the patterns in theamplitude envelope and instantaneous frequencysignals of the AM±FM vocoder. In the next sec-tion, e�cient modeling and coding algorithms forthe amplitude envelope and instantaneous fre-quency signals of speech resonances are proposed.
3.1. Modeling the modulation signals
The amplitude envelope signals of di�erentformants are highly correlated for voiced speech
Fig. 3. Block diagram of the modulation vocoder.
202 A. Potamianos, P. Maragos / Speech Communication 28 (1999) 195±209
and have a speci®c structure. To exploit thisstructure a multipulse model (Atal and Remde,1982) is used for modeling the amplitude envelope.The multipulse excitation signals for amplitudeenvelopes of di�erent formant bands are expectedto be coupled for voiced speech and loosely cou-pled for unvoiced speech.
The model used for the amplitude envelope is
a�n� � u�n� � g�n� � h�n�;
u�n� �XK
k�1
bkd�nÿ nk�;�10�
where the impulse sequence u�n� is the excitationsignal, g�n� is the impulse response of a criticallydamped second-order system and h�n� is thebaseband impulse response of the ®lter used forextracting the corresponding resonance signal r�t�(for a real Gabor ®lter h�t� � exp�ÿat2�). Thefrequency response G�z� of the critically dampedsystem with impulse response g�n� is
G�z� � c0=1� c1zÿ1 � c2zÿ2;
c1 � ÿ2eÿpB=Fs ; c2 � eÿ2pB=Fs ; �11�
where B determines the rate of decay of the am-plitude envelope signal and Fs is the samplingfrequency. The main reason for using a criticallydamped second-order ®lter g�n� is the inability ofthe unconstrained linear predictor to model theperceptually important information of the enve-lope signal a�n�. The impulse response of this one-parameter critically damped system g�n� wasfound to be a good approximation to the ampli-tude envelope of real speech resonances for boththe attack and the (exponential) decay portions ofthe signal. Finally, h�n� was introduced in theamplitude envelope model of Eq. (10) to accountfor the distortion introduced in a�t� from the(Gabor) bandpass ®ltering procedure. The pulsepositions nk are computed from the analysis-by-synthesis loop, while the amplitudes bk have aclosed form solution (Atal and Remde, 1982; Po-tamianos, 1995) so that the mean square modelingerror
E �XN
n�1
e�n�2 �XN
n�1
�s�n� ÿ s�n��2 �12�
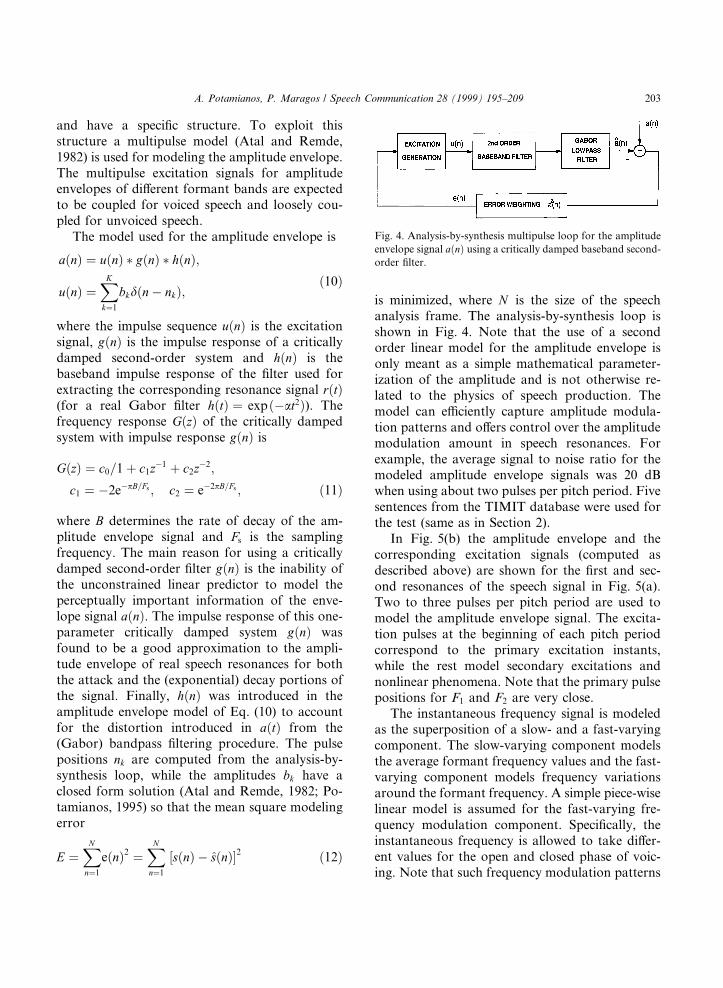
is minimized, where N is the size of the speechanalysis frame. The analysis-by-synthesis loop isshown in Fig. 4. Note that the use of a secondorder linear model for the amplitude envelope isonly meant as a simple mathematical parameter-ization of the amplitude and is not otherwise re-lated to the physics of speech production. Themodel can e�ciently capture amplitude modula-tion patterns and o�ers control over the amplitudemodulation amount in speech resonances. Forexample, the average signal to noise ratio for themodeled amplitude envelope signals was 20 dBwhen using about two pulses per pitch period. Fivesentences from the TIMIT database were used forthe test (same as in Section 2).
In Fig. 5(b) the amplitude envelope and thecorresponding excitation signals (computed asdescribed above) are shown for the ®rst and sec-ond resonances of the speech signal in Fig. 5(a).Two to three pulses per pitch period are used tomodel the amplitude envelope signal. The excita-tion pulses at the beginning of each pitch periodcorrespond to the primary excitation instants,while the rest model secondary excitations andnonlinear phenomena. Note that the primary pulsepositions for F1 and F2 are very close.
The instantaneous frequency signal is modeledas the superposition of a slow- and a fast-varyingcomponent. The slow-varying component modelsthe average formant frequency values and the fast-varying component models frequency variationsaround the formant frequency. A simple piece-wiselinear model is assumed for the fast-varying fre-quency modulation component. Speci®cally, theinstantaneous frequency is allowed to take di�er-ent values for the open and closed phase of voic-ing. Note that such frequency modulation patterns
Fig. 4. Analysis-by-synthesis multipulse loop for the amplitude
envelope signal a�n� using a critically damped baseband second-
order ®lter.
A. Potamianos, P. Maragos / Speech Communication 28 (1999) 195±209 203
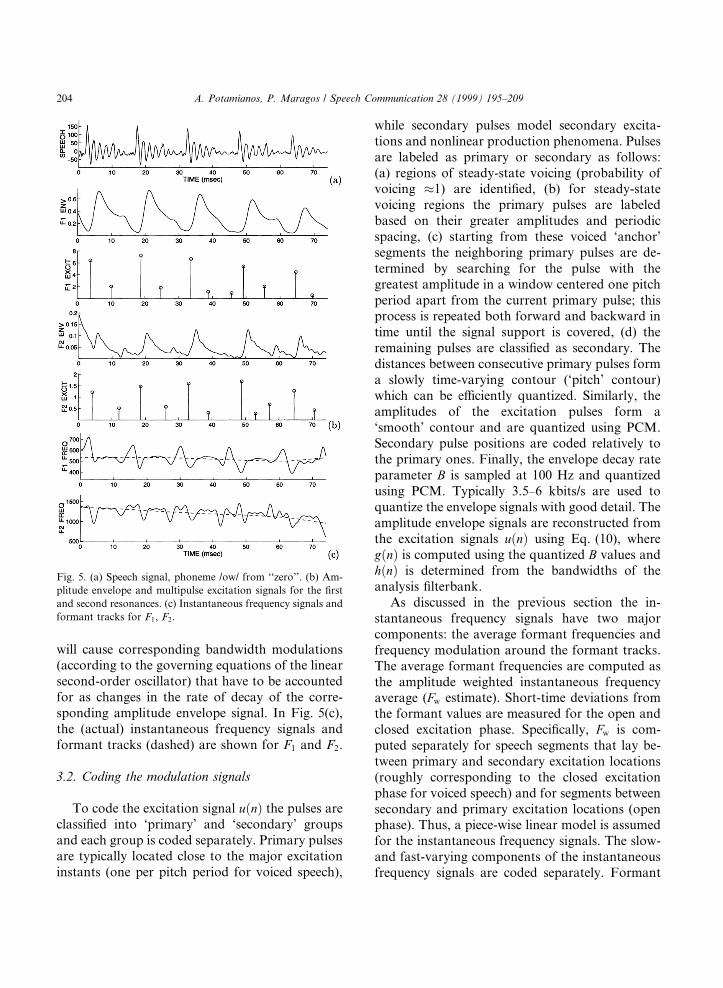
will cause corresponding bandwidth modulations(according to the governing equations of the linearsecond-order oscillator) that have to be accountedfor as changes in the rate of decay of the corre-sponding amplitude envelope signal. In Fig. 5(c),the (actual) instantaneous frequency signals andformant tracks (dashed) are shown for F1 and F2.
3.2. Coding the modulation signals
To code the excitation signal u�n� the pulses areclassi®ed into `primary' and `secondary' groupsand each group is coded separately. Primary pulsesare typically located close to the major excitationinstants (one per pitch period for voiced speech),
while secondary pulses model secondary excita-tions and nonlinear production phenomena. Pulsesare labeled as primary or secondary as follows:(a) regions of steady-state voicing (probability ofvoicing �1) are identi®ed, (b) for steady-statevoicing regions the primary pulses are labeledbased on their greater amplitudes and periodicspacing, (c) starting from these voiced `anchor'segments the neighboring primary pulses are de-termined by searching for the pulse with thegreatest amplitude in a window centered one pitchperiod apart from the current primary pulse; thisprocess is repeated both forward and backward intime until the signal support is covered, (d) theremaining pulses are classi®ed as secondary. Thedistances between consecutive primary pulses forma slowly time-varying contour (`pitch' contour)which can be e�ciently quantized. Similarly, theamplitudes of the excitation pulses form a`smooth' contour and are quantized using PCM.Secondary pulse positions are coded relatively tothe primary ones. Finally, the envelope decay rateparameter B is sampled at 100 Hz and quantizedusing PCM. Typically 3.5±6 kbits/s are used toquantize the envelope signals with good detail. Theamplitude envelope signals are reconstructed fromthe excitation signals u�n� using Eq. (10), whereg�n� is computed using the quantized B values andh�n� is determined from the bandwidths of theanalysis ®lterbank.
As discussed in the previous section the in-stantaneous frequency signals have two majorcomponents: the average formant frequencies andfrequency modulation around the formant tracks.The average formant frequencies are computed asthe amplitude weighted instantaneous frequencyaverage (Fw estimate). Short-time deviations fromthe formant values are measured for the open andclosed excitation phase. Speci®cally, Fw is com-puted separately for speech segments that lay be-tween primary and secondary excitation locations(roughly corresponding to the closed excitationphase for voiced speech) and for segments betweensecondary and primary excitation locations (openphase). Thus, a piece-wise linear model is assumedfor the instantaneous frequency signals. The slow-and fast-varying components of the instantaneousfrequency signals are coded separately. Formant
Fig. 5. (a) Speech signal, phoneme /ow/ from ``zero''. (b) Am-
plitude envelope and multipulse excitation signals for the ®rst
and second resonances. (c) Instantaneous frequency signals and
formant tracks for F1, F2.
204 A. Potamianos, P. Maragos / Speech Communication 28 (1999) 195±209
tracks are decimated to 60 Hz and quantized usingPCM. The frequency modulation components forthe open and closed phase are coded separately asdeviations from the average formant frequency(only for the ®rst formant where FM is perceptu-ally most important). Finally, the absolute phaseat primary excitation instants was judged to beperceptually important for formant bands below1000 Hz. Typically 1.3±3 kbits/s are alloted to theinstantaneous frequency signals. The instanta-neous frequency signals are reconstructed by in-terpolation of the quantized formant frequencytracks. Then the FM component is added and thephase signal is obtained as the running integral ofthe instantaneous frequency signal. Finally, aphase discontinuity is added at envelope minimato guarantee that the phase at excitation instantstakes the appropriate value. A moving average®lter is used to smooth the discontinuity. 4
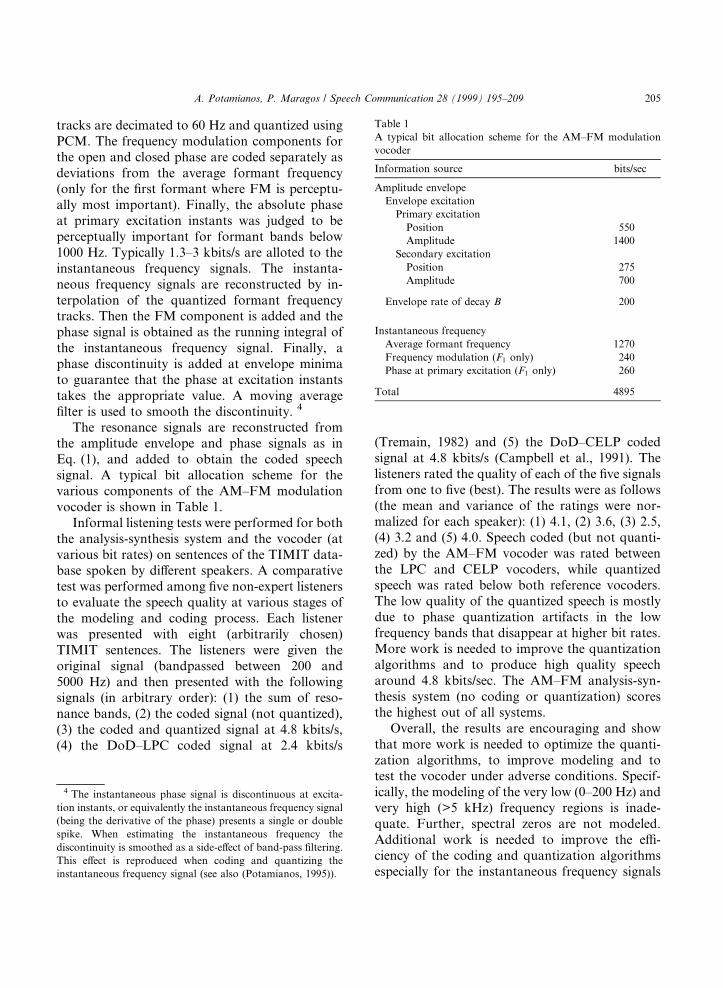
The resonance signals are reconstructed fromthe amplitude envelope and phase signals as inEq. (1), and added to obtain the coded speechsignal. A typical bit allocation scheme for thevarious components of the AM±FM modulationvocoder is shown in Table 1.
Informal listening tests were performed for boththe analysis-synthesis system and the vocoder (atvarious bit rates) on sentences of the TIMIT data-base spoken by di�erent speakers. A comparativetest was performed among ®ve non-expert listenersto evaluate the speech quality at various stages ofthe modeling and coding process. Each listenerwas presented with eight (arbitrarily chosen)TIMIT sentences. The listeners were given theoriginal signal (bandpassed between 200 and5000 Hz) and then presented with the followingsignals (in arbitrary order): (1) the sum of reso-nance bands, (2) the coded signal (not quantized),(3) the coded and quantized signal at 4.8 kbits/s,(4) the DoD±LPC coded signal at 2.4 kbits/s
(Tremain, 1982) and (5) the DoD±CELP codedsignal at 4.8 kbits/s (Campbell et al., 1991). Thelisteners rated the quality of each of the ®ve signalsfrom one to ®ve (best). The results were as follows(the mean and variance of the ratings were nor-malized for each speaker): (1) 4.1, (2) 3.6, (3) 2.5,(4) 3.2 and (5) 4.0. Speech coded (but not quanti-zed) by the AM±FM vocoder was rated betweenthe LPC and CELP vocoders, while quantizedspeech was rated below both reference vocoders.The low quality of the quantized speech is mostlydue to phase quantization artifacts in the lowfrequency bands that disappear at higher bit rates.More work is needed to improve the quantizationalgorithms and to produce high quality speecharound 4.8 kbits/sec. The AM±FM analysis-syn-thesis system (no coding or quantization) scoresthe highest out of all systems.
Overall, the results are encouraging and showthat more work is needed to optimize the quanti-zation algorithms, to improve modeling and totest the vocoder under adverse conditions. Specif-ically, the modeling of the very low (0±200 Hz) andvery high (>5 kHz) frequency regions is inade-quate. Further, spectral zeros are not modeled.Additional work is needed to improve the e�-ciency of the coding and quantization algorithmsespecially for the instantaneous frequency signals
4 The instantaneous phase signal is discontinuous at excita-
tion instants, or equivalently the instantaneous frequency signal
(being the derivative of the phase) presents a single or double
spike. When estimating the instantaneous frequency the
discontinuity is smoothed as a side-e�ect of band-pass ®ltering.
This e�ect is reproduced when coding and quantizing the
instantaneous frequency signal (see also (Potamianos, 1995)).
Table 1
A typical bit allocation scheme for the AM±FM modulation
vocoder
Information source bits/sec
Amplitude envelope
Envelope excitation
Primary excitation
Position 550
Amplitude 1400
Secondary excitation
Position 275
Amplitude 700
Envelope rate of decay B 200
Instantaneous frequency
Average formant frequency 1270
Frequency modulation (F1 only) 240
Phase at primary excitation (F1 only) 260
Total 4895
A. Potamianos, P. Maragos / Speech Communication 28 (1999) 195±209 205
in order to produce high-quality coded speech at4.8±9.6 kbits/sec. However, even with the currentsimple implementation, the AM±FM analysis-synthesis system produces natural speech andprovides the test-bed for the perceptual impor-tance of modulations in speech.
4. Discussion
In this section, the perceptual importance ofamplitude and frequency modulations is discussed.First we present preliminary results that show thatmodulation patterns are both speaker and phonedependent and could provide important perceptualcues for noise-corrupted or bandpassed speech.Further, alternative ways of modeling the ampli-tude and frequency modulation patterns are pro-posed.
From informal listening tests it was veri®ed thatthe amplitude and frequency modulation of speechresonances are perceptually important for pro-ducing natural sounding speech. From preliminaryexperiments on synthetic speech and sentencesfrom the TIMIT database using the AM±FMmodulation vocoder it was determined that am-plitude modulations convey both phonemic andspeaker-dependent information (see also next pa-ragraph). For bandpassed synthetic speech (withonly a single formant on average in the passband)it was shown that adding amplitude modulationscan alter the perceived phonemic quality ofthe sound. The existence of complementaryinformation in resonance modulations may be themain reason for the increased intelligibility ofnoise-corrupted natural speech versus (identicallycorrupted) speech produced by a formant synthe-sizer.
The speaker and phone dependency of ampli-tude modulation patterns was veri®ed by con-ducting a preliminary analysis of 120 sentences ofthe TIMIT database collected from 12 malespeakers (10 sentences per speaker) using the AM±FM modulation vocoder. Each sentence was ana-lyzed using the techniques outlined in the previoussections. For each sentence in the database, theprimary and secondary pulse locations and am-plitudes were computed for each formant reso-
nance amplitude envelope signal (F1, F2 and F3).Next the average ratio of the secondary to primaryexcitation pulse amplitude was computed as arough estimate of the amplitude modulation index.The modulation index estimate was computed for15 monophtongal vowels and diphthongs (usingthe phonemic segmentation and labels providedwith the TIMIT database). Average modulationindex estimates were computed for each phone, foreach speaker, and for each left and right phonemicgroup context. It was found that the amount ofmodulation in each band was speaker-dependentranging: 13±24% (F1), 14±40% (F2) and 9±40%(F3). Average AM index values for all 120 sen-tences analyzed were 16% (F1) and 23% (F2) and23% (F3). The range of phone-dependent AM in-dex estimates was 13±19% (F1), 17±30% (F2) and17±30% (F3). Phonemes that displayed the highestamount of modulation were /ao/, /ax/, while /aw/,/eh/ displayed the lowest. Finally, context-depen-dent AM modulation indexes were computed. Thefollowing left and right contexts were investigated:silence, vowel, plosive, nasal, glide, voiced fricativeand unvoiced fricative. The AM index was foundto be 30% higher than average for segments pre-ceded or followed by silence. Increased AMamounts were also found in the context of glidesand voiced fricatives. This is to be expected sincethe dynamics of speech production are changingrapidly during voiced-unvoiced transitions, si-lence-speech transitions, and glides. Further in-vestigation is required to understand theimportance of the modulation patterns for speechsynthesis and recognition.
The AM±FM analysis-synthesis system is avaluable tool for measuring modulations in speechresonances. Alternatively, one can investigatemodulations in speech using a frequency domainmodel. Amplitude modulations appear in the DFTspectrum as a departure from the shape of thelinear formant peak, e.g., as an asymmetric for-mant peak or a peak were certain harmonics havereduced amplitudes. A simple short-time modelthat can quantify such phenomena is the sinusoi-dal model (McAulay and Quatieri, 1986) appliedto the formant resonance signal, i.e., express thespeech resonance signal as a superposition of si-nusoids and quantify the modulation amount by
206 A. Potamianos, P. Maragos / Speech Communication 28 (1999) 195±209
the di�erence between the amplitudes of the sinu-soids for an actual and synthetic speech resonance.Similar ideas have been discussed in (Quatieri,1997). The model can be further enhanced to ac-count for time-varying modulation amounts. Fre-quency modulation is not clearly visible from theDFT of the signal. A sinusoidal model withmodulated (time-varying) amplitudes in the anal-ysis window could capture some of the frequencymodulation phenomena. By combining sinusoidaland resonance modeling additional intuition canbe gained in the physical signi®cance of modula-tions in speech.
5. Conclusions
The AM±FM modulation model and multibanddemodulation were successfully applied to speechanalysis. The multiband demodulation pitchtracking algorithm was proposed that producessmooth and accurate fundamental frequency con-tours. E�cient modeling and coding algorithmswere proposed for the amplitude envelope andinstantaneous frequency resonance signals of theAM±FM modulation vocoder. The vocoder pro-duces natural speech at 4.8±9.6 kbits/sec. Ampli-tude and frequency modulations were shown toconvey both phonemic and speaker-dependentinformation and to be perceptually important forproducing natural sounding speech.
Overall, the AM±FM analysis±synthesis systemaccounts for a variety of speech production phe-nomena not described in linear models and, as aresult, produces speech of natural quality. Thedetailed parametric modeling of the amplitudeenvelope and instantaneous frequency signals of-fers the means to study the perceptual e�ects ofamplitude and frequency modulations in speechresonances. The AM±FM analysis-synthesis sys-tem o�ers the possibility to modify speech, i.e.,altering the speakers characteristic or the speakingstyle, by changing the amount of amplitude andfrequency modulation in formants. More work isunderway to quantify how such modi®cations af-fect the speech quality. An application area of thevocoder is text-to-speech (TTS) synthesis andspeaker transformation.
Appendix A
Consider the sum of N sinusoids with constant 5
amplitudes an and frequencies fn,
r�t� �X
n
an cos �2pfnt � hn�; �A:1�
where hn are arbitrary phase constants. Assumingthat the bandwidth of r�t� is much smaller thanminn�fn�, the analytical signal z�t� estimates for theamplitude envelope jaH�t�j and instantaneous fre-quency fH�t� computed from the Hilbert transformare
jaH�t�j � jz�t�j �X
n
Xk
anak cos �D/nk�t�� !1=2
;
�A:2�
fH�t� � d
dt\z�t�
�X
n
Xk
fnanak cos �D/nk�t��=�aH�t��2; �A:3�
where D/nk�t� � 2p�fn ÿ fk�t � �hn ÿ hk�.We will show next that under the assumption
jfi�1 ÿ fij � F0, i � 1; . . . ;N ÿ 1;
Fu � 1
T
Zt�T
t
fH�t� dt � fm;
if am � a1; . . . ; amÿ1; am�1; . . . ; aN ; �A:4�
i.e., for a sum of harmonically related sinusoidsthe unweighted instantaneous frequency Fu locksonto the frequency of the sinusoid with thegreatest amplitude. By expanding the denominatorin Eq. (A3) in a Taylor series
5 Note that the results presented in Appendix A hold
approximately for sums of sinusoids with time-varying ampli-
tudes an�t� and frequencies fn�t�, provided that an�t� and fn�t�are slowly-varying compared to cos �2pfnt�. In this case, an�t�and fn�t� can be assumed constant when di�erentiating or
integrating in the presence of the fast varying cos �2pfnt� term
(two time-scale analysis).
A. Potamianos, P. Maragos / Speech Communication 28 (1999) 195±209 207

fH�t� � fm
�Xn6�m
an
am�fn � fm� cos �D/nm�
�Xn 6�m
an
am
� �2
fn �Xn 6�m
Xk 6�m;n
an ak
a2m
fk cos �D/nk�!
� 1
ÿ 2Xn6�m
an
amcos �D/nm� ÿ
Xn6�m
an
am
� �2
ÿXn 6�m
Xk 6�m;n
an ak
a2m
cos �D/nk�
� 4Xn6�m
an
am
� �2
cos2�D/nm� � h:o:t:
!:
We further assume that the averaging windowduration T is proportional to the `pitch period'of the sum of the sinusoids, i.e., T / 1=F0
(pitch-synchronous analysis). In this caseR t�Tt cos �D/nk�dt � 0 and
R t�Tt cos �D/nk� cos �D/ij�dt
� 0, for �n; k� 6� �i; j�. Carrying out the algebra
Fu � 1
T
Zt�T
t
fH�t� dt
� fm ÿXn6�m
an
am
� �2
fm � 2Xn6�m
�an
am�2 fm
ÿXn6�m
an
am
� �2
�fn � fm�
�Xn6�m
an
am
� �2
fn � h:o:t:
� fm � O��4�;am � a1; . . . ; amÿ1; am�1; . . . ; aN ;
since the O��2� terms cancel out, where� � maxk 6�m�ak=am�. Thus, for pitch-synchronousanalysis, the approximation error is O��4�. Inpractice, the duration of the averaging windowused is not a multiple of the `pitch period' and theexact values of Fu depend on the averaging windowboundaries. For pitch-asynchronous analysis, theorder of the approximation error is O���.
Similarly, for the weighted estimator Fw onemay write
Fw �R t�T
t fH�t��aH�t��2 dtR t�Tt �aH�t��2 dt
�P
n
Pk fnanak
R t�Tt cos �D/nk�t�� dtP
n
Pk anak
R t�Tt cos �D/nk�t�� dt
�P
n fna2nP
n a2n
; �A:5�
i.e., the weighted instantaneous frequency Fw
equals the amplitude weighted average of theharmonic frequencies.
References
Atal, B.S., Remde, J.R., 1982. A new model of LPC excitation
for producing natural±sounding speech at low bit rates. In:
Proc. Internat. Conf. Acoust. Speech Signal Process., Paris,
France, May 1982, pp. 614±617.
Bovik, A.C., Maragos, P., Quatieri, T.F., 1993. AM±FM
energy detection and separation in noise using multiband
energy operators. IEEE Transactions on Signal Processing
41, 3245±3265.
Campbell, J.P., Tremain, T.E., Welch, V.C., 1991. The Federal
Standard 1016 4800 bps CELP Voice Coder, Digital Signal
Processing, Academic Press, Vol. 1, No. 3, pp. 145±155.
Cohen, L., Lee, C., 1992. Instantaneous bandwidth. In:
Boashash, B. (Ed.), Time Frequency Signal Analysis ±
Methods and Applications, Longman±Chesire, London.
Flanagan, J.L., 1972. Speech Analysis Synthesis and Percep-
tion, 2nd ed. Springer, Berlin.
Flanagan, J.L., 1980. Parametric coding of speech spectra.
Journal of the Acoust. Soc. of America 68, 412±419.
George, E.B., 1991. An analysis±by±synthesis approach to
sinusoidal modeling applied to speech and music signal
processing. Ph.D. Thesis, Georgia Institute of Technology,
Atlanta, GA.
Havlicek, J.P., 1996. AM±FM image models. Ph.D. Thesis,
University of Texas at Austin, Austin, TX.
Holmes, J.N., 1983. Research report: Formant synthesizers:
Cascade or parallel? Speech Communication 2 (4),
251±273.
Jankowski, C.R., 1996. Fine structure features for speaker
identi®cation. Ph.D. Thesis, Massachusetts Institute of
Technology, Cambridge, MA.
Kaiser, J.F., 1990. On Teager's energy algorithm and its
generalization to continuous signals. In: Proceedings of the
Fourth IEEE DSP Workshop, Mohonk, New Paltz, NY,
September 1990.
Klatt, D.H., 1980. Software for a cascade/parallel formant
synthesizer. J. Aocust. Soc. Amer. 67, 971±995.
Lu, S., Doerschuk, P.C., 1996. Nonlinear modeling and
processing of speech based on sums of AM±FM formant
models. IEEE Trans. Signal Processing 44 (4), 773±782.
208 A. Potamianos, P. Maragos / Speech Communication 28 (1999) 195±209
Maragos, P., Quatieri, T.F., Kaiser, J.F., 1991. Speech nonlin-
earities, modulations and energy operators. In: Proc. Inter-
nat. Conf. Acoust. Speech Signal Process, pp. 421±424.
Maragos, P., Kaiser, J.F., Quatieri, T.F., 1993a. Energy
separation in signal modulations with application to speech
analysis. IEEE Trans. Signal Processing 41, 3024±3051.
Maragos, P., Kaiser, J.F., Quatieri, T.F., 1993b. On amplitude
and frequency demodulation using energy operators. IEEE
Trans. Signal Processing 41, 1532±1550.
McAulay, R.J., Quatieri, T.F., 1986. Speech analysis/synthesis
based on a sinusoidal representation. IEEE Trans. Acoust.
Speech and Signal Processing 34, 744±754.
McAulay, R.J., Quatieri, T.F., 1990. Pitch estimation and
voicing detection based on a sinusoidal speech model. In:
Proc. Internat. Conf. Acoust. Speech Signal Process.,
Albuquerque, New Mexico, April 1990, pp. 249±252.
McEachern, R., 1992. How the ear really works. In: Proceed-
ings IEEE International Symposium on Time-Frequency
and Time-Scale Analysis, Victoria, BC, Canada, pp. 437±
440.
Potamianos, A., 1995. Speech processing applications using an
AM±FM modulation model. Ph.D. Thesis, Harvard Uni-
versity, Cambridge, MA.
Potamianos, A., Maragos, P., 1994. A comparison of the energy
operator and the Hilbert transform approach to signal and
speech demodulation. Signal Processing 37 (2), 95±120.
Potamianos, A., Maragos, P., 1996. Speech formant frequency
and bandwidth tracking using multiband energy demodu-
lation. J. Acoust. Soc. Amer. 99, 3795±3806.
Potamianos, A., Maragos, P., 1997. Speech analysis and
synthesis using an AM±FM modulation model. In: Pro-
ceedings European Conference on Speech Communica-
tions and Technology, Rhodes, Greece, September 1997,
pp. 1355±1358.
Ramalho, M.A., 1994. The pitch mode modulation model with
applications in speech processing. Ph.D. Thesis, The State
University of New Jersey, New Brunswick, NJ, January
1994.
Rao, P., 1996. A robust method for the estimation of formant
frequency modulation in speech signals. In: Proc. ICASSP-
96, Atlanta, Georgia, 7±10 May 1996; pp. II±813±816.
Quatieri, T.F., 1997. Personal communication.
Quatieri, T.F., Hanna, T.E., O'Leary, G.C., 1997. AM±FM
separations using auditory-motivated ®lters. IEEE Trans.
Speech and Audio Processing 5, 465±480.
Santhanam, B., 1998. Multicomponent AM±FM energy de-
modulation with application to signal processing and
communications. Ph.D. Thesis, Georgia Institute of Tech-
nology, Atlanta, GA.
Secrest, B.G., Doddington, G.R., 1983. An integrated
pitch tracking algorithm for speech systems In: Proc.
Internat. Conf. on Acoust. Speech Signal Process., pp.
1352±1355.
Stylianou, Y., 1996. Decomposition of speech signals into a
deterministic and a stochastic part. In: Proc. Internat.
Conf. Spoken Lang. Process., Philadelphia, PA, pp. 1213±
1216.
Sussman, R.B., 1996. Analysis and resynthesis of musical
instrument sounds using energy separation, Master's The-
sis, Rutgers, The State University of New Jersey, Graduate
School, New Brunswick, NJ.
Teager, H.M., Teager, S.M., 1990. Evidence of nonlinear sound
production mechanisms in the vocal tract. In: Hardcastle,
W.J., Marchal, A., (Eds.), Speech Production and Speech
Modeling. Kluwer Academic Publishers, Dordrecht,
pp. 241±261.
Tremain, T., 1982. The government standard linear predictive
coding algorithm: LPC-10. Speech Technology, 40±49.
A. Potamianos, P. Maragos / Speech Communication 28 (1999) 195±209 209