speech - the university of texas at dallas
TRANSCRIPT

SPEECH COMMUNICATION
ELSEVIER Speech Communication 20 (1996) 93-110
Generating stressed speech from neutral speech using a mod CELP vocoder ’
ified
Sahar E. Bou-Ghazale, John H.L. Hansen *
Robust Speech Processing Laboratory, Department of Electrical and Computer Engineering, Box 90291, Duke Uniuersi&, Durham, NC
27708-0291, USA
Received 30 January 1996; revised 15 June 1996
Abstract
The problem of speech modeling for generating stressed speech using a source generator framework is addressed in this paper. In general, stress in this context refers to emotional or task induced speaking conditions. Throughout this particular study, the focus will be limited to speech under angry, loud and Lombard effect (i.e., speech produced in noise) speaking conditions. Source generator theory was originally developed for equalization of speech under stress for robust recognition (Hansen, 1993, 1994). It was later used for simulated stressed training token generation for improved recognition (Bou-Ghazale, 1993; Bou-Gh aza e and Hansen, 1994). The objective here is to generate stressed perturbed speech from 1 neutral speech using a source generator framework previously employed for stressed speech recognition. The approach is based on (i) developing a mathematical model that provides a means for representing the change in speech production under stressed conditions for perturbation, and (ii> employing this framework in an isolated word speech processing system to produce emotional/stressed perturbed speech from neutral speech. A stress perturbation algorithm is formulated based on a CELP (code-excited linear prediction) speech synthesis structure. The algorithm is evaluated using four different speech feature perturbation sets. The stressed speech parameter evaluations from this study revealed that pitch is capable of reflecting the emotional state of the speaker, while formant information alone is not as good a correlate of stress. However, the combination of formant location, pitch and gain information proved to be the most reliable indicator of emotional stress under a CELP speech model. Results from formal listener evaluations of the generated stressed speech show successful classification rates of 87% for angry speech, 75% for Lombard effect speech and 92% for loud speech.
Zusammenfassung
Das Problem der Sprachmodellierung zur Erzeugung von verrauschter Sprache unter Verwendung eines Source Generator Frameworks wird in diesem Paper betrachtet. Im Allgemeinen, Stress bedeutet im Kontext dieses Papers emotionale oder aufgabeninduzierte Sprachbedingungen. Das Augenmerk wird hierbei auf Sprache unter lauten, wiitenden und Lombard Effekt (d.h. Sprache, produziert in verrauschten Umgebungen) Bedingungen gelegt. Die Source Generator Theorie wurde urspriinglich zum Ausgleich von Sprache unter Stress entwickeh fur robuste Spracherkennung (Hansen, 1993, 1994). Diese Theorie wurde splter benutzt zur simulierten Tokengenerierung unter Stress fur eine verbesserte Spracherkennung (Bou-Ghazale, 1993; Bou-Ghazale and Hansen, 1994). Das Ziel hier ist, verrauschte Sprache aus einer neutralen Sprache zu
* Corresponding author. E-mail: [email protected]; http://www.ee.duke.edu/Research/Speech
’ Audiofiles available. See http://www.elsevier.nl/locate/specom
0167.6393/96/$15.00 Copyright 0 1996 Elsevier Science B.V. All rights reserved.
PII SO 167-6393(96)00047-7
94 S.E. Bou-Ghazale, J.H.L. Hansen/Speech Communication 20 (1996) 93-l 10
erzeugen unter Verwendung eines Source Generator Frameworks, das zuvor bereits zur Erkennung von verrauschter Sprache verwendet wurde. Diese Vorgehensweise ist basiert auf (i) Entwicklung eines mathematischen Modells, das die Miiglichkei- ten zur Darstellung der Anderung der Sprachproduktion in einer verrauschten Umgebung bietet, (ii> Verwendung dieses Frameworks in einem isolierten Sprachverarbeitungssystem, urn emotional veranderte Sprache und Sprache unter Stress aus einer neutralen Sprache zu erzeugen. Ein Algorithmus, der Stress hinzufligt, wird auf einer CELP (code-excited linear prediction) basierenden Sprachsynthesestruktur formuliert. Dieser Algorithmus wird dann evaluiert unter der Verwendung von 5 verschiedenen Spracheigenschaftsmengen. Die Sprachparameter, die wir bei dieser Auswertung erhalten haben, haben gezeigt dass es dadurch moglich ist, den emotionalen Status eines Sprechers zu reflektieren. Die Kombination aller Eigenschaften hat sich als ein zuverllssiger Indikator von emotionalen Stress unter einem CELP Sprachmodell erwiesen. Resultate von formalen Zuhorerauswertungen der erzeugten verrauschten Sprache haben erfolgreiche Klassifikationsraten von 87% fur eine wiitende Sprache, 75% fur den Lombard Effekt und 92% fur eine laute Sprache ergeben.
R&urn6
Cet article traite du probleme de la modelisation de la parole pour la generation de parole sous stress en utilisant le cadre “source generator framework”. D’une man&e g&r&ale, le terme stress dans ce contexte se rapporte ‘a la condition du locuteur qui peut &tre Cmotionnelle ou induite par une t&he specifique. Dans cette etude, l’accent est mis sur la parole criCe ou produite dans des conditions de co&e ou d’effet Lombard. A l’origine, la theorie de generation de source a et6 developpee pour l’egalisation de la parole sous stress afin d’effectuer une reconnaissance robuste (Hansen, 1993, 1994). Elle a et& ensuite utilisee pour la generation d’occurrences d’apprentissage avec un stress simult (Bou-Ghazale, 1993; Bou-Ghazale and Hansen, 1994). L’objectif de ce travail est de g6nCrer de la parole sous stress a partir de parole normale, en utitisant un “source generator framework” prealablement utilise pour la reconnaissance de parole sous stress. L’approche est basee sur 6) le developpement d’un modble mathematique representant l’effet du stress sur la production de la parole, et (ii) l’utilisation de cette modelisation pour produire les effets du stress et des emotions sur des mots isoles prononces en parole naturele. L’algorithme de perturbation simulant les effets du stress est base sur la structure de synthese de parole par CELP (“code-excited linear prediction”). Cet algorithme a Ctt CvaluC sur quatre ensembles de parametres exprimant la perturbation dans la parole. Les evaluations effect&es dans cette etude montrent que le pitch est capable de refleter l’etat Cmotionnel du locuteur, alors que l’information sur les formants n’est pas aussi bien cot&lee au stress. NCanmoins, dans le cadre d’une modelisation CELP de la parole, c’est la combinaison de la localisation des formants, du pitch et de l’energie qui produit l’indicateur le plus fiable du stress Cmotionnel. Les resultats des evaluations, bashes sur l’ecoute de parole sous stress gCnCrCe par le systeme, montrent des taux de classification correcte de 87% pour la parole produite avec l’effet de la colere, 75% pour la parole avec l’effet Lombard et 92% pour la parole criee.
1. Introduction
In the field of speech analysis, stress has been found to alter the normal behavior of the human speech production and the resulting speech feature characteristics. Stress changes the normal speech production process, resulting in irregular vocal fold movement, vocal tract articulator perturbation, varia- tion in airflow from the lungs, changes in subglottal air pressure, and other vocal system modifications. The area of stressed speech analysis has drawn many researchers into investigating the vocal and acousti- cal changes caused by the emotional state of the speaker. These studies can serve many areas in
speech research such as (i> integrating emotions for more natural speech synthesis, and (ii> improving stressed speech recognition.
Several studies have been aimed at determining reliable indicators of emotional stress (Streeter et al., 1983; Lieberman and Michaels, 1962; Williams and Stevens, 1972; Scherer, 1981). The vocal indicators of emotional expression most widely used in these studies include the (1) pitch mean, range and con- tour, (21 amplitude variation, (3) word and syllable durations, (4) speech rate, and (5) voice quality. In most cases, pitch is used to differentiate between emotions. Streeter et al. (1983) noted that listener perception of stress include elevated pitch and loud-

S.E. BowGhazale, J.H.L. Hansen/Speech Communication 20 (1996) 93-110 95
ness levels, as well as increased variability in these two variables. However, Streeter et al. (1983) argued against the existence of a single variable responsible for communicating emotional state. It was also noted that stress does not necessarily affect vocal parame- ters, such as pitch level, in a unidirectional way. A similar conclusion was noted by Lieberman and Michaels (1962). Though their study considers the pitch contour and its deviations from neutral to be the best indicator of emotional content within an utterance, they note that pitch is not solely responsi- ble for communication of emotion.
Synthesis of stressed speech has been the focus of a limited number of studies. The aim in these studies is to control the speech parameters of a synthesizer in order to represent different vocal moods, portray speaker identity traits, or simply improve the natural- ness of synthetic speech. Murray (19931, Murray and Amott (1995) and Cahn (1990) have used a text-to- speech DECtalk-based speech synthesizer to simu- late emotions in synthetic speech. This text-to-speech approach allows control over pitch and duration of individual phonemes, as well as some thirty parame- ters. The study by Cahn (1990) aimed at simulating the following speaking styles: angry, fearful, dis- gusted, surprised, sad and glad. Five sentences syn- thesized with six different emotions were presented to 28 listeners. Sadness was reported as being the most consistently recognized emotion.
The performance of a speech recognition system degrades if the recognizer is not trained and tested under similar speaking conditions. An approach re- ferred to as multi-style training (Lippmann et al., 1987) has been suggested for improving recognition of stressed speech. Another approach employs a source generator framework (Bou-Ghazale and Hansen, 1994) for generating simulated stressed to- kens which are used for training a robust stressed speech recognizer. In this approach, both duration and spectral content (i.e., mel-cepstral parameters) were altered to statistically resemble a stressed speech token. The token generation training method im- proved isolated word recognition by 8% for slow speaking style, 14% for loud speaking style and 24% for speech under Lombard effect when compared to neutral trained isolated word recognition. It is desir- able to employ a similar approach to perturb neutral speech parameters so that the resulting synthetic
speech is perceived as being under stress. However, a modified framework is necessary for the applica- tion of perturbation, since the speech production relayers which contribute most to reduced recogni- tion performance may not be those which are most perceptual in synthesis for a listener (e.g., pitch for example).
This study is intended to develop models for representing speech variations under stress for the purpose of producing stressed sounding speech from neutral input speech data. Speech parameter models are derived for individual source generators of iso- lated words spoken under neutral, angry, loud and Lombard effect speaking conditions. The source gen- erator set in this study represents the entire set of American English phonemes. For the purpose of modeling and conveying stress and emotional char- acteristics, we propose an integrated model of excita- tion, intensity and vocal tract spectral structure. The proposed stress modeling scheme will then be ap- plied to an existing analysis-by-synthesis speech coder which serves as a framework for speech pa- rameter extraction and resynthesis. Applying this framework to a speech coder provides for the ability to assess a vocoder’s performance in conveying stress or emotional content of a speech utterance. Vocoder evaluation will include a formal listener assessment of coded speech under neutral and stressed condi- tions. The stressed speech models resulting from this study could also be generalized and applied to other applications involving stressed speech.
The remainder of this paper is organized as fol- lows. In Section 2, the source generator model framework is discussed. This approach was origi- nally established to address speech production varia- tion under stress for recognition (Bou-Ghazale, 1993; Bou-Ghazale and Hansen, 1994; Hansen, 1993, 1994). Here, we illustrate how it can be employed for perturbation of speech under stress. In Section 3, the framework is applied to the CELP coder, and the speech parameters employed for perturbation are in- troduced. This section presents a detailed discussion of how the modeling and mapping of speech parame- ters is accomplished. Next, in Section 4 we present statistics derived from parameter perturbation evalua- tions of speech spoken in neutral and stressed condi- tions. This section also contains results from formal listener evaluations of the perturbed stressed speech.

96 S.E. Bou-Ghazale, J.H.L. Hansen/Speech Communication 20 (1996) 93-110
. NEUTRAL
0 STREssEo
Fig. 1. Neutral and stressed source generator paths in the speech production space.
Finally, in Section 5, we summarize elusions from our study, and suggest study.
2. Source generator framework
and draw con- future areas of
The proposed framework presumes that speech production can be described as a sequence of speech articulator movements and associated excitation events to achieve desired vocal system target config- urations. If only vocal tract structure is considered, the collection of speech articulator movements can be represented by a sequence of source generators y,, . . , yj, each of which can describe in general an isolated phoneme, a diphone-pair or some temporal partition (Fig. 1). While many temporal partitioning levels are possible (voiced/transitional/unvoiced, phonemic class, etc.), some may be better than oth- ers for a given collection of stress conditions. In this study, the collection of source generators will repre- sent the set of isolated phonemes in American En- glish.
The production of a neutral word is described, in the speech production space, as the movement from one source generator to another. This movement represents a well defined path with some degree of natural variations. Under stress conditions, the result- ing path is different from that of neutral due to the physical variations that occur when a speaker wishes
to communicate stress or emotional state (see Fig. 1). It is assumed that speech under a given stress/emo- tional condition can be represented by a transforma- tion of the neutral speech parameters. In order to better illustrate the proposed perturbation approach, let us assume that it is desired to impart stress (angry) characteristics on a specific feature such as the first formant of /E/ of a neutral token of the word help. Let us assume that the variations of the first formant location for the phoneme /E/ are given by the Gaussian distribution fs(~F,)N, with mean mN and variance o,.,?, and that the variations under angry conditions are given by fs(sF, )A with mean mA and variance aA’. Here, mN, mA and a,$, o-A’ represent the neutral and angry mean and vari- ance of the first formant location of /E/. 2 Assum- ing that a mapping operator G( . ) exists between the neutral and angry formant locations, and is linear, then the two features are related by
(+,)A=4sF,).+b, (1)
’ Here, we assume unknown parameters are Gaussianly dis- tributed for the purposes of illustrating feature perturbation. For
actual perturbation, physical constraints such as only positive formant locations must be enforced on parameter distributions.
This can be achieved by employing conditional pdfs in place of full Gaussian distributions.
S.E. Bou-Ghazale, J.H.L. Hansen /Speech Communication 20 (1996) 93-110 97
where the values of a and b can be easily derived from the following set of linear equations:
mA =am,+b, (2)
2 ak = a2ci. (3)
The least squares estimate of mA and oA2 are found by obtaining values for a and b as follows:
UA a=-
UN (4)
(5)
Now, let (pN represent the first formant location of an input neutral phoneme /E/. Then the per- turbed first formant location, qA, can be obtained from (pA = acp, + b, where a and b are given by Eqs. (4) and (5). Substituting for a and b in the original equation yields
(pA=jpNfmA- a;, mN. UN i 1 UN
With this transformation equation, one feature of the neutral word help, such as the first formant location, can be transformed by mapping the first formant location of each neutral speech frame. While a linear transformation fixed over time has been selected, other transformations may prove to be more effective for a given stress condition.
3. Application to CELP synthesis
It is suggested that a perturbation approach em- ploying a source generator framework can be devel- oped within an existing analysis-by-synthesis vocoder. The U.S. standard code excited linear pre- dictive (CELP) 4800 bps voice coder as developed in (Atal and Schroeder, 1984; Campbell et al., 1989) will be used for this purpose. The CELP vocoder offers the user a control over a limited number of speech parameters which are related to spectral enve- lope, formant location/bandwidth, pitch period and excitation. Employing CELP will also allow for the evaluation of the vocoder’s ability to properly model and transmit the stressed content present in an input
speech utterance. It is recognized however, that by employing CELP, the potential features and perturba- tion method may be limited to those available within the CELP framework.
The CELP algorithm is a frame-oriented tech- nique which can be represented as a combination of an analysis component and a synthesis component. The CELP analysis and synthesis structure is as follows. The analysis component consists of three basic functions: (i) short delay “spectrum” predic- tion for representing the vocal-tract formant struc- ture, (ii) long delay “pitch” search for calculating pitch periodicity of voiced speech, and (iii> residual “codebook” search for codebook excitation. The synthesis component consists of the same three func- tions (performed in reverse order) with the addition of a postfilter for output enhancement. Spectrum analysis is performed once per frame by open-loop, lOth-order autocorrelation LPC analysis using no preemphasis and 15 Hz bandwidth expansion with a 30 ms Hamming window. The LPC spectral parame- ters are used to model the vocal tract. The spectrum is coded using 34-bit independent nonuniform scalar quantization of the line spectral pair (LSP) parame- ters.
The CELP algorithm processes input speech on a frame-by-frame basis, with parameters extracted and quantized prior to transmission across the channel. However, for the present perturbation application, the quantized stage is removed to eliminate any errors due to parameter quantization. The transmitted parameters are (i> 10 LSP parameters used to model the spectral envelope of the speech signal, (ii) the adaptive codebook index and gain for long delay pitch search, and (iii> the stochastic codebook index and gain of the residual codebook. At the synthesis stage, the received parameters are decoded and used for generating the synthesized speech. The transmit- ted parameters are briefly discussed next.
The Line spectral pairs are related to the poles of the LPC filter, while the poles are related to the formant locations of the speech signal. The LSP frequencies can be used to derive the LSP position and difference parameters which reflect formant lo- cation and formant bandwidth information. The posi- tion parameters, which are the odd-numbered LSPs, are related to the peaks in the frequency response of the LPC filter. The position and difference parame-
98 S.E. BowGhazale, J.H.L. Hansen/Speech Communication 20 (19%) 93-110
ters, pi and di (for a lOth-order all-pole speech model) are related to the LSP frequencies, wi, by
p, = wz;_ ,, i = 1,. . . ,5, (7)
Id,1 = min Iw*i+j - Wz;l, i= 1,...,5. (8)
j= - 1,l
The difference parameters have been shown to be correlated with the formant bandwidth of the speech signal (Crosmer and Bamwell, 1985). Here, the wi’s represent the LSP frequencies which are naturally ordered as (w, < w2 < w3 < . . . < w,~). The sign of the difference parameter d, is positive if wZi is closer to the lower position coefficient, and negative otherwise if closer to the upper position coefficient.
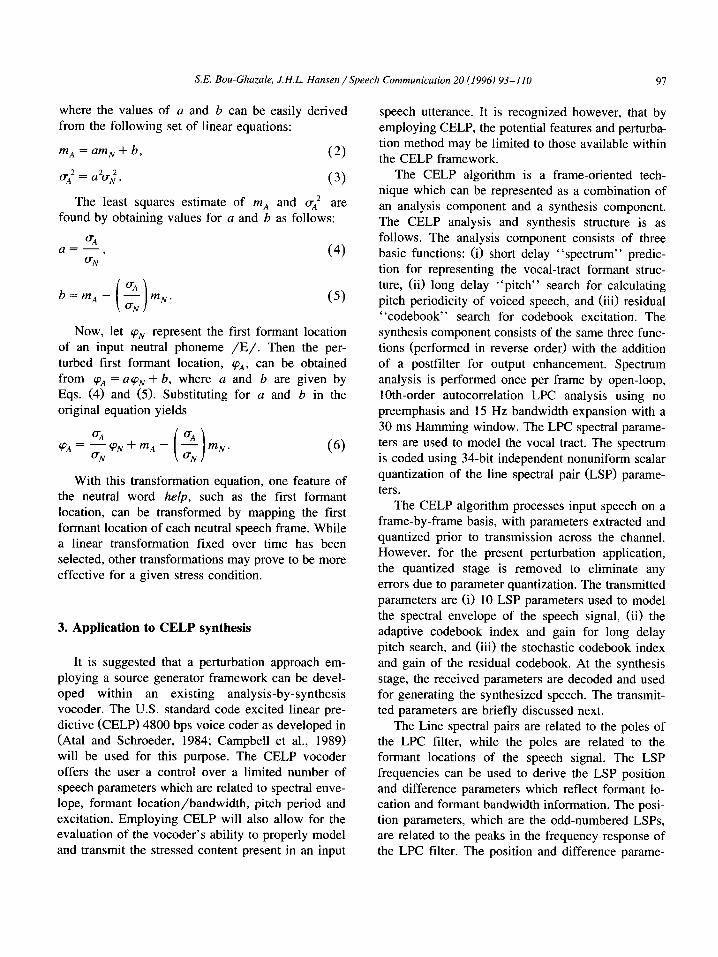
Pitch delay will be used to model changes related to pitch period of speech under neutral and stressed conditions. Pitch delay in CELP does not represent the actual pitch period of speech, rather, it represents either the pitch period or a multiple of the pitch period, as noted in the study by Kroon and Atal (1988). If a mismatch occurs between pitch period and pitch predictor delay, the exhaustive search pro- cedure may find the best delay value to be equal to a multiple of the pitch period. Therefore, the pitch predictor delay values for a periodic signal are gen- erally smooth except for a few spikes that represent a multiple of the pitch period, as can be seen in Fig. 2 (between frame number 41 and 104) 3.
The stochastic codebook contains sparse ternary valued samples (- l,O, + 1) of a zero-mean, unit variance, Gaussian sequence center clipped at 1.2 and ternary level quantized. This codebook allows for fast search procedures.
In our application, two assumptions are made: (1) the text of the input word is known to an input parsing algorithm, and (2) the system has access to the CELP synthesizer. The first assumption ensures that all utterances of a word are parsed into the same sequence of phonemes. The second assumption is required in order to have access to the transmitted parameters prior to synthesis.
The speech data that was employed for both the analysis and evaluations come from a previously
’ An audio demonstration of the word “south” under the
Angry stressed condition for this figure is available at http://www.elsevier.nl/locate/specom.
PITCH DELAY FOR’SOUTHl.GiA 1501 I
0 20 160 S"BF~OAMEN~~BER:~~~ME~,~OE=18~2~KIPd~~~=45
180
Fig. 2. Angry pitch delay for the word south before and after
pitch smoothing. The thick line represents the polynomial fitting
for the pitch delay of the voiced sound /W/ in south.
established database (Hansen, 1988) called SUSAS
(Speech U d S’ 1 d n er lmu ate and Actual Stress) which is further discussed in Section 4. The speaking styles studied here include Angry, Loud, Lombard effect and Neutral. Lombard effect is the reflex that takes place when a speaker modifies their vocal effort while speaking in the presence of noise (Lombard, 1911).
3.1. Analysis of CELP features for stressed speech
In order to develop a modified CELP vocoder for generating stressed perturbed speech from neutral speech, it is necessary to study the structure of CELP, and to identify the best parameters to use for modeling and perturbation purposes. The CELP fea- tures considered for imparting stress on neutral speech include (1) stochastic excitation index, (2) stochastic excitation gain, (3) line-spectral pair (LSP) parameters, (4) pitch delay, (5) pitch gain, and (6) effects of analysis window size on high frequency representation. An initial study investigating the stochastic excitation structure revealed that modify- ing the codebook index, i.e. selecting a different residual vector for glottal excitation, does not lead to a perceptually noticeable distortion in the speech

SE. Bou-Ghazale, J.H.L. Hansen /Speech Communication 20 (1996) 93-110 99
signal. This is attributed to the fact that CELP excita- tion modeling may not coincide with actual source excitation in the speech production system. Also, an analysis window of size 180 samples (22.5 msec) was found to better represent the time evolution of the high frequency structure in the signal than the normally larger analysis window of 240 samples (30 msec). In the remainder of this section, the investiga- tion will focus on the effects of stress on LSP parameters (specifically odd LSP parameters related to formant locations), adaptive pitch delay (related to pitch period) and pitch gain.
3.2. CELP perturbation models
In order to develop an effective stress perturbation scheme, a priori knowledge of how speech features vary under stress must be obtained. CELP perturba- tion models were developed for LSP position and difference parameters, pitch delay and pitch gain. This section presents the techniques used for model- ing the pitch delay and the LSP parameters of neutral and stressed speech. The resulting statistics/models from actual speech data are also presented. LSP models are generated for all source generator classes. Pitch delay models are generated for only voiced source generators since the pitch delay for unvoiced speech, which represents noise-like excitation, varies randomly in order to minimize the overall mean- square-error in CELP.
The LSPs are used to derive the position and difference parameters which have been shown to be related to formant location and bandwidth. Experi- mental studies noted that changes in the LSPs corre- sponding to the first and second formant locations are more perceptible and noticeable than changes at higher frequencies. Also, deviations in the LSP dif- ference parameters corresponding to formant band- widths were generally not perceptual to the human ear. Therefore, based on these informal evaluations, the position parameters will be used to model the variations related to formant locations, while the difference parameter information will be carried along only to preserve the natural ordering of the LSPs. Models of odd-numbered LSPs are generated for all source generator classes. The odd LSPs, or position parameters, of a source generator, yi, are assumed to be Gaussianly distributed and are charac-
terized by their sample mean and variance. Under stressed speaking conditions, the odd LSPs are as- sumed to vary linearly according to the following linear mapping:
L( P)r,(S) = 4 P)v,L( P)y,(N) + b(a)% p= 1,...,5,
where L(p),,,,,, p = 1,. . . ,5, represents the five position parameter distributions, or equivalently the odd LSP distributions, of source generator y, under neutral conditions, while L( P),,(~,, p = 1,. . ,5, rep- resents the five LSP distributions of y, under stress conditions. The linear mapping coefficients a(p),, and b(p),,,, will be unique for each source generator class and LSP coefficient under each speaking style. This linear mapping is one potential transformation in which to impart stress characteristics on neutral speech. While a linear transformation is employed here, alternate transformations could potentially be more effective for a given stress condition or source generator class.
The formulation of a pitch delay model will be illustrated through an example. In order to generate a
PITCH DELAY MODELING INPUT SPEECH
c d/ . . . 6
0 LABEL SOURCE GENERATOR BOUNDARIES . EXTRACT VOICED SOURCE GENERATOR ?’
. 3rd ORDER POLY. FIT OF PITCH DELAY PROFILE
p-1 : (C-l(o), C-l(i). C-1(2), c-1(3); d-l]
P-K: I c-K(O), c-K(l), c-K(2), c-K(3); d-K]
CALCULATE AVERAGE DURATION d,,, IN SAMPLES
4
EXTRACT davg SAMPLES FROM EACH PITCH DELAY MODEL P-1 EVALUATED BETWEEN [O, d-i]
I +
. FIND AVERAGE WAVEFORM OF SAMPLED POLY.
. BEST FIT FOR DATA (3rd ORDER POLY.)
,------__--____ A_______________ : . I PDM:ICo,C,,Cp,C 3;d,vgl : ,________________,__--_______’
Fig. 3. Flow graph for generating a pitch delay model.

100 S.E. Bou-Ghazale, J.H.L. Hansen/Speech Communication 20 (1996) 93-110
pitch delay model for a voiced phoneme such as /W/ of the word south spoken under neutral condi- tions, the following steps are required. All tokens i=l , . . . , K of the word south spoken by nine speakers under the desired speaking condition are used in developing the model. The speech data asso- ciated with voiced source generators yvoiced = /W/ are extracted, and pitch predictor delays are com-
puted for each observation frame. The resulting pitch delay response from a token forms a well defined contour that is next modeled by a least square poly- nomial fitting. It should be noted that the duration
spent in Yvoiced varies across the training tokens. Therefore, the pitch delay for each token containing the /W/ is characterized by its pitch delay contour and its duration, di, computed in number of sub-
, ST POSITION PARAMETER (NEUTRAL -> ANGRY)
0.03 FRONT VOWELS
(4
2ND POSITION PARAMETER (NEUTRAL --) ANGRY)
FRONT VOWELS
(b)
3RD POSITION PARAMETER (NEUTRAL --) ANGRY)
0.005 0.2 0.2, 0.22 0.23 0.24 0.25
MEAN VALVE
Cc)
Fig. 4. Mean versus standard deviation of the first, second and third position parameters of front vowels as they vary from neutral to angry speaking conditions.

SE. Bou-Ghazale, J.H.L. Hansen/Speech Communication 20 (1996) 93-110 101
frames. Each pitch delay profile is passed through a smoothing filter to eliminate impulsive pitch delay discontinuities present in the contour, and then char- acterized by a third order least squares polynomial. An example illustrating the resulting smoothed and polynomial fitted pitch delay profile of one token of
the word south is shown in Fig. 2. The thick line represents the resulting least-squares polynomial that best approximates the voiced frames after pitch delay smoothing. The steps for pitch delay modeling are shown in the flow graph of Fig. 3. The pitch delay polynomial coefficients, c,(i), c,(i), c,(i), c,(i), and
1 ST POSITION PARAMETER (NEUTRAL -a LOMBARD)
FRONT VOWELS
2ND POSITION PARAMETER (NEUTRAL -=- LOMBARD) IPI,
0.03 FRONT VOWELS
(b)
3RD POSITION PARAMETER (NEUTRAL -=a LOMBARD)
0.03
t
/e/ a----- FRONT VOWELS
Fig. 5. Mean versus standard deviation of the first, second and third position parameters of front vowels as they vary from neutral to
Lombard speaking conditions.
102 S.E. Bou-Ghazale, J.H.L. Hansen/Speech Communication 20 (1996) 93-110
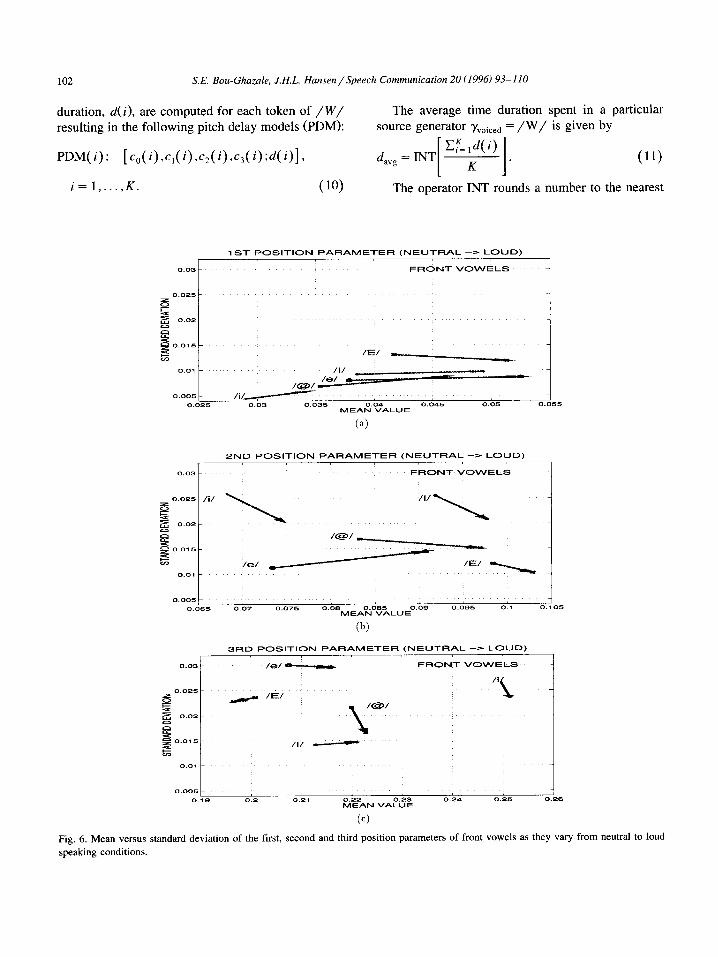
duration, d(i), are computed for each token of /W/ resulting in the following pitch delay models (PDM):
PDM(i): [c,,(i),c,(i),~~(i)&);d(i)l,
The average time duration spent in a particular source generator yvoiced = /W/ is given by
d = INT E;“,,d(i)
avg I 1 K (11)
i= l,...,K. (10) The operator INT rounds a number to the nearest
1 ST POSlTlON PARAMETER (NEUTRAL -9 LOUD)
0.03 FRONT VOWELS
i
(4
2ND POSlTlON PARAMETER (NEUTRAL --) LOUD)
0.03 FRONT VOWELS
i
(b)
3RD POSlTlON PARAMETER (NEUTRAL -z LOUD)
0.005 - 0.3s 0.2 0.21 0.22 0.23 0.24 0.25 0.26
MEAN VALUE
(cl
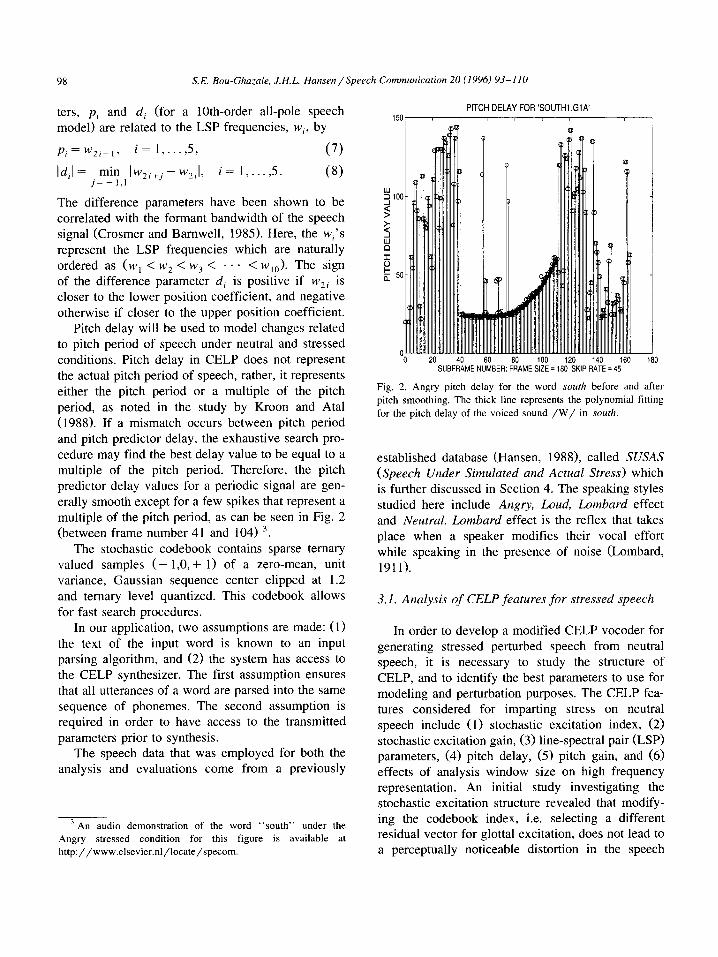
Fig. 6. Mean versus standard deviation of the first, second and third position parameters of front vowels as they vary from neutral to loud
speaking conditions.

S.E. BowGhazale, J.H.L. Hansen /Speech Communication 20 (1996) 93-l IO 103
integer (in number of subframes) towards zero. To preserve the pitch delay profile, it is necessary to equally sample the pitch delay polynomials, PDM(l), PDM(2) ,. . .,PDM(K), at the rate d(i)/&,. This procedure preserves the shape of the pitch delay model across time, independent of duration variation (which could be subsequently applied). The sampled pitch delay models of length da_ are denoted by - - PDM(l), PDM(2), . . . ,PDM(K), and the average pitch delay model is computed according to
PDM,,,[l:d,,,] =CfC=,PDM(i)[l:d,,,]
d a”g t (12)
where da_ is the average duration of /W/ and PDM,,,[ 1 :davg 1 is a sampled version of the pitch delay model of length davg. The sequence PDM,,, is then modeled by a third-order polynomial. The re- sulting pitch delay model is characterized by the polynomial coefficients, cO, c, , c2, cj, and the aver- age duration davg.
The modeling equations for the pitch delay and line-spectral-pairs, as given by Eqs. (9)-(12), were applied to isolated words spoken under neutral, an- gry, loud and Lombard effect speaking conditions. Figs. 4-6 show plots of mean versus standard devia- tion of the first, second and third position parameters (corresponding approximately to first, second and third formant location) of front vowels under angry, loud and Lombard effect speaking conditions. These figures help illustrate the significance of formant
Neutral Pitch Delay
’ Angry Pitch Delay Models
8 %s
5
‘o 35 40 0
5 10 15 20 25 30
SuBFRAMES
Fig. 7. Pitch delay models of neutral (top half curves) and angry The flow diagram for speech parameter perturba- (lower curves) voiced phonemes. tion is shown in Fig. 10. This block diagram consists
‘o ‘5 ,O 15 20 25 30 35 40
SUBFRAMES
Fig. 8. Pitch delay models of neutral (top half curves) and loud
(lower curves) voiced phonemes.
location shifts under the different stress conditions. Evaluating these plots closely, we note that the mean of the first position parameter of the phoneme /E/ under neutral conditions (Fig. 4(a)) is 0.042. The mean increased to 0.053 for angry conditions with a very small change in standard deviation, thereby implying that the first position parameter of the majority of the /E/ tokens increased for angry conditions. Similar observations can be concluded for other source generator LSP responses.
Pitch delay models for voiced phonemes under angry, loud and Lombard effect conditions are given in Figs. 7-9, respectively. The pitch delay curves in the lower half of the plot represent the neutral pitch delay models. The upper curves represent the stressed pitch delay models. These plots illustrate the clear shift between neutral and stressed pitch delay. For example, the angry pitch delay models in Fig. 7 are initially lower than the neutral pitch delay models. The angry pitch delay models start decreasing and then ascend with a steep slope (compared to that of the neutral pitch delay model) until they surpass the neutral pitch delay models. These pitch delay models were used to map the neutral pitch delay profiles to stress perturbed profiles.
3.3. Algorithm formulation
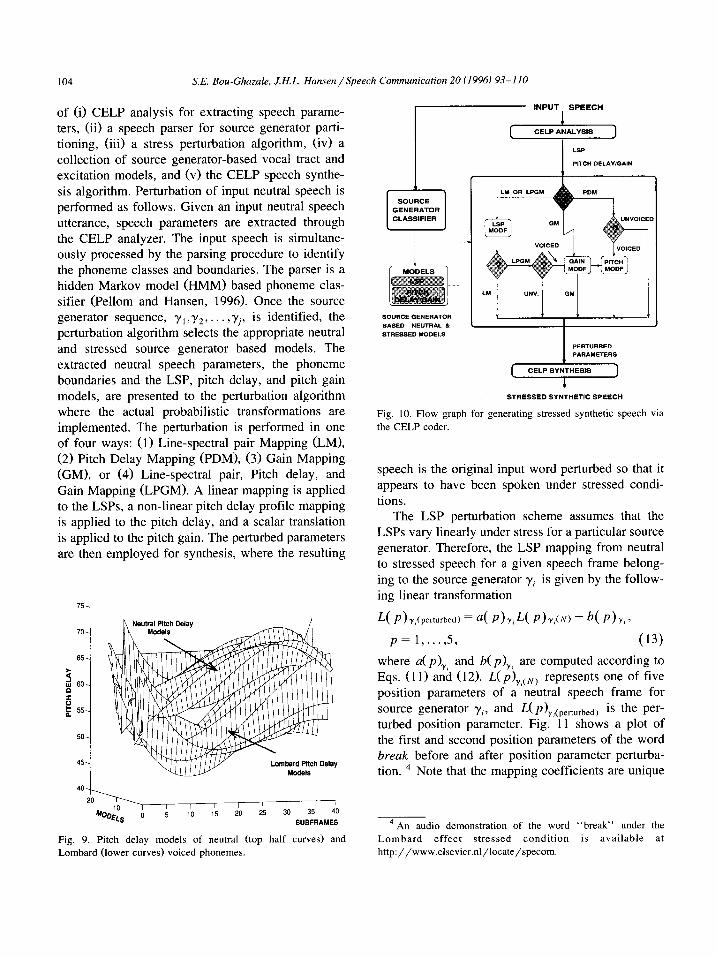
104 SE. BowGhazale, J.H.L. Hansen/Speech Communication 20 (1996) 93-110
of (i) CELP analysis for extracting speech parame- ters, (ii) a speech parser for source generator parti- tioning, (iii) a stress perturbation algorithm, (iv) a collection of source generator-based vocal tract and excitation models, and (v) the CELP speech synthe- sis algorithm. Perturbation of input neutral speech is performed as follows. Given an input neutral speech utterance, speech parameters are extracted through the CELP analyzer. The input speech is simultane- ously processed by the parsing procedure to identify the phoneme classes and boundaries. The parser is a hidden Markov model (HMM) based phoneme clas- sifier (Pellom and Hansen, 1996). Once the source generator sequence, y,,y2,. . . ,y,, is identified, the perturbation algorithm selects the appropriate neutral and stressed source generator based models. The extracted neutral speech parameters, the phoneme boundaries and the LSP, pitch delay, and pitch gain models, are presented to the perturbation algorithm where the actual probabilistic transformations are implemented. The perturbation is performed in one of four ways: (1) Line-spectral pair Mapping (LM), (2) Pitch Delay Mapping (PDM), (3) Gain Mapping (GM), or (4) Line-spectral pair, Pitch delay, and Gain Mapping (LPGM). A linear mapping is applied to the LSPs, a non-linear pitch delay profile mapping is applied to the pitch delay, and a scalar translation is applied to the pitch gain. The perturbed parameters are then employed for synthesis, where the resulting
75 1
70.
50-
mtwd Pilch Delay
I 1 ’ 5 IO 15 20 25 30 6U;;RAM;;
Fig. 9. Pitch delay models of neutral (top half curves) and
Lombard (lower curves) voiced phonemes.
STREs.!3ED SYNTHETIC SPEECH
Fig. 10. Flow graph for generating stressed synthetic speech via
the CELP coder.
speech is the original input word perturbed so that it appears to have been spoken under stressed condi- tions.
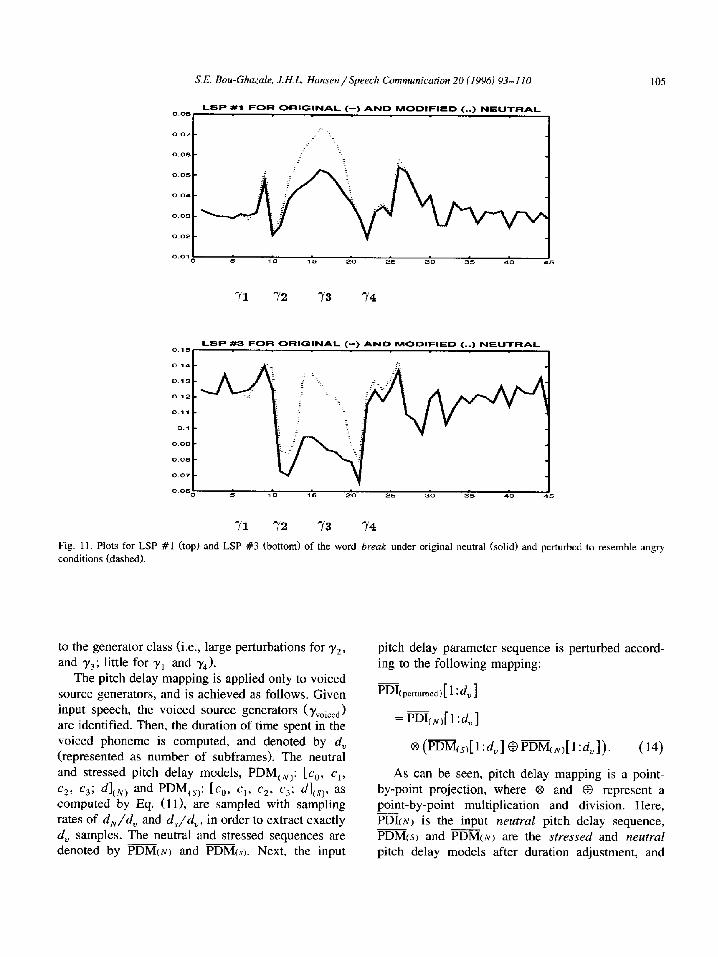
The LSP perturbation scheme assumes that the LSPs vary linearly under stress for a particular source generator. Therefore, the LSP mapping from neutral to stressed speech for a given speech frame belong- ing to the source generator yi is given by the follow- ing linear transformation
L( P)y,(perturbed) = a( P)v,~( P)y,(N) + b( P)Y,’
p= l,...,S, (13)
where a(p),, and b( p$ are computed according to Eqs. (11) and (12). Lo, represents one of five position parameters of a neutral speech frame for source generator yi, and ~~~~~~~~~~~~~~~~~ is the per- turbed position parameter. Fig. 11 shows a plot of the first and second position parameters of the word break before and after position parameter perturba- tion. 4 Note that the mapping coefficients are unique
4 An audio demonstration of the word “break” under the
Lombard effect stressed condition is available at
http://www.elsevier.nl/locate/specom.
S.E. Bou-Ghazale, J.H.L. Hansen /Speech Communication 20 (1996) 93-110 105
l_SP #1 FOR ORIGINAL <-_) AND MODIFIED (__) NEUfRAL
0.07 -
LsP #3 FOR ORIGINAL c-1 AND MODIFIED <__j NEUTRAL
0.14 -
Yl Y2 73 74
Fig. 11. Plots for LSP #l (top) and LSP #3 (bottom) of the word break under original neutral (solid) and perturbed to resemble angry conditions (dashed).
to the generator class (i.e., large perturbations for y2, and yj; little for y1 and y4).
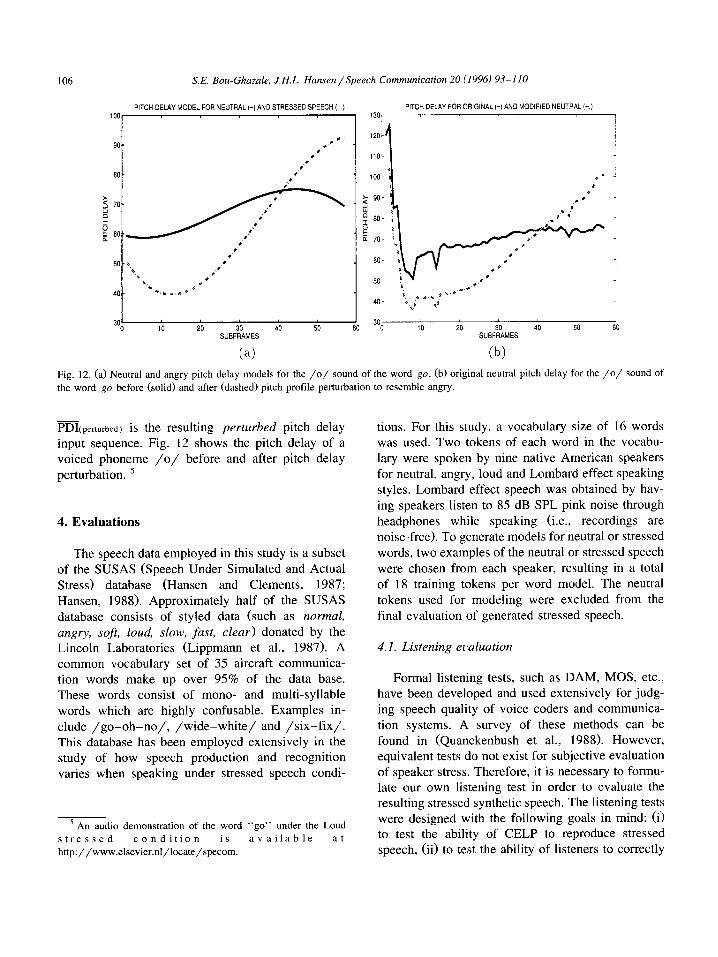
The pitch delay mapping is applied only to voiced source generators, and is achieved as follows. Given input speech, the voiced source generators (Yvoiced) are identified. Then, the duration of time spent in the voiced phoneme is computed, and denoted by d, (represented as number of subframes). The neutral and stressed pitch delay models, PDM,,,: [co, cl,
c2, c3; dl,,, and PDM,,,: [c,, cl, czr c3; dl,,,, as computed by Eq. (111, are sampled with sampling rates of d,/d, and d,/d,, in order to extract exactly d, samples. The neutral and stressed sequences are denoted by PDM~N) and PDM(.+ Next, the input
pitch delay parameter sequence is perturbed accord- ing to the following mapping:
- perturbedj[ 1 :d,] I’D4
= PDI& 1 :d,,]
“(PDM&l:d,] O~~.,[l:d,]). (14)
As can be seen, pitch delay mapping is a point- by-point projection, where @ and 0 represent a point-by-point multiplication and division. Here, PDI(w is the input neutral pitch delay sequence, PDM(s) and PDM(N) are the stressed and neutral pitch delay models after duration adjustment, and
106 SE. Bou-Ghazale, J.H.L. Hansen/Speech Communication 20 (1996) 93-110
PITCH DELAY MODEL FOR NEUTRAL (-1 AND STRESSED SPEECH (-.) PITCH DELAY FOR ORIGINAL (-) AND MODIFIED NEUTRAL (-.) 100 1301
I i
, i
+
1:::: ;!;* .“/* ;
50-r ‘*
‘. /*
*,. . .
*O 40 . a. _,I -
3o0
1 s ;I i*\\ 1
10 20 S”SFiOAMES
40 50 60 0 10 20 S&AMES
40 50 60
(a) (b)
Fig. 12. (a) Neutral and angry pitch delay models for the /o/ sound of the word go, (b) original neutral pitch delay for the /o/ sound of
the word go before (solid) and after (dashed) pitch profile perturbation to resemble angry.
PDI(perturbed) is the resulting perturbed pitch delay input sequence. Fig. 12 shows the pitch delay of a voiced phoneme /o/ before and after pitch delay perturbation. 5
4. Evaluations
The speech data employed in this study is a subset of the SUSAS (Speech Under Simulated and Actual Stress) database (Hansen and Clements, 1987; Hansen, 1988). Approximately half of the SUSAS database consists of styled data (such as normal, angry, so@, loud, slow, fast, clear) donated by the Lincoln Laboratories (Lippmann et al., 1987). A common vocabulary set of 35 aircraft communica- tion words make up over 95% of the data base. These words consist of mono- and multi-syllable words which are highly confusable. Examples in- clude /go-oh-no/, /wide-white/ and /six-fix/. This database has been employed extensively in the study of how speech production and recognition varies when speaking under stressed speech condi-
’ An audio demonstration of the word “go” under the Loud
stressed condition is available at
http://www.elsevier.nl/locate/specom.
tions. For this study, a vocabulary size of 16 words was used. Two tokens of each word in the vocabu- lary were spoken by nine native American speakers for neutral, angry, loud and Lombard effect speaking styles. Lombard effect speech was obtained by hav- ing speakers listen to 8.5 dB SPL pink noise through headphones while speaking (i.e., recordings are noise-free). To generate models for neutral or stressed words, two examples of the neutral or stressed speech were chosen from each speaker, resulting in a total of 18 training tokens per word model. The neutral tokens used for modeling were excluded from the final evaluation of generated stressed speech.
4.1. Listening eualuation
Formal listening tests, such as DAM, MOS, etc., have been developed and used extensively for judg- ing speech quality of voice coders and communica- tion systems. A survey of these methods can be found in (Quanckenbush et al., 1988). However, equivalent tests do not exist for subjective evaluation of speaker stress. Therefore, it is necessary to formu- late our own listening test in order to evaluate the resulting stressed synthetic speech. The listening tests were designed with the following goals in mind: (i) to test the ability of CELP to reproduce stressed speech, (ii) to test the ability of listeners to correctly

S.E. Bou-Ghazale, J.H.L. Hansen/Speech Communicakm 20 (1996193-110 107
Table 1 Table 3 Listeners heard a series of word pairs and were asked to select one
of the below 4 choices for angry speech assessment
Choices presented to listeners for angry speech assessment
Loss in CELP’s ability to reproduce stressed speech
Input speech Loss in performance
* First word is more angry
- Second word is more angry
* Both words are equally angry
* Neither word is angry
Angry Lombard Loud
classify a speaking style as being neutral, or stressed, and (iii) to evaluate the ability of our perturbation algorithms to generate stressed synthetic speech within a CELP vocoder framework.
tain speaking styles were better reproduced by CELP than others. CELP coded angry speech, for example, was judged 8% of the time as sounding less angry than the original angry speech. While CELP coded loud speech was judged only 3% of the time as sounding less loud than its original token. Finally,
The listener test was implemented using an inter- active user interface on a Sun workstation. Evalua- tors used high quality headphones, and were seated in front of the workstation in a quiet office. In all, 12 listeners with no history of hearing loss performed the evaluation. For angry speech assessment, for example, the listener heard a series of word pairs and was asked to select one of the four choices listed in Table 1. The listening test consisted of a sequence of pairwise comparisons. The word pairs consisted of one of the combinations listed in Table 2, and they were presented to listeners in a random order. The perturbed stressed speech was obtained using one of four algorithms (LM, GM, PDM, LPGM) previously described in Section 3.3. The same test was repeated for angry, loud and Lombard effect speaking condi- tions.
Formal subjective listening results of CELP coded stressed speech demonstrated a slight loss in CELP’s ability to reproduce stressed speech (Table 3). Cer-
Table 2
Example of word pairs presented to listeners for angry speech
assessment. The order of the word pair is random
Word pairs presented to listeners for angry speech assessment
Original neutral Original neutral
Original angry Original angry
Original neutral Original angry
Original neutral Neutral-perturbed *
Original angry Neutral-perturbed *
Original neutral CELP-coded neutral
Original neutral CELP-coded angry Original angry CELP-coded angry
* Neutral-perturbed to resemble angry.
Fig. 13. Detailed bar graphs from a subjective listening test
illustrating (a) the percent of times the generated loud speech was chosen as more loud than the original neutral, and (b) the percent
of times the generated Lombard speech was chosen as such when
compared to original neutral.
8% 3%
2%
LOUD NEUTRAL LM
(8)
GM PDM LPGM
i’ t
Original Speech Perturbed via CELP to Simulate
_ 82%
‘““I I LOMBARD NEUTRAL LM
(b)

108 SE. BowGhazale, J.H.L. Hansen/Speech Communication 20 (1996) 93-110
CELP coded Lombard effect speech was better re- produced than any other stressed style with only a 2% loss in CELP’s ability to reproduce it properly. It is suggested that the variability in speech production, coupled with the coding restrictions within CELP, contribute to its reduction in effective transmission of stress content in the speech signal.
Detailed listener results of the generated loud speech are presented in Fig. 13(a). The results show that the original loud speech was correctly classified 85% of the time, and the original neutral speech was classified 5% of the time as sounding loud. The results also show that LSP modification alone (LM) does not convey the emotional state of speech to the listener. Gain modification (GM) alone also does not convey sufficient stress cues. In addition, the results show that PDM perturbed loud speech was classified 62% of the time as sounding loud, while the LPGM perturbed loud speech was classified 92% of the times as sounding loud. The two most effective algorithms were the pitch delay mapping (PDM) and the combination of LSP, pitch delay and pitch gain modification (LPGM). Note that the LPGM per- turbed loud speech resulted in even a higher stress classification level than the original loud speech (7% higher).
Next, listener results of the generated Lombard effect speech are presented in Fig. 13(b). The results show that the original Lombard effect speech was classified 82% of the time, while the neutral speech was misclassified as being Lombard effect speech 10% of the time. This suggests that listeners had either an easier time identifying loud speech versus Lombard effect speech, or that speakers produced more perceptually meaningful cues in the loud ver- sus Lombard effect speech. The LPGM perturbed Lombard effect speech once more resulted in the highest classification rate of 75%, followed by the PDM perturbed which was classified as being under Lombard effect 65% of the time. The LSP modifica- tion alone and Gain modification (GM) alone did not convey sufficient cues to the listener.
A summary of the overall results for the three stressed speaking styles is given in Fig. 14 for PDM and LPGM perturbed speech. The LPGM perturbed loud speech resulted in the highest classification rate, and was perceived 92% of the time as sounding loud. LPGM perturbed angry was perceived 87% of the
STRESSED SYNTHETIC SPEECH CLASSIFICATION
STRESSED SYNTHETIC SPEECH GENERATED BY :
PlTCH DELAY MODlFICATlON
m LSP, PITCH DELAY, AND PITCH GAIN MODIFICATION
Fig. 14. A summary of the subjective listening test illustrating the
performance of two stress perturbation algorithm: PDM, LPGM.
The bar graph shows the percent of times the generated stressed
synthetic speech is correctly classified.
time as sounding angry. Finally, LPGM perturbed Lombard was classified 75% of the time as appear- ing to have Lombard effect characteristics. This sug- gests that listeners employ a combination of excita- tion and vocal tract acoustic cues in their perception of stress/emotional speech content, and that a per- turbation algorithm employing a combination of fea- tures representing excitation/vocal tract character- istics can be effective in imparting the effects of stress on input neutral speech.
5. Discussions and conclusions
This study has focused on developing speech parameter perturbation models for isolated words under neutral, loud, angry and Lombard effect speak- ing conditions for the purpose of generating stressed speech from original neutral speech. The goal has been to understand what speech parameter variations are needed to generate stressed speech from neutral speech given a particular speech modeling frame- work. In order to analyze the speech waveforms and synthesize the resulting speech parameters, the anal-

SE. BowGhazale, J.H.L. Hansen/Speech Communication 20 (19961 93-110 109
ysis and synthesis components of the code-excited- linear predictive (CELP) coder were employed with parameter quantization disabled. The coder was also used to measure the effect of stress on speech coding performance. An algorithm was formulated for mod- eling neutral and stressed speech parameters, and a second for imparting stressed speech characteristics onto isolated words with known phonemic content.
The algorithms employed CELP parameters which include line-spectral pairs (LSPs), pitch delay and pitch gain, for modeling (1) the distribution of the formant locations under neutral and stressed condi- tions, (2) the variation of voiced speech pitch across stressed speaking styles, and (3) the variation of the average gain across the word. Four approaches were considered for perturbing neutral parameters to pro- duce stressed synthetic speech within the CELP coder. The first approach transformed the vocal-tract features, represented by the line-spectral pairs, re- ferred to as the LM perturbation. The second ap- proach perturbed the pitch delay, referred to as the PDM perturbation. The third approach scaled the overall gain, referred to as the GM perturbation. Finally, the fourth approach modified the LSPs, pitch delay and pitch gain, referred to as the LPGM pertur- bation. A large database of neutral perturbed speech was generated employing these four approaches, for the purposes of listener assessment.
The evaluations of the proposed modeling scheme consisted of a set of subjective listening tests. An assessment of neutral and stressed speech CELP parameters showed a clear shift. Listener results showed that formant locations alone, or overall gain alone were not sufficient relayers of stress, while pitch delay was a more successful indicator of the emotional state of the speaker. Listening results also indicate that the combination of LSP, pitch delay and gain modification (LPGM) produced the highest sub- jective listening results. Listeners judged the LPGM angry speech to sound angry of the time, and the LPGM Lombard effect speech 7.5% of the time. The highest score was for the LPGM loud speech which was judged 92% of the times as sounding loud. The results suggest that feature perturbation in a source generator framework can be successful for generat- ing stressed speech from neutral speech.
It should be noted that while the general stress modeling scheme was applied within a CELP coder
framework, the general modeling/mapping approach could be employed within other speech synthesis algorithms. It is also noted that though a linear transformation was employed in this study for im- parting stress, other transformations may prove to be more effective for a given stress condition. It was previously shown that nonlinear speech character- istics can be effective in classifying speech under various stressed conditions (loud, Lombard effect, clear, anger) (Cairns and Hansen, 1994). An exten- sion of this work would be to investigate only one stress condition (Lombard, for example), and one modeling framework (CELP, sinusoidal LPC, etc.), in order to study the performance of different trans- formation methods for imparting a single stress con- dition.
References
B.S. Atal and M.R. Schroeder (19841, “Stochastic coding of
speech signals at very low bit rates”, Proc. IEEE Internat.
Conf Communications. p. 48.1.
S.E. Bou-Ghazale (I 993), Duration and spectral based stress token
generation for keyword recognition using hidden Markov
models, MS. of Science, Duke University, Department of
Electrical Engineering, Durham, NC.
S.E. Bou-Ghazale and J.H.L. Hansen (l994), “Duration and
spectral based stress token generation for HMM speech recog-
nition under stress”, Proc. IEEE Internat. Con$ Aroust.
Speech Signal Process.. Adelaide, South Australia, pp. 413-
416.
J.E. Cahn (19901, “The generation of affect in synthesized
speech”, J. Amer. Voice I/O Sot., pp. l-19.
D.A. Cairns and J.H.L. Hartsen (l994), “Nonlinear analysis and
detection of speech under stressed conditions”, J. Acoust.
Sac. Amer., Vol. 96, pp. 3392-3400.
J.P. Campbell, V.C. Welch and T.E. Tremain (19891, “An ex-
pandable error-protected 4800 bps CELP coder (U.S. Federal
Standard 4800 bps Voice Coder)“, Proc. IEEE Internat. Co@
Acoust. Speech Signal Process., Glasgow, Scotland, pp. 735-
738.
J.R. Crosmer and T.P. Barnwell III (1985), “A low bit rate
segment vocoder based on line-spectrum pairs”. Proc. IEEE
Internat. Conj Acowt. Speech Signal Process., Tampa, FL,
pp. 240-243.
J.H.L. Hansen (19881, Analysis and compensation of stressed and
noisy speech with application to robust automatic recognition.
PhD thesis, Georgia Institute of Technology, School of Elec- trical Engineering, Atlanta, GA.
J.H.L. Hansen (1993), “Adaptive source generator compensation and enhancement for speech recognition in noisy stressful
environments”, Proc. IEEE Internat. Conf Acoust. Speech
Signal Process., Minneapolis, MN, pp. 95-98.

110 SE. Bou-Ghazale, J.H.L. Hansen/Speech Communication 20 (1996) 93-110
J.H.L. Hansen (19941, “Morphological constrained enhancement with adaptive cepstral compensation (MCE-ACC) for speech
recognition in noise and Lombard effect”, IEEE Trans. Speech
Audio Process., Vol. 2, pp. 598-614.
J.H.L. Hansen and M.A. Clements (1987), “Evaluation of speech
under stress and emotional conditions”, Proc. Acoust. Sot.
Amer., Miami, FL.
P. Kroon and B.S. Atal (1988). “Strategies for improving the performance of CELP coders at low bit rates”, Proc. IEEE
Internat. ConjI Acoust. Speech Signal Process., New York, pp. 151-154.
P. Lieberman and S.B. Michaels (19621, “Some aspects of funda-
mental frequency and envelope amplitude as related to the
emotional content of speech”, J. Acoust. Sot. Amer., Vol. 34,
pp. 922-921.
thetic speech: A review of the literature on human vocal
emotion”, J. Acoust. Sot. Amer., Vol. 93, pp. 1097-1108.
LR. Murray and J.L. Amott (19951, “Implementation and testing
of a system for producing emotion-by-rule in synthetic
speech”, Speech Communication, Vol. 16, No. 4, pp. 369-390.
B.L. Pellom and J.H.L. Hansen (1996), “Text-directed speech
enhancement using phoneme classification and feature map
constrained vector quantization”, Proc. IEEE Internat. Conf:
Acoust. Speech Signal Process., Atlanta, GA, pp. 645-648.
S.R. Quanckenbush, T.P. Barnwell III and M.A. Clements (1988).
Objectiue Measure of Speech Quality (Prentice-Hall, Engle- wood Cliffs, NJ).
K.R. Scherer (19811, “Speech and emotional states”, in: J.K.
Darby, Ed., Speech Evaluation in Psychiatry (Grune and
Stratton, New York). R.P. Lippmann, E.A. Martin and D.B. Paul (19871, “Multi-style L.A. Streeter, N.H. Macdonald, W. Apple, R.M. Krauss and K.M.
training for robust isolated-word speech recognition”, Proc. Galotti (1983). “Acoustic and perceptual indicators of emo- IEEE Internat. Conj Acoust. Speech Signal Process., Dallas, tional stress”, J. Acoust. Sot. Amer., Vol. 73, No. 4, pp. TX, pp. 705-708. 1354-1360.
E. Lombard (1911). “Le signe de l’tltvation de la voix”, Ann.
Maladies Oreille, Larynx, Nez, Pharynx, Vol. 31, pp. 101-l 19.
I.R. Murray (1993), “Toward the simulation of emotion in syn-
C.E. Williams and K.N. Stevens (19721, “Emotions and speech:
Some acoustical correlates”, J. Acoust. Sot. Amer., Vol. 52,
pp. 1238-1250.