speed camera programs: 2018 annual review · nsw speed camera programs: 2018 annual review 8...
TRANSCRIPT

September 2019 | Version: 1.0
Speed Camera Programs: 2018 Annual Review

NSW Speed Camera Programs: 2018 Annual Review 2
Author: Centre for Road Safety
Date: February 2019
Version: 1.0
Division: Safety, Environment & Regulation

NSW Speed Camera Programs: 2018 Annual Review 3
Contents 1 Executive summary ................................................................................................... 5
1.1 How NSW reviews speed cameras ............................................................... 5 1.2 Key findings .................................................................................................. 6
2 Introduction .............................................................................................................. 10 2.1 The NSW Speed Camera Strategy ............................................................. 10 2.2 Annual review of NSW speed camera programs ........................................ 10 2.3 The speeding problem ................................................................................ 10 2.4 Safety benefits of camera enforcement ...................................................... 11 2.5 Transparent management of NSW speed camera programs ..................... 11
3 Types of speed camera programs in NSW .............................................................. 12 3.1 Fixed speed cameras .................................................................................. 12 3.2 Red-light speed cameras ............................................................................ 12 3.3 Mobile speed cameras ................................................................................ 13 3.4 Average speed cameras ............................................................................. 13
4 Review Criteria for reviewing speed cameras ......................................................... 14 4.1 Measuring the performance of speed camera programs ............................ 14 4.2 Measuring the performance of individual speed cameras .......................... 15
5 Data context ............................................................................................................ 16 5.1 Road crash data .......................................................................................... 16 5.2 Injury severity .............................................................................................. 16
6 Data parameters ...................................................................................................... 18 6.1 Five years of data ....................................................................................... 18 6.2 Time periods analysed ................................................................................ 18 6.3 Crashes selected for analysis ..................................................................... 19 6.4 State-wide crash data ................................................................................. 19 6.5 State-wide comparison traffic volume data ................................................. 19 6.6 State-wide speed survey data ..................................................................... 19 6.7 Infringement data ........................................................................................ 20
7 Review methodology ............................................................................................... 21 7.1 Fixed speed camera locations .................................................................... 21 7.2 Red-light speed camera locations ............................................................... 25 7.3 Mobile speed camera locations .................................................................. 27 7.4 Average speed enforcement lengths .......................................................... 27
8 Results and discussion ............................................................................................ 28 8.1 Fixed speed cameras .................................................................................. 28 8.2 Red-light speed cameras ............................................................................ 30 8.3 Mobile speed cameras ................................................................................ 34 8.4 Average speed cameras ............................................................................. 35

NSW Speed Camera Programs: 2018 Annual Review 4
Appendices A. NSW fixed speed cameras……………………………………….……....A1
Most infringing locations
Warning mode locations
High risk locations
B. NSW red-light speed cameras……………………………….…………..B1
Most infringing locations
C. NSW mobile speed cameras……………………………………….…….C1
D. NSW heavy vehicle average speed cameras………………………….D1

NSW Speed Camera Programs: 2018 Annual Review 5
1 Executive summary
The purpose of the annual NSW Speed Camera Review is to monitor speed cameras in NSW to ensure they are having a positive road safety effect. This report was prepared in early 2019, using data up until the end of the 2017 calendar year.
The NSW Centre for Road Safety (CRS) has reviewed all NSW speed cameras against the criteria in the NSW Speed Camera Strategy 2012 (the Strategy), culminating in this report. This document is the seventh in a series of annual reports that addresses the recommendation from the 2011 NSW Auditor-General’s audit of speed cameras, to provide the community with information about the road safety impact of speed cameras.
This report has identified that overall trauma reductions at fixed, red-light and average speed camera locations have exceeded the trauma reductions observed across NSW since those cameras were installed. In addition, the mobile speed camera program continues to deliver road safety benefits, compared to the period before the program was reintroduced onto NSW roads.
If an individual camera is found not to have a positive road safety effect, CRS will consider alternative road safety measures at the location. The findings from this annual review also guide future speed enforcement priorities.
1.1 How NSW reviews speed cameras
The review criteria for speed camera programs and individual camera locations are provided within the Strategy. Broadly speaking, review recommendations are measured by two key criteria:
Reduction in casualty crashes and casualties, and
Reduction in infringement rates.
At least five years of crash and casualty data are required to make an assessment of a camera’s safety benefit. The criteria and methodology are outlined within sections 4 and 7 of this review.
1.1.1 Fixed and red-light speed cameras
Most fixed speed cameras, and approximately half of red-light speed cameras, have now been installed for at least 5 years. As a result, there is sufficient data available to reliably assess road safety benefits, and this review has developed recommendations to retain, monitor or review these cameras.
Where there is not yet 5 years of post-installation data available, recommendations have not been made.
1.1.2 Mobile speed cameras
Because mobile speed cameras are designed to generally deter speeding across the road network, and because they move regularly, the annual review examines crash and speed data for the entire state, rather than individual mobile speed camera locations.
1.1.3 Average speed cameras
There are now 20 average speed enforcement lengths where 5 years of data are available, and the program continues to deliver a road safety benefit.

NSW Speed Camera Programs: 2018 Annual Review 6
NSW is currently expanding the heavy vehicle average speed camera program to metropolitan areas.
1.2 Key findings
1.2.1 Fixed speed camera program
Program size as at 31 December 2017: 139 cameras at 110 locations1
Median camera installation date: 30 April 2003
Overall, there has been a reduction in fatal crashes and casualty crashes at fixed speed camera locations since the cameras were installed, compared with the five year period prior to installation.
Specifically, at fixed speed camera locations there has been a:
32 per cent reduction in casualty crashes
80 per cent reduction in fatalities
37 per cent reduction in injuries.
The reduction in fatalities and injuries represents a saving of $549 million to the community.
The trauma reductions at camera locations compare to the following rates of change observed across NSW over the same period:
13 per cent reduction in casualty crashes
35 per cent reduction in fatalities
15 per cent reduction in injuries.
It should also be noted, alongside the crash data outlined above, that there has also been a notable increase in traffic volumes. Over the periods that fixed digital speed cameras have been reviewed within this report, there has been a 19 per cent increase in traffic volume across NSW.2
1 Of the 110 fixed speed camera locations, seven locations operate in warning mode and five locations are high risk sites located in tunnels. Recommendations are not provided for these warning mode and high risk locations.
2 Estimates for Vehicle Kilometres Travelled (VKT) estimated in Yearbook 2018: Australian Infrastructure Statistics, Statistical Report, BITRE

NSW Speed Camera Programs: 2018 Annual Review 7
Individual Camera Locations
Of the 110 fixed speed camera locations, seven locations operate in warning mode and five locations are high risk sites located in tunnels. Recommendations are not provided for these 12 locations.
For the remaining 98 fixed speed camera locations:
79 locations were found to offer continued safety benefits,
2 locations were identified for ongoing monitoring in future years,
4 locations had insufficient data to review, and
13 locations were ineligible for review.
No fixed digital speed camera locations were identified for review.
None of the 10 highest infringing fixed speed camera locations were identified in this review for ongoing monitoring.
1.2.2 Red-light speed camera program
Program size as at 31 December 2017: 191 cameras at 171 intersections
Median camera installation date: 27 June 2011
Overall, there has been a reduction in fatal crashes and serious injury crashes at red-light speed camera locations since the cameras were installed, compared with the five year period prior to installation.
Specifically, at red-light speed camera locations there has been a:
38 per cent reduction in fatal and serious injury crashes
74 per cent reduction in fatalities
40 per cent reduction in serious injuries
48 per cent reduction in pedestrian casualties.
The reduction in fatalities and serious injuries represents a saving of $174 million to the community.
The trauma reductions at camera locations compare to the following rates of change observed across NSW over the same period:
No change in fatal and serious injury crashes
15 per cent reduction in fatalities
No change in serious injuries
27 per cent reduction in pedestrian casualties.
It should also be noted, alongside the crash data outlined above, that there has also been a notable increase in traffic volumes. Over the period that red-light speed cameras have been reviewed within this report, there has been an 11 per cent increase in traffic volume across NSW.3
3 Estimates for Vehicle Kilometres Travelled (VKT) estimated in Yearbook 2018: Australian Infrastructure Statistics, Statistical Report, BITRE

NSW Speed Camera Programs: 2018 Annual Review 8
Individual Camera Locations
Of the 171 red-light speed camera locations, 80 locations have not yet been installed for 5 years. Recommendations are not provided for these 80 locations.
For the remaining 91 locations:
72 locations were found to offer continued safety benefits,
18 locations were identified for ongoing monitoring in future years, and
1 location was ineligible for review.
None of the 10 highest infringing red-light speed camera locations were identified for review or ongoing monitoring.
1.2.3 Mobile speed camera program
Program size as at 31 Dec 2017: 7,000 hrs of enforcement / month at 1,024 locations
Annual speed survey data indicate that the mobile speed camera program continues to deliver road safety benefits, compared to results prior to the reintroduction of the mobile speed camera program in 2010.
The speed survey results show that there has been a decrease in the proportion of light vehicles exceeding the speed limit over the last nine years, for all speed zones. When comparing the 2017 results against the 2016 results there has been a decrease in the percentage of light vehicles exceeding the speed limit by up to 10km/h in all speed zones except for in the 110km/h zone. The percentage of vehicles exceeding the speed limit by 10km/h or more has decreased in all speed zones except in the 90km/h, 100km/h and 110km/h.
The speed survey results also indicate that there is a reduced proportion of heavy vehicles exceeding the speed limit over the last nine years; but while this is true for most speed zones, it is not the case for exceeding the speed limit by 10km/h or more in 100km/h and 110km/h zones.
In 2017 there were a total of 21,347 infringements issued from mobile speed camera enforcement resulting in $4.6 million of fines. The total number of mobile speed camera infringements issued in 2017 decreased by 27 per cent compared to 2016.
Over 99 per cent of vehicles passing mobile speed cameras are not infringed for speeding, and this high rate of compliance has remained consistent since 2010 when the program was reintroduced in NSW.
The mobile speed camera program continues to deliver road safety benefits when compared to the most recent period without the program in operation, and there has

NSW Speed Camera Programs: 2018 Annual Review 9
been a 14 per cent increase in traffic volume across NSW since the mobile speed camera program was reintroduced in 2010.4
1.2.4 Average speed camera program
Program size as at 31 December 2017: 25 lengths
Median camera installation date: 16 December 2011
Overall, there has been a reduction in fatal crashes and casualty crashes involving a heavy vehicle on NSW average speed enforcement lengths since those lengths were installed, compared with the five year period prior to installation.
Across heavy vehicle average speed enforcement lengths, there has been a:
22 per cent reduction in casualty crashes involving a heavy vehicle
44 per cent reduction in fatalities from crashes involving heavy vehicles
4 per cent reduction in serious injuries from crashes involving heavy vehicles.
The reduction in fatalities and serious injuries represents a saving of $138 million to the community.
The trauma reductions at camera locations compare to the following rates of change observed across NSW over the same period for crashes involving heavy vehicles:
10 per cent reduction in casualty crashes involving a heavy vehicle
19 per cent reduction in fatalities from crashes involving heavy vehicles
10 per cent increase in serious injuries from crashes involving heavy vehicles.
It should also be noted, alongside the crash data outlined above, that there has been a notable increase in heavy vehicle traffic volumes. Over the periods that average speed enforcement lengths have been reviewed within this report, there has been an 11 per cent increase in heavy vehicle volumes across NSW.5
NSW is currently expanding the heavy vehicle average speed camera program to metropolitan areas, and CRS will continue to monitor the program.
4 Estimates for Vehicle Kilometres Travelled (VKT) estimated in Yearbook 2018: Australian Infrastructure Statistics, Statistical Report, BITRE 5 Estimates for Vehicle Kilometres Travelled (VKT) estimated in Yearbook 2018: Australian Infrastructure Statistics, Statistical Report, BITRE

NSW Speed Camera Programs: 2018 Annual Review 10
2 Introduction
2.1 The NSW Speed Camera Strategy
The NSW Speed Camera Strategy (the Strategy) provides an integrated framework for speed enforcement in NSW, and aims to improve the transparency of NSW speed camera programs. The Strategy was developed in consultation with the NSW Police Force and NRMA Motoring and Services, and reinforces the Government’s commitment to reducing fatalities and serious injuries on NSW roads.
The NSW Auditor-General has found that speed cameras change driver behaviour and improve road safety.6 The Auditor-General also recommended that speed camera performance information be regularly made available to the public. One of the key actions in the Strategy is therefore an annual review of speed camera programs against defined criteria.
2.2 Annual review of NSW speed camera programs
This annual review monitors automated speed enforcement in NSW. This includes fixed speed cameras, red-light speed cameras, mobile speed cameras and average speed cameras. However, this does not include the speed enforcement conducted by the NSW Police Force.
This report was prepared in early 2019, using data up until the end of the 2017 calendar year. Detailed analysis for NSW speed camera locations is provided within Appendices A – D of this report.
However, detailed analysis is not included for fixed speed cameras operating in warning mode.7 Crash and infringement data is instead provided for these cameras, within Appendix A. Detailed analysis is also not included for fixed speed cameras at five high risk tunnel locations. Speed cameras were generally installed at these locations when the tunnel was constructed, and therefore no pre-installation data are available for analysis.
Based on the findings of the annual review, cameras which are not delivering the expected road safety benefits will be more comprehensively investigated. These comprehensive investigations may result in the removal and relocation of the camera.
The findings from the annual review also inform future speed enforcement operations, and address NRMA Motoring & Services’ request for an assessment of all high infringing speed camera locations.
2.3 The speeding problem
Speeding, which encompasses excessive speed (driving above the speed limit) or inappropriate speed (driving too fast for the prevailing conditions), is unquestionably recognised as a major contributing factor in both the number and severity of crashes in NSW.
6 https://www.audit.nsw.gov.au/ArticleDocuments/200/Improving_Road_Safety_Media_Release.pdf.aspx?Embed=Y 7 For speed cameras operating in warning mode, warning letters are issued to motorists detected speeding, unless they exceed the speed limit by more than 30km/h, in which case a court attendance notice is issued and drivers face significant penalties. A three-strikes system also applies, where if a registered operator of a vehicle is issued two warning letters from the one warning mode camera, an infringement will be issued for a third offence and any further offences at that location.
NSW Speed Camera Programs: 2018 Annual Review 11
Speeding increases the risk of having a crash, and increases the risk of death or serious injury in the event of a crash. Studies of survival and impact speed show that small increases in travel speed can result in large increases in braking distances and impact speed, resulting in both an increased risk of a crash and a more severe outcome. This is especially the case for crashes with less protected road users such as pedestrians and cyclists.
2.4 Safety benefits of camera enforcement
Speed camera enforcement is an important road safety initiative with proven road safety benefits, and is a commonly employed method of speed enforcement in many best practice road safety jurisdictions worldwide. Speed enforcement helps to reduce the incidences of speeding on our roads, which in turn reduces the risk of crashes and reduces the likelihood of death or serious injuries in the event of a crash.
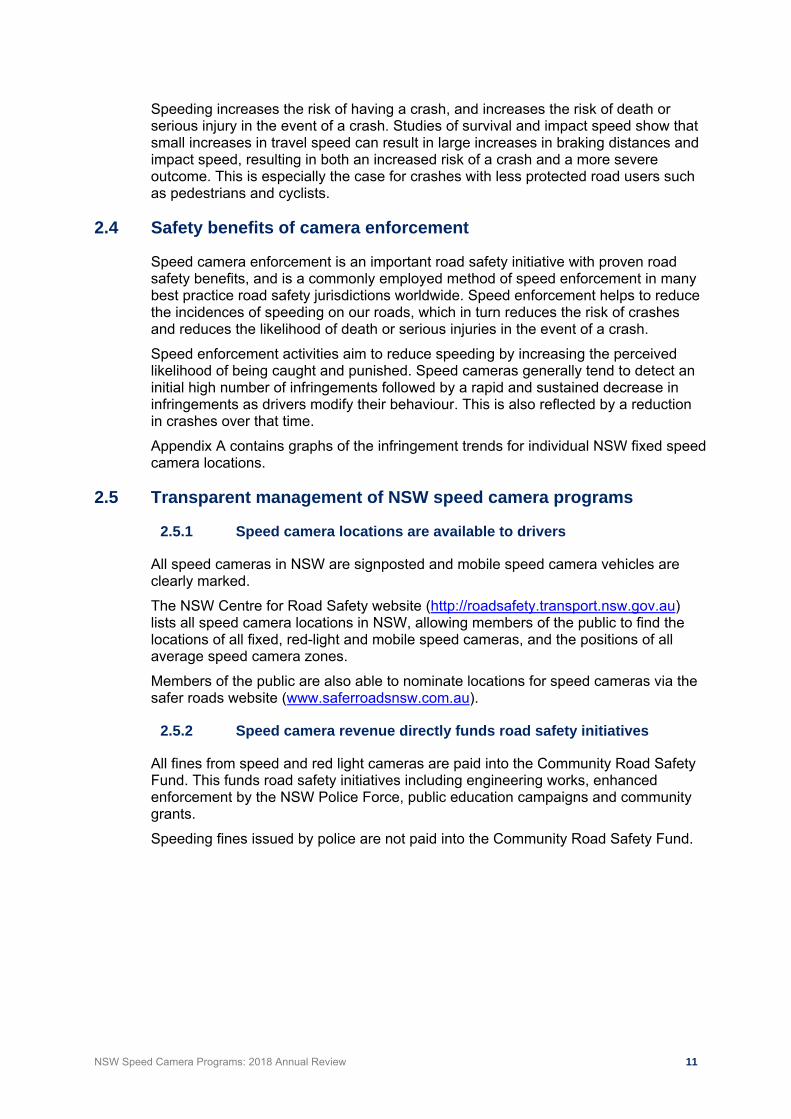
Speed enforcement activities aim to reduce speeding by increasing the perceived likelihood of being caught and punished. Speed cameras generally tend to detect an initial high number of infringements followed by a rapid and sustained decrease in infringements as drivers modify their behaviour. This is also reflected by a reduction in crashes over that time.
Appendix A contains graphs of the infringement trends for individual NSW fixed speed camera locations.
2.5 Transparent management of NSW speed camera programs
2.5.1 Speed camera locations are available to drivers
All speed cameras in NSW are signposted and mobile speed camera vehicles are clearly marked.
The NSW Centre for Road Safety website (http://roadsafety.transport.nsw.gov.au) lists all speed camera locations in NSW, allowing members of the public to find the locations of all fixed, red-light and mobile speed cameras, and the positions of all average speed camera zones.
Members of the public are also able to nominate locations for speed cameras via the safer roads website (www.saferroadsnsw.com.au).
2.5.2 Speed camera revenue directly funds road safety initiatives
All fines from speed and red light cameras are paid into the Community Road Safety Fund. This funds road safety initiatives including engineering works, enhanced enforcement by the NSW Police Force, public education campaigns and community grants.
Speeding fines issued by police are not paid into the Community Road Safety Fund.

NSW Speed Camera Programs: 2018 Annual Review 12
3 Types of speed camera programs in NSW
Speed cameras are automated speed enforcement tools that supplement enforcement conducted by the NSW Police Force.
The NSW Police Force routinely nominates locations to be considered for automated speed enforcement, as cameras can operate in locations that may be difficult for police to enforce. Members of the public are also able to nominate locations for speed cameras, via the NSW safer roads website at www.saferroadsnsw.com.au.
Table 1 shows the four types of speed cameras used in NSW.
Table 1: Types of speed camera enforcement in NSW
Speed cameras used in NSW
Camera Type
Main purpose Introduced Program Size
(as at 31 Dec 2017)
Fixed speed cameras
Location specific, to address black spot / high risk locations
1997 139 cameras at 110 locations8
Red-light speed cameras
Location specific,
to address high risk intersections
2009 191 cameras at 171 intersections.
Mobile speed cameras
General network deterrence
Re-introduced in 2010.
(This program was first introduced in 1991, but
ceased operation in Dec 2008)
1,024 locations,
7,000 hours of enforcement/month
Average speed cameras
Route enforcement (for heavy vehicles only)
2010 25 lengths
3.1 Fixed speed cameras
Fixed speed cameras are located at road lengths where there is a demonstrated crash history or a high crash risk. These cameras detect and deter speeding at a specific location on the road network.
3.2 Red-light speed cameras
Red-light speed cameras are installed at signalised intersections where drivers are vulnerable to right angle crashes and there is an elevated risk of a pedestrian crash. These cameras detect and deter both speeding and red-light running, both of which can result in severe injuries even in lower speed crashes.
8 Of the 109 fixed speed camera locations, seven locations operate in warning mode and five locations are high risk sites located in tunnels. Recommendations are not provided for these warning mode and high risk locations.

NSW Speed Camera Programs: 2018 Annual Review 13
3.3 Mobile speed cameras
Mobile speed cameras are moved around the road network at various times and locations. This means drivers are less able to predict where enforcement will occur, and so are more likely to comply with the speed limit more often.
Mobile speed cameras are operated from highly visible vehicles. Enforcement is conducted by private contractors that are managed by Roads and Maritime Services. The prevailing speed limit is displayed on a warning sign so that motorists are aware of the speed limit and the mobile speed camera.
The benefit of mobile speed cameras in reducing speeding is not limited to mobile speed camera locations or the time the camera is located there; they produce a sustained change in driver behaviour by increasing the real and perceived likelihood that speeding can be enforced anywhere at any time.
3.4 Average speed cameras
The NSW average speed camera program addresses heavy vehicle speeding along travel routes with a demonstrated history of heavy vehicle crashes and/or speeding. The program targets heavy vehicles because they are over-represented in crashes on known heavy vehicle routes.
Average speed enforcement works by measuring the amount of time it takes a heavy vehicle to travel between points and then calculating the average speed of the vehicle. If the vehicle’s average speed is faster than the speed limit for the length of road, the driver will be infringed for speeding.

NSW Speed Camera Programs: 2018 Annual Review 14
4 Review Criteria for reviewing speed cameras
Speed cameras are used in NSW to reduce the number of people killed and injured in crashes.
The following sections outline the criteria that guide the review of speed camera performance in NSW.
4.1 Measuring the performance of speed camera programs
Table 2: Criteria for measuring the performance of speed camera programs
Program Measure of Performance
Fixed speed camera program
Reduction in vehicles speeding at fixed speed camera locations
Reduced frequency or severity of crashes at fixed speed camera locations
Red-light speed camera program
Reduction in frequency and severity of crashes at enforced intersections
Reduction in frequency and severity of crashes at all signalised intersections (due to deterrent effect across the network)
Mobile speed camera program
Reduction in road trauma across the entire road network
Reduction in speed-related crashes across the entire road network
Reduction in speeding across the entire road network
Average speed
camera program
Reduction in heavy vehicle speeding on enforcement lengths
Reduction in the frequency and severity of heavy vehicle crashes on
enforcement lengths
Results for the above are presented in Section 8.

NSW Speed Camera Programs: 2018 Annual Review 15
4.2 Measuring the performance of individual speed cameras
Table 3: Criteria for measuring the performance of individual speed cameras
Camera Type Performance data Measure of performance
Fixed speed cameras
Speeds Reduction in vehicles speeding within 500 metres of the camera
Compliance data Increase in compliance at camera location and/or reduction in infringement rates
Crash data Reduction in casualties and crashes within 500 metres of the camera
Risk Reduction in risk at the location (for example low level of speeding and/or crashes in tunnels)
Red-light speed cameras
Speeds Reduction in vehicles exceeding speed limit at the intersection
Compliance data Increase in compliance at the intersection and/or reduction in infringement rates
Crash data Reduction in casualties and crashes at intersection
Mobile speed cameras
Annual speed surveys
Reduction in vehicles exceeding speed limit across the road network, by testing a random sample of locations
Compliance data Increase in compliance rates and/or reduction in infringement rates
Crash data Reduction in crashes and casualties across NSW
Average speed camera program
Speeds Reduction in heavy vehicle speeding within enforcement lengths
Compliance data Increase in heavy vehicle compliance within the enforcement length and/or reduction in heavy vehicle infringement rates
Crash data Reduction in heavy vehicle crashes within enforcement lengths
Results for the above are presented in Appendices A – D.

NSW Speed Camera Programs: 2018 Annual Review 16
5 Data context
5.1 Road crash data
The crash statistics recorded by Transport for NSW in the CRS crash recording database, CrashLink, are confined to those crashes which conform to the national guidelines for reporting and classifying road vehicle crashes9, based on the following criteria:
The crash was reported to the Police,
The crash occurred on a road open to the public,
The crash involved at least one moving road vehicle, and
The crash involved at least one person being killed or injured or at least one motor vehicle being towed away.
The method of reporting tow away crash data changed in October 2014, and as such is no longer comparable to the before period. As a result, this review has focussed on casualty, fatal and serious injury crashes, compared to some of the reviews completed in previous years. This is further discussed in section 7.
5.2 Injury severity
Crash data is presented by severity of injury, and defined as follows:
Fatality: a person who dies within thirty days from injuries received in a road traffic crash.
Serious injury: a person identified in CrashLink (casualty or driver or rider) who is matched to a hospital admission record on the same day or on the day after a crash and did not die within 30 days of the crash, and is admitted with at least one injury diagnosis; or linked to an iCare (Lifetime Care) participant record.
Moderate injury: a person identified in CrashLink (casualty or driver or rider) who is matched to an emergency department attendance record on the same day or on the day after a crash but was not killed or not subsequently admitted to hospital; or a previously defined Minor/Other or No Injury CrashLink record matched to a SIRA CTP record with a MAIS score of 2 (Moderate) or higher.
Minor / Other injury: a person identified as an injury in CrashLink who is not matched to a hospital admission record or emergency department attendance record; or a previously defined No Injury CrashLink record matched to a SIRA CTP record with an MAIS score of 1 (Minor).
Injury – Severity uncategorised: a person identified as an injury in CrashLink prior to 2005 for which data linkage with health records is not available.
Casualty: any person killed or injured because of a crash.
Casualty crash: a crash that results in at least one person killed or injured.
9 More information about how crash data is processed in NSW is available online at www.roadsafety.transport.nsw.gov.au.

NSW Speed Camera Programs: 2018 Annual Review 17
Crash data reported from 2005 onwards includes additional detail regarding injury severity, and are categorised as:
Serious Injury,
Moderate Injury,
Minor / Other Injury.
Prior to 2005, crash data was not matched to hospital admissions or emergency department presentations, so all non-fatal injuries prior to 2005 were uncategorised with respect to the severity of injury.
5.2.1.1 Updated serious injury definition
In previous years, NSW defined a serious injury to be an injury from a crash which resulted in a hospital admission.
Under the current definition, a serious injury is defined as:
A person matched to a hospital admission that identifies an injury,
or
A person that has a SIRA icare (Lifetime Care) claim.
This has decreased the number of serious injuries per year due to the removal of hospital admissions for reasons other than injury.
In addition, further investigation and linkage of hospital data has improved the identification of serious injuries, and refreshed some data, as outlined below.
5.2.1.2 Inclusion of additional moderate injuries
The Centre for Road Safety has identified a number of people injured in crashes that did not report to police as having been injured at the time of the crash, but have subsequently made a claim for an injury. These records were identified within Compulsory Third Party (CTP) insurance claims.
Additional records of people injured in a crash were also identified within the NSW Government’s emergency department presentation records.
As a result, a number of moderate injuries have been added into CrashLink for people that were previously recorded as not injured. This had the effect of increasing the numbers of moderate and minor injuries for years 2005 to 2013 (when compared to the totals reported in some previous years).

NSW Speed Camera Programs: 2018 Annual Review 18
6 Data parameters
6.1 Five years of data
Typically, at least five years of data are required to make an assessment of a camera’s performance.10
As some camera locations or lengths have been operational for less than five years, the data for these locations are insufficient to reliably assess performance. Preliminary observations have instead been provided for these locations.
6.2 Time periods analysed
Data for the period before the installation of the camera (the “before” period) has been compared against data after the camera’s commencement date (the “after” period, when warning letters and then infringements are issued).
To assess the current performance of the speed camera, the most recent five calendar year period (i.e. 2013 - 2017) is selected as the “after” period.
6.2.1 Pre-installation periods
For fixed, red-light and average speed camera programs, the five year “before” period ends three months prior to the “commencement date.” This is to ensure that the “before” period does not capture the “pre-installation period” when behavioural changes may result from the presence of not-yet operational camera housing.
However, it should be noted that a significant portion of the red-light speed camera locations previously featured a wet-film red-light camera. (The wet-film red-light program preceded the red-light speed camera program). 82 of the 171 red-light speed camera locations previously featured a wet-film red-light camera.
Wet-film red-light cameras were operational for different periods of time, requiring there to be camera housing (poles and camera boxes) at the roadside at these locations. As a result, “before” data for a significant number of red-light speed cameras may have been impacted by drivers’ perceptions that there was camera enforcement in place at these locations. It can be assumed that this would have improved drivers’ compliance at these locations, compared to other sites where there were no camera housings in place.
6.2.2 Warning mode periods
Fixed and red-light speed cameras generally operate in warning mode for a one-month period after the “commencement date”. A one-month warning mode period also applied for mobile speed cameras when the program was introduced, but has not been applied since then.
NSW average speed camera lengths generally operate in warning mode for a two-month period after the “commencement date”.
10 Austroads (2009). Guide to Road Safety Part 8: Treatment of Crash Locations. Publication No. AGRS08/09.

NSW Speed Camera Programs: 2018 Annual Review 19
Figure 1: Before, After and Warning Mode periods
6.3 Crashes selected for analysis
When reviewing fixed, red-light and average speed cameras, crash data were examined at individual speed camera locations.
When reviewing mobile speed cameras, crash data were examined for the entire state, due to the nature of mobile speed cameras and their purpose of creating a general deterrence effect across the NSW road network.
6.4 State-wide crash data
State-wide crash data is provided to compare the crash outcomes at fixed and red-light speed camera locations against the rates of change observed across NSW.
6.5 State-wide comparison traffic volume data
The Australian Bureau of Infrastructure, Transport and Regional Economics publishes the yearbook of Australian Infrastructure Statistics each year.11
NSW state-wide measures of vehicle kilometres travelled (VKT) as calculated for the yearbook are the basis of the state-wide vehicle volumes cited within this report.
6.6 State-wide speed survey data
Vehicle speeds were assessed state-wide via the CRS annual speed survey program.
In 2017, speed surveys for the CRS annual speed survey program were conducted at 175 NSW locations, including a range of roads with a range of speed limits, to gather current information about the speeding behaviour of both light vehicle drivers and heavy vehicle drivers.
The surveys measure free travel speeds, with a headway of four seconds. That is, only the speeds of vehicles that are unimpeded by other traffic are measured. Therefore the survey provides a measure of the speed that drivers choose to travel rather than a measure of traffic congestion.
11 Estimates for Vehicle Kilometres Travelled (VKT) estimated in Yearbook 2018: Australian Infrastructure Statistics, Statistical Report, BITRE
“Before”period
“Commencement d
ate”
(Camera
beco
mes o
pera
tional)
5 years 3 months
“After”period
5 years
Typically1‐2 months
Ongoing …
Warn
ing
mode
Infringements are issued
“Pre insta
llation”
perio
d
NSW Fixed, Red‐Light and Point‐to‐point Speed Cameras

NSW Speed Camera Programs: 2018 Annual Review 20
Speed surveys are not undertaken at specific speed camera enforcement locations. Because of this, this report instead uses infringement data at camera locations as a proxy for speed data.
6.7 Infringement data
Infringement data analysed in this report include penalty notices from July 2002 onwards. No earlier infringement data are available.
All fines from speed cameras are directed to the Community Road Safety Fund to pay for road safety programs across the state. Infringement data for red-light speed cameras, fixed speed cameras and mobile speed cameras are publicly available through the Revenue NSW website (http://www.revenue.nsw.gov.au/info/statistics).

NSW Speed Camera Programs: 2018 Annual Review 21
7 Review methodology
7.1 Fixed speed camera locations
7.1.1 Fixed speed cameras analysed
While at the end of 2017 there were 110 fixed speed camera locations across NSW, road safety benefits were only assessed in detail for 98 fixed speed camera locations within this report.
12 fixed speed camera locations were excluded, as follows:
Seven locations are currently operating in warning mode.12 This report includes information on crashes, warning letters and infringements at these locations within Appendix A (sections A4 & A5).
Five locations are located in tunnels (and were sometimes referred to in the review as “high risk” locations). These cameras were generally installed when the tunnel was constructed, therefore no pre-installation data are available. Post installation crash and infringement data for these locations is presented at section A6.
The 98 fixed speed camera locations analysed in this report have been operational for the following periods:
Table 4: Operational duration of NSW fixed speed cameras
7.1.2 Road length analysed for each camera
Crash data were typically examined within 500 metres either side of fixed speed cameras.
For fixed speed cameras located within a school zone, crash data were examined from patch-to-patch (i.e. the length of road designated as a school zone, as identified by the start and end 40km/h patches marked on the road).
For locations with more than one camera in operation (where cameras are less than 100 metres apart), the crash analysis length was for 500 metres either side of the mid-point of the two cameras.
One fixed speed camera location - the M1 Princes Motorway (formerly the F6, Southern Freeway) Gwynneville - had two cameras operating approximately 1,000 metres apart and infringing in different directions. Within this report, the two cameras were listed as separate locations for the directions they enforce.
12 For speed cameras operating in warning mode, warning letters are issued to motorists detected speeding, unless they exceed the speed limit by more than 30km/h, in which case a court attendance notice is issued and drivers face significant penalties. A three-strikes system also applies, where if a registered operator of a vehicle is issued two warning letters from the one camera location, an infringement will be issued for a third offence and any further offences at that location.
NSW fixed speed cameras
Operational for 5 years or more: 94 locations
Operational for less than 5 years: 4 locations
Total: 98 locations

NSW Speed Camera Programs: 2018 Annual Review 22
7.1.3 Recommendations
This report considered “before” and “after” crash analysis, and whether the fixed speed camera location has previously been comprehensively reviewed, to develop recommendations as follows:
Table 5: Developing recommendations for fixed speed cameras
13 A p-value of 0.05 has been applied to determine statistical significance 14 A p-value of 0.05 has been applied to determine statistical significance
Recommendation Trigger Outcome
Review
Major roadworks have been undertaken at the location or
TfNSW will undertake a comprehensive review of the camera location.
There has been a statistically significant increase13 in the number of casualty crashes, and the camera has not been reviewed in the last 5 years.
Retain and monitor
There has been an increase in the number of casualty crashes, but it is not a statistically significant result.
The camera will continue to be used at the location.
The location will also be flagged for ongoing monitoring in future reviews.
Retain
There has been no increase in casualty crashes or
The camera will continue to be used at the location.
There has been an increase in the number of casualty crashes, but it is not a statistically significant result, and the location has been reviewed within the last 5 years or
There has been a statistically significant increase14 in the number of casualty crashes, but the location has been reviewed within the last 5 years.
Insufficient data There is less than 5 years of ‘after’ data available.
The camera will be assessed once 5 years of “after” data is available.
Ineligible
There is a review currently underway at the location, or
TfNSW will complete the comprehensive review.
The camera has been removed. Nil.

NSW Speed Camera Programs: 2018 Annual Review 23
7.1.4 Comprehensive reviews
Where required, comprehensive reviews will be undertaken as per the process in previous years. Depending on the findings of each comprehensive review, the fixed speed camera may be removed, and road safety treatments implemented to address any identified road safety risks. These treatments may involve improved signage, road works, traffic facilities, speed zoning reviews and targeted communications.
The Centre for Road Safety is currently leading a program of 13 comprehensive speed camera reviews, at the following locations:
Berry - Princes Highway, between Kangaroo Valley Road and Victoria Street
Foxground - Princes Highway, between Foxground Road and Broughton Creek
Hungry Head - Giinagay Way (formerly the Pacific Highway), between Boundary Road and Ballards Road
Terrigal - Terrigal Drive, between Brunswick Road and Bellbird Avenue (School Zone)
Valla Beach - Giinagay Way (formerly the Pacific Highway), between Valla Beach Road and Oyster Creek
Bomaderry - Bolong Road, between Beinda Street and Coomea Street
Brogo - Princes Highway, between Pioneer Close and Brogo River
Burringbar - Tweed Valley Way, between Blakeneys Road and Cooradilla Road
North Narrabeen - Pittwater Road, between Garden Street and Namona Street (School Zone)
Queanbeyan - Lanyon Drive, between Tompsitt Drive and Hoover Road
Rydalmere - Victoria Road, between Park Road and John Road (School Zone)
Hartley - Great Western Highway, between Mid Hartley Road and Blackmans Creek
Moore Park – ANZAC Parade at Lang Road (RLSC location).
7.1.5 Additional technical notes
Additional technical notes for the analysis of fixed speed cameras:
1. The commencement date listed for each location refers to the date that the fixed speed camera commenced infringement (or warning mode) at that location. For locations where more than one fixed speed camera is in operation, the date listed refers to the date that the first camera started infringing at that location, unless otherwise specified.
2. For each location, the “before” and “after” periods vary depending on the date the camera commenced infringement, and exclude the three-month period directly before the commencement date. For each location, the “before” period was defined as the five-year period up to three months prior to the “commencement date” (when infringements commence). The “after” period was defined as the most recent five-year calendar period (2013 - 2017).

NSW Speed Camera Programs: 2018 Annual Review 24
Additional technical notes for the analysis of fixed speed cameras:
3. In instances when there was less than five years of “before” data, the “before” period was adjusted so that it represented an equivalent five-year period.
4. The percentage reduction for crashes and casualties are based on the annual averages in crashes and casualties at each location in the “before” period and the “after” period. This allows an approximate comparison to be made between the five-year “before” period and the most recent five calendar year “after” period (2013 - 2017).
5. The estimated casualty cost for the “before” period and the most recent five calendar year “after” period was calculated using the willingness to pay methodology, which reflects the accumulated value the NSW community is willing to pay or forgo in exchange for a reduction in the probability of crash related injuries and road crash deaths on NSW roads. The casualty costs used were based on the costs for the weighted average of urban and non-urban fatal and injury reductions, as follows: * $7,598,848 per fatality, * $485,992 per serious injury, * $75,790 per moderate or minor/other injury, and * $211,679 per uncategorised injury.
6. For each fixed speed camera location, a test of significance of the observed change in casualty crashes was conducted using the conditional method.15 This approach compared the number of casualty crashes in the “after” period with the conditional distribution of the casualty crashes in the “after” period given the total casualty crashes in both the “before” and “after” periods.
7. Data for the crash analysis have not been ranked and are presented alphabetically according to the location description of the camera location.
15 Przyborowski, J., Wilenski, H., 1940. Homogeneity of results in testing samples from Poisson series. Biometrika 31, 313–323.

NSW Speed Camera Programs: 2018 Annual Review 25
7.2 Red-light speed camera locations
7.2.1 Red-light speed cameras analysed
At the end of 2017, there were 191 red-light speed cameras in total, operating at 171 intersections around Sydney, Newcastle and Wollongong. 19 intersections featured two or more cameras.
All red-light speed camera intersections were analysed in this report, and they have been operational for the following periods:
7.2.2 Road length analysed for each camera
Crash data were examined within 10 metres of each intersection with a red-light speed camera.
7.2.3 Analysis of specific crash types
In addition to total casualties at each location, pedestrian casualties were specifically examined given the greater exposure of pedestrians at signalised intersections and the higher likelihood of severe casualty outcomes for this group due to their lack of protection in a crash.
Data were also examined for adjacent, right-through and rear-end casualty crashes, as these are the crash types that typically occur at intersections. Adjacent and right-through crashes are often more severe as drivers and passengers are not as protected from side impact crashes, with low-speed side impact crashes potentially resulting in severe injuries. The frequency and severity of these crash types are expected to reduce at intersections enforced by red-light speed cameras.
Red-light speed cameras are intended to counteract the potential increase in rear-end crashes by also enforcing speed, as it is easier for drivers to brake in time to avoid a rear-end collision when they are driving at lower speeds.
7.2.4 Recommendations
This is the third year that sufficient data has been available to assess individual red-light speed camera locations.
This review considered “before” and “after” crash analysis to develop these recommendations. No red-light speed camera locations have previously been reviewed, so this was not a factor in developing recommendations.
Table 6 (overleaf) outlines the process for developing recommendations for red-light speed camera locations.
NSW red-light speed cameras
Operational for 5 years or more: 91
Operational for less than 5 years: 80
Total: 171

NSW Speed Camera Programs: 2018 Annual Review 26
Table 6: Developing recommendations for red-light speed cameras
7.2.5 Additional technical notes
Additional technical notes for the analysis of red-light speed cameras
1. To identify crashes at each intersection, CRS initially examined crashes geo-coded to be within 200 metres of the traffic signals. Crashes were then assigned to the enforced intersection if they occurred within, or up to 10 metres from, the intersection.
2. These crashes were attributed to the relevant intersection by taking into account the geo-coding as well as the street name, identifying feature(s), and intersection type.
3. Where unclear, the correct location of the crash was confirmed or inferred from the original police report.
4. The commencement of the warning letter period was listed for each camera. For the analysis of intersections with two cameras, the “after” period was based on the earlier of the two commencement dates.
5. Data for each crash type (adjacent, right- and rear-end) was reported based on Road User Movement (RUM) codes. RUM codes describe the first impact that occurred during the crash. Adjacent crashes are indicated by RUM code 10; Right-crashes are coded 21 and rear-end crashes are coded 30. More information on RUM codes can be found in the Definition and notes to support road crash data at http://roadsafety.transport.nsw.gov.au/downloads/definitions-notes.pdf
6. The improvement rates for crashes and casualties were based on the annual averages in crashes and casualties at each location before and after the cameras were installed. This allowed an approximate comparison to be made between the five year “before” period and the available data for the “after” period until December 2017 (which is less than five years for a number of red-light speed camera locations).
16
A p-value of 0.05 has been applied to determine statistical significance
Recommendation Trigger Outcome
Review
There has been a statistically significant increase16 in the number of fatal and serious injury crashes.
TfNSW will undertake a comprehensive review of the camera location.
Retain and monitor
There has been an increase in the number of fatal and serious injury crashes but it is not a statistically significant result.
The camera will continue to be used at the location.
The location will also be flagged for ongoing monitoring in future reviews.
Retain There has been no increase in fatal and serious injury crashes.
The camera will continue to be used at the location.
Insufficient data There is less than 5 years of ‘after’ data available.
The camera will be assessed once 5 years of “after” data is available.
Ineligible There is a review currently underway at the location
TfNSW will complete the comprehensive review.

NSW Speed Camera Programs: 2018 Annual Review 27
Additional technical notes for the analysis of red-light speed cameras
7. The estimated casualty cost for the “before” period and the most recent five calendar year “after” period was calculated using the willingness to pay methodology, which reflects the accumulated value the NSW community is willing to pay or forgo in exchange for a reduction in the probability of crash related injuries and road crash deaths on NSW roads. The casualty costs used were based on the costs for the urban fatal and injury reductions, as follows: * $7,278,105 per fatality, * $436,643 per serious injury, * $67,045 per moderate or minor/other injury.
8. Crash data were not ranked and were presented alphabetically by suburb of the camera location.
7.3 Mobile speed camera locations
7.3.1 Road lengths analysed
The entire NSW road network was analysed to review the general deterrence effect of the mobile speed camera program.
7.3.2 Program structure and periods of enforcement
In December 2015, the NSW Government announced new higher-visibility mobile speed camera vehicle markings, and additional enhancements to warning signage. The mobile speed camera program delivered 7,000 enforcement hours per month at 1,024 locations.
7.4 Average speed enforcement lengths
7.4.1 Average speed enforcement lengths analysed
The average speed camera program only targets heavy vehicles. The program includes 25 enforcement lengths ranging from 7 – 94km, and includes most major NSW highways. Enforcement lengths were installed over the following years:
Year Lengths installed
2010 2
(5 years of crash data is available for these lengths)
2011 14
2012 4
2013 1
(Less than 5 years of crash data is available for the lengths)
2014 3
2015 1
2016 0
2017 0
Total: 25
As for previous years, heavy vehicle crash and infringement data are presented to facilitate analysis of the current impact of individual average speed enforcement lengths.

NSW Speed Camera Programs: 2018 Annual Review 28
8 Results and discussion
This review has found that speed cameras are continuing to improve road safety in NSW. Results from the fixed, red-light, mobile and average speed camera programs show that drivers are changing their behaviour, which overall is resulting in a reduction in crashes and casualties at camera locations and across the road network.
NSW’s four speed camera programs are individually considered below.
8.1 Fixed speed cameras
Program size as at 31 December 2017: 139 cameras at 110 locations17
Median camera installation date: 30 April 2003
The analysis of individual fixed speed camera locations is available at Appendix A.
Overall, there has been a reduction in fatal crashes and casualty crashes at fixed speed camera locations since the cameras were installed, compared with the five year period prior to installation.
Specifically, at fixed speed camera locations there has been a:
32 per cent reduction in casualty crashes
80 per cent reduction in fatalities
37 per cent reduction in injuries.
The reduction in fatalities and injuries represents a saving of $549 million to the community.
The trauma reductions at camera locations compare to the following rates of change observed across NSW over the same period:
13 per cent reduction in casualty crashes
35 per cent reduction in fatalities
15 per cent reduction in injuries.
It should also be noted, alongside the crash data discussed above, that there has also been a notable increase in traffic volumes. Over the periods that fixed digital speed cameras have been reviewed within this report, there has been a 14 per cent increase in traffic volume across NSW.18
8.1.1 Individual fixed speed camera locations
Analysis within Appendix A has identified the following findings for individual camera locations:
17 Of the 110 fixed speed camera locations, seven locations operate in warning mode and five locations are high risk sites located in tunnels. Recommendations are not provided for these warning mode and high risk locations.
18 Estimates for Vehicle Kilometres Travelled (VKT) estimated in Yearbook 2018: Australian Infrastructure Statistics, Statistical Report, BITRE

NSW Speed Camera Programs: 2018 Annual Review 29
Table 7: Fixed speed camera locations status
Camera Status: Number of Cameras
Insufficient data A more comprehensive analysis over a longer time period is required before drawing any conclusions.
4
Ineligible The camera has been removed or a review is currently underway 13
5 years of “after” data is available for the camera.
Retain 79
Retain and monitor 2
Review 0
Total: 98
The following table identifies fixed speed cameras with notable reductions in casualty crashes:
Table 8: Top performing fixed speed cameras
Location Casualty crashes Change in
cas crashes
% change Before After
New England Highway, Tenterfield
6 0 ↓ 6 ↓ 100
Pacific Highway, Ewingsdale
14 1 ↓ 13 ↓ 92.9%
Kingsway, Miranda (school zone)
14 2 ↓ 12 ↓ 85.7%
Pacific Highway, Woodburn 5 1 ↓ 4 ↓ 80% Castle Hill Road, West Pennant Hills
17 4 ↓ 13 ↓ 76.5%
8.1.2 Fixed speed cameras identified to review / monitor
CRS has identified two camera locations that recorded an increase in casualty crashes. These increases were not statistically significant and the locations will be monitored in future years.
This is the third year in a row that Bonnyrigg (Elizabeth Drive) has been identified for additional monitoring and the second year in a row that Bonnyrigg (Cabramatta Road) has been identified for additional monitoring.

NSW Speed Camera Programs: 2018 Annual Review 30
Table 9: Key crash data for identified fixed speed cameras
Pre-Installation Post-Installation
Cra
shes
at
mid
-blo
ck
Cra
shes
on
cu
rves
Wet
su
rfac
e c
rash
es
Hea
d-o
n c
ras
hes
Ru
n-o
ff-r
oad
cra
shes
Sin
gle
veh
icle
cra
she
s
Cra
shes
at
mid
-blo
ck
Cra
shes
on
cu
rves
Wet
su
rfac
e c
rash
es
Hea
d-o
n c
ras
hes
Ru
n-o
ff-r
oad
cra
shes
Sin
gle
veh
icle
cra
she
s
Bonnyrigg (Elizabeth
Drive) 16 2 11 1 8 8
3 2 2 0 1 2
Bonnyrigg (Cabramatta
Road) 10 3 6 2 4 4
7 1 5 1 4 3
Total 26 5 17 3 12 12
10 3 7 1 5 5
Percentage change: ↓ 62% ↓ 40% ↓ 59% ↓ 67% ↓ 58% ↓ 58%
8.1.2.1 Bonnyrigg (Elizabeth Drive)
Casualty crashes at the Bonnyrigg (Elizabeth Drive) fixed digital speed camera location rose from 12 in the four years prior to installation of the camera, to 21 in the most recent five years (to the end of 2017). This is not a statistically significant outcome.
However, despite the rise in the overall number of casualty crashes, the crash types likely to be improved by the presence of a fixed speed camera have markedly improved or remained constant over these periods. Speeding has also fallen by approximately 75 per cent at this location.
These outcomes represent a substantial road safety gain – particularly considering that vehicle volumes have risen by an estimated 17 per cent at this location since the camera was installed in the year 2000.
8.1.2.2 Bonnyrigg (Cabramatta Road)
Casualty crashes at the Bonnyrigg (Cabramatta Road) fixed digital speed camera location rose from 25 in the five years prior to installation of the camera, to 28 in the most recent five years (to the end of 2017). This is not a statistically significant outcome.
However, despite the rise in the overall number of casualty crashes, almost all of the crash types most likely to be improved by the presence of a fixed speed camera have either improved or remained constant over these periods. Speeding has also fallen by approximately 83 per cent at this location.
These outcomes represent a substantial road safety gain – particularly considering that vehicle volumes have risen by an estimated 16 per cent at this location since the camera was installed in 2003.
8.2 Red-light speed cameras
Program size as at 31 December 2017: 191 cameras at 171 intersections
Median camera installation date: 27 June 2011

NSW Speed Camera Programs: 2018 Annual Review 31
The analysis of red-light speed camera locations is available at Appendix B.
Overall, there has been a reduction in fatal crashes and serious injury crashes at red-light speed camera locations since the cameras were installed, compared with the five year period prior to installation.
Specifically, at red-light speed camera locations there has been a:
38 per cent reduction in fatal and serious injury crashes
74 per cent reduction in fatalities
40 per cent reduction in serious injuries
48 per cent reduction in pedestrian casualties.
The reduction in fatalities and serious injuries represents a saving of $174 million to the community.
The trauma reductions at camera locations compare to the following rates of change observed across NSW over the same period:
No change in fatal and serious injury crashes
15 per cent reduction in fatalities
No change in serious injuries
27 per cent reduction in pedestrian casualties.
It should also be noted, alongside the crash data discussed above, that there has also been a notable increase in traffic volumes. Over the period that red-light speed cameras have been reviewed within this report, there has been a 14 per cent increase in traffic volume across NSW.19
8.2.1 Individual red-light speed camera locations
Analysis within Appendix B identifies the following findings for individual camera locations:
Table 10: Red-light speed camera location status
Camera Status: Number of Fixed Speed Cameras
Insufficient data
A more comprehensive analysis over a longer time period is required before drawing any further conclusions.
80
5 years of “after” data is available for the camera.
Retain 72
Retain and monitor 18
Ineligible 1
Total: 171
19 Estimates for Vehicle Kilometres Travelled (VKT) estimated in Yearbook 2018: Australian Infrastructure Statistics, Statistical Report, BITRE

NSW Speed Camera Programs: 2018 Annual Review 32
The following table identifies red-light speed cameras with notable reductions in fatal / serious injury crashes:
Table 11: Top performing red-light speed cameras
Location Fatal / Serious Injury crashes Change in
FSI crashes % change
Before After Bondi Junction - Old South Head Road at Bondi Road
8 0 ↓8 ↓100%
Strathfield - Arthur Street at Centenary Drive
15 1 ↓14 ↓93.3%
Paddington / Surry Hills - South Dowling Street at Fitzroy Street / Moore Park Road
28 4 ↓24 ↓85.7%
Rozelle - Wellington Street at Victoria Road
6 1 ↓7 ↓83.3%
Pennant Hills - Pennant Hills Road at Beecroft Road (school zone)
5 1 ↓8 ↓80%
8.2.2 Red-light speed cameras identified to retain / monitor
18 locations also recorded an increase in fatal and serious injury crashes – but that was not a statistically significant result. These locations will be monitored in future years:
Bexley: Forest Road at Harrow Road
Canley Vale: Sackville Street at Canley Vale Road
Castle Hill: Showground Road at Victoria Avenue
Five Dock: Fairlight Street at Ramsay Road
Haberfield: Parramatta Road at Sloane Street
Kensington: Anzac Parade at Todman Avenue
Kirrawee: Acacia Road at President Avenue
Kogarah Bay: Park Road at Princes Highway
Marrickville: Sydenham Road at Victoria Road
Mayfield West: Pacific Highway at Maud Street
Milperra: Newbridge Road at Henry Lawson Drive
Moore Park: Anzac Parade at Lang Road
North Ryde: Wicks Road at Epping Road
Petersham: Gordon Street at New Canterbury Road
Petersham: Parramatta Road at West Street
Redfern: Chalmers Street and Cleveland Street
Ryde: Victoria Road and Devlin Street
South Wentworthville: Cumberland Highway at Old Prospect Road

September 2019 | Version: 1.0
This is the third year in a row that four of the above locations have been identified for monitoring. Additional analysis has been completed for these locations as outlined below.
Table 12: Key crash data for identified red-light speed cameras
Pre-Installation
Post-Installation
Ped
estr
ian
ca
sual
ties
Ad
jace
nt
casu
alty
cra
she
s
Rig
ht
thro
ug
h
casu
alty
cra
she
s
Rea
r en
d
casu
alty
cra
she
s
Ped
estr
ian
ca
sual
ties
Ad
jace
nt
casu
alty
cra
she
s
Rig
ht
thro
ug
h
casu
alty
cra
she
s
Rea
r en
d
casu
alty
cra
she
s
Milperra 1 1 3 8
0
2 2 15
North Ryde 0 1 0 9 0
1 1 11
Petersham (Gordon St) 1 2 3 2
3
2 1 3
Petersham (Parramatta Rd) 1 3 6 6
0
2 3 2
3 7 12 25 3 7 7 31
Percentage change: Nil. Nil. ↓ 42% ↑ 24%
8.2.2.1 Milperra (Newbridge Road)
Fatal and serious injury crashes have increased from 1 such crash in the five years prior to the installation of the camera, to 6 such crashes in the most recent five calendar years to the end of 2017. This is not a statistically significant outcome.
Two of crash types likely to be improved by the presence of a red-light speed camera (pedestrian casualties and right through crashes) have improved at this location, while two others (adjacent and rear-end casualty crashes) have worsened. Red-light running and speeding have also fallen by approximately 85 per cent and 99 per cent at this location.
Overall, these outcomes represent a substantial road safety gain, particularly considering that traffic volumes have grown by an estimated 9 per cent at this location since the camera was installed in 2010.
8.2.2.2 North Ryde (Wicks Road)
Fatal and serious injury crashes have increased from 1 such crash in the five years prior to the installation of the camera, to 6 such crashes in the most recent five calendar years to the end of 2017. This is not a statistically significant outcome.
There have been no pedestrian casualty crashes since in the last 5 years and adjacent casualty crashes have remained flat. Right through and rear-end casualty crashes have worsened. Red-light running and speeding have fallen by approximately 60 per cent and approximately 50 per cent respectively at this location.
Overall, these outcomes represent a road safety gain, particularly considering that traffic volumes have grown by an estimated 14 per cent at this location since the camera was installed in 2010.

NSW Speed Camera Programs: 2018 Annual Review 34
8.2.2.3 Petersham (Gordon Street)
There has been an increase in fatal and serious injury crashes at this location, from zero such crashes in the five years prior to the installation of the camera to 2 such crashes in the most recent five calendar years to the end of 2017. This is not a statistically significant outcome.
Right-through casualty crashes have improved at this location, while two others (pedestrian casualties and rear end casualty crashes) have worsened. The number of adjacent casualty crashes has remained constant. Red-light running has also fallen by approximately 67 per cent at this location, but speeding cannot be enforced at this location for technical reasons.
Overall, these outcomes represent a road safety gain, particularly considering that traffic volumes have grown by an estimated 9 per cent at this location since the camera was installed in 2010.
8.2.2.4 Petersham (Parramatta Road)
There has only been a small increase in fatal and serious injury crashes at this location, from 1 such crash in the five years prior to the installation of the camera to 2 such crashes in the most recent five calendar years to the end of 2017. This is not a statistically significant outcome.
However, despite the rise in the overall number of casualty crashes, the crash types likely to be improved by the presence of a red-light speed camera have improved. Red-light running and speeding have also fallen by approximately 60 per cent and 93 per cent at this location.
These outcomes represent a substantial road safety gain – although it is estimated that traffic volumes have fallen by an estimated 1 per cent at this location since the camera was installed in 2010.
8.3 Mobile speed cameras
The analysis of the mobile speed camera program is available at Appendix C.
There were 389 fatalities on NSW roads in 2017. While this was an increase on the 2016 figure (380), it remains significantly below the 2009 figure of 453 (prior to the reintroduction of mobile speed cameras in 2010).
The NSW fatality rate per 100,000 population was 4.9 in 2017. This was the same as the 2016 figure and remains significantly below the 2009 figure of 6.42.
Annual speed survey data indicate that the mobile speed camera program continues to deliver road safety benefits, compared to results prior to the reintroduction of the mobile speed camera program.
8.3.1 Light vehicles
NSW speed survey data for the last nine years shows a reduced proportion of light vehicles exceeding the speed limit, across most speed zones.
Comparing the 2017 speed survey results against those from 2016, there is also a decreased proportion of light vehicles exceeding the speed limit, for all speed zones except for in the 110km/h zone. The percentage of vehicles exceeding the speed limit by 10km/h or more has decreased in all speed zones except in the 90km/h, 100km/h and 110km/h.

NSW Speed Camera Programs: 2018 Annual Review 35
8.3.2 Heavy vehicles
The speed survey results also indicate that there has been a decrease in the proportion of heavy vehicles exceeding the speed limit over the last nine years; but while this is true for most speed zones, it is not the case for exceeding the speed limit by 10km/h or more in 100km/h and 110km/h zones.
Comparing the 2017 results against the 2016 results, there is an increased proportion of heavy vehicles exceeding the speed limit for approximately 15 per cent of the speed zones measured.
8.3.3 Infringements
In 2017 there were a total of 21,347 infringements issued from mobile speed camera enforcement resulting in $4.6 million of fines. The cost of conducting the mobile speed camera program in 2017 was $22.8 million.
The total number of mobile speed camera infringements issued in 2017 decreased by 27 per cent compared to 2016.
8.3.4 Vehicle compliance rate
In 2017 the compliance rate was 99.9%. This high rate of compliance has remained consistent since 2010 when the program was reintroduced.
Overall, the trend in road fatalities, infringements and annual speed survey data demonstrates that the mobile speed camera program has delivered road safety benefits over the years since the program was re-introduced in 2010.
8.4 Average speed cameras
The analysis of the average speed camera program is available at Appendix D.
8.4.1 Crash Data
Overall, there has been a reduction in fatal crashes and casualty crashes involving a heavy vehicle on NSW average speed enforcement lengths since those lengths were installed, compared with the five year period prior to installation.
Across heavy vehicle average speed camera lengths, there has been a:
22 per cent reduction in casualty crashes involving a heavy vehicle
44 per cent reduction in fatalities from crashes involving heavy vehicles
4 per cent reduction in serious injuries from crashes involving heavy vehicles.
The reduction in fatalities and serious injuries represents a saving of $138 million to the community.
The trauma reductions at camera locations compare to the following rates of change observed across NSW over the same period for crashes involving heavy vehicles:
10 per cent reduction in casualty crashes involving a heavy vehicle
19 per cent reduction in fatalities from crashes involving heavy vehicles
10 per cent increase in serious injuries from crashes involving heavy vehicles.
It should also be noted, alongside the crash data discussed above, that there has also been a notable increase in heavy vehicle traffic volumes. Over the period that heavy vehicle average speed enforcement lengths have been reviewed within this

NSW Speed Camera Programs: 2018 Annual Review 36
report, there has been an 11 per cent increase in heavy vehicle volume across NSW.20
8.4.2 Infringement Data
A total of 2,130 speeding infringements, resulting in total fines of $1,033,608, were issued at NSW average speed camera lengths in 2017.
Overall, there has been a reduction in fatal crashes and casualty crashes involving a heavy vehicle on NSW average speed enforcement lengths since those lengths were installed, compared with the five year period prior to installation.
This represents a particularly notable road safety improvement when compared to NSW heavy vehicle volumes, which have risen 11 per cent over the same period.21
NSW is currently expanding the heavy vehicle average speed camera program to metropolitan areas, and CRS will continue to monitor the program.
20 Estimates for Vehicle Kilometres Travelled (VKT) estimated in Yearbook 2018: Australian Infrastructure Statistics, Statistical Report, BITRE 21 Estimates for Vehicle Kilometres Travelled (VKT) estimated in Yearbook 2018: Australian Infrastructure Statistics, Statistical Report, BITRE

NSW Speed Camera Programs Annual Review 2018 – Appendix A: Fixed speed cameras A1
A. NSW fixed speed cameras
A.1 The NSW fixed speed camera program
As at 31 December 2017, there were 139 fixed speed cameras in place at 110 locations across NSW. The median installation date for NSW fixed speed cameras was 30 April 2003.
Fixed speed cameras are located at specified road lengths where there is a demonstrated crash history or a high crash risk, to detect and deter speeding at specific locations.
In managing the program, Roads and Maritime Services (RMS) may increase the warning letter period and/or use Variable Message Signs to increase driver awareness of camera locations, where the trend in warning letters or number of infringements issued deems this appropriate. RMS also conducts ongoing site maintenance to ensure that signage is effectively placed and not obscured by roadside objects, such as trees.
A table outlining the detailed analysis of 98 NSW fixed speed camera locations is provided overleaf, and data about those individual camera locations are provided on pages A7 – A104.
Detailed analysis is not provided for 12 fixed speed camera locations, for the following reasons:
Seven locations are currently operating in warning mode.1 This report includes information on crashes, warning letters and infringements at these locations within sections A4 & A5.
Five locations are located in tunnels (and were sometimes referred to in the review as “high risk” locations). These cameras were generally installed when the tunnel was constructed, therefore no pre-installation data are available. Post installation crash and infringement data for these locations is presented at section A6.
1 For speed cameras operating in warning mode, warning letters are issued to motorists detected speeding, unless they exceed the speed limit by more than 30km/h, in which case a court attendance notice is issued and drivers face significant penalties. A three-strikes system also applies, where if a registered operator of a vehicle is issued two warning letters from the one camera location, an infringement will be issued for a third offence and any further offences at that location.

NSW Speed Camera Programs Annual Review 2018 – Appendix A: Fixed speed cameras A2
A.2 NSW fixed speed camera locations
Location Cameras Road Status Page 1 Ashfield (sz) 1 Hume Highway, between Murrell Street and Queen Street Retain A7
2 Auburn 1 Parramatta Road, between Harbord Street and Duck Street Retain A8
3 Bankstown (sz) 2 Hume Highway, between Rookwood Road and Stacey Street Retain A9
4 Bar Point 1 M1 Pacific Motorway, between Jolls Bridge and Mt White Exit Ramp Retain A10
5 Ben Lomond 1 New England Highway, between Ross Road and Ben Lomond Road Retain A11
6 Berkshire Park 1 Richmond Road, between Llandilo Road and Sanctuary Drive Retain A12
7 Berry 1 Princes Highway, between Kangaroo Valley Road and Victoria Street Ineligible A13
8 Beverly Hills (sz) 2 King Georges Road, between Stoney Creek Road and Edgbaston Road Retain A14
9 Bexley North 1 Bexley Road, between Kingsland Road North and Miller Avenue Retain A15
10 Blandford 1 New England Highway, between Hayles Street and Mills Street Retain A16
11 Bomaderry 1 Bolong Road, between Beinda Street and Coomea Street Ineligible A17
12 Bonnyrigg (sz) 1 Cabramatta Road, between Katinka Street and Tarlington Parade Retain and monitor A18
13 Bonnyrigg 1 Elizabeth Drive, between Brown Road and Humphries Road Retain and monitor A19
14 Brogo 1 Princes Highway, between Pioneer Close and Brogo River Ineligible A20
15 Bulli 1 Princes Highway, between Grevillea Park Road and Black Diamond Place Retain A21
16 Burringbar 1 Tweed Valley Way, between Blakeneys Road and Cooradilla Road Ineligible A22
17 Burwood Heights 1 Hume Highway, between Kelso Street and Appian Way Retain A23
18 Camellia 1 James Ruse Drive, between Victoria Road and Grand Avenue North Retain A24
19 Canterbury 1 Canterbury Road, between Gould Street and Jeffrey Street Retain A25
20 Caringbah 1 Captain Cook Drive, between Cawarra Road and Gannons Road Retain A26
21 Carlingford 1 Pennant Hills Road, between Evans Road and Coleman Avenue Retain A27
22 Castle Hill (sz) 1 Old Northern Road, between Telfer Road and Brisbane Road Retain A28

NSW Speed Camera Programs Annual Review 2018 – Appendix A: Fixed speed cameras A3
Location Cameras Road Status Page 23 Charmhaven 1 Pacific Highway, between Wallarah Creek and Lowana Avenue Retain A29
24 Concord West 1 Concord Road, between Nirranda Street and Mepunga Street Retain A30
25 Condell Park (sz) 1 Edgar Street, between Augusta Street and Upper Railway Parade Retain A31
26 Corrimal 2 Northern Distributor (Memorial Drive), between Towradgi Road and Railway Street Retain A32
27 East Gardens/ Maroubra (sz) 2 Bunnerong Road, between Fitzgerald Avenue and Smith Street Retain A33
28 Edgecliff 1 New South Head Road, between Waratah Street and New Beach Road Retain A34
29 Engadine 1 Heathcote Road, between Forum Drive and New Illawarra Road Insufficient data A35
30 Ewingsdale 1 Pacific Highway, between St Helena Road and Ewingsdale Road. Insufficient data A36
31 Fairfield East 1 Fairfield Street, between Scott Street and Mandarin Street Retain A37
32 Foxground 1 Princes Highway, between Foxground Road and Broughton Creek Retain A38
33 Gateshead (sz) 1 Pacific Highway, between Sydney Street and Macquarie Avenue Ineligible A39
34 Greystanes 1 Greystanes Road, between Merrylands Road and Old Prospect Road Retain A40
35 Guildford (sz) 2 Woodville Road, between Kenelda Avenue and Osgood Street Retain A41
36 Gwynneville 1 M1 Princes Motorway, between Northern Distributor Overpass and Gipps Road Overpass (northbound) Retain A42
37 Gwynneville 1 M1 Princes Motorway, University Avenue Overpass and Mount Ousley Road (southbound) Retain A43
38 Hartley 1 Great Western Highway, between Mid Hartley Road and Blackmans Creek Road Retain A44
39 Hungry Head 1 Pacific Highway, between Boundary Road and Ballards Road Ineligible A45
40 Hurstville (sz) 1 Forest Road, between Lily Street and Cronulla Street Ineligible A46
41 Kingswood (sz) 2 Parker Street, between Copeland Street and Gascoigne Street Retain A47
42 Kogarah (sz) 2 Princes Highway, between Gray Street and President Avenue Retain A48
43 Korora 1 Pacific Highway, between Bruxner Park Road and Korora Basin Road Retain A49
44 Kurrajong 1 Bells Line of Road, between Queen Street and Bellbird Avenue Retain A50
45 Lane Cove 1 Centennial Avenue, between Gentle Street and Figtree Street Retain A51

NSW Speed Camera Programs Annual Review 2018 – Appendix A: Fixed speed cameras A4
Location Cameras Road Status Page 46 Lansvale 1 Hume Highway, between Henry Lawson Drive and Knight Street Retain A52
47 Lindfield (sz) 2 Pacific Highway, between Eton Road and Gladstone Parade Retain A53
48 Liverpool (sz) 1 Bigge Street, between Elizabeth Drive and Campbell Street Retain A54
49 Lochinvar (sz) 1 New England Highway, between Robert Road and Station Lane Retain A55
50 Maroubra (sz) 2 Malabar Road, between Mons Avenue and Duncan Street Retain A56
51 Mayfield West 1 Pacific Highway, between Werribee Street and Tourle Street Retain A57
52 Merrylands (sz) 1 Merrylands Road, between Chetwynd Road and Davies Street Retain A58
53 Miranda (sz) 2 Kingsway, between Sylva Avenue and University Road Retain A59
54 Moore Park (sz) 2 Cleveland Street, between Anzac Parade and South Dowling Street Retain A60
55 Mosman (sz) 1 Macpherson Street, between Ourimbah Road and Montague Road Retain A61
56 Mount Victoria 1 Great Western Highway, between Mitchells Lookout Road and Ambermere Drive Retain A62
57 Narrabeen (sz) 2 Pittwater Road, between Ocean Street and Devitt Street Insufficient data A63
58 Narraweena 1 Warringah Road, near the intersection with May Road Retain A64
59 New Italy 2 Pacific Highway, between New Italy Road and Turners Road Insufficient data A65
60 Nords Wharf 1 Pacific Highway, between Nords Wharf Road and Flowers Drive Retain A66
61 North Curl Curl (sz) 1 Harbord Road, between Abbott Road and Brighton Street Retain A67
62 North Macksville 1 Pacific Highway, between Bellview Drive and Ferry Street Insufficient data A68
63 North Macksville 1 Pacific Highway, between Florence Wilmont Drive and Watt Creek Retain A69
64 North Narrabeen (sz) 2 Pittwater Road, between Garden Street and Namona Street Retain A70
65 North Parramatta 1 Pennant Hills Road, between Castle Street and Bellevue Street Ineligible A71
66 North Parramatta / Oatlands(sz) 2 Pennant Hills Road, between Masons Drive and Suttor Avenue Retain A72
67 North Wollongong 1 Princes Highway, between Ajax Avenue and Exeter Avenue Retain A73
68 Old Guildford (sz) 2 Woodville Road, between Orchardleigh Street and Middleton Road Retain A74

NSW Speed Camera Programs Annual Review 2018 – Appendix A: Fixed speed cameras A5
Location Cameras Road Status Page 69 Ourimbah 1 M1 Pacific Motorway, between Dogtrap Road Overpass and Ourimbah Creek Road Retain A75
70 Ourimbah (sz) 2 Pacific Highway, between Yates Road and Dog Trap Road Retain A76
71 Padstow 1 Gibson Avenue, between Turvey Street and Bryant Street, Padstow Retain A77
72 Peakhurst 1 Henry Lawson Drive, between Belmont Road and Ogilvy Street Retain A78
73 Penshurst (sz) 1 Forest Road, between Penshurst Street and St Georges Street Retain A79
74 Picnic Point 1 Henry Lawson Drive, between Carinya Road and The River Road Retain A80
75 Queanbeyan 1 Lanyon Drive, between Tompsitt Drive and Hoover Road Retain A81
76 Randwick (sz) 1 Avoca Street, between Howard Street and Barker Road Ineligible A82
77 Rankin Park 1 McCaffrey Drive, between Duval Street and Orara Street Retain A83
78 Rosebery/Alexandria (sz) 2 Botany Road, between Gardeners Road and Gillespie Street Retain A84
79 Rydalmere (sz) 2 Victoria Road, between Park Road and John Road Retain A85
80 Ryde 1 Blaxland Road, between Reservoir Lane and North Road Ineligible A86
81 Ryde (sz) 2 Victoria Road, between Margaret Street and Cressy Road Retain A87
82 Sandgate 2 Pacific Highway, between Wallsend Road and Ironbark Creek Retain A88
83 South Windsor 1 George Street, between Rickaby Street and Yarrawonga Street Ineligible A89
84 Strathfield (sz) 1 The Boulevarde, between Torrington Parade and Russell Street Retain A90
85 Tenterfield 1 New England Highway, between Duncan Street and George Street Retain A91
86 Terrigal (sz) 1 Terrigal Drive, between Brunswick Road and Bellbird Avenue Ineligible A92
87 Toongabbie (sz) 2 Fitzwilliam Road, between Reynolds Street and Binalong Road Retain A93
88 Valla Beach 1 Pacific Highway, between Valla Beach Road and Oyster Creek Ineligible A94
89 Valley Heights 1 Great Western Highway, between The Valley Road and Sun Valley Road Retain A95
90 Wahroonga (sz) 2 Pacific Highway, between Gilda Avenue and Woodville Avenue Retain A96
91 Wardell 1 Pacific Highway, between Riverside Drive and Carlisle Street Retain A97

NSW Speed Camera Programs Annual Review 2018 – Appendix A: Fixed speed cameras A6
Location Cameras Road Status Page 92 Warrawong 1 Northcliffe Drive, between Griffin Street and Kully Street Retain A98
93 West Pennant Hills 1 Castle Hill Road, between Pennant Hills Road and Coonara Avenue Retain A99
94 Wollongbar 1 Bruxner Highway, between Convernys Lane and McLeans Ridges Road Retain A100
95 Wollongong (sz) 1 Princes Highway, between Mount Keira Road and Highway Avenue Retain A101
96 Woodburn 1 Pacific Highway, between Sussex Street and Richmond Street Retain A102
97 Wyoming (sz) 1 Henry Parry Drive, between Glennie Street and Dwyer Street Retain A103
98 Yagoona 1 Hume Highway, between Smith Street and Brennan Avenue Retain A104
Total: 121
Crash and infringement data for these 98 camera locations are individually presented overleaf.
(sz: school zone)

9820: Ashfield - Hume Highway, between Murrell Street and Queen Street
School zone: Ashfield Public SchoolThis location is 410m (patch to patch) in length, and is enforced with one camera.The camera commenced operating on 7 August 2007.
18 15
0 0
3 6
4 8
3 4
9
Fatalities
Serious
Moderate
Minor/Other
Uncategorised
Casualty Crashes
Casualties and Casualty Crashes
Casualty Cost:
Infringements by Month
0
100
200
300
400
500
600
700
800
900
Aug-07
Aug-08
Aug-09
Aug-10
Aug-11
Aug-12
Aug-13
Aug-14
Aug-15
Aug-16
Aug-17
Month-Year
Infr
ingem
ents
per
Month
Casualties and Casualty Crashes
0
1
2
3
4
5
6
7
8
-5Y
-4Y
-3Y
-2Y
-1Y
2008
2009
2010
2011
2012
2013
2014
2015
2016
2017
Number of years before and calendar year after camera installation
Num
ber
of casualti
es/c
asualty
cra
shes
Uncategorised M inor/Other M oderate InjurySerious Injury Killed Casualty Crash
Total Injuries 19 18
-
↓ 5%
↓ 17%
Count Percentage Change²
$4.02M $3.81M ↓ 5%
¹ Ending 7 May 2007, 3 calendar months before installation.² The percentage change is based on annualised crash data to allow for a direct comparison between the pre and post installation time periods. Red values indicate an increase.
5 years before installation¹
• When comparing the pre installation period to the most recent five year period, there has been a 17% decrease in casualty crashes at this fixed speed camera location. The data presented do not account for the prevailing statewide trend.• The infringement graph details the trend in infringements at this location since the camera began
operating. Roadworks and camera maintenance may influence the number of infringements issued. • This location was reviewed in 2013 due to concerns about the increase in casualties in recent years. In
the 2013 review it was recommended that the speed camera be retained.
Status : Retain
5 years to end 2017
-
(There has been no increase in casualty crashes.)
Annual NSW Speed Camera Review 2018 - Appendix A: Fixed Speed Cameras A7

9534: Auburn - Parramatta Road, between Harbord Street and Duck Street
This location is 1000m in length, and is enforced with one camera.The camera commenced operating on 15 May 2002.
57 40
0 1
- 13
- 8
- 29
79
Fatalities
Serious
Moderate
Minor/Other
Uncategorised
Casualty Crashes
Casualties and Casualty Crashes
Casualty Cost:
Infringements by Month
0
500
1000
1500
2000
2500
3000
3500
4000
4500
5000
Jul-02
Jul-03
Jul-04
Jul-05
Jul-06
Jul-07
Jul-08
Jul-09
Jul-10
Jul-11
Jul-12
Jul-13
Jul-14
Jul-15
Jul-16
Jul-17
Month-Year
Infr
ingem
ents
per
Month
Casualties and Casualty Crashes
0
5
10
15
20
25
30
35
-5Y
-3Y
-1Y
2004
2006
2008
2010
2012
2014
2016
Number of years before and calendar year after camera installation
Num
ber
of casualti
es/c
asualty
cra
shes
Uncategorised M inor/Other M oderate InjurySerious Injury Killed Casualty Crash
Total Injuries 79 50
Increase
↓ 37%
↓ 30%
Count Percentage Change²
$16.72M $18.18M ↑ 9%
¹ Ending 15 February 2002, 3 calendar months before installation.² The percentage change is based on annualised crash data to allow for a direct comparison between the pre and post installation time periods. Red values indicate an increase.
5 years before installation¹
• When comparing the pre installation period to the most recent five year period, there has been a 30% decrease in casualty crashes at this fixed speed camera location. The data presented do not account for the prevailing statewide trend.• The infringement graph details the trend in infringements at this location since July 2002. Infringement
data before this date is not available. Roadworks and camera maintenance may influence the number of infringements issued.
Status : Retain
5 years to end 2017
-
(There has been no increase in casualty crashes.)
Annual NSW Speed Camera Review 2018 - Appendix A: Fixed Speed Cameras A8

9818|9819: Bankstown - Hume Highway, between Rookwood Road and Stacey Street
School zone: Bankstown North Public School, La Salle Catholic SchoolThis location is 670m patch to patch in length, and is enforced by 2 cameras.Both cameras commenced operating on 4 July 2007.
57 54
0 0
4 11
17 19
10 31
41
Fatalities
Serious
Moderate
Minor/Other
Uncategorised
Casualty Crashes
Casualties and Casualty Crashes
Casualty Cost:
Infringements by Month
0
2000
4000
6000
8000
10000
12000
Jul-07
Jul-08
Jul-09
Jul-10
Jul-11
Jul-12
Jul-13
Jul-14
Jul-15
Jul-16
Jul-17
Month-Year
Infr
ingem
ents
per
Month
Casualties and Casualty Crashes
0
2
4
6
8
10
12
14
16
18
20
-5Y
-4Y
-3Y
-2Y
-1Y
2008
2009
2010
2011
2012
2013
2014
2015
2016
2017
Number of years before and calendar year after camera installation
Num
ber
of casualti
es/c
asualty
cra
shes
Uncategorised M inor/Other M oderate InjurySerious Injury Killed Casualty Crash
Total Injuries 72 61
-
↓ 15%
↓ 5%
Count Percentage Change²
$15.24M $12.91M ↓ 15%
¹ Ending 4 April 2007, 3 calendar months before installation.² The percentage change is based on annualised crash data to allow for a direct comparison between the pre and post installation time periods. Red values indicate an increase.
5 years before installation¹
• When comparing the pre installation period to the most recent five year period, there has been a 5% decrease in casualty crashes at this fixed speed camera location. The data presented do not account for the prevailing statewide trend.• The infringement graph details the trend in infringements at this location since the camera began
operating. Roadworks and camera maintenance may influence the number of infringements issued. • This location was reviewed in 2013 due to concerns about the increase in casualties in recent years. The
review found that during 2011 there were 28 casualties. This significant increase in the number of casualties included one crash involving a bus, resulting in 11 casualties. The number of casualty crashes has reduced in the following years. Speeding infringements were also found to have significantly reduced following the introduction of the speed cameras. It was recommended that the speed cameras be retained.
Status : Retain
5 years to end 2017
-
(There has been no increase in casualty crashes.)
Annual NSW Speed Camera Review 2018 - Appendix A: Fixed Speed Cameras A9

9616: Bar Point - M1 Pacific Motorway, between Jolls Bridge and Mt White Exit Ramp
This location is 1000m in length, and is enforced with one camera.The camera commenced operating on 10 April 2006.
15 12
1 0
0 4
0 7
0 4
16
Fatalities
Serious
Moderate
Minor/Other
Uncategorised
Casualty Crashes
Casualties and Casualty Crashes
Casualty Cost:
Infringements by Month
0
50
100
150
200
250
Jun-06
Jun-07
Jun-08
Jun-09
Jun-10
Jun-11
Jun-12
Jun-13
Jun-14
Jun-15
Jun-16
Jun-17
Month-Year
Infr
ingem
ents
per
Month
Casualties and Casualty Crashes
0
1
2
3
4
5
6
7
8
9
10
-5Y
-4Y
-3Y
-2Y
-1Y
2007
2008
2009
2010
2011
2012
2013
2014
2015
2016
2017
Number of years before and calendar year after camera installation
Num
ber
of casualti
es/c
asualty
cra
shes
Uncategorised M inor/Other M oderate InjurySerious Injury Killed Casualty Crash
Total Injuries 16 15
↓ 100%
↓ 6%
↓ 20%
Count Percentage Change²
$10.99M $3.18M ↓ 71%
¹ Ending 10 January 2006, 3 calendar months before installation.² The percentage change is based on annualised crash data to allow for a direct comparison between the pre and post installation time periods. Red values indicate an increase.
5 years before installation¹
• When comparing the pre installation period to the most recent five year period, there has been a 20% decrease in casualty crashes at this fixed speed camera location. The data presented do not account for the prevailing statewide trend.• The infringement graph details the trend in infringements at this location since the camera began
operating. Roadworks and camera maintenance may influence the number of infringements issued.
Status : Retain
5 years to end 2017
-
(There has been no increase in casualty crashes.)
Annual NSW Speed Camera Review 2018 - Appendix A: Fixed Speed Cameras A10

9563: Ben Lomond - New England Highway, between Ross Road and Ben Lomond Road
This location is 1000m in length, and is enforced with one camera.The camera commenced operating on 4 September 2003.
5 0
2 0
- 0
- 0
- 0
8
Fatalities
Serious
Moderate
Minor/Other
Uncategorised
Casualty Crashes
Casualties and Casualty Crashes
Casualty Cost:
Infringements by Month
0
5
10
15
20
25
30
35
40
Sep-03
Sep-04
Sep-05
Sep-06
Sep-07
Sep-08
Sep-09
Sep-10
Sep-11
Sep-12
Sep-13
Sep-14
Sep-15
Sep-16
Sep-17
Month-Year
Infr
ingem
ents
per
Month
Casualties and Casualty Crashes
0
1
2
3
4
5
6
-5Y
-4Y
-3Y
-2Y
-1Y
2004
2005
2006
2007
2008
2009
2010
2011
2012
2013
2014
2015
2016
2017
Number of years before and calendar year after camera installation
Num
ber
of casualti
es/c
asualty
cra
shes
Uncategorised M inor/Other M oderate InjurySerious Injury Killed Casualty Crash
Total Injuries 8 0
↓ 100%
↓ 100%
↓ 100%
Count Percentage Change²
$16.89M $0 ↓ 100%
¹ Ending 4 June 2003, 3 calendar months before installation.² The percentage change is based on annualised crash data to allow for a direct comparison between the pre and post installation time periods. Red values indicate an increase.
5 years before installation¹
• When comparing the pre installation period to the most recent five year period, there has been a 100% decrease in casualty crashes at this fixed speed camera location. The data presented do not account for the prevailing statewide trend.• The infringement graph details the trend in infringements at this location since the camera began
operating. Roadworks and camera maintenance may influence the number of infringements issued.
Status : Retain
5 years to end 2017
-
(There has been no increase in casualty crashes.)
Annual NSW Speed Camera Review 2018 - Appendix A: Fixed Speed Cameras A11

9643: Berkshire Park - Richmond Road, between Llandilo Road and Sanctuary Drive
This location is 1000m in length, and is enforced with one camera.The camera commenced operating on 30 June 2000.
13 14
1 0
- 11
- 8
- 5
18
Fatalities
Serious
Moderate
Minor/Other
Uncategorised
Casualty Crashes
Casualties and Casualty Crashes
Casualty Cost:
Infringements by Month
0
10
20
30
40
50
60
70
80
90
100
Aug-02
Aug-03
Aug-04
Aug-05
Aug-06
Aug-07
Aug-08
Aug-09
Aug-10
Aug-11
Aug-12
Aug-13
Aug-14
Aug-15
Aug-16
Aug-17
Month-Year
Infr
ingem
ents
per
Month
Casualties and Casualty Crashes
0
2
4
6
8
10
12
-4Y
-2Y
2001
2003
2005
2007
2009
2011
2013
2015
2017
Number of years before and calendar year after camera installation
Num
ber
of casualti
es/c
asualty
cra
shes
Uncategorised M inor/Other M oderate InjurySerious Injury Killed Casualty Crash
Total Injuries 18 24
↓ 100%
↑ 7%
↓ 14%
Count Percentage Change²
$11.41M $5.08M ↓ 64%
¹ Ending 30 March 2000, 3 calendar months before installation.² The percentage change is based on annualised crash data to allow for a direct comparison between the pre and post installation time periods. Red values indicate an increase.
4 years before installation¹
• When comparing the pre installation period to the most recent five year period, there has been a 14% decrease in casualty crashes at this fixed speed camera location. The data presented do not account for the prevailing statewide trend.• The infringement graph details the trend in infringements at this location since July 2002. Infringement
data before this date is not available. Roadworks and camera maintenance may influence the number of infringements issued. • This location was reviewed in 2014. The safety review found that the speed camera continues to provide
safety benefits and it was recommended that the speed camera be retained.
Status : Retain
5 years to end 2017
-
(There has been no increase in casualty crashes.)
Annual NSW Speed Camera Review 2018 - Appendix A: Fixed Speed Cameras A12

9590: Berry - Princes Highway, between Kangaroo Valley Road and Victoria Street
This location is 1000m in length, and is enforced with one camera.The camera commenced operating on 28 April 2003.
5 2
0 0
- 0
- 2
- 0
8
Fatalities
Serious
Moderate
Minor/Other
Uncategorised
Casualty Crashes
Casualties and Casualty Crashes
Casualty Cost:
Infringements by Month
0
200
400
600
800
1000
1200
1400
1600
1800
2000
Sep-03
Sep-04
Sep-05
Sep-06
Sep-07
Sep-08
Sep-09
Sep-10
Sep-11
Sep-12
Sep-13
Sep-14
Sep-15
Sep-16
Sep-17
Month-Year
Infr
ingem
ents
per
Month
Casualties and Casualty Crashes
0
1
2
3
4
5
-5Y
-4Y
-3Y
-2Y
-1Y
2004
2005
2006
2007
2008
2009
2010
2011
2012
2013
2014
2015
2016
2017
Number of years before and calendar year after camera installation
Num
ber
of casualti
es/c
asualty
cra
shes
Uncategorised M inor/Other M oderate InjurySerious Injury Killed Casualty Crash
Total Injuries 8 2
-
↓ 75%
↓ 60%
Count Percentage Change²
$1.69M $0.42M ↓ 75%
¹ Ending 28 January 2003, 3 calendar months before installation.² The percentage change is based on annualised crash data to allow for a direct comparison between the pre and post installation time periods. Red values indicate an increase.
5 years before installation¹
• When comparing the pre installation period to the most recent five year period, there has been a 60% decrease in casualty crashes at this fixed speed camera location. The data presented do not account for the prevailing statewide trend.• The infringement graph details the trend in infringements at this location since the camera began
operating. Roadworks and camera maintenance may influence the number of infringements issued. • In 2015, major traffic works commenced at this location for the construction of the Foxground and Berry
bypass. The camera and accompanying signage has been removed for the works. The location will be reviewed once works are complete and a final decision will be made about the need for ongoing enforcement.
Status : Ineligible
5 years to end 2017
-
(There is currently a review underway at this location.)
Annual NSW Speed Camera Review 2018 - Appendix A: Fixed Speed Cameras A13

9822|9823: Beverly Hills - King Georges Road, between Stoney Creek Road and Edgbaston Road
School zone: Beverly Hills Girls High SchoolThis location is 1040m patch to patch in length, and is enforced by 2 cameras.The cameras commenced operating on: • Camera 1 (northbound) 9 July 2007 • Camera 2 (southbound) 20 July 2007
84 57
1 0
6 11
31 24
24 33
62
Fatalities
Serious
Moderate
Minor/Other
Uncategorised
Casualty Crashes
Casualties and Casualty Crashes
Casualty Cost:
Infringements by Month
0
2000
4000
6000
8000
10000
12000
14000
16000
18000
Jul-07
Jul-08
Jul-09
Jul-10
Jul-11
Jul-12
Jul-13
Jul-14
Jul-15
Jul-16
Jul-17
Month-Year
Infr
ingem
ents
per
Month
Casualties and Casualty Crashes
0
5
10
15
20
25
30
35
40
-5Y
-4Y
-3Y
-2Y
-1Y
2008
2009
2010
2011
2012
2013
2014
2015
2016
2017
Number of years before and calendar year after camera installation
Num
ber
of casualti
es/c
asualty
cra
shes
Uncategorised M inor/Other M oderate InjurySerious Injury Killed Casualty Crash
Total Injuries 123 68
↓ 100%
↓ 45%
↓ 32%
Count Percentage Change²
$33.64M $14.39M ↓ 57%
¹ Ending 9 April 2007, 3 calendar months before installation.² The percentage change is based on annualised crash data to allow for a direct comparison between the pre and post installation time periods. Red values indicate an increase.
5 years before installation¹
• When comparing the pre installation period to the most recent five year period, there has been a 32% decrease in casualty crashes at this fixed speed camera location. The data presented do not account for the prevailing statewide trend.• The infringement graph details the trend in infringements at this location since the camera began
operating. Roadworks and camera maintenance may influence the number of infringements issued.
Status : Retain
5 years to end 2017
-
(There has been no increase in casualty crashes.)
Annual NSW Speed Camera Review 2018 - Appendix A: Fixed Speed Cameras A14

9617: Bexley North - Bexley Road, between Kingsland Road North and Miller Avenue
This location is 1000m in length, and is enforced with one camera.The camera commenced operating on 29 May 2006.
29 13
1 0
3 4
5 11
1 2
34
Fatalities
Serious
Moderate
Minor/Other
Uncategorised
Casualty Crashes
Casualties and Casualty Crashes
Casualty Cost:
Infringements by Month
0
200
400
600
800
1000
1200
May-06
May-07
May-08
May-09
May-10
May-11
May-12
May-13
May-14
May-15
May-16
May-17
Month-Year
Infr
ingem
ents
per
Month
Casualties and Casualty Crashes
0
2
4
6
8
10
12
14
16
18
-5Y
-4Y
-3Y
-2Y
-1Y
2007
2008
2009
2010
2011
2012
2013
2014
2015
2016
2017
Number of years before and calendar year after camera installation
Num
ber
of casualti
es/c
asualty
cra
shes
Uncategorised M inor/Other M oderate InjurySerious Injury Killed Casualty Crash
Total Injuries 43 17
↓ 100%
↓ 60%
↓ 55%
Count Percentage Change²
$16.70M $3.60M ↓ 78%
¹ Ending 1 March 2006, 3 calendar months before installation.² The percentage change is based on annualised crash data to allow for a direct comparison between the pre and post installation time periods. Red values indicate an increase.
5 years before installation¹
• When comparing the pre installation period to the most recent five year period, there has been a 55% decrease in casualty crashes at this fixed speed camera location. The data presented do not account for the prevailing statewide trend.• The infringement graph details the trend in infringements at this location since the camera began
operating. Roadworks and camera maintenance may influence the number of infringements issued.
Status : Retain
5 years to end 2017
-
(There has been no increase in casualty crashes.)
Annual NSW Speed Camera Review 2018 - Appendix A: Fixed Speed Cameras A15

9579: Blandford - New England Highway, between Hayles Street and Mills Street
This location is 1000m in length, and is enforced with one camera.The camera commenced operating on 10 April 2002.
3 0
0 0
- 0
- 0
- 0
3
Fatalities
Serious
Moderate
Minor/Other
Uncategorised
Casualty Crashes
Casualties and Casualty Crashes
Casualty Cost:
Infringements by Month
0
20
40
60
80
100
120
Apr-03
Apr-04
Apr-05
Apr-06
Apr-07
Apr-08
Apr-09
Apr-10
Apr-11
Apr-12
Apr-13
Apr-14
Apr-15
Apr-16
Apr-17
Month-Year
Infr
ingem
ents
per
Month
Casualties and Casualty Crashes
0
1
2
-5Y
-3Y
-1Y
2004
2006
2008
2010
2012
2014
2016
Number of years before and calendar year after camera installation
Num
ber
of casualti
es/c
asualty
cra
shes
Uncategorised M inor/Other M oderate InjurySerious Injury Killed Casualty Crash
Total Injuries 3 0
-
↓ 100%
↓ 100%
Count Percentage Change²
$0.64M $0 ↓ 100%
¹ Ending 10 January 2002, 3 calendar months before installation.² The percentage change is based on annualised crash data to allow for a direct comparison between the pre and post installation time periods. Red values indicate an increase.
5 years before installation¹
• When comparing the pre installation period to the most recent five year period, there has been a 100% decrease in casualty crashes at this fixed speed camera location. The data presented do not account for the prevailing statewide trend.• The infringement graph details the trend in infringements at this location since July 2002. Infringement
data before this date is not available. Roadworks and camera maintenance may influence the number of infringements issued.
Status : Retain
5 years to end 2017
-
(There has been no increase in casualty crashes.)
Annual NSW Speed Camera Review 2018 - Appendix A: Fixed Speed Cameras A16

9594: Bomaderry - Bolong Road, between Beinda Street and Coomea Street
This location is 1000m in length, and is enforced with one camera.The camera commenced operating on 31 March 2003.
7 11
1 0
- 3
- 5
- 4
9
Fatalities
Serious
Moderate
Minor/Other
Uncategorised
Casualty Crashes
Casualties and Casualty Crashes
Casualty Cost:
Infringements by Month
0
50
100
150
200
250
300
350
Mar-03
Mar-04
Mar-05
Mar-06
Mar-07
Mar-08
Mar-09
Mar-10
Mar-11
Mar-12
Mar-13
Mar-14
Mar-15
Mar-16
Mar-17
Month-Year
Infr
ingem
ents
per
Month
Casualties and Casualty Crashes
0
1
2
3
4
5
6
7
-5Y
-4Y
-3Y
-2Y
-1Y
2004
2005
2006
2007
2008
2009
2010
2011
2012
2013
2014
2015
2016
2017
Number of years before and calendar year after camera installation
Num
ber
of casualti
es/c
asualty
cra
shes
Uncategorised M inor/Other M oderate InjurySerious Injury Killed Casualty Crash
Total Injuries 9 12
↓ 100%
↑ 33%
↑ 57%
Count Percentage Change²
$9.50M $2.54M ↓ 73%
¹ Ending 31 December 2002, 3 calendar months before installation.² The percentage change is based on annualised crash data to allow for a direct comparison between the pre and post installation time periods. Red values indicate an increase.
5 years before installation¹
• When comparing the pre installation period to the most recent five year period, there has been a 57% increase in casualty crashes at this fixed speed camera location. The increase in casualty crashes is not statistically signficant. The data presented do not account for the prevailing statewide trend.• The infringement graph details the trend in infringements at this location since the camera began
operating. Roadworks and camera maintenance may influence the number of infringements issued.
Status : Ineligible
5 years to end 2017
-
(There is currently a review underway at this location.)
Annual NSW Speed Camera Review 2018 - Appendix A: Fixed Speed Cameras A17

9832: Bonnyrigg - Cabramatta Road, between Katinka Street and Tarlington Parade
School zone: Bonnyrigg High School, Our Lady of Mt Carmel Primary SchoolThis location is 1000m (patch to patch) in length, and is enforced with one camera.The camera commenced operating on 17 October 2007.
25 28
0 0
6 5
13 14
6 15
26
Fatalities
Serious
Moderate
Minor/Other
Uncategorised
Casualty Crashes
Casualties and Casualty Crashes
Casualty Cost:
Infringements by Month
0
500
1000
1500
2000
2500
3000
3500
Oct-07
Oct-08
Oct-09
Oct-10
Oct-11
Oct-12
Oct-13
Oct-14
Oct-15
Oct-16
Oct-17
Month-Year
Infr
ingem
ents
per
Month
Casualties and Casualty Crashes
0
5
10
15
20
25
30
-5Y
-4Y
-3Y
-2Y
-1Y
2008
2009
2010
2011
2012
2013
2014
2015
2016
2017
Number of years before and calendar year after camera installation
Num
ber
of casualti
es/c
asualty
cra
shes
Uncategorised M inor/Other M oderate InjurySerious Injury Killed Casualty Crash
Total Injuries 51 34
-
↓ 33%
↑ 12%
Count Percentage Change²
$10.80M $7.20M ↓ 33%
¹ Ending 17 July 2007, 3 calendar months before installation.² The percentage change is based on annualised crash data to allow for a direct comparison between the pre and post installation time periods. Red values indicate an increase.
5 years before installation¹
• When comparing the pre installation period to the most recent five year period, there has been a 12% increase in casualty crashes at this fixed speed camera location. The increase in casualty crashes is not statistically signficant. The data presented do not account for the prevailing statewide trend.• The infringement graph details the trend in infringements at this location since the camera began
operating. Roadworks and camera maintenance may influence the number of infringements issued.
Status : Retain and monitor
5 years to end 2017
-
(There has been an increase in casualty crashes at this location, but the increase is not statistically significant. This location has not previously identified for review.)
Annual NSW Speed Camera Review 2018 - Appendix A: Fixed Speed Cameras A18

9645: Bonnyrigg - Elizabeth Drive, between Brown Road and Humphries Road
This location is 1000m in length, and is enforced with one camera.The camera commenced operating on 7 July 2000.
12 21
2 0
- 3
- 18
- 7
18
Fatalities
Serious
Moderate
Minor/Other
Uncategorised
Casualty Crashes
Casualties and Casualty Crashes
Casualty Cost:
Infringements by Month
0
200
400
600
800
1000
1200
Jul-02
Jul-03
Jul-04
Jul-05
Jul-06
Jul-07
Jul-08
Jul-09
Jul-10
Jul-11
Jul-12
Jul-13
Jul-14
Jul-15
Jul-16
Jul-17
Month-Year
Infr
ingem
ents
per
Month
Casualties and Casualty Crashes
0
2
4
6
8
10
12
-4Y
-2Y
2001
2003
2005
2007
2009
2011
2013
2015
2017
Number of years before and calendar year after camera installation
Num
ber
of casualti
es/c
asualty
cra
shes
Uncategorised M inor/Other M oderate InjurySerious Injury Killed Casualty Crash
Total Injuries 18 28
↓ 100%
↑ 24%
↑ 40%
Count Percentage Change²
$19.01M $5.93M ↓ 75%
¹ Ending 7 April 2000, 3 calendar months before installation.² The percentage change is based on annualised crash data to allow for a direct comparison between the pre and post installation time periods. Red values indicate an increase.
4 years before installation¹
• When comparing the pre installation period to the most recent five year period, there has been a 40% increase in casualty crashes at this fixed speed camera location. The increase in casualty crashes is not statistically signficant. The data presented do not account for the prevailing statewide trend.• The infringement graph details the trend in infringements at this location since July 2002. Infringement
data before this date is not available. The spike in infringements from July 2007 can be attributed to the camera commencing speed enforcement of both directions of traffic where it previously enforced one direction. Since then, there has been a reduction in speeding behaviour at this location over time. Roadworks and camera maintenance may influence the number of infringements issued. • A desktop review of this location was undertaken in 2015.
Status : Retain and monitor
5 years to end 2017
-
(There has been an increase in casualty crashes at this location, but the increase is not statistically significant. This location has not previously identified for review.)
Annual NSW Speed Camera Review 2018 - Appendix A: Fixed Speed Cameras A19

9612: Brogo - Princes Highway, between Pioneer Close and Brogo River
This location is 1000m in length, and is enforced with one camera.The camera commenced operating on 2 May 2003.
2 0
0 0
- 0
- 0
- 0
3
Fatalities
Serious
Moderate
Minor/Other
Uncategorised
Casualty Crashes
Casualties and Casualty Crashes
Casualty Cost:
Infringements by Month
0
5
10
15
20
25
30
May-03
May-04
May-05
May-06
May-07
May-08
May-09
May-10
May-11
May-12
May-13
May-14
May-15
May-16
May-17
Month-Year
Infr
ingem
ents
per
Month
Casualties and Casualty Crashes
0
1
2
3
-5Y
-4Y
-3Y
-2Y
-1Y
2004
2005
2006
2007
2008
2009
2010
2011
2012
2013
2014
2015
2016
2017
Number of years before and calendar year after camera installation
Num
ber
of casualti
es/c
asualty
cra
shes
Uncategorised M inor/Other M oderate InjurySerious Injury Killed Casualty Crash
Total Injuries 3 0
-
↓ 100%
↓ 100%
Count Percentage Change²
$0.64M $0 ↓ 100%
¹ Ending 2 February 2003, 3 calendar months before installation.² The percentage change is based on annualised crash data to allow for a direct comparison between the pre and post installation time periods. Red values indicate an increase.
5 years before installation¹
• When comparing the pre installation period to the most recent five year period, there has been a 100% decrease in casualty crashes at this fixed speed camera location. The data presented do not account for the prevailing statewide trend.• The infringement graph details the trend in infringements at this location since the camera began
operating. Roadworks and camera maintenance may influence the number of infringements issued.
Status : Ineligible
5 years to end 2017
-
(There is currently a review underway at this location.)
Annual NSW Speed Camera Review 2018 - Appendix A: Fixed Speed Cameras A20

9509: Bulli - Princes Highway, between Grevillea Park Road and Black Diamond Place
This location is 1000m in length, and is enforced with one camera.The camera commenced operating on 4 December 2001.
26 9
1 0
- 4
- 2
- 3
29
Fatalities
Serious
Moderate
Minor/Other
Uncategorised
Casualty Crashes
Casualties and Casualty Crashes
Casualty Cost:
Infringements by Month
0
100
200
300
400
500
600
Jul-02
Jul-03
Jul-04
Jul-05
Jul-06
Jul-07
Jul-08
Jul-09
Jul-10
Jul-11
Jul-12
Jul-13
Jul-14
Jul-15
Jul-16
Jul-17
Month-Year
Infr
ingem
ents
per
Month
Casualties and Casualty Crashes
0
2
4
6
8
10
12
-5Y
-3Y
-1Y
2003
2005
2007
2009
2011
2013
2015
2017
Number of years before and calendar year after camera installation
Num
ber
of casualti
es/c
asualty
cra
shes
Uncategorised M inor/Other M oderate InjurySerious Injury Killed Casualty Crash
Total Injuries 29 9
↓ 100%
↓ 69%
↓ 65%
Count Percentage Change²
$13.74M $1.91M ↓ 86%
¹ Ending 4 September 2001, 3 calendar months before installation.² The percentage change is based on annualised crash data to allow for a direct comparison between the pre and post installation time periods. Red values indicate an increase.
5 years before installation¹
• When comparing the pre installation period to the most recent five year period, there has been a 65% decrease in casualty crashes at this fixed speed camera location. The data presented do not account for the prevailing statewide trend.• The infringement graph details the trend in infringements at this location since July 2002. Infringement
data before this date is not available. The spike in infringements from July 2006 may be attributed to the camera commencing speed enforcement of both directions of traffic where it previously enforced one direction. Since then, there has been a reduction in speeding behaviour at this location over time. Roadworks and camera maintenance may influence the number of infringements issued.
Status : Retain
5 years to end 2017
-
(There has been no increase in casualty crashes.)
Annual NSW Speed Camera Review 2018 - Appendix A: Fixed Speed Cameras A21
9652: Burringbar - Tweed Valley Way, between Blakeneys Road and Cooradilla Road
This location is 1000m in length, and is enforced with one camera.The camera commenced operating on 2 April 1999.
4 2
3 0
- 2
- 0
- 0
4
Fatalities
Serious
Moderate
Minor/Other
Uncategorised
Casualty Crashes
Casualties and Casualty Crashes
Casualty Cost:
Infringements by Month
0
5
10
15
20
25
30
35
40
45
50
Jul-02
Jul-03
Jul-04
Jul-05
Jul-06
Jul-07
Jul-08
Jul-09
Jul-10
Jul-11
Jul-12
Jul-13
Jul-14
Jul-15
Jul-16
Jul-17
Month-Year
Infr
ingem
ents
per
Month
Casualties and Casualty Crashes
0
1
2
3
4
5
6
-3Y
-1Y
2001
2003
2005
2007
2009
2011
2013
2015
2017
Number of years before and calendar year after camera installation
Num
ber
of casualti
es/c
asualty
cra
shes
Uncategorised M inor/Other M oderate InjurySerious Injury Killed Casualty Crash
Total Injuries 4 2
↓ 100%
↓ 70%
↓ 70%
Count Percentage Change²
$23.64M $0.42M ↓ 99%
¹ Ending 2 January 1999, 3 calendar months before installation.² The percentage change is based on annualised crash data to allow for a direct comparison between the pre and post installation time periods. Red values indicate an increase.
3 years before installation¹
• When comparing the pre installation period to the most recent five year period, there has been a 70% decrease in casualty crashes at this fixed speed camera location. The data presented do not account for the prevailing statewide trend.• The infringement graph details the trend in infringements at this location since July 2002. Infringement
data before this date is not available. Roadworks and camera maintenance may influence the number of infringements issued. • This camera is located on a section of road that was formerly the Pacific Highway, that has been
bypassed. While there is a low level of speeding infringements at this location, the review will help determine whether there are road safety risks that require ongoing speed enforcement at this location.
Status : Ineligible
5 years to end 2017
-
(There is currently a review underway at this location.)
Annual NSW Speed Camera Review 2018 - Appendix A: Fixed Speed Cameras A22

9522: Burwood Heights - Hume Highway, between Kelso Street and Appian Way
This location is 1000m in length, and is enforced with one camera.The camera commenced operating on 5 December 2001.
37 15
0 0
- 3
- 11
- 5
50
Fatalities
Serious
Moderate
Minor/Other
Uncategorised
Casualty Crashes
Casualties and Casualty Crashes
Casualty Cost:
Infringements by Month
0
50
100
150
200
250
300
350
400
Jul-02
Jul-03
Jul-04
Jul-05
Jul-06
Jul-07
Jul-08
Jul-09
Jul-10
Jul-11
Jul-12
Jul-13
Jul-14
Jul-15
Jul-16
Jul-17
Month-Year
Infr
ingem
ents
per
Month
Casualties and Casualty Crashes
0
2
4
6
8
10
12
14
16
-5Y
-3Y
-1Y
2003
2005
2007
2009
2011
2013
2015
2017
Number of years before and calendar year after camera installation
Num
ber
of casualti
es/c
asualty
cra
shes
Uncategorised M inor/Other M oderate InjurySerious Injury Killed Casualty Crash
Total Injuries 50 19
-
↓ 62%
↓ 59%
Count Percentage Change²
$10.58M $4.02M ↓ 62%
¹ Ending 5 September 2001, 3 calendar months before installation.² The percentage change is based on annualised crash data to allow for a direct comparison between the pre and post installation time periods. Red values indicate an increase.
5 years before installation¹
• When comparing the pre installation period to the most recent five year period, there has been a 59% decrease in casualty crashes at this fixed speed camera location. The data presented do not account for the prevailing statewide trend.• The infringement graph details the trend in infringements at this location since July 2002. Infringement
data before this date is not available. Roadworks and camera maintenance may influence the number of infringements issued.
Status : Retain
5 years to end 2017
-
(There has been no increase in casualty crashes.)
Annual NSW Speed Camera Review 2018 - Appendix A: Fixed Speed Cameras A23

9540: Camellia - James Ruse Drive, between Victoria Road and Grand Avenue North
This location is 1000m in length, and is enforced with one camera.The camera commenced operating on 6 December 2001.
36 36
1 1
- 14
- 12
- 23
56
Fatalities
Serious
Moderate
Minor/Other
Uncategorised
Casualty Crashes
Casualties and Casualty Crashes
Casualty Cost:
Infringements by Month
0
200
400
600
800
1000
1200
1400
1600
1800
Jul-02
Jul-03
Jul-04
Jul-05
Jul-06
Jul-07
Jul-08
Jul-09
Jul-10
Jul-11
Jul-12
Jul-13
Jul-14
Jul-15
Jul-16
Jul-17
Month-Year
Infr
ingem
ents
per
Month
Casualties and Casualty Crashes
0
2
4
6
8
10
12
14
16
18
-5Y
-3Y
-1Y
2003
2005
2007
2009
2011
2013
2015
2017
Number of years before and calendar year after camera installation
Num
ber
of casualti
es/c
asualty
cra
shes
Uncategorised M inor/Other M oderate InjurySerious Injury Killed Casualty Crash
Total Injuries 56 49
0%
↓ 13%
0%
Count Percentage Change²
$19.45M $17.97M ↓ 8%
¹ Ending 6 September 2001, 3 calendar months before installation.² The percentage change is based on annualised crash data to allow for a direct comparison between the pre and post installation time periods. Red values indicate an increase.
5 years before installation¹
• When comparing the pre installation period to the most recent five year period, there has been no change in casualty crashes at this fixed speed camera location. The change in casualty crashes is not statistically signficant. The data presented do not account for the prevailing statewide trend.• The infringement graph details the trend in infringements at this location since July 2002. Infringement
data before this date is not available. Roadworks and camera maintenance may influence the number of infringements issued.
Status : Retain
5 years to end 2017
-
(There has been no increase in casualty crashes.)
Annual NSW Speed Camera Review 2018 - Appendix A: Fixed Speed Cameras A24

9651: Canterbury - Canterbury Road, between Gould Street and Jeffrey Street
This location is 1000m in length, and is enforced with one camera.The camera commenced operating on 19 April 2001.
74 32
1 0
- 7
- 12
- 18
91
Fatalities
Serious
Moderate
Minor/Other
Uncategorised
Casualty Crashes
Casualties and Casualty Crashes
Casualty Cost:
Infringements by Month
0
200
400
600
800
1000
1200
1400
Jul-02
Jul-03
Jul-04
Jul-05
Jul-06
Jul-07
Jul-08
Jul-09
Jul-10
Jul-11
Jul-12
Jul-13
Jul-14
Jul-15
Jul-16
Jul-17
Month-Year
Infr
ingem
ents
per
Month
Casualties and Casualty Crashes
0
5
10
15
20
25
30
35
-5Y
-3Y
-1Y
2003
2005
2007
2009
2011
2013
2015
2017
Number of years before and calendar year after camera installation
Num
ber
of casualti
es/c
asualty
cra
shes
Uncategorised M inor/Other M oderate InjurySerious Injury Killed Casualty Crash
Total Injuries 91 37
↓ 100%
↓ 59%
↓ 57%
Count Percentage Change²
$26.86M $7.83M ↓ 71%
¹ Ending 19 January 2001, 3 calendar months before installation.² The percentage change is based on annualised crash data to allow for a direct comparison between the pre and post installation time periods. Red values indicate an increase.
5 years before installation¹
• When comparing the pre installation period to the most recent five year period, there has been a 57% decrease in casualty crashes at this fixed speed camera location. The data presented do not account for the prevailing statewide trend.• The infringement graph details the trend in infringements at this location since July 2002. Infringement
data before this date is not available. Roadworks and camera maintenance may influence the number of infringements issued.
Status : Retain
5 years to end 2017
-
(There has been no increase in casualty crashes.)
Annual NSW Speed Camera Review 2018 - Appendix A: Fixed Speed Cameras A25

9626: Caringbah - Captain Cook Drive, between Cawarra Road and Gannons Road
This location is 1000m in length, and is enforced with one camera.The camera commenced operating on 12 April 2001.
15 15
1 0
- 5
- 7
- 6
22
Fatalities
Serious
Moderate
Minor/Other
Uncategorised
Casualty Crashes
Casualties and Casualty Crashes
Casualty Cost:
Infringements by Month
0
20
40
60
80
100
120
140
160
Aug-02
Aug-03
Aug-04
Aug-05
Aug-06
Aug-07
Aug-08
Aug-09
Aug-10
Aug-11
Aug-12
Aug-13
Aug-14
Aug-15
Aug-16
Aug-17
Month-Year
Infr
ingem
ents
per
Month
Casualties and Casualty Crashes
0
1
2
3
4
5
6
7
8
9
10
-5Y
-3Y
-1Y
2003
2005
2007
2009
2011
2013
2015
2017
Number of years before and calendar year after camera installation
Num
ber
of casualti
es/c
asualty
cra
shes
Uncategorised M inor/Other M oderate InjurySerious Injury Killed Casualty Crash
Total Injuries 22 18
↓ 100%
↓ 18%
0%
Count Percentage Change²
$12.26M $3.81M ↓ 69%
¹ Ending 12 January 2001, 3 calendar months before installation.² The percentage change is based on annualised crash data to allow for a direct comparison between the pre and post installation time periods. Red values indicate an increase.
5 years before installation¹
• When comparing the pre installation period to the most recent five year period, there has been no change in casualty crashes at this fixed speed camera location. The change in casualty crashes is not statistically signficant. The data presented do not account for the prevailing statewide trend.• The infringement graph details the trend in infringements at this location since July 2002. Infringement
data before this date is not available. No infringements were recorded at this location from November 2010 to May 2011 as a replacement camera was installed. Roadworks and camera maintenance may influence the number of infringements issued.
Status : Retain
5 years to end 2017
-
(There has been no increase in casualty crashes.)
Annual NSW Speed Camera Review 2018 - Appendix A: Fixed Speed Cameras A26

9553: Carlingford - Pennant Hills Road, between Evans Road and Coleman Avenue
This location is 1000m in length, and is enforced with one camera.The camera commenced operating on 16 August 2002.
42 30
0 0
- 8
- 9
- 21
55
Fatalities
Serious
Moderate
Minor/Other
Uncategorised
Casualty Crashes
Casualties and Casualty Crashes
Casualty Cost:
Infringements by Month
0
500
1000
1500
2000
2500
3000
Jul-02
Jul-03
Jul-04
Jul-05
Jul-06
Jul-07
Jul-08
Jul-09
Jul-10
Jul-11
Jul-12
Jul-13
Jul-14
Jul-15
Jul-16
Jul-17
Month-Year
Infr
ingem
ents
per
Month
Casualties and Casualty Crashes
0
2
4
6
8
10
12
14
16
18
-5Y
-3Y
-1Y
2004
2006
2008
2010
2012
2014
2016
Number of years before and calendar year after camera installation
Num
ber
of casualti
es/c
asualty
cra
shes
Uncategorised M inor/Other M oderate InjurySerious Injury Killed Casualty Crash
Total Injuries 55 38
-
↓ 31%
↓ 29%
Count Percentage Change²
$11.64M $8.04M ↓ 31%
¹ Ending 16 May 2002, 3 calendar months before installation.² The percentage change is based on annualised crash data to allow for a direct comparison between the pre and post installation time periods. Red values indicate an increase.
5 years before installation¹
• When comparing the pre installation period to the most recent five year period, there has been a 29% decrease in casualty crashes at this fixed speed camera location. The data presented do not account for the prevailing statewide trend.• The infringement graph details the trend in infringements at this location since the camera began
operating. Roadworks and camera maintenance may influence the number of infringements issued.
Status : Retain
5 years to end 2017
-
(There has been no increase in casualty crashes.)
Annual NSW Speed Camera Review 2018 - Appendix A: Fixed Speed Cameras A27

9804: Castle Hill - Old Northern Road, between Telfer Road and Brisbane Road
School zone: St Bernadette’s Primary SchoolThis location is 430m patch to patch in length, and is enforced with one camera.The camera commenced operating on 18 May 2007.
8 3
0 0
1 2
0 0
3 1
5
Fatalities
Serious
Moderate
Minor/Other
Uncategorised
Casualty Crashes
Casualties and Casualty Crashes
Casualty Cost:
Infringements by Month
0
200
400
600
800
1000
1200
1400
1600
1800
2000
May-07
May-08
May-09
May-10
May-11
May-12
May-13
May-14
May-15
May-16
May-17
Month-Year
Infr
ingem
ents
per
Month
Casualties and Casualty Crashes
0
1
2
3
4
5
-5Y
-4Y
-3Y
-2Y
-1Y
2008
2009
2010
2011
2012
2013
2014
2015
2016
2017
Number of years before and calendar year after camera installation
Num
ber
of casualti
es/c
asualty
cra
shes
Uncategorised M inor/Other M oderate InjurySerious Injury Killed Casualty Crash
Total Injuries 9 3
-
↓ 67%
↓ 63%
Count Percentage Change²
$1.91M $0.64M ↓ 67%
¹ Ending 18 February 2007, 3 calendar months before installation.² The percentage change is based on annualised crash data to allow for a direct comparison between the pre and post installation time periods. Red values indicate an increase.
5 years before installation¹
• When comparing the pre installation period to the most recent five year period, there has been a 63% decrease in casualty crashes at this fixed speed camera location. The data presented do not account for the prevailing statewide trend.• The infringement graph details the trend in infringements at this location since the camera began
operating. Roadworks and camera maintenance may influence the number of infringements issued.
Status : Retain
5 years to end 2017
-
(There has been no increase in casualty crashes.)
Annual NSW Speed Camera Review 2018 - Appendix A: Fixed Speed Cameras A28

9622: Charmhaven - Pacific Highway, between Wallarah Creek and Lowana Avenue
This location is 1000m in length, and is enforced with one camera.The camera commenced operating on 10 April 2007.
18 9
0 0
4 5
6 10
2 2
12
Fatalities
Serious
Moderate
Minor/Other
Uncategorised
Casualty Crashes
Casualties and Casualty Crashes
Casualty Cost:
Infringements by Month
0
50
100
150
200
250
Apr-07
Apr-08
Apr-09
Apr-10
Apr-11
Apr-12
Apr-13
Apr-14
Apr-15
Apr-16
Apr-17
Month-Year
Infr
ingem
ents
per
Month
Casualties and Casualty Crashes
0
1
2
3
4
5
6
7
8
9
-5Y
-4Y
-3Y
-2Y
-1Y
2008
2009
2010
2011
2012
2013
2014
2015
2016
2017
Number of years before and calendar year after camera installation
Num
ber
of casualti
es/c
asualty
cra
shes
Uncategorised M inor/Other M oderate InjurySerious Injury Killed Casualty Crash
Total Injuries 24 17
-
↓ 29%
↓ 50%
Count Percentage Change²
$5.08M $3.60M ↓ 29%
¹ Ending 10 January 2007, 3 calendar months before installation.² The percentage change is based on annualised crash data to allow for a direct comparison between the pre and post installation time periods. Red values indicate an increase.
5 years before installation¹
• When comparing the pre installation period to the most recent five year period, there has been a 50% decrease in casualty crashes at this fixed speed camera location. The data presented do not account for the prevailing statewide trend.• The infringement graph details the trend in infringements at this location since the camera began
operating. Roadworks and camera maintenance may influence the number of infringements issued.
Status : Retain
5 years to end 2017
-
(There has been no increase in casualty crashes.)
Annual NSW Speed Camera Review 2018 - Appendix A: Fixed Speed Cameras A29

9625: Concord West - Concord Road, between Nirranda Street and Mepunga Street
This location is 1000m in length, and is enforced with one camera.The camera commenced operating on 24 July 2000.
17 18
0 0
- 4
- 10
- 12
22
Fatalities
Serious
Moderate
Minor/Other
Uncategorised
Casualty Crashes
Casualties and Casualty Crashes
Casualty Cost:
Infringements by Month
0
200
400
600
800
1000
1200
1400
1600
1800
Jul-02
Jul-03
Jul-04
Jul-05
Jul-06
Jul-07
Jul-08
Jul-09
Jul-10
Jul-11
Jul-12
Jul-13
Jul-14
Jul-15
Jul-16
Jul-17
Month-Year
Infr
ingem
ents
per
Month
Casualties and Casualty Crashes
0
1
2
3
4
5
6
7
8
9
10
-4Y
-2Y
2001
2003
2005
2007
2009
2011
2013
2015
2017
Number of years before and calendar year after camera installation
Num
ber
of casualti
es/c
asualty
cra
shes
Uncategorised M inor/Other M oderate InjurySerious Injury Killed Casualty Crash
Total Injuries 22 26
-
↓ 5%
↓ 15%
Count Percentage Change²
$4.66M $5.50M ↓ 5%
¹ Ending 24 April 2000, 3 calendar months before installation.² The percentage change is based on annualised crash data to allow for a direct comparison between the pre and post installation time periods. Red values indicate an increase.
4 years before installation¹
• When comparing the pre installation period to the most recent five year period, there has been a 15% decrease in casualty crashes at this fixed speed camera location. The data presented do not account for the prevailing statewide trend.• The infringement graph details the trend in infringements at this location since July 2002. Infringement
data before this date is not available. No infringements were recorded at this location from October 2009 to July 2010 due to road resurfacing works. Roadworks and camera maintenance may influence the number of infringements issued.
Status : Retain
5 years to end 2017
-
(There has been no increase in casualty crashes.)
Annual NSW Speed Camera Review 2018 - Appendix A: Fixed Speed Cameras A30

9828: Condell Park - Edgar Street, between Augusta Street and Upper Railway Parade
School zone: Condell Park Primary SchoolThis location is 240m (patch to patch) in length, and is enforced with one camera.The camera commenced operating on 24 October 2007.
17 6
1 0
0 1
4 1
7 5
8
Fatalities
Serious
Moderate
Minor/Other
Uncategorised
Casualty Crashes
Casualties and Casualty Crashes
Casualty Cost:
Infringements by Month
0
50
100
150
200
250
Oct-07
Oct-08
Oct-09
Oct-10
Oct-11
Oct-12
Oct-13
Oct-14
Oct-15
Oct-16
Oct-17
Month-Year
Infr
ingem
ents
per
Month
Casualties and Casualty Crashes
0
1
2
3
4
5
6
7
-5Y
-4Y
-3Y
-2Y
-1Y
2008
2009
2010
2011
2012
2013
2014
2015
2016
2017
Number of years before and calendar year after camera installation
Num
ber
of casualti
es/c
asualty
cra
shes
Uncategorised M inor/Other M oderate InjurySerious Injury Killed Casualty Crash
Total Injuries 19 7
↓ 100%
↓ 63%
↓ 65%
Count Percentage Change²
$11.62M $1.48M ↓ 87%
¹ Ending 24 July 2007, 3 calendar months before installation.² The percentage change is based on annualised crash data to allow for a direct comparison between the pre and post installation time periods. Red values indicate an increase.
5 years before installation¹
• When comparing the pre installation period to the most recent five year period, there has been a 65% decrease in casualty crashes at this fixed speed camera location. The data presented do not account for the prevailing statewide trend.• The infringement graph details the trend in infringements at this location since the camera began
operating. Roadworks and camera maintenance may influence the number of infringements issued.
Status : Retain
5 years to end 2017
-
(There has been no increase in casualty crashes.)
Annual NSW Speed Camera Review 2018 - Appendix A: Fixed Speed Cameras A31

9556|9557: Corrimal - Northern Distributor (Memorial Drive), between Towradgi Road and Railway Street
This location is 1000m in length, and is enforced by 2 cameras.The cameras commenced operating on: • Camera 1 (northbound) 11 July 2002 • Camera 2 (southbound) 25 July 2002
19 18
1 1
- 7
- 12
- 5
29
Fatalities
Serious
Moderate
Minor/Other
Uncategorised
Casualty Crashes
Casualties and Casualty Crashes
Casualty Cost:
Infringements by Month
0
100
200
300
400
500
600
700
800
Jul-02
Jul-03
Jul-04
Jul-05
Jul-06
Jul-07
Jul-08
Jul-09
Jul-10
Jul-11
Jul-12
Jul-13
Jul-14
Jul-15
Jul-16
Jul-17
Month-Year
Infr
ingem
ents
per
Month
Casualties and Casualty Crashes
0
2
4
6
8
10
12
14
16
-5Y
-3Y
-1Y
2004
2006
2008
2010
2012
2014
2016
Number of years before and calendar year after camera installation
Num
ber
of casualti
es/c
asualty
cra
shes
Uncategorised M inor/Other M oderate InjurySerious Injury Killed Casualty Crash
Total Injuries 29 24
0%
↓ 17%
↓ 5%
Count Percentage Change²
$13.74M $12.68M ↓ 8%
¹ Ending 11 April 2002, 3 calendar months before installation.² The percentage change is based on annualised crash data to allow for a direct comparison between the pre and post installation time periods. Red values indicate an increase.
5 years before installation¹
• When comparing the pre installation period to the most recent five year period, there has been a 5% decrease in casualty crashes at this fixed speed camera location. The data presented do not account for the prevailing statewide trend.• The infringement graph details the trend in infringements at this location since the camera began
operating. Roadworks and camera maintenance may influence the number of infringements issued. • This location was reviewed in 2012 due to concerns about the increase in fatalities in recent years. The
review found no evidence that the recent fatality, which occurred at an adjacent intersection, were speed-related and it is unlikely that the speed camera would have reduced these crashes.
Status : Retain
5 years to end 2017
-
(There has been no increase in casualty crashes.)
Annual NSW Speed Camera Review 2018 - Appendix A: Fixed Speed Cameras A32

9811|9812: East Gardens/ Maroubra - Bunnerong Road, between Fitzgerald Avenue and Smith Street
School zone: Marist College PagewoodThis location is 370m (patch to patch) in length, and is enforced by 2 cameras.Both cameras commenced operating on 20 June 2007.
13 4
0 0
1 1
6 1
2 2
8
Fatalities
Serious
Moderate
Minor/Other
Uncategorised
Casualty Crashes
Casualties and Casualty Crashes
Casualty Cost:
Infringements by Month
0
500
1000
1500
2000
2500
3000
3500
Jun-07
Jun-08
Jun-09
Jun-10
Jun-11
Jun-12
Jun-13
Jun-14
Jun-15
Jun-16
Jun-17
Month-Year
Infr
ingem
ents
per
Month
Casualties and Casualty Crashes
0
1
2
3
4
5
6
7
8
9
-5Y
-4Y
-3Y
-2Y
-1Y
2008
2009
2010
2011
2012
2013
2014
2015
2016
2017
Number of years before and calendar year after camera installation
Num
ber
of casualti
es/c
asualty
cra
shes
Uncategorised M inor/Other M oderate InjurySerious Injury Killed Casualty Crash
Total Injuries 17 4
-
↓ 76%
↓ 69%
Count Percentage Change²
$3.60M $0.85M ↓ 76%
¹ Ending 20 March 2007, 3 calendar months before installation.² The percentage change is based on annualised crash data to allow for a direct comparison between the pre and post installation time periods. Red values indicate an increase.
5 years before installation¹
• When comparing the pre installation period to the most recent five year period, there has been a 69% decrease in casualty crashes at this fixed speed camera location. The data presented do not account for the prevailing statewide trend.• The infringement graph details the trend in infringements at this location since the camera began
operating. Roadworks and camera maintenance may influence the number of infringements issued.
Status : Retain
5 years to end 2017
-
(There has been no increase in casualty crashes.)
Annual NSW Speed Camera Review 2018 - Appendix A: Fixed Speed Cameras A33

9549: Edgecliff - New South Head Road, between Waratah Street and New Beach Road
This location is 1000m in length, and is enforced with one camera.The camera commenced operating on 7 December 2001.
37 24
0 0
- 4
- 10
- 12
43
Fatalities
Serious
Moderate
Minor/Other
Uncategorised
Casualty Crashes
Casualties and Casualty Crashes
Casualty Cost:
Infringements by Month
0
500
1000
1500
2000
2500
Jul-02
Jul-03
Jul-04
Jul-05
Jul-06
Jul-07
Jul-08
Jul-09
Jul-10
Jul-11
Jul-12
Jul-13
Jul-14
Jul-15
Jul-16
Jul-17
Month-Year
Infr
ingem
ents
per
Month
Casualties and Casualty Crashes
0
2
4
6
8
10
12
14
16
-5Y
-3Y
-1Y
2003
2005
2007
2009
2011
2013
2015
2017
Number of years before and calendar year after camera installation
Num
ber
of casualti
es/c
asualty
cra
shes
Uncategorised M inor/Other M oderate InjurySerious Injury Killed Casualty Crash
Total Injuries 43 26
-
↓ 40%
↓ 35%
Count Percentage Change²
$9.10M $5.50M ↓ 40%
¹ Ending 7 September 2001, 3 calendar months before installation.² The percentage change is based on annualised crash data to allow for a direct comparison between the pre and post installation time periods. Red values indicate an increase.
5 years before installation¹
• When comparing the pre installation period to the most recent five year period, there has been a 35% decrease in casualty crashes at this fixed speed camera location. The data presented do not account for the prevailing statewide trend.• The infringement graph details the trend in infringements at this location since July 2002. Infringement
data before this date is not available. Roadworks and camera maintenance may influence the number of infringements issued. • This location was reviewed in 2012 due to concerns that crashes and casualties at this location had
increased. The comprehensive review found that the camera only has an impact on the eastbound direction of traffic because the camera only enforces in this direction and there is a very wide median at the camera location. Therefore the camera was found to be effective and this crash analysis looks only at the eastbound carriageway of New South Head Road.
Status : Retain
5 years to end 2017
-
(There has been no increase in casualty crashes.)
Annual NSW Speed Camera Review 2018 - Appendix A: Fixed Speed Cameras A34

9669: Engadine - Heathcote Road, between Forum Drive and New Illawarra Road
This location is 1000m in length, and is enforced with one camera.The camera commenced operating on 4 June 2017.
20 0
0 0
12 0
13 0
1 0
0
Fatalities
Serious
Moderate
Minor/Other
Uncategorised
Casualty Crashes
Casualties and Casualty Crashes
Casualty Cost:
Casualties and Casualty Crashes
0
1
2
3
4
5
6
7
8
9
-5Y
-4Y
-3Y
-2Y
-1Y
Number of years before and calendar year after camera installation
Num
ber
of casualti
es/c
asualty
cra
shes
Uncategorised M inor/Other M oderate InjurySerious Injury Killed Casualty Crash
Total Injuries 26 0
-
↓ 100%
↓ 100%
Count Percentage Change²
$5.50M $0 ↓ 100%
¹ Ending 4 March 2017, 3 calendar months before installation.² The percentage change is based on annualised crash data to allow for a direct comparison between the pre and post installation time periods. Red values indicate an increase.
5 years before installation¹
• CRS will develop further commentary when there is additional data available for this location in the future.• The infringement graph details the trend in infringements at this location since the camera began
operating. Roadworks and camera maintenance may influence the number of infringements issued.
Status : Insufficient data
0.57 years to end 2017
-
Annual NSW Speed Camera Review 2018 - Appendix A: Fixed Speed Cameras A35

9623: Ewingsdale - Pacific Highway, between St Helena Road and Ewingsdale Road.
This location is 1000m in length, and is enforced with one camera.The camera commenced operating on 22 September 2006.
14 1
1 0
2 0
0 1
3 0
18
Fatalities
Serious
Moderate
Minor/Other
Uncategorised
Casualty Crashes
Casualties and Casualty Crashes
Casualty Cost:
Infringements by Month
0
500
1000
1500
2000
2500
3000
3500
4000
Oct-06
Oct-07
Oct-08
Oct-09
Oct-10
Oct-11
Oct-12
Oct-13
Oct-14
Oct-15
Oct-16
Oct-17
Month-Year
Infr
ingem
ents
per
Month
Casualties and Casualty Crashes
0
2
4
6
8
10
12
-5Y
-4Y
-3Y
-2Y
-1Y
2007
2008
2009
2010
2011
2012
2013
2014
2015
2016
2017
Number of years before and calendar year after camera installation
Num
ber
of casualti
es/c
asualty
cra
shes
Uncategorised M inor/Other M oderate InjurySerious Injury Killed Casualty Crash
Total Injuries 23 1
↓ 100%
↓ 96%
↓ 93%
Count Percentage Change²
$12.47M $0.21M ↓ 98%
¹ Ending 22 June 2006, 3 calendar months before installation.² The percentage change is based on annualised crash data to allow for a direct comparison between the pre and post installation time periods. Red values indicate an increase.
5 years before installation¹
• When comparing the pre installation period to the most recent five year period, there has been a 93% decrease in casualty crashes at this fixed speed camera location. The data presented do not account for the prevailing statewide trend.• The infringement graph details the trend in infringements at this location since the camera began
operating. Roadworks and camera maintenance may influence the number of infringements issued.
Status : Retain
5 years to end 2017
-
(There has been no increase in casualty crashes.)
Annual NSW Speed Camera Review 2018 - Appendix A: Fixed Speed Cameras A36

9561: Fairfield East - Fairfield Street, between Scott Street and Mandarin Street
This location is 1000m in length, and is enforced with one camera.The camera commenced operating on 4 July 2002.
16 9
1 0
- 3
- 5
- 6
22
Fatalities
Serious
Moderate
Minor/Other
Uncategorised
Casualty Crashes
Casualties and Casualty Crashes
Casualty Cost:
Infringements by Month
0
50
100
150
200
250
300
350
400
Jul-02
Jul-03
Jul-04
Jul-05
Jul-06
Jul-07
Jul-08
Jul-09
Jul-10
Jul-11
Jul-12
Jul-13
Jul-14
Jul-15
Jul-16
Jul-17
Month-Year
Infr
ingem
ents
per
Month
Casualties and Casualty Crashes
0
1
2
3
4
5
6
7
8
9
10
-5Y
-3Y
-1Y
2004
2006
2008
2010
2012
2014
2016
Number of years before and calendar year after camera installation
Num
ber
of casualti
es/c
asualty
cra
shes
Uncategorised M inor/Other M oderate InjurySerious Injury Killed Casualty Crash
Total Injuries 22 14
↓ 100%
↓ 36%
↓ 44%
Count Percentage Change²
$12.26M $2.96M ↓ 76%
¹ Ending 4 April 2002, 3 calendar months before installation.² The percentage change is based on annualised crash data to allow for a direct comparison between the pre and post installation time periods. Red values indicate an increase.
5 years before installation¹
• When comparing the pre installation period to the most recent five year period, there has been a 44% decrease in casualty crashes at this fixed speed camera location. The data presented do not account for the prevailing statewide trend.• The infringement graph details the trend in infringements at this location since the camera began
operating. Roadworks and camera maintenance may influence the number of infringements issued. • This location was reviewed in 2013 due to concerns about the increase in crashes and casualties in recent
years. The 2013 review found that since the speed camera was installed, the number of crashes per year had decreased. The review also found that the number of injury crashes per year decreased. While there was one fatal crash with one fatality prior to the installation of the speed camera, there have been no fatalities since the camera has been in operation. Therefore based on this information, the speed camera has been retained.
Status : Retain
5 years to end 2017
-
(There has been no increase in casualty crashes.)
Annual NSW Speed Camera Review 2018 - Appendix A: Fixed Speed Cameras A37

9593: Foxground - Princes Highway, between Foxground Road and Broughton Creek
This location is 1000m in length, and is enforced with one camera.The camera commenced operating on 9 May 2003.
8 3
1 0
- 2
- 5
- 0
11
Fatalities
Serious
Moderate
Minor/Other
Uncategorised
Casualty Crashes
Casualties and Casualty Crashes
Casualty Cost:
Infringements by Month
0
2
4
6
8
10
12
14
16
18
Nov-03
Nov-04
Nov-05
Nov-06
Nov-07
Nov-08
Nov-09
Nov-10
Nov-11
Nov-12
Nov-13
Nov-14
Nov-15
Nov-16
Nov-17
Month-Year
Infr
ingem
ents
per
Month
Casualties and Casualty Crashes
0
1
2
3
4
5
6
7
8
9
10
-5Y
-4Y
-3Y
-2Y
-1Y
2004
2005
2006
2007
2008
2009
2010
2011
2012
2013
2014
2015
2016
2017
Number of years before and calendar year after camera installation
Num
ber
of casualti
es/c
asualty
cra
shes
Uncategorised M inor/Other M oderate InjurySerious Injury Killed Casualty Crash
Total Injuries 11 7
↓ 100%
↓ 36%
↓ 63%
Count Percentage Change²
$9.93M $1.48M ↓ 85%
¹ Ending 9 February 2003, 3 calendar months before installation.² The percentage change is based on annualised crash data to allow for a direct comparison between the pre and post installation time periods. Red values indicate an increase.
5 years before installation¹
• When comparing the pre installation period to the most recent five year period, there has been a 63% decrease in casualty crashes at this fixed speed camera location. The data presented do not account for the prevailing statewide trend.• The infringement graph details the trend in infringements at this location since the camera began
operating. Roadworks and camera maintenance may influence the number of infringements issued. • In 2015, major traffic works commenced at this location for the construction of the Foxground and Berry
bypass. The camera and accompanying signage has been removed for the works. The location will be reviewed once works are complete and a final decision will be made about the need for ongoing enforcement.
Status : Ineligible
5 years to end 2017
-
(There is currently a review underway at this location.)
Annual NSW Speed Camera Review 2018 - Appendix A: Fixed Speed Cameras A38

9637: Gateshead - Pacific Highway, between Sydney Street and Macquarie Avenue
School zone: Hunter Sports High School, Gateshead Public School, St Mary's High SchoolThis location is 820m (patch to patch) in length, and is enforced with one camera.The camera commenced operating on 30 May 2000.
4 4
0 0
- 2
- 3
- 0
4
Fatalities
Serious
Moderate
Minor/Other
Uncategorised
Casualty Crashes
Casualties and Casualty Crashes
Casualty Cost:
Infringements by Month
0
100
200
300
400
500
600
700
800
900
Aug-03
Aug-04
Aug-05
Aug-06
Aug-07
Aug-08
Aug-09
Aug-10
Aug-11
Aug-12
Aug-13
Aug-14
Aug-15
Aug-16
Aug-17
Month-Year
Infr
ingem
ents
per
Month
Casualties and Casualty Crashes
0
1
2
3
4
5
6
-4Y
-2Y
2001
2003
2005
2007
2009
2011
2013
2015
2017
Number of years before and calendar year after camera installation
Num
ber
of casualti
es/c
asualty
cra
shes
Uncategorised M inor/Other M oderate InjurySerious Injury Killed Casualty Crash
Total Injuries 4 5
-
0%
↓ 20%
Count Percentage Change²
$0.85M $1.06M 0%
¹ Ending 1 March 2000, 3 calendar months before installation.² The percentage change is based on annualised crash data to allow for a direct comparison between the pre and post installation time periods. Red values indicate an increase.
4 years before installation¹
• When comparing the pre installation period to the most recent five year period, there has been a 20% decrease in casualty crashes at this fixed speed camera location. The data presented do not account for the prevailing statewide trend.• The infringement graph details the trend in infringements at this location since July 2002. Infringement
data before this date is not available. Roadworks and camera maintenance may influence the number of infringements issued.
Status : Retain
5 years to end 2017
-
(There has been no increase in casualty crashes.)
Annual NSW Speed Camera Review 2018 - Appendix A: Fixed Speed Cameras A39

9543: Greystanes - Greystanes Road, between Merrylands Road and Old Prospect Road
This location is 1000m in length, and is enforced with one camera.The camera commenced operating on 30 November 2001.
13 6
0 0
- 3
- 0
- 3
15
Fatalities
Serious
Moderate
Minor/Other
Uncategorised
Casualty Crashes
Casualties and Casualty Crashes
Casualty Cost:
Infringements by Month
0
50
100
150
200
250
300
350
400
Aug-02
Aug-03
Aug-04
Aug-05
Aug-06
Aug-07
Aug-08
Aug-09
Aug-10
Aug-11
Aug-12
Aug-13
Aug-14
Aug-15
Aug-16
Aug-17
Month-Year
Infr
ingem
ents
per
Month
Casualties and Casualty Crashes
0
1
2
3
4
5
6
7
8
-5Y
-3Y
-1Y
2003
2005
2007
2009
2011
2013
2015
2017
Number of years before and calendar year after camera installation
Num
ber
of casualti
es/c
asualty
cra
shes
Uncategorised M inor/Other M oderate InjurySerious Injury Killed Casualty Crash
Total Injuries 15 6
-
↓ 60%
↓ 54%
Count Percentage Change²
$3.18M $1.27M ↓ 60%
¹ Ending 30 August 2001, 3 calendar months before installation.² The percentage change is based on annualised crash data to allow for a direct comparison between the pre and post installation time periods. Red values indicate an increase.
5 years before installation¹
• When comparing the pre installation period to the most recent five year period, there has been a 54% decrease in casualty crashes at this fixed speed camera location. The data presented do not account for the prevailing statewide trend.• The infringement graph details the trend in infringements at this location since July 2002. Infringement
data before this date is not available. Roadworks and camera maintenance may influence the number of infringements issued.
Status : Retain
5 years to end 2017
-
(There has been no increase in casualty crashes.)
Annual NSW Speed Camera Review 2018 - Appendix A: Fixed Speed Cameras A40

9806|9807: Guildford - Woodville Road, between Kenelda Avenue and Osgood Street
School zone: Granville South Public SchoolThis location is 500m (patch to patch) in length, and is enforced by 2 cameras.Both cameras commenced operating on 16 May 2007.
29 19
1 0
6 3
6 2
1 20
30
Fatalities
Serious
Moderate
Minor/Other
Uncategorised
Casualty Crashes
Casualties and Casualty Crashes
Casualty Cost:
Infringements by Month
0
500
1000
1500
2000
2500
May-07
May-08
May-09
May-10
May-11
May-12
May-13
May-14
May-15
May-16
May-17
Month-Year
Infr
ingem
ents
per
Month
Casualties and Casualty Crashes
0
2
4
6
8
10
12
14
-5Y
-4Y
-3Y
-2Y
-1Y
2008
2009
2010
2011
2012
2013
2014
2015
2016
2017
Number of years before and calendar year after camera installation
Num
ber
of casualti
es/c
asualty
cra
shes
Uncategorised M inor/Other M oderate InjurySerious Injury Killed Casualty Crash
Total Injuries 43 25
↓ 100%
↓ 42%
↓ 34%
Count Percentage Change²
$16.70M $5.29M ↓ 68%
¹ Ending 16 February 2007, 3 calendar months before installation.² The percentage change is based on annualised crash data to allow for a direct comparison between the pre and post installation time periods. Red values indicate an increase.
5 years before installation¹
• When comparing the pre installation period to the most recent five year period, there has been a 34% decrease in casualty crashes at this fixed speed camera location. The data presented do not account for the prevailing statewide trend.• The infringement graph details the trend in infringements at this location since the camera began
operating. Roadworks and camera maintenance may influence the number of infringements issued.
Status : Retain
5 years to end 2017
-
(There has been no increase in casualty crashes.)
Annual NSW Speed Camera Review 2018 - Appendix A: Fixed Speed Cameras A41

9597: Gwynneville - M1 Princes Motorway, between Northern Distributor Overpass and Gipps Road Overpass (northbound)
This location is 1000m in length, and is enforced with one camera.The camera commenced operating on 7 August 2003.
15 4
0 0
- 0
- 4
- 0
32
Fatalities
Serious
Moderate
Minor/Other
Uncategorised
Casualty Crashes
Casualties and Casualty Crashes
Casualty Cost:
Infringements by Month
0
500
1000
1500
2000
2500
3000
3500
4000
Sep-03
Sep-04
Sep-05
Sep-06
Sep-07
Sep-08
Sep-09
Sep-10
Sep-11
Sep-12
Sep-13
Sep-14
Sep-15
Sep-16
Sep-17
Month-Year
Infr
ingem
ents
per
Month
Casualties and Casualty Crashes
0
2
4
6
8
10
12
14
-5Y
-4Y
-3Y
-2Y
-1Y
2004
2005
2006
2007
2008
2009
2010
2011
2012
2013
2014
2015
2016
2017
Number of years before and calendar year after camera installation
Num
ber
of casualti
es/c
asualty
cra
shes
Uncategorised M inor/Other M oderate InjurySerious Injury Killed Casualty Crash
Total Injuries 32 4
-
↓ 88%
↓ 73%
Count Percentage Change²
$6.77M $0.85M ↓ 88%
¹ Ending 7 May 2003, 3 calendar months before installation.² The percentage change is based on annualised crash data to allow for a direct comparison between the pre and post installation time periods. Red values indicate an increase.
5 years before installation¹
• When comparing the pre installation period to the most recent five year period, there has been a 73% decrease in casualty crashes at this fixed speed camera location. The data presented do not account for the prevailing statewide trend.• The infringement graph details the trend in infringements at this location since the camera began
operating. Roadworks and camera maintenance may influence the number of infringements issued.
Status : Retain
5 years to end 2017
-
(There has been no increase in casualty crashes.)
Annual NSW Speed Camera Review 2018 - Appendix A: Fixed Speed Cameras A42

9662: Gwynneville - M1 Princes Motorway, University Avenue Overpass and Mount Ousley Road (southbound)
This location is 1000m in length, and is enforced with one camera.The camera commenced operating on 7 August 2003.
3 2
1 0
- 1
- 0
- 1
7
Fatalities
Serious
Moderate
Minor/Other
Uncategorised
Casualty Crashes
Casualties and Casualty Crashes
Casualty Cost:
Infringements by Month
0
500
1000
1500
2000
2500
3000
3500
4000
Jul-03
Jul-04
Jul-05
Jul-06
Jul-07
Jul-08
Jul-09
Jul-10
Jul-11
Jul-12
Jul-13
Jul-14
Jul-15
Jul-16
Jul-17
Month-Year
Infr
ingem
ents
per
Month
Casualties and Casualty Crashes
0
1
2
3
4
5
6
7
8
-5Y
-4Y
-3Y
-2Y
-1Y
2004
2005
2006
2007
2008
2009
2010
2011
2012
2013
2014
2015
2016
2017
Number of years before and calendar year after camera installation
Num
ber
of casualti
es/c
asualty
cra
shes
Uncategorised M inor/Other M oderate InjurySerious Injury Killed Casualty Crash
Total Injuries 7 2
↓ 100%
↓ 71%
↓ 33%
Count Percentage Change²
$9.08M $0.42M ↓ 95%
¹ Ending 7 May 2003, 3 calendar months before installation.² The percentage change is based on annualised crash data to allow for a direct comparison between the pre and post installation time periods. Red values indicate an increase.
5 years before installation¹
• When comparing the pre installation period to the most recent five year period, there has been a 33% decrease in casualty crashes at this fixed speed camera location. The data presented do not account for the prevailing statewide trend.• The infringement graph details the trend in infringements at this location since the camera began
operating. Roadworks and camera maintenance may influence the number of infringements issued.
Status : Retain
5 years to end 2017
-
(There has been no increase in casualty crashes.)
Annual NSW Speed Camera Review 2018 - Appendix A: Fixed Speed Cameras A43

9631: Hartley - Great Western Highway, between Mid Hartley Road and Blackmans Creek Road
This location is 1000m in length, and is enforced with one camera.The camera commenced operating on 6 December 2000.
3 1
0 0
- 1
- 1
- 0
4
Fatalities
Serious
Moderate
Minor/Other
Uncategorised
Casualty Crashes
Casualties and Casualty Crashes
Casualty Cost:
Infringements by Month
0
50
100
150
200
250
300
Jul-02
Jul-03
Jul-04
Jul-05
Jul-06
Jul-07
Jul-08
Jul-09
Jul-10
Jul-11
Jul-12
Jul-13
Jul-14
Jul-15
Jul-16
Jul-17
Month-Year
Infr
ingem
ents
per
Month
Casualties and Casualty Crashes
0
1
2
3
4
5
-4Y
-2Y
2001
2003
2005
2007
2009
2011
2013
2015
2017
Number of years before and calendar year after camera installation
Num
ber
of casualti
es/c
asualty
cra
shes
Uncategorised M inor/Other M oderate InjurySerious Injury Killed Casualty Crash
Total Injuries 4 2
-
↓ 60%
↓ 73%
Count Percentage Change²
$0.85M $0.42M ↓ 60%
¹ Ending 6 September 2000, 3 calendar months before installation.² The percentage change is based on annualised crash data to allow for a direct comparison between the pre and post installation time periods. Red values indicate an increase.
4 years before installation¹
• When comparing the pre installation period to the most recent five year period, there has been a 73% decrease in casualty crashes at this fixed speed camera location. The data presented do not account for the prevailing statewide trend.• The infringement graph details the trend in infringements at this location since July 2002. Infringement
data before this date is not available. Roadworks and camera maintenance may influence the number of infringements issued. • This location was recommended for review in the 2014 annual speed camera review.
Status : Ineligible
5 years to end 2017
-
(There is currently a review underway at this location.)
Annual NSW Speed Camera Review 2018 - Appendix A: Fixed Speed Cameras A44

9567: Hungry Head - Pacific Highway, between Boundary Road and Ballards Road
This location is 1000m in length, and is enforced with one camera.The camera commenced operating on 25 November 2002.
2 2
1 0
- 0
- 5
- 0
2
Fatalities
Serious
Moderate
Minor/Other
Uncategorised
Casualty Crashes
Casualties and Casualty Crashes
Casualty Cost:
Infringements by Month
0
5
10
15
20
25
30
35
40
45
Nov-02
Nov-03
Nov-04
Nov-05
Nov-06
Nov-07
Nov-08
Nov-09
Nov-10
Nov-11
Nov-12
Nov-13
Nov-14
Nov-15
Nov-16
Nov-17
Month-Year
Infr
ingem
ents
per
Month
Casualties and Casualty Crashes
0
1
2
3
4
5
6
7
-5Y
-3Y
-1Y
2004
2006
2008
2010
2012
2014
2016
Number of years before and calendar year after camera installation
Num
ber
of casualti
es/c
asualty
cra
shes
Uncategorised M inor/Other M oderate InjurySerious Injury Killed Casualty Crash
Total Injuries 2 5
↓ 100%
↑ 150%
0%
Count Percentage Change²
$8.02M $1.06M ↓ 87%
¹ Ending 25 August 2002, 3 calendar months before installation.² The percentage change is based on annualised crash data to allow for a direct comparison between the pre and post installation time periods. Red values indicate an increase.
5 years before installation¹
• When comparing the pre installation period to the most recent five year period, there has been no change in casualty crashes at this fixed speed camera location. The change in casualty crashes is not statistically signficant. The data presented do not account for the prevailing statewide trend.• The infringement graph details the trend in infringements at this location since the camera began
operating. Roadworks and camera maintenance may influence the number of infringements issued. • This location was reviewed in 2012 due to concerns that casualties at this location had increased. This
speed camera is also located on a section of the Pacific highway which is yet to be upgraded. This camera was retained until the road was bypassed as part of the Pacific Highway upgrade.
Status : Ineligible
5 years to end 2017
-
(There is currently a review underway at this location.)
Annual NSW Speed Camera Review 2018 - Appendix A: Fixed Speed Cameras A45

9830: Hurstville - Forest Road, between Lily Street and Cronulla Street
School zone: Bethany College, Sydney Technical High School, Hurstville Boys High School, Hurstville Primary SchoolThis location is 710m (patch to patch) in length, and is enforced with one camera.The camera commenced operating on 17 October 2007.
18 17
0 0
5 3
6 16
1 6
15
Fatalities
Serious
Moderate
Minor/Other
Uncategorised
Casualty Crashes
Casualties and Casualty Crashes
Casualty Cost:
Infringements by Month
0
200
400
600
800
1000
1200
1400
Oct-07
Oct-08
Oct-09
Oct-10
Oct-11
Oct-12
Oct-13
Oct-14
Oct-15
Oct-16
Oct-17
Month-Year
Infr
ingem
ents
per
Month
Casualties and Casualty Crashes
0
1
2
3
4
5
6
7
8
9
10
-5Y
-4Y
-3Y
-2Y
-1Y
2008
2009
2010
2011
2012
2013
2014
2015
2016
2017
Number of years before and calendar year after camera installation
Num
ber
of casualti
es/c
asualty
cra
shes
Uncategorised M inor/Other M oderate InjurySerious Injury Killed Casualty Crash
Total Injuries 27 25
-
↓ 7%
↓ 6%
Count Percentage Change²
$5.72M $5.29M ↓ 7%
¹ Ending 17 July 2007, 3 calendar months before installation.² The percentage change is based on annualised crash data to allow for a direct comparison between the pre and post installation time periods. Red values indicate an increase.
5 years before installation¹
• When comparing the pre installation period to the most recent five year period, there has been a 6% decrease in casualty crashes at this fixed speed camera location. The data presented do not account for the prevailing statewide trend.• The infringement graph details the trend in infringements at this location since the camera began
operating. Roadworks and camera maintenance may influence the number of infringements issued.
Status : Retain
5 years to end 2017
-
(There has been no increase in casualty crashes.)
Annual NSW Speed Camera Review 2018 - Appendix A: Fixed Speed Cameras A46

9845|9846: Kingswood - Parker Street, between Copeland Street and Gascoigne Street
School zone: St Dominics CollegeThis location is 340m (patch to patch) in length, and is enforced by 2 cameras.Both cameras commenced operating on 28 January 2009.
16 15
0 0
5 6
7 10
16 5
2
Fatalities
Serious
Moderate
Minor/Other
Uncategorised
Casualty Crashes
Casualties and Casualty Crashes
Casualty Cost:
Infringements by Month
0
100
200
300
400
500
600
700
800
Mar-09
Sep-09
Mar-10
Sep-10
Mar-11
Sep-11
Mar-12
Sep-12
Mar-13
Sep-13
Mar-14
Sep-14
Mar-15
Sep-15
Mar-16
Sep-16
Mar-17
Sep-17
Month-Year
Infr
ingem
ents
per
Month
Casualties and Casualty Crashes
0
1
2
3
4
5
6
7
8
9
-5Y
-4Y
-3Y
-2Y
-1Y
2010
2011
2012
2013
2014
2015
2016
2017
Number of years before and calendar year after camera installation
Num
ber
of casualti
es/c
asualty
cra
shes
Uncategorised M inor/Other M oderate InjurySerious Injury Killed Casualty Crash
Total Injuries 30 21
-
↓ 30%
↓ 6%
Count Percentage Change²
$6.35M $4.45M ↓ 30%
¹ Ending 28 October 2008, 3 calendar months before installation.² The percentage change is based on annualised crash data to allow for a direct comparison between the pre and post installation time periods. Red values indicate an increase.
5 years before installation¹
• When comparing the pre installation period to the most recent five year period, there has been a 6% decrease in casualty crashes at this fixed speed camera location. The data presented do not account for the prevailing statewide trend.• The infringement graph details the trend in infringements at this location since the camera began
operating. Roadworks and camera maintenance may influence the number of infringements issued.
Status : Retain
5 years to end 2017
-
(There has been no increase in casualty crashes.)
Annual NSW Speed Camera Review 2018 - Appendix A: Fixed Speed Cameras A47

9600|9601: Kogarah - Princes Highway, between Gray Street and President Avenue
School zone: St Patricks Primary School, Bethany College, James Cook Boys High School, Moorefield Girls High School, Kogarah Public SchoolThis location is 990m (patch to patch) in length, and is enforced by 2 cameras.Both cameras commenced operating on 15 July 2003.
54 44
1 0
- 10
- 21
- 21
69
Fatalities
Serious
Moderate
Minor/Other
Uncategorised
Casualty Crashes
Casualties and Casualty Crashes
Casualty Cost:
Infringements by Month
0
1000
2000
3000
4000
5000
6000
7000
8000
9000
10000
Jun-03
Jun-04
Jun-05
Jun-06
Jun-07
Jun-08
Jun-09
Jun-10
Jun-11
Jun-12
Jun-13
Jun-14
Jun-15
Jun-16
Jun-17
Month-Year
Infr
ingem
ents
per
Month
Casualties and Casualty Crashes
0
2
4
6
8
10
12
14
16
18
20
-5Y
-4Y
-3Y
-2Y
-1Y
2004
2005
2006
2007
2008
2009
2010
2011
2012
2013
2014
2015
2016
2017
Number of years before and calendar year after camera installation
Num
ber
of casualti
es/c
asualty
cra
shes
Uncategorised M inor/Other M oderate InjurySerious Injury Killed Casualty Crash
Total Injuries 69 52
↓ 100%
↓ 25%
↓ 19%
Count Percentage Change²
$22.20M $11.01M ↓ 50%
¹ Ending 15 April 2003, 3 calendar months before installation.² The percentage change is based on annualised crash data to allow for a direct comparison between the pre and post installation time periods. Red values indicate an increase.
5 years before installation¹
• When comparing the pre installation period to the most recent five year period, there has been a 19% decrease in casualty crashes at this fixed speed camera location. The data presented do not account for the prevailing statewide trend.• The infringement graph details the trend in infringements at this location since the camera began
operating. Roadworks and camera maintenance may influence the number of infringements issued.
Status : Retain
5 years to end 2017
-
(There has been no increase in casualty crashes.)
Annual NSW Speed Camera Review 2018 - Appendix A: Fixed Speed Cameras A48

9574: Korora - Pacific Highway, between Bruxner Park Road and Korora Basin Road
This location is 1000m in length, and is enforced with one camera.The camera commenced operating on 20 February 2003.
7 2
1 0
- 1
- 1
- 0
6
Fatalities
Serious
Moderate
Minor/Other
Uncategorised
Casualty Crashes
Casualties and Casualty Crashes
Casualty Cost:
Infringements by Month
0
100
200
300
400
500
600
700
800
Jan-03
Jan-04
Jan-05
Jan-06
Jan-07
Jan-08
Jan-09
Jan-10
Jan-11
Jan-12
Jan-13
Jan-14
Jan-15
Jan-16
Jan-17
Month-Year
Infr
ingem
ents
per
Month
Casualties and Casualty Crashes
0
1
2
3
4
-5Y
-4Y
-3Y
-2Y
-1Y
2004
2005
2006
2007
2008
2009
2010
2011
2012
2013
2014
2015
2016
2017
Number of years before and calendar year after camera installation
Num
ber
of casualti
es/c
asualty
cra
shes
Uncategorised M inor/Other M oderate InjurySerious Injury Killed Casualty Crash
Total Injuries 6 2
↓ 100%
↓ 67%
↓ 71%
Count Percentage Change²
$8.87M $0.42M ↓ 95%
¹ Ending 20 November 2002, 3 calendar months before installation.² The percentage change is based on annualised crash data to allow for a direct comparison between the pre and post installation time periods. Red values indicate an increase.
5 years before installation¹
• When comparing the pre installation period to the most recent five year period, there has been a 71% decrease in casualty crashes at this fixed speed camera location. The data presented do not account for the prevailing statewide trend.• The infringement graph details the trend in infringements at this location since the camera began
operating. The spike in infringements in July 2012 can be attributed to a speed limit change from 100km/h to 80km/h. Roadworks and camera maintenance may influence the number of infringements issued.
Status : Retain
5 years to end 2017
-
(There has been no increase in casualty crashes.)
Annual NSW Speed Camera Review 2018 - Appendix A: Fixed Speed Cameras A49

9638: Kurrajong - Bells Line of Road, between Queen Street and Bellbird Avenue
This location is 1000m in length, and is enforced with one camera.The camera commenced operating on 22 May 2000.
4 2
0 0
- 0
- 2
- 0
6
Fatalities
Serious
Moderate
Minor/Other
Uncategorised
Casualty Crashes
Casualties and Casualty Crashes
Casualty Cost:
Infringements by Month
0
200
400
600
800
1000
1200
Jul-02
Jul-03
Jul-04
Jul-05
Jul-06
Jul-07
Jul-08
Jul-09
Jul-10
Jul-11
Jul-12
Jul-13
Jul-14
Jul-15
Jul-16
Jul-17
Month-Year
Infr
ingem
ents
per
Month
Casualties and Casualty Crashes
0
1
2
3
4
5
-4Y
-2Y
2001
2003
2005
2007
2009
2011
2013
2015
2017
Number of years before and calendar year after camera installation
Num
ber
of casualti
es/c
asualty
cra
shes
Uncategorised M inor/Other M oderate InjurySerious Injury Killed Casualty Crash
Total Injuries 6 2
-
↓ 73%
↓ 60%
Count Percentage Change²
$1.27M $0.42M ↓ 73%
¹ Ending 22 February 2000, 3 calendar months before installation.² The percentage change is based on annualised crash data to allow for a direct comparison between the pre and post installation time periods. Red values indicate an increase.
4 years before installation¹
• When comparing the pre installation period to the most recent five year period, there has been a 60% decrease in casualty crashes at this fixed speed camera location. The data presented do not account for the prevailing statewide trend.• The infringement graph details the trend in infringements at this location since July 2002. Infringement
data before this date is not available. Roadworks and camera maintenance may influence the number of infringements issued.
Status : Retain
5 years to end 2017
-
(There has been no increase in casualty crashes.)
Annual NSW Speed Camera Review 2018 - Appendix A: Fixed Speed Cameras A50

9550: Lane Cove - Centennial Avenue, between Gentle Street and Figtree Street
This location is 1000m in length, and is enforced with one camera.The camera commenced operating on 10 December 2001.
21 17
1 2
- 4
- 10
- 3
21
Fatalities
Serious
Moderate
Minor/Other
Uncategorised
Casualty Crashes
Casualties and Casualty Crashes
Casualty Cost:
Infringements by Month
0
200
400
600
800
1000
1200
1400
1600
Aug-02
Aug-03
Aug-04
Aug-05
Aug-06
Aug-07
Aug-08
Aug-09
Aug-10
Aug-11
Aug-12
Aug-13
Aug-14
Aug-15
Aug-16
Aug-17
Month-Year
Infr
ingem
ents
per
Month
Casualties and Casualty Crashes
0
1
2
3
4
5
6
7
8
9
-5Y
-3Y
-1Y
2003
2005
2007
2009
2011
2013
2015
2017
Number of years before and calendar year after camera installation
Num
ber
of casualti
es/c
asualty
cra
shes
Uncategorised M inor/Other M oderate InjurySerious Injury Killed Casualty Crash
Total Injuries 21 17
↑ 100%
↓ 19%
↓ 19%
Count Percentage Change²
$12.04M $18.80M ↑ 56%
¹ Ending 10 September 2001, 3 calendar months before installation.² The percentage change is based on annualised crash data to allow for a direct comparison between the pre and post installation time periods. Red values indicate an increase.
5 years before installation¹
• When comparing the pre installation period to the most recent five year period, there has been a 19% decrease in casualty crashes at this fixed speed camera location. The data presented do not account for the prevailing statewide trend.• The infringement graph details the trend in infringements at this location since July 2002. Infringement
data before this date is not available. Roadworks and camera maintenance may influence the number of infringements issued.
Status : Retain
5 years to end 2017
-
(There has been no increase in casualty crashes.)
Annual NSW Speed Camera Review 2018 - Appendix A: Fixed Speed Cameras A51

9546: Lansvale - Hume Highway, between Henry Lawson Drive and Knight Street
This location is 1000m in length, and is enforced with one camera.The camera commenced operating on 5 December 2001.
53 49
2 0
- 9
- 16
- 32
69
Fatalities
Serious
Moderate
Minor/Other
Uncategorised
Casualty Crashes
Casualties and Casualty Crashes
Casualty Cost:
Infringements by Month
0
200
400
600
800
1000
1200
Jul-02
Jul-03
Jul-04
Jul-05
Jul-06
Jul-07
Jul-08
Jul-09
Jul-10
Jul-11
Jul-12
Jul-13
Jul-14
Jul-15
Jul-16
Jul-17
Month-Year
Infr
ingem
ents
per
Month
Casualties and Casualty Crashes
0
5
10
15
20
25
-5Y
-3Y
-1Y
2003
2005
2007
2009
2011
2013
2015
2017
Number of years before and calendar year after camera installation
Num
ber
of casualti
es/c
asualty
cra
shes
Uncategorised M inor/Other M oderate InjurySerious Injury Killed Casualty Crash
Total Injuries 69 57
↓ 100%
↓ 17%
↓ 8%
Count Percentage Change²
$29.80M $12.07M ↓ 60%
¹ Ending 5 September 2001, 3 calendar months before installation.² The percentage change is based on annualised crash data to allow for a direct comparison between the pre and post installation time periods. Red values indicate an increase.
5 years before installation¹
• When comparing the pre installation period to the most recent five year period, there has been an 8% decrease in casualty crashes at this fixed speed camera location. The data presented do not account for the prevailing statewide trend.• The infringement graph details the trend in infringements at this location since July 2002. Infringement
data before this date is not available. Roadworks and camera maintenance may influence the number of infringements issued.
Status : Retain
5 years to end 2017
-
(There has been no increase in casualty crashes.)
Annual NSW Speed Camera Review 2018 - Appendix A: Fixed Speed Cameras A52

9824|9825: Lindfield - Pacific Highway, between Eton Road and Gladstone Parade
School zone: Lindfield Primary SchoolThis location is 480m (patch to patch) in length, and is enforced by 2 cameras.Both cameras commenced operating on 9 July 2007.
8 6
0 0
2 4
1 0
2 3
4
Fatalities
Serious
Moderate
Minor/Other
Uncategorised
Casualty Crashes
Casualties and Casualty Crashes
Casualty Cost:
Infringements by Month
0
1000
2000
3000
4000
5000
6000
7000
Jul-07
Jul-08
Jul-09
Jul-10
Jul-11
Jul-12
Jul-13
Jul-14
Jul-15
Jul-16
Jul-17
Month-Year
Infr
ingem
ents
per
Month
Casualties and Casualty Crashes
0
1
2
3
4
-5Y
-4Y
-3Y
-2Y
-1Y
2008
2009
2010
2011
2012
2013
2014
2015
2016
2017
Number of years before and calendar year after camera installation
Num
ber
of casualti
es/c
asualty
cra
shes
Uncategorised M inor/Other M oderate InjurySerious Injury Killed Casualty Crash
Total Injuries 9 7
-
↓ 22%
↓ 25%
Count Percentage Change²
$1.91M $1.48M ↓ 22%
¹ Ending 9 April 2007, 3 calendar months before installation.² The percentage change is based on annualised crash data to allow for a direct comparison between the pre and post installation time periods. Red values indicate an increase.
5 years before installation¹
• When comparing the pre installation period to the most recent five year period, there has been a 25% decrease in casualty crashes at this fixed speed camera location. The data presented do not account for the prevailing statewide trend.• The infringement graph details the trend in infringements at this location since the camera began
operating. The camera was turned off at this location during 2012 due to road works at this location. Roadworks and camera maintenance may influence the number of infringements issued.
Status : Retain
5 years to end 2017
-
(There has been no increase in casualty crashes.)
Annual NSW Speed Camera Review 2018 - Appendix A: Fixed Speed Cameras A53

9821: Liverpool - Bigge Street, between Elizabeth Drive and Campbell Street
School zone: All Saints Catholic Primary School, All Saints Catholic Girls College, All Saints Catholic Boys CollegeThis location is 360m (patch to patch) in length, and is enforced with one camera.The camera commenced operating on 14 November 2007.
25 13
0 0
0 5
10 4
10 6
13
Fatalities
Serious
Moderate
Minor/Other
Uncategorised
Casualty Crashes
Casualties and Casualty Crashes
Casualty Cost:
Infringements by Month
0
500
1000
1500
2000
2500
Nov-07
Nov-08
Nov-09
Nov-10
Nov-11
Nov-12
Nov-13
Nov-14
Nov-15
Nov-16
Nov-17
Month-Year
Infr
ingem
ents
per
Month
Casualties and Casualty Crashes
0
1
2
3
4
5
6
7
8
9
10
-5Y
-4Y
-3Y
-2Y
-1Y
2008
2009
2010
2011
2012
2013
2014
2015
2016
2017
Number of years before and calendar year after camera installation
Num
ber
of casualti
es/c
asualty
cra
shes
Uncategorised M inor/Other M oderate InjurySerious Injury Killed Casualty Crash
Total Injuries 33 15
-
↓ 55%
↓ 48%
Count Percentage Change²
$6.99M $3.18M ↓ 55%
¹ Ending 14 August 2007, 3 calendar months before installation.² The percentage change is based on annualised crash data to allow for a direct comparison between the pre and post installation time periods. Red values indicate an increase.
5 years before installation¹
• When comparing the pre installation period to the most recent five year period, there has been a 48% decrease in casualty crashes at this fixed speed camera location. The data presented do not account for the prevailing statewide trend.• The infringement graph details the trend in infringements at this location since the camera began
operating. Roadworks and camera maintenance may influence the number of infringements issued.
Status : Retain
5 years to end 2017
-
(There has been no increase in casualty crashes.)
Annual NSW Speed Camera Review 2018 - Appendix A: Fixed Speed Cameras A54

9636: Lochinvar - New England Highway, between Robert Road and Station Lane
School zone: Lochinvar Public School, St Patrick’s Primary School, All Saint’s College – St Joseph’s CampusThis location is 1000m (patch to patch) in length, and is enforced with one camera.The camera commenced operating on 9 May 2000.
3 2
1 0
- 3
- 0
- 1
2
Fatalities
Serious
Moderate
Minor/Other
Uncategorised
Casualty Crashes
Casualties and Casualty Crashes
Casualty Cost:
Infringements by Month
0
100
200
300
400
500
600
700
800
900
Jun-03
Jun-04
Jun-05
Jun-06
Jun-07
Jun-08
Jun-09
Jun-10
Jun-11
Jun-12
Jun-13
Jun-14
Jun-15
Jun-16
Jun-17
Month-Year
Infr
ingem
ents
per
Month
Casualties and Casualty Crashes
0
1
2
3
4
5
6
-4Y
-2Y
2001
2003
2005
2007
2009
2011
2013
2015
2017
Number of years before and calendar year after camera installation
Num
ber
of casualti
es/c
asualty
cra
shes
Uncategorised M inor/Other M oderate InjurySerious Injury Killed Casualty Crash
Total Injuries 2 4
↓ 100%
↑ 60%
↓ 47%
Count Percentage Change²
$8.02M $0.85M ↓ 92%
¹ Ending 9 February 2000, 3 calendar months before installation.² The percentage change is based on annualised crash data to allow for a direct comparison between the pre and post installation time periods. Red values indicate an increase.
4 years before installation¹
• When comparing the pre installation period to the most recent five year period, there has been a 47% decrease in casualty crashes at this fixed speed camera location. The data presented do not account for the prevailing statewide trend.• The infringement graph details the trend in infringements at this location since July 2002. Infringement
data before this date is not available. The spike in infringements from September 2007 was due to the camera commencing speed enforcement of both directions of traffic where it previously enforced one direction. Roadworks and camera maintenance may influence the number of infringements issued. • This location was reviewed in 2012 due to concerns that casualties had increased slightly. The
comprehensive safety review found that since the speed camera was installed, traffic volumes had increased significantly due to mining activities in the Hunter region. Given the increase in traffic volume, the adjusted casualty rate indicated that the speed camera has been effective in reducing casualties. Further, there was strong community support for the retention of the speed camera due to its location in a school zone where safety is a high priority. Therefore the speed camera at this location was retained.
Status : Retain
5 years to end 2017
-
(There has been no increase in casualty crashes.)
Annual NSW Speed Camera Review 2018 - Appendix A: Fixed Speed Cameras A55

9813|9814: Maroubra - Malabar Road, between Mons Avenue and Duncan Street
School zone: St Mary and St Joseph’s Primary, Maroubra BayThis location is 680m (patch to patch) in length, and is enforced by 2 cameras.Both cameras commenced operating on 20 June 2007.
11 9
0 0
0 2
6 6
3 4
5
Fatalities
Serious
Moderate
Minor/Other
Uncategorised
Casualty Crashes
Casualties and Casualty Crashes
Casualty Cost:
Infringements by Month
0
100
200
300
400
500
600
Jun-07
Jun-08
Jun-09
Jun-10
Jun-11
Jun-12
Jun-13
Jun-14
Jun-15
Jun-16
Jun-17
Month-Year
Infr
ingem
ents
per
Month
Casualties and Casualty Crashes
0
1
2
3
4
5
6
7
-5Y
-4Y
-3Y
-2Y
-1Y
2008
2009
2010
2011
2012
2013
2014
2015
2016
2017
Number of years before and calendar year after camera installation
Num
ber
of casualti
es/c
asualty
cra
shes
Uncategorised M inor/Other M oderate InjurySerious Injury Killed Casualty Crash
Total Injuries 14 12
-
↓ 14%
↓ 18%
Count Percentage Change²
$2.96M $2.54M ↓ 14%
¹ Ending 20 March 2007, 3 calendar months before installation.² The percentage change is based on annualised crash data to allow for a direct comparison between the pre and post installation time periods. Red values indicate an increase.
5 years before installation¹
• When comparing the pre installation period to the most recent five year period, there has been an 18% decrease in casualty crashes at this fixed speed camera location. The data presented do not account for the prevailing statewide trend.• The infringement graph details the trend in infringements at this location since the camera began
operating. The spike in infringements in early 2015 is due to a number of infringements having been issued in error. Infringement notices were withdrawn. Roadworks and camera maintenance may influence the number of infringements issued.
Status : Retain
5 years to end 2017
-
(There has been no increase in casualty crashes.)
Annual NSW Speed Camera Review 2018 - Appendix A: Fixed Speed Cameras A56

9582: Mayfield West - Pacific Highway, between Werribee Street and Tourle Street
This location is 1000m in length, and is enforced with one camera.The camera commenced operating on 23 December 2002.
38 22
0 1
- 7
- 5
- 13
52
Fatalities
Serious
Moderate
Minor/Other
Uncategorised
Casualty Crashes
Casualties and Casualty Crashes
Casualty Cost:
Infringements by Month
0
100
200
300
400
500
600
700
800
Nov-02
Nov-03
Nov-04
Nov-05
Nov-06
Nov-07
Nov-08
Nov-09
Nov-10
Nov-11
Nov-12
Nov-13
Nov-14
Nov-15
Nov-16
Nov-17
Month-Year
Infr
ingem
ents
per
Month
Casualties and Casualty Crashes
0
2
4
6
8
10
12
14
16
18
-5Y
-3Y
-1Y
2004
2006
2008
2010
2012
2014
2016
Number of years before and calendar year after camera installation
Num
ber
of casualti
es/c
asualty
cra
shes
Uncategorised M inor/Other M oderate InjurySerious Injury Killed Casualty Crash
Total Injuries 52 25
Increase
↓ 52%
↓ 42%
Count Percentage Change²
$11.01M $12.89M ↑ 17%
¹ Ending 23 September 2002, 3 calendar months before installation.² The percentage change is based on annualised crash data to allow for a direct comparison between the pre and post installation time periods. Red values indicate an increase.
5 years before installation¹
• When comparing the pre installation period to the most recent five year period, there has been a 42% decrease in casualty crashes at this fixed speed camera location. The data presented do not account for the prevailing statewide trend.• The infringement graph details the trend in infringements at this location since the camera began
operating. Roadworks and camera maintenance may influence the number of infringements issued.
Status : Retain
5 years to end 2017
-
(There has been no increase in casualty crashes.)
Annual NSW Speed Camera Review 2018 - Appendix A: Fixed Speed Cameras A57

9810: Merrylands - Merrylands Road, between Chetwynd Road and Davies Street
School zone: St Margaret Mary’s Primary SchoolThis location is 220m (patch to patch) in length, and is enforced with one camera.The camera commenced operating on 16 May 2007.
15 8
2 0
2 3
5 2
1 4
7
Fatalities
Serious
Moderate
Minor/Other
Uncategorised
Casualty Crashes
Casualties and Casualty Crashes
Casualty Cost:
Infringements by Month
0
200
400
600
800
1000
1200
1400
1600
1800
May-07
May-08
May-09
May-10
May-11
May-12
May-13
May-14
May-15
May-16
May-17
Month-Year
Infr
ingem
ents
per
Month
Casualties and Casualty Crashes
0
1
2
3
4
5
6
7
-5Y
-4Y
-3Y
-2Y
-1Y
2008
2009
2010
2011
2012
2013
2014
2015
2016
2017
Number of years before and calendar year after camera installation
Num
ber
of casualti
es/c
asualty
cra
shes
Uncategorised M inor/Other M oderate InjurySerious Injury Killed Casualty Crash
Total Injuries 15 9
↓ 100%
↓ 40%
↓ 47%
Count Percentage Change²
$18.37M $1.91M ↓ 90%
¹ Ending 16 February 2007, 3 calendar months before installation.² The percentage change is based on annualised crash data to allow for a direct comparison between the pre and post installation time periods. Red values indicate an increase.
5 years before installation¹
• When comparing the pre installation period to the most recent five year period, there has been a 47% decrease in casualty crashes at this fixed speed camera location. The data presented do not account for the prevailing statewide trend.• The infringement graph details the trend in infringements at this location since the camera began
operating. Roadworks and camera maintenance may influence the number of infringements issued.
Status : Retain
5 years to end 2017
-
(There has been no increase in casualty crashes.)
Annual NSW Speed Camera Review 2018 - Appendix A: Fixed Speed Cameras A58

9833|9834: Miranda - Kingsway, between Sylva Avenue and University Road
School zone: Port Hacking High School, Miranda Public SchoolThis location is 400 (patch to patch) in length, and is enforced by 2 cameras.Both cameras commenced operating on 7 November 2007.
14 2
0 0
2 0
6 1
3 1
8
Fatalities
Serious
Moderate
Minor/Other
Uncategorised
Casualty Crashes
Casualties and Casualty Crashes
Casualty Cost:
Infringements by Month
0
200
400
600
800
1000
1200
1400
1600
Nov-07
Nov-08
Nov-09
Nov-10
Nov-11
Nov-12
Nov-13
Nov-14
Nov-15
Nov-16
Nov-17
Month-Year
Infr
ingem
ents
per
Month
Casualties and Casualty Crashes
0
1
2
3
4
5
-5Y
-4Y
-3Y
-2Y
-1Y
2008
2009
2010
2011
2012
2013
2014
2015
2016
2017
Number of years before and calendar year after camera installation
Num
ber
of casualti
es/c
asualty
cra
shes
Uncategorised M inor/Other M oderate InjurySerious Injury Killed Casualty Crash
Total Injuries 19 2
-
↓ 89%
↓ 86%
Count Percentage Change²
$4.02M $0.42M ↓ 89%
¹ Ending 7 August 2007, 3 calendar months before installation.² The percentage change is based on annualised crash data to allow for a direct comparison between the pre and post installation time periods. Red values indicate an increase.
5 years before installation¹
• When comparing the pre installation period to the most recent five year period, there has been an 86% decrease in casualty crashes at this fixed speed camera location. The data presented do not account for the prevailing statewide trend.• The infringement graph details the trend in infringements at this location since the camera began
operating. Roadworks and camera maintenance may influence the number of infringements issued.
Status : Retain
5 years to end 2017
-
(There has been no increase in casualty crashes.)
Annual NSW Speed Camera Review 2018 - Appendix A: Fixed Speed Cameras A59

9837|9838: Moore Park - Cleveland Street, between Anzac Parade and South Dowling Street
School zone: Sydney Boys High School, Sydney Girls High SchoolThis location is 380m (patch to patch) in length, and is enforced by 2 cameras.The cameras commenced operating on: • Camera 1 (eastbound) 14 November 2007 • Camera 2 (westbound) 15 November 2007
10 7
0 0
3 3
1 2
5 2
5
Fatalities
Serious
Moderate
Minor/Other
Uncategorised
Casualty Crashes
Casualties and Casualty Crashes
Casualty Cost:
Infringements by Month
0
2000
4000
6000
8000
10000
12000
Dec-07
Dec-08
Dec-09
Dec-10
Dec-11
Dec-12
Dec-13
Dec-14
Dec-15
Dec-16
Dec-17
Month-Year
Infr
ingem
ents
per
Month
Casualties and Casualty Crashes
0
1
2
3
4
5
6
7
-5Y
-4Y
-3Y
-2Y
-1Y
2008
2009
2010
2011
2012
2013
2014
2015
2016
2017
Number of years before and calendar year after camera installation
Num
ber
of casualti
es/c
asualty
cra
shes
Uncategorised M inor/Other M oderate InjurySerious Injury Killed Casualty Crash
Total Injuries 14 7
-
↓ 50%
↓ 30%
Count Percentage Change²
$2.96M $1.48M ↓ 50%
¹ Ending 14 August 2007, 3 calendar months before installation.² The percentage change is based on annualised crash data to allow for a direct comparison between the pre and post installation time periods. Red values indicate an increase.
5 years before installation¹
• When comparing the pre installation period to the most recent five year period, there has been a 30% decrease in casualty crashes at this fixed speed camera location. The data presented do not account for the prevailing statewide trend.• The infringement graph details the trend in infringements at this location since the camera began
operating. Roadworks and camera maintenance may influence the number of infringements issued.
Status : Retain
5 years to end 2017
-
(There has been no increase in casualty crashes.)
Annual NSW Speed Camera Review 2018 - Appendix A: Fixed Speed Cameras A60

9602: Mosman - Macpherson Street, between Ourimbah Road and Montague Road
School zone: Middle Harbour Primary SchoolThis location is 320m (patch to patch) in length, and is enforced with one camera.The camera commenced operating on 15 July 2003.
4 2
0 0
- 0
- 1
- 1
6
Fatalities
Serious
Moderate
Minor/Other
Uncategorised
Casualty Crashes
Casualties and Casualty Crashes
Casualty Cost:
Infringements by Month
0
1000
2000
3000
4000
5000
6000
Jun-03
Jun-04
Jun-05
Jun-06
Jun-07
Jun-08
Jun-09
Jun-10
Jun-11
Jun-12
Jun-13
Jun-14
Jun-15
Jun-16
Jun-17
Month-Year
Infr
ingem
ents
per
Month
Casualties and Casualty Crashes
0
1
2
3
4
-5Y
-4Y
-3Y
-2Y
-1Y
2004
2005
2006
2007
2008
2009
2010
2011
2012
2013
2014
2015
2016
2017
Number of years before and calendar year after camera installation
Num
ber
of casualti
es/c
asualty
cra
shes
Uncategorised M inor/Other M oderate InjurySerious Injury Killed Casualty Crash
Total Injuries 6 2
-
↓ 67%
↓ 50%
Count Percentage Change²
$1.27M $0.42M ↓ 67%
¹ Ending 15 April 2003, 3 calendar months before installation.² The percentage change is based on annualised crash data to allow for a direct comparison between the pre and post installation time periods. Red values indicate an increase.
5 years before installation¹
• When comparing the pre installation period to the most recent five year period, there has been a 50% decrease in casualty crashes at this fixed speed camera location. The data presented do not account for the prevailing statewide trend.• The infringement graph details the trend in infringements at this location since the camera began
operating. Roadworks and camera maintenance may influence the number of infringements issued.
Status : Retain
5 years to end 2017
-
(There has been no increase in casualty crashes.)
Annual NSW Speed Camera Review 2018 - Appendix A: Fixed Speed Cameras A61

9666: Mount Victoria - Great Western Highway, between Mitchells Lookout Road and Ambermere Drive
This location is 1000m in length, and is enforced with one camera.The camera commenced operating on 25 July 2015.
16 3
2 0
5 0
16 4
3 0
0
Fatalities
Serious
Moderate
Minor/Other
Uncategorised
Casualty Crashes
Casualties and Casualty Crashes
Casualty Cost:
Infringements by Month
0
500
1000
1500
2000
2500
3000
3500
4000
4500
Oct-15
Dec-15
Feb-16
Apr-16
Jun-16
Aug-16
Oct-16
Dec-16
Feb-17
Apr-17
Jun-17
Aug-17
Oct-17
Dec-17
Month-Year
Infr
ingem
ents
per
Month
Casualties and Casualty Crashes
0
1
2
3
4
5
6
7
8
9
10
-5Y
-4Y
-3Y
-2Y
-1Y
2016
2017
Number of years before and calendar year after camera installation
Num
ber
of casualti
es/c
asualty
cra
shes
Uncategorised M inor/Other M oderate InjurySerious Injury Killed Casualty Crash
Total Injuries 24 4
↓ 100%
↓ 66%
↓ 62%
Count Percentage Change²
$20.28M $0.85M ↓ 91%
¹ Ending 25 April 2015, 3 calendar months before installation.² The percentage change is based on annualised crash data to allow for a direct comparison between the pre and post installation time periods. Red values indicate an increase.
5 years before installation¹
• CRS will develop further commentary when there is additional data available for this location in the future.• The infringement graph details the trend in infringements at this location since the camera began
operating. Roadworks and camera maintenance may influence the number of infringements issued.
Status : Insufficient data
2.44 years to end 2017
-
Annual NSW Speed Camera Review 2018 - Appendix A: Fixed Speed Cameras A62

9826|9827: Narrabeen - Pittwater Road, between Ocean Street and Devitt Street
School zone: Narrabeen Lakes Primary SchoolThis location is 300m (patch to patch) in length, and is enforced by 2 cameras.Both cameras commenced operating on 31 October 2007.
11 9
2 0
1 5
6 2
0 2
6
Fatalities
Serious
Moderate
Minor/Other
Uncategorised
Casualty Crashes
Casualties and Casualty Crashes
Casualty Cost:
Infringements by Month
0
500
1000
1500
2000
2500
3000
3500
Oct-07
Oct-08
Oct-09
Oct-10
Oct-11
Oct-12
Oct-13
Oct-14
Oct-15
Oct-16
Oct-17
Month-Year
Infr
ingem
ents
per
Month
Casualties and Casualty Crashes
0
1
2
3
4
5
6
7
8
-5Y
-4Y
-3Y
-2Y
-1Y
2008
2009
2010
2011
2012
2013
2014
2015
2016
2017
Number of years before and calendar year after camera installation
Num
ber
of casualti
es/c
asualty
cra
shes
Uncategorised M inor/Other M oderate InjurySerious Injury Killed Casualty Crash
Total Injuries 13 9
↓ 100%
↓ 31%
↓ 18%
Count Percentage Change²
$17.95M $1.91M ↓ 89%
¹ Ending 31 July 2007, 3 calendar months before installation.² The percentage change is based on annualised crash data to allow for a direct comparison between the pre and post installation time periods. Red values indicate an increase.
5 years before installation¹
• When comparing the pre installation period to the most recent five year period, there has been an 18% decrease in casualty crashes at this fixed speed camera location. The data presented do not account for the prevailing statewide trend.• The infringement graph details the trend in infringements at this location since the camera began
operating. Roadworks and camera maintenance may influence the number of infringements issued.
Status : Retain
5 years to end 2017
-
(There has been no increase in casualty crashes.)
Annual NSW Speed Camera Review 2018 - Appendix A: Fixed Speed Cameras A63

9667: Narraweena - Warringah Road, near the intersection with May Road
This location is 1000m in length, and is enforced with one camera.The camera commenced operating on 14 December 2015.
36 9
1 0
8 4
22 2
20 5
0
Fatalities
Serious
Moderate
Minor/Other
Uncategorised
Casualty Crashes
Casualties and Casualty Crashes
Casualty Cost:
Infringements by Month
0
200
400
600
800
1000
1200
Feb-16
Apr-16
Jun-16
Aug-16
Oct-16
Dec-16
Feb-17
Apr-17
Jun-17
Aug-17
Oct-17
Dec-17
Month-Year
Infr
ingem
ents
per
Month
Casualties and Casualty Crashes
0
2
4
6
8
10
12
14
-5Y
-4Y
-3Y
-2Y
-1Y
2016
2017
Number of years before and calendar year after camera installation
Num
ber
of casualti
es/c
asualty
cra
shes
Uncategorised M inor/Other M oderate InjurySerious Injury Killed Casualty Crash
Total Injuries 50 11
↓ 100%
↓ 46%
↓ 39%
Count Percentage Change²
$18.18M $2.33M ↓ 69%
¹ Ending 14 September 2015, 3 calendar months before installation.² The percentage change is based on annualised crash data to allow for a direct comparison between the pre and post installation time periods. Red values indicate an increase.
5 years before installation¹
• CRS will develop further commentary when there is additional data available for this location in the future.• The infringement graph details the trend in infringements at this location since the camera began
operating. Roadworks and camera maintenance may influence the number of infringements issued.
Status : Insufficient data
2.05 years to end 2017
-
Annual NSW Speed Camera Review 2018 - Appendix A: Fixed Speed Cameras A64

9620|9621: New Italy - Pacific Highway, between New Italy Road and Turners Road
This location is 1000m in length, and is enforced by 2 cameras.Both cameras commenced operating on 25 July 2002.
2 1
0 0
- 1
- 0
- 0
3
Fatalities
Serious
Moderate
Minor/Other
Uncategorised
Casualty Crashes
Casualties and Casualty Crashes
Casualty Cost:
Infringements by Month
0
10
20
30
40
50
60
70
80
Aug-02
Aug-03
Aug-04
Aug-05
Aug-06
Aug-07
Aug-08
Aug-09
Aug-10
Aug-11
Aug-12
Aug-13
Aug-14
Aug-15
Aug-16
Aug-17
Month-Year
Infr
ingem
ents
per
Month
Casualties and Casualty Crashes
0
1
2
3
4
-5Y
-3Y
-1Y
2004
2006
2008
2010
2012
2014
2016
Number of years before and calendar year after camera installation
Num
ber
of casualti
es/c
asualty
cra
shes
Uncategorised M inor/Other M oderate InjurySerious Injury Killed Casualty Crash
Total Injuries 3 1
-
↓ 67%
↓ 50%
Count Percentage Change²
$0.64M $0.21M ↓ 67%
¹ Ending 25 April 2002, 3 calendar months before installation.² The percentage change is based on annualised crash data to allow for a direct comparison between the pre and post installation time periods. Red values indicate an increase.
5 years before installation¹
• When comparing the pre installation period to the most recent five year period, there has been a 50% decrease in casualty crashes at this fixed speed camera location. The data presented do not account for the prevailing statewide trend.• The infringement graph details the trend in infringements at this location since the camera began
operating. Roadworks and camera maintenance may influence the number of infringements issued.
Status : Retain
5 years to end 2017
-
(There has been no increase in casualty crashes.)
Annual NSW Speed Camera Review 2018 - Appendix A: Fixed Speed Cameras A65

9583: Nords Wharf - Pacific Highway, between Nords Wharf Road and Flowers Drive
This location is 1000m in length, and is enforced with one camera.The camera commenced operating on 27 February 2003.
2 2
0 0
- 0
- 2
- 3
2
Fatalities
Serious
Moderate
Minor/Other
Uncategorised
Casualty Crashes
Casualties and Casualty Crashes
Casualty Cost:
Infringements by Month
0
50
100
150
200
250
Jan-03
Jan-04
Jan-05
Jan-06
Jan-07
Jan-08
Jan-09
Jan-10
Jan-11
Jan-12
Jan-13
Jan-14
Jan-15
Jan-16
Jan-17
Month-Year
Infr
ingem
ents
per
Month
Casualties and Casualty Crashes
0
1
2
3
4
5
6
-5Y
-4Y
-3Y
-2Y
-1Y
2004
2005
2006
2007
2008
2009
2010
2011
2012
2013
2014
2015
2016
2017
Number of years before and calendar year after camera installation
Num
ber
of casualti
es/c
asualty
cra
shes
Uncategorised M inor/Other M oderate InjurySerious Injury Killed Casualty Crash
Total Injuries 2 5
-
↑ 150%
0%
Count Percentage Change²
$0.42M $1.06M ↑ 150%
¹ Ending 27 November 2002, 3 calendar months before installation.² The percentage change is based on annualised crash data to allow for a direct comparison between the pre and post installation time periods. Red values indicate an increase.
5 years before installation¹
• When comparing the pre installation period to the most recent five year period, there has been no change in casualty crashes at this fixed speed camera location. The change in casualty crashes is not statistically signficant. The data presented do not account for the prevailing statewide trend.• The infringement graph details the trend in infringements at this location since the camera began
operating. Roadworks and camera maintenance may influence the number of infringements issued.
Status : Retain
5 years to end 2017
-
(There has been no increase in casualty crashes.)
Annual NSW Speed Camera Review 2018 - Appendix A: Fixed Speed Cameras A66

9831: North Curl Curl - Harbord Road, between Abbott Road and Brighton Street
School zone: Freshwater Senior High School, Manly Selective CampusThis location is 1060m (patch to patch) in length, and is enforced with one camera.The camera commenced operating on 31 October 2007.
21 10
0 0
4 4
2 3
6 5
14
Fatalities
Serious
Moderate
Minor/Other
Uncategorised
Casualty Crashes
Casualties and Casualty Crashes
Casualty Cost:
Infringements by Month
0
100
200
300
400
500
600
700
800
900
Nov-07
Nov-08
Nov-09
Nov-10
Nov-11
Nov-12
Nov-13
Nov-14
Nov-15
Nov-16
Nov-17
Month-Year
Infr
ingem
ents
per
Month
Casualties and Casualty Crashes
0
1
2
3
4
5
6
7
8
9
10
-5Y
-4Y
-3Y
-2Y
-1Y
2008
2009
2010
2011
2012
2013
2014
2015
2016
2017
Number of years before and calendar year after camera installation
Num
ber
of casualti
es/c
asualty
cra
shes
Uncategorised M inor/Other M oderate InjurySerious Injury Killed Casualty Crash
Total Injuries 26 12
-
↓ 54%
↓ 52%
Count Percentage Change²
$5.50M $2.54M ↓ 54%
¹ Ending 31 July 2007, 3 calendar months before installation.² The percentage change is based on annualised crash data to allow for a direct comparison between the pre and post installation time periods. Red values indicate an increase.
5 years before installation¹
• When comparing the pre installation period to the most recent five year period, there has been a 52% decrease in casualty crashes at this fixed speed camera location. The data presented do not account for the prevailing statewide trend.• The infringement graph details the trend in infringements at this location since the camera began
operating. Roadworks and camera maintenance may influence the number of infringements issued.
Status : Retain
5 years to end 2017
-
(There has been no increase in casualty crashes.)
Annual NSW Speed Camera Review 2018 - Appendix A: Fixed Speed Cameras A67

9665: North Macksville - Pacific Highway, between Bellview Drive and Ferry Street
This location is 1000m in length, and is enforced with one camera.The camera commenced operating on 10 January 2015.
10 1
0 0
5 1
2 0
5 1
0
Fatalities
Serious
Moderate
Minor/Other
Uncategorised
Casualty Crashes
Casualties and Casualty Crashes
Casualty Cost:
Infringements by Month
0
20
40
60
80
100
120
140
160
180
200
Jan-15
Mar-15
May-15
Jul-15
Sep-15
Nov-15
Jan-16
Mar-16
May-16
Jul-16
Sep-16
Nov-16
Jan-17
Mar-17
May-17
Jul-17
Sep-17
Nov-17
Month-Year
Infr
ingem
ents
per
Month
Casualties and Casualty Crashes
0
1
2
3
4
5
6
7
8
-5Y
-4Y
-3Y
-2Y
-1Y
2016
2017
Number of years before and calendar year after camera installation
Num
ber
of casualti
es/c
asualty
cra
shes
Uncategorised M inor/Other M oderate InjurySerious Injury Killed Casualty Crash
Total Injuries 12 2
-
↓ 72%
↓ 83%
Count Percentage Change²
$2.54M $0.42M ↓ 72%
¹ Ending 10 October 2014, 3 calendar months before installation.² The percentage change is based on annualised crash data to allow for a direct comparison between the pre and post installation time periods. Red values indicate an increase.
5 years before installation¹
• CRS will develop further commentary when there is additional data available for this location in the future.• The infringement graph details the trend in infringements at this location since the camera began
operating. Roadworks and camera maintenance may influence the number of infringements issued.
Status : Insufficient data
2.97 years to end 2017
-
Annual NSW Speed Camera Review 2018 - Appendix A: Fixed Speed Cameras A68

9578: North Macksville - Pacific Highway, between Florence Wilmont Drive and Watt Creek
This location is 1000m in length, and is enforced with one camera.The camera commenced operating on 3 March 2003.
6 4
3 0
- 3
- 4
- 3
12
Fatalities
Serious
Moderate
Minor/Other
Uncategorised
Casualty Crashes
Casualties and Casualty Crashes
Casualty Cost:
Infringements by Month
0
10
20
30
40
50
60
70
80
90
May-03
May-04
May-05
May-06
May-07
May-08
May-09
May-10
May-11
May-12
May-13
May-14
May-15
May-16
May-17
Month-Year
Infr
ingem
ents
per
Month
Casualties and Casualty Crashes
0
1
2
3
4
5
6
7
-5Y
-4Y
-3Y
-2Y
-1Y
2004
2005
2006
2007
2008
2009
2010
2011
2012
2013
2014
2015
2016
2017
Number of years before and calendar year after camera installation
Num
ber
of casualti
es/c
asualty
cra
shes
Uncategorised M inor/Other M oderate InjurySerious Injury Killed Casualty Crash
Total Injuries 12 10
↓ 100%
↓ 17%
↓ 33%
Count Percentage Change²
$25.34M $2.12M ↓ 92%
¹ Ending 3 December 2002, 3 calendar months before installation.² The percentage change is based on annualised crash data to allow for a direct comparison between the pre and post installation time periods. Red values indicate an increase.
5 years before installation¹
• When comparing the pre installation period to the most recent five year period, there has been a 33% decrease in casualty crashes at this fixed speed camera location. The data presented do not account for the prevailing statewide trend.• The infringement graph details the trend in infringements at this location since the camera began
operating. Roadworks and camera maintenance may influence the number of infringements issued.
Status : Retain
5 years to end 2017
-
(There has been no increase in casualty crashes.)
Annual NSW Speed Camera Review 2018 - Appendix A: Fixed Speed Cameras A69

9847|9848: North Narrabeen - Pittwater Road, between Garden Street and Namona Street
School zone: Narrabeen North Public School, Narrabeen Sports HighThis location is 590m (patch to patch) in length, and is enforced by 2 cameras.Both cameras commenced operating on 28 January 2009.
9 12
0 0
0 5
5 7
1 7
6
Fatalities
Serious
Moderate
Minor/Other
Uncategorised
Casualty Crashes
Casualties and Casualty Crashes
Casualty Cost:
Infringements by Month
0
200
400
600
800
1000
1200
Apr-09
Oct-09
Apr-10
Oct-10
Apr-11
Oct-11
Apr-12
Oct-12
Apr-13
Oct-13
Apr-14
Oct-14
Apr-15
Oct-15
Apr-16
Oct-16
Apr-17
Oct-17
Month-Year
Infr
ingem
ents
per
Month
Casualties and Casualty Crashes
0
1
2
3
4
5
6
7
-5Y
-4Y
-3Y
-2Y
-1Y
2010
2011
2012
2013
2014
2015
2016
2017
Number of years before and calendar year after camera installation
Num
ber
of casualti
es/c
asualty
cra
shes
Uncategorised M inor/Other M oderate InjurySerious Injury Killed Casualty Crash
Total Injuries 12 19
-
↑ 58%
↑ 33%
Count Percentage Change²
$2.54M $4.02M ↑ 58%
¹ Ending 28 October 2008, 3 calendar months before installation.² The percentage change is based on annualised crash data to allow for a direct comparison between the pre and post installation time periods. Red values indicate an increase.
5 years before installation¹
• When comparing the pre installation period to the most recent five year period, there has been a 33% increase in casualty crashes at this fixed speed camera location. The increase in casualty crashes is not statistically signficant. The data presented do not account for the prevailing statewide trend.• The infringement graph details the trend in infringements at this location since the camera began
operating. Roadworks and camera maintenance may influence the number of infringements issued.
Status : Ineligible
5 years to end 2017
-
(There is currently a review underway at this location.)
Annual NSW Speed Camera Review 2018 - Appendix A: Fixed Speed Cameras A70

9541: North Parramatta - Pennant Hills Road, between Castle Street and Bellevue Street
This location is 1000m in length, and is enforced with one camera.The camera commenced operating on 30 November 2001.
13 10
0 0
- 2
- 3
- 6
17
Fatalities
Serious
Moderate
Minor/Other
Uncategorised
Casualty Crashes
Casualties and Casualty Crashes
Casualty Cost:
Infringements by Month
0
200
400
600
800
1000
1200
1400
Jul-02
Jul-03
Jul-04
Jul-05
Jul-06
Jul-07
Jul-08
Jul-09
Jul-10
Jul-11
Jul-12
Jul-13
Jul-14
Jul-15
Jul-16
Jul-17
Month-Year
Infr
ingem
ents
per
Month
Casualties and Casualty Crashes
0
2
4
6
8
10
12
14
16
-5Y
-3Y
-1Y
2003
2005
2007
2009
2011
2013
2015
2017
Number of years before and calendar year after camera installation
Num
ber
of casualti
es/c
asualty
cra
shes
Uncategorised M inor/Other M oderate InjurySerious Injury Killed Casualty Crash
Total Injuries 17 11
-
↓ 35%
↓ 23%
Count Percentage Change²
$3.60M $2.33M ↓ 35%
¹ Ending 30 August 2001, 3 calendar months before installation.² The percentage change is based on annualised crash data to allow for a direct comparison between the pre and post installation time periods. Red values indicate an increase.
5 years before installation¹
• When comparing the pre installation period to the most recent five year period, there has been a 23% decrease in casualty crashes at this fixed speed camera location. The data presented do not account for the prevailing statewide trend.• The infringement graph details the trend in infringements at this location since July 2002. Infringement
data before this date is not available. Roadworks and camera maintenance may influence the number of infringements issued.
Status : Retain
5 years to end 2017
-
(There has been no increase in casualty crashes.)
Annual NSW Speed Camera Review 2018 - Appendix A: Fixed Speed Cameras A71

9657|9658: North Parramatta / Oatlands - Pennant Hills Road, between Masons Drive and Suttor Avenue
School zone: Burnside Public School, The Kings School, Redeemer Baptist School, Garfield Barwick School, American International School, Cumberland High SchoolThis location is 2770m (patch to patch) in length, and is enforced by 2 cameras.Both cameras commenced operating on 10 April 2007.
46 30
1 2
6 14
7 16
15 10
37
Fatalities
Serious
Moderate
Minor/Other
Uncategorised
Casualty Crashes
Casualties and Casualty Crashes
Casualty Cost:
Infringements by Month
0
500
1000
1500
2000
2500
3000
Apr-07
Apr-08
Apr-09
Apr-10
Apr-11
Apr-12
Apr-13
Apr-14
Apr-15
Apr-16
Apr-17
Month-Year
Infr
ingem
ents
per
Month
Casualties and Casualty Crashes
0
2
4
6
8
10
12
14
16
18
20
-5Y
-4Y
-3Y
-2Y
-1Y
2008
2009
2010
2011
2012
2013
2014
2015
2016
2017
Number of years before and calendar year after camera installation
Num
ber
of casualti
es/c
asualty
cra
shes
Uncategorised M inor/Other M oderate InjurySerious Injury Killed Casualty Crash
Total Injuries 65 40
↑ 100%
↓ 38%
↓ 35%
Count Percentage Change²
$21.36M $23.66M ↑ 11%
¹ Ending 10 January 2007, 3 calendar months before installation.² The percentage change is based on annualised crash data to allow for a direct comparison between the pre and post installation time periods. Red values indicate an increase.
5 years before installation¹
• When comparing the pre installation period to the most recent five year period, there has been a 35%decrease in casualty crashes at this fixed speed camera location. The data presented do not account for the prevailing statewide trend.• The infringement graph details the trend in infringements at this location since the camera began
operating. Roadworks and camera maintenance may influence the number of infringements issued.
Status : Retain
5 years to end 2017
-
(There has been no increase in casualty crashes.)
Annual NSW Speed Camera Review 2018 - Appendix A: Fixed Speed Cameras A72

9639: North Wollongong - Princes Highway, between Ajax Avenue and Exeter Avenue
This location is 1000m in length, and is enforced with one camera.The camera commenced operating on 13 June 2000.
31 27
0 0
- 8
- 9
- 15
50
Fatalities
Serious
Moderate
Minor/Other
Uncategorised
Casualty Crashes
Casualties and Casualty Crashes
Casualty Cost:
Infringements by Month
0
200
400
600
800
1000
1200
Jul-02
Jul-03
Jul-04
Jul-05
Jul-06
Jul-07
Jul-08
Jul-09
Jul-10
Jul-11
Jul-12
Jul-13
Jul-14
Jul-15
Jul-16
Jul-17
Month-Year
Infr
ingem
ents
per
Month
Casualties and Casualty Crashes
0
2
4
6
8
10
12
14
16
18
20
-4Y
-2Y
2001
2003
2005
2007
2009
2011
2013
2015
2017
Number of years before and calendar year after camera installation
Num
ber
of casualti
es/c
asualty
cra
shes
Uncategorised M inor/Other M oderate InjurySerious Injury Killed Casualty Crash
Total Injuries 50 32
-
↓ 49%
↓ 30%
Count Percentage Change²
$10.58M $6.77M ↓ 49%
¹ Ending 13 March 2000, 3 calendar months before installation.² The percentage change is based on annualised crash data to allow for a direct comparison between the pre and post installation time periods. Red values indicate an increase.
4 years before installation¹
• When comparing the pre installation period to the most recent five year period, there has been a 30% decrease in casualty crashes at this fixed speed camera location. The data presented do not account for the prevailing statewide trend.• The infringement graph details the trend in infringements at this location since July 2002. Infringement
data before this date is not available. Roadworks and camera maintenance may influence the number of infringements issued.
Status : Retain
5 years to end 2017
-
(There has been no increase in casualty crashes.)
Annual NSW Speed Camera Review 2018 - Appendix A: Fixed Speed Cameras A73

9841|9842: Old Guildford - Woodville Road, between Orchardleigh Street and Middleton Road
School zone: Old Guildford Public SchoolThis location is 370m in length, and is enforced by 2 cameras.Both cameras commenced operating on 30 January 2009.
19 10
0 1
9 5
5 7
5 4
5
Fatalities
Serious
Moderate
Minor/Other
Uncategorised
Casualty Crashes
Casualties and Casualty Crashes
Casualty Cost:
Infringements by Month
0
200
400
600
800
1000
1200
Apr-09
Oct-09
Apr-10
Oct-10
Apr-11
Oct-11
Apr-12
Oct-12
Apr-13
Oct-13
Apr-14
Oct-14
Apr-15
Oct-15
Apr-16
Oct-16
Apr-17
Oct-17
Month-Year
Infr
ingem
ents
per
Month
Casualties and Casualty Crashes
0
1
2
3
4
5
6
7
8
9
-5Y
-4Y
-3Y
-2Y
-1Y
2010
2011
2012
2013
2014
2015
2016
2017
Number of years before and calendar year after camera installation
Num
ber
of casualti
es/c
asualty
cra
shes
Uncategorised M inor/Other M oderate InjurySerious Injury Killed Casualty Crash
Total Injuries 24 16
Increase
↓ 33%
↓ 47%
Count Percentage Change²
$5.08M $10.99M ↑ 116%
¹ Ending 30 October 2008, 3 calendar months before installation.² The percentage change is based on annualised crash data to allow for a direct comparison between the pre and post installation time periods. Red values indicate an increase.
5 years before installation¹
• When comparing the pre installation period to the most recent five year period, there has been a 47%decrease in casualty crashes at this fixed speed camera location. The data presented do not account for the prevailing statewide trend.• The infringement graph details the trend in infringements at this location since the camera began
operating. Roadworks and camera maintenance may influence the number of infringements issued.
Status : Retain
5 years to end 2017
-
(There has been no increase in casualty crashes.)
Annual NSW Speed Camera Review 2018 - Appendix A: Fixed Speed Cameras A74

9535: Ourimbah - M1 Pacific Motorway, between Dogtrap Road Overpass and Ourimbah Creek Road
This location is 1000m in length, and is enforced with one camera.The camera commenced operating on 6 December 2001.
8 4
1 0
- 2
- 1
- 1
8
Fatalities
Serious
Moderate
Minor/Other
Uncategorised
Casualty Crashes
Casualties and Casualty Crashes
Casualty Cost:
Infringements by Month
0
100
200
300
400
500
600
Jul-02
Jul-03
Jul-04
Jul-05
Jul-06
Jul-07
Jul-08
Jul-09
Jul-10
Jul-11
Jul-12
Jul-13
Jul-14
Jul-15
Jul-16
Jul-17
Month-Year
Infr
ingem
ents
per
Month
Casualties and Casualty Crashes
0
1
2
3
4
5
6
7
8
9
10
-5Y
-3Y
-1Y
2003
2005
2007
2009
2011
2013
2015
2017
Number of years before and calendar year after camera installation
Num
ber
of casualti
es/c
asualty
cra
shes
Uncategorised M inor/Other M oderate InjurySerious Injury Killed Casualty Crash
Total Injuries 8 4
↓ 100%
↓ 50%
↓ 50%
Count Percentage Change²
$9.29M $0.85M ↓ 91%
¹ Ending 6 September 2001, 3 calendar months before installation.² The percentage change is based on annualised crash data to allow for a direct comparison between the pre and post installation time periods. Red values indicate an increase.
5 years before installation¹
• When comparing the pre installation period to the most recent five year period, there has been a 50% decrease in casualty crashes at this fixed speed camera location. The data presented do not account for the prevailing statewide trend.• The infringement graph details the trend in infringements at this location since July 2002. Infringement
data before this date is not available. Roadworks and camera maintenance may influence the number of infringements issued.
Status : Retain
5 years to end 2017
-
(There has been no increase in casualty crashes.)
Annual NSW Speed Camera Review 2018 - Appendix A: Fixed Speed Cameras A75

9660|9661, 9607: Ourimbah - Pacific Highway, between Yates Road and Dog Trap Road
School zone: Ourimbah Primary SchoolThis location is 360m (patch to patch) in length, and is enforced by 2 cameras.The cameras commenced operating on: • Camera 1 (northbound) 15 July 2003 • Camera 2 (southbound) 18 February 2008
2 0
0 0
- 0
- 0
- 0
2
Fatalities
Serious
Moderate
Minor/Other
Uncategorised
Casualty Crashes
Casualties and Casualty Crashes
Casualty Cost:
Infringements by Month
0
200
400
600
800
1000
1200
Jun-03
Jun-04
Jun-05
Jun-06
Jun-07
Jun-08
Jun-09
Jun-10
Jun-11
Jun-12
Jun-13
Jun-14
Jun-15
Jun-16
Jun-17
Month-Year
Infr
ingem
ents
per
Month
Casualties and Casualty Crashes
0
1
2
3
-5Y
-4Y
-3Y
-2Y
-1Y
2004
2005
2006
2007
2008
2009
2010
2011
2012
2013
2014
2015
2016
2017
Number of years before and calendar year after camera installation
Num
ber
of casualti
es/c
asualty
cra
shes
Uncategorised M inor/Other M oderate InjurySerious Injury Killed Casualty Crash
Total Injuries 2 0
-
↓ 100%
↓ 100%
Count Percentage Change²
$0.42M $0 ↓ 100%
¹ Ending 15 April 2003, 3 calendar months before installation.² The percentage change is based on annualised crash data to allow for a direct comparison between the pre and post installation time periods. Red values indicate an increase.
5 years before installation¹
• When comparing the pre installation period to the most recent five year period, there has been a 100% decrease in casualty crashes at this fixed speed camera location. The data presented do not account for the prevailing statewide trend.• The infringement graph details the trend in infringements at this location since the camera began
operating. The spike in infringements from February 2008 can be attributed to the installation of a second camera at this location, enforcing southbound traffic. The extended period of camera downtime in 2009 and 2010 was due to significant road upgrades. Roadworks and camera maintenance may influence the number of infringements issued.
Status : Retain
5 years to end 2017
-
(There has been no increase in casualty crashes.)
Annual NSW Speed Camera Review 2018 - Appendix A: Fixed Speed Cameras A76

9646: Padstow - Gibson Avenue, between Turvey Street and Bryant Street, Padstow
This location is 1000m in length, and is enforced with one camera.The camera commenced operating on 3 July 2000.
12 10
1 1
- 3
- 6
- 2
14
Fatalities
Serious
Moderate
Minor/Other
Uncategorised
Casualty Crashes
Casualties and Casualty Crashes
Casualty Cost:
Infringements by Month
0
50
100
150
200
250
Jul-02
Jul-03
Jul-04
Jul-05
Jul-06
Jul-07
Jul-08
Jul-09
Jul-10
Jul-11
Jul-12
Jul-13
Jul-14
Jul-15
Jul-16
Jul-17
Month-Year
Infr
ingem
ents
per
Month
Casualties and Casualty Crashes
0
1
2
3
4
5
6
7
8
-4Y
-2Y
2001
2003
2005
2007
2009
2011
2013
2015
2017
Number of years before and calendar year after camera installation
Num
ber
of casualti
es/c
asualty
cra
shes
Uncategorised M inor/Other M oderate InjurySerious Injury Killed Casualty Crash
Total Injuries 14 11
↓ 20%
↓ 37%
↓ 33%
Count Percentage Change²
$10.56M $9.93M ↓ 25%
¹ Ending 3 April 2000, 3 calendar months before installation.² The percentage change is based on annualised crash data to allow for a direct comparison between the pre and post installation time periods. Red values indicate an increase.
4 years before installation¹
• When comparing the pre installation period to the most recent five year period, there has been a 33%decrease in casualty crashes at this fixed speed camera location. The data presented do not account for the prevailing statewide trend.• The infringement graph details the trend in infringements at this location since July 2002. Infringement
data before this date is not available. Roadworks and camera maintenance may influence the number of infringements issued.
Status : Retain
5 years to end 2017
-
(There has been no increase in casualty crashes.)
Annual NSW Speed Camera Review 2018 - Appendix A: Fixed Speed Cameras A77

9573: Peakhurst - Henry Lawson Drive, between Belmont Road and Ogilvy Street
This location is 1000m in length, and is enforced with one camera.The camera commenced operating on 29 January 2003.
17 12
0 1
- 3
- 4
- 5
24
Fatalities
Serious
Moderate
Minor/Other
Uncategorised
Casualty Crashes
Casualties and Casualty Crashes
Casualty Cost:
Infringements by Month
0
200
400
600
800
1000
1200
1400
Jan-03
Jan-04
Jan-05
Jan-06
Jan-07
Jan-08
Jan-09
Jan-10
Jan-11
Jan-12
Jan-13
Jan-14
Jan-15
Jan-16
Jan-17
Month-Year
Infr
ingem
ents
per
Month
Casualties and Casualty Crashes
0
1
2
3
4
5
6
7
8
9
-5Y
-4Y
-3Y
-2Y
-1Y
2004
2005
2006
2007
2008
2009
2010
2011
2012
2013
2014
2015
2016
2017
Number of years before and calendar year after camera installation
Num
ber
of casualti
es/c
asualty
cra
shes
Uncategorised M inor/Other M oderate InjurySerious Injury Killed Casualty Crash
Total Injuries 24 12
Increase
↓ 50%
↓ 29%
Count Percentage Change²
$5.08M $10.14M ↑ 100%
¹ Ending 29 October 2002, 3 calendar months before installation.² The percentage change is based on annualised crash data to allow for a direct comparison between the pre and post installation time periods. Red values indicate an increase.
5 years before installation¹
• When comparing the pre installation period to the most recent five year period, there has been a 29% decrease in casualty crashes at this fixed speed camera location. The data presented do not account for the prevailing statewide trend.• The infringement graph details the trend in infringements at this location since the camera began
operating. Roadworks and camera maintenance may influence the number of infringements issued.
Status : Retain
5 years to end 2017
-
(There has been no increase in casualty crashes.)
Annual NSW Speed Camera Review 2018 - Appendix A: Fixed Speed Cameras A78

9829: Penshurst - Forest Road, between Penshurst Street and St Georges Street
School zone: Penshurst Girls Campus – Georges River College, Penshurst Public School, St Declan’s Primary SchoolThis location is 620m (patch to patch) in length, and is enforced with one camera.The camera commenced operating on 17 October 2007.
17 14
0 1
0 5
7 7
1 8
13
Fatalities
Serious
Moderate
Minor/Other
Uncategorised
Casualty Crashes
Casualties and Casualty Crashes
Casualty Cost:
Infringements by Month
0
50
100
150
200
250
300
350
400
450
500
Oct-07
Oct-08
Oct-09
Oct-10
Oct-11
Oct-12
Oct-13
Oct-14
Oct-15
Oct-16
Oct-17
Month-Year
Infr
ingem
ents
per
Month
Casualties and Casualty Crashes
0
1
2
3
4
5
6
7
8
9
-5Y
-4Y
-3Y
-2Y
-1Y
2008
2009
2010
2011
2012
2013
2014
2015
2016
2017
Number of years before and calendar year after camera installation
Num
ber
of casualti
es/c
asualty
cra
shes
Uncategorised M inor/Other M oderate InjurySerious Injury Killed Casualty Crash
Total Injuries 21 20
Increase
↓ 5%
↓ 18%
Count Percentage Change²
$4.45M $11.83M ↑ 166%
¹ Ending 17 July 2007, 3 calendar months before installation.² The percentage change is based on annualised crash data to allow for a direct comparison between the pre and post installation time periods. Red values indicate an increase.
5 years before installation¹
• When comparing the pre installation period to the most recent five year period, there has been an 18% decrease in casualty crashes at this fixed speed camera location. The data presented do not account for the prevailing statewide trend.• The infringement graph details the trend in infringements at this location since the camera began
operating. Roadworks and camera maintenance may influence the number of infringements issued.
Status : Retain
5 years to end 2017
-
(There has been no increase in casualty crashes.)
Annual NSW Speed Camera Review 2018 - Appendix A: Fixed Speed Cameras A79

9644: Picnic Point - Henry Lawson Drive, between Carinya Road and The River Road
This location is 1000m in length, and is enforced with one camera.The camera commenced operating on 16 May 2001.
5 3
0 0
- 0
- 4
- 0
6
Fatalities
Serious
Moderate
Minor/Other
Uncategorised
Casualty Crashes
Casualties and Casualty Crashes
Casualty Cost:
Infringements by Month
0
100
200
300
400
500
600
700
800
900
Jul-02
Jul-03
Jul-04
Jul-05
Jul-06
Jul-07
Jul-08
Jul-09
Jul-10
Jul-11
Jul-12
Jul-13
Jul-14
Jul-15
Jul-16
Jul-17
Month-Year
Infr
ingem
ents
per
Month
Casualties and Casualty Crashes
0
1
2
3
4
5
-5Y
-3Y
-1Y
2003
2005
2007
2009
2011
2013
2015
2017
Number of years before and calendar year after camera installation
Num
ber
of casualti
es/c
asualty
cra
shes
Uncategorised M inor/Other M oderate InjurySerious Injury Killed Casualty Crash
Total Injuries 6 4
-
↓ 33%
↓ 40%
Count Percentage Change²
$1.27M $0.85M ↓ 33%
¹ Ending 16 February 2001, 3 calendar months before installation.² The percentage change is based on annualised crash data to allow for a direct comparison between the pre and post installation time periods. Red values indicate an increase.
5 years before installation¹
• When comparing the pre installation period to the most recent five year period, there has been a 40%decrease in casualty crashes at this fixed speed camera location. The data presented do not account for the prevailing statewide trend.• The infringement graph details the trend in infringements at this location since July 2002. Infringement
data before this date is not available. Roadworks and camera maintenance may influence the number of infringements issued.
Status : Retain
5 years to end 2017
-
(There has been no increase in casualty crashes.)
Annual NSW Speed Camera Review 2018 - Appendix A: Fixed Speed Cameras A80

9596: Queanbeyan - Lanyon Drive, between Tompsitt Drive and Hoover Road
This location is 1000m in length, and is enforced with one camera.The camera commenced operating on 2 May 2003.
2 1
1 0
- 1
- 0
- 0
1
Fatalities
Serious
Moderate
Minor/Other
Uncategorised
Casualty Crashes
Casualties and Casualty Crashes
Casualty Cost:
Infringements by Month
0
50
100
150
200
250
300
350
400
450
500
Apr-03
Apr-04
Apr-05
Apr-06
Apr-07
Apr-08
Apr-09
Apr-10
Apr-11
Apr-12
Apr-13
Apr-14
Apr-15
Apr-16
Apr-17
Month-Year
Infr
ingem
ents
per
Month
Casualties and Casualty Crashes
0
1
2
3
-5Y
-4Y
-3Y
-2Y
-1Y
2004
2005
2006
2007
2008
2009
2010
2011
2012
2013
2014
2015
2016
2017
Number of years before and calendar year after camera installation
Num
ber
of casualti
es/c
asualty
cra
shes
Uncategorised M inor/Other M oderate InjurySerious Injury Killed Casualty Crash
Total Injuries 1 1
↓ 100%
0%
↓ 50%
Count Percentage Change²
$7.81M $0.21M ↓ 97%
¹ Ending 2 February 2003, 3 calendar months before installation.² The percentage change is based on annualised crash data to allow for a direct comparison between the pre and post installation time periods. Red values indicate an increase.
5 years before installation¹
• When comparing the pre installation period to the most recent five year period, there has been a 50%decrease in casualty crashes at this fixed speed camera location. The data presented do not account for the prevailing statewide trend.• The infringement graph details the trend in infringements at this location since the camera began
operating. Roadworks and camera maintenance may influence the number of infringements issued.
Status : Ineligible
5 years to end 2017
-
(There is currently a review underway at this location.)
Annual NSW Speed Camera Review 2018 - Appendix A: Fixed Speed Cameras A81

9815: Randwick - Avoca Street, between Howard Street and Barker Road
School zone: Randwick Boys High School, Randwick Girls High SchoolThis location is 560m (patch to patch) in length, and is enforced with one camera.The camera commenced operating on 29 June 2007.
25 19
0 0
1 4
7 11
7 10
16
Fatalities
Serious
Moderate
Minor/Other
Uncategorised
Casualty Crashes
Casualties and Casualty Crashes
Casualty Cost:
Infringements by Month
0
500
1000
1500
2000
2500
3000
3500
Jul-07
Jul-08
Jul-09
Jul-10
Jul-11
Jul-12
Jul-13
Jul-14
Jul-15
Jul-16
Jul-17
Month-Year
Infr
ingem
ents
per
Month
Casualties and Casualty Crashes
0
2
4
6
8
10
12
14
-5Y
-4Y
-3Y
-2Y
-1Y
2008
2009
2010
2011
2012
2013
2014
2015
2016
2017
Number of years before and calendar year after camera installation
Num
ber
of casualti
es/c
asualty
cra
shes
Uncategorised M inor/Other M oderate InjurySerious Injury Killed Casualty Crash
Total Injuries 31 25
-
↓ 19%
↓ 24%
Count Percentage Change²
$6.56M $5.29M ↓ 19%
¹ Ending 29 March 2007, 3 calendar months before installation.² The percentage change is based on annualised crash data to allow for a direct comparison between the pre and post installation time periods. Red values indicate an increase.
5 years before installation¹
• When comparing the pre installation period to the most recent five year period, there has been a 24%decrease in casualty crashes at this fixed speed camera location. The data presented do not account for the prevailing statewide trend.• The infringement graph details the trend in infringements at this location since the camera began
operating. Roadworks and camera maintenance may influence the number of infringements issued.
Status : Retain
5 years to end 2017
-
(There has been no increase in casualty crashes.)
Annual NSW Speed Camera Review 2018 - Appendix A: Fixed Speed Cameras A82

9586: Rankin Park - McCaffrey Drive, between Duval Street and Orara Street
This location is 1000m in length, and is enforced with one camera.The camera commenced operating on 29 April 2003.
3 10
0 0
- 3
- 7
- 5
8
Fatalities
Serious
Moderate
Minor/Other
Uncategorised
Casualty Crashes
Casualties and Casualty Crashes
Casualty Cost:
Infringements by Month
0
100
200
300
400
500
600
700
Apr-03
Apr-04
Apr-05
Apr-06
Apr-07
Apr-08
Apr-09
Apr-10
Apr-11
Apr-12
Apr-13
Apr-14
Apr-15
Apr-16
Apr-17
Month-Year
Infr
ingem
ents
per
Month
Casualties and Casualty Crashes
0
1
2
3
4
5
6
7
8
-5Y
-4Y
-3Y
-2Y
-1Y
2004
2005
2006
2007
2008
2009
2010
2011
2012
2013
2014
2015
2016
2017
Number of years before and calendar year after camera installation
Num
ber
of casualti
es/c
asualty
cra
shes
Uncategorised M inor/Other M oderate InjurySerious Injury Killed Casualty Crash
Total Injuries 8 15
-
↑ 88%
↑ 233%
Count Percentage Change²
$1.69M $3.18M ↑ 88%
¹ Ending 29 January 2003, 3 calendar months before installation.² The percentage change is based on annualised crash data to allow for a direct comparison between the pre and post installation time periods. Red values indicate an increase.
5 years before installation¹
• When comparing the pre installation period to the most recent five year period, there has been a 233% increase in casualty crashes at this fixed speed camera location. The increase in casualty crashes is statistically signficant. The data presented do not account for the prevailing statewide trend.• The infringement graph details the trend in infringements at this location since the camera began
operating. Roadworks and camera maintenance may influence the number of infringements issued. • This location was reviewed in 2013 due to concerns about the increase in casualties in recent years. It
was recommended retaining the speed camera at this location following the comprehensive review.
Status : Retain
5 years to end 2017
-
(There has been a statistically significant increase in casualty crashes, however this location has previously been reviewed.)
Annual NSW Speed Camera Review 2018 - Appendix A: Fixed Speed Cameras A83

9816|9817: Rosebery/Alexandria - Botany Road, between Gardeners Road and Gillespie Street
School zone: Gardeners Road Public SchoolThis location is 360m (patch to patch) in length, and is enforced by 2 cameras.Both cameras commenced operating on 13 June 2007.
16 12
0 0
1 1
3 9
1 4
11
Fatalities
Serious
Moderate
Minor/Other
Uncategorised
Casualty Crashes
Casualties and Casualty Crashes
Casualty Cost:
Infringements by Month
0
500
1000
1500
2000
2500
3000
Jun-07
Jun-08
Jun-09
Jun-10
Jun-11
Jun-12
Jun-13
Jun-14
Jun-15
Jun-16
Jun-17
Month-Year
Infr
ingem
ents
per
Month
Casualties and Casualty Crashes
0
1
2
3
4
5
6
-5Y
-4Y
-3Y
-2Y
-1Y
2008
2009
2010
2011
2012
2013
2014
2015
2016
2017
Number of years before and calendar year after camera installation
Num
ber
of casualti
es/c
asualty
cra
shes
Uncategorised M inor/Other M oderate InjurySerious Injury Killed Casualty Crash
Total Injuries 16 14
-
↓ 13%
↓ 25%
Count Percentage Change²
$3.39M $2.96M ↓ 13%
¹ Ending 13 March 2007, 3 calendar months before installation.² The percentage change is based on annualised crash data to allow for a direct comparison between the pre and post installation time periods. Red values indicate an increase.
5 years before installation¹
• When comparing the pre installation period to the most recent five year period, there has been a 25% decrease in casualty crashes at this fixed speed camera location. The data presented do not account for the prevailing statewide trend.• The infringement graph details the trend in infringements at this location since the camera began
operating. The spike in infringements after July 2012 can be attributed to a change in speed limit from 60km/h to 50km/h. Roadworks and camera maintenance may influence the number of infringements issued.
Status : Retain
5 years to end 2017
-
(There has been no increase in casualty crashes.)
Annual NSW Speed Camera Review 2018 - Appendix A: Fixed Speed Cameras A84

9839|9840: Rydalmere - Victoria Road, between Park Road and John Road
School zone: Rydalmere Public SchoolThis location is 440m (patch to patch) in length, and is enforced by 2 cameras.Both cameras commenced operating on 28 January 2009.
3 7
0 0
0 2
0 3
2 2
1
Fatalities
Serious
Moderate
Minor/Other
Uncategorised
Casualty Crashes
Casualties and Casualty Crashes
Casualty Cost:
Infringements by Month
0
100
200
300
400
500
600
Mar-09
Sep-09
Mar-10
Sep-10
Mar-11
Sep-11
Mar-12
Sep-12
Mar-13
Sep-13
Mar-14
Sep-14
Mar-15
Sep-15
Mar-16
Sep-16
Mar-17
Sep-17
Month-Year
Infr
ingem
ents
per
Month
Casualties and Casualty Crashes
0
1
2
3
-5Y
-4Y
-3Y
-2Y
-1Y
2010
2011
2012
2013
2014
2015
2016
2017
Number of years before and calendar year after camera installation
Num
ber
of casualti
es/c
asualty
cra
shes
Uncategorised M inor/Other M oderate InjurySerious Injury Killed Casualty Crash
Total Injuries 3 7
-
↑ 133%
↑ 133%
Count Percentage Change²
$0.64M $1.48M ↑ 133%
¹ Ending 28 October 2008, 3 calendar months before installation.² The percentage change is based on annualised crash data to allow for a direct comparison between the pre and post installation time periods. Red values indicate an increase.
5 years before installation¹
• When comparing the pre installation period to the most recent five year period, there has been a 133%increase in casualty crashes at this fixed speed camera location. The increase in casualty crashes is not statistically signficant. The data presented do not account for the prevailing statewide trend.• The infringement graph details the trend in infringements at this location since the camera began
operating. Roadworks and camera maintenance may influence the number of infringements issued.
Status : Ineligible
5 years to end 2017
-
(There is currently a review underway at this location.)
Annual NSW Speed Camera Review 2018 - Appendix A: Fixed Speed Cameras A85

9554: Ryde - Blaxland Road, between Reservoir Lane and North Road
This location is 1000m in length, and is enforced with one camera.The camera commenced operating on 24 June 2002.
25 18
1 0
- 5
- 10
- 8
31
Fatalities
Serious
Moderate
Minor/Other
Uncategorised
Casualty Crashes
Casualties and Casualty Crashes
Casualty Cost:
Infringements by Month
0
500
1000
1500
2000
2500
Jul-02
Jul-03
Jul-04
Jul-05
Jul-06
Jul-07
Jul-08
Jul-09
Jul-10
Jul-11
Jul-12
Jul-13
Jul-14
Jul-15
Jul-16
Jul-17
Month-Year
Infr
ingem
ents
per
Month
Casualties and Casualty Crashes
0
2
4
6
8
10
12
14
-5Y
-3Y
-1Y
2004
2006
2008
2010
2012
2014
2016
Number of years before and calendar year after camera installation
Num
ber
of casualti
es/c
asualty
cra
shes
Uncategorised M inor/Other M oderate InjurySerious Injury Killed Casualty Crash
Total Injuries 31 23
↓ 100%
↓ 26%
↓ 28%
Count Percentage Change²
$14.16M $4.87M ↓ 66%
¹ Ending 24 March 2002, 3 calendar months before installation.² The percentage change is based on annualised crash data to allow for a direct comparison between the pre and post installation time periods. Red values indicate an increase.
5 years before installation¹
• When comparing the pre installation period to the most recent five year period, there has been a 28% decrease in casualty crashes at this fixed speed camera location. The data presented do not account for the prevailing statewide trend.• The infringement graph details the trend in infringements at this location since the camera began
operating. Roadworks and camera maintenance may influence the number of infringements issued.
Status : Retain
5 years to end 2017
-
(There has been no increase in casualty crashes.)
Annual NSW Speed Camera Review 2018 - Appendix A: Fixed Speed Cameras A86

9835|9836: Ryde - Victoria Road, between Margaret Street and Cressy Road
School zone: Holy Cross College Ryde, St Charles School RydeThis location is 570m (patch to patch) in length, and is enforced by 2 cameras.Both cameras commenced operating on 14 November 2007.
16 11
0 0
4 3
2 1
4 7
10
Fatalities
Serious
Moderate
Minor/Other
Uncategorised
Casualty Crashes
Casualties and Casualty Crashes
Casualty Cost:
Infringements by Month
0
500
1000
1500
2000
2500
3000
Nov-07
Nov-08
Nov-09
Nov-10
Nov-11
Nov-12
Nov-13
Nov-14
Nov-15
Nov-16
Nov-17
Month-Year
Infr
ingem
ents
per
Month
Casualties and Casualty Crashes
0
1
2
3
4
5
6
7
-5Y
-4Y
-3Y
-2Y
-1Y
2008
2009
2010
2011
2012
2013
2014
2015
2016
2017
Number of years before and calendar year after camera installation
Num
ber
of casualti
es/c
asualty
cra
shes
Uncategorised M inor/Other M oderate InjurySerious Injury Killed Casualty Crash
Total Injuries 20 11
-
↓ 45%
↓ 31%
Count Percentage Change²
$4.23M $2.33M ↓ 45%
¹ Ending 14 August 2007, 3 calendar months before installation.² The percentage change is based on annualised crash data to allow for a direct comparison between the pre and post installation time periods. Red values indicate an increase.
5 years before installation¹
• When comparing the pre installation period to the most recent five year period, there has been a 31% decrease in casualty crashes at this fixed speed camera location. The data presented do not account for the prevailing statewide trend.• The infringement graph details the trend in infringements at this location since the camera began
operating. Roadworks and camera maintenance may influence the number of infringements issued.
Status : Retain
5 years to end 2017
-
(There has been no increase in casualty crashes.)
Annual NSW Speed Camera Review 2018 - Appendix A: Fixed Speed Cameras A87

9580|9581: Sandgate - Pacific Highway, between Wallsend Road and Ironbark Creek
This location is 1000m in length, and is enforced by 2 cameras.The cameras commenced operating on: • Camera 1 (northbound) 14 January 2003 • Camera 2 (southbound) 23 April 2003
22 14
1 0
- 5
- 6
- 4
22
Fatalities
Serious
Moderate
Minor/Other
Uncategorised
Casualty Crashes
Casualties and Casualty Crashes
Casualty Cost:
Infringements by Month
0
50
100
150
200
250
300
350
400
Dec-02
Dec-03
Dec-04
Dec-05
Dec-06
Dec-07
Dec-08
Dec-09
Dec-10
Dec-11
Dec-12
Dec-13
Dec-14
Dec-15
Dec-16
Dec-17
Month-Year
Infr
ingem
ents
per
Month
Casualties and Casualty Crashes
0
1
2
3
4
5
6
7
8
9
10
-5Y
-4Y
-3Y
-2Y
-1Y
2004
2005
2006
2007
2008
2009
2010
2011
2012
2013
2014
2015
2016
2017
Number of years before and calendar year after camera installation
Num
ber
of casualti
es/c
asualty
cra
shes
Uncategorised M inor/Other M oderate InjurySerious Injury Killed Casualty Crash
Total Injuries 22 15
↓ 100%
↓ 32%
↓ 36%
Count Percentage Change²
$12.26M $3.18M ↓ 74%
¹ Ending 14 October 2002, 3 calendar months before installation.² The percentage change is based on annualised crash data to allow for a direct comparison between the pre and post installation time periods. Red values indicate an increase.
5 years before installation¹
• When comparing the pre installation period to the most recent five year period, there has been a 36% decrease in casualty crashes at this fixed speed camera location. The data presented do not account for the prevailing statewide trend.• The infringement graph details the trend in infringements at this location since the camera began
operating. Roadworks and camera maintenance may influence the number of infringements issued.
Status : Ineligible
5 years to end 2017
-
(There is currently a review underway at this location.)
Annual NSW Speed Camera Review 2018 - Appendix A: Fixed Speed Cameras A88

9547: South Windsor - George Street, between Rickaby Street and Yarrawonga Street
This location is 1000m in length, and is enforced with one camera.The camera commenced operating on 30 November 2001.
15 14
0 0
- 4
- 10
- 4
23
Fatalities
Serious
Moderate
Minor/Other
Uncategorised
Casualty Crashes
Casualties and Casualty Crashes
Casualty Cost:
Infringements by Month
0
50
100
150
200
250
300
350
400
450
500
Jul-02
Jul-03
Jul-04
Jul-05
Jul-06
Jul-07
Jul-08
Jul-09
Jul-10
Jul-11
Jul-12
Jul-13
Jul-14
Jul-15
Jul-16
Jul-17
Month-Year
Infr
ingem
ents
per
Month
Casualties and Casualty Crashes
0
1
2
3
4
5
6
7
8
-5Y
-3Y
-1Y
2003
2005
2007
2009
2011
2013
2015
2017
Number of years before and calendar year after camera installation
Num
ber
of casualti
es/c
asualty
cra
shes
Uncategorised M inor/Other M oderate InjurySerious Injury Killed Casualty Crash
Total Injuries 23 18
-
↓ 22%
↓ 7%
Count Percentage Change²
$4.87M $3.81M ↓ 22%
¹ Ending 30 August 2001, 3 calendar months before installation.² The percentage change is based on annualised crash data to allow for a direct comparison between the pre and post installation time periods. Red values indicate an increase.
5 years before installation¹
• When comparing the pre installation period to the most recent five year period, there has been a 7%decrease in casualty crashes at this fixed speed camera location. The data presented do not account for the prevailing statewide trend.• The infringement graph details the trend in infringements at this location since July 2002. Infringement
data before this date is not available. The spike in infringements in April 2007 may be attributed to the camera commencing speed enforcement of both directions of traffic where it previously enforced one direction only. Roadworks and camera maintenance may influence the number of infringements issued.
Status : Retain
5 years to end 2017
-
(There has been no increase in casualty crashes.)
Annual NSW Speed Camera Review 2018 - Appendix A: Fixed Speed Cameras A89

9849: Strathfield - The Boulevarde, between Torrington Parade and Russell Street
School zone: Trinity Grammar Preparatory School, Santa Sabina College, Santa Maria Del Monte, Meridan Senior and JuniorThis location is 1010m (patch to patch) in length, and is enforced with one camera.The camera commenced operating on 4 February 2009.
32 25
0 0
6 6
11 12
11 9
14
Fatalities
Serious
Moderate
Minor/Other
Uncategorised
Casualty Crashes
Casualties and Casualty Crashes
Casualty Cost:
Infringements by Month
0
200
400
600
800
1000
1200
Apr-09
Oct-09
Apr-10
Oct-10
Apr-11
Oct-11
Apr-12
Oct-12
Apr-13
Oct-13
Apr-14
Oct-14
Apr-15
Oct-15
Apr-16
Oct-16
Apr-17
Oct-17
Month-Year
Infr
ingem
ents
per
Month
Casualties and Casualty Crashes
0
2
4
6
8
10
12
14
-5Y
-4Y
-3Y
-2Y
-1Y
2010
2011
2012
2013
2014
2015
2016
2017
Number of years before and calendar year after camera installation
Num
ber
of casualti
es/c
asualty
cra
shes
Uncategorised M inor/Other M oderate InjurySerious Injury Killed Casualty Crash
Total Injuries 42 27
-
↓ 36%
↓ 22%
Count Percentage Change²
$8.89M $5.72M ↓ 36%
¹ Ending 4 November 2008, 3 calendar months before installation.² The percentage change is based on annualised crash data to allow for a direct comparison between the pre and post installation time periods. Red values indicate an increase.
5 years before installation¹
• When comparing the pre installation period to the most recent five year period, there has been a 22% decrease in casualty crashes at this fixed speed camera location. The data presented do not account for the prevailing statewide trend.• The infringement graph details the trend in infringements at this location since the camera began
operating. Roadworks and camera maintenance may influence the number of infringements issued.
Status : Retain
5 years to end 2017
-
(There has been no increase in casualty crashes.)
Annual NSW Speed Camera Review 2018 - Appendix A: Fixed Speed Cameras A90

9568|: Tenterfield - New England Highway, between Duncan Street and George Street
This location is 1000m in length, and is enforced by 2 cameras.Both cameras commenced operating on 3 October 2002.
6 0
2 0
- 0
- 0
- 0
9
Fatalities
Serious
Moderate
Minor/Other
Uncategorised
Casualty Crashes
Casualties and Casualty Crashes
Casualty Cost:
Infringements by Month
0
200
400
600
800
1000
1200
Sep-02
Sep-03
Sep-04
Sep-05
Sep-06
Sep-07
Sep-08
Sep-09
Sep-10
Sep-11
Sep-12
Sep-13
Sep-14
Sep-15
Sep-16
Sep-17
Month-Year
Infr
ingem
ents
per
Month
Casualties and Casualty Crashes
0
1
2
3
4
5
-5Y
-3Y
-1Y
2004
2006
2008
2010
2012
2014
2016
Number of years before and calendar year after camera installation
Num
ber
of casualti
es/c
asualty
cra
shes
Uncategorised M inor/Other M oderate InjurySerious Injury Killed Casualty Crash
Total Injuries 9 0
↓ 100%
↓ 100%
↓ 100%
Count Percentage Change²
$17.10M $0 ↓ 100%
¹ Ending 3 July 2002, 3 calendar months before installation.² The percentage change is based on annualised crash data to allow for a direct comparison between the pre and post installation time periods. Red values indicate an increase.
5 years before installation¹
• When comparing the pre installation period to the most recent five year period, there has been a 100%decrease in casualty crashes at this fixed speed camera location. The data presented do not account for the prevailing statewide trend.• The infringement graph details the trend in infringements at this location since the camera began
operating. Roadworks and camera maintenance may influence the number of infringements issued.
Status : Retain
5 years to end 2017
-
(There has been no increase in casualty crashes.)
Annual NSW Speed Camera Review 2018 - Appendix A: Fixed Speed Cameras A91

9587: Terrigal - Terrigal Drive, between Brunswick Road and Bellbird Avenue
School zone: Terrigal High SchoolThis location is 585m in length, and is enforced with one camera.The camera commenced operating on 27 February 2003.
22 6
1 0
- 1
- 5
- 3
28
Fatalities
Serious
Moderate
Minor/Other
Uncategorised
Casualty Crashes
Casualties and Casualty Crashes
Casualty Cost:
Infringements by Month
0
100
200
300
400
500
600
Jan-03
Jan-04
Jan-05
Jan-06
Jan-07
Jan-08
Jan-09
Jan-10
Jan-11
Jan-12
Jan-13
Jan-14
Jan-15
Jan-16
Jan-17
Month-Year
Infr
ingem
ents
per
Month
Casualties and Casualty Crashes
0
2
4
6
8
10
12
14
-5Y
-4Y
-3Y
-2Y
-1Y
2004
2005
2006
2007
2008
2009
2010
2011
2012
2013
2014
2015
2016
2017
Number of years before and calendar year after camera installation
Num
ber
of casualti
es/c
asualty
cra
shes
Uncategorised M inor/Other M oderate InjurySerious Injury Killed Casualty Crash
Total Injuries 28 9
↓ 100%
↓ 68%
↓ 73%
Count Percentage Change²
$13.53M $1.91M ↓ 86%
¹ Ending 27 November 2002, 3 calendar months before installation.² The percentage change is based on annualised crash data to allow for a direct comparison between the pre and post installation time periods. Red values indicate an increase.
5 years before installation¹
• When comparing the pre installation period to the most recent five year period, there has been a 73% decrease in casualty crashes at this fixed speed camera location. The data presented do not account for the prevailing statewide trend.• The infringement graph details the trend in infringements at this location since the camera began
operating. The extended period of camera downtime from December 2010 to June 2012 was due to road works. The subsequent spike in infringements in June 2012 may be attributed to a change in speed limit as the area became a school zone in March 2012. Roadworks and camera maintenance may influence the number of infringements issued. • In 2014, major road safety and traffic works commenced at this location. The camera and accompanying
signage has been removed. The location will be reviewed now that works are complete and a final decision will be made about the need for ongoing enforcement.• For the 2017 Annual Review, this location was analysed as a School Zone.
Status : Ineligible
5 years to end 2017
-
(There is currently a review underway at this location.)
Annual NSW Speed Camera Review 2018 - Appendix A: Fixed Speed Cameras A92

9802|9803: Toongabbie - Fitzwilliam Road, between Reynolds Street and Binalong Road
School zone: Toongabbie Public SchoolThis location is 590m (patch to patch) in length, and is enforced by 2 cameras.Both cameras commenced operating on 16 May 2007.
7 6
0 0
2 2
1 2
3 2
2
Fatalities
Serious
Moderate
Minor/Other
Uncategorised
Casualty Crashes
Casualties and Casualty Crashes
Casualty Cost:
Infringements by Month
0
50
100
150
200
250
300
350
400
450
500
May-07
May-08
May-09
May-10
May-11
May-12
May-13
May-14
May-15
May-16
May-17
Month-Year
Infr
ingem
ents
per
Month
Casualties and Casualty Crashes
0
1
2
3
4
5
6
7
-5Y
-4Y
-3Y
-2Y
-1Y
2008
2009
2010
2011
2012
2013
2014
2015
2016
2017
Number of years before and calendar year after camera installation
Num
ber
of casualti
es/c
asualty
cra
shes
Uncategorised M inor/Other M oderate InjurySerious Injury Killed Casualty Crash
Total Injuries 8 6
-
↓ 25%
↓ 14%
Count Percentage Change²
$1.69M $1.27M ↓ 25%
¹ Ending 16 February 2007, 3 calendar months before installation.² The percentage change is based on annualised crash data to allow for a direct comparison between the pre and post installation time periods. Red values indicate an increase.
5 years before installation¹
• When comparing the pre installation period to the most recent five year period, there has been a 14%decrease in casualty crashes at this fixed speed camera location. The data presented do not account for the prevailing statewide trend.• The infringement graph details the trend in infringements at this location since the camera began
operating. Roadworks and camera maintenance may influence the number of infringements issued.
Status : Retain
5 years to end 2017
-
(There has been no increase in casualty crashes.)
Annual NSW Speed Camera Review 2018 - Appendix A: Fixed Speed Cameras A93

9538|: Valla Beach - Pacific Highway, between Valla Beach Road and Oyster Creek
This location is 1000m in length, and is enforced by 2 cameras.Both cameras commenced operating on 5 February 2002.
5 2
0 0
- 0
- 2
- 1
6
Fatalities
Serious
Moderate
Minor/Other
Uncategorised
Casualty Crashes
Casualties and Casualty Crashes
Casualty Cost:
Infringements by Month
0
50
100
150
200
250
Jul-02
Jul-03
Jul-04
Jul-05
Jul-06
Jul-07
Jul-08
Jul-09
Jul-10
Jul-11
Jul-12
Jul-13
Jul-14
Jul-15
Jul-16
Jul-17
Month-Year
Infr
ingem
ents
per
Month
Casualties and Casualty Crashes
0
1
2
3
4
5
6
7
8
-5Y
-3Y
-1Y
2004
2006
2008
2010
2012
2014
2016
Number of years before and calendar year after camera installation
Num
ber
of casualti
es/c
asualty
cra
shes
Uncategorised M inor/Other M oderate InjurySerious Injury Killed Casualty Crash
Total Injuries 6 3
-
↓ 50%
↓ 60%
Count Percentage Change²
$1.27M $0.64M ↓ 50%
¹ Ending 5 November 2001, 3 calendar months before installation.² The percentage change is based on annualised crash data to allow for a direct comparison between the pre and post installation time periods. Red values indicate an increase.
5 years before installation¹
• When comparing the pre installation period to the most recent five year period, there has been a 60% decrease in casualty crashes at this fixed speed camera location. The data presented do not account for the prevailing statewide trend.• The infringement graph details the trend in infringements at this location since July 2002. Infringement
data before this date is not available. The spike in infringements from May 2011 can be attributed to the speed limit changing from 100km/h to 80km/h. The speed limit was changed due to the poor safety record of this section of the Pacific Highway. Following an adjustment period, the graph shows there has been a reduction in speeding from the end of 2012. Roadworks and camera maintenance may influence the number of infringements issued.
Status : Ineligible
5 years to end 2017
-
(There is currently a review underway at this location.)
Annual NSW Speed Camera Review 2018 - Appendix A: Fixed Speed Cameras A94

9548: Valley Heights - Great Western Highway, between The Valley Road and Sun Valley Road
This location is 1000m in length, and is enforced with one camera.The camera commenced operating on 29 April 2002.
14 9
2 0
- 6
- 3
- 3
22
Fatalities
Serious
Moderate
Minor/Other
Uncategorised
Casualty Crashes
Casualties and Casualty Crashes
Casualty Cost:
Infringements by Month
0
50
100
150
200
250
Jul-02
Jul-03
Jul-04
Jul-05
Jul-06
Jul-07
Jul-08
Jul-09
Jul-10
Jul-11
Jul-12
Jul-13
Jul-14
Jul-15
Jul-16
Jul-17
Month-Year
Infr
ingem
ents
per
Month
Casualties and Casualty Crashes
0
1
2
3
4
5
6
7
8
-5Y
-3Y
-1Y
2004
2006
2008
2010
2012
2014
2016
Number of years before and calendar year after camera installation
Num
ber
of casualti
es/c
asualty
cra
shes
Uncategorised M inor/Other M oderate InjurySerious Injury Killed Casualty Crash
Total Injuries 22 12
↓ 100%
↓ 45%
↓ 36%
Count Percentage Change²
$19.85M $2.54M ↓ 87%
¹ Ending 29 January 2002, 3 calendar months before installation.² The percentage change is based on annualised crash data to allow for a direct comparison between the pre and post installation time periods. Red values indicate an increase.
5 years before installation¹
• When comparing the pre installation period to the most recent five year period, there has been a 36%decrease in casualty crashes at this fixed speed camera location. The data presented do not account for the prevailing statewide trend.• The infringement graph details the trend in infringements at this location since July 2002. Infringement
data before this date is not available. Roadworks and camera maintenance may influence the number of infringements issued.
Status : Retain
5 years to end 2017
-
(There has been no increase in casualty crashes.)
Annual NSW Speed Camera Review 2018 - Appendix A: Fixed Speed Cameras A95

9843|9844: Wahroonga - Pacific Highway, between Gilda Avenue and Woodville Avenue
School zone: Warrawee Public School, Knox Grammar, Abbotsleigh Senior CampusThis location is 1960m (patch to patch) in length, and is enforced by 2 cameras.Both cameras commenced operating on 28 January 2009.
53 52
0 0
10 9
25 24
23 25
15
Fatalities
Serious
Moderate
Minor/Other
Uncategorised
Casualty Crashes
Casualties and Casualty Crashes
Casualty Cost:
Infringements by Month
0
1000
2000
3000
4000
5000
6000
Jan-09
Jul-09
Jan-10
Jul-10
Jan-11
Jul-11
Jan-12
Jul-12
Jan-13
Jul-13
Jan-14
Jul-14
Jan-15
Jul-15
Jan-16
Jul-16
Jan-17
Jul-17
Month-Year
Infr
ingem
ents
per
Month
Casualties and Casualty Crashes
0
2
4
6
8
10
12
14
16
18
20
-5Y
-4Y
-3Y
-2Y
-1Y
2010
2011
2012
2013
2014
2015
2016
2017
Number of years before and calendar year after camera installation
Num
ber
of casualti
es/c
asualty
cra
shes
Uncategorised M inor/Other M oderate InjurySerious Injury Killed Casualty Crash
Total Injuries 73 58
-
↓ 21%
↓ 2%
Count Percentage Change²
$15.45M $12.28M ↓ 21%
¹ Ending 28 October 2008, 3 calendar months before installation.² The percentage change is based on annualised crash data to allow for a direct comparison between the pre and post installation time periods. Red values indicate an increase.
5 years before installation¹
• When comparing the pre installation period to the most recent five year period, there has been a 2%decrease in casualty crashes at this fixed speed camera location. The data presented do not account for the prevailing statewide trend.• The infringement graph details the trend in infringements at this location since the camera began
operating. Roadworks and camera maintenance may influence the number of infringements issued.
Status : Retain
5 years to end 2017
-
(There has been no increase in casualty crashes.)
Annual NSW Speed Camera Review 2018 - Appendix A: Fixed Speed Cameras A96

9570: Wardell - Pacific Highway, between Coolgardie Road and Fitzroy Street
This location is 1000m in length, and is enforced with one camera.The camera commenced operating on 24 February 2003.
7 2
0 0
- 0
- 2
- 1
14
Fatalities
Serious
Moderate
Minor/Other
Uncategorised
Casualty Crashes
Casualties and Casualty Crashes
Casualty Cost:
Infringements by Month
0
50
100
150
200
250
300
Jan-03
Jan-04
Jan-05
Jan-06
Jan-07
Jan-08
Jan-09
Jan-10
Jan-11
Jan-12
Jan-13
Jan-14
Jan-15
Jan-16
Jan-17
Month-Year
Infr
ingem
ents
per
Month
Casualties and Casualty Crashes
0
1
2
3
4
5
6
7
8
9
-5Y
-4Y
-3Y
-2Y
-1Y
2004
2005
2006
2007
2008
2009
2010
2011
2012
2013
2014
2015
2016
2017
Number of years before and calendar year after camera installation
Num
ber
of casualti
es/c
asualty
cra
shes
Uncategorised M inor/Other M oderate InjurySerious Injury Killed Casualty Crash
Total Injuries 14 3
-
↓ 79%
↓ 71%
Count Percentage Change²
$2.96M $0.64M ↓ 79%
¹ Ending 24 November 2002, 3 calendar months before installation.² The percentage change is based on annualised crash data to allow for a direct comparison between the pre and post installation time periods. Red values indicate an increase.
5 years before installation¹
• When comparing the pre installation period to the most recent five year period, there has been a 71%decrease in casualty crashes at this fixed speed camera location. The data presented do not account for the prevailing statewide trend.• The infringement graph details the trend in infringements at this location since the camera began
operating. The spike in infringements in September 2009 can be attributed to the speed limit changing from 100km/h to 80km/h. Roadworks and camera maintenance may influence the number of infringements issued.
Status : Retain
5 years to end 2017
-
(There has been no increase in casualty crashes.)
Annual NSW Speed Camera Review 2018 - Appendix A: Fixed Speed Cameras A97

9592: Warrawong - Northcliffe Drive, between Griffin Street and Kully Street
This location is 1000m in length, and is enforced with one camera.The camera commenced operating on 1 May 2003.
11 6
0 0
- 1
- 3
- 2
15
Fatalities
Serious
Moderate
Minor/Other
Uncategorised
Casualty Crashes
Casualties and Casualty Crashes
Casualty Cost:
Infringements by Month
0
100
200
300
400
500
600
700
Apr-03
Apr-04
Apr-05
Apr-06
Apr-07
Apr-08
Apr-09
Apr-10
Apr-11
Apr-12
Apr-13
Apr-14
Apr-15
Apr-16
Apr-17
Month-Year
Infr
ingem
ents
per
Month
Casualties and Casualty Crashes
0
1
2
3
4
5
6
7
8
9
10
-5Y
-4Y
-3Y
-2Y
-1Y
2004
2005
2006
2007
2008
2009
2010
2011
2012
2013
2014
2015
2016
2017
Number of years before and calendar year after camera installation
Num
ber
of casualti
es/c
asualty
cra
shes
Uncategorised M inor/Other M oderate InjurySerious Injury Killed Casualty Crash
Total Injuries 15 6
-
↓ 60%
↓ 45%
Count Percentage Change²
$3.18M $1.27M ↓ 60%
¹ Ending 1 February 2003, 3 calendar months before installation.² The percentage change is based on annualised crash data to allow for a direct comparison between the pre and post installation time periods. Red values indicate an increase.
5 years before installation¹
• When comparing the pre installation period to the most recent five year period, there has been a 45% decrease in casualty crashes at this fixed speed camera location. The data presented do not account for the prevailing statewide trend.• The infringement graph details the trend in infringements at this location since the camera began
operating. Roadworks and camera maintenance may influence the number of infringements issued.
Status : Retain
5 years to end 2017
-
(There has been no increase in casualty crashes.)
Annual NSW Speed Camera Review 2018 - Appendix A: Fixed Speed Cameras A98

9560: West Pennant Hills - Castle Hill Road, between Pennant Hills Road and Coonara Avenue
This location is 1000m in length, and is enforced with one camera.The camera commenced operating on 18 July 2002.
17 4
2 0
- 0
- 1
- 3
17
Fatalities
Serious
Moderate
Minor/Other
Uncategorised
Casualty Crashes
Casualties and Casualty Crashes
Casualty Cost:
Infringements by Month
0
500
1000
1500
2000
2500
3000
Jul-02
Jul-03
Jul-04
Jul-05
Jul-06
Jul-07
Jul-08
Jul-09
Jul-10
Jul-11
Jul-12
Jul-13
Jul-14
Jul-15
Jul-16
Jul-17
Month-Year
Infr
ingem
ents
per
Month
Casualties and Casualty Crashes
0
1
2
3
4
5
6
7
8
9
-5Y
-3Y
-1Y
2004
2006
2008
2010
2012
2014
2016
Number of years before and calendar year after camera installation
Num
ber
of casualti
es/c
asualty
cra
shes
Uncategorised M inor/Other M oderate InjurySerious Injury Killed Casualty Crash
Total Injuries 17 4
↓ 100%
↓ 76%
↓ 76%
Count Percentage Change²
$18.80M $0.85M ↓ 95%
¹ Ending 18 April 2002, 3 calendar months before installation.² The percentage change is based on annualised crash data to allow for a direct comparison between the pre and post installation time periods. Red values indicate an increase.
5 years before installation¹
• When comparing the pre installation period to the most recent five year period, there has been a 76% decrease in casualty crashes at this fixed speed camera location. The data presented do not account for the prevailing statewide trend.• The infringement graph details the trend in infringements at this location since the camera began
operating. Roadworks and camera maintenance may influence the number of infringements issued.
Status : Retain
5 years to end 2017
-
(There has been no increase in casualty crashes.)
Annual NSW Speed Camera Review 2018 - Appendix A: Fixed Speed Cameras A99

9571: Wollongbar - Bruxner Highway, between Convernys Lane and McLeans Ridges Road
This location is 1000m in length, and is enforced with one camera.The camera commenced operating on 24 February 2003.
7 2
1 0
- 1
- 2
- 0
7
Fatalities
Serious
Moderate
Minor/Other
Uncategorised
Casualty Crashes
Casualties and Casualty Crashes
Casualty Cost:
Infringements by Month
0
10
20
30
40
50
60
70
80
90
100
May-03
May-04
May-05
May-06
May-07
May-08
May-09
May-10
May-11
May-12
May-13
May-14
May-15
May-16
May-17
Month-Year
Infr
ingem
ents
per
Month
Casualties and Casualty Crashes
0
1
2
3
4
5
6
7
-5Y
-4Y
-3Y
-2Y
-1Y
2004
2005
2006
2007
2008
2009
2010
2011
2012
2013
2014
2015
2016
2017
Number of years before and calendar year after camera installation
Num
ber
of casualti
es/c
asualty
cra
shes
Uncategorised M inor/Other M oderate InjurySerious Injury Killed Casualty Crash
Total Injuries 7 3
↓ 100%
↓ 57%
↓ 71%
Count Percentage Change²
$9.08M $0.64M ↓ 93%
¹ Ending 24 November 2002, 3 calendar months before installation.² The percentage change is based on annualised crash data to allow for a direct comparison between the pre and post installation time periods. Red values indicate an increase.
5 years before installation¹
• When comparing the pre installation period to the most recent five year period, there has been a 71% decrease in casualty crashes at this fixed speed camera location. The data presented do not account for the prevailing statewide trend.• The infringement graph details the trend in infringements at this location since the camera began
operating. The spike in infringements in February 2006 can be attributed to the speed limit changing from 100km/h to 80km/h. The spike in infringements in April 2009 can be attributed to when the camera switched to bi-directional enforcement where it previously enforced in one direction. Roadworks and camera maintenance may influence the number of infringements issued.
Status : Retain
5 years to end 2017
-
(There has been no increase in casualty crashes.)
Annual NSW Speed Camera Review 2018 - Appendix A: Fixed Speed Cameras A100

9610: Wollongong - Princes Highway, between Mount Keira Road and Highway Avenue
School zone: Illawarra Grammar School, Wollongong West Public School, St Theresa Primary SchoolThis location is 620m (patch to patch) in length, and is enforced with one camera.The camera commenced operating on 15 July 2003.
15 12
0 0
- 4
- 3
- 6
19
Fatalities
Serious
Moderate
Minor/Other
Uncategorised
Casualty Crashes
Casualties and Casualty Crashes
Casualty Cost:
Infringements by Month
0
200
400
600
800
1000
1200
1400
Apr-03
Apr-04
Apr-05
Apr-06
Apr-07
Apr-08
Apr-09
Apr-10
Apr-11
Apr-12
Apr-13
Apr-14
Apr-15
Apr-16
Apr-17
Month-Year
Infr
ingem
ents
per
Month
Casualties and Casualty Crashes
0
1
2
3
4
5
6
7
8
-5Y
-4Y
-3Y
-2Y
-1Y
2004
2005
2006
2007
2008
2009
2010
2011
2012
2013
2014
2015
2016
2017
Number of years before and calendar year after camera installation
Num
ber
of casualti
es/c
asualty
cra
shes
Uncategorised M inor/Other M oderate InjurySerious Injury Killed Casualty Crash
Total Injuries 19 13
-
↓ 32%
↓ 20%
Count Percentage Change²
$4.02M $2.75M ↓ 32%
¹ Ending 15 April 2003, 3 calendar months before installation.² The percentage change is based on annualised crash data to allow for a direct comparison between the pre and post installation time periods. Red values indicate an increase.
5 years before installation¹
• When comparing the pre installation period to the most recent five year period, there has been a 20%decrease in casualty crashes at this fixed speed camera location. The data presented do not account for the prevailing statewide trend.• The infringement graph details the trend in infringements at this location since the camera began
operating. Roadworks and camera maintenance may influence the number of infringements issued.
Status : Retain
5 years to end 2017
-
(There has been no increase in casualty crashes.)
Annual NSW Speed Camera Review 2018 - Appendix A: Fixed Speed Cameras A101

9648: Woodburn - Pacific Highway, between Sussex Street and Richmond Street
This location is 1000m in length, and is enforced with one camera.The camera commenced operating on 20 March 2001.
5 1
2 0
- 0
- 0
- 1
8
Fatalities
Serious
Moderate
Minor/Other
Uncategorised
Casualty Crashes
Casualties and Casualty Crashes
Casualty Cost:
Infringements by Month
0
500
1000
1500
2000
2500
3000
Jul-02
Jul-03
Jul-04
Jul-05
Jul-06
Jul-07
Jul-08
Jul-09
Jul-10
Jul-11
Jul-12
Jul-13
Jul-14
Jul-15
Jul-16
Jul-17
Month-Year
Infr
ingem
ents
per
Month
Casualties and Casualty Crashes
0
1
2
3
4
5
6
7
8
-5Y
-3Y
-1Y
2003
2005
2007
2009
2011
2013
2015
2017
Number of years before and calendar year after camera installation
Num
ber
of casualti
es/c
asualty
cra
shes
Uncategorised M inor/Other M oderate InjurySerious Injury Killed Casualty Crash
Total Injuries 8 1
↓ 100%
↓ 88%
↓ 80%
Count Percentage Change²
$16.89M $0.21M ↓ 99%
¹ Ending 20 December 2000, 3 calendar months before installation.² The percentage change is based on annualised crash data to allow for a direct comparison between the pre and post installation time periods. Red values indicate an increase.
5 years before installation¹
• When comparing the pre installation period to the most recent five year period, there has been an 80% decrease in casualty crashes at this fixed speed camera location. The data presented do not account for the prevailing statewide trend.• The infringement graph details the trend in infringements at this location since July 2002. Infringement
data before this date is not available. The spike in infringements in June 2007 may be attributed to the speed limit changing from 60km/h to 50km/h. Following this spike, infringements again reduced and have remained at a consistent level at this location. Roadworks and camera maintenance may influence the number of infringements issued.
Status : Retain
5 years to end 2017
-
(There has been no increase in casualty crashes.)
Annual NSW Speed Camera Review 2018 - Appendix A: Fixed Speed Cameras A102

9606: Wyoming - Henry Parry Drive, between Glennie Street and Dwyer Street
School zone: Our Lady of the Rosary Primary SchoolThis location is 230m (patch to patch) in length, and is enforced with one camera.The camera commenced operating on 15 July 2003.
8 4
0 0
- 0
- 3
- 2
12
Fatalities
Serious
Moderate
Minor/Other
Uncategorised
Casualty Crashes
Casualties and Casualty Crashes
Casualty Cost:
Infringements by Month
0
200
400
600
800
1000
1200
Jun-03
Jun-04
Jun-05
Jun-06
Jun-07
Jun-08
Jun-09
Jun-10
Jun-11
Jun-12
Jun-13
Jun-14
Jun-15
Jun-16
Jun-17
Month-Year
Infr
ingem
ents
per
Month
Casualties and Casualty Crashes
0
1
2
3
4
5
6
7
-5Y
-4Y
-3Y
-2Y
-1Y
2004
2005
2006
2007
2008
2009
2010
2011
2012
2013
2014
2015
2016
2017
Number of years before and calendar year after camera installation
Num
ber
of casualti
es/c
asualty
cra
shes
Uncategorised M inor/Other M oderate InjurySerious Injury Killed Casualty Crash
Total Injuries 12 5
-
↓ 58%
↓ 50%
Count Percentage Change²
$2.54M $1.06M ↓ 58%
¹ Ending 15 April 2003, 3 calendar months before installation.² The percentage change is based on annualised crash data to allow for a direct comparison between the pre and post installation time periods. Red values indicate an increase.
5 years before installation¹
• When comparing the pre installation period to the most recent five year period, there has been a 50%decrease in casualty crashes at this fixed speed camera location. The data presented do not account for the prevailing statewide trend.• The infringement graph details the trend in infringements at this location since the camera began
operating. Roadworks and camera maintenance may influence the number of infringements issued.
Status : Retain
5 years to end 2017
-
(There has been no increase in casualty crashes.)
Annual NSW Speed Camera Review 2018 - Appendix A: Fixed Speed Cameras A103

9542: Yagoona - Hume Highway, between Smith Street and Brennan Avenue
This location is 1000m in length, and is enforced with one camera.The camera commenced operating on 7 December 2001.
42 32
2 0
- 10
- 19
- 20
74
Fatalities
Serious
Moderate
Minor/Other
Uncategorised
Casualty Crashes
Casualties and Casualty Crashes
Casualty Cost:
Infringements by Month
0
50
100
150
200
250
300
350
400
450
Jul-02
Jul-03
Jul-04
Jul-05
Jul-06
Jul-07
Jul-08
Jul-09
Jul-10
Jul-11
Jul-12
Jul-13
Jul-14
Jul-15
Jul-16
Jul-17
Month-Year
Infr
ingem
ents
per
Month
Casualties and Casualty Crashes
0
5
10
15
20
25
30
-5Y
-3Y
-1Y
2003
2005
2007
2009
2011
2013
2015
2017
Number of years before and calendar year after camera installation
Num
ber
of casualti
es/c
asualty
cra
shes
Uncategorised M inor/Other M oderate InjurySerious Injury Killed Casualty Crash
Total Injuries 74 49
↓ 100%
↓ 34%
↓ 24%
Count Percentage Change²
$30.86M $10.37M ↓ 66%
¹ Ending 7 September 2001, 3 calendar months before installation.² The percentage change is based on annualised crash data to allow for a direct comparison between the pre and post installation time periods. Red values indicate an increase.
5 years before installation¹
• When comparing the pre installation period to the most recent five year period, there has been a 24%decrease in casualty crashes at this fixed speed camera location. The data presented do not account for the prevailing statewide trend.• The infringement graph details the trend in infringements at this location since July 2002. Infringement
data before this date is not available. Roadworks and camera maintenance may influence the number of infringements issued.
Status : Retain
5 years to end 2017
-
(There has been no increase in casualty crashes.)
Annual NSW Speed Camera Review 2018 - Appendix A: Fixed Speed Cameras A104
NSW Speed Camera Programs Annual Review 2018 – Appendix A: Fixed speed cameras A105
A. NSW fixed speed cameras
A.3 Fixed speed camera locations with the most infringements
In April 2013, NRMA Motoring & Services called for an assessment of all high infringing speed camera locations across the state to determine whether the cameras were appropriately placed and clearly signposted.
The NSW Centre for Road Safety (CRS) has identified the 10 fixed speed camera locations with the highest number of infringements detected in 2017, detailed in the table overleaf. Cameras in high-risk locations are excluded.
The 10 speed camera locations are on main roads with high traffic volumes. None of the 10 highest infringing fixed speed camera locations were identified in this review for review or ongoing monitoring.
All camera locations had high compliance rates with more than 99 per cent of drivers passing the cameras without being infringed for speeding. This demonstrates that most drivers are aware of the cameras and do not exceed the speed limit, with less than one per cent of drivers penalised. It is this high level of compliance that provides road safety benefits. Compliance data compares the number of vehicles that pass a camera with the number of infringements issued by the camera.
CRS will continue to monitor infringement numbers at camera locations to identify and address any ongoing road safety risks. As is the case currently, Roads and Maritime Services (RMS) may increase the warning letter period and/or use Variable Message Signs to increase driver awareness of speed camera locations, where the trend in warning letters or number of infringements issued deems this appropriate. Ongoing site maintenance is also conducted by RMS to ensure that signage is effectively placed and not obscured by roadside objects, such as trees.

NSW Speed Camera Programs Annual Review 2018 – Appendix A: Fixed speed cameras A106
Fixed speed camera locations with the most infringements
Location (commencement date) Number of cameras
Infringements (Total: 2016)
Infringements (Total: 2017)
Compliance rate (2017)
1 Mount Victoria - Great Western Highway (July, 2015) 1 30,977 24,143 99.40%
2 Moore Park - Cleveland Street between Anzac parade and SouthDowling Street (school zone) (November, 2007)
2 17,552 17,220 99.52%
3 Ewingsdale - Pacific Highway, between St Helena Road andEwingsdale Road (September, 2006)
1 16,153 14,816 99.49%
4 Wahroonga - Pacific Highway between Gilda Avenue and WoodvilleAvenue (school zone) (January, 2009)
2 9,215 11,439 99.94%
5 Kogarah - Princes Highway, between Gray Street and PresidentAvenue (school zone) (July, 2003)
2 9,423 10,159 99.96%
6 Rosebery/Alexandria - Botany Road, between Gardeners Road andGillespie Street (school zone) (June, 2007)
2 9,688 9,108 99.88%
7 Ryde - Victoria Road, between Margaret Street and Cressy Road(school zone) (November, 2007) 2 8,190 7,543 99.88%
8 Gwynneville - M1 Princes Motorway, between Northern DistributorOverpass and Gipps Road Overpass (Northbound) (August, 2003)
1 7,881 7,774 99.86%
9 East Gardens/Maroubra, Bunnerong Road between FitzgeraldAvenue and Smith Street (school zone) (June 2007)
2 6,090 6,791 99.96%
10 Lindfield - Pacific Highway, between Eton Road and GladstoneParade (school zone) (July, 2007)
2 5,001 6,711 99.96%

NSW Speed Camera Programs Annual Review 2018 – Appendix A: Fixed speed cameras A107
A. NSW fixed speed cameras
A.4 Fixed speed cameras operating in warning mode
Following the results of the 2011 audit of speed cameras, the then Minister for Roads and Freight directed the deactivation of fixed speed cameras that were found to not be delivering the expected road safety benefit at 38 locations.
However, cameras at seven of locations remain in warning mode following reviews by the Centre for Road Safety and safety concerns expressed by the community.
These seven warning mode locations are not included in the detailed analysis provided earlier within this appendix. Crash and infringement results for 2017 are instead provided overleaf.
A.5 ‘Three strikes’ warning scheme
These seven cameras began operating in warning mode at different times, starting from August 2011. By July 2012, cameras at all seven locations commenced operating under a ‘three strike’ scheme where vehicle owners receive an infringement notice on the third speeding offence at any of the seven locations. Vehicles detected speeding more than 30km/h over the speed limit receive a court attendance notice and face significant penalties.
The table overleaf shows that there is a significant decrease in the number of warning notices from the issuing of a first warning notice, to the second warning notice and subsequent infringement notice for a third strike.

NSW Speed Camera Programs Annual Review 2018 – Appendix A: Fixed speed cameras A108
Performance at fixed speed camera locations operating in warning mode (2017)
Location (commencement date)
No. of cameras
Casualty crashes and casualties 2017 Warning letters and infringements issued under
‘3 strikes’ program Court attendance notices issued
Fat
aliti
es
Ser
ious
in
jurie
s
Mod
erat
e in
jurie
s
Min
or /
oth
er
inju
ries
Cas
ua
lty
cras
hes
1st w
arni
ng
lett
er
2nd w
arni
ng
lett
er
3rd s
peed
ing
off
ence
(in
frin
gem
ent
issu
ed)
Tot
al n
umbe
r of
war
ning
le
tter
s an
d in
frin
gem
ents
Veh
icle
s sp
eedi
ng
>30
km/h
Veh
icle
s sp
eedi
ng
>45
km/h
Tot
al n
umbe
r o
f no
tices
is
sued
1. Bangalow Road, Clunes(August 2011)
1 0 0 0 0 0 4,110 442 227 4,779 247 42 289
2. Spit Road, Mosman / Beauty Point(June 2012)
2 0 0 1 3 4 1,515 139 52 1,706 10 2 12
3. Carlingford Road, North Epping(school zone) (June 2012)
1 0 0 0 0 0 1,247 160 81 1,488 6 4 10
4. Pacific Highway, Urunga(January 2012)
1 0 0 0 0 0 2,997 357 166 3,520 41 27 68
5. President Avenue, Gymea(school zone) (August 2011)
1 0 0 0 1 1 1,943 252 105 2,300 42 39 81
6. Eastern Valley Way, North Willoughby(July 2012)
1 0 0 0 2 2 420 39 17 476 4 0 4
7. Eastern Arterial Road, Gordon(June 2012)
1 0 1 0 0 1 1,217 131 37 1,385 11 1 12
Totals: 8 0 1 1 6 8 13,449 1,520 685 15,654 361 115 476

NSW Speed Camera Programs Annual Review 2018 – Appendix A: Fixed speed cameras A109
A. NSW fixed speed cameras
A.6 Fixed speed cameras at high risk locations
There are fixed speed cameras in place at the following high risk locations:
Location Cameras Road
1 Bardwell Park / Arncliffe 2 M5 Motorway
2 Darlinghurst 2 Eastern Distributor
3 Lane Cove 2 Lane Cove Tunnel
4 Sydney 2 Sydney Harbour Tunnel
5 Woolloomooloo / East Sydney 2 Cross City Tunnel
Total: 10
These cameras were generally installed when the tunnel was constructed, therefore no pre-installation data are available for these high risk locations. Recommendations are not provided for these high risk locations.
Crash and infringement data are presented on pages A110 – A114.

Bardwell Park/Arncliffe - M5 Motorway
This is a high risk location that is enforced with fixed speed cameras, because it is difficult for the NSW Police to enforce. The length of each enforced direction is: • Camera 1 (eastbound) 3975m • Camera 2 (westbound) 3965mThe cameras commenced operating on 1 August 2002.
Infringements by Month
0
200
400
600
800
1000
1200
1400
1600
Jul-0
2
Jul-0
3
Jul-0
4
Jul-0
5
Jul-0
6
Jul-0
7
Jul-0
8
Jul-0
9
Jul-1
0
Jul-1
1
Jul-1
2
Jul-1
3
Jul-1
4
Jul-1
5
Jul-1
6
Jul-1
7
Month-Year
Infr
inge
men
ts p
er M
onth
Casualties and Casualty Crashes
0
2
4
6
8
10
12
2003 2004 2005 2006 2007 2008 2009 2010 2011 2012 2013 2014 2015 2016 2017
Calendar year after camera installation
Cas
ualti
es/c
asua
lty c
rash
es p
er Y
ear
Uncategorised M inor/Other M oderate Injury
Serious Injury Killed Casualty Crash
Camera 1 Eastbound Camera 2 Westbound
• In the eastbound direction, there were 5 casualty crashes in the 2017 data. This resulted in 1 serious injury, 5 moderate injuries, and 2 minor injuries. • In the westbound direction, there were 3 casualty crashes in the 2017 data. This resulted in 1 serious injury, 1 moderate injury, and 1 minor injury. • The infringement graphs show the number of infringements issued at this location by direction, as well as the trend in infringements. Roadworks and camera maintenance may influence the number of infringements issued.
Casualties and Casualty Crashes
0
2
4
6
8
10
12
2003 2004 2005 2006 2007 2008 2009 2010 2011 2012 2013 2014 2015 2016 2017
Calendar year after camera installation
Cas
ualti
es/c
asua
lty c
rash
es p
er Y
ear
Uncategorised M inor/Other M oderate Injury
Serious Injury Killed Casualty Crash
Infringements by Month
0
200
400
600
800
1000
1200
1400
1600
Jul-0
2
Jul-0
3
Jul-0
4
Jul-0
5
Jul-0
6
Jul-0
7
Jul-0
8
Jul-0
9
Jul-1
0
Jul-1
1
Jul-1
2
Jul-1
3
Jul-1
4
Jul-1
5
Jul-1
6
Jul-1
7
Month-Year
Infr
inge
men
ts p
er M
onth
Annual NSW Speed Camera Review 2018 - Appendix A: Fixed Speed Cameras (High Risk) A110

Darlinghurst - Eastern Distributor
This is a high risk location that is enforced with fixed speed cameras, because it is difficult for the NSW Police to enforce. This location is 1645m in length, and the two cameras commenced operating on: • Camera 1 (Northbound) 30 November 2000 • Camera 2 (Southbound) 30 November 2000
Infringements by Month
0
500
1000
1500
2000
2500
3000
Jul-0
2
Jul-0
3
Jul-0
4
Jul-0
5
Jul-0
6
Jul-0
7
Jul-0
8
Jul-0
9
Jul-1
0
Jul-1
1
Jul-1
2
Jul-1
3
Jul-1
4
Jul-1
5
Jul-1
6
Jul-1
7
Month-Year
Infr
inge
men
ts p
er M
onth
Casualties and Casualty Crashes
0
2
4
6
8
10
12
14
16
18
2001 2002 2003 2004 2005 2006 2007 2008 2009 2010 2011 2012 2013 2014 2015 2016 2017
Calendar year after camera installation
Cas
ualti
es/c
asua
lty c
rash
es p
er Y
ear
Uncategorised M inor/Other M oderate Injury
Serious Injury Killed Casualty Crash
Camera 1 Northbound Camera 2 Southbound
• In the northbound direction, there were no casualty crashes in the 2017 data. • In the southbound direction, there were 8 casualty crashes in the 2017 data. This resulted in 5 serious injuries, 3 moderate injuries, and 3 minor injuries. • The infringement graphs show the number of infringements issued at this location by direction, as well as the trend in infringements. Roadworks and camera maintenance may influence the number of infringements issued.
Casualties and Casualty Crashes
0
2
4
6
8
10
12
14
16
18
2001 2002 2003 2004 2005 2006 2007 2008 2009 2010 2011 2012 2013 2014 2015 2016 2017
Calendar year after camera installation
Cas
ualti
es/c
asua
lty c
rash
es p
er Y
ear
Uncategorised M inor/Other M oderate Injury
Serious Injury Killed Casualty Crash
Infringements by Month
0
500
1000
1500
2000
2500
3000
Jul-0
2
Jul-0
3
Jul-0
4
Jul-0
5
Jul-0
6
Jul-0
7
Jul-0
8
Jul-0
9
Jul-1
0
Jul-1
1
Jul-1
2
Jul-1
3
Jul-1
4
Jul-1
5
Jul-1
6
Jul-1
7
Month-Year
Infr
inge
men
ts p
er M
onth
Annual NSW Speed Camera Review 2018 - Appendix A: Fixed Speed Cameras (High Risk) A111

Lane Cove - Lane Cove Tunnel
This is a high risk location that is enforced with fixed speed cameras, because it is difficult for the NSW Police to enforce. The length of each enforced direction is: • Camera 1 (eastbound) 3610m • Camera 2 (westbound) 3615mThe cameras commenced operating on 25 March 2007.
Infringements by Month
0
1000
2000
3000
4000
5000
6000
7000
8000
9000
Mar
-07
Mar
-08
Mar
-09
Mar
-10
Mar
-11
Mar
-12
Mar
-13
Mar
-14
Mar
-15
Mar
-16
Mar
-17
Month-Year
Infr
inge
men
ts p
er M
onth
Casualties and Casualty Crashes
0
1
2
3
4
5
6
2008 2009 2010 2011 2012 2013 2014 2015 2016 2017
Calendar year after camera installation
Cas
ualti
es/c
asua
lty c
rash
es p
er Y
ear
Uncategorised M inor/Other M oderate Injury
Serious Injury Killed Casualty Crash
Camera 1 Eastbound Camera 2 Westbound
• In the eastbound direction, there was 1 casualty crash in the 2017 data. This resulted in 1 serious injury. • In the westbound direction, there were no casualty crashes in the 2017 data. • The infringement graphs show the number of infringements issued at this location by direction, as well as the trend in infringements. Roadworks and camera maintenance may influence the number of infringements issued.
Casualties and Casualty Crashes
0
1
2
3
4
5
6
2008 2009 2010 2011 2012 2013 2014 2015 2016 2017
Calendar year after camera installation
Cas
ualti
es/c
asua
lty c
rash
es p
er Y
ear
Uncategorised M inor/Other M oderate Injury
Serious Injury Killed Casualty Crash
Infringements by Month
0
1000
2000
3000
4000
5000
6000
7000
8000
9000
Mar
-07
Mar
-08
Mar
-09
Mar
-10
Mar
-11
Mar
-12
Mar
-13
Mar
-14
Mar
-15
Mar
-16
Mar
-17
Month-Year
Infr
inge
men
ts p
er M
onth
Annual NSW Speed Camera Review 2018 - Appendix A: Fixed Speed Cameras (High Risk) A112

Sydney - Sydney Harbour Tunnel
This is a high risk location that is enforced with fixed speed cameras, because it is difficult for the NSW Police to enforce. The length of each enforced direction is: • Camera 1 (northbound) 2295m • Camera 2 (southbound) 2295mThe cameras commenced operating on 2 August 2002.
Infringements by Month
0
100
200
300
400
500
600
700
Jul-0
2
Jul-0
3
Jul-0
4
Jul-0
5
Jul-0
6
Jul-0
7
Jul-0
8
Jul-0
9
Jul-1
0
Jul-1
1
Jul-1
2
Jul-1
3
Jul-1
4
Jul-1
5
Jul-1
6
Jul-1
7
Month-Year
Infr
inge
men
ts p
er M
onth
Casualties and Casualty Crashes
0
1
2
3
4
5
6
7
8
9
2003 2004 2005 2006 2007 2008 2009 2010 2011 2012 2013 2014 2015 2016 2017
Calendar year after camera installation
Cas
ualti
es/c
asua
lty c
rash
es p
er Y
ear
Uncategorised M inor/Other M oderate Injury
Serious Injury Killed Casualty Crash
Camera 1 Northbound Camera 2 Southbound
• In the northbound direction, there was 1 casualty crash in the 2017 data. This resulted in 1 serious injury, 1 moderate injury, and 1 minor injury. • In the southbound direction, there were 3 casualty crashes in the 2017 data. This resulted in 3 minor injuries. • The infringement graphs show the number of infringements issued at this location by direction, as well as the trend in infringements. Roadworks and camera maintenance may influence the number of infringements issued.
Casualties and Casualty Crashes
0
1
2
3
4
5
6
7
8
9
2003 2004 2005 2006 2007 2008 2009 2010 2011 2012 2013 2014 2015 2016 2017
Calendar year after camera installation
Cas
ualti
es/c
asua
lty c
rash
es p
er Y
ear
Uncategorised M inor/Other M oderate Injury
Serious Injury Killed Casualty Crash
Infringements by Month
0
100
200
300
400
500
600
700
Aug
-02
Aug
-03
Aug
-04
Aug
-05
Aug
-06
Aug
-07
Aug
-08
Aug
-09
Aug
-10
Aug
-11
Aug
-12
Aug
-13
Aug
-14
Aug
-15
Aug
-16
Aug
-17
Month-Year
Infr
inge
men
ts p
er M
onth
Annual NSW Speed Camera Review 2018 - Appendix A: Fixed Speed Cameras (High Risk) A113

Woolloomooloo/East Sydney - Cross City Tunnel
This is a high risk location that is enforced with fixed speed cameras, because it is difficult for the NSW Police to enforce. The length of each enforced direction is: • Camera 1 (eastbound) 2145m • Camera 2 (westbound) 2090mThe cameras commenced operating on 5 September 2005.
Infringements by Month
0
500
1000
1500
2000
2500
Sep
-05
Sep
-06
Sep
-07
Sep
-08
Sep
-09
Sep
-10
Sep
-11
Sep
-12
Sep
-13
Sep
-14
Sep
-15
Sep
-16
Sep
-17
Month-Year
Infr
inge
men
ts p
er M
onth
Casualties and Casualty Crashes
0
1
2
3
2006 2007 2008 2009 2010 2011 2012 2013 2014 2015 2016 2017
Calendar year after camera installation
Cas
ualti
es/c
asua
lty c
rash
es p
er Y
ear
Uncategorised M inor/Other M oderate Injury
Serious Injury Killed Casualty Crash
Camera 1 Eastbound Camera 2 Westbound
• In the eastbound direction, there were no casualty crashes in the 2017 data. • In the westbound direction, there were no casualty crashes in the 2017 data. • The infringement graphs show the number of infringements issued at this location by direction, as well as the trend in infringements. Roadworks and camera maintenance may influence the number of infringements issued.
Casualties and Casualty Crashes
0
1
2
3
2006 2007 2008 2009 2010 2011 2012 2013 2014 2015 2016 2017
Calendar year after camera installation
Cas
ualti
es/c
asua
lty c
rash
es p
er Y
ear
Uncategorised M inor/Other M oderate Injury
Serious Injury Killed Casualty Crash
Infringements by Month
0
500
1000
1500
2000
2500
Sep
-05
Sep
-06
Sep
-07
Sep
-08
Sep
-09
Sep
-10
Sep
-11
Sep
-12
Sep
-13
Sep
-14
Sep
-15
Sep
-16
Sep
-17
Month-Year
Infr
inge
men
ts p
er M
onth
Annual NSW Speed Camera Review 2018 - Appendix A: Fixed Speed Cameras (High Risk) A114

NSW Speed Camera Programs Annual Review 2018 – Appendix B: Red-light speed cameras B1
B. NSW red-light speed cameras
B.1 The red-light speed camera program
As at 31 December 2017, there were 191 red-light speed cameras in place at 171 locations across NSW. The median installation date for NSW red-light speed cameras was 27 June 2011.
Red-light speed cameras are installed at specific signalised intersections where drivers are vulnerable to right angle crashes and there is an elevated risk of a pedestrian crash. These cameras detect and deter both speeding and red-light running, both of which can result in severe injuries even in lower speed crashes.
In managing the program, Roads and Maritime Services (RMS) may increase the warning letter period and/or use Variable Message Signs to increase driver awareness of camera locations, where the trend in warning letters or number of infringements issued deems this appropriate. RMS also conducts ongoing site maintenance to ensure that signage is effectively placed and not obscured by roadside objects, such as trees. In late 2012, RMS also improved the road signs at red-light speed camera locations.
A table outlining NSW red-light speed camera locations is provided overleaf, and data about individual camera locations are provided on pages B8 – B178.

NSW Speed Camera Programs Annual Review 2018 – Appendix B: Red-light speed cameras B2
B.2 Red-light speed camera locations
Red-light speed cameras are installed across NSW, as follows:
Location Cameras Road Status Page 1 Adamstown 1 Park Avenue at Northcott Drive Retain B8
2 Alexandria 1 Collins Street at O'Riordan Street Insufficient data B9
3 Alexandria / Waterloo 2 McEvoy Street at Botany Road Retain B10
4 Ashfield 1 Frederick Street at Hume Highway Retain B11
5 Auburn 1 Chisholm Road at Mona Street Insufficient data B12
6 Auburn 1 Rawson Street at Northumberland Road Insufficient data B13
7 Auburn 1 Rawson Street at Station Road Insufficient data B14
8 Auburn 2 Silverwater Road at M4 westbound on-ramp Retain B15
9 Banksmeadow 1 Botany Road at Foreshore Road Insufficient data B16
10 Bankstown 1 Edgar Street at Marion Street Insufficient data B17
11 Bankstown 1 Meredith Street at Hume Highway (school zone) Retain B18
12 Bankstown 1 Stacey Street at Hume Highway Insufficient data B19
13 Baulkham Hills 2 Windsor Road at Old Northern Road / Seven Hills Road Retain B20
14 Belfield 1 Burwood Road at Punchbowl Road Insufficient data B21
15 Bexley 1 Forest Road at Harrow Road Retain and monitor B22
16 Bexley 1 Harrow Road at Watkin Street Insufficient data B23
17 Blacktown 1 Bungarribee Road at Balmoral Street Retain B24
18 Blacktown 1 Great Western Highway at Reservoir Road Retain B25
19 Blacktown 1 Lancaster Street at Kildare Street (school zone) Retain B26
20 Blacktown 1 Newton Road at Flushcombe Road (school zone) Retain B27
21 Blacktown 1 Richmond Road at Third Avenue Insufficient data B28
22 Blacktown 1 Sunnyholt Road at Main Street Retain B29
23 Blacktown 1 Third Avenue at Prince Street Insufficient data B30
24 Blakehurst 1 King Georges Road at Terry Streeet Insufficient data B31
25 Bondi Junction 1 Old South Head Road at Bondi Road Retain B32
26 Bradbury 1 Moore Oxley Bypass at The Parkway Insufficient data B33
27 Burwood 1 Railway Parade at Burwood Road Insufficient data B34

NSW Speed Camera Programs Annual Review 2018 – Appendix B: Red-light speed cameras B3
Location Cameras Road Status Page 28 Burwood / Concord 2 Parramatta Road at Burwood Road Retain B35
29 Cabramatta 2 Cumberland Highway at Cabramatta Road West Retain B36
30 Cabramatta 1 Cumberland Highway at St Johns Road Retain B37
31 Campbelltown 2 Kellicar Road at Narellan Road Retain B38
32 Campbelltown 2 Moore-Oxley Bypass at Broughton Street Retain B39
33 Campsie 1 Canterbury Road at Bexley Road Retain and monitor B40
34 Campsie 1 Canterbury Road at Thorncraft Parade Insufficient data B41
35 Canley Heights 1 Cumberland Highway at Canley Vale Road (school zone) Insufficient data B42
36 Canley Vale 1 Sackville Street at Canley Vale Road Retain and monitor B43
37 Caringbah 1 The Kingsway at Gannons Road Retain B44
38 Castle Hill 1 Pennant Street at Castle Street Insufficient data B45
39 Castle Hill 1 Showground Road at Victoria Avenue Retain and monitor B46
40 Chester Hill / Sefton 2 Waldron Road at Hector Street Retain B47
41 Chippendale 1 Abercrombie Street at Broadway Insufficient data B48
42 Chullora 1 Rookwood Road at Muir Road Insufficient data B49
43 Concord 1 Broughton Street at Crane Street Insufficient data B50
44 Crows Nest 1 Pacific Highway at Hume Street Retain B51
45 Croydon Park 1 Georges River Road at Croydon Avenue Insufficient data B52
46 Darlinghurst 1 Craigend Street at McLachlan Avenue Retain B53
47 Darlinghurst 2 Oxford Street at Crown Street Insufficient data B54
48 Darlinghurst 1 William Street at Crown Street Insufficient data B55
49 Dean Park 1 Richmond Road at M7 Motorway southbound on-ramp Insufficient data B56
50 Dee Why 1 Pittwater Road at Harbord Road Retain B57
51 Drummoyne 1 Victoria Road at Lyons Road Insufficient data B58
52 Eastern Creek 1 Great Western Highway at Rooty Hill Road South Insufficient data B59
53 Eastwood 1 Blaxland Road at May Street Retain B60
54 Eastwood 1 Rutledge Street at Shaftsbury Road (school zone) Insufficient data B61
55 Epping 1 Carlingford Road at Rawson Street Insufficient data B62
56 Ermington 1 Victoria Road at Spurway Street Insufficient data B63
57 Fairfield 1 Hamilton Road at Sackville Street Retain B64

NSW Speed Camera Programs Annual Review 2018 – Appendix B: Red-light speed cameras B4
Location Cameras Road Status Page 58 Fairfield 1 Hamilton Road at The Boulevarde Insufficient data B65
59 Fairfield 1 The Horsley Drive at Polding Street Insufficient data B66
60 Figtree 1 Princes Highway at O'Briens Road Retain B67
61 Five Dock 1 Fairlight Street at Ramsay Road Retain and monitor B68
62 Five Dock 1 Parramatta Road at Arlington Street Insufficient data B69
63 Glenwood 1 Old Windsor Road at Sunnyholt Road Insufficient data B70
64 Granville 1 Parramatta Road at Good Street Insufficient data B71
65 Granville 1 Woodville Road at M4 westbound on-ramp Retain B72
66 Greenacre 1 Juno Parade at Roberts Road Insufficient data B73
67 Greystanes 1 Cumberland Highway at Merrylands Road Insufficient data B74
68 Guildford 1 Woodville Road at Guildford Road Retain B75
69 Haberfield 1 Dobroyd Parade at Mortley Avenue Retain B76
70 Haberfield 1 Parramatta Road at Sloane Street Retain B77
71 Haberfield 1 Ramsay Street at Wattle Street Insufficient data B78
72 Hamilton 1 Tudor Street at Beaumont Street Retain and monitor B79
73 Hamilton East 1 Pacific Highway at Parry Street Retain B80
74 Haymarket 2 George Street at Pitt Street / Quay Street Insufficient data B81
75 Homebush West 1 Homebush Bay Drive at M4 eastbound on-ramp Insufficient data B82
76 Hunters Hill 1 Ryde Road at Pittwater Road Retain B83
77 Kensington 1 Anzac Parade at Todman Avenue Retain and monitor B84
78 Kingsgrove 1 Bexley Road at William Street Retain B85
79 Kingsgrove 1 Kingsgrove Road at Forsyth Street Insufficient data B86
80 Kingsgrove 1 Stoney Creek Road at Patrick Street Insufficient data B87
81 Kirrawee 1 Acacia Road at President Avenue Retain B88
82 Kogarah Bay 1 Park Road at Princes Highway Retain and monitor B89
83 Lakemba 1 Punchbowl Road at Wangee Road Insufficient data B90
84 Lambton 1 Griffiths Road at Turton Road Retain B91
85 Lane Cove 1 Epping Road at Centennial Avenue Insufficient data B92
86 Lansdowne / Villawood 2 Henry Lawson Drive / Woodville Road at Hume Highway Retain B93
87 Leichhardt 1 City West Link at James Street Insufficient data B94

NSW Speed Camera Programs Annual Review 2018 – Appendix B: Red-light speed cameras B5
Location Cameras Road Status Page 88 Lidcombe 1 Olympic Drive at Vaughan Street Retain B95
89 Liverpool 1 Hume Highway at Hoxton Park Road Insufficient data B96
90 Liverpool 1 Hume Highway at Elizabeth Drive Retain B97
91 Liverpool 1 Memorial Avenue at Bathurst Street Insufficient data B98
92 Liverpool 1 Moore Street at Bathurst Street Insufficient data B99
93 Maroubra 1 Anzac Parade at Boyce Road Insufficient data B100
94 Marrickville 1 Sydenham Road at Victoria Road Retain and monitor B101
95 Mascot 1 O'Riordan Street at Coward Street Retain B102
96 Mascot 1 O'Riordan Street at Gardeners Road Retain B103
97 Mayfield West 1 Pacific Highway at Maud Street Retain and monitor B104
98 Mays Hill 2 Great Western Highway at Coleman Street / Hawkesbury Road Retain B105
99 Merrylands West 1 Merrylands Road at Sherwood Road Insufficient data B106
100 Milperra 1 Newbridge Road at Henry Lawson Drive Retain and monitor B107
101 Miranda 1 Kingsway at Port Hacking Road Retain B108
102 Moore Park 1 Anzac Parade at Lang Road Ineligible B109
103 Moore Park / Paddington 2 Anzac Parade / Flinders Street at Moore Park Road Retain B110
104 Moorebank 1 Newbridge Road at Stockton Avenue Retain B111
105 Mosman 1 Military Road at Cowles Road Retain and monitor B112
106 Mount Druitt 1 Great Western Highway at Carlisle Avenue Insufficient data B113
107 Naremburn 1 Willoughby Road at Chandos Street Insufficient data B114
108 Neutral Bay 1 Falcon Street at Merlin Street Insufficient data B115
109 North Ryde 3 Cox's Road at Lane Cove Road (school zone) Insufficient data B116
110 North Ryde 1 Wicks Road at Epping Road Retain and monitor B117
111 Northmead 1 Briens Road at Redbank Road Insufficient data B118
112 Northmead 1 Old Windsor Road at Cumberland Highway Retain B119
113 Paddington 1 Moore Park Road at Lang Road Retain B120
114 Paddington / Surry Hills 2 South Dowling Street at Fitzroy Street / Moore Park Road Retain B121
115 Parramatta 1 Great Western Highway at Marsden Street Insufficient data B122
116 Parramatta 1 Macquarie Street at Marsden Street Insufficient data B123
117 Parramatta 1 O'Connell Street at Argyle Street Insufficient data B124

NSW Speed Camera Programs Annual Review 2018 – Appendix B: Red-light speed cameras B6
Location Cameras Road Status Page 118 Parramatta 1 Victoria Road at Church Street Retain B125
119 Pennant Hills 1 Pennant Hills Road at Beecroft Road (school zone) Retain B126
120 Petersham 1 Gordon Street at New Canterbury Road Retain and monitor B127
121 Petersham 1 Parramatta Road at West Street Retain and monitor B128
122 Prospect 1 Great Western Highway at Clunies Ross Street Insufficient data B129
123 Ramsgate 1 Rocky Point Road at Ramsgate Road Insufficient data B130
124 Randwick 1 Alison Street at Avoca Street Insufficient data B131
125 Randwick 1 Avoca Street at Darley Road Retain B132
126 Redfern 1 Chalmers Street at Cleveland Street (school zone) Retain B133
127 Richmond 1 March Street at East Market Street Insufficient data B134
128 Rockdale 1 Bestic Street at West Botany Street Retain B135
129 Rockdale 2 Princes Highway at Bay Street / The Seven Ways Retain B136
130 Rooty Hill 1 Woodstock Avenue at M7 northbound off-ramp Insufficient data B137
131 Roselands 1 King Georges Road at Moorefields Road Retain B138
132 Roselands / Wiley Park 2 Canterbury Road at King Georges Road Retain B139
133 Rozelle 1 Victoria Road at Evans Street Retain B140
134 Rozelle 1 Wellington Street at Victoria Road Retain B141
135 Ryde 1 Victoria Road at Devlin Street Retain and monitor B142
136 Seven Hills 1 Abbott Road at Station Road Insufficient data B143
137 Silverwater 1 Silverwater Road at M4 eastbound on-ramp Retain B144
138 Smithfield 1 Cumberland Highway at The Horsley Drive Insufficient data B145
139 Smithfield 1 Polding Street at The Boulevarde Insufficient data B146
140 Smithfield 1 The Horsley Drive at Gipps Street Insufficient data B147
141 Smithfield 1 Victoria Street at Hassall Street Retain and monitor B148
142 South Penrith 1 Parker Street at Jamison Road Retain and monitor B149
143 South Wentworthville 1 Cumberland Highway at Old Prospect Road Retain and monitor B150
144 Spring Hill 2 Springhill Road at Masters Road Insufficient data B151
145 St Marys 2 Great Western Highway at Charles Hackett Drive / Pages Road Retain B152
146 St Marys 1 Mamre Road at Saddington Street (school zone) Insufficient data B153
147 St Peters 1 Princes Highway at Sydney Park Road Insufficient data B154

NSW Speed Camera Programs Annual Review 2018 – Appendix B: Red-light speed cameras B7
Location Cameras Road Status Page 148 Strathfield 1 Arthur Street at Centenary Drive Retain B155
149 Surry Hills 1 Cleveland Street at South Dowling Street Retain B156
150 Surry Hills 1 Crown Street at Albion Street Insufficient data B157
151 Surry Hills 1 Foveaux Street at Crown Street Insufficient data B158
152 Sydney 1 Elizabeth Street at Park Street Insufficient data B159
153 Thornleigh 1 Pennant Hills Road at Parkes Street Retain and monitor B160
154 Ultimo 1 Wattle Street at William Henry Street Retain B161
155 Unanderra 1 Princes Highway at Five Islands Road Retain B162
156 Waitara 1 Pacific Highway at Romsey Street (school zone) Insufficient data B163
157 Wallsend 1 Thomas Street at Metcalfe Street Insufficient data B164
158 Warrawong 1 King Street (Grand Pacific Drive) at Cowper Street Insufficient data B165
159 Warwick Farm 1 Hume Highway at Bigge Street Retain B166
160 Waterloo 1 McEvoy Street at Elizabeth Street Insufficient data B167
161 Wentworthville 1 Great Western Highway at Station Street Retain B168
162 West Pennant Hills 1 Pennant Hills Road at Eaton Road Retain B169
163 West Pymble 1 Ryde Road at Lady Game Drive Retain B170
164 Wiley Park 1 The Boulevarde at King Georges Road (school zone) Insufficient data B171
165 Windang 1 Windang Road at Boronia Avenue Retain B172
166 Windsor 1 Macquarie Street at Hawkesbury Valley Way Insufficient data B173
167 Wollongong 1 Corrimal Street at Burelli Street Retain B174
168 Wollongong 1 Gladstone Avenue at Princes Highway Retain and monitor B175
169 Woollahra 1 Queen Street at Ocean Street Insufficient data B176
170 Yagoona 1 Rookwood Road at Brunker Road Insufficient data B177
171 Zetland 1 Bourke Street at Botany Road Retain B178
Total cameras: 191
Crash and infringement data for these 171 camera locations are individually presented overleaf.

• There is one camera at this intersection.
Casualties and FSI Crashes
0
2
4
6
8
10
-5Y -4Y -3Y -2Y -1Y 2012 2013 2014 2015 2016 2017Number of years before and year after camera installation
Casualti
es / C
rashes
Uncategorised M inor/Other M oderate Injury
Serious Injury Killed FSI Crash
7211 Adamstown - Park Avenue at Northcott Drive
• The infringement graphs show the number of warning letters and infringements issued at this intersection as well as the trend in infringements since the camera began operation. Roadworks and camera maintenance may influence the number of infringements issued.
Status: Retain.
Casualties and casualty crashes at enforced intersection Infringements at enforced intersection
Red-Light Infringements
0
50
100
150
200
250
May-11
Nov-11
May-12
Nov-12
May-13
Nov-13
May-14
Nov-14
May-15
Nov-15
May-16
Nov-16
May-17
Nov-17
Month-Year
Infr
ingem
ents
per
Month
Red-light Warning Letters Red-light Infringements5 year
after period²
Casualty CrashesCasualty CrashesCasualty CrashesCasualty Crashes 19 3 ↓ 84%
Serious InjuriesSerious InjuriesSerious InjuriesSerious Injuries
FatalitiesFatalitiesFatalitiesFatalities
4 0 ↓ 100%
0 0 -
Pedestrian Casualties
Right Through Casualty Crashes
Adjacent Casualty Crashes
Rear End Casualty Crashes
1
10
0
5
0
0
0
3
↓ 100%
↓ 100%
-
↓ 40%
Speeding Infringements
0
5
10
15
20
25
30
35
40
May-11
Nov-11
May-12
Nov-12
May-13
Nov-13
May-14
Nov-14
May-15
Nov-15
May-16
Nov-16
May-17
Nov-17
Month-Year
Infr
ingem
ents
per
Month
Speeding Warning Letters Speeding Infringements
Moderate InjuriesModerate InjuriesModerate InjuriesModerate Injuries 13 1 ↓ 92%
Minor / Other InjuriesMinor / Other InjuriesMinor / Other InjuriesMinor / Other Injuries 10 2 ↓ 80%
¹ Ending 91 days before the start of the warning letter period, 21 February 2011² Ending 31 December 2017
5 years before
installation¹
Total Casualties:Total Casualties:Total Casualties:Total Casualties: 3 ↓ 89%27
Percentage
change
Fatal and Serious CrashesFatal and Serious CrashesFatal and Serious CrashesFatal and Serious Crashes 4 0 ↓ 100%
• The camera at the intersection of Park Avenue and Northcott Drive commenced issuing warning letters in May 2011.
Annual NSW Speed Camera Performance Review 2018 - Appendix B: Red-light speed cameras B8

• There is one camera at this intersection.
Casualties and FSI Crashes
0
1
2
3
4
5
-5Y -4Y -3Y -2Y -1Y 1Y 2Y 3Y 4YNumber of years before and after camera installation
Casualti
es / C
rashes
Uncategorised M inor/Other M oderate Injury
Serious Injury Killed FSI Crash
7287 Alexandria - Collins Street at O'Riordan Street
• The infringement graphs show the number of warning letters and infringements issued at this intersection as well as the trend in infringements since the camera began operation. Roadworks and camera maintenance may influence the number of infringements issued.
Status: Insufficient data (<5 years) to reliably assess.
Casualties and casualty crashes at enforced intersection Infringements at enforced intersection
Red-Light Infringements
0
50
100
150
200
250
300
350
400
Oct-13
Jan-14
Apr-14
Jul-14
Oct-14
Jan-15
Apr-15
Jul-15
Oct-15
Jan-16
Apr-16
Jul-16
Oct-16
Jan-17
Apr-17
Jul-17
Oct-17
Month-Year
Infr
ingem
ents
per
Month
Red-light Warning Letters Red-light Infringements4 years and 70 days
after installation²
Casualty CrashesCasualty CrashesCasualty CrashesCasualty Crashes 9 6 ↓ 20%
Serious InjuriesSerious InjuriesSerious InjuriesSerious Injuries
FatalitiesFatalitiesFatalitiesFatalities
1 2 ↑ 139%
0 0 -
Pedestrian Casualties
Right Through Casualty Crashes
Adjacent Casualty Crashes
Rear End Casualty Crashes
0
2
4
1
0
2
2
1
-
↑ 19%
↓ 40%
↑ 19%
Speeding Infringements
0
1
2
3
4
5
6
7
Oct-13
Jan-14
Apr-14
Jul-14
Oct-14
Jan-15
Apr-15
Jul-15
Oct-15
Jan-16
Apr-16
Jul-16
Oct-16
Jan-17
Apr-17
Jul-17
Oct-17
Month-Year
Infr
ingem
ents
per
Month
Speeding Warning Letters Speeding Infringements
Moderate InjuriesModerate InjuriesModerate InjuriesModerate Injuries 8 4 ↓ 40%
Minor / Other InjuriesMinor / Other InjuriesMinor / Other InjuriesMinor / Other Injuries 2 2 ↑ 19%
¹ Ending 91 days before the start of the warning letter period, 23 July 2013² Ending 31 December 2017³ The percentage change is based on annualised crash data to allow for a direct comparison between the pre and post installation time periods. Red values indicate an increase.
5 years before
installation¹
Total Casualties:Total Casualties:Total Casualties:Total Casualties: 8 ↓ 13%11
Percentage
change³
Fatal and Serious CrashesFatal and Serious CrashesFatal and Serious CrashesFatal and Serious Crashes 1 2 ↑ 139%
• The camera at the intersection of Collins Street and O'Riordan Street commenced issuing warning letters in October 2013.
Annual NSW Speed Camera Performance Review 2018 - Appendix B: Red-light speed cameras B9

• There are two cameras at this intersection. This was previously a wet-film red-light camera location.
Casualties and FSI Crashes
0
2
4
6
8
10
12
-5Y -4Y -3Y -2Y -1Y 2011 2012 2013 2014 2015 2016 2017Number of years before and year after camera installation
Casualti
es / C
rashes
Uncategorised M inor/Other M oderate Injury
Serious Injury Killed FSI Crash
7101|7102 Alexandria / Waterloo - McEvoy Street at Botany Road
• The infringement graphs show the number of warning letters and infringements issued at this intersection as well as the trend in infringements since the camera began operation. Roadworks and camera maintenance may influence the number of infringements issued.
Status: Retain.
Casualties and casualty crashes at enforced intersection Infringements at enforced intersection
Red-Light Infringements
0
50
100
150
200
250
300
350
Jun-10
Dec-10
Jun-11
Dec-11
Jun-12
Dec-12
Jun-13
Dec-13
Jun-14
Dec-14
Jun-15
Dec-15
Jun-16
Dec-16
Jun-17
Dec-17
Month-Year
Infr
ingem
ents
per
Month
Red-light Warning Letters Red-light Infringements5 year
after period²
Casualty CrashesCasualty CrashesCasualty CrashesCasualty Crashes 22 7 ↓ 68%
Serious InjuriesSerious InjuriesSerious InjuriesSerious Injuries
FatalitiesFatalitiesFatalitiesFatalities
2 2 ↓ 0%
2 0 ↓ 100%
Pedestrian Casualties
Right Through Casualty Crashes
Adjacent Casualty Crashes
Rear End Casualty Crashes
6
3
5
6
1
0
5
1
↓ 83%
↓ 100%
↓ 0%
↓ 83%
Speeding Infringements
0
5
10
15
20
25
30
Jun-10
Dec-10
Jun-11
Dec-11
Jun-12
Dec-12
Jun-13
Dec-13
Jun-14
Dec-14
Jun-15
Dec-15
Jun-16
Dec-16
Jun-17
Dec-17
Month-Year
Infr
ingem
ents
per
Month
Speeding Warning Letters Speeding Infringements
Moderate InjuriesModerate InjuriesModerate InjuriesModerate Injuries 14 5 ↓ 64%
Minor / Other InjuriesMinor / Other InjuriesMinor / Other InjuriesMinor / Other Injuries 10 2 ↓ 80%
¹ Ending 91 days before the start of the warning letter period, 31 March 2010² Ending 31 December 2017
5 years before
installation¹
Total Casualties:Total Casualties:Total Casualties:Total Casualties: 9 ↓ 68%28
Percentage
change
Fatal and Serious CrashesFatal and Serious CrashesFatal and Serious CrashesFatal and Serious Crashes 3 2 ↓ 33%
• Both cameras at the intersection of McEvoy Street and Botany Road commenced issuing warning letters in June 2010.
Annual NSW Speed Camera Performance Review 2018 - Appendix B: Red-light speed cameras B10

• There is one camera at this intersection. This was previously a wet-film red-light camera location.
Casualties and FSI Crashes
0
2
4
6
8
-5Y -4Y -3Y -2Y -1Y 2012 2013 2014 2015 2016 2017Number of years before and year after camera installation
Casualti
es / C
rashes
Uncategorised M inor/Other M oderate Injury
Serious Injury Killed FSI Crash
7180 Ashfield - Frederick Street at Hume Highway
• The infringement graphs show the number of warning letters and infringements issued at this intersection as well as the trend in infringements since the camera began operation. Roadworks and camera maintenance may influence the number of infringements issued.
Status: Retain.
Casualties and casualty crashes at enforced intersection Infringements at enforced intersection
Red-Light Infringements
0
50
100
150
200
250
Mar-11
Sep-11
Mar-12
Sep-12
Mar-13
Sep-13
Mar-14
Sep-14
Mar-15
Sep-15
Mar-16
Sep-16
Mar-17
Sep-17
Month-Year
Infr
ingem
ents
per
Month
Red-light Warning Letters Red-light Infringements5 year
after period²
Casualty CrashesCasualty CrashesCasualty CrashesCasualty Crashes 12 12 ↓ 0%
Serious InjuriesSerious InjuriesSerious InjuriesSerious Injuries
FatalitiesFatalitiesFatalitiesFatalities
2 0 ↓ 100%
0 0 -
Pedestrian Casualties
Right Through Casualty Crashes
Adjacent Casualty Crashes
Rear End Casualty Crashes
0
3
3
4
0
1
1
7
-
↓ 67%
↓ 67%
↑ 75%
Speeding Infringements
0
20
40
60
80
100
120
140
Mar-11
Sep-11
Mar-12
Sep-12
Mar-13
Sep-13
Mar-14
Sep-14
Mar-15
Sep-15
Mar-16
Sep-16
Mar-17
Sep-17
Month-Year
Infr
ingem
ents
per
Month
Speeding Warning Letters Speeding Infringements
Moderate InjuriesModerate InjuriesModerate InjuriesModerate Injuries 4 7 ↑ 75%
Minor / Other InjuriesMinor / Other InjuriesMinor / Other InjuriesMinor / Other Injuries 9 7 ↓ 22%
¹ Ending 91 days before the start of the warning letter period, 15 December 2010² Ending 31 December 2017
5 years before
installation¹
Total Casualties:Total Casualties:Total Casualties:Total Casualties: 14 ↓ 7%15
Percentage
change
Fatal and Serious CrashesFatal and Serious CrashesFatal and Serious CrashesFatal and Serious Crashes 2 0 ↓ 100%
• The camera at the intersection of Frederick Street and Hume Highway commenced issuing warning letters in March 2011.
Annual NSW Speed Camera Performance Review 2018 - Appendix B: Red-light speed cameras B11

• There is one camera at this intersection.
Casualties and FSI Crashes
0
1
2
3
4
5
6
7
-5Y -4Y -3Y -2Y -1Y 1Y 2Y 3Y 4YNumber of years before and after camera installation
Casualti
es / C
rashes
Uncategorised M inor/Other M oderate Injury
Serious Injury Killed FSI Crash
7250 Auburn - Chisholm Road at Mona Street
• The infringement graphs show the number of warning letters and infringements issued at this intersection as well as the trend in infringements since the camera began operation. Roadworks and camera maintenance may influence the number of infringements issued.
Status: Insufficient data (<5 years) to reliably assess.
Casualties and casualty crashes at enforced intersection Infringements at enforced intersection
Red-Light Infringements
0
10
20
30
40
50
60
70
80
90
Feb-13
Jun-13
Oct-13
Feb-14
Jun-14
Oct-14
Feb-15
Jun-15
Oct-15
Feb-16
Jun-16
Oct-16
Feb-17
Jun-17
Oct-17
Month-Year
Infr
ingem
ents
per
Month
Red-light Warning Letters Red-light Infringements4 years and 308
days after installation²
Casualty CrashesCasualty CrashesCasualty CrashesCasualty Crashes 15 10 ↓ 31%
Serious InjuriesSerious InjuriesSerious InjuriesSerious Injuries
FatalitiesFatalitiesFatalitiesFatalities
8 2 ↓ 74%
0 0 -
Pedestrian Casualties
Right Through Casualty Crashes
Adjacent Casualty Crashes
Rear End Casualty Crashes
0
2
8
1
0
3
3
3
-
↑ 55%
↓ 61%
↑ 210%
Speeding Infringements
0
2
4
6
8
10
12
14
16
18
20
Feb-13
Jun-13
Oct-13
Feb-14
Jun-14
Oct-14
Feb-15
Jun-15
Oct-15
Feb-16
Jun-16
Oct-16
Feb-17
Jun-17
Oct-17
Month-Year
Infr
ingem
ents
per
Month
Speeding Warning Letters Speeding Infringements
Moderate InjuriesModerate InjuriesModerate InjuriesModerate Injuries 7 3 ↓ 56%
Minor / Other InjuriesMinor / Other InjuriesMinor / Other InjuriesMinor / Other Injuries 5 5 ↑ 3%
¹ Ending 91 days before the start of the warning letter period, 27 November 2012² Ending 31 December 2017³ The percentage change is based on annualised crash data to allow for a direct comparison between the pre and post installation time periods. Red values indicate an increase.
5 years before
installation¹
Total Casualties:Total Casualties:Total Casualties:Total Casualties: 10 ↓ 48%20
Percentage
change³
Fatal and Serious CrashesFatal and Serious CrashesFatal and Serious CrashesFatal and Serious Crashes 7 2 ↓ 70%
• The camera at the intersection of Chisholm Road and Mona Street commenced issuing warning letters in February 2013.
Annual NSW Speed Camera Performance Review 2018 - Appendix B: Red-light speed cameras B12

• There is one camera at this intersection.
Casualties and FSI Crashes
0
1
2
3
4
-5Y -4Y -3Y -2Y -1Y 1YNumber of years before and after camera installation
Casualti
es / C
rashes
Uncategorised M inor/Other M oderate Injury
Serious Injury Killed FSI Crash
7336 Auburn - Rawson Street at Northumberland Road
• The infringement graphs show the number of warning letters and infringements issued at this intersection as well as the trend in infringements since the camera began operation. Roadworks and camera maintenance may influence the number of infringements issued.
Status: Insufficient data (<5 years) to reliably assess.
Casualties and casualty crashes at enforced intersection Infringements at enforced intersection
Red-Light Infringements
0
50
100
150
200
250
Sep-16
Oct-16
Nov-16
Dec-16
Jan-17
Feb-17
Mar-17
Apr-17
May-17
Jun-17
Jul-17
Aug-17
Sep-17
Oct-17
Nov-17
Dec-17
Month-Year
Infr
ingem
ents
per
Month
Red-light Warning Letters Red-light Infringements1 year and 92 days
after installation²
Casualty CrashesCasualty CrashesCasualty CrashesCasualty Crashes 7 1 ↓ 43%
Serious InjuriesSerious InjuriesSerious InjuriesSerious Injuries
FatalitiesFatalitiesFatalitiesFatalities
7 0 ↓ 100%
0 0 -
Pedestrian Casualties
Right Through Casualty Crashes
Adjacent Casualty Crashes
Rear End Casualty Crashes
5
1
0
1
1
0
0
0
↓ 20%
↓ 100%
-
↓ 100%
Speeding Infringements
0
20
40
60
80
100
120
140
160
180
200
Sep-16
Oct-16
Nov-16
Dec-16
Jan-17
Feb-17
Mar-17
Apr-17
May-17
Jun-17
Jul-17
Aug-17
Sep-17
Oct-17
Nov-17
Dec-17
Month-Year
Infr
ingem
ents
per
Month
Speeding Warning Letters Speeding Infringements
Moderate InjuriesModerate InjuriesModerate InjuriesModerate Injuries 2 1 ↑ 100%
Minor / Other InjuriesMinor / Other InjuriesMinor / Other InjuriesMinor / Other Injuries 1 0 ↓ 100%
¹ Ending 91 days before the start of the warning letter period, 1 July 2016² Ending 31 December 2017³ The percentage change is based on annualised crash data to allow for a direct comparison between the pre and post installation time periods. Red values indicate an increase.
5 years before
installation¹
Total Casualties:Total Casualties:Total Casualties:Total Casualties: 1 ↓ 60%10
Percentage
change³
Fatal and Serious CrashesFatal and Serious CrashesFatal and Serious CrashesFatal and Serious Crashes 6 0 ↓ 100%
• The camera at the intersection of Rawson Street and Northumberland Road commenced issuing warning letters in September 2016.
Annual NSW Speed Camera Performance Review 2018 - Appendix B: Red-light speed cameras B13

• There is one camera at this intersection.
Casualties and FSI Crashes
0
2
4
6
8
-5Y -4Y -3Y -2Y -1Y 1Y 2Y 3YNumber of years before and after camera installation
Casualti
es / C
rashes
Uncategorised M inor/Other M oderate Injury
Serious Injury Killed FSI Crash
7300 Auburn - Rawson Street at Station Road
• The infringement graphs show the number of warning letters and infringements issued at this intersection as well as the trend in infringements since the camera began operation. Roadworks and camera maintenance may influence the number of infringements issued.
Status: Insufficient data (<5 years) to reliably assess.
Casualties and casualty crashes at enforced intersection Infringements at enforced intersection
Red-Light Infringements
0
50
100
150
200
250
300
350
400
450
Jul-14
Oct-14
Jan-15
Apr-15
Jul-15
Oct-15
Jan-16
Apr-16
Jul-16
Oct-16
Jan-17
Apr-17
Jul-17
Oct-17
Month-Year
Infr
ingem
ents
per
Month
Red-light Warning Letters Red-light Infringements3 years and 159
days after installation²
Casualty CrashesCasualty CrashesCasualty CrashesCasualty Crashes 21 8 ↓ 45%
Serious InjuriesSerious InjuriesSerious InjuriesSerious Injuries
FatalitiesFatalitiesFatalitiesFatalities
11 3 ↓ 60%
0 1 Increase
Pedestrian Casualties
Right Through Casualty Crashes
Adjacent Casualty Crashes
Rear End Casualty Crashes
9
0
10
0
4
0
0
2
↓ 35%
-
↓ 100%
Increase
Speeding Infringements
0
20
40
60
80
100
120
Jul-14
Oct-14
Jan-15
Apr-15
Jul-15
Oct-15
Jan-16
Apr-16
Jul-16
Oct-16
Jan-17
Apr-17
Jul-17
Oct-17
Month-Year
Infr
ingem
ents
per
Month
Speeding Warning Letters Speeding Infringements
Moderate InjuriesModerate InjuriesModerate InjuriesModerate Injuries 8 3 ↓ 45%
Minor / Other InjuriesMinor / Other InjuriesMinor / Other InjuriesMinor / Other Injuries 4 3 ↑ 9%
¹ Ending 91 days before the start of the warning letter period, 25 April 2014² Ending 31 December 2017³ The percentage change is based on annualised crash data to allow for a direct comparison between the pre and post installation time periods. Red values indicate an increase.
5 years before
installation¹
Total Casualties:Total Casualties:Total Casualties:Total Casualties: 10 ↓ 37%23
Percentage
change³
Fatal and Serious CrashesFatal and Serious CrashesFatal and Serious CrashesFatal and Serious Crashes 10 4 ↓ 42%
• The camera at the intersection of Rawson Street and Station Road commenced issuing warning letters in July 2014.
Annual NSW Speed Camera Performance Review 2018 - Appendix B: Red-light speed cameras B14

• There are two cameras at this intersection.
Casualties and FSI Crashes
0
2
4
6
8
10
12
-5Y -4Y -3Y -2Y -1Y 2011 2012 2013 2014 2015 2016 2017Number of years before and year after camera installation
Casualti
es / C
rashes
Uncategorised M inor/Other M oderate Injury
Serious Injury Killed FSI Crash
7112|7223 Auburn - Silverwater Road at M4 westbound on-ramp
• The infringement graphs show the number of warning letters and infringements issued at this intersection as well as the trend in infringements since the camera began operation. Roadworks and camera maintenance may influence the number of infringements issued.
Status: Retain.
Casualties and casualty crashes at enforced intersection Infringements at enforced intersection
Red-Light Infringements
0
50
100
150
200
250
300
350
400
450
500
Jul-10
Jan-11
Jul-11
Jan-12
Jul-12
Jan-13
Jul-13
Jan-14
Jul-14
Jan-15
Jul-15
Jan-16
Jul-16
Jan-17
Jul-17
Month-Year
Infr
ingem
ents
per
Month
Red-light Warning Letters Red-light Infringements5 year
after period²
Casualty CrashesCasualty CrashesCasualty CrashesCasualty Crashes 30 12 ↓ 60%
Serious InjuriesSerious InjuriesSerious InjuriesSerious Injuries
FatalitiesFatalitiesFatalitiesFatalities
4 1 ↓ 75%
0 0 -
Pedestrian Casualties
Right Through Casualty Crashes
Adjacent Casualty Crashes
Rear End Casualty Crashes
0
4
3
13
0
2
0
8
-
↓ 50%
↓ 100%
↓ 38%
Speeding Infringements
0
10
20
30
40
50
60
70
Jul-10
Jan-11
Jul-11
Jan-12
Jul-12
Jan-13
Jul-13
Jan-14
Jul-14
Jan-15
Jul-15
Jan-16
Jul-16
Jan-17
Jul-17
Month-Year
Infr
ingem
ents
per
Month
Speeding Warning Letters Speeding Infringements
Moderate InjuriesModerate InjuriesModerate InjuriesModerate Injuries 10 5 ↓ 50%
Minor / Other InjuriesMinor / Other InjuriesMinor / Other InjuriesMinor / Other Injuries 23 7 ↓ 70%
¹ Ending 91 days before the start of the warning letter period, 16 April 2010² Ending 31 December 2017
5 years before
installation¹
Total Casualties:Total Casualties:Total Casualties:Total Casualties: 13 ↓ 65%37
Percentage
change
Fatal and Serious CrashesFatal and Serious CrashesFatal and Serious CrashesFatal and Serious Crashes 4 1 ↓ 75%
• The camera at the intersection of Silverwater Road and M4 Westbound On-ramp (northbound) commenced issuing warning letters in July 2010.
• The camera at the intersection of M4 Western Motorway Off-ramp and Silverwater Road (westbound) commenced issuing warning letters in June 2011.
Annual NSW Speed Camera Performance Review 2018 - Appendix B: Red-light speed cameras B15

• There is one camera at this intersection.
Casualties and FSI Crashes
0
1
2
3
4
-5Y -4Y -3Y -2Y -1Y 1YNumber of years before and after camera installation
Casualti
es / C
rashes
Uncategorised M inor/Other M oderate Injury
Serious Injury Killed FSI Crash
7323 Banksmeadow - Botany Road at Foreshore Road
• The infringement graphs show the number of warning letters and infringements issued at this intersection as well as the trend in infringements since the camera began operation. Roadworks and camera maintenance may influence the number of infringements issued.
Status: Insufficient data (<5 years) to reliably assess.
Casualties and casualty crashes at enforced intersection Infringements at enforced intersection
Red-Light Infringements
0
20
40
60
80
100
120
140
160
Jul-16
Sep-16
Nov-16
Jan-17
Mar-17
May-17
Jul-17
Sep-17
Nov-17
Month-Year
Infr
ingem
ents
per
Month
Red-light Warning Letters Red-light Infringements1 year and 178 days
after installation²
Casualty CrashesCasualty CrashesCasualty CrashesCasualty Crashes 7 4 ↑ 92%
Serious InjuriesSerious InjuriesSerious InjuriesSerious Injuries
FatalitiesFatalitiesFatalitiesFatalities
2 1 ↑ 68%
0 0 -
Pedestrian Casualties
Right Through Casualty Crashes
Adjacent Casualty Crashes
Rear End Casualty Crashes
0
0
0
2
0
1
0
1
-
Increase
-
↑ 68%
Speeding Infringements
0
200
400
600
800
1000
1200
1400
Jul-16
Sep-16
Nov-16
Jan-17
Mar-17
May-17
Jul-17
Sep-17
Nov-17
Month-Year
Infr
ingem
ents
per
Month
Speeding Warning Letters Speeding Infringements
Moderate InjuriesModerate InjuriesModerate InjuriesModerate Injuries 3 1 ↑ 12%
Minor / Other InjuriesMinor / Other InjuriesMinor / Other InjuriesMinor / Other Injuries 5 3 ↑ 102%
¹ Ending 91 days before the start of the warning letter period, 6 April 2016² Ending 31 December 2017³ The percentage change is based on annualised crash data to allow for a direct comparison between the pre and post installation time periods. Red values indicate an increase.
5 years before
installation¹
Total Casualties:Total Casualties:Total Casualties:Total Casualties: 5 ↑ 68%10
Percentage
change³
Fatal and Serious CrashesFatal and Serious CrashesFatal and Serious CrashesFatal and Serious Crashes 2 1 ↑ 68%
• The camera at the intersection of Foreshore Road and Botany Road commenced issuing warning letters in July 2016.
Annual NSW Speed Camera Performance Review 2018 - Appendix B: Red-light speed cameras B16

• There is one camera at this intersection.
Casualties and FSI Crashes
0
2
4
6
8
10
12
-5Y -4Y -3Y -2Y -1Y 1Y 2Y 3Y 4YNumber of years before and after camera installation
Casualti
es / C
rashes
Uncategorised M inor/Other M oderate Injury
Serious Injury Killed FSI Crash
7272 Bankstown - Edgar Street at Marion Street
• The infringement graphs show the number of warning letters and infringements issued at this intersection as well as the trend in infringements since the camera began operation. Roadworks and camera maintenance may influence the number of infringements issued.
Status: Insufficient data (<5 years) to reliably assess.
Casualties and casualty crashes at enforced intersection Infringements at enforced intersection
Red-Light Infringements
0
50
100
150
200
250
300
350
400
Aug-13
Dec-13
Apr-14
Aug-14
Dec-14
Apr-15
Aug-15
Dec-15
Apr-16
Aug-16
Dec-16
Apr-17
Aug-17
Dec-17
Month-Year
Infr
ingem
ents
per
Month
Red-light Warning Letters Red-light Infringements4 years and 126
days after installation²
Casualty CrashesCasualty CrashesCasualty CrashesCasualty Crashes 18 21 ↑ 34%
Serious InjuriesSerious InjuriesSerious InjuriesSerious Injuries
FatalitiesFatalitiesFatalitiesFatalities
2 8 ↑ 360%
0 0 -
Pedestrian Casualties
Right Through Casualty Crashes
Adjacent Casualty Crashes
Rear End Casualty Crashes
0
4
7
3
0
7
6
3
-
↑ 101%
↓ 1%
↑ 15%
Speeding Infringements
0
0.5
1
1.5
2
2.5
Aug-13
Dec-13
Apr-14
Aug-14
Dec-14
Apr-15
Aug-15
Dec-15
Apr-16
Aug-16
Dec-16
Apr-17
Aug-17
Dec-17
Month-Year
Infr
ingem
ents
per
Month
Speeding Warning Letters Speeding Infringements
Moderate InjuriesModerate InjuriesModerate InjuriesModerate Injuries 15 9 ↓ 31%
Minor / Other InjuriesMinor / Other InjuriesMinor / Other InjuriesMinor / Other Injuries 8 11 ↑ 58%
¹ Ending 91 days before the start of the warning letter period, 28 May 2013² Ending 31 December 2017³ The percentage change is based on annualised crash data to allow for a direct comparison between the pre and post installation time periods. Red values indicate an increase.
5 years before
installation¹
Total Casualties:Total Casualties:Total Casualties:Total Casualties: 28 ↑ 29%25
Percentage
change³
Fatal and Serious CrashesFatal and Serious CrashesFatal and Serious CrashesFatal and Serious Crashes 2 7 ↑ 303%
• The camera at the intersection of Edgar Street and Marion Street commenced issuing warning letters in August 2013.
Annual NSW Speed Camera Performance Review 2018 - Appendix B: Red-light speed cameras B17

• There is one camera at this intersection. This was previously a wet-film red-light camera location.
Casualties and FSI Crashes
0
2
4
6
8
10
12
14
-5Y -4Y -3Y -2Y -1Y 2011 2012 2013 2014 2015 2016 2017Number of years before and year after camera installation
Casualti
es / C
rashes
Uncategorised M inor/Other M oderate Injury
Serious Injury Killed FSI Crash
7155 Bankstown - Meredith Street at Hume Highway (school zone)
• The infringement graphs show the number of warning letters and infringements issued at this intersection as well as the trend in infringements since the camera began operation. Roadworks and camera maintenance may influence the number of infringements issued.
Status: Retain.
Casualties and casualty crashes at enforced intersection Infringements at enforced intersection
Red-Light Infringements
0
50
100
150
200
250
Dec-10
Jun-11
Dec-11
Jun-12
Dec-12
Jun-13
Dec-13
Jun-14
Dec-14
Jun-15
Dec-15
Jun-16
Dec-16
Jun-17
Dec-17
Month-Year
Infr
ingem
ents
per
Month
Red-light Warning Letters Red-light Infringements5 year
after period²
Casualty CrashesCasualty CrashesCasualty CrashesCasualty Crashes 17 17 ↓ 0%
Serious InjuriesSerious InjuriesSerious InjuriesSerious Injuries
FatalitiesFatalitiesFatalitiesFatalities
8 2 ↓ 75%
0 0 -
Pedestrian Casualties
Right Through Casualty Crashes
Adjacent Casualty Crashes
Rear End Casualty Crashes
2
5
3
7
3
8
1
3
↑ 50%
↑ 60%
↓ 67%
↓ 57%
Moderate InjuriesModerate InjuriesModerate InjuriesModerate Injuries 12 8 ↓ 33%
Minor / Other InjuriesMinor / Other InjuriesMinor / Other InjuriesMinor / Other Injuries 5 10 ↑ 100%
¹ Ending 91 days before the start of the warning letter period, 15 September 2010² Ending 31 December 2017
5 years before
installation¹
Total Casualties:Total Casualties:Total Casualties:Total Casualties: 20 ↓ 20%25
Percentage
change
Fatal and Serious CrashesFatal and Serious CrashesFatal and Serious CrashesFatal and Serious Crashes 8 2 ↓ 75%
• The camera at the intersection of Meredith Street and Hume Highway commenced issuing warning letters in December 2010. This camera enforces red-light running only.
Annual NSW Speed Camera Performance Review 2018 - Appendix B: Red-light speed cameras B18

• There is one camera at this intersection.
Casualties and FSI Crashes
0
5
10
15
20
-5Y -4Y -3Y -2Y -1Y 1Y 2Y 3Y 4YNumber of years before and after camera installation
Casualti
es / C
rashes
Uncategorised M inor/Other M oderate Injury
Serious Injury Killed FSI Crash
7248 Bankstown - Stacey Street at Hume Highway
• The infringement graphs show the number of warning letters and infringements issued at this intersection as well as the trend in infringements since the camera began operation. Roadworks and camera maintenance may influence the number of infringements issued.
Status: Insufficient data (<5 years) to reliably assess.
Casualties and casualty crashes at enforced intersection Infringements at enforced intersection
Red-Light Infringements
0
200
400
600
800
1000
1200
1400
Apr-13
Aug-13
Dec-13
Apr-14
Aug-14
Dec-14
Apr-15
Aug-15
Dec-15
Apr-16
Aug-16
Dec-16
Apr-17
Aug-17
Dec-17
Month-Year
Infr
ingem
ents
per
Month
Red-light Warning Letters Red-light Infringements4 years and 255
days after installation²
Casualty CrashesCasualty CrashesCasualty CrashesCasualty Crashes 20 15 ↓ 20%
Serious InjuriesSerious InjuriesSerious InjuriesSerious Injuries
FatalitiesFatalitiesFatalitiesFatalities
3 2 ↓ 29%
0 0 -
Pedestrian Casualties
Right Through Casualty Crashes
Adjacent Casualty Crashes
Rear End Casualty Crashes
0
1
6
8
0
0
0
10
-
↓ 100%
↓ 100%
↑ 33%
Speeding Infringements
0
10
20
30
40
50
60
70
80
Apr-13
Aug-13
Dec-13
Apr-14
Aug-14
Dec-14
Apr-15
Aug-15
Dec-15
Apr-16
Aug-16
Dec-16
Apr-17
Aug-17
Dec-17
Month-Year
Infr
ingem
ents
per
Month
Speeding Warning Letters Speeding Infringements
Moderate InjuriesModerate InjuriesModerate InjuriesModerate Injuries 15 2 ↓ 86%
Minor / Other InjuriesMinor / Other InjuriesMinor / Other InjuriesMinor / Other Injuries 9 13 ↑ 54%
¹ Ending 91 days before the start of the warning letter period, 19 January 2013² Ending 31 December 2017³ The percentage change is based on annualised crash data to allow for a direct comparison between the pre and post installation time periods. Red values indicate an increase.
5 years before
installation¹
Total Casualties:Total Casualties:Total Casualties:Total Casualties: 17 ↓ 33%27
Percentage
change³
Fatal and Serious CrashesFatal and Serious CrashesFatal and Serious CrashesFatal and Serious Crashes 2 2 ↑ 6%
• The camera at the intersection of Stacey Street and Hume Highway commenced issuing warning letters in April 2013.
Annual NSW Speed Camera Performance Review 2018 - Appendix B: Red-light speed cameras B19

• There are two cameras at this intersection. This was previously a wet-film red-light camera location.
Casualties and FSI Crashes
0
2
4
6
8
10
12
14
-5Y -4Y -3Y -2Y -1Y 2011 2012 2013 2014 2015 2016 2017Number of years before and year after camera installation
Casualti
es / C
rashes
Uncategorised M inor/Other M oderate Injury
Serious Injury Killed FSI Crash
7145|7146 Baulkham Hills - Windsor Road at Old Northern Road / Seven Hills Road
• The infringement graphs show the number of warning letters and infringements issued at this intersection as well as the trend in infringements since the camera began operation. Roadworks and camera maintenance may influence the number of infringements issued.
Status: Retain.
Casualties and casualty crashes at enforced intersection Infringements at enforced intersection
Red-Light Infringements
0
100
200
300
400
500
600
Sep-10
Mar-11
Sep-11
Mar-12
Sep-12
Mar-13
Sep-13
Mar-14
Sep-14
Mar-15
Sep-15
Mar-16
Sep-16
Mar-17
Sep-17
Month-Year
Infr
ingem
ents
per
Month
Red-light Warning Letters Red-light Infringements5 year
after period²
Casualty CrashesCasualty CrashesCasualty CrashesCasualty Crashes 25 12 ↓ 52%
Serious InjuriesSerious InjuriesSerious InjuriesSerious Injuries
FatalitiesFatalitiesFatalitiesFatalities
4 5 ↑ 25%
1 0 ↓ 100%
Pedestrian Casualties
Right Through Casualty Crashes
Adjacent Casualty Crashes
Rear End Casualty Crashes
1
3
3
8
2
1
1
7
↑ 100%
↓ 67%
↓ 67%
↓ 13%
Speeding Infringements
0
50
100
150
200
250
300
350
400
450
500
Sep-10
Mar-11
Sep-11
Mar-12
Sep-12
Mar-13
Sep-13
Mar-14
Sep-14
Mar-15
Sep-15
Mar-16
Sep-16
Mar-17
Sep-17
Month-Year
Infr
ingem
ents
per
Month
Speeding Warning Letters Speeding Infringements
Moderate InjuriesModerate InjuriesModerate InjuriesModerate Injuries 5 2 ↓ 60%
Minor / Other InjuriesMinor / Other InjuriesMinor / Other InjuriesMinor / Other Injuries 19 8 ↓ 58%
¹ Ending 91 days before the start of the warning letter period, 3 June 2010² Ending 31 December 2017
5 years before
installation¹
Total Casualties:Total Casualties:Total Casualties:Total Casualties: 15 ↓ 48%29
Percentage
change
Fatal and Serious CrashesFatal and Serious CrashesFatal and Serious CrashesFatal and Serious Crashes 5 4 ↓ 20%
• Both cameras at the intersection of Windsor Road and Seven Hills Road commenced issuing warning letters in September 2010.
Annual NSW Speed Camera Performance Review 2018 - Appendix B: Red-light speed cameras B20

• There is one camera at this intersection.
Casualties and FSI Crashes
0
2
4
6
8
-5Y -4Y -3Y -2Y -1Y 1Y 2Y 3Y 4YNumber of years before and after camera installation
Casualti
es / C
rashes
Uncategorised M inor/Other M oderate Injury
Serious Injury Killed FSI Crash
7277 Belfield - Burwood Road at Punchbowl Road
• The infringement graphs show the number of warning letters and infringements issued at this intersection as well as the trend in infringements since the camera began operation. Roadworks and camera maintenance may influence the number of infringements issued.
Status: Insufficient data (<5 years) to reliably assess.
Casualties and casualty crashes at enforced intersection Infringements at enforced intersection
Red-Light Infringements
0
50
100
150
200
250
300
Oct-13
Jan-14
Apr-14
Jul-14
Oct-14
Jan-15
Apr-15
Jul-15
Oct-15
Jan-16
Apr-16
Jul-16
Oct-16
Jan-17
Apr-17
Jul-17
Oct-17
Month-Year
Infr
ingem
ents
per
Month
Red-light Warning Letters Red-light Infringements4 years and 70 days
after installation²
Casualty CrashesCasualty CrashesCasualty CrashesCasualty Crashes 16 13 ↓ 3%
Serious InjuriesSerious InjuriesSerious InjuriesSerious Injuries
FatalitiesFatalitiesFatalitiesFatalities
1 3 ↑ 258%
0 0 -
Pedestrian Casualties
Right Through Casualty Crashes
Adjacent Casualty Crashes
Rear End Casualty Crashes
7
4
6
0
3
2
0
6
↓ 49%
↓ 40%
↓ 100%
Increase
Speeding Infringements
0
5
10
15
20
25
30
35
40
45
Oct-13
Jan-14
Apr-14
Jul-14
Oct-14
Jan-15
Apr-15
Jul-15
Oct-15
Jan-16
Apr-16
Jul-16
Oct-16
Jan-17
Apr-17
Jul-17
Oct-17
Month-Year
Infr
ingem
ents
per
Month
Speeding Warning Letters Speeding Infringements
Moderate InjuriesModerate InjuriesModerate InjuriesModerate Injuries 16 6 ↓ 55%
Minor / Other InjuriesMinor / Other InjuriesMinor / Other InjuriesMinor / Other Injuries 10 6 ↓ 28%
¹ Ending 91 days before the start of the warning letter period, 23 July 2013² Ending 31 December 2017³ The percentage change is based on annualised crash data to allow for a direct comparison between the pre and post installation time periods. Red values indicate an increase.
5 years before
installation¹
Total Casualties:Total Casualties:Total Casualties:Total Casualties: 15 ↓ 34%27
Percentage
change³
Fatal and Serious CrashesFatal and Serious CrashesFatal and Serious CrashesFatal and Serious Crashes 1 3 ↑ 258%
• The camera at the intersection of Burwood Road and Punchbowl Road commenced issuing warning letters in October 2013.
Annual NSW Speed Camera Performance Review 2018 - Appendix B: Red-light speed cameras B21

• There is one camera at this intersection. This was previously a wet-film red-light camera location.
Casualties and FSI Crashes
0
1
2
3
4
5
6
7
-5Y -4Y -3Y -2Y -1Y 2012 2013 2014 2015 2016 2017Number of years before and year after camera installation
Casualti
es / C
rashes
Uncategorised M inor/Other M oderate Injury
Serious Injury Killed FSI Crash
7183 Bexley - Forest Road at Harrow Road
• The infringement graphs show the number of warning letters and infringements issued at this intersection as well as the trend in infringements since the camera began operation. Roadworks and camera maintenance may influence the number of infringements issued.
Status: Retain and Monitor. The previous wet-film red light camera may have influenced the before period data. Annual traffic counts have increased across NSW.
Casualties and casualty crashes at enforced intersection Infringements at enforced intersection
Red-Light Infringements
0
50
100
150
200
250
Jun-11
Dec-11
Jun-12
Dec-12
Jun-13
Dec-13
Jun-14
Dec-14
Jun-15
Dec-15
Jun-16
Dec-16
Jun-17
Dec-17
Month-Year
Infr
ingem
ents
per
Month
Red-light Warning Letters Red-light Infringements5 year
after period²
Casualty CrashesCasualty CrashesCasualty CrashesCasualty Crashes 17 15 ↓ 12%
Serious InjuriesSerious InjuriesSerious InjuriesSerious Injuries
FatalitiesFatalitiesFatalitiesFatalities
2 8 ↑ 300%
0 0 -
Pedestrian Casualties
Right Through Casualty Crashes
Adjacent Casualty Crashes
Rear End Casualty Crashes
1
4
1
7
2
3
0
8
↑ 100%
↓ 25%
↓ 100%
↑ 14%
Speeding Infringements
0
2
4
6
8
10
12
14
16
18
Jun-11
Dec-11
Jun-12
Dec-12
Jun-13
Dec-13
Jun-14
Dec-14
Jun-15
Dec-15
Jun-16
Dec-16
Jun-17
Dec-17
Month-Year
Infr
ingem
ents
per
Month
Speeding Warning Letters Speeding Infringements
Moderate InjuriesModerate InjuriesModerate InjuriesModerate Injuries 6 7 ↑ 17%
Minor / Other InjuriesMinor / Other InjuriesMinor / Other InjuriesMinor / Other Injuries 11 7 ↓ 36%
¹ Ending 91 days before the start of the warning letter period, 30 March 2011² Ending 31 December 2017
5 years before
installation¹
Total Casualties:Total Casualties:Total Casualties:Total Casualties: 22 ↑ 16%19
Percentage
change
Fatal and Serious CrashesFatal and Serious CrashesFatal and Serious CrashesFatal and Serious Crashes 2 5 ↑ 150%
• The camera at the intersection of Forest Road and Harrow Road commenced issuing warning letters in June 2011.
Annual NSW Speed Camera Performance Review 2018 - Appendix B: Red-light speed cameras B22

• There is one camera at this intersection. This was previously a wet-film red-light camera location.
Casualties and FSI Crashes
0
2
4
6
8
10
12
-5Y -4Y -3Y -2Y -1Y 1Y 2Y 3YNumber of years before and after camera installation
Casualti
es / C
rashes
Uncategorised M inor/Other M oderate Injury
Serious Injury Killed FSI Crash
7304 Bexley - Harrow Road at Watkin Street
• The infringement graphs show the number of warning letters and infringements issued at this intersection as well as the trend in infringements since the camera began operation. Roadworks and camera maintenance may influence the number of infringements issued.
Status: Insufficient data (<5 years) to reliably assess.
Casualties and casualty crashes at enforced intersection Infringements at enforced intersection
Red-Light Infringements
0
20
40
60
80
100
120
140
160
180
Jul-14
Oct-14
Jan-15
Apr-15
Jul-15
Oct-15
Jan-16
Apr-16
Jul-16
Oct-16
Jan-17
Apr-17
Jul-17
Oct-17
Month-Year
Infr
ingem
ents
per
Month
Red-light Warning Letters Red-light Infringements3 years and 159
days after installation²
Casualty CrashesCasualty CrashesCasualty CrashesCasualty Crashes 20 9 ↓ 35%
Serious InjuriesSerious InjuriesSerious InjuriesSerious Injuries
FatalitiesFatalitiesFatalitiesFatalities
5 3 ↓ 13%
0 0 -
Pedestrian Casualties
Right Through Casualty Crashes
Adjacent Casualty Crashes
Rear End Casualty Crashes
2
7
5
2
1
2
3
0
↓ 27%
↓ 58%
↓ 13%
↓ 100%
Speeding Infringements
0
5
10
15
20
25
30
Jul-14
Oct-14
Jan-15
Apr-15
Jul-15
Oct-15
Jan-16
Apr-16
Jul-16
Oct-16
Jan-17
Apr-17
Jul-17
Oct-17
Month-Year
Infr
ingem
ents
per
Month
Speeding Warning Letters Speeding Infringements
Moderate InjuriesModerate InjuriesModerate InjuriesModerate Injuries 13 6 ↓ 33%
Minor / Other InjuriesMinor / Other InjuriesMinor / Other InjuriesMinor / Other Injuries 9 7 ↑ 13%
¹ Ending 91 days before the start of the warning letter period, 25 April 2014² Ending 31 December 2017³ The percentage change is based on annualised crash data to allow for a direct comparison between the pre and post installation time periods. Red values indicate an increase.
5 years before
installation¹
Total Casualties:Total Casualties:Total Casualties:Total Casualties: 16 ↓ 14%27
Percentage
change³
Fatal and Serious CrashesFatal and Serious CrashesFatal and Serious CrashesFatal and Serious Crashes 5 2 ↓ 42%
• The camera at the intersection of Harrow Road and Watkin Street commenced issuing warning letters in July 2014.
Annual NSW Speed Camera Performance Review 2018 - Appendix B: Red-light speed cameras B23

• There is one camera at this intersection. This was previously a wet-film red-light camera location.
Casualties and FSI Crashes
0
2
4
6
8
10
12
14
-5Y -4Y -3Y -2Y -1Y 2011 2012 2013 2014 2015 2016 2017Number of years before and year after camera installation
Casualti
es / C
rashes
Uncategorised M inor/Other M oderate Injury
Serious Injury Killed FSI Crash
7160 Blacktown - Bungarribee Road at Balmoral Street
• The infringement graphs show the number of warning letters and infringements issued at this intersection as well as the trend in infringements since the camera began operation. Roadworks and camera maintenance may influence the number of infringements issued.
Status: Retain.
Casualties and casualty crashes at enforced intersection Infringements at enforced intersection
Red-Light Infringements
0
20
40
60
80
100
120
140
Sep-10
Mar-11
Sep-11
Mar-12
Sep-12
Mar-13
Sep-13
Mar-14
Sep-14
Mar-15
Sep-15
Mar-16
Sep-16
Mar-17
Sep-17
Month-Year
Infr
ingem
ents
per
Month
Red-light Warning Letters Red-light Infringements5 year
after period²
Casualty CrashesCasualty CrashesCasualty CrashesCasualty Crashes 19 13 ↓ 32%
Serious InjuriesSerious InjuriesSerious InjuriesSerious Injuries
FatalitiesFatalitiesFatalitiesFatalities
4 6 ↑ 50%
0 0 -
Pedestrian Casualties
Right Through Casualty Crashes
Adjacent Casualty Crashes
Rear End Casualty Crashes
0
6
6
5
0
3
0
9
-
↓ 50%
↓ 100%
↑ 80%
Speeding Infringements
0
5
10
15
20
25
30
35
40
45
50
Sep-10
Mar-11
Sep-11
Mar-12
Sep-12
Mar-13
Sep-13
Mar-14
Sep-14
Mar-15
Sep-15
Mar-16
Sep-16
Mar-17
Sep-17
Month-Year
Infr
ingem
ents
per
Month
Speeding Warning Letters Speeding Infringements
Moderate InjuriesModerate InjuriesModerate InjuriesModerate Injuries 12 2 ↓ 83%
Minor / Other InjuriesMinor / Other InjuriesMinor / Other InjuriesMinor / Other Injuries 10 9 ↓ 10%
¹ Ending 91 days before the start of the warning letter period, 14 June 2010² Ending 31 December 2017
5 years before
installation¹
Total Casualties:Total Casualties:Total Casualties:Total Casualties: 17 ↓ 35%26
Percentage
change
Fatal and Serious CrashesFatal and Serious CrashesFatal and Serious CrashesFatal and Serious Crashes 4 4 ↓ 0%
• The camera at the intersection of Bungarribee Road and Balmoral Street commenced issuing warning letters in September 2010.
Annual NSW Speed Camera Performance Review 2018 - Appendix B: Red-light speed cameras B24

• There is one camera at this intersection. This was previously a wet-film red-light camera location.
Casualties and FSI Crashes
0
5
10
15
-5Y -4Y -3Y -2Y -1Y 2011 2012 2013 2014 2015 2016 2017Number of years before and year after camera installation
Casualti
es / C
rashes
Uncategorised M inor/Other M oderate Injury
Serious Injury Killed FSI Crash
7168 Blacktown - Great Western Highway at Reservoir Road
• The infringement graphs show the number of warning letters and infringements issued at this intersection as well as the trend in infringements since the camera began operation. Roadworks and camera maintenance may influence the number of infringements issued.
Status: Retain.
Casualties and casualty crashes at enforced intersection Infringements at enforced intersection
Red-Light Infringements
0
5
10
15
20
25
Dec-10
Jun-11
Dec-11
Jun-12
Dec-12
Jun-13
Dec-13
Jun-14
Dec-14
Jun-15
Dec-15
Jun-16
Dec-16
Jun-17
Dec-17
Month-Year
Infr
ingem
ents
per
Month
Red-light Warning Letters Red-light Infringements5 year
after period²
Casualty CrashesCasualty CrashesCasualty CrashesCasualty Crashes 19 9 ↓ 53%
Serious InjuriesSerious InjuriesSerious InjuriesSerious Injuries
FatalitiesFatalitiesFatalitiesFatalities
9 2 ↓ 78%
0 0 -
Pedestrian Casualties
Right Through Casualty Crashes
Adjacent Casualty Crashes
Rear End Casualty Crashes
0
5
3
6
0
0
0
4
-
↓ 100%
↓ 100%
↓ 33%
Speeding Infringements
0
10
20
30
40
50
60
70
80
Dec-10
Jun-11
Dec-11
Jun-12
Dec-12
Jun-13
Dec-13
Jun-14
Dec-14
Jun-15
Dec-15
Jun-16
Dec-16
Jun-17
Dec-17
Month-Year
Infr
ingem
ents
per
Month
Speeding Warning Letters Speeding Infringements
Moderate InjuriesModerate InjuriesModerate InjuriesModerate Injuries 12 2 ↓ 83%
Minor / Other InjuriesMinor / Other InjuriesMinor / Other InjuriesMinor / Other Injuries 9 5 ↓ 44%
¹ Ending 348 days before the start of the warning letter period, 1 January 2010² Ending 31 December 2017
5 years before
installation¹
Total Casualties:Total Casualties:Total Casualties:Total Casualties: 9 ↓ 70%30
Percentage
change
Fatal and Serious CrashesFatal and Serious CrashesFatal and Serious CrashesFatal and Serious Crashes 6 2 ↓ 67%
• The camera at the intersection of Great Western Highway and Reservoir Road commenced issuing warning letters in December 2010.
Annual NSW Speed Camera Performance Review 2018 - Appendix B: Red-light speed cameras B25

• There is one camera at this intersection. This was previously a wet-film red-light camera location.
Casualties and FSI Crashes
0
1
2
3
4
5
-5Y -4Y -3Y -2Y -1Y 2011 2012 2013 2014 2015 2016 2017Number of years before and year after camera installation
Casualti
es / C
rashes
Uncategorised M inor/Other M oderate Injury
Serious Injury Killed FSI Crash
7196 Blacktown - Lancaster Street at Kildare Street (school zone)
• The infringement graphs show the number of warning letters and infringements issued at this intersection as well as the trend in infringements since the camera began operation. Roadworks and camera maintenance may influence the number of infringements issued.
Status: Retain.
Casualties and casualty crashes at enforced intersection Infringements at enforced intersection
Red-Light Infringements
0
10
20
30
40
50
60
70
Nov-10
May-11
Nov-11
May-12
Nov-12
May-13
Nov-13
May-14
Nov-14
May-15
Nov-15
May-16
Nov-16
May-17
Nov-17
Month-Year
Infr
ingem
ents
per
Month
Red-light Warning Letters Red-light Infringements5 year
after period²
Casualty CrashesCasualty CrashesCasualty CrashesCasualty Crashes 12 4 ↓ 67%
Serious InjuriesSerious InjuriesSerious InjuriesSerious Injuries
FatalitiesFatalitiesFatalitiesFatalities
1 1 ↓ 0%
0 0 -
Pedestrian Casualties
Right Through Casualty Crashes
Adjacent Casualty Crashes
Rear End Casualty Crashes
2
2
3
3
0
1
1
1
↓ 100%
↓ 50%
↓ 67%
↓ 67%
Speeding Infringements
0
5
10
15
20
25
30
35
Nov-10
May-11
Nov-11
May-12
Nov-12
May-13
Nov-13
May-14
Nov-14
May-15
Nov-15
May-16
Nov-16
May-17
Nov-17
Month-Year
Infr
ingem
ents
per
Month
Speeding Warning Letters Speeding Infringements
Moderate InjuriesModerate InjuriesModerate InjuriesModerate Injuries 6 1 ↓ 83%
Minor / Other InjuriesMinor / Other InjuriesMinor / Other InjuriesMinor / Other Injuries 9 4 ↓ 56%
¹ Ending 91 days before the start of the warning letter period, 12 August 2010² Ending 31 December 2017
5 years before
installation¹
Total Casualties:Total Casualties:Total Casualties:Total Casualties: 6 ↓ 63%16
Percentage
change
Fatal and Serious CrashesFatal and Serious CrashesFatal and Serious CrashesFatal and Serious Crashes 1 1 ↓ 0%
• The camera at the intersection of Lancaster Street and Kildare Road commenced issuing warning letters in November 2010.
Annual NSW Speed Camera Performance Review 2018 - Appendix B: Red-light speed cameras B26

• There is one camera at this intersection. This was previously a wet-film red-light camera location.
Casualties and FSI Crashes
0
1
2
3
4
5
6
7
-5Y -4Y -3Y -2Y -1Y 2011 2012 2013 2014 2015 2016 2017Number of years before and year after camera installation
Casualti
es / C
rashes
Uncategorised M inor/Other M oderate Injury
Serious Injury Killed FSI Crash
7170 Blacktown - Newton Road at Flushcombe Road (school zone)
• The infringement graphs show the number of warning letters and infringements issued at this intersection as well as the trend in infringements since the camera began operation. Roadworks and camera maintenance may influence the number of infringements issued.
Status: Retain.
Casualties and casualty crashes at enforced intersection Infringements at enforced intersection
Red-Light Infringements
0
10
20
30
40
50
60
70
80
90
100
Oct-10
Apr-11
Oct-11
Apr-12
Oct-12
Apr-13
Oct-13
Apr-14
Oct-14
Apr-15
Oct-15
Apr-16
Oct-16
Apr-17
Oct-17
Month-Year
Infr
ingem
ents
per
Month
Red-light Warning Letters Red-light Infringements5 year
after period²
Casualty CrashesCasualty CrashesCasualty CrashesCasualty Crashes 12 7 ↓ 42%
Serious InjuriesSerious InjuriesSerious InjuriesSerious Injuries
FatalitiesFatalitiesFatalitiesFatalities
2 2 ↓ 0%
0 0 -
Pedestrian Casualties
Right Through Casualty Crashes
Adjacent Casualty Crashes
Rear End Casualty Crashes
1
7
2
2
0
2
2
0
↓ 100%
↓ 71%
↓ 0%
↓ 100%
Speeding Infringements
0
50
100
150
200
250
300
Oct-10
Apr-11
Oct-11
Apr-12
Oct-12
Apr-13
Oct-13
Apr-14
Oct-14
Apr-15
Oct-15
Apr-16
Oct-16
Apr-17
Oct-17
Month-Year
Infr
ingem
ents
per
Month
Speeding Warning Letters Speeding Infringements
Moderate InjuriesModerate InjuriesModerate InjuriesModerate Injuries 3 0 ↓ 100%
Minor / Other InjuriesMinor / Other InjuriesMinor / Other InjuriesMinor / Other Injuries 9 8 ↓ 11%
¹ Ending 91 days before the start of the warning letter period, 8 July 2010² Ending 31 December 2017
5 years before
installation¹
Total Casualties:Total Casualties:Total Casualties:Total Casualties: 10 ↓ 29%14
Percentage
change
Fatal and Serious CrashesFatal and Serious CrashesFatal and Serious CrashesFatal and Serious Crashes 2 2 ↓ 0%
• The camera at the intersection of Newton Road and Flushcombe Road commenced issuing warning letters in October 2010.
Annual NSW Speed Camera Performance Review 2018 - Appendix B: Red-light speed cameras B27

• There is one camera at this intersection.
Casualties and FSI Crashes
0
2
4
6
8
-5Y -4Y -3Y -2Y -1Y 1Y 2YNumber of years before and after camera installation
Casualti
es / C
rashes
Uncategorised M inor/Other M oderate Injury
Serious Injury Killed FSI Crash
7327 Blacktown - Richmond Road at Third Avenue
• The infringement graphs show the number of warning letters and infringements issued at this intersection as well as the trend in infringements since the camera began operation. Roadworks and camera maintenance may influence the number of infringements issued.
Status: Insufficient data (<5 years) to reliably assess.
Casualties and casualty crashes at enforced intersection Infringements at enforced intersection
Red-Light Infringements
0
10
20
30
40
50
60
70
80
90
100
Jul-15
Sep-15
Nov-15
Jan-16
Mar-16
May-16
Jul-16
Sep-16
Nov-16
Jan-17
Mar-17
May-17
Jul-17
Sep-17
Nov-17
Month-Year
Infr
ingem
ents
per
Month
Red-light Warning Letters Red-light Infringements2 years and 157
days after installation²
Casualty CrashesCasualty CrashesCasualty CrashesCasualty Crashes 15 3 ↓ 59%
Serious InjuriesSerious InjuriesSerious InjuriesSerious Injuries
FatalitiesFatalitiesFatalitiesFatalities
11 1 ↓ 81%
0 0 -
Pedestrian Casualties
Right Through Casualty Crashes
Adjacent Casualty Crashes
Rear End Casualty Crashes
8
3
2
2
0
1
0
1
↓ 100%
↓ 31%
↓ 100%
↑ 3%
Speeding Infringements
0
10
20
30
40
50
60
Jul-15
Sep-15
Nov-15
Jan-16
Mar-16
May-16
Jul-16
Sep-16
Nov-16
Jan-17
Mar-17
May-17
Jul-17
Sep-17
Nov-17
Month-Year
Infr
ingem
ents
per
Month
Speeding Warning Letters Speeding Infringements
Moderate InjuriesModerate InjuriesModerate InjuriesModerate Injuries 2 0 ↓ 100%
Minor / Other InjuriesMinor / Other InjuriesMinor / Other InjuriesMinor / Other Injuries 5 2 ↓ 18%
¹ Ending 91 days before the start of the warning letter period, 28 April 2015² Ending 31 December 2017³ The percentage change is based on annualised crash data to allow for a direct comparison between the pre and post installation time periods. Red values indicate an increase.
5 years before
installation¹
Total Casualties:Total Casualties:Total Casualties:Total Casualties: 3 ↓ 66%18
Percentage
change³
Fatal and Serious CrashesFatal and Serious CrashesFatal and Serious CrashesFatal and Serious Crashes 10 1 ↓ 79%
• The camera at the intersection of Third Avenue and Richmond Road commenced issuing warning letters in July 2015.
Annual NSW Speed Camera Performance Review 2018 - Appendix B: Red-light speed cameras B28

• There is one camera at this intersection. This was previously a wet-film red-light camera location.
Casualties and FSI Crashes
0
1
2
3
4
5
6
-5Y -4Y -3Y -2Y -1Y 2011 2012 2013 2014 2015 2016 2017Number of years before and year after camera installation
Casualti
es / C
rashes
Uncategorised M inor/Other M oderate Injury
Serious Injury Killed FSI Crash
7193 Blacktown - Sunnyholt Road at Main Street
• The infringement graphs show the number of warning letters and infringements issued at this intersection as well as the trend in infringements since the camera began operation. Roadworks and camera maintenance may influence the number of infringements issued.
Status: Retain.
Casualties and casualty crashes at enforced intersection Infringements at enforced intersection
Red-Light Infringements
0
50
100
150
200
250
300
Nov-10
May-11
Nov-11
May-12
Nov-12
May-13
Nov-13
May-14
Nov-14
May-15
Nov-15
May-16
Nov-16
May-17
Nov-17
Month-Year
Infr
ingem
ents
per
Month
Red-light Warning Letters Red-light Infringements5 year
after period²
Casualty CrashesCasualty CrashesCasualty CrashesCasualty Crashes 16 4 ↓ 75%
Serious InjuriesSerious InjuriesSerious InjuriesSerious Injuries
FatalitiesFatalitiesFatalitiesFatalities
7 2 ↓ 71%
0 0 -
Pedestrian Casualties
Right Through Casualty Crashes
Adjacent Casualty Crashes
Rear End Casualty Crashes
8
1
2
2
0
1
0
2
↓ 100%
↓ 0%
↓ 100%
↓ 0%
Speeding Infringements
0
5
10
15
20
25
Nov-10
May-11
Nov-11
May-12
Nov-12
May-13
Nov-13
May-14
Nov-14
May-15
Nov-15
May-16
Nov-16
May-17
Nov-17
Month-Year
Infr
ingem
ents
per
Month
Speeding Warning Letters Speeding Infringements
Moderate InjuriesModerate InjuriesModerate InjuriesModerate Injuries 8 0 ↓ 100%
Minor / Other InjuriesMinor / Other InjuriesMinor / Other InjuriesMinor / Other Injuries 2 3 ↑ 50%
¹ Ending 91 days before the start of the warning letter period, 12 August 2010² Ending 31 December 2017
5 years before
installation¹
Total Casualties:Total Casualties:Total Casualties:Total Casualties: 5 ↓ 71%17
Percentage
change
Fatal and Serious CrashesFatal and Serious CrashesFatal and Serious CrashesFatal and Serious Crashes 7 2 ↓ 71%
• The camera at the intersection of Sunnyholt Road and Main Street commenced issuing warning letters in November 2010.
Annual NSW Speed Camera Performance Review 2018 - Appendix B: Red-light speed cameras B29

• There is one camera at this intersection.
Casualties and FSI Crashes
0
2
4
6
8
10
12
-5Y -4Y -3Y -2Y -1Y 1Y 2Y 3YNumber of years before and after camera installation
Casualti
es / C
rashes
Uncategorised M inor/Other M oderate Injury
Serious Injury Killed FSI Crash
7310 Blacktown - Third Avenue at Prince Street
• The infringement graphs show the number of warning letters and infringements issued at this intersection as well as the trend in infringements since the camera began operation. Roadworks and camera maintenance may influence the number of infringements issued.
Status: Insufficient data (<5 years) to reliably assess.
Casualties and casualty crashes at enforced intersection Infringements at enforced intersection
Red-Light Infringements
0
20
40
60
80
100
120
Jul-14
Oct-14
Jan-15
Apr-15
Jul-15
Oct-15
Jan-16
Apr-16
Jul-16
Oct-16
Jan-17
Apr-17
Jul-17
Oct-17
Month-Year
Infr
ingem
ents
per
Month
Red-light Warning Letters Red-light Infringements3 years and 159
days after installation²
Casualty CrashesCasualty CrashesCasualty CrashesCasualty Crashes 25 6 ↓ 65%
Serious InjuriesSerious InjuriesSerious InjuriesSerious Injuries
FatalitiesFatalitiesFatalitiesFatalities
13 5 ↓ 44%
0 0 -
Pedestrian Casualties
Right Through Casualty Crashes
Adjacent Casualty Crashes
Rear End Casualty Crashes
9
9
3
4
0
2
1
0
↓ 100%
↓ 68%
↓ 52%
↓ 100%
Speeding Infringements
0
50
100
150
200
250
300
350
400
450
Jul-14
Oct-14
Jan-15
Apr-15
Jul-15
Oct-15
Jan-16
Apr-16
Jul-16
Oct-16
Jan-17
Apr-17
Jul-17
Oct-17
Month-Year
Infr
ingem
ents
per
Month
Speeding Warning Letters Speeding Infringements
Moderate InjuriesModerate InjuriesModerate InjuriesModerate Injuries 9 2 ↓ 68%
Minor / Other InjuriesMinor / Other InjuriesMinor / Other InjuriesMinor / Other Injuries 12 3 ↓ 64%
¹ Ending 91 days before the start of the warning letter period, 25 April 2014² Ending 31 December 2017³ The percentage change is based on annualised crash data to allow for a direct comparison between the pre and post installation time periods. Red values indicate an increase.
5 years before
installation¹
Total Casualties:Total Casualties:Total Casualties:Total Casualties: 10 ↓ 57%34
Percentage
change³
Fatal and Serious CrashesFatal and Serious CrashesFatal and Serious CrashesFatal and Serious Crashes 13 5 ↓ 44%
• The camera at the intersection of Third Avenue and Prince Street commenced issuing warning letters in July 2014.
Annual NSW Speed Camera Performance Review 2018 - Appendix B: Red-light speed cameras B30

• There is one camera at this intersection.
Casualties and FSI Crashes
0
2
4
6
8
-5Y -4Y -3Y -2Y -1Y 1Y 2YNumber of years before and after camera installation
Casualti
es / C
rashes
Uncategorised M inor/Other M oderate Injury
Serious Injury Killed FSI Crash
7313 Blakehurst - King Georges Road at Terry Streeet
• The infringement graphs show the number of warning letters and infringements issued at this intersection as well as the trend in infringements since the camera began operation. Roadworks and camera maintenance may influence the number of infringements issued.
Status: Insufficient data (<5 years) to reliably assess.
Casualties and casualty crashes at enforced intersection Infringements at enforced intersection
Red-Light Infringements
0
5
10
15
20
25
30
35
40
45
50
Aug-15
Oct-15
Dec-15
Feb-16
Apr-16
Jun-16
Aug-16
Oct-16
Dec-16
Feb-17
Apr-17
Jun-17
Aug-17
Oct-17
Dec-17
Month-Year
Infr
ingem
ents
per
Month
Red-light Warning Letters Red-light Infringements2 years and 127
days after installation²
Casualty CrashesCasualty CrashesCasualty CrashesCasualty Crashes 12 3 ↓ 47%
Serious InjuriesSerious InjuriesSerious InjuriesSerious Injuries
FatalitiesFatalitiesFatalitiesFatalities
4 1 ↓ 47%
0 0 -
Pedestrian Casualties
Right Through Casualty Crashes
Adjacent Casualty Crashes
Rear End Casualty Crashes
3
7
0
2
0
2
1
0
↓ 100%
↓ 39%
Increase
↓ 100%
Speeding Infringements
0
20
40
60
80
100
120
Aug-15
Oct-15
Dec-15
Feb-16
Apr-16
Jun-16
Aug-16
Oct-16
Dec-16
Feb-17
Apr-17
Jun-17
Aug-17
Oct-17
Dec-17
Month-Year
Infr
ingem
ents
per
Month
Speeding Warning Letters Speeding Infringements
Moderate InjuriesModerate InjuriesModerate InjuriesModerate Injuries 13 3 ↓ 51%
Minor / Other InjuriesMinor / Other InjuriesMinor / Other InjuriesMinor / Other Injuries 2 0 ↓ 100%
¹ Ending 91 days before the start of the warning letter period, 28 May 2015² Ending 31 December 2017³ The percentage change is based on annualised crash data to allow for a direct comparison between the pre and post installation time periods. Red values indicate an increase.
5 years before
installation¹
Total Casualties:Total Casualties:Total Casualties:Total Casualties: 4 ↓ 55%19
Percentage
change³
Fatal and Serious CrashesFatal and Serious CrashesFatal and Serious CrashesFatal and Serious Crashes 3 1 ↓ 29%
• The camera at the intersection of King Georges Road and Terry Street commenced issuing warning letters in August 2015.
Annual NSW Speed Camera Performance Review 2018 - Appendix B: Red-light speed cameras B31

• There is one camera at this intersection. This was previously a wet-film red-light camera location.
Casualties and FSI Crashes
0
1
2
3
4
5
6
7
-5Y -4Y -3Y -2Y -1Y 2012 2013 2014 2015 2016 2017Number of years before and year after camera installation
Casualti
es / C
rashes
Uncategorised M inor/Other M oderate Injury
Serious Injury Killed FSI Crash
7192 Bondi Junction - Old South Head Road at Bondi Road
• The infringement graphs show the number of warning letters and infringements issued at this intersection as well as the trend in infringements since the camera began operation. Roadworks and camera maintenance may influence the number of infringements issued.
Status: Retain.
Casualties and casualty crashes at enforced intersection Infringements at enforced intersection
Red-Light Infringements
0
100
200
300
400
500
600
700
800
900
Jun-11
Dec-11
Jun-12
Dec-12
Jun-13
Dec-13
Jun-14
Dec-14
Jun-15
Dec-15
Jun-16
Dec-16
Jun-17
Dec-17
Month-Year
Infr
ingem
ents
per
Month
Red-light Warning Letters Red-light Infringements5 year
after period²
Casualty CrashesCasualty CrashesCasualty CrashesCasualty Crashes 12 5 ↓ 58%
Serious InjuriesSerious InjuriesSerious InjuriesSerious Injuries
FatalitiesFatalitiesFatalitiesFatalities
8 0 ↓ 100%
0 0 -
Pedestrian Casualties
Right Through Casualty Crashes
Adjacent Casualty Crashes
Rear End Casualty Crashes
2
0
6
0
0
0
0
3
↓ 100%
-
↓ 100%
Increase
Speeding Infringements
0
5
10
15
20
25
30
Jun-11
Dec-11
Jun-12
Dec-12
Jun-13
Dec-13
Jun-14
Dec-14
Jun-15
Dec-15
Jun-16
Dec-16
Jun-17
Dec-17
Month-Year
Infr
ingem
ents
per
Month
Speeding Warning Letters Speeding Infringements
Moderate InjuriesModerate InjuriesModerate InjuriesModerate Injuries 0 2 Increase
Minor / Other InjuriesMinor / Other InjuriesMinor / Other InjuriesMinor / Other Injuries 6 3 ↓ 50%
¹ Ending 91 days before the start of the warning letter period, 28 March 2011² Ending 31 December 2017
5 years before
installation¹
Total Casualties:Total Casualties:Total Casualties:Total Casualties: 5 ↓ 64%14
Percentage
change
Fatal and Serious CrashesFatal and Serious CrashesFatal and Serious CrashesFatal and Serious Crashes 8 0 ↓ 100%
• The camera at the intersection of Old South Head Road and Bondi Road commenced issuing warning letters in June 2011.
Annual NSW Speed Camera Performance Review 2018 - Appendix B: Red-light speed cameras B32

• There is one camera at this intersection.
Casualties and FSI Crashes
0
2
4
6
8
-5Y -4Y -3Y -2Y -1Y 1Y 2Y 3Y 4YNumber of years before and after camera installation
Casualti
es / C
rashes
Uncategorised M inor/Other M oderate Injury
Serious Injury Killed FSI Crash
7276 Bradbury - Moore Oxley Bypass at The Parkway
• The infringement graphs show the number of warning letters and infringements issued at this intersection as well as the trend in infringements since the camera began operation. Roadworks and camera maintenance may influence the number of infringements issued.
Status: Insufficient data (<5 years) to reliably assess.
Casualties and casualty crashes at enforced intersection Infringements at enforced intersection
Red-Light Infringements
0
100
200
300
400
500
600
Oct-13
Jan-14
Apr-14
Jul-14
Oct-14
Jan-15
Apr-15
Jul-15
Oct-15
Jan-16
Apr-16
Jul-16
Oct-16
Jan-17
Apr-17
Jul-17
Oct-17
Month-Year
Infr
ingem
ents
per
Month
Red-light Warning Letters Red-light Infringements4 years and 74 days
after installation²
Casualty CrashesCasualty CrashesCasualty CrashesCasualty Crashes 7 10 ↑ 70%
Serious InjuriesSerious InjuriesSerious InjuriesSerious Injuries
FatalitiesFatalitiesFatalitiesFatalities
2 2 ↑ 19%
0 0 -
Pedestrian Casualties
Right Through Casualty Crashes
Adjacent Casualty Crashes
Rear End Casualty Crashes
0
4
1
1
0
5
0
3
-
↑ 49%
↓ 100%
↑ 257%
Speeding Infringements
0
100
200
300
400
500
600
700
800
Oct-13
Jan-14
Apr-14
Jul-14
Oct-14
Jan-15
Apr-15
Jul-15
Oct-15
Jan-16
Apr-16
Jul-16
Oct-16
Jan-17
Apr-17
Jul-17
Oct-17
Month-Year
Infr
ingem
ents
per
Month
Speeding Warning Letters Speeding Infringements
Moderate InjuriesModerate InjuriesModerate InjuriesModerate Injuries 4 7 ↑ 108%
Minor / Other InjuriesMinor / Other InjuriesMinor / Other InjuriesMinor / Other Injuries 3 6 ↑ 138%
¹ Ending 91 days before the start of the warning letter period, 19 July 2013² Ending 31 December 2017³ The percentage change is based on annualised crash data to allow for a direct comparison between the pre and post installation time periods. Red values indicate an increase.
5 years before
installation¹
Total Casualties:Total Casualties:Total Casualties:Total Casualties: 15 ↑ 98%9
Percentage
change³
Fatal and Serious CrashesFatal and Serious CrashesFatal and Serious CrashesFatal and Serious Crashes 2 2 ↑ 19%
• The camera at the intersection of Moore Oxley Bypass and The Parkway commenced issuing warning letters in October 2013.
Annual NSW Speed Camera Performance Review 2018 - Appendix B: Red-light speed cameras B33

• There is one camera at this intersection.
Casualties and FSI Crashes
0
2
4
6
8
10
12
-5Y -4Y -3Y -2Y -1Y 1Y 2YNumber of years before and after camera installation
Casualti
es / C
rashes
Uncategorised M inor/Other M oderate Injury
Serious Injury Killed FSI Crash
7293 Burwood - Railway Parade at Burwood Road
• The infringement graphs show the number of warning letters and infringements issued at this intersection as well as the trend in infringements since the camera began operation. Roadworks and camera maintenance may influence the number of infringements issued.
Status: Insufficient data (<5 years) to reliably assess.
Casualties and casualty crashes at enforced intersection Infringements at enforced intersection
Red-Light Infringements
0
10
20
30
40
50
60
Aug-15
Oct-15
Dec-15
Feb-16
Apr-16
Jun-16
Aug-16
Oct-16
Dec-16
Feb-17
Apr-17
Jun-17
Aug-17
Oct-17
Dec-17
Month-Year
Infr
ingem
ents
per
Month
Red-light Warning Letters Red-light Infringements2 years and 127
days after installation²
Casualty CrashesCasualty CrashesCasualty CrashesCasualty Crashes 28 3 ↓ 77%
Serious InjuriesSerious InjuriesSerious InjuriesSerious Injuries
FatalitiesFatalitiesFatalitiesFatalities
5 0 ↓ 100%
0 0 -
Pedestrian Casualties
Right Through Casualty Crashes
Adjacent Casualty Crashes
Rear End Casualty Crashes
15
4
2
3
2
1
0
0
↓ 72%
↓ 47%
↓ 100%
↓ 100%
Speeding Infringements
0
20
40
60
80
100
120
Aug-15
Oct-15
Dec-15
Feb-16
Apr-16
Jun-16
Aug-16
Oct-16
Dec-16
Feb-17
Apr-17
Jun-17
Aug-17
Oct-17
Dec-17
Month-Year
Infr
ingem
ents
per
Month
Speeding Warning Letters Speeding Infringements
Moderate InjuriesModerate InjuriesModerate InjuriesModerate Injuries 14 3 ↓ 54%
Minor / Other InjuriesMinor / Other InjuriesMinor / Other InjuriesMinor / Other Injuries 13 1 ↓ 84%
¹ Ending 91 days before the start of the warning letter period, 28 May 2015² Ending 31 December 2017³ The percentage change is based on annualised crash data to allow for a direct comparison between the pre and post installation time periods. Red values indicate an increase.
5 years before
installation¹
Total Casualties:Total Casualties:Total Casualties:Total Casualties: 4 ↓ 73%32
Percentage
change³
Fatal and Serious CrashesFatal and Serious CrashesFatal and Serious CrashesFatal and Serious Crashes 5 0 ↓ 100%
• The camera at the intersection of Railway Parade and Burwood Road commenced issuing warning letters in August 2015.
Annual NSW Speed Camera Performance Review 2018 - Appendix B: Red-light speed cameras B34

• There are two cameras at this intersection.
Casualties and FSI Crashes
0
2
4
6
8
10
-5Y -4Y -3Y -2Y -1Y 2011 2012 2013 2014 2015 2016 2017Number of years before and year after camera installation
Casualti
es / C
rashes
Uncategorised M inor/Other M oderate Injury
Serious Injury Killed FSI Crash
7129|7130 Burwood / Concord - Parramatta Road at Burwood Road
• The infringement graphs show the number of warning letters and infringements issued at this intersection as well as the trend in infringements since the camera began operation. Roadworks and camera maintenance may influence the number of infringements issued.
Status: Retain.
Casualties and casualty crashes at enforced intersection Infringements at enforced intersection
Red-Light Infringements
0
50
100
150
200
250
300
350
400
450
Sep-10
Mar-11
Sep-11
Mar-12
Sep-12
Mar-13
Sep-13
Mar-14
Sep-14
Mar-15
Sep-15
Mar-16
Sep-16
Mar-17
Sep-17
Month-Year
Infr
ingem
ents
per
Month
Red-light Warning Letters Red-light Infringements5 year
after period²
Casualty CrashesCasualty CrashesCasualty CrashesCasualty Crashes 15 18 ↑ 20%
Serious InjuriesSerious InjuriesSerious InjuriesSerious Injuries
FatalitiesFatalitiesFatalitiesFatalities
5 4 ↓ 20%
0 0 -
Pedestrian Casualties
Right Through Casualty Crashes
Adjacent Casualty Crashes
Rear End Casualty Crashes
3
0
5
5
4
1
2
8
↑ 33%
Increase
↓ 60%
↑ 60%
Speeding Infringements
0
200
400
600
800
1000
1200
1400
1600
1800
2000
Sep-10
Mar-11
Sep-11
Mar-12
Sep-12
Mar-13
Sep-13
Mar-14
Sep-14
Mar-15
Sep-15
Mar-16
Sep-16
Mar-17
Sep-17
Month-Year
Infr
ingem
ents
per
Month
Speeding Warning Letters Speeding Infringements
Moderate InjuriesModerate InjuriesModerate InjuriesModerate Injuries 8 8 ↓ 0%
Minor / Other InjuriesMinor / Other InjuriesMinor / Other InjuriesMinor / Other Injuries 8 13 ↑ 63%
¹ Ending 91 days before the start of the warning letter period, 7 June 2010² Ending 31 December 2017
5 years before
installation¹
Total Casualties:Total Casualties:Total Casualties:Total Casualties: 25 ↑ 19%21
Percentage
change
Fatal and Serious CrashesFatal and Serious CrashesFatal and Serious CrashesFatal and Serious Crashes 4 4 ↓ 0%
• Both cameras at the intersection of Parramatta Road and Burwood Road commenced issuing warning letters in September 2010.
Annual NSW Speed Camera Performance Review 2018 - Appendix B: Red-light speed cameras B35

• There are two cameras at this intersection. This was previously a wet-film red-light camera location.
Casualties and FSI Crashes
0
2
4
6
8
10
12
14
-5Y -4Y -3Y -2Y -1Y 2011 2012 2013 2014 2015 2016 2017Number of years before and year after camera installation
Casualti
es / C
rashes
Uncategorised M inor/Other M oderate Injury
Serious Injury Killed FSI Crash
7108|7109 Cabramatta - Cumberland Highway at Cabramatta Road West
• The infringement graphs show the number of warning letters and infringements issued at this intersection as well as the trend in infringements since the camera began operation. Roadworks and camera maintenance may influence the number of infringements issued.
Status: Retain.
Casualties and casualty crashes at enforced intersection Infringements at enforced intersection
Red-Light Infringements
0
50
100
150
200
250
300
350
400
Jun-10
Dec-10
Jun-11
Dec-11
Jun-12
Dec-12
Jun-13
Dec-13
Jun-14
Dec-14
Jun-15
Dec-15
Jun-16
Dec-16
Jun-17
Dec-17
Month-Year
Infr
ingem
ents
per
Month
Red-light Warning Letters Red-light Infringements5 year
after period²
Casualty CrashesCasualty CrashesCasualty CrashesCasualty Crashes 31 29 ↓ 6%
Serious InjuriesSerious InjuriesSerious InjuriesSerious Injuries
FatalitiesFatalitiesFatalitiesFatalities
9 4 ↓ 56%
0 0 -
Pedestrian Casualties
Right Through Casualty Crashes
Adjacent Casualty Crashes
Rear End Casualty Crashes
2
12
3
8
0
10
1
13
↓ 100%
↓ 17%
↓ 67%
↑ 63%
Speeding Infringements
0
50
100
150
200
250
300
350
400
Jun-10
Dec-10
Jun-11
Dec-11
Jun-12
Dec-12
Jun-13
Dec-13
Jun-14
Dec-14
Jun-15
Dec-15
Jun-16
Dec-16
Jun-17
Dec-17
Month-Year
Infr
ingem
ents
per
Month
Speeding Warning Letters Speeding Infringements
Moderate InjuriesModerate InjuriesModerate InjuriesModerate Injuries 12 16 ↑ 33%
Minor / Other InjuriesMinor / Other InjuriesMinor / Other InjuriesMinor / Other Injuries 15 18 ↑ 20%
¹ Ending 91 days before the start of the warning letter period, 25 March 2010² Ending 31 December 2017
5 years before
installation¹
Total Casualties:Total Casualties:Total Casualties:Total Casualties: 38 ↑ 6%36
Percentage
change
Fatal and Serious CrashesFatal and Serious CrashesFatal and Serious CrashesFatal and Serious Crashes 9 4 ↓ 56%
• Both cameras at the intersection of Cumberland Highway and Cabramatta Road West commenced issuing warning letters in June 2010.
Annual NSW Speed Camera Performance Review 2018 - Appendix B: Red-light speed cameras B36

• There is one camera at this intersection. This was previously a wet-film red-light camera location.
Casualties and FSI Crashes
0
2
4
6
8
10
12
14
-5Y -4Y -3Y -2Y -1Y 2010 2011 2012 2013 2014 2015 2016 2017Number of years before and year after camera installation
Casualti
es / C
rashes
Uncategorised M inor/Other M oderate Injury
Serious Injury Killed FSI Crash
7159 Cabramatta - Cumberland Highway at St Johns Road
• The infringement graphs show the number of warning letters and infringements issued at this intersection as well as the trend in infringements since the camera began operation. Roadworks and camera maintenance may influence the number of infringements issued.
Status: Retain.
Casualties and casualty crashes at enforced intersection Infringements at enforced intersection
Red-Light Infringements
0
50
100
150
200
250
300
Dec-09
Jun-10
Dec-10
Jun-11
Dec-11
Jun-12
Dec-12
Jun-13
Dec-13
Jun-14
Dec-14
Jun-15
Dec-15
Jun-16
Dec-16
Jun-17
Dec-17
Month-Year
Infr
ingem
ents
per
Month
Red-light Warning Letters Red-light Infringements5 year
after period²
Casualty CrashesCasualty CrashesCasualty CrashesCasualty Crashes 21 15 ↓ 33%
Serious InjuriesSerious InjuriesSerious InjuriesSerious Injuries
FatalitiesFatalitiesFatalitiesFatalities
4 2 ↓ 53%
0 0 -
Pedestrian Casualties
Right Through Casualty Crashes
Adjacent Casualty Crashes
Rear End Casualty Crashes
0
7
1
8
0
2
2
5
-
↓ 73%
↑ 88%
↓ 41%
Speeding Infringements
0
20
40
60
80
100
120
Dec-09
Jun-10
Dec-10
Jun-11
Dec-11
Jun-12
Dec-12
Jun-13
Dec-13
Jun-14
Dec-14
Jun-15
Dec-15
Jun-16
Dec-16
Jun-17
Dec-17
Month-Year
Infr
ingem
ents
per
Month
Speeding Warning Letters Speeding Infringements
Moderate InjuriesModerate InjuriesModerate InjuriesModerate Injuries 20 6 ↓ 72%
Minor / Other InjuriesMinor / Other InjuriesMinor / Other InjuriesMinor / Other Injuries 9 10 ↑ 5%
¹ Ending 91 days before the start of the warning letter period, 18 September 2009² Ending 31 December 2017
4 years and 260 days
before installation¹
Total Casualties:Total Casualties:Total Casualties:Total Casualties: 18 ↓ 49%33
Percentage
change
Fatal and Serious CrashesFatal and Serious CrashesFatal and Serious CrashesFatal and Serious Crashes 4 2 ↓ 53%
• The camera at the intersection of Cumberland Highway and St Johns Road commenced issuing warning letters in December 2009.
Annual NSW Speed Camera Performance Review 2018 - Appendix B: Red-light speed cameras B37

• There are two cameras at this intersection.
Casualties and FSI Crashes
0
5
10
15
20
-5Y -4Y -3Y -2Y -1Y 2012 2013 2014 2015 2016 2017Number of years before and year after camera installation
Casualti
es / C
rashes
Uncategorised M inor/Other M oderate Injury
Serious Injury Killed FSI Crash
7110|7111 Campbelltown - Kellicar Road at Narellan Road
• The infringement graphs show the number of warning letters and infringements issued at this intersection as well as the trend in infringements since the camera began operation. Roadworks and camera maintenance may influence the number of infringements issued.
Status: Retain.
Casualties and casualty crashes at enforced intersection Infringements at enforced intersection
Red-Light Infringements
0
100
200
300
400
500
600
700
May-11
Nov-11
May-12
Nov-12
May-13
Nov-13
May-14
Nov-14
May-15
Nov-15
May-16
Nov-16
May-17
Nov-17
Month-Year
Infr
ingem
ents
per
Month
Red-light Warning Letters Red-light Infringements5 year
after period²
Casualty CrashesCasualty CrashesCasualty CrashesCasualty Crashes 31 8 ↓ 74%
Serious InjuriesSerious InjuriesSerious InjuriesSerious Injuries
FatalitiesFatalitiesFatalitiesFatalities
2 0 ↓ 100%
0 0 -
Pedestrian Casualties
Right Through Casualty Crashes
Adjacent Casualty Crashes
Rear End Casualty Crashes
6
9
3
6
0
0
1
6
↓ 100%
↓ 100%
↓ 67%
↓ 0%
Speeding Infringements
0
5
10
15
20
25
30
35
40
45
May-11
Nov-11
May-12
Nov-12
May-13
Nov-13
May-14
Nov-14
May-15
Nov-15
May-16
Nov-16
May-17
Nov-17
Month-Year
Infr
ingem
ents
per
Month
Speeding Warning Letters Speeding Infringements
Moderate InjuriesModerate InjuriesModerate InjuriesModerate Injuries 32 4 ↓ 88%
Minor / Other InjuriesMinor / Other InjuriesMinor / Other InjuriesMinor / Other Injuries 16 7 ↓ 56%
¹ Ending 91 days before the start of the warning letter period, 7 February 2011² Ending 31 December 2017
5 years before
installation¹
Total Casualties:Total Casualties:Total Casualties:Total Casualties: 11 ↓ 78%50
Percentage
change
Fatal and Serious CrashesFatal and Serious CrashesFatal and Serious CrashesFatal and Serious Crashes 2 0 ↓ 100%
• Both cameras at the intersection of Kellicar Road and Narellan Road commenced issuing warning letters in May 2011.
Annual NSW Speed Camera Performance Review 2018 - Appendix B: Red-light speed cameras B38

• There are two cameras at this intersection. This was previously a wet-film red-light camera location.
Casualties and FSI Crashes
0
5
10
15
20
-5Y -4Y -3Y -2Y -1Y 2011 2012 2013 2014 2015 2016 2017Number of years before and year after camera installation
Casualti
es / C
rashes
Uncategorised M inor/Other M oderate Injury
Serious Injury Killed FSI Crash
7103|7104 Campbelltown - Moore-Oxley Bypass at Broughton Street
• The infringement graphs show the number of warning letters and infringements issued at this intersection as well as the trend in infringements since the camera began operation. Roadworks and camera maintenance may influence the number of infringements issued.
Status: Retain.
Casualties and casualty crashes at enforced intersection Infringements at enforced intersection
Red-Light Infringements
0
20
40
60
80
100
120
140
160
180
200
Jun-10
Dec-10
Jun-11
Dec-11
Jun-12
Dec-12
Jun-13
Dec-13
Jun-14
Dec-14
Jun-15
Dec-15
Jun-16
Dec-16
Jun-17
Dec-17
Month-Year
Infr
ingem
ents
per
Month
Red-light Warning Letters Red-light Infringements5 year
after period²
Casualty CrashesCasualty CrashesCasualty CrashesCasualty Crashes 22 7 ↓ 68%
Serious InjuriesSerious InjuriesSerious InjuriesSerious Injuries
FatalitiesFatalitiesFatalitiesFatalities
4 5 ↑ 25%
1 0 ↓ 100%
Pedestrian Casualties
Right Through Casualty Crashes
Adjacent Casualty Crashes
Rear End Casualty Crashes
0
10
5
6
0
5
1
1
-
↓ 50%
↓ 80%
↓ 83%
Speeding Infringements
0
100
200
300
400
500
600
Jun-10
Dec-10
Jun-11
Dec-11
Jun-12
Dec-12
Jun-13
Dec-13
Jun-14
Dec-14
Jun-15
Dec-15
Jun-16
Dec-16
Jun-17
Dec-17
Month-Year
Infr
ingem
ents
per
Month
Speeding Warning Letters Speeding Infringements
Moderate InjuriesModerate InjuriesModerate InjuriesModerate Injuries 16 7 ↓ 56%
Minor / Other InjuriesMinor / Other InjuriesMinor / Other InjuriesMinor / Other Injuries 21 1 ↓ 95%
¹ Ending 91 days before the start of the warning letter period, 25 March 2010² Ending 31 December 2017
5 years before
installation¹
Total Casualties:Total Casualties:Total Casualties:Total Casualties: 13 ↓ 69%42
Percentage
change
Fatal and Serious CrashesFatal and Serious CrashesFatal and Serious CrashesFatal and Serious Crashes 5 4 ↓ 20%
• Both cameras at the intersection of Moore-Oxley Bypass and Broughton Street commenced issuing warning letters in June 2010.
Annual NSW Speed Camera Performance Review 2018 - Appendix B: Red-light speed cameras B39

• There is one camera at this intersection. This was previously a wet-film red-light camera location.
Casualties and FSI Crashes
0
2
4
6
8
10
-5Y -4Y -3Y -2Y -1Y 2011 2012 2013 2014 2015 2016 2017Number of years before and year after camera installation
Casualti
es / C
rashes
Uncategorised M inor/Other M oderate Injury
Serious Injury Killed FSI Crash
7167 Campsie - Canterbury Road at Bexley Road
• The infringement graphs show the number of warning letters and infringements issued at this intersection as well as the trend in infringements since the camera began operation. Roadworks and camera maintenance may influence the number of infringements issued.
Status: Retain.
Casualties and casualty crashes at enforced intersection Infringements at enforced intersection
Red-Light Infringements
0
50
100
150
200
250
300
350
Oct-10
Apr-11
Oct-11
Apr-12
Oct-12
Apr-13
Oct-13
Apr-14
Oct-14
Apr-15
Oct-15
Apr-16
Oct-16
Apr-17
Oct-17
Month-Year
Infr
ingem
ents
per
Month
Red-light Warning Letters Red-light Infringements5 year
after period²
Casualty CrashesCasualty CrashesCasualty CrashesCasualty Crashes 17 16 ↓ 6%
Serious InjuriesSerious InjuriesSerious InjuriesSerious Injuries
FatalitiesFatalitiesFatalitiesFatalities
8 4 ↓ 50%
0 0 -
Pedestrian Casualties
Right Through Casualty Crashes
Adjacent Casualty Crashes
Rear End Casualty Crashes
1
6
2
3
2
4
1
4
↑ 100%
↓ 33%
↓ 50%
↑ 33%
Speeding Infringements
0
20
40
60
80
100
120
140
Oct-10
Apr-11
Oct-11
Apr-12
Oct-12
Apr-13
Oct-13
Apr-14
Oct-14
Apr-15
Oct-15
Apr-16
Oct-16
Apr-17
Oct-17
Month-Year
Infr
ingem
ents
per
Month
Speeding Warning Letters Speeding Infringements
Moderate InjuriesModerate InjuriesModerate InjuriesModerate Injuries 16 8 ↓ 50%
Minor / Other InjuriesMinor / Other InjuriesMinor / Other InjuriesMinor / Other Injuries 3 9 ↑ 200%
¹ Ending 91 days before the start of the warning letter period, 16 July 2010² Ending 31 December 2017
5 years before
installation¹
Total Casualties:Total Casualties:Total Casualties:Total Casualties: 21 ↓ 22%27
Percentage
change
Fatal and Serious CrashesFatal and Serious CrashesFatal and Serious CrashesFatal and Serious Crashes 4 4 ↓ 0%
• The camera at the intersection of Canterbury Road and Bexley Road commenced issuing warning letters in October 2010.
Annual NSW Speed Camera Performance Review 2018 - Appendix B: Red-light speed cameras B40

• There is one camera at this intersection.
Casualties and FSI Crashes
0
2
4
6
8
-5Y -4Y -3Y -2Y -1Y 1Y 2Y 3Y 4YNumber of years before and after camera installation
Casualti
es / C
rashes
Uncategorised M inor/Other M oderate Injury
Serious Injury Killed FSI Crash
7246 Campsie - Canterbury Road at Thorncraft Parade
• The infringement graphs show the number of warning letters and infringements issued at this intersection as well as the trend in infringements since the camera began operation. Roadworks and camera maintenance may influence the number of infringements issued.
Status: Insufficient data (<5 years) to reliably assess.
Casualties and casualty crashes at enforced intersection Infringements at enforced intersection
Red-Light Infringements
0
20
40
60
80
100
120
140
Apr-13
Aug-13
Dec-13
Apr-14
Aug-14
Dec-14
Apr-15
Aug-15
Dec-15
Apr-16
Aug-16
Dec-16
Apr-17
Aug-17
Dec-17
Month-Year
Infr
ingem
ents
per
Month
Red-light Warning Letters Red-light Infringements4 years and 269
days after installation²
Casualty CrashesCasualty CrashesCasualty CrashesCasualty Crashes 16 10 ↓ 34%
Serious InjuriesSerious InjuriesSerious InjuriesSerious Injuries
FatalitiesFatalitiesFatalitiesFatalities
4 1 ↓ 74%
0 0 -
Pedestrian Casualties
Right Through Casualty Crashes
Adjacent Casualty Crashes
Rear End Casualty Crashes
3
6
6
1
1
2
3
2
↓ 65%
↓ 65%
↓ 47%
↑ 111%
Speeding Infringements
0
50
100
150
200
250
300
Apr-13
Aug-13
Dec-13
Apr-14
Aug-14
Dec-14
Apr-15
Aug-15
Dec-15
Apr-16
Aug-16
Dec-16
Apr-17
Aug-17
Dec-17
Month-Year
Infr
ingem
ents
per
Month
Speeding Warning Letters Speeding Infringements
Moderate InjuriesModerate InjuriesModerate InjuriesModerate Injuries 15 7 ↓ 51%
Minor / Other InjuriesMinor / Other InjuriesMinor / Other InjuriesMinor / Other Injuries 5 5 ↑ 6%
¹ Ending 91 days before the start of the warning letter period, 5 January 2013² Ending 31 December 2017³ The percentage change is based on annualised crash data to allow for a direct comparison between the pre and post installation time periods. Red values indicate an increase.
5 years before
installation¹
Total Casualties:Total Casualties:Total Casualties:Total Casualties: 13 ↓ 43%24
Percentage
change³
Fatal and Serious CrashesFatal and Serious CrashesFatal and Serious CrashesFatal and Serious Crashes 4 1 ↓ 74%
• The camera at the intersection of Canterbury Road and Thorncraft Parade commenced issuing warning letters in April 2013.
Annual NSW Speed Camera Performance Review 2018 - Appendix B: Red-light speed cameras B41

• There is one camera at this intersection.
Casualties and FSI Crashes
0
1
2
3
4
5
6
7
-5Y -4Y -3Y -2Y -1Y 1Y 2YNumber of years before and after camera installation
Casualti
es / C
rashes
Uncategorised M inor/Other M oderate Injury
Serious Injury Killed FSI Crash
7324 Canley Heights - Cumberland Highway at Canley Vale Road (school zone)
• The infringement graphs show the number of warning letters and infringements issued at this intersection as well as the trend in infringements since the camera began operation. Roadworks and camera maintenance may influence the number of infringements issued.
Status: Insufficient data (<5 years) to reliably assess.
Casualties and casualty crashes at enforced intersection Infringements at enforced intersection
Red-Light Infringements
0
10
20
30
40
50
60
70
Oct-15
Dec-15
Feb-16
Apr-16
Jun-16
Aug-16
Oct-16
Dec-16
Feb-17
Apr-17
Jun-17
Aug-17
Oct-17
Dec-17
Month-Year
Infr
ingem
ents
per
Month
Red-light Warning Letters Red-light Infringements2 years and 85 days
after installation²
Casualty CrashesCasualty CrashesCasualty CrashesCasualty Crashes 15 7 ↑ 5%
Serious InjuriesSerious InjuriesSerious InjuriesSerious Injuries
FatalitiesFatalitiesFatalitiesFatalities
1 1 ↑ 124%
0 0 -
Pedestrian Casualties
Right Through Casualty Crashes
Adjacent Casualty Crashes
Rear End Casualty Crashes
1
6
0
6
0
2
0
3
↓ 100%
↓ 25%
-
↑ 12%
Speeding Infringements
0
50
100
150
200
250
300
Oct-15
Dec-15
Feb-16
Apr-16
Jun-16
Aug-16
Oct-16
Dec-16
Feb-17
Apr-17
Jun-17
Aug-17
Oct-17
Dec-17
Month-Year
Infr
ingem
ents
per
Month
Speeding Warning Letters Speeding Infringements
Moderate InjuriesModerate InjuriesModerate InjuriesModerate Injuries 6 4 ↑ 49%
Minor / Other InjuriesMinor / Other InjuriesMinor / Other InjuriesMinor / Other Injuries 10 3 ↓ 33%
¹ Ending 91 days before the start of the warning letter period, 9 July 2015² Ending 31 December 2017³ The percentage change is based on annualised crash data to allow for a direct comparison between the pre and post installation time periods. Red values indicate an increase.
5 years before
installation¹
Total Casualties:Total Casualties:Total Casualties:Total Casualties: 8 ↑ 5%17
Percentage
change³
Fatal and Serious CrashesFatal and Serious CrashesFatal and Serious CrashesFatal and Serious Crashes 1 1 ↑ 124%
• The camera at the intersection of Cumberland Highway and Canley Vale Road commenced issuing warning letters in October 2015.
Annual NSW Speed Camera Performance Review 2018 - Appendix B: Red-light speed cameras B42

• There is one camera at this intersection. This was previously a wet-film red-light camera location.
Casualties and FSI Crashes
0
2
4
6
8
10
12
-5Y -4Y -3Y -2Y -1Y 2012 2013 2014 2015 2016 2017Number of years before and year after camera installation
Casualti
es / C
rashes
Uncategorised M inor/Other M oderate Injury
Serious Injury Killed FSI Crash
7209 Canley Vale - Sackville Street at Canley Vale Road
• The infringement graphs show the number of warning letters and infringements issued at this intersection as well as the trend in infringements since the camera began operation. Roadworks and camera maintenance may influence the number of infringements issued.
Status: Retain and Monitor. The previous wet-film red light camera may have influenced the before period data. Annual traffic counts have increased across NSW.
Casualties and casualty crashes at enforced intersection Infringements at enforced intersection
Red-Light Infringements
0
10
20
30
40
50
60
70
Apr-11
Oct-11
Apr-12
Oct-12
Apr-13
Oct-13
Apr-14
Oct-14
Apr-15
Oct-15
Apr-16
Oct-16
Apr-17
Oct-17
Month-Year
Infr
ingem
ents
per
Month
Red-light Warning Letters Red-light Infringements5 year
after period²
Casualty CrashesCasualty CrashesCasualty CrashesCasualty Crashes 7 9 ↑ 29%
Serious InjuriesSerious InjuriesSerious InjuriesSerious Injuries
FatalitiesFatalitiesFatalitiesFatalities
1 4 ↑ 300%
0 0 -
Pedestrian Casualties
Right Through Casualty Crashes
Adjacent Casualty Crashes
Rear End Casualty Crashes
0
3
1
2
0
5
1
2
-
↑ 67%
↓ 0%
↓ 0%
Speeding Infringements
0
10
20
30
40
50
60
70
80
Apr-11
Oct-11
Apr-12
Oct-12
Apr-13
Oct-13
Apr-14
Oct-14
Apr-15
Oct-15
Apr-16
Oct-16
Apr-17
Oct-17
Month-Year
Infr
ingem
ents
per
Month
Speeding Warning Letters Speeding Infringements
Moderate InjuriesModerate InjuriesModerate InjuriesModerate Injuries 6 6 ↓ 0%
Minor / Other InjuriesMinor / Other InjuriesMinor / Other InjuriesMinor / Other Injuries 3 5 ↑ 67%
¹ Ending 91 days before the start of the warning letter period, 7 January 2011² Ending 31 December 2017
5 years before
installation¹
Total Casualties:Total Casualties:Total Casualties:Total Casualties: 15 ↑ 50%10
Percentage
change
Fatal and Serious CrashesFatal and Serious CrashesFatal and Serious CrashesFatal and Serious Crashes 1 3 ↑ 200%
• The camera at the intersection of Sackville Street and Canley Vale Road commenced issuing warning letters in April 2011.
Annual NSW Speed Camera Performance Review 2018 - Appendix B: Red-light speed cameras B43

• There is one camera at this intersection. This was previously a wet-film red-light camera location.
Casualties and FSI Crashes
0
2
4
6
8
10
12
-5Y -4Y -3Y -2Y -1Y 2011 2012 2013 2014 2015 2016 2017Number of years before and year after camera installation
Casualti
es / C
rashes
Uncategorised M inor/Other M oderate Injury
Serious Injury Killed FSI Crash
7162 Caringbah - The Kingsway at Gannons Road
• The infringement graphs show the number of warning letters and infringements issued at this intersection as well as the trend in infringements since the camera began operation. Roadworks and camera maintenance may influence the number of infringements issued.
Status: Retain.
Casualties and casualty crashes at enforced intersection Infringements at enforced intersection
Red-Light Infringements
0
10
20
30
40
50
60
70
Sep-10
Mar-11
Sep-11
Mar-12
Sep-12
Mar-13
Sep-13
Mar-14
Sep-14
Mar-15
Sep-15
Mar-16
Sep-16
Mar-17
Sep-17
Month-Year
Infr
ingem
ents
per
Month
Red-light Warning Letters Red-light Infringements5 year
after period²
Casualty CrashesCasualty CrashesCasualty CrashesCasualty Crashes 23 9 ↓ 61%
Serious InjuriesSerious InjuriesSerious InjuriesSerious Injuries
FatalitiesFatalitiesFatalitiesFatalities
6 2 ↓ 67%
0 0 -
Pedestrian Casualties
Right Through Casualty Crashes
Adjacent Casualty Crashes
Rear End Casualty Crashes
3
9
6
3
1
3
1
2
↓ 67%
↓ 67%
↓ 83%
↓ 33%
Speeding Infringements
0
10
20
30
40
50
60
70
80
90
Sep-10
Mar-11
Sep-11
Mar-12
Sep-12
Mar-13
Sep-13
Mar-14
Sep-14
Mar-15
Sep-15
Mar-16
Sep-16
Mar-17
Sep-17
Month-Year
Infr
ingem
ents
per
Month
Speeding Warning Letters Speeding Infringements
Moderate InjuriesModerate InjuriesModerate InjuriesModerate Injuries 22 6 ↓ 73%
Minor / Other InjuriesMinor / Other InjuriesMinor / Other InjuriesMinor / Other Injuries 5 4 ↓ 20%
¹ Ending 91 days before the start of the warning letter period, 30 June 2010² Ending 31 December 2017
5 years before
installation¹
Total Casualties:Total Casualties:Total Casualties:Total Casualties: 12 ↓ 64%33
Percentage
change
Fatal and Serious CrashesFatal and Serious CrashesFatal and Serious CrashesFatal and Serious Crashes 5 2 ↓ 60%
• The camera at the intersection of Kingsway and Gannons Road commenced issuing warning letters in September 2010.
Annual NSW Speed Camera Performance Review 2018 - Appendix B: Red-light speed cameras B44

• There is one camera at this intersection.
Casualties and FSI Crashes
0
1
2
3
4
5
6
7
-5Y -4Y -3Y -2Y -1Y 1Y 2Y 3YNumber of years before and after camera installation
Casualti
es / C
rashes
Uncategorised M inor/Other M oderate Injury
Serious Injury Killed FSI Crash
7309 Castle Hill - Pennant Street at Castle Street
• The infringement graphs show the number of warning letters and infringements issued at this intersection as well as the trend in infringements since the camera began operation. Roadworks and camera maintenance may influence the number of infringements issued.
Status: Insufficient data (<5 years) to reliably assess.
Casualties and casualty crashes at enforced intersection Infringements at enforced intersection
Red-Light Infringements
0
20
40
60
80
100
120
140
160
180
Aug-14
Nov-14
Feb-15
May-15
Aug-15
Nov-15
Feb-16
May-16
Aug-16
Nov-16
Feb-17
May-17
Aug-17
Nov-17
Month-Year
Infr
ingem
ents
per
Month
Red-light Warning Letters Red-light Infringements3 years and 141
days after installation²
Casualty CrashesCasualty CrashesCasualty CrashesCasualty Crashes 10 7 ↑ 3%
Serious InjuriesSerious InjuriesSerious InjuriesSerious Injuries
FatalitiesFatalitiesFatalitiesFatalities
4 1 ↓ 63%
0 0 -
Pedestrian Casualties
Right Through Casualty Crashes
Adjacent Casualty Crashes
Rear End Casualty Crashes
0
6
1
1
2
4
0
0
Increase
↓ 2%
↓ 100%
↓ 100%
Speeding Infringements
0
5
10
15
20
25
30
35
40
45
50
Aug-14
Nov-14
Feb-15
May-15
Aug-15
Nov-15
Feb-16
May-16
Aug-16
Nov-16
Feb-17
May-17
Aug-17
Nov-17
Month-Year
Infr
ingem
ents
per
Month
Speeding Warning Letters Speeding Infringements
Moderate InjuriesModerate InjuriesModerate InjuriesModerate Injuries 3 2 ↓ 2%
Minor / Other InjuriesMinor / Other InjuriesMinor / Other InjuriesMinor / Other Injuries 6 4 ↓ 2%
¹ Ending 91 days before the start of the warning letter period, 13 May 2014² Ending 31 December 2017³ The percentage change is based on annualised crash data to allow for a direct comparison between the pre and post installation time periods. Red values indicate an increase.
5 years before
installation¹
Total Casualties:Total Casualties:Total Casualties:Total Casualties: 7 ↓ 21%13
Percentage
change³
Fatal and Serious CrashesFatal and Serious CrashesFatal and Serious CrashesFatal and Serious Crashes 4 1 ↓ 63%
• The camera at the intersection of Pennant Street and Castle Street commenced issuing warning letters in August 2014.
Annual NSW Speed Camera Performance Review 2018 - Appendix B: Red-light speed cameras B45

• There is one camera at this intersection. This was previously a wet-film red-light camera location.
Casualties and FSI Crashes
0
1
2
3
4
5
6
7
-5Y -4Y -3Y -2Y -1Y 2012 2013 2014 2015 2016 2017Number of years before and year after camera installation
Casualti
es / C
rashes
Uncategorised M inor/Other M oderate Injury
Serious Injury Killed FSI Crash
7150 Castle Hill - Showground Road at Victoria Avenue
• The infringement graphs show the number of warning letters and infringements issued at this intersection as well as the trend in infringements since the camera began operation. Roadworks and camera maintenance may influence the number of infringements issued.
Status: Retain and Monitor. The previous wet-film red light camera may have influenced the before period data. Annual traffic counts have increased across NSW.
Casualties and casualty crashes at enforced intersection Infringements at enforced intersection
Red-Light Infringements
0
20
40
60
80
100
120
140
160
180
Aug-11
Feb-12
Aug-12
Feb-13
Aug-13
Feb-14
Aug-14
Feb-15
Aug-15
Feb-16
Aug-16
Feb-17
Aug-17
Month-Year
Infr
ingem
ents
per
Month
Red-light Warning Letters Red-light Infringements5 year
after period²
Casualty CrashesCasualty CrashesCasualty CrashesCasualty Crashes 6 13 ↑ 117%
Serious InjuriesSerious InjuriesSerious InjuriesSerious Injuries
FatalitiesFatalitiesFatalitiesFatalities
0 3 Increase
0 0 -
Pedestrian Casualties
Right Through Casualty Crashes
Adjacent Casualty Crashes
Rear End Casualty Crashes
0
0
0
4
0
0
1
6
-
-
Increase
↑ 50%
Speeding Infringements
0
100
200
300
400
500
600
700
800
900
Aug-11
Feb-12
Aug-12
Feb-13
Aug-13
Feb-14
Aug-14
Feb-15
Aug-15
Feb-16
Aug-16
Feb-17
Aug-17
Month-Year
Infr
ingem
ents
per
Month
Speeding Warning Letters Speeding Infringements
Moderate InjuriesModerate InjuriesModerate InjuriesModerate Injuries 2 6 ↑ 200%
Minor / Other InjuriesMinor / Other InjuriesMinor / Other InjuriesMinor / Other Injuries 5 7 ↑ 40%
¹ Ending 91 days before the start of the warning letter period, 30 May 2011² Ending 31 December 2017
5 years before
installation¹
Total Casualties:Total Casualties:Total Casualties:Total Casualties: 16 ↑ 129%7
Percentage
change
Fatal and Serious CrashesFatal and Serious CrashesFatal and Serious CrashesFatal and Serious Crashes 0 3 Increase
• The camera at the intersection of Showground Road and Victoria Avenue commenced issuing warning letters in August 2011.
Annual NSW Speed Camera Performance Review 2018 - Appendix B: Red-light speed cameras B46

• There are two cameras at this intersection.
Casualties and FSI Crashes
0
2
4
6
8
-5Y -4Y -3Y -2Y -1Y 2011 2012 2013 2014 2015 2016 2017Number of years before and year after camera installation
Casualti
es / C
rashes
Uncategorised M inor/Other M oderate Injury
Serious Injury Killed FSI Crash
7124|7125 Chester Hill / Sefton - Waldron Road at Hector Street
• The infringement graphs show the number of warning letters and infringements issued at this intersection as well as the trend in infringements since the camera began operation. Roadworks and camera maintenance may influence the number of infringements issued.
Status: Retain.
Casualties and casualty crashes at enforced intersection Infringements at enforced intersection
Red-Light Infringements
0
10
20
30
40
50
60
70
80
90
Jul-10
Jan-11
Jul-11
Jan-12
Jul-12
Jan-13
Jul-13
Jan-14
Jul-14
Jan-15
Jul-15
Jan-16
Jul-16
Jan-17
Jul-17
Month-Year
Infr
ingem
ents
per
Month
Red-light Warning Letters Red-light Infringements5 year
after period²
Casualty CrashesCasualty CrashesCasualty CrashesCasualty Crashes 20 21 ↑ 5%
Serious InjuriesSerious InjuriesSerious InjuriesSerious Injuries
FatalitiesFatalitiesFatalitiesFatalities
7 4 ↓ 43%
0 0 -
Pedestrian Casualties
Right Through Casualty Crashes
Adjacent Casualty Crashes
Rear End Casualty Crashes
1
13
5
0
0
15
1
1
↓ 100%
↑ 15%
↓ 80%
Increase
Speeding Infringements
0
5
10
15
20
25
30
35
40
Jul-10
Jan-11
Jul-11
Jan-12
Jul-12
Jan-13
Jul-13
Jan-14
Jul-14
Jan-15
Jul-15
Jan-16
Jul-16
Jan-17
Jul-17
Month-Year
Infr
ingem
ents
per
Month
Speeding Warning Letters Speeding Infringements
Moderate InjuriesModerate InjuriesModerate InjuriesModerate Injuries 12 10 ↓ 17%
Minor / Other InjuriesMinor / Other InjuriesMinor / Other InjuriesMinor / Other Injuries 6 10 ↑ 67%
¹ Ending 91 days before the start of the warning letter period, 23 April 2010² Ending 31 December 2017
5 years before
installation¹
Total Casualties:Total Casualties:Total Casualties:Total Casualties: 24 ↓ 4%25
Percentage
change
Fatal and Serious CrashesFatal and Serious CrashesFatal and Serious CrashesFatal and Serious Crashes 7 4 ↓ 43%
• The camera at the intersection of Waldron Road and Hector Street (westbound) commenced issuing warning letters in July 2010.
• The camera at the intersection of Waldron Road and Hector Street (eastbound) commenced issuing warning letters in August 2010.
Annual NSW Speed Camera Performance Review 2018 - Appendix B: Red-light speed cameras B47

• There is one camera at this intersection. This was previously a wet-film red-light camera location.
Casualties and FSI Crashes
0
2
4
6
8
-5Y -4Y -3Y -2Y -1Y 1Y 2YNumber of years before and after camera installation
Casualti
es / C
rashes
Uncategorised M inor/Other M oderate Injury
Serious Injury Killed FSI Crash
7316 Chippendale - Abercrombie Street at Broadway
• The infringement graphs show the number of warning letters and infringements issued at this intersection as well as the trend in infringements since the camera began operation. Roadworks and camera maintenance may influence the number of infringements issued.
Status: Insufficient data (<5 years) to reliably assess.
Casualties and casualty crashes at enforced intersection Infringements at enforced intersection
Red-Light Infringements
0
20
40
60
80
100
120
140
160
180
200
Dec-15
Feb-16
Apr-16
Jun-16
Aug-16
Oct-16
Dec-16
Feb-17
Apr-17
Jun-17
Aug-17
Oct-17
Dec-17
Month-Year
Infr
ingem
ents
per
Month
Red-light Warning Letters Red-light Infringements2 years and 8 days
after installation²
Casualty CrashesCasualty CrashesCasualty CrashesCasualty Crashes 18 3 ↓ 59%
Serious InjuriesSerious InjuriesSerious InjuriesSerious Injuries
FatalitiesFatalitiesFatalitiesFatalities
5 0 ↓ 100%
0 0 -
Pedestrian Casualties
Right Through Casualty Crashes
Adjacent Casualty Crashes
Rear End Casualty Crashes
2
0
3
5
1
0
0
1
↑ 24%
-
↓ 100%
↓ 51%
Speeding Infringements
0
20
40
60
80
100
120
140
160
Dec-15
Feb-16
Apr-16
Jun-16
Aug-16
Oct-16
Dec-16
Feb-17
Apr-17
Jun-17
Aug-17
Oct-17
Dec-17
Month-Year
Infr
ingem
ents
per
Month
Speeding Warning Letters Speeding Infringements
Moderate InjuriesModerate InjuriesModerate InjuriesModerate Injuries 6 3 ↑ 24%
Minor / Other InjuriesMinor / Other InjuriesMinor / Other InjuriesMinor / Other Injuries 12 0 ↓ 100%
¹ Ending 91 days before the start of the warning letter period, 24 September 2015² Ending 31 December 2017³ The percentage change is based on annualised crash data to allow for a direct comparison between the pre and post installation time periods. Red values indicate an increase.
5 years before
installation¹
Total Casualties:Total Casualties:Total Casualties:Total Casualties: 3 ↓ 68%23
Percentage
change³
Fatal and Serious CrashesFatal and Serious CrashesFatal and Serious CrashesFatal and Serious Crashes 4 0 ↓ 100%
• The camera at the intersection of Abercrombie Street and Broadway commenced issuing warning letters in December 2015.
Annual NSW Speed Camera Performance Review 2018 - Appendix B: Red-light speed cameras B48

• There is one camera at this intersection.
Casualties and FSI Crashes
0
2
4
6
8
-5Y -4Y -3Y -2Y -1Y 1Y 2YNumber of years before and after camera installation
Casualti
es / C
rashes
Uncategorised M inor/Other M oderate Injury
Serious Injury Killed FSI Crash
7321 Chullora - Rookwood Road at Muir Road
• The infringement graphs show the number of warning letters and infringements issued at this intersection as well as the trend in infringements since the camera began operation. Roadworks and camera maintenance may influence the number of infringements issued.
Status: Insufficient data (<5 years) to reliably assess.
Casualties and casualty crashes at enforced intersection Infringements at enforced intersection
Red-Light Infringements
0
10
20
30
40
50
60
70
80
90
Jul-15
Sep-15
Nov-15
Jan-16
Mar-16
May-16
Jul-16
Sep-16
Nov-16
Jan-17
Mar-17
May-17
Jul-17
Sep-17
Nov-17
Month-Year
Infr
ingem
ents
per
Month
Red-light Warning Letters Red-light Infringements2 years and 157
days after installation²
Casualty CrashesCasualty CrashesCasualty CrashesCasualty Crashes 8 4 ↑ 3%
Serious InjuriesSerious InjuriesSerious InjuriesSerious Injuries
FatalitiesFatalitiesFatalitiesFatalities
1 2 ↑ 312%
0 0 -
Pedestrian Casualties
Right Through Casualty Crashes
Adjacent Casualty Crashes
Rear End Casualty Crashes
0
3
0
1
1
0
0
1
Increase
↓ 100%
-
↑ 106%
Speeding Infringements
0
20
40
60
80
100
120
140
160
180
Jul-15
Sep-15
Nov-15
Jan-16
Mar-16
May-16
Jul-16
Sep-16
Nov-16
Jan-17
Mar-17
May-17
Jul-17
Sep-17
Nov-17
Month-Year
Infr
ingem
ents
per
Month
Speeding Warning Letters Speeding Infringements
Moderate InjuriesModerate InjuriesModerate InjuriesModerate Injuries 9 1 ↓ 77%
Minor / Other InjuriesMinor / Other InjuriesMinor / Other InjuriesMinor / Other Injuries 4 1 ↓ 49%
¹ Ending 91 days before the start of the warning letter period, 28 April 2015² Ending 31 December 2017³ The percentage change is based on annualised crash data to allow for a direct comparison between the pre and post installation time periods. Red values indicate an increase.
5 years before
installation¹
Total Casualties:Total Casualties:Total Casualties:Total Casualties: 4 ↓ 41%14
Percentage
change³
Fatal and Serious CrashesFatal and Serious CrashesFatal and Serious CrashesFatal and Serious Crashes 1 2 ↑ 312%
• The camera at the intersection of Rookwood Road and Muir Road commenced issuing warning letters in July 2015.
Annual NSW Speed Camera Performance Review 2018 - Appendix B: Red-light speed cameras B49

• There is one camera at this intersection.
Casualties and FSI Crashes
0
2
4
6
8
10
12
-5Y -4Y -3Y -2Y -1Y 1Y 2Y 3Y 4YNumber of years before and after camera installation
Casualti
es / C
rashes
Uncategorised M inor/Other M oderate Injury
Serious Injury Killed FSI Crash
7252 Concord - Broughton Street at Crane Street
• The infringement graphs show the number of warning letters and infringements issued at this intersection as well as the trend in infringements since the camera began operation. Roadworks and camera maintenance may influence the number of infringements issued.
Status: Insufficient data (<5 years) to reliably assess.
Casualties and casualty crashes at enforced intersection Infringements at enforced intersection
Red-Light Infringements
0
5
10
15
20
25
30
35
40
45
Mar-13
Jul-13
Nov-13
Mar-14
Jul-14
Nov-14
Mar-15
Jul-15
Nov-15
Mar-16
Jul-16
Nov-16
Mar-17
Jul-17
Nov-17
Month-Year
Infr
ingem
ents
per
Month
Red-light Warning Letters Red-light Infringements4 years and 277
days after installation²
Casualty CrashesCasualty CrashesCasualty CrashesCasualty Crashes 15 5 ↓ 65%
Serious InjuriesSerious InjuriesSerious InjuriesSerious Injuries
FatalitiesFatalitiesFatalitiesFatalities
5 0 ↓ 100%
0 0 -
Pedestrian Casualties
Right Through Casualty Crashes
Adjacent Casualty Crashes
Rear End Casualty Crashes
0
1
13
0
0
2
2
1
-
↑ 110%
↓ 84%
Increase
Speeding Infringements
0
2
4
6
8
10
12
14
16
18
Mar-13
Jul-13
Nov-13
Mar-14
Jul-14
Nov-14
Mar-15
Jul-15
Nov-15
Mar-16
Jul-16
Nov-16
Mar-17
Jul-17
Nov-17
Month-Year
Infr
ingem
ents
per
Month
Speeding Warning Letters Speeding Infringements
Moderate InjuriesModerate InjuriesModerate InjuriesModerate Injuries 14 3 ↓ 77%
Minor / Other InjuriesMinor / Other InjuriesMinor / Other InjuriesMinor / Other Injuries 4 2 ↓ 47%
¹ Ending 91 days before the start of the warning letter period, 28 December 2012² Ending 31 December 2017³ The percentage change is based on annualised crash data to allow for a direct comparison between the pre and post installation time periods. Red values indicate an increase.
5 years before
installation¹
Total Casualties:Total Casualties:Total Casualties:Total Casualties: 5 ↓ 77%23
Percentage
change³
Fatal and Serious CrashesFatal and Serious CrashesFatal and Serious CrashesFatal and Serious Crashes 5 0 ↓ 100%
• The camera at the intersection of Broughton Street and Crane Street commenced issuing warning letters in March 2013.
Annual NSW Speed Camera Performance Review 2018 - Appendix B: Red-light speed cameras B50

• There is one camera at this intersection. This was previously a wet-film red-light camera location.
Casualties and FSI Crashes
0
1
2
3
4
-5Y -4Y -3Y -2Y -1Y 2012 2013 2014 2015 2016 2017Number of years before and year after camera installation
Casualti
es / C
rashes
Uncategorised M inor/Other M oderate Injury
Serious Injury Killed FSI Crash
7174 Crows Nest - Pacific Highway at Hume Street
• The infringement graphs show the number of warning letters and infringements issued at this intersection as well as the trend in infringements since the camera began operation. Roadworks and camera maintenance may influence the number of infringements issued.
Status: Retain.
Casualties and casualty crashes at enforced intersection Infringements at enforced intersection
Red-Light Infringements
0
20
40
60
80
100
120
Apr-11
Oct-11
Apr-12
Oct-12
Apr-13
Oct-13
Apr-14
Oct-14
Apr-15
Oct-15
Apr-16
Oct-16
Apr-17
Oct-17
Month-Year
Infr
ingem
ents
per
Month
Red-light Warning Letters Red-light Infringements5 year
after period²
Casualty CrashesCasualty CrashesCasualty CrashesCasualty Crashes 6 7 ↑ 17%
Serious InjuriesSerious InjuriesSerious InjuriesSerious Injuries
FatalitiesFatalitiesFatalitiesFatalities
1 1 ↓ 0%
1 0 ↓ 100%
Pedestrian Casualties
Right Through Casualty Crashes
Adjacent Casualty Crashes
Rear End Casualty Crashes
3
0
1
2
3
1
0
2
↓ 0%
Increase
↓ 100%
↓ 0%
Speeding Infringements
0
100
200
300
400
500
600
700
Apr-11
Oct-11
Apr-12
Oct-12
Apr-13
Oct-13
Apr-14
Oct-14
Apr-15
Oct-15
Apr-16
Oct-16
Apr-17
Oct-17
Month-Year
Infr
ingem
ents
per
Month
Speeding Warning Letters Speeding Infringements
Moderate InjuriesModerate InjuriesModerate InjuriesModerate Injuries 2 3 ↑ 50%
Minor / Other InjuriesMinor / Other InjuriesMinor / Other InjuriesMinor / Other Injuries 4 4 ↓ 0%
¹ Ending 91 days before the start of the warning letter period, 17 January 2011² Ending 31 December 2017
5 years before
installation¹
Total Casualties:Total Casualties:Total Casualties:Total Casualties: 8 ↓ 0%8
Percentage
change
Fatal and Serious CrashesFatal and Serious CrashesFatal and Serious CrashesFatal and Serious Crashes 2 1 ↓ 50%
• The camera at the intersection of Pacific Highway and Hume Street commenced issuing warning letters in April 2011.
Annual NSW Speed Camera Performance Review 2018 - Appendix B: Red-light speed cameras B51

• There is one camera at this intersection.
Casualties and FSI Crashes
0
1
2
3
4
5
6
-5Y -4Y -3Y -2Y -1Y 1Y 2Y 3Y 4YNumber of years before and after camera installation
Casualti
es / C
rashes
Uncategorised M inor/Other M oderate Injury
Serious Injury Killed FSI Crash
7275 Croydon Park - Georges River Road at Croydon Avenue
• The infringement graphs show the number of warning letters and infringements issued at this intersection as well as the trend in infringements since the camera began operation. Roadworks and camera maintenance may influence the number of infringements issued.
Status: Insufficient data (<5 years) to reliably assess.
Casualties and casualty crashes at enforced intersection Infringements at enforced intersection
Red-Light Infringements
0
10
20
30
40
50
60
70
80
90
Aug-13
Dec-13
Apr-14
Aug-14
Dec-14
Apr-15
Aug-15
Dec-15
Apr-16
Aug-16
Dec-16
Apr-17
Aug-17
Dec-17
Month-Year
Infr
ingem
ents
per
Month
Red-light Warning Letters Red-light Infringements4 years and 126
days after installation²
Casualty CrashesCasualty CrashesCasualty CrashesCasualty Crashes 12 6 ↓ 42%
Serious InjuriesSerious InjuriesSerious InjuriesSerious Injuries
FatalitiesFatalitiesFatalitiesFatalities
3 3 ↑ 15%
0 0 -
Pedestrian Casualties
Right Through Casualty Crashes
Adjacent Casualty Crashes
Rear End Casualty Crashes
3
4
5
0
3
0
1
1
↑ 15%
↓ 100%
↓ 77%
Increase
Speeding Infringements
0
50
100
150
200
250
Aug-13
Dec-13
Apr-14
Aug-14
Dec-14
Apr-15
Aug-15
Dec-15
Apr-16
Aug-16
Dec-16
Apr-17
Aug-17
Dec-17
Month-Year
Infr
ingem
ents
per
Month
Speeding Warning Letters Speeding Infringements
Moderate InjuriesModerate InjuriesModerate InjuriesModerate Injuries 5 2 ↓ 54%
Minor / Other InjuriesMinor / Other InjuriesMinor / Other InjuriesMinor / Other Injuries 5 1 ↓ 77%
¹ Ending 91 days before the start of the warning letter period, 28 May 2013² Ending 31 December 2017³ The percentage change is based on annualised crash data to allow for a direct comparison between the pre and post installation time periods. Red values indicate an increase.
5 years before
installation¹
Total Casualties:Total Casualties:Total Casualties:Total Casualties: 6 ↓ 47%13
Percentage
change³
Fatal and Serious CrashesFatal and Serious CrashesFatal and Serious CrashesFatal and Serious Crashes 3 3 ↑ 15%
• The camera at the intersection of Georges River Road and Croydon Avenue commenced issuing warning letters in August 2013.
Annual NSW Speed Camera Performance Review 2018 - Appendix B: Red-light speed cameras B52

• There is one camera at this intersection.
Casualties and FSI Crashes
0
5
10
15
20
-5Y -4Y -3Y -2Y -1Y 2011 2012 2013 2014 2015 2016 2017Number of years before and year after camera installation
Casualti
es / C
rashes
Uncategorised M inor/Other M oderate Injury
Serious Injury Killed FSI Crash
7139 Darlinghurst - Craigend Street at McLachlan Avenue
• The infringement graphs show the number of warning letters and infringements issued at this intersection as well as the trend in infringements since the camera began operation. Roadworks and camera maintenance may influence the number of infringements issued. This location was impacted by major civil works between June and November 2011.
Status: Retain.
Casualties and casualty crashes at enforced intersection Infringements at enforced intersection
Red-Light Infringements
0
100
200
300
400
500
600
700
Aug-10
Feb-11
Aug-11
Feb-12
Aug-12
Feb-13
Aug-13
Feb-14
Aug-14
Feb-15
Aug-15
Feb-16
Aug-16
Feb-17
Aug-17
Month-Year
Infr
ingem
ents
per
Month
Red-light Warning Letters Red-light Infringements5 year
after period²
Casualty CrashesCasualty CrashesCasualty CrashesCasualty Crashes 48 21 ↓ 56%
Serious InjuriesSerious InjuriesSerious InjuriesSerious Injuries
FatalitiesFatalitiesFatalitiesFatalities
13 6 ↓ 54%
0 0 -
Pedestrian Casualties
Right Through Casualty Crashes
Adjacent Casualty Crashes
Rear End Casualty Crashes
0
0
40
2
0
0
12
1
-
-
↓ 70%
↓ 50%
Speeding Infringements
0
500
1000
1500
2000
2500
3000
3500
4000
4500
5000
Aug-10
Feb-11
Aug-11
Feb-12
Aug-12
Feb-13
Aug-13
Feb-14
Aug-14
Feb-15
Aug-15
Feb-16
Aug-16
Feb-17
Aug-17
Month-Year
Infr
ingem
ents
per
Month
Speeding Warning Letters Speeding Infringements
Moderate InjuriesModerate InjuriesModerate InjuriesModerate Injuries 25 12 ↓ 52%
Minor / Other InjuriesMinor / Other InjuriesMinor / Other InjuriesMinor / Other Injuries 31 9 ↓ 71%
¹ Ending 91 days before the start of the warning letter period, 28 May 2010² Ending 31 December 2017
5 years before
installation¹
Total Casualties:Total Casualties:Total Casualties:Total Casualties: 27 ↓ 61%69
Percentage
change
Fatal and Serious CrashesFatal and Serious CrashesFatal and Serious CrashesFatal and Serious Crashes 12 5 ↓ 58%
• The camera at the intersection of Craigend Street and McLachlan Avenue commenced issuing warning letters in August 2010.
Annual NSW Speed Camera Performance Review 2018 - Appendix B: Red-light speed cameras B53

• There are two cameras at this intersection.
Casualties and FSI Crashes
0
2
4
6
8
10
12
14
-5Y -4Y -3Y -2Y -1Y 1Y 2Y 3YNumber of years before and after camera installation
Casualti
es / C
rashes
Uncategorised M inor/Other M oderate Injury
Serious Injury Killed FSI Crash
7302|7318 Darlinghurst - Oxford Street at Crown Street
• The infringement graphs show the number of warning letters and infringements issued at this intersection as well as the trend in infringements since the camera began operation. Roadworks and camera maintenance may influence the number of infringements issued.
Status: Insufficient data (<5 years) to reliably assess.
Casualties and casualty crashes at enforced intersection Infringements at enforced intersection
Red-Light Infringements
0
50
100
150
200
250
300
350
Sep-14
Dec-14
Mar-15
Jun-15
Sep-15
Dec-15
Mar-16
Jun-16
Sep-16
Dec-16
Mar-17
Jun-17
Sep-17
Dec-17
Month-Year
Infr
ingem
ents
per
Month
Red-light Warning Letters Red-light Infringements3 years and 92 days
after installation²
Casualty CrashesCasualty CrashesCasualty CrashesCasualty Crashes 25 12 ↓ 26%
Serious InjuriesSerious InjuriesSerious InjuriesSerious Injuries
FatalitiesFatalitiesFatalitiesFatalities
12 5 ↓ 36%
0 0 -
Pedestrian Casualties
Right Through Casualty Crashes
Adjacent Casualty Crashes
Rear End Casualty Crashes
15
0
0
2
5
0
0
3
↓ 49%
-
-
↑ 131%
Speeding Infringements
0
200
400
600
800
1000
1200
1400
1600
1800
Sep-14
Dec-14
Mar-15
Jun-15
Sep-15
Dec-15
Mar-16
Jun-16
Sep-16
Dec-16
Mar-17
Jun-17
Sep-17
Dec-17
Month-Year
Infr
ingem
ents
per
Month
Speeding Warning Letters Speeding Infringements
Moderate InjuriesModerate InjuriesModerate InjuriesModerate Injuries 18 8 ↓ 32%
Minor / Other InjuriesMinor / Other InjuriesMinor / Other InjuriesMinor / Other Injuries 0 1 Increase
¹ Ending 91 days before the start of the warning letter period, 1 July 2014² Ending 31 December 2017³ The percentage change is based on annualised crash data to allow for a direct comparison between the pre and post installation time periods. Red values indicate an increase.
5 years before
installation¹
Total Casualties:Total Casualties:Total Casualties:Total Casualties: 14 ↓ 28%30
Percentage
change³
Fatal and Serious CrashesFatal and Serious CrashesFatal and Serious CrashesFatal and Serious Crashes 11 5 ↓ 30%
• The camera at the intersection of Oxford Street and Crown Street (westbound) commenced issuing warning letters in September 2014.
• The camera at the intersection of Oxford Street and Crown Street (eastbound) commenced issuing warning letters in August 2015.
Annual NSW Speed Camera Performance Review 2018 - Appendix B: Red-light speed cameras B54

• There is one camera at this intersection. This was previously a wet-film red-light camera location.
Casualties and FSI Crashes
0
1
2
3
4
5
6
7
-5Y -4Y -3Y -2Y -1Y 1Y 2Y 3YNumber of years before and after camera installation
Casualti
es / C
rashes
Uncategorised M inor/Other M oderate Injury
Serious Injury Killed FSI Crash
7296 Darlinghurst - William Street at Crown Street
• The infringement graphs show the number of warning letters and infringements issued at this intersection as well as the trend in infringements since the camera began operation. Roadworks and camera maintenance may influence the number of infringements issued.
Status: Insufficient data (<5 years) to reliably assess.
Casualties and casualty crashes at enforced intersection Infringements at enforced intersection
Red-Light Infringements
0
20
40
60
80
100
120
140
Oct-14
Jan-15
Apr-15
Jul-15
Oct-15
Jan-16
Apr-16
Jul-16
Oct-16
Jan-17
Apr-17
Jul-17
Oct-17
Month-Year
Infr
ingem
ents
per
Month
Red-light Warning Letters Red-light Infringements3 years and 76 days
after installation²
Casualty CrashesCasualty CrashesCasualty CrashesCasualty Crashes 15 5 ↓ 48%
Serious InjuriesSerious InjuriesSerious InjuriesSerious Injuries
FatalitiesFatalitiesFatalitiesFatalities
4 1 ↓ 61%
0 0 -
Pedestrian Casualties
Right Through Casualty Crashes
Adjacent Casualty Crashes
Rear End Casualty Crashes
2
2
4
0
2
0
0
1
↑ 56%
↓ 100%
↓ 100%
Increase
Speeding Infringements
0
500
1000
1500
2000
2500
Oct-14
Jan-15
Apr-15
Jul-15
Oct-15
Jan-16
Apr-16
Jul-16
Oct-16
Jan-17
Apr-17
Jul-17
Oct-17
Month-Year
Infr
ingem
ents
per
Month
Speeding Warning Letters Speeding Infringements
Moderate InjuriesModerate InjuriesModerate InjuriesModerate Injuries 4 2 ↓ 22%
Minor / Other InjuriesMinor / Other InjuriesMinor / Other InjuriesMinor / Other Injuries 8 2 ↓ 61%
¹ Ending 91 days before the start of the warning letter period, 17 July 2014² Ending 31 December 2017³ The percentage change is based on annualised crash data to allow for a direct comparison between the pre and post installation time periods. Red values indicate an increase.
5 years before
installation¹
Total Casualties:Total Casualties:Total Casualties:Total Casualties: 5 ↓ 51%16
Percentage
change³
Fatal and Serious CrashesFatal and Serious CrashesFatal and Serious CrashesFatal and Serious Crashes 4 1 ↓ 61%
• The camera at the intersection of William Street and Crown Street commenced issuing warning letters in October 2014.
Annual NSW Speed Camera Performance Review 2018 - Appendix B: Red-light speed cameras B55

• There is one camera at this intersection.
Casualties and FSI Crashes
0
1
2
3
4
5
6
7
-5Y -4Y -3Y -2Y -1Y 1Y 2Y 3YNumber of years before and after camera installation
Casualti
es / C
rashes
Uncategorised M inor/Other M oderate Injury
Serious Injury Killed FSI Crash
7312 Dean Park - Richmond Road at M7 Motorway southbound on-ramp
• The infringement graphs show the number of warning letters and infringements issued at this intersection as well as the trend in infringements since the camera began operation. Roadworks and camera maintenance may influence the number of infringements issued.
Status: Insufficient data (<5 years) to reliably assess.
Casualties and casualty crashes at enforced intersection Infringements at enforced intersection
Red-Light Infringements
0
50
100
150
200
250
300
Aug-14
Nov-14
Feb-15
May-15
Aug-15
Nov-15
Feb-16
May-16
Aug-16
Nov-16
Feb-17
May-17
Aug-17
Nov-17
Month-Year
Infr
ingem
ents
per
Month
Red-light Warning Letters Red-light Infringements3 years and 126
days after installation²
Casualty CrashesCasualty CrashesCasualty CrashesCasualty Crashes 15 4 ↓ 60%
Serious InjuriesSerious InjuriesSerious InjuriesSerious Injuries
FatalitiesFatalitiesFatalitiesFatalities
6 3 ↓ 25%
0 0 -
Pedestrian Casualties
Right Through Casualty Crashes
Adjacent Casualty Crashes
Rear End Casualty Crashes
0
13
0
0
0
2
0
2
-
↓ 77%
-
Increase
Moderate InjuriesModerate InjuriesModerate InjuriesModerate Injuries 3 0 ↓ 100%
Minor / Other InjuriesMinor / Other InjuriesMinor / Other InjuriesMinor / Other Injuries 9 1 ↓ 83%
¹ Ending 91 days before the start of the warning letter period, 28 May 2014² Ending 31 December 2017³ The percentage change is based on annualised crash data to allow for a direct comparison between the pre and post installation time periods. Red values indicate an increase.
5 years before
installation¹
Total Casualties:Total Casualties:Total Casualties:Total Casualties: 4 ↓ 67%18
Percentage
change³
Fatal and Serious CrashesFatal and Serious CrashesFatal and Serious CrashesFatal and Serious Crashes 5 3 ↓ 10%
• The camera at the intersection of Richmond Road and M7 Motorway on ramp (Southbound) commenced issuing warning letters in August 2014. This camera enforces red-light running only.
Annual NSW Speed Camera Performance Review 2018 - Appendix B: Red-light speed cameras B56

• There is one camera at this intersection. This was previously a wet-film red-light camera location.
Casualties and FSI Crashes
0
1
2
3
4
5
6
7
-5Y -4Y -3Y -2Y -1Y 2012 2013 2014 2015 2016 2017Number of years before and year after camera installation
Casualti
es / C
rashes
Uncategorised M inor/Other M oderate Injury
Serious Injury Killed FSI Crash
7194 Dee Why - Pittwater Road at Harbord Road
• The infringement graphs show the number of warning letters and infringements issued at this intersection as well as the trend in infringements since the camera began operation. Roadworks and camera maintenance may influence the number of infringements issued.
Status: Retain.
Casualties and casualty crashes at enforced intersection Infringements at enforced intersection
Red-Light Infringements
0
100
200
300
400
500
600
700
800
Jun-11
Dec-11
Jun-12
Dec-12
Jun-13
Dec-13
Jun-14
Dec-14
Jun-15
Dec-15
Jun-16
Dec-16
Jun-17
Dec-17
Month-Year
Infr
ingem
ents
per
Month
Red-light Warning Letters Red-light Infringements5 year
after period²
Casualty CrashesCasualty CrashesCasualty CrashesCasualty Crashes 13 12 ↓ 8%
Serious InjuriesSerious InjuriesSerious InjuriesSerious Injuries
FatalitiesFatalitiesFatalitiesFatalities
2 2 ↓ 0%
0 0 -
Pedestrian Casualties
Right Through Casualty Crashes
Adjacent Casualty Crashes
Rear End Casualty Crashes
0
0
1
8
0
2
0
5
-
Increase
↓ 100%
↓ 38%
Speeding Infringements
0
100
200
300
400
500
600
Jun-11
Dec-11
Jun-12
Dec-12
Jun-13
Dec-13
Jun-14
Dec-14
Jun-15
Dec-15
Jun-16
Dec-16
Jun-17
Dec-17
Month-Year
Infr
ingem
ents
per
Month
Speeding Warning Letters Speeding Infringements
Moderate InjuriesModerate InjuriesModerate InjuriesModerate Injuries 2 4 ↑ 100%
Minor / Other InjuriesMinor / Other InjuriesMinor / Other InjuriesMinor / Other Injuries 10 9 ↓ 10%
¹ Ending 91 days before the start of the warning letter period, 28 March 2011² Ending 31 December 2017
5 years before
installation¹
Total Casualties:Total Casualties:Total Casualties:Total Casualties: 15 ↑ 7%14
Percentage
change
Fatal and Serious CrashesFatal and Serious CrashesFatal and Serious CrashesFatal and Serious Crashes 2 2 ↓ 0%
• The camera at the intersection of Pittwater Road and Harbord Road commenced issuing warning letters in June 2011.
Annual NSW Speed Camera Performance Review 2018 - Appendix B: Red-light speed cameras B57

• There is one camera at this intersection.
Casualties and FSI Crashes
0
1
2
3
4
5
6
7
-5Y -4Y -3Y -2Y -1Y 1YNumber of years before and after camera installation
Casualti
es / C
rashes
Uncategorised M inor/Other M oderate Injury
Serious Injury Killed FSI Crash
7330 Drummoyne - Victoria Road at Lyons Road
• The infringement graphs show the number of warning letters and infringements issued at this intersection as well as the trend in infringements since the camera began operation. Roadworks and camera maintenance may influence the number of infringements issued.
Status: Insufficient data (<5 years) to reliably assess.
Casualties and casualty crashes at enforced intersection Infringements at enforced intersection
Red-Light Infringements
0
50
100
150
200
250
300
Oct-16
Nov-16
Dec-16
Jan-17
Feb-17
Mar-17
Apr-17
May-17
Jun-17
Jul-17
Aug-17
Sep-17
Oct-17
Nov-17
Dec-17
Month-Year
Infr
ingem
ents
per
Month
Red-light Warning Letters Red-light Infringements1 year and 85 days
after installation²
Casualty CrashesCasualty CrashesCasualty CrashesCasualty Crashes 15 3 ↓ 19%
Serious InjuriesSerious InjuriesSerious InjuriesSerious Injuries
FatalitiesFatalitiesFatalitiesFatalities
6 0 ↓ 100%
0 0 -
Pedestrian Casualties
Right Through Casualty Crashes
Adjacent Casualty Crashes
Rear End Casualty Crashes
10
1
1
2
1
0
0
2
↓ 59%
↓ 100%
↓ 100%
↑ 306%
Speeding Infringements
0
50
100
150
200
250
300
Oct-16
Nov-16
Dec-16
Jan-17
Feb-17
Mar-17
Apr-17
May-17
Jun-17
Jul-17
Aug-17
Sep-17
Oct-17
Nov-17
Dec-17
Month-Year
Infr
ingem
ents
per
Month
Speeding Warning Letters Speeding Infringements
Moderate InjuriesModerate InjuriesModerate InjuriesModerate Injuries 9 0 ↓ 100%
Minor / Other InjuriesMinor / Other InjuriesMinor / Other InjuriesMinor / Other Injuries 2 3 ↑ 509%
¹ Ending 91 days before the start of the warning letter period, 8 July 2016² Ending 31 December 2017³ The percentage change is based on annualised crash data to allow for a direct comparison between the pre and post installation time periods. Red values indicate an increase.
5 years before
installation¹
Total Casualties:Total Casualties:Total Casualties:Total Casualties: 3 ↓ 28%17
Percentage
change³
Fatal and Serious CrashesFatal and Serious CrashesFatal and Serious CrashesFatal and Serious Crashes 6 0 ↓ 100%
• The camera at the intersection of Victoria Road and Lyons Road commenced issuing warning letters in October 2016.
Annual NSW Speed Camera Performance Review 2018 - Appendix B: Red-light speed cameras B58

• There is one camera at this intersection.
Casualties and FSI Crashes
0
2
4
6
8
-5Y -4Y -3Y -2Y -1Y 1Y 2YNumber of years before and after camera installation
Casualti
es / C
rashes
Uncategorised M inor/Other M oderate Injury
Serious Injury Killed FSI Crash
7319 Eastern Creek - Great Western Highway at Rooty Hill Road South
• The infringement graphs show the number of warning letters and infringements issued at this intersection as well as the trend in infringements since the camera began operation. Roadworks and camera maintenance may influence the number of infringements issued.
Status: Insufficient data (<5 years) to reliably assess.
Casualties and casualty crashes at enforced intersection Infringements at enforced intersection
Red-Light Infringements
0
10
20
30
40
50
60
70
Oct-15
Dec-15
Feb-16
Apr-16
Jun-16
Aug-16
Oct-16
Dec-16
Feb-17
Apr-17
Jun-17
Aug-17
Oct-17
Dec-17
Month-Year
Infr
ingem
ents
per
Month
Red-light Warning Letters Red-light Infringements2 years and 85 days
after installation²
Casualty CrashesCasualty CrashesCasualty CrashesCasualty Crashes 17 8 ↑ 5%
Serious InjuriesSerious InjuriesSerious InjuriesSerious Injuries
FatalitiesFatalitiesFatalitiesFatalities
9 1 ↓ 75%
0 0 -
Pedestrian Casualties
Right Through Casualty Crashes
Adjacent Casualty Crashes
Rear End Casualty Crashes
0
2
3
5
0
0
1
5
-
↓ 100%
↓ 25%
↑ 124%
Speeding Infringements
0
10
20
30
40
50
60
70
80
Oct-15
Dec-15
Feb-16
Apr-16
Jun-16
Aug-16
Oct-16
Dec-16
Feb-17
Apr-17
Jun-17
Aug-17
Oct-17
Dec-17
Month-Year
Infr
ingem
ents
per
Month
Speeding Warning Letters Speeding Infringements
Moderate InjuriesModerate InjuriesModerate InjuriesModerate Injuries 10 3 ↓ 33%
Minor / Other InjuriesMinor / Other InjuriesMinor / Other InjuriesMinor / Other Injuries 6 6 ↑ 124%
¹ Ending 91 days before the start of the warning letter period, 9 July 2015² Ending 31 December 2017³ The percentage change is based on annualised crash data to allow for a direct comparison between the pre and post installation time periods. Red values indicate an increase.
5 years before
installation¹
Total Casualties:Total Casualties:Total Casualties:Total Casualties: 10 ↓ 10%25
Percentage
change³
Fatal and Serious CrashesFatal and Serious CrashesFatal and Serious CrashesFatal and Serious Crashes 9 0 ↓ 100%
• The camera at the intersection of Great Western Highway and Rooty Hill Road South commenced issuing warning letters in October 2015.
Annual NSW Speed Camera Performance Review 2018 - Appendix B: Red-light speed cameras B59

• There is one camera at this intersection. This was previously a wet-film red-light camera location.
Casualties and FSI Crashes
0
2
4
6
8
10
12
-5Y -4Y -3Y -2Y -1Y 2012 2013 2014 2015 2016 2017Number of years before and year after camera installation
Casualti
es / C
rashes
Uncategorised M inor/Other M oderate Injury
Serious Injury Killed FSI Crash
7200 Eastwood - Blaxland Road at May Street
• The infringement graphs show the number of warning letters and infringements issued at this intersection as well as the trend in infringements since the camera began operation. Roadworks and camera maintenance may influence the number of infringements issued.
Status: Retain.
Casualties and casualty crashes at enforced intersection Infringements at enforced intersection
Red-Light Infringements
0
10
20
30
40
50
60
70
80
90
100
Apr-11
Oct-11
Apr-12
Oct-12
Apr-13
Oct-13
Apr-14
Oct-14
Apr-15
Oct-15
Apr-16
Oct-16
Apr-17
Oct-17
Month-Year
Infr
ingem
ents
per
Month
Red-light Warning Letters Red-light Infringements5 year
after period²
Casualty CrashesCasualty CrashesCasualty CrashesCasualty Crashes 12 1 ↓ 92%
Serious InjuriesSerious InjuriesSerious InjuriesSerious Injuries
FatalitiesFatalitiesFatalitiesFatalities
2 1 ↓ 50%
0 0 -
Pedestrian Casualties
Right Through Casualty Crashes
Adjacent Casualty Crashes
Rear End Casualty Crashes
2
7
0
2
0
1
0
0
↓ 100%
↓ 86%
-
↓ 100%
Speeding Infringements
0
100
200
300
400
500
600
700
Apr-11
Oct-11
Apr-12
Oct-12
Apr-13
Oct-13
Apr-14
Oct-14
Apr-15
Oct-15
Apr-16
Oct-16
Apr-17
Oct-17
Month-Year
Infr
ingem
ents
per
Month
Speeding Warning Letters Speeding Infringements
Moderate InjuriesModerate InjuriesModerate InjuriesModerate Injuries 7 0 ↓ 100%
Minor / Other InjuriesMinor / Other InjuriesMinor / Other InjuriesMinor / Other Injuries 9 0 ↓ 100%
¹ Ending 91 days before the start of the warning letter period, 7 January 2011² Ending 31 December 2017
5 years before
installation¹
Total Casualties:Total Casualties:Total Casualties:Total Casualties: 1 ↓ 94%18
Percentage
change
Fatal and Serious CrashesFatal and Serious CrashesFatal and Serious CrashesFatal and Serious Crashes 2 1 ↓ 50%
• The camera at the intersection of Blaxland Road and May Street commenced issuing warning letters in April 2011.
Annual NSW Speed Camera Performance Review 2018 - Appendix B: Red-light speed cameras B60

• There is one camera at this intersection.
Casualties and FSI Crashes
0
2
4
6
8
10
12
-5Y -4Y -3Y -2Y -1Y 1Y 2Y 3YNumber of years before and after camera installation
Casualti
es / C
rashes
Uncategorised M inor/Other M oderate Injury
Serious Injury Killed FSI Crash
7301 Eastwood - Rutledge Street at Shaftsbury Road (school zone)
• The infringement graphs show the number of warning letters and infringements issued at this intersection as well as the trend in infringements since the camera began operation. Roadworks and camera maintenance may influence the number of infringements issued.
Status: Insufficient data (<5 years) to reliably assess.
Casualties and casualty crashes at enforced intersection Infringements at enforced intersection
Red-Light Infringements
0
20
40
60
80
100
120
Jul-14
Oct-14
Jan-15
Apr-15
Jul-15
Oct-15
Jan-16
Apr-16
Jul-16
Oct-16
Jan-17
Apr-17
Jul-17
Oct-17
Month-Year
Infr
ingem
ents
per
Month
Red-light Warning Letters Red-light Infringements3 years and 170
days after installation²
Casualty CrashesCasualty CrashesCasualty CrashesCasualty Crashes 9 1 ↓ 84%
Serious InjuriesSerious InjuriesSerious InjuriesSerious Injuries
FatalitiesFatalitiesFatalitiesFatalities
5 0 ↓ 100%
1 0 ↓ 100%
Pedestrian Casualties
Right Through Casualty Crashes
Adjacent Casualty Crashes
Rear End Casualty Crashes
2
2
3
1
0
1
0
0
↓ 100%
↓ 28%
↓ 100%
↓ 100%
Speeding Infringements
0
50
100
150
200
250
Jul-14
Oct-14
Jan-15
Apr-15
Jul-15
Oct-15
Jan-16
Apr-16
Jul-16
Oct-16
Jan-17
Apr-17
Jul-17
Oct-17
Month-Year
Infr
ingem
ents
per
Month
Speeding Warning Letters Speeding Infringements
Moderate InjuriesModerate InjuriesModerate InjuriesModerate Injuries 4 1 ↓ 64%
Minor / Other InjuriesMinor / Other InjuriesMinor / Other InjuriesMinor / Other Injuries 5 0 ↓ 100%
¹ Ending 91 days before the start of the warning letter period, 14 April 2014² Ending 31 December 2017³ The percentage change is based on annualised crash data to allow for a direct comparison between the pre and post installation time periods. Red values indicate an increase.
5 years before
installation¹
Total Casualties:Total Casualties:Total Casualties:Total Casualties: 1 ↓ 90%15
Percentage
change³
Fatal and Serious CrashesFatal and Serious CrashesFatal and Serious CrashesFatal and Serious Crashes 4 0 ↓ 100%
• The camera at the intersection of Rutledge Street and Shaftsbury Road commenced issuing warning letters in July 2014.
Annual NSW Speed Camera Performance Review 2018 - Appendix B: Red-light speed cameras B61

• There is one camera at this intersection.
Casualties and FSI Crashes
0
1
2
3
4
5
6
-5Y -4Y -3Y -2Y -1Y 1Y 2Y 3YNumber of years before and after camera installation
Casualti
es / C
rashes
Uncategorised M inor/Other M oderate Injury
Serious Injury Killed FSI Crash
7303 Epping - Carlingford Road at Rawson Street
• The infringement graphs show the number of warning letters and infringements issued at this intersection as well as the trend in infringements since the camera began operation. Roadworks and camera maintenance may influence the number of infringements issued.
Status: Insufficient data (<5 years) to reliably assess.
Casualties and casualty crashes at enforced intersection Infringements at enforced intersection
Red-Light Infringements
0
10
20
30
40
50
60
70
80
Aug-14
Nov-14
Feb-15
May-15
Aug-15
Nov-15
Feb-16
May-16
Aug-16
Nov-16
Feb-17
May-17
Aug-17
Nov-17
Month-Year
Infr
ingem
ents
per
Month
Red-light Warning Letters Red-light Infringements3 years and 126
days after installation²
Casualty CrashesCasualty CrashesCasualty CrashesCasualty Crashes 14 6 ↓ 36%
Serious InjuriesSerious InjuriesSerious InjuriesSerious Injuries
FatalitiesFatalitiesFatalitiesFatalities
4 1 ↓ 63%
0 0 -
Pedestrian Casualties
Right Through Casualty Crashes
Adjacent Casualty Crashes
Rear End Casualty Crashes
5
5
1
2
1
0
0
1
↓ 70%
↓ 100%
↓ 100%
↓ 25%
Speeding Infringements
0
2
4
6
8
10
12
14
Aug-14
Nov-14
Feb-15
May-15
Aug-15
Nov-15
Feb-16
May-16
Aug-16
Nov-16
Feb-17
May-17
Aug-17
Nov-17
Month-Year
Infr
ingem
ents
per
Month
Speeding Warning Letters Speeding Infringements
Moderate InjuriesModerate InjuriesModerate InjuriesModerate Injuries 6 3 ↓ 25%
Minor / Other InjuriesMinor / Other InjuriesMinor / Other InjuriesMinor / Other Injuries 5 2 ↓ 40%
¹ Ending 91 days before the start of the warning letter period, 28 May 2014² Ending 31 December 2017³ The percentage change is based on annualised crash data to allow for a direct comparison between the pre and post installation time periods. Red values indicate an increase.
5 years before
installation¹
Total Casualties:Total Casualties:Total Casualties:Total Casualties: 6 ↓ 40%15
Percentage
change³
Fatal and Serious CrashesFatal and Serious CrashesFatal and Serious CrashesFatal and Serious Crashes 4 1 ↓ 63%
• The camera at the intersection of Carlingford Road and Rawson Street commenced issuing warning letters in August 2014.
Annual NSW Speed Camera Performance Review 2018 - Appendix B: Red-light speed cameras B62

• There is one camera at this intersection.
Casualties and FSI Crashes
0
2
4
6
8
10
-5Y -4Y -3Y -2Y -1Y 1Y 2Y 3YNumber of years before and after camera installation
Casualti
es / C
rashes
Uncategorised M inor/Other M oderate Injury
Serious Injury Killed FSI Crash
7298 Ermington - Victoria Road at Spurway Street
• The infringement graphs show the number of warning letters and infringements issued at this intersection as well as the trend in infringements since the camera began operation. Roadworks and camera maintenance may influence the number of infringements issued.
Status: Insufficient data (<5 years) to reliably assess.
Casualties and casualty crashes at enforced intersection Infringements at enforced intersection
Red-Light Infringements
0
10
20
30
40
50
60
70
80
90
100
Aug-14
Nov-14
Feb-15
May-15
Aug-15
Nov-15
Feb-16
May-16
Aug-16
Nov-16
Feb-17
May-17
Aug-17
Nov-17
Month-Year
Infr
ingem
ents
per
Month
Red-light Warning Letters Red-light Infringements3 years and 126
days after installation²
Casualty CrashesCasualty CrashesCasualty CrashesCasualty Crashes 18 13 ↑ 8%
Serious InjuriesSerious InjuriesSerious InjuriesSerious Injuries
FatalitiesFatalitiesFatalitiesFatalities
4 3 ↑ 12%
0 0 -
Pedestrian Casualties
Right Through Casualty Crashes
Adjacent Casualty Crashes
Rear End Casualty Crashes
3
10
2
0
2
3
0
3
↓ 0%
↓ 55%
↓ 100%
Increase
Speeding Infringements
0
5
10
15
20
25
30
Aug-14
Nov-14
Feb-15
May-15
Aug-15
Nov-15
Feb-16
May-16
Aug-16
Nov-16
Feb-17
May-17
Aug-17
Nov-17
Month-Year
Infr
ingem
ents
per
Month
Speeding Warning Letters Speeding Infringements
Moderate InjuriesModerate InjuriesModerate InjuriesModerate Injuries 5 4 ↑ 20%
Minor / Other InjuriesMinor / Other InjuriesMinor / Other InjuriesMinor / Other Injuries 11 6 ↓ 18%
¹ Ending 91 days before the start of the warning letter period, 28 May 2014² Ending 31 December 2017³ The percentage change is based on annualised crash data to allow for a direct comparison between the pre and post installation time periods. Red values indicate an increase.
5 years before
installation¹
Total Casualties:Total Casualties:Total Casualties:Total Casualties: 13 ↓ 3%20
Percentage
change³
Fatal and Serious CrashesFatal and Serious CrashesFatal and Serious CrashesFatal and Serious Crashes 4 3 ↑ 12%
• The camera at the intersection of Victoria Road and Spurway Street commenced issuing warning letters in August 2014.
Annual NSW Speed Camera Performance Review 2018 - Appendix B: Red-light speed cameras B63

• There is one camera at this intersection.
Casualties and FSI Crashes
0
2
4
6
8
10
-5Y -4Y -3Y -2Y -1Y 1YNumber of years before and after camera installation
Casualti
es / C
rashes
Uncategorised M inor/Other M oderate Injury
Serious Injury Killed FSI Crash
7314 Fairfield - Hamilton Road at Sackville Street
• The infringement graphs show the number of warning letters and infringements issued at this intersection as well as the trend in infringements since the camera began operation. Roadworks and camera maintenance may influence the number of infringements issued.
Status: Insufficient data (<5 years) to reliably assess.
Casualties and casualty crashes at enforced intersection Infringements at enforced intersection
Red-Light Infringements
0
10
20
30
40
50
60
70
80
90
Jan-16
Mar-16
May-16
Jul-16
Sep-16
Nov-16
Jan-17
Mar-17
May-17
Jul-17
Sep-17
Nov-17
Month-Year
Infr
ingem
ents
per
Month
Red-light Warning Letters Red-light Infringements1 year and 351 days
after installation²
Casualty CrashesCasualty CrashesCasualty CrashesCasualty Crashes 18 4 ↓ 43%
Serious InjuriesSerious InjuriesSerious InjuriesSerious Injuries
FatalitiesFatalitiesFatalitiesFatalities
4 0 ↓ 100%
0 0 -
Pedestrian Casualties
Right Through Casualty Crashes
Adjacent Casualty Crashes
Rear End Casualty Crashes
2
5
3
3
0
0
0
0
↓ 100%
↓ 100%
↓ 100%
↓ 100%
Speeding Infringements
0
1
2
3
4
5
6
7
Jan-16
Mar-16
May-16
Jul-16
Sep-16
Nov-16
Jan-17
Mar-17
May-17
Jul-17
Sep-17
Nov-17
Month-Year
Infr
ingem
ents
per
Month
Speeding Warning Letters Speeding Infringements
Moderate InjuriesModerate InjuriesModerate InjuriesModerate Injuries 10 1 ↓ 74%
Minor / Other InjuriesMinor / Other InjuriesMinor / Other InjuriesMinor / Other Injuries 12 3 ↓ 36%
¹ Ending 91 days before the start of the warning letter period, 16 October 2015² Ending 31 December 2017³ The percentage change is based on annualised crash data to allow for a direct comparison between the pre and post installation time periods. Red values indicate an increase.
5 years before
installation¹
Total Casualties:Total Casualties:Total Casualties:Total Casualties: 4 ↓ 61%26
Percentage
change³
Fatal and Serious CrashesFatal and Serious CrashesFatal and Serious CrashesFatal and Serious Crashes 4 0 ↓ 100%
• The camera at the intersection of Sackville Street and Hamilton Road commenced issuing warning letters in January 2016.
Annual NSW Speed Camera Performance Review 2018 - Appendix B: Red-light speed cameras B64

• There is one camera at this intersection. This was previously a wet-film red-light camera location.
Casualties and FSI Crashes
0
2
4
6
8
10
-5Y -4Y -3Y -2Y -1Y 2011 2012 2013 2014 2015 2016 2017Number of years before and year after camera installation
Casualti
es / C
rashes
Uncategorised M inor/Other M oderate Injury
Serious Injury Killed FSI Crash
7166 Fairfield - Hamilton Road at The Boulevarde
• The infringement graphs show the number of warning letters and infringements issued at this intersection as well as the trend in infringements since the camera began operation. Roadworks and camera maintenance may influence the number of infringements issued.
Status: Retain.
Casualties and casualty crashes at enforced intersection Infringements at enforced intersection
Red-Light Infringements
0
10
20
30
40
50
60
70
Oct-10
Apr-11
Oct-11
Apr-12
Oct-12
Apr-13
Oct-13
Apr-14
Oct-14
Apr-15
Oct-15
Apr-16
Oct-16
Apr-17
Oct-17
Month-Year
Infr
ingem
ents
per
Month
Red-light Warning Letters Red-light Infringements5 year
after period²
Casualty CrashesCasualty CrashesCasualty CrashesCasualty Crashes 19 8 ↓ 58%
Serious InjuriesSerious InjuriesSerious InjuriesSerious Injuries
FatalitiesFatalitiesFatalitiesFatalities
4 1 ↓ 75%
0 0 -
Pedestrian Casualties
Right Through Casualty Crashes
Adjacent Casualty Crashes
Rear End Casualty Crashes
1
13
2
0
0
5
1
1
↓ 100%
↓ 62%
↓ 50%
Increase
Speeding Infringements
0
50
100
150
200
250
300
Oct-10
Apr-11
Oct-11
Apr-12
Oct-12
Apr-13
Oct-13
Apr-14
Oct-14
Apr-15
Oct-15
Apr-16
Oct-16
Apr-17
Oct-17
Month-Year
Infr
ingem
ents
per
Month
Speeding Warning Letters Speeding Infringements
Moderate InjuriesModerate InjuriesModerate InjuriesModerate Injuries 17 4 ↓ 76%
Minor / Other InjuriesMinor / Other InjuriesMinor / Other InjuriesMinor / Other Injuries 8 5 ↓ 38%
¹ Ending 91 days before the start of the warning letter period, 12 July 2010² Ending 31 December 2017
5 years before
installation¹
Total Casualties:Total Casualties:Total Casualties:Total Casualties: 10 ↓ 66%29
Percentage
change
Fatal and Serious CrashesFatal and Serious CrashesFatal and Serious CrashesFatal and Serious Crashes 4 1 ↓ 75%
• The camera at the intersection of Hamilton Road and The Boulevarde commenced issuing warning letters in October 2010.
Annual NSW Speed Camera Performance Review 2018 - Appendix B: Red-light speed cameras B65

• There is one camera at this intersection.
Casualties and FSI Crashes
0
2
4
6
8
10
12
14
-5Y -4Y -3Y -2Y -1Y 1Y 2Y 3Y 4YNumber of years before and after camera installation
Casualti
es / C
rashes
Uncategorised M inor/Other M oderate Injury
Serious Injury Killed FSI Crash
7279 Fairfield - The Horsley Drive at Polding Street
• The infringement graphs show the number of warning letters and infringements issued at this intersection as well as the trend in infringements since the camera began operation. Roadworks and camera maintenance may influence the number of infringements issued.
Status: Insufficient data (<5 years) to reliably assess.
Casualties and casualty crashes at enforced intersection Infringements at enforced intersection
Red-Light Infringements
0
50
100
150
200
250
300
350
400
450
Sep-13
Jan-14
May-14
Sep-14
Jan-15
May-15
Sep-15
Jan-16
May-16
Sep-16
Jan-17
May-17
Sep-17
Month-Year
Infr
ingem
ents
per
Month
Red-light Warning Letters Red-light Infringements4 years and 96 days
after installation²
Casualty CrashesCasualty CrashesCasualty CrashesCasualty Crashes 27 24 ↑ 4%
Serious InjuriesSerious InjuriesSerious InjuriesSerious Injuries
FatalitiesFatalitiesFatalitiesFatalities
5 3 ↓ 30%
0 0 -
Pedestrian Casualties
Right Through Casualty Crashes
Adjacent Casualty Crashes
Rear End Casualty Crashes
1
15
4
4
1
8
0
8
↑ 17%
↓ 37%
↓ 100%
↑ 135%
Speeding Infringements
0
50
100
150
200
250
300
350
Sep-13
Jan-14
May-14
Sep-14
Jan-15
May-15
Sep-15
Jan-16
May-16
Sep-16
Jan-17
May-17
Sep-17
Month-Year
Infr
ingem
ents
per
Month
Speeding Warning Letters Speeding Infringements
Moderate InjuriesModerate InjuriesModerate InjuriesModerate Injuries 17 7 ↓ 52%
Minor / Other InjuriesMinor / Other InjuriesMinor / Other InjuriesMinor / Other Injuries 15 17 ↑ 33%
¹ Ending 91 days before the start of the warning letter period, 27 June 2013² Ending 31 December 2017³ The percentage change is based on annualised crash data to allow for a direct comparison between the pre and post installation time periods. Red values indicate an increase.
5 years before
installation¹
Total Casualties:Total Casualties:Total Casualties:Total Casualties: 27 ↓ 14%37
Percentage
change³
Fatal and Serious CrashesFatal and Serious CrashesFatal and Serious CrashesFatal and Serious Crashes 5 3 ↓ 30%
• The camera at the intersection of The Horsley Drive and Polding Street commenced issuing warning letters in September 2013.
Annual NSW Speed Camera Performance Review 2018 - Appendix B: Red-light speed cameras B66

• There is one camera at this intersection. This was previously a wet-film red-light camera location.
Casualties and FSI Crashes
0
1
2
3
4
-5Y -4Y -3Y -2Y -1Y 2012 2013 2014 2015 2016 2017Number of years before and year after camera installation
Casualti
es / C
rashes
Uncategorised M inor/Other M oderate Injury
Serious Injury Killed FSI Crash
7219 Figtree - Princes Highway at O'Briens Road
• The infringement graphs show the number of warning letters and infringements issued at this intersection as well as the trend in infringements since the camera began operation. Roadworks and camera maintenance may influence the number of infringements issued.
Status: Retain.
Casualties and casualty crashes at enforced intersection Infringements at enforced intersection
Red-Light Infringements
0
10
20
30
40
50
60
70
80
90
100
Apr-11
Oct-11
Apr-12
Oct-12
Apr-13
Oct-13
Apr-14
Oct-14
Apr-15
Oct-15
Apr-16
Oct-16
Apr-17
Oct-17
Month-Year
Infr
ingem
ents
per
Month
Red-light Warning Letters Red-light Infringements5 year
after period²
Casualty CrashesCasualty CrashesCasualty CrashesCasualty Crashes 7 4 ↓ 43%
Serious InjuriesSerious InjuriesSerious InjuriesSerious Injuries
FatalitiesFatalitiesFatalitiesFatalities
1 0 ↓ 100%
0 0 -
Pedestrian Casualties
Right Through Casualty Crashes
Adjacent Casualty Crashes
Rear End Casualty Crashes
0
2
1
2
0
1
0
3
-
↓ 50%
↓ 100%
↑ 50%
Speeding Infringements
0
50
100
150
200
250
300
Apr-11
Oct-11
Apr-12
Oct-12
Apr-13
Oct-13
Apr-14
Oct-14
Apr-15
Oct-15
Apr-16
Oct-16
Apr-17
Oct-17
Month-Year
Infr
ingem
ents
per
Month
Speeding Warning Letters Speeding Infringements
Moderate InjuriesModerate InjuriesModerate InjuriesModerate Injuries 1 2 ↑ 100%
Minor / Other InjuriesMinor / Other InjuriesMinor / Other InjuriesMinor / Other Injuries 6 4 ↓ 33%
¹ Ending 91 days before the start of the warning letter period, 17 January 2011² Ending 31 December 2017
5 years before
installation¹
Total Casualties:Total Casualties:Total Casualties:Total Casualties: 6 ↓ 25%8
Percentage
change
Fatal and Serious CrashesFatal and Serious CrashesFatal and Serious CrashesFatal and Serious Crashes 1 0 ↓ 100%
• The camera at the intersection of Princes Highway and O'Briens Road commenced issuing warning letters in April 2011.
Annual NSW Speed Camera Performance Review 2018 - Appendix B: Red-light speed cameras B67

• There is one camera at this intersection. This was previously a wet-film red-light camera location.
Casualties and FSI Crashes
0
2
4
6
8
10
-5Y -4Y -3Y -2Y -1Y 2011 2012 2013 2014 2015 2016 2017Number of years before and year after camera installation
Casualti
es / C
rashes
Uncategorised M inor/Other M oderate Injury
Serious Injury Killed FSI Crash
7186 Five Dock - Fairlight Street at Ramsay Road
• The infringement graphs show the number of warning letters and infringements issued at this intersection as well as the trend in infringements since the camera began operation. Roadworks and camera maintenance may influence the number of infringements issued.
Status: Retain and Monitor. The previous wet-film red light camera may have influenced the before period data. Annual traffic counts have increased across NSW.
Casualties and casualty crashes at enforced intersection Infringements at enforced intersection
Red-Light Infringements
0
50
100
150
200
250
Nov-10
May-11
Nov-11
May-12
Nov-12
May-13
Nov-13
May-14
Nov-14
May-15
Nov-15
May-16
Nov-16
May-17
Nov-17
Month-Year
Infr
ingem
ents
per
Month
Red-light Warning Letters Red-light Infringements5 year
after period²
Casualty CrashesCasualty CrashesCasualty CrashesCasualty Crashes 15 20 ↑ 33%
Serious InjuriesSerious InjuriesSerious InjuriesSerious Injuries
FatalitiesFatalitiesFatalitiesFatalities
3 7 ↑ 133%
0 0 -
Pedestrian Casualties
Right Through Casualty Crashes
Adjacent Casualty Crashes
Rear End Casualty Crashes
2
1
6
1
1
1
6
1
↓ 50%
↓ 0%
↓ 0%
↓ 0%
Speeding Infringements
0
0.5
1
1.5
2
2.5
3
3.5
Nov-10
May-11
Nov-11
May-12
Nov-12
May-13
Nov-13
May-14
Nov-14
May-15
Nov-15
May-16
Nov-16
May-17
Nov-17
Month-Year
Infr
ingem
ents
per
Month
Speeding Warning Letters Speeding Infringements
Moderate InjuriesModerate InjuriesModerate InjuriesModerate Injuries 14 8 ↓ 43%
Minor / Other InjuriesMinor / Other InjuriesMinor / Other InjuriesMinor / Other Injuries 4 10 ↑ 150%
¹ Ending 91 days before the start of the warning letter period, 12 August 2010² Ending 31 December 2017
5 years before
installation¹
Total Casualties:Total Casualties:Total Casualties:Total Casualties: 25 ↑ 19%21
Percentage
change
Fatal and Serious CrashesFatal and Serious CrashesFatal and Serious CrashesFatal and Serious Crashes 3 6 ↑ 100%
• The camera at the intersection of Fairlight Street and Ramsay Road commenced issuing warning letters in November 2010.
Annual NSW Speed Camera Performance Review 2018 - Appendix B: Red-light speed cameras B68

• There is one camera at this intersection. This was previously a wet-film red-light camera location.
Casualties and FSI Crashes
0
1
2
3
4
5
6
7
-5Y -4Y -3Y -2Y -1Y 1Y 2Y 3Y 4YNumber of years before and after camera installation
Casualti
es / C
rashes
Uncategorised M inor/Other M oderate Injury
Serious Injury Killed FSI Crash
7241 Five Dock - Parramatta Road at Arlington Street
• The infringement graphs show the number of warning letters and infringements issued at this intersection as well as the trend in infringements since the camera began operation. Roadworks and camera maintenance may influence the number of infringements issued.
Status: Insufficient data (<5 years) to reliably assess.
Casualties and casualty crashes at enforced intersection Infringements at enforced intersection
Red-Light Infringements
0
20
40
60
80
100
120
140
160
180
200
Apr-13
Aug-13
Dec-13
Apr-14
Aug-14
Dec-14
Apr-15
Aug-15
Dec-15
Apr-16
Aug-16
Dec-16
Apr-17
Aug-17
Dec-17
Month-Year
Infr
ingem
ents
per
Month
Red-light Warning Letters Red-light Infringements4 years and 263
days after installation²
Casualty CrashesCasualty CrashesCasualty CrashesCasualty Crashes 13 5 ↓ 59%
Serious InjuriesSerious InjuriesSerious InjuriesSerious Injuries
FatalitiesFatalitiesFatalitiesFatalities
0 1 Increase
0 0 -
Pedestrian Casualties
Right Through Casualty Crashes
Adjacent Casualty Crashes
Rear End Casualty Crashes
2
0
6
3
0
0
2
1
↓ 100%
-
↓ 65%
↓ 65%
Speeding Infringements
0
50
100
150
200
250
300
350
400
Apr-13
Aug-13
Dec-13
Apr-14
Aug-14
Dec-14
Apr-15
Aug-15
Dec-15
Apr-16
Aug-16
Dec-16
Apr-17
Aug-17
Dec-17
Month-Year
Infr
ingem
ents
per
Month
Speeding Warning Letters Speeding Infringements
Moderate InjuriesModerate InjuriesModerate InjuriesModerate Injuries 10 1 ↓ 89%
Minor / Other InjuriesMinor / Other InjuriesMinor / Other InjuriesMinor / Other Injuries 4 4 ↑ 6%
¹ Ending 91 days before the start of the warning letter period, 11 January 2013² Ending 31 December 2017³ The percentage change is based on annualised crash data to allow for a direct comparison between the pre and post installation time periods. Red values indicate an increase.
5 years before
installation¹
Total Casualties:Total Casualties:Total Casualties:Total Casualties: 6 ↓ 55%14
Percentage
change³
Fatal and Serious CrashesFatal and Serious CrashesFatal and Serious CrashesFatal and Serious Crashes 0 1 Increase
• The camera at the intersection of Parramatta Road and Arlington Street commenced issuing warning letters in April 2013.
Annual NSW Speed Camera Performance Review 2018 - Appendix B: Red-light speed cameras B69

• There is one camera at this intersection.
Casualties and FSI Crashes
0
2
4
6
8
10
12
-5Y -4Y -3Y -2Y -1Y 1Y 2Y 3YNumber of years before and after camera installation
Casualti
es / C
rashes
Uncategorised M inor/Other M oderate Injury
Serious Injury Killed FSI Crash
7311 Glenwood - Old Windsor Road at Sunnyholt Road
• The infringement graphs show the number of warning letters and infringements issued at this intersection as well as the trend in infringements since the camera began operation. Roadworks and camera maintenance may influence the number of infringements issued.
Status: Insufficient data (<5 years) to reliably assess.
Casualties and casualty crashes at enforced intersection Infringements at enforced intersection
Red-Light Infringements
0
10
20
30
40
50
60
70
80
90
Aug-14
Nov-14
Feb-15
May-15
Aug-15
Nov-15
Feb-16
May-16
Aug-16
Nov-16
Feb-17
May-17
Aug-17
Nov-17
Month-Year
Infr
ingem
ents
per
Month
Red-light Warning Letters Red-light Infringements3 years and 137
days after installation²
Casualty CrashesCasualty CrashesCasualty CrashesCasualty Crashes 18 10 ↓ 18%
Serious InjuriesSerious InjuriesSerious InjuriesSerious Injuries
FatalitiesFatalitiesFatalitiesFatalities
10 1 ↓ 85%
0 0 -
Pedestrian Casualties
Right Through Casualty Crashes
Adjacent Casualty Crashes
Rear End Casualty Crashes
0
4
3
5
0
0
0
6
-
↓ 100%
↓ 100%
↑ 78%
Speeding Infringements
0
5
10
15
20
25
30
35
40
45
50
Aug-14
Nov-14
Feb-15
May-15
Aug-15
Nov-15
Feb-16
May-16
Aug-16
Nov-16
Feb-17
May-17
Aug-17
Nov-17
Month-Year
Infr
ingem
ents
per
Month
Speeding Warning Letters Speeding Infringements
Moderate InjuriesModerate InjuriesModerate InjuriesModerate Injuries 5 5 ↑ 48%
Minor / Other InjuriesMinor / Other InjuriesMinor / Other InjuriesMinor / Other Injuries 9 5 ↓ 18%
¹ Ending 91 days before the start of the warning letter period, 17 May 2014² Ending 31 December 2017³ The percentage change is based on annualised crash data to allow for a direct comparison between the pre and post installation time periods. Red values indicate an increase.
5 years before
installation¹
Total Casualties:Total Casualties:Total Casualties:Total Casualties: 11 ↓ 32%24
Percentage
change³
Fatal and Serious CrashesFatal and Serious CrashesFatal and Serious CrashesFatal and Serious Crashes 8 1 ↓ 81%
• The camera at the intersection of Old Windsor Road and Sunnyholt Road commenced issuing warning letters in August 2014.
Annual NSW Speed Camera Performance Review 2018 - Appendix B: Red-light speed cameras B70
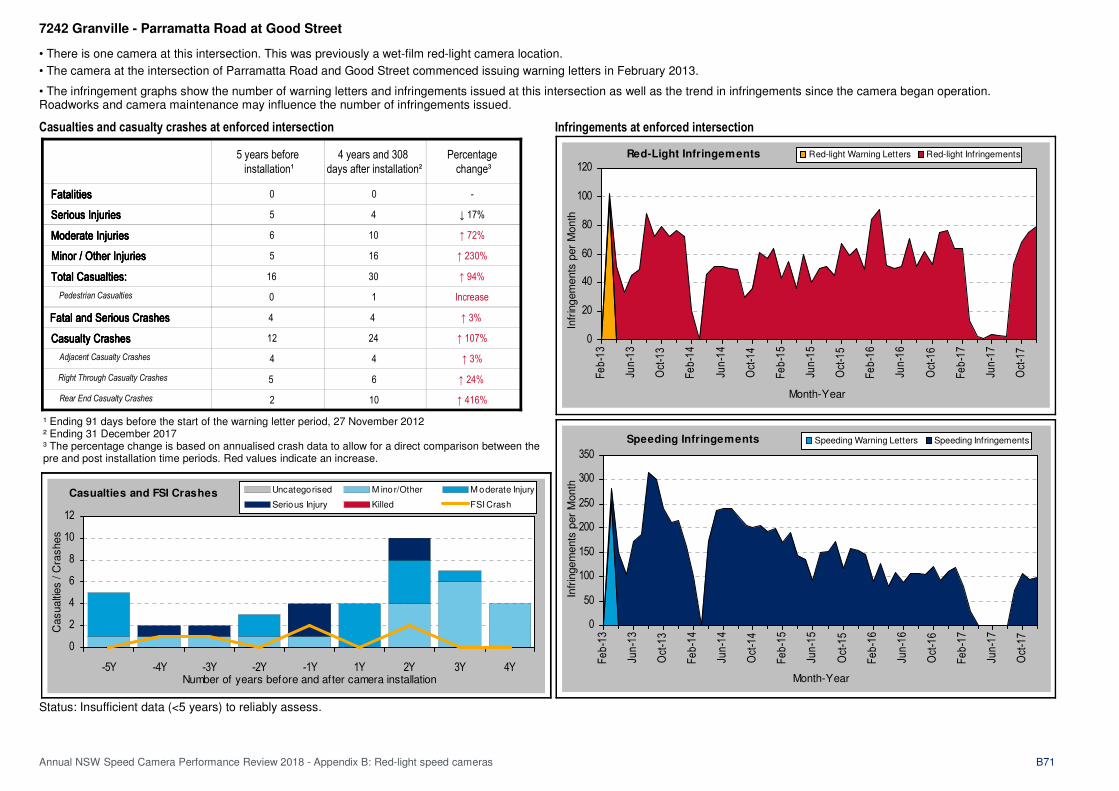
• There is one camera at this intersection. This was previously a wet-film red-light camera location.
Casualties and FSI Crashes
0
2
4
6
8
10
12
-5Y -4Y -3Y -2Y -1Y 1Y 2Y 3Y 4YNumber of years before and after camera installation
Casualti
es / C
rashes
Uncategorised M inor/Other M oderate Injury
Serious Injury Killed FSI Crash
7242 Granville - Parramatta Road at Good Street
• The infringement graphs show the number of warning letters and infringements issued at this intersection as well as the trend in infringements since the camera began operation. Roadworks and camera maintenance may influence the number of infringements issued.
Status: Insufficient data (<5 years) to reliably assess.
Casualties and casualty crashes at enforced intersection Infringements at enforced intersection
Red-Light Infringements
0
20
40
60
80
100
120
Feb-13
Jun-13
Oct-13
Feb-14
Jun-14
Oct-14
Feb-15
Jun-15
Oct-15
Feb-16
Jun-16
Oct-16
Feb-17
Jun-17
Oct-17
Month-Year
Infr
ingem
ents
per
Month
Red-light Warning Letters Red-light Infringements4 years and 308
days after installation²
Casualty CrashesCasualty CrashesCasualty CrashesCasualty Crashes 12 24 ↑ 107%
Serious InjuriesSerious InjuriesSerious InjuriesSerious Injuries
FatalitiesFatalitiesFatalitiesFatalities
5 4 ↓ 17%
0 0 -
Pedestrian Casualties
Right Through Casualty Crashes
Adjacent Casualty Crashes
Rear End Casualty Crashes
0
5
4
2
1
6
4
10
Increase
↑ 24%
↑ 3%
↑ 416%
Speeding Infringements
0
50
100
150
200
250
300
350
Feb-13
Jun-13
Oct-13
Feb-14
Jun-14
Oct-14
Feb-15
Jun-15
Oct-15
Feb-16
Jun-16
Oct-16
Feb-17
Jun-17
Oct-17
Month-Year
Infr
ingem
ents
per
Month
Speeding Warning Letters Speeding Infringements
Moderate InjuriesModerate InjuriesModerate InjuriesModerate Injuries 6 10 ↑ 72%
Minor / Other InjuriesMinor / Other InjuriesMinor / Other InjuriesMinor / Other Injuries 5 16 ↑ 230%
¹ Ending 91 days before the start of the warning letter period, 27 November 2012² Ending 31 December 2017³ The percentage change is based on annualised crash data to allow for a direct comparison between the pre and post installation time periods. Red values indicate an increase.
5 years before
installation¹
Total Casualties:Total Casualties:Total Casualties:Total Casualties: 30 ↑ 94%16
Percentage
change³
Fatal and Serious CrashesFatal and Serious CrashesFatal and Serious CrashesFatal and Serious Crashes 4 4 ↑ 3%
• The camera at the intersection of Parramatta Road and Good Street commenced issuing warning letters in February 2013.
Annual NSW Speed Camera Performance Review 2018 - Appendix B: Red-light speed cameras B71

• There is one camera at this intersection.
Casualties and FSI Crashes
0
2
4
6
8
10
12
14
-5Y -4Y -3Y -2Y -1Y 2011 2012 2013 2014 2015 2016 2017Number of years before and year after camera installation
Casualti
es / C
rashes
Uncategorised M inor/Other M oderate Injury
Serious Injury Killed FSI Crash
7144 Granville - Woodville Road at M4 westbound on-ramp
• The infringement graphs show the number of warning letters and infringements issued at this intersection as well as the trend in infringements since the camera began operation. Roadworks and camera maintenance may influence the number of infringements issued.
Status: Retain.
Casualties and casualty crashes at enforced intersection Infringements at enforced intersection
Red-Light Infringements
0
200
400
600
800
1000
1200
1400
1600
1800
2000
Sep-10
Mar-11
Sep-11
Mar-12
Sep-12
Mar-13
Sep-13
Mar-14
Sep-14
Mar-15
Sep-15
Mar-16
Sep-16
Mar-17
Sep-17
Month-Year
Infr
ingem
ents
per
Month
Red-light Warning Letters Red-light Infringements5 year
after period²
Casualty CrashesCasualty CrashesCasualty CrashesCasualty Crashes 23 21 ↓ 9%
Serious InjuriesSerious InjuriesSerious InjuriesSerious Injuries
FatalitiesFatalitiesFatalitiesFatalities
7 5 ↓ 29%
0 0 -
Pedestrian Casualties
Right Through Casualty Crashes
Adjacent Casualty Crashes
Rear End Casualty Crashes
1
6
6
4
1
1
0
11
↓ 0%
↓ 83%
↓ 100%
↑ 175%
Speeding Infringements
0
50
100
150
200
250
300
350
Sep-10
Mar-11
Sep-11
Mar-12
Sep-12
Mar-13
Sep-13
Mar-14
Sep-14
Mar-15
Sep-15
Mar-16
Sep-16
Mar-17
Sep-17
Month-Year
Infr
ingem
ents
per
Month
Speeding Warning Letters Speeding Infringements
Moderate InjuriesModerate InjuriesModerate InjuriesModerate Injuries 11 7 ↓ 36%
Minor / Other InjuriesMinor / Other InjuriesMinor / Other InjuriesMinor / Other Injuries 18 10 ↓ 44%
¹ Ending 91 days before the start of the warning letter period, 10 June 2010² Ending 31 December 2017
5 years before
installation¹
Total Casualties:Total Casualties:Total Casualties:Total Casualties: 22 ↓ 39%36
Percentage
change
Fatal and Serious CrashesFatal and Serious CrashesFatal and Serious CrashesFatal and Serious Crashes 6 5 ↓ 17%
• The camera at the intersection of Woodville Road and M4 on ramp commenced issuing warning letters in September 2010.
Annual NSW Speed Camera Performance Review 2018 - Appendix B: Red-light speed cameras B72

• There is one camera at this intersection.
Casualties and FSI Crashes
0
2
4
6
8
-5Y -4Y -3Y -2Y -1Y 1Y 2YNumber of years before and after camera installation
Casualti
es / C
rashes
Uncategorised M inor/Other M oderate Injury
Serious Injury Killed FSI Crash
7322 Greenacre - Juno Parade at Roberts Road
• The infringement graphs show the number of warning letters and infringements issued at this intersection as well as the trend in infringements since the camera began operation. Roadworks and camera maintenance may influence the number of infringements issued.
Status: Insufficient data (<5 years) to reliably assess.
Casualties and casualty crashes at enforced intersection Infringements at enforced intersection
Red-Light Infringements
0
20
40
60
80
100
120
140
Jun-15
Aug-15
Oct-15
Dec-15
Feb-16
Apr-16
Jun-16
Aug-16
Oct-16
Dec-16
Feb-17
Apr-17
Jun-17
Aug-17
Oct-17
Dec-17
Month-Year
Infr
ingem
ents
per
Month
Red-light Warning Letters Red-light Infringements2 years and 185
days after installation²
Casualty CrashesCasualty CrashesCasualty CrashesCasualty Crashes 17 7 ↓ 18%
Serious InjuriesSerious InjuriesSerious InjuriesSerious Injuries
FatalitiesFatalitiesFatalitiesFatalities
4 0 ↓ 100%
0 0 -
Pedestrian Casualties
Right Through Casualty Crashes
Adjacent Casualty Crashes
Rear End Casualty Crashes
0
2
2
7
0
1
0
5
-
↓ 0%
↓ 100%
↑ 43%
Speeding Infringements
0
50
100
150
200
250
Jun-15
Aug-15
Oct-15
Dec-15
Feb-16
Apr-16
Jun-16
Aug-16
Oct-16
Dec-16
Feb-17
Apr-17
Jun-17
Aug-17
Oct-17
Dec-17
Month-Year
Infr
ingem
ents
per
Month
Speeding Warning Letters Speeding Infringements
Moderate InjuriesModerate InjuriesModerate InjuriesModerate Injuries 14 2 ↓ 71%
Minor / Other InjuriesMinor / Other InjuriesMinor / Other InjuriesMinor / Other Injuries 7 5 ↑ 43%
¹ Ending 91 days before the start of the warning letter period, 31 March 2015² Ending 31 December 2017³ The percentage change is based on annualised crash data to allow for a direct comparison between the pre and post installation time periods. Red values indicate an increase.
5 years before
installation¹
Total Casualties:Total Casualties:Total Casualties:Total Casualties: 7 ↓ 44%25
Percentage
change³
Fatal and Serious CrashesFatal and Serious CrashesFatal and Serious CrashesFatal and Serious Crashes 4 0 ↓ 100%
• The camera at the intersection of Roberts Road and Juno Parade commenced issuing warning letters in June 2015.
Annual NSW Speed Camera Performance Review 2018 - Appendix B: Red-light speed cameras B73

• There is one camera at this intersection.
Casualties and FSI Crashes
0
5
10
15
20
-5Y -4Y -3Y -2Y -1Y 1YNumber of years before and after camera installation
Casualti
es / C
rashes
Uncategorised M inor/Other M oderate Injury
Serious Injury Killed FSI Crash
7335 Greystanes - Cumberland Highway at Merrylands Road
• The infringement graphs show the number of warning letters and infringements issued at this intersection as well as the trend in infringements since the camera began operation. Roadworks and camera maintenance may influence the number of infringements issued.
Status: Insufficient data (<5 years) to reliably assess.
Casualties and casualty crashes at enforced intersection Infringements at enforced intersection
Red-Light Infringements
0
10
20
30
40
50
60
70
80
90
100
Sep-16
Oct-16
Nov-16
Dec-16
Jan-17
Feb-17
Mar-17
Apr-17
May-17
Jun-17
Jul-17
Aug-17
Sep-17
Oct-17
Nov-17
Dec-17
Month-Year
Infr
ingem
ents
per
Month
Red-light Warning Letters Red-light Infringements1 year and 107 days
after installation²
Casualty CrashesCasualty CrashesCasualty CrashesCasualty Crashes 32 7 ↓ 15%
Serious InjuriesSerious InjuriesSerious InjuriesSerious Injuries
FatalitiesFatalitiesFatalitiesFatalities
10 0 ↓ 100%
0 0 -
Pedestrian Casualties
Right Through Casualty Crashes
Adjacent Casualty Crashes
Rear End Casualty Crashes
0
8
6
10
0
1
0
2
-
↓ 52%
↓ 100%
↓ 23%
Speeding Infringements
0
5
10
15
20
25
30
35
Sep-16
Oct-16
Nov-16
Dec-16
Jan-17
Feb-17
Mar-17
Apr-17
May-17
Jun-17
Jul-17
Aug-17
Sep-17
Oct-17
Nov-17
Dec-17
Month-Year
Infr
ingem
ents
per
Month
Speeding Warning Letters Speeding Infringements
Moderate InjuriesModerate InjuriesModerate InjuriesModerate Injuries 14 3 ↓ 17%
Minor / Other InjuriesMinor / Other InjuriesMinor / Other InjuriesMinor / Other Injuries 20 5 ↓ 3%
¹ Ending 91 days before the start of the warning letter period, 16 June 2016² Ending 31 December 2017³ The percentage change is based on annualised crash data to allow for a direct comparison between the pre and post installation time periods. Red values indicate an increase.
5 years before
installation¹
Total Casualties:Total Casualties:Total Casualties:Total Casualties: 8 ↓ 30%44
Percentage
change³
Fatal and Serious CrashesFatal and Serious CrashesFatal and Serious CrashesFatal and Serious Crashes 9 0 ↓ 100%
• The camera at the intersection of Cumberland Highway and Merrylands Road commenced issuing warning letters in September 2016.
Annual NSW Speed Camera Performance Review 2018 - Appendix B: Red-light speed cameras B74

• There is one camera at this intersection. This was previously a wet-film red-light camera location.
Casualties and FSI Crashes
0
2
4
6
8
10
12
14
-5Y -4Y -3Y -2Y -1Y 2011 2012 2013 2014 2015 2016 2017Number of years before and year after camera installation
Casualti
es / C
rashes
Uncategorised M inor/Other M oderate Injury
Serious Injury Killed FSI Crash
7173 Guildford - Woodville Road at Guildford Road
• The infringement graphs show the number of warning letters and infringements issued at this intersection as well as the trend in infringements since the camera began operation. Roadworks and camera maintenance may influence the number of infringements issued.
Status: Retain.
Casualties and casualty crashes at enforced intersection Infringements at enforced intersection
Red-Light Infringements
0
20
40
60
80
100
120
Nov-10
May-11
Nov-11
May-12
Nov-12
May-13
Nov-13
May-14
Nov-14
May-15
Nov-15
May-16
Nov-16
May-17
Nov-17
Month-Year
Infr
ingem
ents
per
Month
Red-light Warning Letters Red-light Infringements5 year
after period²
Casualty CrashesCasualty CrashesCasualty CrashesCasualty Crashes 21 16 ↓ 24%
Serious InjuriesSerious InjuriesSerious InjuriesSerious Injuries
FatalitiesFatalitiesFatalitiesFatalities
7 4 ↓ 43%
0 0 -
Pedestrian Casualties
Right Through Casualty Crashes
Adjacent Casualty Crashes
Rear End Casualty Crashes
2
3
6
5
1
2
2
9
↓ 50%
↓ 33%
↓ 67%
↑ 80%
Speeding Infringements
0
5
10
15
20
25
30
35
40
Nov-10
May-11
Nov-11
May-12
Nov-12
May-13
Nov-13
May-14
Nov-14
May-15
Nov-15
May-16
Nov-16
May-17
Nov-17
Month-Year
Infr
ingem
ents
per
Month
Speeding Warning Letters Speeding Infringements
Moderate InjuriesModerate InjuriesModerate InjuriesModerate Injuries 14 8 ↓ 43%
Minor / Other InjuriesMinor / Other InjuriesMinor / Other InjuriesMinor / Other Injuries 9 12 ↑ 33%
¹ Ending 91 days before the start of the warning letter period, 12 August 2010² Ending 31 December 2017
5 years before
installation¹
Total Casualties:Total Casualties:Total Casualties:Total Casualties: 24 ↓ 20%30
Percentage
change
Fatal and Serious CrashesFatal and Serious CrashesFatal and Serious CrashesFatal and Serious Crashes 6 3 ↓ 50%
• The camera at the intersection of Woodville Road and Guildford Road commenced issuing warning letters in November 2010.
Annual NSW Speed Camera Performance Review 2018 - Appendix B: Red-light speed cameras B75

• There is one camera at this intersection. This was previously a wet-film red-light camera location.
Casualties and FSI Crashes
0
1
2
3
4
5
6
7
-5Y -4Y -3Y -2Y -1Y 2012 2013 2014 2015 2016 2017Number of years before and year after camera installation
Casualti
es / C
rashes
Uncategorised M inor/Other M oderate Injury
Serious Injury Killed FSI Crash
7171 Haberfield - Dobroyd Parade at Mortley Avenue
• The infringement graphs show the number of warning letters and infringements issued at this intersection as well as the trend in infringements since the camera began operation. Roadworks and camera maintenance may influence the number of infringements issued.
Status: Retain.
Casualties and casualty crashes at enforced intersection Infringements at enforced intersection
Red-Light Infringements
0
50
100
150
200
250
300
Jun-11
Dec-11
Jun-12
Dec-12
Jun-13
Dec-13
Jun-14
Dec-14
Jun-15
Dec-15
Jun-16
Dec-16
Jun-17
Dec-17
Month-Year
Infr
ingem
ents
per
Month
Red-light Warning Letters Red-light Infringements5 year
after period²
Casualty CrashesCasualty CrashesCasualty CrashesCasualty Crashes 9 13 ↑ 44%
Serious InjuriesSerious InjuriesSerious InjuriesSerious Injuries
FatalitiesFatalitiesFatalitiesFatalities
1 0 ↓ 100%
0 0 -
Pedestrian Casualties
Right Through Casualty Crashes
Adjacent Casualty Crashes
Rear End Casualty Crashes
1
4
0
3
0
2
0
10
↓ 100%
↓ 50%
-
↑ 233%
Speeding Infringements
0
200
400
600
800
1000
1200
1400
Jun-11
Dec-11
Jun-12
Dec-12
Jun-13
Dec-13
Jun-14
Dec-14
Jun-15
Dec-15
Jun-16
Dec-16
Jun-17
Dec-17
Month-Year
Infr
ingem
ents
per
Month
Speeding Warning Letters Speeding Infringements
Moderate InjuriesModerate InjuriesModerate InjuriesModerate Injuries 4 5 ↑ 25%
Minor / Other InjuriesMinor / Other InjuriesMinor / Other InjuriesMinor / Other Injuries 5 9 ↑ 80%
¹ Ending 530 days before the start of the warning letter period, 1 January 2010² Ending 31 December 2017
5 years before
installation¹
Total Casualties:Total Casualties:Total Casualties:Total Casualties: 14 ↑ 40%10
Percentage
change
Fatal and Serious CrashesFatal and Serious CrashesFatal and Serious CrashesFatal and Serious Crashes 1 0 ↓ 100%
• The camera at the intersection of Dobroyd Parade and Mortley Avenue commenced issuing warning letters in June 2011.
Annual NSW Speed Camera Performance Review 2018 - Appendix B: Red-light speed cameras B76

• There is one camera at this intersection. This was previously a wet-film red-light camera location.
Casualties and FSI Crashes
0
1
2
3
4
-5Y -4Y -3Y -2Y -1Y 2012 2013 2014 2015 2016 2017Number of years before and year after camera installation
Casualti
es / C
rashes
Uncategorised M inor/Other M oderate Injury
Serious Injury Killed FSI Crash
7210 Haberfield - Parramatta Road at Sloane Street
• The infringement graphs show the number of warning letters and infringements issued at this intersection as well as the trend in infringements since the camera began operation. Roadworks and camera maintenance may influence the number of infringements issued.
Status: Retain and Monitor. The previous wet-film red light camera may have influenced the before period data. Annual traffic counts have increased across NSW.
Casualties and casualty crashes at enforced intersection Infringements at enforced intersection
Red-Light Infringements
0
50
100
150
200
250
Jun-11
Dec-11
Jun-12
Dec-12
Jun-13
Dec-13
Jun-14
Dec-14
Jun-15
Dec-15
Jun-16
Dec-16
Jun-17
Dec-17
Month-Year
Infr
ingem
ents
per
Month
Red-light Warning Letters Red-light Infringements5 year
after period²
Casualty CrashesCasualty CrashesCasualty CrashesCasualty Crashes 5 7 ↑ 40%
Serious InjuriesSerious InjuriesSerious InjuriesSerious Injuries
FatalitiesFatalitiesFatalitiesFatalities
1 2 ↑ 100%
0 0 -
Pedestrian Casualties
Right Through Casualty Crashes
Adjacent Casualty Crashes
Rear End Casualty Crashes
1
0
0
2
1
0
1
3
↓ 0%
-
Increase
↑ 50%
Speeding Infringements
0
200
400
600
800
1000
1200
1400
1600
Jun-11
Dec-11
Jun-12
Dec-12
Jun-13
Dec-13
Jun-14
Dec-14
Jun-15
Dec-15
Jun-16
Dec-16
Jun-17
Dec-17
Month-Year
Infr
ingem
ents
per
Month
Speeding Warning Letters Speeding Infringements
Moderate InjuriesModerate InjuriesModerate InjuriesModerate Injuries 3 2 ↓ 33%
Minor / Other InjuriesMinor / Other InjuriesMinor / Other InjuriesMinor / Other Injuries 3 3 ↓ 0%
¹ Ending 91 days before the start of the warning letter period, 28 March 2011² Ending 31 December 2017
5 years before
installation¹
Total Casualties:Total Casualties:Total Casualties:Total Casualties: 7 ↓ 0%7
Percentage
change
Fatal and Serious CrashesFatal and Serious CrashesFatal and Serious CrashesFatal and Serious Crashes 1 2 ↑ 100%
• The camera at the intersection of Parramatta Road and Sloane Street commenced issuing warning letters in June 2011.
Annual NSW Speed Camera Performance Review 2018 - Appendix B: Red-light speed cameras B77

• There is one camera at this intersection.
Casualties and FSI Crashes
0
2
4
6
8
10
12
-5Y -4Y -3Y -2Y -1Y 1Y 2Y 3Y 4YNumber of years before and after camera installation
Casualti
es / C
rashes
Uncategorised M inor/Other M oderate Injury
Serious Injury Killed FSI Crash
7240 Haberfield - Ramsay Street at Wattle Street
• The infringement graphs show the number of warning letters and infringements issued at this intersection as well as the trend in infringements since the camera began operation. Roadworks and camera maintenance may influence the number of infringements issued.
Status: Insufficient data (<5 years) to reliably assess.
Casualties and casualty crashes at enforced intersection Infringements at enforced intersection
Red-Light Infringements
0
20
40
60
80
100
120
140
160
Feb-13
Jun-13
Oct-13
Feb-14
Jun-14
Oct-14
Feb-15
Jun-15
Oct-15
Feb-16
Jun-16
Oct-16
Feb-17
Jun-17
Oct-17
Month-Year
Infr
ingem
ents
per
Month
Red-light Warning Letters Red-light Infringements4 years and 308
days after installation²
Casualty CrashesCasualty CrashesCasualty CrashesCasualty Crashes 15 9 ↓ 38%
Serious InjuriesSerious InjuriesSerious InjuriesSerious Injuries
FatalitiesFatalitiesFatalitiesFatalities
2 1 ↓ 48%
0 0 -
Pedestrian Casualties
Right Through Casualty Crashes
Adjacent Casualty Crashes
Rear End Casualty Crashes
0
0
11
2
0
0
3
5
-
-
↓ 72%
↑ 158%
Speeding Infringements
0
1
2
3
4
5
6
7
8
9
Feb-13
Jun-13
Oct-13
Feb-14
Jun-14
Oct-14
Feb-15
Jun-15
Oct-15
Feb-16
Jun-16
Oct-16
Feb-17
Jun-17
Oct-17
Month-Year
Infr
ingem
ents
per
Month
Speeding Warning Letters Speeding Infringements
Moderate InjuriesModerate InjuriesModerate InjuriesModerate Injuries 16 1 ↓ 94%
Minor / Other InjuriesMinor / Other InjuriesMinor / Other InjuriesMinor / Other Injuries 4 7 ↑ 81%
¹ Ending 91 days before the start of the warning letter period, 27 November 2012² Ending 31 December 2017³ The percentage change is based on annualised crash data to allow for a direct comparison between the pre and post installation time periods. Red values indicate an increase.
5 years before
installation¹
Total Casualties:Total Casualties:Total Casualties:Total Casualties: 9 ↓ 58%22
Percentage
change³
Fatal and Serious CrashesFatal and Serious CrashesFatal and Serious CrashesFatal and Serious Crashes 2 1 ↓ 48%
• The camera at the intersection of Ramsay Street and Wattle Street commenced issuing warning letters in February 2013.
Annual NSW Speed Camera Performance Review 2018 - Appendix B: Red-light speed cameras B78

• There is one camera at this intersection. This was previously a wet-film red-light camera location.
Casualties and FSI Crashes
0
1
2
3
4
-5Y -4Y -3Y -2Y -1Y 2012 2013 2014 2015 2016 2017Number of years before and year after camera installation
Casualti
es / C
rashes
Uncategorised M inor/Other M oderate Injury
Serious Injury Killed FSI Crash
7215 Hamilton - Tudor Street at Beaumont Street
• The infringement graphs show the number of warning letters and infringements issued at this intersection as well as the trend in infringements since the camera began operation. Roadworks and camera maintenance may influence the number of infringements issued.
Status: Retain.
Casualties and casualty crashes at enforced intersection Infringements at enforced intersection
Red-Light Infringements
0
20
40
60
80
100
120
140
Jun-11
Dec-11
Jun-12
Dec-12
Jun-13
Dec-13
Jun-14
Dec-14
Jun-15
Dec-15
Jun-16
Dec-16
Jun-17
Dec-17
Month-Year
Infr
ingem
ents
per
Month
Red-light Warning Letters Red-light Infringements5 year
after period²
Casualty CrashesCasualty CrashesCasualty CrashesCasualty Crashes 6 0 ↓ 100%
Serious InjuriesSerious InjuriesSerious InjuriesSerious Injuries
FatalitiesFatalitiesFatalitiesFatalities
0 0 -
0 0 -
Pedestrian Casualties
Right Through Casualty Crashes
Adjacent Casualty Crashes
Rear End Casualty Crashes
1
1
1
2
0
0
0
0
↓ 100%
↓ 100%
↓ 100%
↓ 100%
Speeding Infringements
0
20
40
60
80
100
120
140
Jun-11
Dec-11
Jun-12
Dec-12
Jun-13
Dec-13
Jun-14
Dec-14
Jun-15
Dec-15
Jun-16
Dec-16
Jun-17
Dec-17
Month-Year
Infr
ingem
ents
per
Month
Speeding Warning Letters Speeding Infringements
Moderate InjuriesModerate InjuriesModerate InjuriesModerate Injuries 3 0 ↓ 100%
Minor / Other InjuriesMinor / Other InjuriesMinor / Other InjuriesMinor / Other Injuries 4 0 ↓ 100%
¹ Ending 91 days before the start of the warning letter period, 28 March 2011² Ending 31 December 2017
5 years before
installation¹
Total Casualties:Total Casualties:Total Casualties:Total Casualties: 0 ↓ 100%7
Percentage
change
Fatal and Serious CrashesFatal and Serious CrashesFatal and Serious CrashesFatal and Serious Crashes 0 0 -
• The camera at the intersection of Tudor Street and Beaumont Street commenced issuing warning letters in June 2011.
Annual NSW Speed Camera Performance Review 2018 - Appendix B: Red-light speed cameras B79

• There is one camera at this intersection.
Casualties and FSI Crashes
0
2
4
6
8
-5Y -4Y -3Y -2Y -1Y 2012 2013 2014 2015 2016 2017Number of years before and year after camera installation
Casualti
es / C
rashes
Uncategorised M inor/Other M oderate Injury
Serious Injury Killed FSI Crash
7212 Hamilton East - Pacific Highway at Parry Street
• The infringement graphs show the number of warning letters and infringements issued at this intersection as well as the trend in infringements since the camera began operation. Roadworks and camera maintenance may influence the number of infringements issued.
Status: Retain.
Casualties and casualty crashes at enforced intersection Infringements at enforced intersection
Red-Light Infringements
0
20
40
60
80
100
120
140
160
180
Jun-11
Dec-11
Jun-12
Dec-12
Jun-13
Dec-13
Jun-14
Dec-14
Jun-15
Dec-15
Jun-16
Dec-16
Jun-17
Dec-17
Month-Year
Infr
ingem
ents
per
Month
Red-light Warning Letters Red-light Infringements5 year
after period²
Casualty CrashesCasualty CrashesCasualty CrashesCasualty Crashes 12 7 ↓ 42%
Serious InjuriesSerious InjuriesSerious InjuriesSerious Injuries
FatalitiesFatalitiesFatalitiesFatalities
2 1 ↓ 50%
0 0 -
Pedestrian Casualties
Right Through Casualty Crashes
Adjacent Casualty Crashes
Rear End Casualty Crashes
0
1
5
3
1
2
0
2
Increase
↑ 100%
↓ 100%
↓ 33%
Speeding Infringements
0
20
40
60
80
100
120
140
160
180
Jun-11
Dec-11
Jun-12
Dec-12
Jun-13
Dec-13
Jun-14
Dec-14
Jun-15
Dec-15
Jun-16
Dec-16
Jun-17
Dec-17
Month-Year
Infr
ingem
ents
per
Month
Speeding Warning Letters Speeding Infringements
Moderate InjuriesModerate InjuriesModerate InjuriesModerate Injuries 3 6 ↑ 100%
Minor / Other InjuriesMinor / Other InjuriesMinor / Other InjuriesMinor / Other Injuries 10 5 ↓ 50%
¹ Ending 91 days before the start of the warning letter period, 30 March 2011² Ending 31 December 2017
5 years before
installation¹
Total Casualties:Total Casualties:Total Casualties:Total Casualties: 12 ↓ 20%15
Percentage
change
Fatal and Serious CrashesFatal and Serious CrashesFatal and Serious CrashesFatal and Serious Crashes 2 1 ↓ 50%
• The camera at the intersection of Pacific Highway and Parry Street commenced issuing warning letters in June 2011.
Annual NSW Speed Camera Performance Review 2018 - Appendix B: Red-light speed cameras B80

• There are two cameras at this intersection.
Casualties and FSI Crashes
0
2
4
6
8
10
12
14
-5Y -4Y -3Y -2Y -1Y 1Y 2Y 3Y 4YNumber of years before and after camera installation
Casualti
es / C
rashes
Uncategorised M inor/Other M oderate Injury
Serious Injury Killed FSI Crash
7243|7244 Haymarket - George Street at Pitt Street / Quay Street
• The infringement graphs show the number of warning letters and infringements issued at this intersection as well as the trend in infringements since the camera began operation. Roadworks and camera maintenance may influence the number of infringements issued.
Status: Insufficient data (<5 years) to reliably assess.
Casualties and casualty crashes at enforced intersection Infringements at enforced intersection
Red-Light Infringements
0
200
400
600
800
1000
1200
1400
1600
1800
Jun-13
Oct-13
Feb-14
Jun-14
Oct-14
Feb-15
Jun-15
Oct-15
Feb-16
Jun-16
Oct-16
Feb-17
Jun-17
Oct-17
Month-Year
Infr
ingem
ents
per
Month
Red-light Warning Letters Red-light Infringements4 years and 192
days after installation²
Casualty CrashesCasualty CrashesCasualty CrashesCasualty Crashes 33 20 ↓ 33%
Serious InjuriesSerious InjuriesSerious InjuriesSerious Injuries
FatalitiesFatalitiesFatalitiesFatalities
7 5 ↓ 21%
0 0 -
Pedestrian Casualties
Right Through Casualty Crashes
Adjacent Casualty Crashes
Rear End Casualty Crashes
15
2
4
3
5
1
4
3
↓ 63%
↓ 45%
↑ 10%
↑ 10%
Speeding Infringements
0
100
200
300
400
500
600
700
800
900
1000
Jun-13
Oct-13
Feb-14
Jun-14
Oct-14
Feb-15
Jun-15
Oct-15
Feb-16
Jun-16
Oct-16
Feb-17
Jun-17
Oct-17
Month-Year
Infr
ingem
ents
per
Month
Speeding Warning Letters Speeding Infringements
Moderate InjuriesModerate InjuriesModerate InjuriesModerate Injuries 17 11 ↓ 29%
Minor / Other InjuriesMinor / Other InjuriesMinor / Other InjuriesMinor / Other Injuries 15 8 ↓ 41%
¹ Ending 91 days before the start of the warning letter period, 23 March 2013² Ending 31 December 2017³ The percentage change is based on annualised crash data to allow for a direct comparison between the pre and post installation time periods. Red values indicate an increase.
5 years before
installation¹
Total Casualties:Total Casualties:Total Casualties:Total Casualties: 24 ↓ 32%39
Percentage
change³
Fatal and Serious CrashesFatal and Serious CrashesFatal and Serious CrashesFatal and Serious Crashes 7 5 ↓ 21%
• Both cameras at the intersection of George Street and Pitt Street commenced issuing warning letters in June 2013.
Annual NSW Speed Camera Performance Review 2018 - Appendix B: Red-light speed cameras B81

• There is one camera at this intersection.
Casualties and FSI Crashes
0
1
2
3
4
5
6
7
-5Y -4Y -3Y -2Y -1Y 1YNumber of years before and after camera installation
Casualti
es / C
rashes
Uncategorised M inor/Other M oderate Injury
Serious Injury Killed FSI Crash
7326 Homebush West - Homebush Bay Drive at M4 eastbound on-ramp
• The infringement graphs show the number of warning letters and infringements issued at this intersection as well as the trend in infringements since the camera began operation. Roadworks and camera maintenance may influence the number of infringements issued.
Status: Insufficient data (<5 years) to reliably assess.
Casualties and casualty crashes at enforced intersection Infringements at enforced intersection
Red-Light Infringements
0
5
10
15
20
25
30
35
Apr-16
Jun-16
Aug-16
Oct-16
Dec-16
Feb-17
Apr-17
Jun-17
Aug-17
Oct-17
Dec-17
Month-Year
Infr
ingem
ents
per
Month
Red-light Warning Letters Red-light Infringements1 year and 262 days
after installation²
Casualty CrashesCasualty CrashesCasualty CrashesCasualty Crashes 10 3 ↓ 13%
Serious InjuriesSerious InjuriesSerious InjuriesSerious Injuries
FatalitiesFatalitiesFatalitiesFatalities
0 0 -
0 0 -
Pedestrian Casualties
Right Through Casualty Crashes
Adjacent Casualty Crashes
Rear End Casualty Crashes
0
6
0
3
0
0
0
2
-
↓ 100%
-
↑ 94%
Speeding Infringements
0
50
100
150
200
250
300
350
400
450
500
Apr-16
Jun-16
Aug-16
Oct-16
Dec-16
Feb-17
Apr-17
Jun-17
Aug-17
Oct-17
Dec-17
Month-Year
Infr
ingem
ents
per
Month
Speeding Warning Letters Speeding Infringements
Moderate InjuriesModerate InjuriesModerate InjuriesModerate Injuries 4 0 ↓ 100%
Minor / Other InjuriesMinor / Other InjuriesMinor / Other InjuriesMinor / Other Injuries 9 3 ↓ 3%
¹ Ending 91 days before the start of the warning letter period, 13 January 2016² Ending 31 December 2017³ The percentage change is based on annualised crash data to allow for a direct comparison between the pre and post installation time periods. Red values indicate an increase.
5 years before
installation¹
Total Casualties:Total Casualties:Total Casualties:Total Casualties: 3 ↓ 33%13
Percentage
change³
Fatal and Serious CrashesFatal and Serious CrashesFatal and Serious CrashesFatal and Serious Crashes 0 0 -
• The camera at the intersection of Homebush Bay Drive and M4 Western Motorway On-ramp (Eastbound) commenced issuing warning letters in April 2016.
Annual NSW Speed Camera Performance Review 2018 - Appendix B: Red-light speed cameras B82

• There is one camera at this intersection. This was previously a wet-film red-light camera location.
Casualties and FSI Crashes
0
2
4
6
8
10
-5Y -4Y -3Y -2Y -1Y 2012 2013 2014 2015 2016 2017Number of years before and year after camera installation
Casualti
es / C
rashes
Uncategorised M inor/Other M oderate Injury
Serious Injury Killed FSI Crash
7204 Hunters Hill - Ryde Road at Pittwater Road
• The infringement graphs show the number of warning letters and infringements issued at this intersection as well as the trend in infringements since the camera began operation. Roadworks and camera maintenance may influence the number of infringements issued.
Status: Retain.
Casualties and casualty crashes at enforced intersection Infringements at enforced intersection
Red-Light Infringements
0
10
20
30
40
50
60
70
Mar-11
Sep-11
Mar-12
Sep-12
Mar-13
Sep-13
Mar-14
Sep-14
Mar-15
Sep-15
Mar-16
Sep-16
Mar-17
Sep-17
Month-Year
Infr
ingem
ents
per
Month
Red-light Warning Letters Red-light Infringements5 year
after period²
Casualty CrashesCasualty CrashesCasualty CrashesCasualty Crashes 10 8 ↓ 20%
Serious InjuriesSerious InjuriesSerious InjuriesSerious Injuries
FatalitiesFatalitiesFatalitiesFatalities
3 3 ↓ 0%
0 0 -
Pedestrian Casualties
Right Through Casualty Crashes
Adjacent Casualty Crashes
Rear End Casualty Crashes
0
8
0
2
1
3
1
3
Increase
↓ 63%
Increase
↑ 50%
Speeding Infringements
0
10
20
30
40
50
60
70
80
Mar-11
Sep-11
Mar-12
Sep-12
Mar-13
Sep-13
Mar-14
Sep-14
Mar-15
Sep-15
Mar-16
Sep-16
Mar-17
Sep-17
Month-Year
Infr
ingem
ents
per
Month
Speeding Warning Letters Speeding Infringements
Moderate InjuriesModerate InjuriesModerate InjuriesModerate Injuries 7 6 ↓ 14%
Minor / Other InjuriesMinor / Other InjuriesMinor / Other InjuriesMinor / Other Injuries 4 3 ↓ 25%
¹ Ending 91 days before the start of the warning letter period, 17 December 2010² Ending 31 December 2017
5 years before
installation¹
Total Casualties:Total Casualties:Total Casualties:Total Casualties: 12 ↓ 14%14
Percentage
change
Fatal and Serious CrashesFatal and Serious CrashesFatal and Serious CrashesFatal and Serious Crashes 3 3 ↓ 0%
• The camera at the intersection of Ryde Road and Pittwater Road commenced issuing warning letters in March 2011.
Annual NSW Speed Camera Performance Review 2018 - Appendix B: Red-light speed cameras B83

• There is one camera at this intersection. This was previously a wet-film red-light camera location.
Casualties and FSI Crashes
0
1
2
3
4
5
6
7
-5Y -4Y -3Y -2Y -1Y 2012 2013 2014 2015 2016 2017Number of years before and year after camera installation
Casualti
es / C
rashes
Uncategorised M inor/Other M oderate Injury
Serious Injury Killed FSI Crash
7208 Kensington - Anzac Parade at Todman Avenue
• The infringement graphs show the number of warning letters and infringements issued at this intersection as well as the trend in infringements since the camera began operation. Roadworks and camera maintenance may influence the number of infringements issued.
Status: Retain and Monitor. The previous wet-film red light camera may have influenced the before period data. Annual traffic counts have increased across NSW.
Casualties and casualty crashes at enforced intersection Infringements at enforced intersection
Red-Light Infringements
0
50
100
150
200
250
300
350
400
Jun-11
Dec-11
Jun-12
Dec-12
Jun-13
Dec-13
Jun-14
Dec-14
Jun-15
Dec-15
Jun-16
Dec-16
Jun-17
Dec-17
Month-Year
Infr
ingem
ents
per
Month
Red-light Warning Letters Red-light Infringements5 year
after period²
Casualty CrashesCasualty CrashesCasualty CrashesCasualty Crashes 13 10 ↓ 23%
Serious InjuriesSerious InjuriesSerious InjuriesSerious Injuries
FatalitiesFatalitiesFatalitiesFatalities
0 2 Increase
0 0 -
Pedestrian Casualties
Right Through Casualty Crashes
Adjacent Casualty Crashes
Rear End Casualty Crashes
4
3
2
3
0
4
2
0
↓ 100%
↑ 33%
↓ 0%
↓ 100%
Speeding Infringements
0
10
20
30
40
50
60
Jun-11
Dec-11
Jun-12
Dec-12
Jun-13
Dec-13
Jun-14
Dec-14
Jun-15
Dec-15
Jun-16
Dec-16
Jun-17
Dec-17
Month-Year
Infr
ingem
ents
per
Month
Speeding Warning Letters Speeding Infringements
Moderate InjuriesModerate InjuriesModerate InjuriesModerate Injuries 10 6 ↓ 40%
Minor / Other InjuriesMinor / Other InjuriesMinor / Other InjuriesMinor / Other Injuries 6 3 ↓ 50%
¹ Ending 91 days before the start of the warning letter period, 30 March 2011² Ending 31 December 2017
5 years before
installation¹
Total Casualties:Total Casualties:Total Casualties:Total Casualties: 11 ↓ 31%16
Percentage
change
Fatal and Serious CrashesFatal and Serious CrashesFatal and Serious CrashesFatal and Serious Crashes 0 2 Increase
• The camera at the intersection of Anzac Parade and Todman Avenue commenced issuing warning letters in June 2011.
Annual NSW Speed Camera Performance Review 2018 - Appendix B: Red-light speed cameras B84

• There is one camera at this intersection. This was previously a wet-film red-light camera location.
Casualties and FSI Crashes
0
2
4
6
8
-5Y -4Y -3Y -2Y -1Y 2012 2013 2014 2015 2016 2017Number of years before and year after camera installation
Casualti
es / C
rashes
Uncategorised M inor/Other M oderate Injury
Serious Injury Killed FSI Crash
7206 Kingsgrove - Bexley Road at William Street
• The infringement graphs show the number of warning letters and infringements issued at this intersection as well as the trend in infringements since the camera began operation. Roadworks and camera maintenance may influence the number of infringements issued.
Status: Retain.
Casualties and casualty crashes at enforced intersection Infringements at enforced intersection
Red-Light Infringements
0
5
10
15
20
25
30
35
40
45
50
Apr-11
Oct-11
Apr-12
Oct-12
Apr-13
Oct-13
Apr-14
Oct-14
Apr-15
Oct-15
Apr-16
Oct-16
Apr-17
Oct-17
Month-Year
Infr
ingem
ents
per
Month
Red-light Warning Letters Red-light Infringements5 year
after period²
Casualty CrashesCasualty CrashesCasualty CrashesCasualty Crashes 16 13 ↓ 19%
Serious InjuriesSerious InjuriesSerious InjuriesSerious Injuries
FatalitiesFatalitiesFatalitiesFatalities
4 1 ↓ 75%
0 0 -
Pedestrian Casualties
Right Through Casualty Crashes
Adjacent Casualty Crashes
Rear End Casualty Crashes
0
10
1
3
0
5
1
5
-
↓ 50%
↓ 0%
↑ 67%
Speeding Infringements
0
50
100
150
200
250
300
350
Apr-11
Oct-11
Apr-12
Oct-12
Apr-13
Oct-13
Apr-14
Oct-14
Apr-15
Oct-15
Apr-16
Oct-16
Apr-17
Oct-17
Month-Year
Infr
ingem
ents
per
Month
Speeding Warning Letters Speeding Infringements
Moderate InjuriesModerate InjuriesModerate InjuriesModerate Injuries 14 5 ↓ 64%
Minor / Other InjuriesMinor / Other InjuriesMinor / Other InjuriesMinor / Other Injuries 3 9 ↑ 200%
¹ Ending 91 days before the start of the warning letter period, 10 January 2011² Ending 31 December 2017
5 years before
installation¹
Total Casualties:Total Casualties:Total Casualties:Total Casualties: 15 ↓ 29%21
Percentage
change
Fatal and Serious CrashesFatal and Serious CrashesFatal and Serious CrashesFatal and Serious Crashes 4 1 ↓ 75%
• The camera at the intersection of Bexley Road and William Street commenced issuing warning letters in April 2011.
Annual NSW Speed Camera Performance Review 2018 - Appendix B: Red-light speed cameras B85

• There is one camera at this intersection.
Casualties and FSI Crashes
0
1
2
3
4
5
6
-5Y -4Y -3Y -2Y -1Y 1Y 2Y 3Y 4YNumber of years before and after camera installation
Casualti
es / C
rashes
Uncategorised M inor/Other M oderate Injury
Serious Injury Killed FSI Crash
7278 Kingsgrove - Kingsgrove Road at Forsyth Street
• The infringement graphs show the number of warning letters and infringements issued at this intersection as well as the trend in infringements since the camera began operation. Roadworks and camera maintenance may influence the number of infringements issued.
Status: Insufficient data (<5 years) to reliably assess.
Casualties and casualty crashes at enforced intersection Infringements at enforced intersection
Red-Light Infringements
0
50
100
150
200
250
Nov-13
Feb-14
May-14
Aug-14
Nov-14
Feb-15
May-15
Aug-15
Nov-15
Feb-16
May-16
Aug-16
Nov-16
Feb-17
May-17
Aug-17
Nov-17
Month-Year
Infr
ingem
ents
per
Month
Red-light Warning Letters Red-light Infringements4 years and 46 days
after installation²
Casualty CrashesCasualty CrashesCasualty CrashesCasualty Crashes 12 2 ↓ 80%
Serious InjuriesSerious InjuriesSerious InjuriesSerious Injuries
FatalitiesFatalitiesFatalitiesFatalities
1 0 ↓ 100%
0 0 -
Pedestrian Casualties
Right Through Casualty Crashes
Adjacent Casualty Crashes
Rear End Casualty Crashes
1
2
7
1
0
0
2
0
↓ 100%
↓ 100%
↓ 65%
↓ 100%
Speeding Infringements
0
50
100
150
200
250
300
350
Nov-13
Feb-14
May-14
Aug-14
Nov-14
Feb-15
May-15
Aug-15
Nov-15
Feb-16
May-16
Aug-16
Nov-16
Feb-17
May-17
Aug-17
Nov-17
Month-Year
Infr
ingem
ents
per
Month
Speeding Warning Letters Speeding Infringements
Moderate InjuriesModerate InjuriesModerate InjuriesModerate Injuries 8 1 ↓ 85%
Minor / Other InjuriesMinor / Other InjuriesMinor / Other InjuriesMinor / Other Injuries 5 1 ↓ 76%
¹ Ending 91 days before the start of the warning letter period, 16 August 2013² Ending 31 December 2017³ The percentage change is based on annualised crash data to allow for a direct comparison between the pre and post installation time periods. Red values indicate an increase.
5 years before
installation¹
Total Casualties:Total Casualties:Total Casualties:Total Casualties: 2 ↓ 83%14
Percentage
change³
Fatal and Serious CrashesFatal and Serious CrashesFatal and Serious CrashesFatal and Serious Crashes 1 0 ↓ 100%
• The camera at the intersection of Kingsgrove Road and Forsyth Street commenced issuing warning letters in November 2013.
Annual NSW Speed Camera Performance Review 2018 - Appendix B: Red-light speed cameras B86

• There is one camera at this intersection.
Casualties and FSI Crashes
0
1
2
3
4
5
6
-5Y -4Y -3Y -2Y -1Y 1Y 2YNumber of years before and after camera installation
Casualti
es / C
rashes
Uncategorised M inor/Other M oderate Injury
Serious Injury Killed FSI Crash
7320 Kingsgrove - Stoney Creek Road at Patrick Street
• The infringement graphs show the number of warning letters and infringements issued at this intersection as well as the trend in infringements since the camera began operation. Roadworks and camera maintenance may influence the number of infringements issued.
Status: Insufficient data (<5 years) to reliably assess.
Casualties and casualty crashes at enforced intersection Infringements at enforced intersection
Red-Light Infringements
0
20
40
60
80
100
120
140
160
Dec-15
Feb-16
Apr-16
Jun-16
Aug-16
Oct-16
Dec-16
Feb-17
Apr-17
Jun-17
Aug-17
Oct-17
Dec-17
Month-Year
Infr
ingem
ents
per
Month
Red-light Warning Letters Red-light Infringements2 years and 13 days
after installation²
Casualty CrashesCasualty CrashesCasualty CrashesCasualty Crashes 6 0 ↓ 100%
Serious InjuriesSerious InjuriesSerious InjuriesSerious Injuries
FatalitiesFatalitiesFatalitiesFatalities
3 0 ↓ 100%
1 0 ↓ 100%
Pedestrian Casualties
Right Through Casualty Crashes
Adjacent Casualty Crashes
Rear End Casualty Crashes
0
6
0
0
0
0
0
0
-
↓ 100%
-
-
Speeding Infringements
0
20
40
60
80
100
120
140
Dec-15
Feb-16
Apr-16
Jun-16
Aug-16
Oct-16
Dec-16
Feb-17
Apr-17
Jun-17
Aug-17
Oct-17
Dec-17
Month-Year
Infr
ingem
ents
per
Month
Speeding Warning Letters Speeding Infringements
Moderate InjuriesModerate InjuriesModerate InjuriesModerate Injuries 10 0 ↓ 100%
Minor / Other InjuriesMinor / Other InjuriesMinor / Other InjuriesMinor / Other Injuries 2 0 ↓ 100%
¹ Ending 91 days before the start of the warning letter period, 19 September 2015² Ending 31 December 2017³ The percentage change is based on annualised crash data to allow for a direct comparison between the pre and post installation time periods. Red values indicate an increase.
5 years before
installation¹
Total Casualties:Total Casualties:Total Casualties:Total Casualties: 0 ↓ 100%16
Percentage
change³
Fatal and Serious CrashesFatal and Serious CrashesFatal and Serious CrashesFatal and Serious Crashes 3 0 ↓ 100%
• The camera at the intersection of Stoney Creek Road and Patrick Street commenced issuing warning letters in December 2015.
Annual NSW Speed Camera Performance Review 2018 - Appendix B: Red-light speed cameras B87

• There is one camera at this intersection. This was previously a wet-film red-light camera location.
Casualties and FSI Crashes
0
2
4
6
8
10
-5Y -4Y -3Y -2Y -1Y 2012 2013 2014 2015 2016 2017Number of years before and year after camera installation
Casualti
es / C
rashes
Uncategorised M inor/Other M oderate Injury
Serious Injury Killed FSI Crash
7198 Kirrawee - Acacia Road at President Avenue
• The infringement graphs show the number of warning letters and infringements issued at this intersection as well as the trend in infringements since the camera began operation. Roadworks and camera maintenance may influence the number of infringements issued.
Status: Retain and Monitor. The previous wet-film red light camera may have influenced the before period data. Annual traffic counts have increased across NSW.
Casualties and casualty crashes at enforced intersection Infringements at enforced intersection
Red-Light Infringements
0
10
20
30
40
50
60
70
80
Jun-11
Dec-11
Jun-12
Dec-12
Jun-13
Dec-13
Jun-14
Dec-14
Jun-15
Dec-15
Jun-16
Dec-16
Jun-17
Dec-17
Month-Year
Infr
ingem
ents
per
Month
Red-light Warning Letters Red-light Infringements5 year
after period²
Casualty CrashesCasualty CrashesCasualty CrashesCasualty Crashes 13 16 ↑ 23%
Serious InjuriesSerious InjuriesSerious InjuriesSerious Injuries
FatalitiesFatalitiesFatalitiesFatalities
2 3 ↑ 50%
0 0 -
Pedestrian Casualties
Right Through Casualty Crashes
Adjacent Casualty Crashes
Rear End Casualty Crashes
2
3
1
6
3
3
1
4
↑ 50%
↓ 0%
↓ 0%
↓ 33%
Speeding Infringements
0
50
100
150
200
250
300
Jun-11
Dec-11
Jun-12
Dec-12
Jun-13
Dec-13
Jun-14
Dec-14
Jun-15
Dec-15
Jun-16
Dec-16
Jun-17
Dec-17
Month-Year
Infr
ingem
ents
per
Month
Speeding Warning Letters Speeding Infringements
Moderate InjuriesModerate InjuriesModerate InjuriesModerate Injuries 7 8 ↑ 14%
Minor / Other InjuriesMinor / Other InjuriesMinor / Other InjuriesMinor / Other Injuries 8 6 ↓ 25%
¹ Ending 91 days before the start of the warning letter period, 28 March 2011² Ending 31 December 2017
5 years before
installation¹
Total Casualties:Total Casualties:Total Casualties:Total Casualties: 17 ↓ 0%17
Percentage
change
Fatal and Serious CrashesFatal and Serious CrashesFatal and Serious CrashesFatal and Serious Crashes 2 3 ↑ 50%
• The camera at the intersection of Acacia Road and President Avenue commenced issuing warning letters in June 2011.
Annual NSW Speed Camera Performance Review 2018 - Appendix B: Red-light speed cameras B88

• There is one camera at this intersection. This was previously a wet-film red-light camera location.
Casualties and FSI Crashes
0
2
4
6
8
-5Y -4Y -3Y -2Y -1Y 2012 2013 2014 2015 2016 2017Number of years before and year after camera installation
Casualti
es / C
rashes
Uncategorised M inor/Other M oderate Injury
Serious Injury Killed FSI Crash
7195 Kogarah Bay - Park Road at Princes Highway
• The infringement graphs show the number of warning letters and infringements issued at this intersection as well as the trend in infringements since the camera began operation. Roadworks and camera maintenance may influence the number of infringements issued.
Status: Retain and Monitor. The previous wet-film red light camera may have influenced the before period data. Annual traffic counts have increased across NSW.
Casualties and casualty crashes at enforced intersection Infringements at enforced intersection
Red-Light Infringements
0
50
100
150
200
250
300
350
400
Jun-11
Dec-11
Jun-12
Dec-12
Jun-13
Dec-13
Jun-14
Dec-14
Jun-15
Dec-15
Jun-16
Dec-16
Jun-17
Dec-17
Month-Year
Infr
ingem
ents
per
Month
Red-light Warning Letters Red-light Infringements5 year
after period²
Casualty CrashesCasualty CrashesCasualty CrashesCasualty Crashes 13 7 ↓ 46%
Serious InjuriesSerious InjuriesSerious InjuriesSerious Injuries
FatalitiesFatalitiesFatalitiesFatalities
1 4 ↑ 300%
0 0 -
Pedestrian Casualties
Right Through Casualty Crashes
Adjacent Casualty Crashes
Rear End Casualty Crashes
0
4
5
3
1
1
2
2
Increase
↓ 75%
↓ 60%
↓ 33%
Speeding Infringements
0
1
2
3
4
5
6
Jun-11
Dec-11
Jun-12
Dec-12
Jun-13
Dec-13
Jun-14
Dec-14
Jun-15
Dec-15
Jun-16
Dec-16
Jun-17
Dec-17
Month-Year
Infr
ingem
ents
per
Month
Speeding Warning Letters Speeding Infringements
Moderate InjuriesModerate InjuriesModerate InjuriesModerate Injuries 10 2 ↓ 80%
Minor / Other InjuriesMinor / Other InjuriesMinor / Other InjuriesMinor / Other Injuries 6 3 ↓ 50%
¹ Ending 91 days before the start of the warning letter period, 16 March 2011² Ending 31 December 2017
5 years before
installation¹
Total Casualties:Total Casualties:Total Casualties:Total Casualties: 9 ↓ 47%17
Percentage
change
Fatal and Serious CrashesFatal and Serious CrashesFatal and Serious CrashesFatal and Serious Crashes 1 4 ↑ 300%
• The camera at the intersection of Park Road and Princes Highway commenced issuing warning letters in June 2011.
Annual NSW Speed Camera Performance Review 2018 - Appendix B: Red-light speed cameras B89

• There is one camera at this intersection.
Casualties and FSI Crashes
0
2
4
6
8
10
12
-5Y -4Y -3Y -2Y -1Y 1Y 2Y 3Y 4YNumber of years before and after camera installation
Casualti
es / C
rashes
Uncategorised M inor/Other M oderate Injury
Serious Injury Killed FSI Crash
7271 Lakemba - Punchbowl Road at Wangee Road
• The infringement graphs show the number of warning letters and infringements issued at this intersection as well as the trend in infringements since the camera began operation. Roadworks and camera maintenance may influence the number of infringements issued.
Status: Insufficient data (<5 years) to reliably assess.
Casualties and casualty crashes at enforced intersection Infringements at enforced intersection
Red-Light Infringements
0
5
10
15
20
25
30
35
40
45
Oct-13
Jan-14
Apr-14
Jul-14
Oct-14
Jan-15
Apr-15
Jul-15
Oct-15
Jan-16
Apr-16
Jul-16
Oct-16
Jan-17
Apr-17
Jul-17
Oct-17
Month-Year
Infr
ingem
ents
per
Month
Red-light Warning Letters Red-light Infringements4 years and 74 days
after installation²
Casualty CrashesCasualty CrashesCasualty CrashesCasualty Crashes 12 4 ↓ 60%
Serious InjuriesSerious InjuriesSerious InjuriesSerious Injuries
FatalitiesFatalitiesFatalitiesFatalities
5 1 ↓ 76%
0 0 -
Pedestrian Casualties
Right Through Casualty Crashes
Adjacent Casualty Crashes
Rear End Casualty Crashes
0
3
7
1
1
1
1
1
Increase
↓ 60%
↓ 83%
↑ 19%
Speeding Infringements
0
20
40
60
80
100
120
140
160
180
Oct-13
Jan-14
Apr-14
Jul-14
Oct-14
Jan-15
Apr-15
Jul-15
Oct-15
Jan-16
Apr-16
Jul-16
Oct-16
Jan-17
Apr-17
Jul-17
Oct-17
Month-Year
Infr
ingem
ents
per
Month
Speeding Warning Letters Speeding Infringements
Moderate InjuriesModerate InjuriesModerate InjuriesModerate Injuries 7 0 ↓ 100%
Minor / Other InjuriesMinor / Other InjuriesMinor / Other InjuriesMinor / Other Injuries 9 4 ↓ 47%
¹ Ending 91 days before the start of the warning letter period, 19 July 2013² Ending 31 December 2017³ The percentage change is based on annualised crash data to allow for a direct comparison between the pre and post installation time periods. Red values indicate an increase.
5 years before
installation¹
Total Casualties:Total Casualties:Total Casualties:Total Casualties: 5 ↓ 72%21
Percentage
change³
Fatal and Serious CrashesFatal and Serious CrashesFatal and Serious CrashesFatal and Serious Crashes 3 1 ↓ 60%
• The camera at the intersection of Punchbowl Road and Wangee Road commenced issuing warning letters in October 2013.
Annual NSW Speed Camera Performance Review 2018 - Appendix B: Red-light speed cameras B90

• There is one camera at this intersection. This was previously a wet-film red-light camera location.
Casualties and FSI Crashes
0
2
4
6
8
10
-5Y -4Y -3Y -2Y -1Y 2012 2013 2014 2015 2016 2017Number of years before and year after camera installation
Casualti
es / C
rashes
Uncategorised M inor/Other M oderate Injury
Serious Injury Killed FSI Crash
7213 Lambton - Griffiths Road at Turton Road
• The infringement graphs show the number of warning letters and infringements issued at this intersection as well as the trend in infringements since the camera began operation. Roadworks and camera maintenance may influence the number of infringements issued.
Status: Retain.
Casualties and casualty crashes at enforced intersection Infringements at enforced intersection
Red-Light Infringements
0
10
20
30
40
50
60
Jun-11
Dec-11
Jun-12
Dec-12
Jun-13
Dec-13
Jun-14
Dec-14
Jun-15
Dec-15
Jun-16
Dec-16
Jun-17
Dec-17
Month-Year
Infr
ingem
ents
per
Month
Red-light Warning Letters Red-light Infringements5 year
after period²
Casualty CrashesCasualty CrashesCasualty CrashesCasualty Crashes 19 8 ↓ 58%
Serious InjuriesSerious InjuriesSerious InjuriesSerious Injuries
FatalitiesFatalitiesFatalitiesFatalities
3 3 ↓ 0%
0 0 -
Pedestrian Casualties
Right Through Casualty Crashes
Adjacent Casualty Crashes
Rear End Casualty Crashes
1
3
3
8
0
1
1
6
↓ 100%
↓ 67%
↓ 67%
↓ 25%
Speeding Infringements
0
100
200
300
400
500
600
700
800
Jun-11
Dec-11
Jun-12
Dec-12
Jun-13
Dec-13
Jun-14
Dec-14
Jun-15
Dec-15
Jun-16
Dec-16
Jun-17
Dec-17
Month-Year
Infr
ingem
ents
per
Month
Speeding Warning Letters Speeding Infringements
Moderate InjuriesModerate InjuriesModerate InjuriesModerate Injuries 16 5 ↓ 69%
Minor / Other InjuriesMinor / Other InjuriesMinor / Other InjuriesMinor / Other Injuries 8 5 ↓ 38%
¹ Ending 91 days before the start of the warning letter period, 3 March 2011² Ending 31 December 2017
5 years before
installation¹
Total Casualties:Total Casualties:Total Casualties:Total Casualties: 13 ↓ 52%27
Percentage
change
Fatal and Serious CrashesFatal and Serious CrashesFatal and Serious CrashesFatal and Serious Crashes 3 2 ↓ 33%
• The camera at the intersection of Griffiths Road and Turton Road commenced issuing warning letters in June 2011.
Annual NSW Speed Camera Performance Review 2018 - Appendix B: Red-light speed cameras B91

• There is one camera at this intersection. This was previously a wet-film red-light camera location.
Casualties and FSI Crashes
0
2
4
6
8
10
-5Y -4Y -3Y -2Y -1Y 1Y 2Y 3YNumber of years before and after camera installation
Casualti
es / C
rashes
Uncategorised M inor/Other M oderate Injury
Serious Injury Killed FSI Crash
7297 Lane Cove - Epping Road at Centennial Avenue
• The infringement graphs show the number of warning letters and infringements issued at this intersection as well as the trend in infringements since the camera began operation. Roadworks and camera maintenance may influence the number of infringements issued.
Status: Insufficient data (<5 years) to reliably assess.
Casualties and casualty crashes at enforced intersection Infringements at enforced intersection
Red-Light Infringements
0
100
200
300
400
500
600
700
Aug-14
Nov-14
Feb-15
May-15
Aug-15
Nov-15
Feb-16
May-16
Aug-16
Nov-16
Feb-17
May-17
Aug-17
Nov-17
Month-Year
Infr
ingem
ents
per
Month
Red-light Warning Letters Red-light Infringements3 years and 141
days after installation²
Casualty CrashesCasualty CrashesCasualty CrashesCasualty Crashes 12 5 ↓ 38%
Serious InjuriesSerious InjuriesSerious InjuriesSerious Injuries
FatalitiesFatalitiesFatalitiesFatalities
5 2 ↓ 41%
0 0 -
Pedestrian Casualties
Right Through Casualty Crashes
Adjacent Casualty Crashes
Rear End Casualty Crashes
0
3
2
5
0
0
1
3
-
↓ 100%
↓ 26%
↓ 11%
Speeding Infringements
0
50
100
150
200
250
Aug-14
Nov-14
Feb-15
May-15
Aug-15
Nov-15
Feb-16
May-16
Aug-16
Nov-16
Feb-17
May-17
Aug-17
Nov-17
Month-Year
Infr
ingem
ents
per
Month
Speeding Warning Letters Speeding Infringements
Moderate InjuriesModerate InjuriesModerate InjuriesModerate Injuries 6 0 ↓ 100%
Minor / Other InjuriesMinor / Other InjuriesMinor / Other InjuriesMinor / Other Injuries 4 3 ↑ 11%
¹ Ending 91 days before the start of the warning letter period, 13 May 2014² Ending 31 December 2017³ The percentage change is based on annualised crash data to allow for a direct comparison between the pre and post installation time periods. Red values indicate an increase.
5 years before
installation¹
Total Casualties:Total Casualties:Total Casualties:Total Casualties: 5 ↓ 51%15
Percentage
change³
Fatal and Serious CrashesFatal and Serious CrashesFatal and Serious CrashesFatal and Serious Crashes 4 2 ↓ 26%
• The camera at the intersection of Epping Road and Centennial Avenue commenced issuing warning letters in August 2014.
Annual NSW Speed Camera Performance Review 2018 - Appendix B: Red-light speed cameras B92

• There are two cameras at this intersection. This was previously a wet-film red-light camera location.
Casualties and FSI Crashes
0
5
10
15
20
-5Y -4Y -3Y -2Y -1Y 2011 2012 2013 2014 2015 2016 2017Number of years before and year after camera installation
Casualti
es / C
rashes
Uncategorised M inor/Other M oderate Injury
Serious Injury Killed FSI Crash
7127|7128 Lansdowne / Villawood - Henry Lawson Drive / Woodville Road at Hume Highway
• The infringement graphs show the number of warning letters and infringements issued at this intersection as well as the trend in infringements since the camera began operation. Roadworks and camera maintenance may influence the number of infringements issued.
Status: Retain.
Casualties and casualty crashes at enforced intersection Infringements at enforced intersection
Red-Light Infringements
0
200
400
600
800
1000
1200
Aug-10
Feb-11
Aug-11
Feb-12
Aug-12
Feb-13
Aug-13
Feb-14
Aug-14
Feb-15
Aug-15
Feb-16
Aug-16
Feb-17
Aug-17
Month-Year
Infr
ingem
ents
per
Month
Red-light Warning Letters Red-light Infringements5 year
after period²
Casualty CrashesCasualty CrashesCasualty CrashesCasualty Crashes 35 40 ↑ 14%
Serious InjuriesSerious InjuriesSerious InjuriesSerious Injuries
FatalitiesFatalitiesFatalitiesFatalities
4 2 ↓ 50%
0 0 -
Pedestrian Casualties
Right Through Casualty Crashes
Adjacent Casualty Crashes
Rear End Casualty Crashes
2
4
1
16
1
4
2
17
↓ 50%
↓ 0%
↑ 100%
↑ 6%
Speeding Infringements
0
50
100
150
200
250
300
350
400
450
Aug-10
Feb-11
Aug-11
Feb-12
Aug-12
Feb-13
Aug-13
Feb-14
Aug-14
Feb-15
Aug-15
Feb-16
Aug-16
Feb-17
Aug-17
Month-Year
Infr
ingem
ents
per
Month
Speeding Warning Letters Speeding Infringements
Moderate InjuriesModerate InjuriesModerate InjuriesModerate Injuries 19 18 ↓ 5%
Minor / Other InjuriesMinor / Other InjuriesMinor / Other InjuriesMinor / Other Injuries 19 25 ↑ 32%
¹ Ending 91 days before the start of the warning letter period, 14 May 2010² Ending 31 December 2017
5 years before
installation¹
Total Casualties:Total Casualties:Total Casualties:Total Casualties: 45 ↑ 7%42
Percentage
change
Fatal and Serious CrashesFatal and Serious CrashesFatal and Serious CrashesFatal and Serious Crashes 4 2 ↓ 50%
• Both cameras at the intersection of Woodville Road and Hume Highway commenced issuing warning letters in August 2010.
Annual NSW Speed Camera Performance Review 2018 - Appendix B: Red-light speed cameras B93

• There is one camera at this intersection.
Casualties and FSI Crashes
0
2
4
6
8
10
12
14
-5Y -4Y -3Y -2Y -1Y 1Y 2Y 3Y 4YNumber of years before and after camera installation
Casualti
es / C
rashes
Uncategorised M inor/Other M oderate Injury
Serious Injury Killed FSI Crash
7251 Leichhardt - City West Link at James Street
• The infringement graphs show the number of warning letters and infringements issued at this intersection as well as the trend in infringements since the camera began operation. Roadworks and camera maintenance may influence the number of infringements issued.
Status: Insufficient data (<5 years) to reliably assess.
Casualties and casualty crashes at enforced intersection Infringements at enforced intersection
Red-Light Infringements
0
100
200
300
400
500
600
700
Apr-13
Aug-13
Dec-13
Apr-14
Aug-14
Dec-14
Apr-15
Aug-15
Dec-15
Apr-16
Aug-16
Dec-16
Apr-17
Aug-17
Dec-17
Month-Year
Infr
ingem
ents
per
Month
Red-light Warning Letters Red-light Infringements4 years and 263
days after installation²
Casualty CrashesCasualty CrashesCasualty CrashesCasualty Crashes 29 15 ↓ 45%
Serious InjuriesSerious InjuriesSerious InjuriesSerious Injuries
FatalitiesFatalitiesFatalitiesFatalities
6 4 ↓ 29%
0 0 -
Pedestrian Casualties
Right Through Casualty Crashes
Adjacent Casualty Crashes
Rear End Casualty Crashes
0
1
12
12
0
0
6
9
-
↓ 100%
↓ 47%
↓ 21%
Speeding Infringements
0
50
100
150
200
250
300
350
Apr-13
Aug-13
Dec-13
Apr-14
Aug-14
Dec-14
Apr-15
Aug-15
Dec-15
Apr-16
Aug-16
Dec-16
Apr-17
Aug-17
Dec-17
Month-Year
Infr
ingem
ents
per
Month
Speeding Warning Letters Speeding Infringements
Moderate InjuriesModerate InjuriesModerate InjuriesModerate Injuries 19 9 ↓ 50%
Minor / Other InjuriesMinor / Other InjuriesMinor / Other InjuriesMinor / Other Injuries 14 8 ↓ 39%
¹ Ending 91 days before the start of the warning letter period, 11 January 2013² Ending 31 December 2017³ The percentage change is based on annualised crash data to allow for a direct comparison between the pre and post installation time periods. Red values indicate an increase.
5 years before
installation¹
Total Casualties:Total Casualties:Total Casualties:Total Casualties: 21 ↓ 43%39
Percentage
change³
Fatal and Serious CrashesFatal and Serious CrashesFatal and Serious CrashesFatal and Serious Crashes 5 4 ↓ 15%
• The camera at the intersection of City West Link and James Street commenced issuing warning letters in April 2013.
Annual NSW Speed Camera Performance Review 2018 - Appendix B: Red-light speed cameras B94

• There is one camera at this intersection. This was previously a wet-film red-light camera location.
Casualties and FSI Crashes
0
2
4
6
8
10
12
-5Y -4Y -3Y -2Y -1Y 2011 2012 2013 2014 2015 2016 2017Number of years before and year after camera installation
Casualti
es / C
rashes
Uncategorised M inor/Other M oderate Injury
Serious Injury Killed FSI Crash
7153 Lidcombe - Olympic Drive at Vaughan Street
• The infringement graphs show the number of warning letters and infringements issued at this intersection as well as the trend in infringements since the camera began operation. Roadworks and camera maintenance may influence the number of infringements issued.
Status: Retain.
Casualties and casualty crashes at enforced intersection Infringements at enforced intersection
Red-Light Infringements
0
50
100
150
200
250
300
Sep-10
Mar-11
Sep-11
Mar-12
Sep-12
Mar-13
Sep-13
Mar-14
Sep-14
Mar-15
Sep-15
Mar-16
Sep-16
Mar-17
Sep-17
Month-Year
Infr
ingem
ents
per
Month
Red-light Warning Letters Red-light Infringements5 year
after period²
Casualty CrashesCasualty CrashesCasualty CrashesCasualty Crashes 20 20 ↓ 0%
Serious InjuriesSerious InjuriesSerious InjuriesSerious Injuries
FatalitiesFatalitiesFatalitiesFatalities
6 3 ↓ 50%
0 0 -
Pedestrian Casualties
Right Through Casualty Crashes
Adjacent Casualty Crashes
Rear End Casualty Crashes
2
5
1
11
1
4
1
12
↓ 50%
↓ 20%
↓ 0%
↑ 9%
Speeding Infringements
0
10
20
30
40
50
60
70
80
90
100
Sep-10
Mar-11
Sep-11
Mar-12
Sep-12
Mar-13
Sep-13
Mar-14
Sep-14
Mar-15
Sep-15
Mar-16
Sep-16
Mar-17
Sep-17
Month-Year
Infr
ingem
ents
per
Month
Speeding Warning Letters Speeding Infringements
Moderate InjuriesModerate InjuriesModerate InjuriesModerate Injuries 11 8 ↓ 27%
Minor / Other InjuriesMinor / Other InjuriesMinor / Other InjuriesMinor / Other Injuries 9 13 ↑ 44%
¹ Ending 91 days before the start of the warning letter period, 14 June 2010² Ending 31 December 2017
5 years before
installation¹
Total Casualties:Total Casualties:Total Casualties:Total Casualties: 24 ↓ 8%26
Percentage
change
Fatal and Serious CrashesFatal and Serious CrashesFatal and Serious CrashesFatal and Serious Crashes 6 3 ↓ 50%
• The camera at the intersection of Olympic Drive and Vaughan Street commenced issuing warning letters in September 2010.
Annual NSW Speed Camera Performance Review 2018 - Appendix B: Red-light speed cameras B95

• There is one camera at this intersection.
Casualties and FSI Crashes
0
2
4
6
8
10
12
14
-5Y -4Y -3Y -2Y -1Y 1YNumber of years before and after camera installation
Casualti
es / C
rashes
Uncategorised M inor/Other M oderate Injury
Serious Injury Killed FSI Crash
7315 Liverpool - Hume Highway at Hoxton Park Road
• The infringement graphs show the number of warning letters and infringements issued at this intersection as well as the trend in infringements since the camera began operation. Roadworks and camera maintenance may influence the number of infringements issued.
Status: Insufficient data (<5 years) to reliably assess.
Casualties and casualty crashes at enforced intersection Infringements at enforced intersection
Red-Light Infringements
0
100
200
300
400
500
600
700
Jul-16
Sep-16
Nov-16
Jan-17
Mar-17
May-17
Jul-17
Sep-17
Nov-17
Month-Year
Infr
ingem
ents
per
Month
Red-light Warning Letters Red-light Infringements1 year and 154 days
after installation²
Casualty CrashesCasualty CrashesCasualty CrashesCasualty Crashes 26 11 ↑ 49%
Serious InjuriesSerious InjuriesSerious InjuriesSerious Injuries
FatalitiesFatalitiesFatalitiesFatalities
6 4 ↑ 135%
0 0 -
Pedestrian Casualties
Right Through Casualty Crashes
Adjacent Casualty Crashes
Rear End Casualty Crashes
2
5
0
9
0
0
0
7
↓ 100%
↓ 100%
-
↑ 174%
Speeding Infringements
0
50
100
150
200
250
300
Jul-16
Sep-16
Nov-16
Jan-17
Mar-17
May-17
Jul-17
Sep-17
Nov-17
Month-Year
Infr
ingem
ents
per
Month
Speeding Warning Letters Speeding Infringements
Moderate InjuriesModerate InjuriesModerate InjuriesModerate Injuries 15 2 ↓ 53%
Minor / Other InjuriesMinor / Other InjuriesMinor / Other InjuriesMinor / Other Injuries 12 8 ↑ 135%
¹ Ending 91 days before the start of the warning letter period, 30 April 2016² Ending 31 December 2017³ The percentage change is based on annualised crash data to allow for a direct comparison between the pre and post installation time periods. Red values indicate an increase.
5 years before
installation¹
Total Casualties:Total Casualties:Total Casualties:Total Casualties: 14 ↑ 49%33
Percentage
change³
Fatal and Serious CrashesFatal and Serious CrashesFatal and Serious CrashesFatal and Serious Crashes 6 4 ↑ 135%
• The camera at the intersection of Hume Highway and Macquarie Street commenced issuing warning letters in July 2016.
Annual NSW Speed Camera Performance Review 2018 - Appendix B: Red-light speed cameras B96

• There is one camera at this intersection.
Casualties and FSI Crashes
0
2
4
6
8
10
12
-5Y -4Y -3Y -2Y -1Y 2011 2012 2013 2014 2015 2016 2017Number of years before and year after camera installation
Casualti
es / C
rashes
Uncategorised M inor/Other M oderate Injury
Serious Injury Killed FSI Crash
7148 Liverpool - Hume Highway at Elizabeth Drive
• The infringement graphs show the number of warning letters and infringements issued at this intersection as well as the trend in infringements since the camera began operation. Roadworks and camera maintenance may influence the number of infringements issued.
Status: Retain.
Casualties and casualty crashes at enforced intersection Infringements at enforced intersection
Red-Light Infringements
0
100
200
300
400
500
600
700
800
Oct-10
Apr-11
Oct-11
Apr-12
Oct-12
Apr-13
Oct-13
Apr-14
Oct-14
Apr-15
Oct-15
Apr-16
Oct-16
Apr-17
Oct-17
Month-Year
Infr
ingem
ents
per
Month
Red-light Warning Letters Red-light Infringements5 year
after period²
Casualty CrashesCasualty CrashesCasualty CrashesCasualty Crashes 22 22 ↓ 0%
Serious InjuriesSerious InjuriesSerious InjuriesSerious Injuries
FatalitiesFatalitiesFatalitiesFatalities
4 3 ↓ 25%
0 0 -
Pedestrian Casualties
Right Through Casualty Crashes
Adjacent Casualty Crashes
Rear End Casualty Crashes
1
3
2
8
0
2
0
14
↓ 100%
↓ 33%
↓ 100%
↑ 75%
Speeding Infringements
0
100
200
300
400
500
600
700
800
Oct-10
Apr-11
Oct-11
Apr-12
Oct-12
Apr-13
Oct-13
Apr-14
Oct-14
Apr-15
Oct-15
Apr-16
Oct-16
Apr-17
Oct-17
Month-Year
Infr
ingem
ents
per
Month
Speeding Warning Letters Speeding Infringements
Moderate InjuriesModerate InjuriesModerate InjuriesModerate Injuries 12 6 ↓ 50%
Minor / Other InjuriesMinor / Other InjuriesMinor / Other InjuriesMinor / Other Injuries 12 20 ↑ 67%
¹ Ending 91 days before the start of the warning letter period, 15 July 2010² Ending 31 December 2017
5 years before
installation¹
Total Casualties:Total Casualties:Total Casualties:Total Casualties: 29 ↑ 4%28
Percentage
change
Fatal and Serious CrashesFatal and Serious CrashesFatal and Serious CrashesFatal and Serious Crashes 4 3 ↓ 25%
• The camera at the intersection of Hume Highway and Elizabeth Drive commenced issuing warning letters in October 2010.
Annual NSW Speed Camera Performance Review 2018 - Appendix B: Red-light speed cameras B97

• There is one camera at this intersection.
Casualties and FSI Crashes
0
2
4
6
8
10
-5Y -4Y -3Y -2Y -1Y 1Y 2Y 3Y 4YNumber of years before and after camera installation
Casualti
es / C
rashes
Uncategorised M inor/Other M oderate Injury
Serious Injury Killed FSI Crash
7253 Liverpool - Memorial Avenue at Bathurst Street
• The infringement graphs show the number of warning letters and infringements issued at this intersection as well as the trend in infringements since the camera began operation. Roadworks and camera maintenance may influence the number of infringements issued.
Status: Insufficient data (<5 years) to reliably assess.
Casualties and casualty crashes at enforced intersection Infringements at enforced intersection
Red-Light Infringements
0
100
200
300
400
500
600
700
800
900
Apr-13
Aug-13
Dec-13
Apr-14
Aug-14
Dec-14
Apr-15
Aug-15
Dec-15
Apr-16
Aug-16
Dec-16
Apr-17
Aug-17
Dec-17
Month-Year
Infr
ingem
ents
per
Month
Red-light Warning Letters Red-light Infringements4 years and 245
days after installation²
Casualty CrashesCasualty CrashesCasualty CrashesCasualty Crashes 23 9 ↓ 58%
Serious InjuriesSerious InjuriesSerious InjuriesSerious Injuries
FatalitiesFatalitiesFatalitiesFatalities
5 6 ↑ 29%
0 0 -
Pedestrian Casualties
Right Through Casualty Crashes
Adjacent Casualty Crashes
Rear End Casualty Crashes
2
6
8
1
0
3
2
2
↓ 100%
↓ 46%
↓ 73%
↑ 114%
Speeding Infringements
0
20
40
60
80
100
120
140
Apr-13
Aug-13
Dec-13
Apr-14
Aug-14
Dec-14
Apr-15
Aug-15
Dec-15
Apr-16
Aug-16
Dec-16
Apr-17
Aug-17
Dec-17
Month-Year
Infr
ingem
ents
per
Month
Speeding Warning Letters Speeding Infringements
Moderate InjuriesModerate InjuriesModerate InjuriesModerate Injuries 15 9 ↓ 36%
Minor / Other InjuriesMinor / Other InjuriesMinor / Other InjuriesMinor / Other Injuries 11 4 ↓ 61%
¹ Ending 91 days before the start of the warning letter period, 29 January 2013² Ending 31 December 2017³ The percentage change is based on annualised crash data to allow for a direct comparison between the pre and post installation time periods. Red values indicate an increase.
5 years before
installation¹
Total Casualties:Total Casualties:Total Casualties:Total Casualties: 19 ↓ 34%31
Percentage
change³
Fatal and Serious CrashesFatal and Serious CrashesFatal and Serious CrashesFatal and Serious Crashes 5 5 ↑ 7%
• The camera at the intersection of Memorial Avenue and Bathurst Street commenced issuing warning letters in April 2013.
Annual NSW Speed Camera Performance Review 2018 - Appendix B: Red-light speed cameras B98

• There is one camera at this intersection.
Casualties and FSI Crashes
0
1
2
3
4
5
6
-5Y -4Y -3Y -2Y -1Y 1YNumber of years before and after camera installation
Casualti
es / C
rashes
Uncategorised M inor/Other M oderate Injury
Serious Injury Killed FSI Crash
7338 Liverpool - Moore Street at Bathurst Street
• The infringement graphs show the number of warning letters and infringements issued at this intersection as well as the trend in infringements since the camera began operation. Roadworks and camera maintenance may influence the number of infringements issued.
Status: Insufficient data (<5 years) to reliably assess.
Casualties and casualty crashes at enforced intersection Infringements at enforced intersection
Red-Light Infringements
0
5
10
15
20
25
30
Sep-16
Oct-16
Nov-16
Dec-16
Jan-17
Feb-17
Mar-17
Apr-17
May-17
Jun-17
Jul-17
Aug-17
Sep-17
Oct-17
Nov-17
Dec-17
Month-Year
Infr
ingem
ents
per
Month
Red-light Warning Letters Red-light Infringements1 year and 116 days
after installation²
Casualty CrashesCasualty CrashesCasualty CrashesCasualty Crashes 13 1 ↓ 71%
Serious InjuriesSerious InjuriesSerious InjuriesSerious Injuries
FatalitiesFatalitiesFatalitiesFatalities
5 0 ↓ 100%
0 0 -
Pedestrian Casualties
Right Through Casualty Crashes
Adjacent Casualty Crashes
Rear End Casualty Crashes
6
1
5
0
0
0
0
1
↓ 100%
↓ 100%
↓ 100%
Increase
Speeding Infringements
0
1
2
3
4
5
6
Sep-16
Oct-16
Nov-16
Dec-16
Jan-17
Feb-17
Mar-17
Apr-17
May-17
Jun-17
Jul-17
Aug-17
Sep-17
Oct-17
Nov-17
Dec-17
Month-Year
Infr
ingem
ents
per
Month
Speeding Warning Letters Speeding Infringements
Moderate InjuriesModerate InjuriesModerate InjuriesModerate Injuries 6 1 ↓ 37%
Minor / Other InjuriesMinor / Other InjuriesMinor / Other InjuriesMinor / Other Injuries 5 0 ↓ 100%
¹ Ending 91 days before the start of the warning letter period, 7 June 2016² Ending 31 December 2017³ The percentage change is based on annualised crash data to allow for a direct comparison between the pre and post installation time periods. Red values indicate an increase.
5 years before
installation¹
Total Casualties:Total Casualties:Total Casualties:Total Casualties: 1 ↓ 76%16
Percentage
change³
Fatal and Serious CrashesFatal and Serious CrashesFatal and Serious CrashesFatal and Serious Crashes 5 0 ↓ 100%
• The camera at the intersection of Moore Street and Bathurst Street commenced issuing warning letters in September 2016.
Annual NSW Speed Camera Performance Review 2018 - Appendix B: Red-light speed cameras B99

• There is one camera at this intersection.
Casualties and FSI Crashes
0
1
2
3
4
-5Y -4Y -3Y -2Y -1Y 1Y 2Y 3YNumber of years before and after camera installation
Casualti
es / C
rashes
Uncategorised M inor/Other M oderate Injury
Serious Injury Killed FSI Crash
7308 Maroubra - Anzac Parade at Boyce Road
• The infringement graphs show the number of warning letters and infringements issued at this intersection as well as the trend in infringements since the camera began operation. Roadworks and camera maintenance may influence the number of infringements issued.
Status: Insufficient data (<5 years) to reliably assess.
Casualties and casualty crashes at enforced intersection Infringements at enforced intersection
Red-Light Infringements
0
20
40
60
80
100
120
140
160
Aug-14
Nov-14
Feb-15
May-15
Aug-15
Nov-15
Feb-16
May-16
Aug-16
Nov-16
Feb-17
May-17
Aug-17
Nov-17
Month-Year
Infr
ingem
ents
per
Month
Red-light Warning Letters Red-light Infringements3 years and 124
days after installation²
Casualty CrashesCasualty CrashesCasualty CrashesCasualty Crashes 8 1 ↓ 81%
Serious InjuriesSerious InjuriesSerious InjuriesSerious Injuries
FatalitiesFatalitiesFatalitiesFatalities
1 0 ↓ 100%
0 0 -
Pedestrian Casualties
Right Through Casualty Crashes
Adjacent Casualty Crashes
Rear End Casualty Crashes
1
0
5
0
0
0
1
0
↓ 100%
-
↓ 70%
-
Speeding Infringements
0
10
20
30
40
50
60
70
Aug-14
Nov-14
Feb-15
May-15
Aug-15
Nov-15
Feb-16
May-16
Aug-16
Nov-16
Feb-17
May-17
Aug-17
Nov-17
Month-Year
Infr
ingem
ents
per
Month
Speeding Warning Letters Speeding Infringements
Moderate InjuriesModerate InjuriesModerate InjuriesModerate Injuries 4 0 ↓ 100%
Minor / Other InjuriesMinor / Other InjuriesMinor / Other InjuriesMinor / Other Injuries 4 2 ↓ 25%
¹ Ending 91 days before the start of the warning letter period, 30 May 2014² Ending 31 December 2017³ The percentage change is based on annualised crash data to allow for a direct comparison between the pre and post installation time periods. Red values indicate an increase.
5 years before
installation¹
Total Casualties:Total Casualties:Total Casualties:Total Casualties: 2 ↓ 67%9
Percentage
change³
Fatal and Serious CrashesFatal and Serious CrashesFatal and Serious CrashesFatal and Serious Crashes 1 0 ↓ 100%
• The camera at the intersection of Anzac Parade and Boyce Road commenced issuing warning letters in August 2014.
Annual NSW Speed Camera Performance Review 2018 - Appendix B: Red-light speed cameras B100

• There is one camera at this intersection. This was previously a wet-film red-light camera location.
Casualties and FSI Crashes
0
1
2
3
4
5
6
-5Y -4Y -3Y -2Y -1Y 2012 2013 2014 2015 2016 2017Number of years before and year after camera installation
Casualti
es / C
rashes
Uncategorised M inor/Other M oderate Injury
Serious Injury Killed FSI Crash
7202 Marrickville - Sydenham Road at Victoria Road
• The infringement graphs show the number of warning letters and infringements issued at this intersection as well as the trend in infringements since the camera began operation. Roadworks and camera maintenance may influence the number of infringements issued.
Status: Retain and Monitor. The previous wet-film red light camera may have influenced the before period data. Annual traffic counts have increased across NSW.
Casualties and casualty crashes at enforced intersection Infringements at enforced intersection
Red-Light Infringements
0
10
20
30
40
50
60
Jun-11
Dec-11
Jun-12
Dec-12
Jun-13
Dec-13
Jun-14
Dec-14
Jun-15
Dec-15
Jun-16
Dec-16
Jun-17
Dec-17
Month-Year
Infr
ingem
ents
per
Month
Red-light Warning Letters Red-light Infringements5 year
after period²
Casualty CrashesCasualty CrashesCasualty CrashesCasualty Crashes 12 8 ↓ 33%
Serious InjuriesSerious InjuriesSerious InjuriesSerious Injuries
FatalitiesFatalitiesFatalitiesFatalities
1 3 ↑ 200%
0 0 -
Pedestrian Casualties
Right Through Casualty Crashes
Adjacent Casualty Crashes
Rear End Casualty Crashes
2
3
3
3
1
3
0
2
↓ 50%
↓ 0%
↓ 100%
↓ 33%
Speeding Infringements
0
5
10
15
20
25
30
35
Jun-11
Dec-11
Jun-12
Dec-12
Jun-13
Dec-13
Jun-14
Dec-14
Jun-15
Dec-15
Jun-16
Dec-16
Jun-17
Dec-17
Month-Year
Infr
ingem
ents
per
Month
Speeding Warning Letters Speeding Infringements
Moderate InjuriesModerate InjuriesModerate InjuriesModerate Injuries 7 2 ↓ 71%
Minor / Other InjuriesMinor / Other InjuriesMinor / Other InjuriesMinor / Other Injuries 7 6 ↓ 14%
¹ Ending 91 days before the start of the warning letter period, 16 March 2011² Ending 31 December 2017
5 years before
installation¹
Total Casualties:Total Casualties:Total Casualties:Total Casualties: 11 ↓ 27%15
Percentage
change
Fatal and Serious CrashesFatal and Serious CrashesFatal and Serious CrashesFatal and Serious Crashes 1 3 ↑ 200%
• The camera at the intersection of Sydenham Road and Victoria Road commenced issuing warning letters in June 2011.
Annual NSW Speed Camera Performance Review 2018 - Appendix B: Red-light speed cameras B101

• There is one camera at this intersection. This was previously a wet-film red-light camera location.
Casualties and FSI Crashes
0
1
2
3
4
5
6
-5Y -4Y -3Y -2Y -1Y 2012 2013 2014 2015 2016 2017Number of years before and year after camera installation
Casualti
es / C
rashes
Uncategorised M inor/Other M oderate Injury
Serious Injury Killed FSI Crash
7190 Mascot - O'Riordan Street at Coward Street
• The infringement graphs show the number of warning letters and infringements issued at this intersection as well as the trend in infringements since the camera began operation. Roadworks and camera maintenance may influence the number of infringements issued.
Status: Retain.
Casualties and casualty crashes at enforced intersection Infringements at enforced intersection
Red-Light Infringements
0
5
10
15
20
25
30
35
40
45
Apr-11
Oct-11
Apr-12
Oct-12
Apr-13
Oct-13
Apr-14
Oct-14
Apr-15
Oct-15
Apr-16
Oct-16
Apr-17
Oct-17
Month-Year
Infr
ingem
ents
per
Month
Red-light Warning Letters Red-light Infringements5 year
after period²
Casualty CrashesCasualty CrashesCasualty CrashesCasualty Crashes 14 6 ↓ 57%
Serious InjuriesSerious InjuriesSerious InjuriesSerious Injuries
FatalitiesFatalitiesFatalitiesFatalities
2 1 ↓ 50%
0 0 -
Pedestrian Casualties
Right Through Casualty Crashes
Adjacent Casualty Crashes
Rear End Casualty Crashes
1
6
3
2
0
0
0
3
↓ 100%
↓ 100%
↓ 100%
↑ 50%
Speeding Infringements
0
50
100
150
200
250
300
350
400
450
Apr-11
Oct-11
Apr-12
Oct-12
Apr-13
Oct-13
Apr-14
Oct-14
Apr-15
Oct-15
Apr-16
Oct-16
Apr-17
Oct-17
Month-Year
Infr
ingem
ents
per
Month
Speeding Warning Letters Speeding Infringements
Moderate InjuriesModerate InjuriesModerate InjuriesModerate Injuries 11 1 ↓ 91%
Minor / Other InjuriesMinor / Other InjuriesMinor / Other InjuriesMinor / Other Injuries 5 5 ↓ 0%
¹ Ending 91 days before the start of the warning letter period, 10 January 2011² Ending 31 December 2017
5 years before
installation¹
Total Casualties:Total Casualties:Total Casualties:Total Casualties: 7 ↓ 61%18
Percentage
change
Fatal and Serious CrashesFatal and Serious CrashesFatal and Serious CrashesFatal and Serious Crashes 2 1 ↓ 50%
• The camera at the intersection of O'Riordan Street and Coward Street commenced issuing warning letters in April 2011.
Annual NSW Speed Camera Performance Review 2018 - Appendix B: Red-light speed cameras B102

• There is one camera at this intersection. This was previously a wet-film red-light camera location.
Casualties and FSI Crashes
0
2
4
6
8
10
12
-5Y -4Y -3Y -2Y -1Y 2011 2012 2013 2014 2015 2016 2017Number of years before and year after camera installation
Casualti
es / C
rashes
Uncategorised M inor/Other M oderate Injury
Serious Injury Killed FSI Crash
7158 Mascot - O'Riordan Street at Gardeners Road
• The infringement graphs show the number of warning letters and infringements issued at this intersection as well as the trend in infringements since the camera began operation. Roadworks and camera maintenance may influence the number of infringements issued.
Status: Retain.
Casualties and casualty crashes at enforced intersection Infringements at enforced intersection
Red-Light Infringements
0
20
40
60
80
100
120
140
160
180
200
Oct-10
Apr-11
Oct-11
Apr-12
Oct-12
Apr-13
Oct-13
Apr-14
Oct-14
Apr-15
Oct-15
Apr-16
Oct-16
Apr-17
Oct-17
Month-Year
Infr
ingem
ents
per
Month
Red-light Warning Letters Red-light Infringements5 year
after period²
Casualty CrashesCasualty CrashesCasualty CrashesCasualty Crashes 23 18 ↓ 22%
Serious InjuriesSerious InjuriesSerious InjuriesSerious Injuries
FatalitiesFatalitiesFatalitiesFatalities
6 0 ↓ 100%
0 0 -
Pedestrian Casualties
Right Through Casualty Crashes
Adjacent Casualty Crashes
Rear End Casualty Crashes
1
13
2
2
0
6
1
5
↓ 100%
↓ 54%
↓ 50%
↑ 150%
Speeding Infringements
0
2
4
6
8
10
12
14
Oct-10
Apr-11
Oct-11
Apr-12
Oct-12
Apr-13
Oct-13
Apr-14
Oct-14
Apr-15
Oct-15
Apr-16
Oct-16
Apr-17
Oct-17
Month-Year
Infr
ingem
ents
per
Month
Speeding Warning Letters Speeding Infringements
Moderate InjuriesModerate InjuriesModerate InjuriesModerate Injuries 19 11 ↓ 42%
Minor / Other InjuriesMinor / Other InjuriesMinor / Other InjuriesMinor / Other Injuries 8 12 ↑ 50%
¹ Ending 91 days before the start of the warning letter period, 29 July 2010² Ending 31 December 2017
5 years before
installation¹
Total Casualties:Total Casualties:Total Casualties:Total Casualties: 23 ↓ 30%33
Percentage
change
Fatal and Serious CrashesFatal and Serious CrashesFatal and Serious CrashesFatal and Serious Crashes 6 0 ↓ 100%
• The camera at the intersection of O'Riordan Street and Gardeners Road commenced issuing warning letters in October 2010.
Annual NSW Speed Camera Performance Review 2018 - Appendix B: Red-light speed cameras B103

• There is one camera at this intersection. This was previously a wet-film red-light camera location.
Casualties and FSI Crashes
0
1
2
3
4
5
6
7
-5Y -4Y -3Y -2Y -1Y 2012 2013 2014 2015 2016 2017Number of years before and year after camera installation
Casualti
es / C
rashes
Uncategorised M inor/Other M oderate Injury
Serious Injury Killed FSI Crash
7214 Mayfield West - Pacific Highway at Maud Street
• The infringement graphs show the number of warning letters and infringements issued at this intersection as well as the trend in infringements since the camera began operation. Roadworks and camera maintenance may influence the number of infringements issued.
Status: Retain and Monitor. The previous wet-film red light camera may have influenced the before period data. Annual traffic counts have increased across NSW.
Casualties and casualty crashes at enforced intersection Infringements at enforced intersection
Red-Light Infringements
0
20
40
60
80
100
120
140
160
180
200
May-11
Nov-11
May-12
Nov-12
May-13
Nov-13
May-14
Nov-14
May-15
Nov-15
May-16
Nov-16
May-17
Nov-17
Month-Year
Infr
ingem
ents
per
Month
Red-light Warning Letters Red-light Infringements5 year
after period²
Casualty CrashesCasualty CrashesCasualty CrashesCasualty Crashes 9 7 ↓ 22%
Serious InjuriesSerious InjuriesSerious InjuriesSerious Injuries
FatalitiesFatalitiesFatalitiesFatalities
1 3 ↑ 200%
0 0 -
Pedestrian Casualties
Right Through Casualty Crashes
Adjacent Casualty Crashes
Rear End Casualty Crashes
1
1
3
1
0
3
1
2
↓ 100%
↑ 200%
↓ 67%
↑ 100%
Speeding Infringements
0
50
100
150
200
250
300
350
400
May-11
Nov-11
May-12
Nov-12
May-13
Nov-13
May-14
Nov-14
May-15
Nov-15
May-16
Nov-16
May-17
Nov-17
Month-Year
Infr
ingem
ents
per
Month
Speeding Warning Letters Speeding Infringements
Moderate InjuriesModerate InjuriesModerate InjuriesModerate Injuries 7 3 ↓ 57%
Minor / Other InjuriesMinor / Other InjuriesMinor / Other InjuriesMinor / Other Injuries 2 3 ↑ 50%
¹ Ending 91 days before the start of the warning letter period, 11 February 2011² Ending 31 December 2017
5 years before
installation¹
Total Casualties:Total Casualties:Total Casualties:Total Casualties: 9 ↓ 10%10
Percentage
change
Fatal and Serious CrashesFatal and Serious CrashesFatal and Serious CrashesFatal and Serious Crashes 1 3 ↑ 200%
• The camera at the intersection of Pacific Highway and Maud Street commenced issuing warning letters in May 2011.
Annual NSW Speed Camera Performance Review 2018 - Appendix B: Red-light speed cameras B104

• There are two cameras at this intersection.
Casualties and FSI Crashes
0
2
4
6
8
10
12
-5Y -4Y -3Y -2Y -1Y 2011 2012 2013 2014 2015 2016 2017Number of years before and year after camera installation
Casualti
es / C
rashes
Uncategorised M inor/Other M oderate Injury
Serious Injury Killed FSI Crash
7118|7119 Mays Hill - Great Western Highway at Coleman Street / Hawkesbury Road
• The infringement graphs show the number of warning letters and infringements issued at this intersection as well as the trend in infringements since the camera began operation. Roadworks and camera maintenance may influence the number of infringements issued.
Status: Retain.
Casualties and casualty crashes at enforced intersection Infringements at enforced intersection
Red-Light Infringements
0
50
100
150
200
250
300
350
Jul-10
Jan-11
Jul-11
Jan-12
Jul-12
Jan-13
Jul-13
Jan-14
Jul-14
Jan-15
Jul-15
Jan-16
Jul-16
Jan-17
Jul-17
Month-Year
Infr
ingem
ents
per
Month
Red-light Warning Letters Red-light Infringements5 year
after period²
Casualty CrashesCasualty CrashesCasualty CrashesCasualty Crashes 20 24 ↑ 20%
Serious InjuriesSerious InjuriesSerious InjuriesSerious Injuries
FatalitiesFatalitiesFatalitiesFatalities
8 8 ↓ 0%
0 0 -
Pedestrian Casualties
Right Through Casualty Crashes
Adjacent Casualty Crashes
Rear End Casualty Crashes
0
9
3
7
1
8
2
7
Increase
↓ 11%
↓ 33%
↓ 0%
Speeding Infringements
0
100
200
300
400
500
600
700
800
Jul-10
Jan-11
Jul-11
Jan-12
Jul-12
Jan-13
Jul-13
Jan-14
Jul-14
Jan-15
Jul-15
Jan-16
Jul-16
Jan-17
Jul-17
Month-Year
Infr
ingem
ents
per
Month
Speeding Warning Letters Speeding Infringements
Moderate InjuriesModerate InjuriesModerate InjuriesModerate Injuries 13 6 ↓ 54%
Minor / Other InjuriesMinor / Other InjuriesMinor / Other InjuriesMinor / Other Injuries 7 15 ↑ 114%
¹ Ending 91 days before the start of the warning letter period, 1 April 2010² Ending 31 December 2017
5 years before
installation¹
Total Casualties:Total Casualties:Total Casualties:Total Casualties: 29 ↑ 4%28
Percentage
change
Fatal and Serious CrashesFatal and Serious CrashesFatal and Serious CrashesFatal and Serious Crashes 8 7 ↓ 13%
• Both cameras at the intersection of Great Western Highway and Hawkesbury Road commenced issuing warning letters in July 2010.
Annual NSW Speed Camera Performance Review 2018 - Appendix B: Red-light speed cameras B105

• There is one camera at this intersection.
Casualties and FSI Crashes
0
5
10
15
20
-5Y -4Y -3Y -2Y -1Y 1Y 2Y 3YNumber of years before and after camera installation
Casualti
es / C
rashes
Uncategorised M inor/Other M oderate Injury
Serious Injury Killed FSI Crash
7299 Merrylands West - Merrylands Road at Sherwood Road
• The infringement graphs show the number of warning letters and infringements issued at this intersection as well as the trend in infringements since the camera began operation. Roadworks and camera maintenance may influence the number of infringements issued.
Status: Insufficient data (<5 years) to reliably assess.
Casualties and casualty crashes at enforced intersection Infringements at enforced intersection
Red-Light Infringements
0
10
20
30
40
50
60
70
80
90
100
Oct-14
Jan-15
Apr-15
Jul-15
Oct-15
Jan-16
Apr-16
Jul-16
Oct-16
Jan-17
Apr-17
Jul-17
Oct-17
Month-Year
Infr
ingem
ents
per
Month
Red-light Warning Letters Red-light Infringements3 years and 75 days
after installation²
Casualty CrashesCasualty CrashesCasualty CrashesCasualty Crashes 27 19 ↑ 10%
Serious InjuriesSerious InjuriesSerious InjuriesSerious Injuries
FatalitiesFatalitiesFatalitiesFatalities
9 3 ↓ 48%
0 0 -
Pedestrian Casualties
Right Through Casualty Crashes
Adjacent Casualty Crashes
Rear End Casualty Crashes
0
18
2
1
1
5
0
9
Increase
↓ 57%
↓ 100%
↑ 1303%
Speeding Infringements
0
2
4
6
8
10
12
14
16
18
20
Oct-14
Jan-15
Apr-15
Jul-15
Oct-15
Jan-16
Apr-16
Jul-16
Oct-16
Jan-17
Apr-17
Jul-17
Oct-17
Month-Year
Infr
ingem
ents
per
Month
Speeding Warning Letters Speeding Infringements
Moderate InjuriesModerate InjuriesModerate InjuriesModerate Injuries 13 4 ↓ 52%
Minor / Other InjuriesMinor / Other InjuriesMinor / Other InjuriesMinor / Other Injuries 15 17 ↑ 77%
¹ Ending 91 days before the start of the warning letter period, 18 July 2014² Ending 31 December 2017³ The percentage change is based on annualised crash data to allow for a direct comparison between the pre and post installation time periods. Red values indicate an increase.
5 years before
installation¹
Total Casualties:Total Casualties:Total Casualties:Total Casualties: 24 ↑ 1%37
Percentage
change³
Fatal and Serious CrashesFatal and Serious CrashesFatal and Serious CrashesFatal and Serious Crashes 8 3 ↓ 42%
• The camera at the intersection of Merrylands Road and Sherwood Road commenced issuing warning letters in October 2014.
Annual NSW Speed Camera Performance Review 2018 - Appendix B: Red-light speed cameras B106

• There is one camera at this intersection.
Casualties and FSI Crashes
0
5
10
15
-5Y -4Y -3Y -2Y -1Y 2011 2012 2013 2014 2015 2016 2017Number of years before and year after camera installation
Casualti
es / C
rashes
Uncategorised M inor/Other M oderate Injury
Serious Injury Killed FSI Crash
7149 Milperra - Newbridge Road at Henry Lawson Drive
• The infringement graphs show the number of warning letters and infringements issued at this intersection as well as the trend in infringements since the camera began operation. Roadworks and camera maintenance may influence the number of infringements issued. The speed limit at this location changed from 60km/h to 70km/h in May 2012.
Status: Retain and Monitor. Annual traffic counts have increased across NSW.
Casualties and casualty crashes at enforced intersection Infringements at enforced intersection
Red-Light Infringements
0
50
100
150
200
250
300
350
400
450
Sep-10
Mar-11
Sep-11
Mar-12
Sep-12
Mar-13
Sep-13
Mar-14
Sep-14
Mar-15
Sep-15
Mar-16
Sep-16
Mar-17
Sep-17
Month-Year
Infr
ingem
ents
per
Month
Red-light Warning Letters Red-light Infringements5 year
after period²
Casualty CrashesCasualty CrashesCasualty CrashesCasualty Crashes 14 37 ↑ 164%
Serious InjuriesSerious InjuriesSerious InjuriesSerious Injuries
FatalitiesFatalitiesFatalitiesFatalities
1 8 ↑ 700%
0 0 -
Pedestrian Casualties
Right Through Casualty Crashes
Adjacent Casualty Crashes
Rear End Casualty Crashes
1
3
1
8
0
2
2
15
↓ 100%
↓ 33%
↑ 100%
↑ 88%
Speeding Infringements
0
200
400
600
800
1000
1200
1400
1600
Sep-10
Mar-11
Sep-11
Mar-12
Sep-12
Mar-13
Sep-13
Mar-14
Sep-14
Mar-15
Sep-15
Mar-16
Sep-16
Mar-17
Sep-17
Month-Year
Infr
ingem
ents
per
Month
Speeding Warning Letters Speeding Infringements
Moderate InjuriesModerate InjuriesModerate InjuriesModerate Injuries 9 11 ↑ 22%
Minor / Other InjuriesMinor / Other InjuriesMinor / Other InjuriesMinor / Other Injuries 6 28 ↑ 367%
¹ Ending 91 days before the start of the warning letter period, 10 June 2010² Ending 31 December 2017
5 years before
installation¹
Total Casualties:Total Casualties:Total Casualties:Total Casualties: 47 ↑ 194%16
Percentage
change
Fatal and Serious CrashesFatal and Serious CrashesFatal and Serious CrashesFatal and Serious Crashes 1 6 ↑ 500%
• The camera at the intersection of Newbridge Road and Henry Lawson Drive commenced issuing warning letters in September 2010.
Annual NSW Speed Camera Performance Review 2018 - Appendix B: Red-light speed cameras B107

• There is one camera at this intersection.
Casualties and FSI Crashes
0
5
10
15
20
-5Y -4Y -3Y -2Y -1Y 2011 2012 2013 2014 2015 2016 2017Number of years before and year after camera installation
Casualti
es / C
rashes
Uncategorised M inor/Other M oderate Injury
Serious Injury Killed FSI Crash
7126 Miranda - Kingsway at Port Hacking Road
• The infringement graphs show the number of warning letters and infringements issued at this intersection as well as the trend in infringements since the camera began operation. Roadworks and camera maintenance may influence the number of infringements issued.
Status: Retain.
Casualties and casualty crashes at enforced intersection Infringements at enforced intersection
Red-Light Infringements
0
50
100
150
200
250
300
Jul-10
Jan-11
Jul-11
Jan-12
Jul-12
Jan-13
Jul-13
Jan-14
Jul-14
Jan-15
Jul-15
Jan-16
Jul-16
Jan-17
Jul-17
Month-Year
Infr
ingem
ents
per
Month
Red-light Warning Letters Red-light Infringements5 year
after period²
Casualty CrashesCasualty CrashesCasualty CrashesCasualty Crashes 27 3 ↓ 89%
Serious InjuriesSerious InjuriesSerious InjuriesSerious Injuries
FatalitiesFatalitiesFatalitiesFatalities
3 1 ↓ 67%
0 0 -
Pedestrian Casualties
Right Through Casualty Crashes
Adjacent Casualty Crashes
Rear End Casualty Crashes
3
14
2
4
0
1
0
2
↓ 100%
↓ 93%
↓ 100%
↓ 50%
Speeding Infringements
0
10
20
30
40
50
60
70
80
90
Jul-10
Jan-11
Jul-11
Jan-12
Jul-12
Jan-13
Jul-13
Jan-14
Jul-14
Jan-15
Jul-15
Jan-16
Jul-16
Jan-17
Jul-17
Month-Year
Infr
ingem
ents
per
Month
Speeding Warning Letters Speeding Infringements
Moderate InjuriesModerate InjuriesModerate InjuriesModerate Injuries 22 0 ↓ 100%
Minor / Other InjuriesMinor / Other InjuriesMinor / Other InjuriesMinor / Other Injuries 13 2 ↓ 85%
¹ Ending 91 days before the start of the warning letter period, 7 April 2010² Ending 31 December 2017
5 years before
installation¹
Total Casualties:Total Casualties:Total Casualties:Total Casualties: 3 ↓ 92%38
Percentage
change
Fatal and Serious CrashesFatal and Serious CrashesFatal and Serious CrashesFatal and Serious Crashes 2 1 ↓ 50%
• The camera at the intersection of Kingsway and Port Hacking Road commenced issuing warning letters in July 2010.
Annual NSW Speed Camera Performance Review 2018 - Appendix B: Red-light speed cameras B108

• There is one camera at this intersection. This was previously a wet-film red-light camera location.
Casualties and FSI Crashes
0
1
2
3
4
5
6
7
-5Y -4Y -3Y -2Y -1Y 2012 2013 2014 2015 2016 2017Number of years before and year after camera installation
Casualti
es / C
rashes
Uncategorised M inor/Other M oderate Injury
Serious Injury Killed FSI Crash
7178 Moore Park - Anzac Parade at Lang Road
• The infringement graphs show the number of warning letters and infringements issued at this intersection as well as the trend in infringements since the camera began operation. Roadworks and camera maintenance may influence the number of infringements issued.
Status: Ineligible (there is currently a review underway at this location). The previous wet-film red light camera may have influenced the before period data.
Casualties and casualty crashes at enforced intersection Infringements at enforced intersection
Red-Light Infringements
0
50
100
150
200
250
300
350
400
450
Mar-11
Sep-11
Mar-12
Sep-12
Mar-13
Sep-13
Mar-14
Sep-14
Mar-15
Sep-15
Mar-16
Sep-16
Mar-17
Sep-17
Month-Year
Infr
ingem
ents
per
Month
Red-light Warning Letters Red-light Infringements5 year
after period²
Casualty CrashesCasualty CrashesCasualty CrashesCasualty Crashes 12 14 ↑ 17%
Serious InjuriesSerious InjuriesSerious InjuriesSerious Injuries
FatalitiesFatalitiesFatalitiesFatalities
1 7 ↑ 600%
0 0 -
Pedestrian Casualties
Right Through Casualty Crashes
Adjacent Casualty Crashes
Rear End Casualty Crashes
1
1
2
5
1
2
2
2
↓ 0%
↑ 100%
↓ 0%
↓ 60%
Speeding Infringements
0
5
10
15
20
25
30
35
40
Mar-11
Sep-11
Mar-12
Sep-12
Mar-13
Sep-13
Mar-14
Sep-14
Mar-15
Sep-15
Mar-16
Sep-16
Mar-17
Sep-17
Month-Year
Infr
ingem
ents
per
Month
Speeding Warning Letters Speeding Infringements
Moderate InjuriesModerate InjuriesModerate InjuriesModerate Injuries 6 4 ↓ 33%
Minor / Other InjuriesMinor / Other InjuriesMinor / Other InjuriesMinor / Other Injuries 8 4 ↓ 50%
¹ Ending 91 days before the start of the warning letter period, 15 December 2010² Ending 31 December 2017
5 years before
installation¹
Total Casualties:Total Casualties:Total Casualties:Total Casualties: 15 ↓ 0%15
Percentage
change
Fatal and Serious CrashesFatal and Serious CrashesFatal and Serious CrashesFatal and Serious Crashes 1 7 ↑ 600%
• The camera at the intersection of Anzac Parade and Lang Road commenced issuing warning letters in March 2011.
Annual NSW Speed Camera Performance Review 2018 - Appendix B: Red-light speed cameras B109

• There are two cameras at this intersection.
Casualties and FSI Crashes
0
2
4
6
8
10
12
-5Y -4Y -3Y -2Y -1Y 2011 2012 2013 2014 2015 2016 2017Number of years before and year after camera installation
Casualti
es / C
rashes
Uncategorised M inor/Other M oderate Injury
Serious Injury Killed FSI Crash
7140|7141 Moore Park / Paddington - Anzac Parade / Flinders Street at Moore Park Road
• The infringement graphs show the number of warning letters and infringements issued at this intersection as well as the trend in infringements since the camera began operation. Roadworks and camera maintenance may influence the number of infringements issued.
Status: Retain.
Casualties and casualty crashes at enforced intersection Infringements at enforced intersection
Red-Light Infringements
0
50
100
150
200
250
300
350
400
450
Aug-10
Feb-11
Aug-11
Feb-12
Aug-12
Feb-13
Aug-13
Feb-14
Aug-14
Feb-15
Aug-15
Feb-16
Aug-16
Feb-17
Aug-17
Month-Year
Infr
ingem
ents
per
Month
Red-light Warning Letters Red-light Infringements5 year
after period²
Casualty CrashesCasualty CrashesCasualty CrashesCasualty Crashes 18 16 ↓ 11%
Serious InjuriesSerious InjuriesSerious InjuriesSerious Injuries
FatalitiesFatalitiesFatalitiesFatalities
13 2 ↓ 85%
0 1 Increase
Pedestrian Casualties
Right Through Casualty Crashes
Adjacent Casualty Crashes
Rear End Casualty Crashes
1
7
2
3
1
5
1
7
↓ 0%
↓ 29%
↓ 50%
↑ 133%
Speeding Infringements
0
100
200
300
400
500
600
700
Aug-10
Feb-11
Aug-11
Feb-12
Aug-12
Feb-13
Aug-13
Feb-14
Aug-14
Feb-15
Aug-15
Feb-16
Aug-16
Feb-17
Aug-17
Month-Year
Infr
ingem
ents
per
Month
Speeding Warning Letters Speeding Infringements
Moderate InjuriesModerate InjuriesModerate InjuriesModerate Injuries 5 5 ↓ 0%
Minor / Other InjuriesMinor / Other InjuriesMinor / Other InjuriesMinor / Other Injuries 6 11 ↑ 83%
¹ Ending 91 days before the start of the warning letter period, 19 May 2010² Ending 31 December 2017
5 years before
installation¹
Total Casualties:Total Casualties:Total Casualties:Total Casualties: 19 ↓ 21%24
Percentage
change
Fatal and Serious CrashesFatal and Serious CrashesFatal and Serious CrashesFatal and Serious Crashes 10 3 ↓ 70%
• Both cameras at the intersection of Anzac Parade and Moore Park Road commenced issuing warning letters in August 2010.
Annual NSW Speed Camera Performance Review 2018 - Appendix B: Red-light speed cameras B110

• There is one camera at this intersection. This was previously a wet-film red-light camera location.
Casualties and FSI Crashes
0
1
2
3
4
5
6
7
-5Y -4Y -3Y -2Y -1Y 2011 2012 2013 2014 2015 2016 2017Number of years before and year after camera installation
Casualti
es / C
rashes
Uncategorised M inor/Other M oderate Injury
Serious Injury Killed FSI Crash
7181 Moorebank - Newbridge Road at Stockton Avenue
• The infringement graphs show the number of warning letters and infringements issued at this intersection as well as the trend in infringements since the camera began operation. Roadworks and camera maintenance may influence the number of infringements issued.
Status: Retain.
Casualties and casualty crashes at enforced intersection Infringements at enforced intersection
Red-Light Infringements
0
5
10
15
20
25
30
35
40
Nov-10
May-11
Nov-11
May-12
Nov-12
May-13
Nov-13
May-14
Nov-14
May-15
Nov-15
May-16
Nov-16
May-17
Nov-17
Month-Year
Infr
ingem
ents
per
Month
Red-light Warning Letters Red-light Infringements5 year
after period²
Casualty CrashesCasualty CrashesCasualty CrashesCasualty Crashes 14 9 ↓ 36%
Serious InjuriesSerious InjuriesSerious InjuriesSerious Injuries
FatalitiesFatalitiesFatalitiesFatalities
4 2 ↓ 50%
0 0 -
Pedestrian Casualties
Right Through Casualty Crashes
Adjacent Casualty Crashes
Rear End Casualty Crashes
0
7
0
5
0
3
0
3
-
↓ 57%
-
↓ 40%
Speeding Infringements
0
20
40
60
80
100
120
140
Nov-10
May-11
Nov-11
May-12
Nov-12
May-13
Nov-13
May-14
Nov-14
May-15
Nov-15
May-16
Nov-16
May-17
Nov-17
Month-Year
Infr
ingem
ents
per
Month
Speeding Warning Letters Speeding Infringements
Moderate InjuriesModerate InjuriesModerate InjuriesModerate Injuries 9 6 ↓ 33%
Minor / Other InjuriesMinor / Other InjuriesMinor / Other InjuriesMinor / Other Injuries 11 7 ↓ 36%
¹ Ending 91 days before the start of the warning letter period, 16 August 2010² Ending 31 December 2017
5 years before
installation¹
Total Casualties:Total Casualties:Total Casualties:Total Casualties: 15 ↓ 38%24
Percentage
change
Fatal and Serious CrashesFatal and Serious CrashesFatal and Serious CrashesFatal and Serious Crashes 4 2 ↓ 50%
• The camera at the intersection of Newbridge Road and Stockton Avenue commenced issuing warning letters in November 2010.
Annual NSW Speed Camera Performance Review 2018 - Appendix B: Red-light speed cameras B111

• There is one camera at this intersection. This was previously a wet-film red-light camera location.
Casualties and FSI Crashes
0
1
2
3
4
5
-5Y -4Y -3Y -2Y -1Y 2011 2012 2013 2014 2015 2016 2017Number of years before and year after camera installation
Casualti
es / C
rashes
Uncategorised M inor/Other M oderate Injury
Serious Injury Killed FSI Crash
7205 Mosman - Military Road at Cowles Road
• The infringement graphs show the number of warning letters and infringements issued at this intersection as well as the trend in infringements since the camera began operation. Roadworks and camera maintenance may influence the number of infringements issued.
Status: Retain.
Casualties and casualty crashes at enforced intersection Infringements at enforced intersection
Red-Light Infringements
0
10
20
30
40
50
60
Dec-10
Jun-11
Dec-11
Jun-12
Dec-12
Jun-13
Dec-13
Jun-14
Dec-14
Jun-15
Dec-15
Jun-16
Dec-16
Jun-17
Dec-17
Month-Year
Infr
ingem
ents
per
Month
Red-light Warning Letters Red-light Infringements5 year
after period²
Casualty CrashesCasualty CrashesCasualty CrashesCasualty Crashes 9 2 ↓ 78%
Serious InjuriesSerious InjuriesSerious InjuriesSerious Injuries
FatalitiesFatalitiesFatalitiesFatalities
1 1 ↓ 0%
0 0 -
Pedestrian Casualties
Right Through Casualty Crashes
Adjacent Casualty Crashes
Rear End Casualty Crashes
1
1
2
5
1
0
0
0
↓ 0%
↓ 100%
↓ 100%
↓ 100%
Speeding Infringements
0
50
100
150
200
250
300
350
400
Dec-10
Jun-11
Dec-11
Jun-12
Dec-12
Jun-13
Dec-13
Jun-14
Dec-14
Jun-15
Dec-15
Jun-16
Dec-16
Jun-17
Dec-17
Month-Year
Infr
ingem
ents
per
Month
Speeding Warning Letters Speeding Infringements
Moderate InjuriesModerate InjuriesModerate InjuriesModerate Injuries 5 1 ↓ 80%
Minor / Other InjuriesMinor / Other InjuriesMinor / Other InjuriesMinor / Other Injuries 5 0 ↓ 100%
¹ Ending 91 days before the start of the warning letter period, 15 September 2010² Ending 31 December 2017
5 years before
installation¹
Total Casualties:Total Casualties:Total Casualties:Total Casualties: 2 ↓ 82%11
Percentage
change
Fatal and Serious CrashesFatal and Serious CrashesFatal and Serious CrashesFatal and Serious Crashes 1 1 ↓ 0%
• The camera at the intersection of Military Road and Cowles Road commenced issuing warning letters in December 2010.
Annual NSW Speed Camera Performance Review 2018 - Appendix B: Red-light speed cameras B112

• There is one camera at this intersection.
Casualties and FSI Crashes
0
2
4
6
8
-5Y -4Y -3Y -2Y -1Y 1Y 2Y 3Y 4YNumber of years before and after camera installation
Casualti
es / C
rashes
Uncategorised M inor/Other M oderate Injury
Serious Injury Killed FSI Crash
7274 Mount Druitt - Great Western Highway at Carlisle Avenue
• The infringement graphs show the number of warning letters and infringements issued at this intersection as well as the trend in infringements since the camera began operation. Roadworks and camera maintenance may influence the number of infringements issued.
Status: Insufficient data (<5 years) to reliably assess.
Casualties and casualty crashes at enforced intersection Infringements at enforced intersection
Red-Light Infringements
0
50
100
150
200
250
300
350
400
Nov-13
Feb-14
May-14
Aug-14
Nov-14
Feb-15
May-15
Aug-15
Nov-15
Feb-16
May-16
Aug-16
Nov-16
Feb-17
May-17
Aug-17
Nov-17
Month-Year
Infr
ingem
ents
per
Month
Red-light Warning Letters Red-light Infringements4 years and 46 days
after installation²
Casualty CrashesCasualty CrashesCasualty CrashesCasualty Crashes 15 12 ↓ 3%
Serious InjuriesSerious InjuriesSerious InjuriesSerious Injuries
FatalitiesFatalitiesFatalitiesFatalities
8 2 ↓ 70%
0 0 -
Pedestrian Casualties
Right Through Casualty Crashes
Adjacent Casualty Crashes
Rear End Casualty Crashes
0
2
1
2
0
1
0
7
-
↓ 39%
↓ 100%
↑ 324%
Speeding Infringements
0
2
4
6
8
10
12
14
16
18
Nov-13
Feb-14
May-14
Aug-14
Nov-14
Feb-15
May-15
Aug-15
Nov-15
Feb-16
May-16
Aug-16
Nov-16
Feb-17
May-17
Aug-17
Nov-17
Month-Year
Infr
ingem
ents
per
Month
Speeding Warning Letters Speeding Infringements
Moderate InjuriesModerate InjuriesModerate InjuriesModerate Injuries 8 5 ↓ 24%
Minor / Other InjuriesMinor / Other InjuriesMinor / Other InjuriesMinor / Other Injuries 7 7 ↑ 21%
¹ Ending 91 days before the start of the warning letter period, 16 August 2013² Ending 31 December 2017³ The percentage change is based on annualised crash data to allow for a direct comparison between the pre and post installation time periods. Red values indicate an increase.
5 years before
installation¹
Total Casualties:Total Casualties:Total Casualties:Total Casualties: 14 ↓ 26%23
Percentage
change³
Fatal and Serious CrashesFatal and Serious CrashesFatal and Serious CrashesFatal and Serious Crashes 7 2 ↓ 65%
• The camera at the intersection of Great Western Highway and Carlisle Avenue commenced issuing warning letters in November 2013.
Annual NSW Speed Camera Performance Review 2018 - Appendix B: Red-light speed cameras B113

• There is one camera at this intersection.
Casualties and FSI Crashes
0
2
4
6
8
-5Y -4Y -3Y -2Y -1Y 1Y 2Y 3Y 4YNumber of years before and after camera installation
Casualti
es / C
rashes
Uncategorised M inor/Other M oderate Injury
Serious Injury Killed FSI Crash
7247 Naremburn - Willoughby Road at Chandos Street
• The infringement graphs show the number of warning letters and infringements issued at this intersection as well as the trend in infringements since the camera began operation. Roadworks and camera maintenance may influence the number of infringements issued.
Status: Insufficient data (<5 years) to reliably assess.
Casualties and casualty crashes at enforced intersection Infringements at enforced intersection
Red-Light Infringements
0
20
40
60
80
100
120
140
160
180
Feb-13
Jun-13
Oct-13
Feb-14
Jun-14
Oct-14
Feb-15
Jun-15
Oct-15
Feb-16
Jun-16
Oct-16
Feb-17
Jun-17
Oct-17
Month-Year
Infr
ingem
ents
per
Month
Red-light Warning Letters Red-light Infringements4 years and 308
days after installation²
Casualty CrashesCasualty CrashesCasualty CrashesCasualty Crashes 11 7 ↓ 34%
Serious InjuriesSerious InjuriesSerious InjuriesSerious Injuries
FatalitiesFatalitiesFatalitiesFatalities
2 3 ↑ 55%
0 0 -
Pedestrian Casualties
Right Through Casualty Crashes
Adjacent Casualty Crashes
Rear End Casualty Crashes
1
2
8
0
1
0
5
1
↑ 3%
↓ 100%
↓ 35%
Increase
Speeding Infringements
0
10
20
30
40
50
60
70
Feb-13
Jun-13
Oct-13
Feb-14
Jun-14
Oct-14
Feb-15
Jun-15
Oct-15
Feb-16
Jun-16
Oct-16
Feb-17
Jun-17
Oct-17
Month-Year
Infr
ingem
ents
per
Month
Speeding Warning Letters Speeding Infringements
Moderate InjuriesModerate InjuriesModerate InjuriesModerate Injuries 9 3 ↓ 66%
Minor / Other InjuriesMinor / Other InjuriesMinor / Other InjuriesMinor / Other Injuries 4 2 ↓ 48%
¹ Ending 91 days before the start of the warning letter period, 27 November 2012² Ending 31 December 2017³ The percentage change is based on annualised crash data to allow for a direct comparison between the pre and post installation time periods. Red values indicate an increase.
5 years before
installation¹
Total Casualties:Total Casualties:Total Casualties:Total Casualties: 8 ↓ 45%15
Percentage
change³
Fatal and Serious CrashesFatal and Serious CrashesFatal and Serious CrashesFatal and Serious Crashes 2 2 ↑ 3%
• The camera at the intersection of Willoughby Road and Chandos Street commenced issuing warning letters in February 2013.
Annual NSW Speed Camera Performance Review 2018 - Appendix B: Red-light speed cameras B114

• There is one camera at this intersection.
Casualties and FSI Crashes
0
2
4
6
8
10
12
14
-5Y -4Y -3Y -2Y -1Y 1Y 2Y 3YNumber of years before and after camera installation
Casualti
es / C
rashes
Uncategorised M inor/Other M oderate Injury
Serious Injury Killed FSI Crash
7305 Neutral Bay - Falcon Street at Merlin Street
• The infringement graphs show the number of warning letters and infringements issued at this intersection as well as the trend in infringements since the camera began operation. Roadworks and camera maintenance may influence the number of infringements issued.
Status: Insufficient data (<5 years) to reliably assess.
Casualties and casualty crashes at enforced intersection Infringements at enforced intersection
Red-Light Infringements
0
100
200
300
400
500
600
700
Jul-14
Oct-14
Jan-15
Apr-15
Jul-15
Oct-15
Jan-16
Apr-16
Jul-16
Oct-16
Jan-17
Apr-17
Jul-17
Oct-17
Month-Year
Infr
ingem
ents
per
Month
Red-light Warning Letters Red-light Infringements3 years and 163
days after installation²
Casualty CrashesCasualty CrashesCasualty CrashesCasualty Crashes 22 10 ↓ 34%
Serious InjuriesSerious InjuriesSerious InjuriesSerious Injuries
FatalitiesFatalitiesFatalitiesFatalities
4 1 ↓ 64%
0 0 -
Pedestrian Casualties
Right Through Casualty Crashes
Adjacent Casualty Crashes
Rear End Casualty Crashes
0
0
8
11
0
0
0
4
-
-
↓ 100%
↓ 47%
Speeding Infringements
0
50
100
150
200
250
300
350
400
450
Jul-14
Oct-14
Jan-15
Apr-15
Jul-15
Oct-15
Jan-16
Apr-16
Jul-16
Oct-16
Jan-17
Apr-17
Jul-17
Oct-17
Month-Year
Infr
ingem
ents
per
Month
Speeding Warning Letters Speeding Infringements
Moderate InjuriesModerate InjuriesModerate InjuriesModerate Injuries 12 1 ↓ 88%
Minor / Other InjuriesMinor / Other InjuriesMinor / Other InjuriesMinor / Other Injuries 15 10 ↓ 3%
¹ Ending 91 days before the start of the warning letter period, 21 April 2014² Ending 31 December 2017³ The percentage change is based on annualised crash data to allow for a direct comparison between the pre and post installation time periods. Red values indicate an increase.
5 years before
installation¹
Total Casualties:Total Casualties:Total Casualties:Total Casualties: 12 ↓ 44%31
Percentage
change³
Fatal and Serious CrashesFatal and Serious CrashesFatal and Serious CrashesFatal and Serious Crashes 4 1 ↓ 64%
• The camera at the intersection of Falcon Street and Merlin Street commenced issuing warning letters in July 2014.
Annual NSW Speed Camera Performance Review 2018 - Appendix B: Red-light speed cameras B115

• There are three cameras at this intersection.
Casualties and FSI Crashes
0
1
2
3
4
5
6
-5Y -4Y -3Y -2Y -1Y 1Y 2Y 3Y 4YNumber of years before and after camera installation
Casualti
es / C
rashes
Uncategorised M inor/Other M oderate Injury
Serious Injury Killed FSI Crash
7254|7269|7270 North Ryde - Cox's Road at Lane Cove Road (school zone)
• The infringement graphs show the number of warning letters and infringements issued at this intersection as well as the trend in infringements since the camera began operation. Roadworks and camera maintenance may influence the number of infringements issued.
Status: Insufficient data (<5 years) to reliably assess.
Casualties and casualty crashes at enforced intersection Infringements at enforced intersection
Red-Light Infringements
0
50
100
150
200
250
300
350
Apr-13
Aug-13
Dec-13
Apr-14
Aug-14
Dec-14
Apr-15
Aug-15
Dec-15
Apr-16
Aug-16
Dec-16
Apr-17
Aug-17
Dec-17
Month-Year
Infr
ingem
ents
per
Month
Red-light Warning Letters Red-light Infringements4 years and 251
days after installation²
Casualty CrashesCasualty CrashesCasualty CrashesCasualty Crashes 9 7 ↓ 17%
Serious InjuriesSerious InjuriesSerious InjuriesSerious Injuries
FatalitiesFatalitiesFatalitiesFatalities
3 4 ↑ 42%
0 0 -
Pedestrian Casualties
Right Through Casualty Crashes
Adjacent Casualty Crashes
Rear End Casualty Crashes
3
0
0
2
0
2
0
4
↓ 100%
Increase
-
↑ 113%
Speeding Infringements
0
100
200
300
400
500
600
700
800
900
Apr-13
Aug-13
Dec-13
Apr-14
Aug-14
Dec-14
Apr-15
Aug-15
Dec-15
Apr-16
Aug-16
Dec-16
Apr-17
Aug-17
Dec-17
Month-Year
Infr
ingem
ents
per
Month
Speeding Warning Letters Speeding Infringements
Moderate InjuriesModerate InjuriesModerate InjuriesModerate Injuries 2 4 ↑ 113%
Minor / Other InjuriesMinor / Other InjuriesMinor / Other InjuriesMinor / Other Injuries 4 1 ↓ 73%
¹ Ending 91 days before the start of the warning letter period, 23 January 2013² Ending 31 December 2017³ The percentage change is based on annualised crash data to allow for a direct comparison between the pre and post installation time periods. Red values indicate an increase.
5 years before
installation¹
Total Casualties:Total Casualties:Total Casualties:Total Casualties: 9 ↑ 7%9
Percentage
change³
Fatal and Serious CrashesFatal and Serious CrashesFatal and Serious CrashesFatal and Serious Crashes 3 4 ↑ 42%
• The camera at the intersection of Cox's Road and Lane Cove Road (westbound) commenced issuing warning letters in April 2013. This camera enforces red-light running only.
• Both cameras at the intersection of Lane Cove Road and Cox's Road commenced issuing warning letters in April 2013.
Annual NSW Speed Camera Performance Review 2018 - Appendix B: Red-light speed cameras B116

• There is one camera at this intersection. This was previously a wet-film red-light camera location.
Casualties and FSI Crashes
0
2
4
6
8
-5Y -4Y -3Y -2Y -1Y 2011 2012 2013 2014 2015 2016 2017Number of years before and year after camera installation
Casualti
es / C
rashes
Uncategorised M inor/Other M oderate Injury
Serious Injury Killed FSI Crash
7185 North Ryde - Wicks Road at Epping Road
• The infringement graphs show the number of warning letters and infringements issued at this intersection as well as the trend in infringements since the camera began operation. Roadworks and camera maintenance may influence the number of infringements issued.
Status: Retain and Monitor. The previous wet-film red light camera may have influenced the before period data. Annual traffic counts have increased across NSW.
Casualties and casualty crashes at enforced intersection Infringements at enforced intersection
Red-Light Infringements
0
20
40
60
80
100
120
140
160
180
200
Nov-10
May-11
Nov-11
May-12
Nov-12
May-13
Nov-13
May-14
Nov-14
May-15
Nov-15
May-16
Nov-16
May-17
Nov-17
Month-Year
Infr
ingem
ents
per
Month
Red-light Warning Letters Red-light Infringements5 year
after period²
Casualty CrashesCasualty CrashesCasualty CrashesCasualty Crashes 14 19 ↑ 36%
Serious InjuriesSerious InjuriesSerious InjuriesSerious Injuries
FatalitiesFatalitiesFatalitiesFatalities
1 7 ↑ 600%
0 0 -
Pedestrian Casualties
Right Through Casualty Crashes
Adjacent Casualty Crashes
Rear End Casualty Crashes
0
0
1
9
0
1
1
11
-
Increase
↓ 0%
↑ 22%
Speeding Infringements
0
0.5
1
1.5
2
2.5
3
3.5
4
4.5
Nov-10
May-11
Nov-11
May-12
Nov-12
May-13
Nov-13
May-14
Nov-14
May-15
Nov-15
May-16
Nov-16
May-17
Nov-17
Month-Year
Infr
ingem
ents
per
Month
Speeding Warning Letters Speeding Infringements
Moderate InjuriesModerate InjuriesModerate InjuriesModerate Injuries 4 5 ↑ 25%
Minor / Other InjuriesMinor / Other InjuriesMinor / Other InjuriesMinor / Other Injuries 11 11 ↓ 0%
¹ Ending 91 days before the start of the warning letter period, 12 August 2010² Ending 31 December 2017
5 years before
installation¹
Total Casualties:Total Casualties:Total Casualties:Total Casualties: 23 ↑ 44%16
Percentage
change
Fatal and Serious CrashesFatal and Serious CrashesFatal and Serious CrashesFatal and Serious Crashes 1 6 ↑ 500%
• The camera at the intersection of Wicks Road and Epping Road commenced issuing warning letters in November 2010.
Annual NSW Speed Camera Performance Review 2018 - Appendix B: Red-light speed cameras B117

• There is one camera at this intersection.
Casualties and FSI Crashes
0
1
2
3
4
5
6
7
-5Y -4Y -3Y -2Y -1Y 1Y 2Y 3Y 4YNumber of years before and after camera installation
Casualti
es / C
rashes
Uncategorised M inor/Other M oderate Injury
Serious Injury Killed FSI Crash
7283 Northmead - Briens Road at Redbank Road
• The infringement graphs show the number of warning letters and infringements issued at this intersection as well as the trend in infringements since the camera began operation. Roadworks and camera maintenance may influence the number of infringements issued.
Status: Insufficient data (<5 years) to reliably assess.
Casualties and casualty crashes at enforced intersection Infringements at enforced intersection
Red-Light Infringements
0
20
40
60
80
100
120
140
160
Sep-13
Jan-14
May-14
Sep-14
Jan-15
May-15
Sep-15
Jan-16
May-16
Sep-16
Jan-17
May-17
Sep-17
Month-Year
Infr
ingem
ents
per
Month
Red-light Warning Letters Red-light Infringements4 years and 96 days
after installation²
Casualty CrashesCasualty CrashesCasualty CrashesCasualty Crashes 17 10 ↓ 31%
Serious InjuriesSerious InjuriesSerious InjuriesSerious Injuries
FatalitiesFatalitiesFatalitiesFatalities
6 1 ↓ 80%
0 0 -
Pedestrian Casualties
Right Through Casualty Crashes
Adjacent Casualty Crashes
Rear End Casualty Crashes
0
3
2
7
1
1
0
6
Increase
↓ 61%
↓ 100%
↑ 1%
Speeding Infringements
0
50
100
150
200
250
300
Sep-13
Jan-14
May-14
Sep-14
Jan-15
May-15
Sep-15
Jan-16
May-16
Sep-16
Jan-17
May-17
Sep-17
Month-Year
Infr
ingem
ents
per
Month
Speeding Warning Letters Speeding Infringements
Moderate InjuriesModerate InjuriesModerate InjuriesModerate Injuries 9 3 ↓ 61%
Minor / Other InjuriesMinor / Other InjuriesMinor / Other InjuriesMinor / Other Injuries 5 6 ↑ 41%
¹ Ending 91 days before the start of the warning letter period, 27 June 2013² Ending 31 December 2017³ The percentage change is based on annualised crash data to allow for a direct comparison between the pre and post installation time periods. Red values indicate an increase.
5 years before
installation¹
Total Casualties:Total Casualties:Total Casualties:Total Casualties: 10 ↓ 41%20
Percentage
change³
Fatal and Serious CrashesFatal and Serious CrashesFatal and Serious CrashesFatal and Serious Crashes 6 1 ↓ 80%
• The camera at the intersection of Briens Road and Redbank Road commenced issuing warning letters in September 2013.
Annual NSW Speed Camera Performance Review 2018 - Appendix B: Red-light speed cameras B118

• There is one camera at this intersection. This was previously a wet-film red-light camera location.
Casualties and FSI Crashes
0
2
4
6
8
-5Y -4Y -3Y -2Y -1Y 2011 2012 2013 2014 2015 2016 2017Number of years before and year after camera installation
Casualti
es / C
rashes
Uncategorised M inor/Other M oderate Injury
Serious Injury Killed FSI Crash
7182 Northmead - Old Windsor Road at Cumberland Highway
• The infringement graphs show the number of warning letters and infringements issued at this intersection as well as the trend in infringements since the camera began operation. Roadworks and camera maintenance may influence the number of infringements issued.
Status: Retain.
Casualties and casualty crashes at enforced intersection Infringements at enforced intersection
Red-Light Infringements
0
20
40
60
80
100
120
140
160
Dec-10
Jun-11
Dec-11
Jun-12
Dec-12
Jun-13
Dec-13
Jun-14
Dec-14
Jun-15
Dec-15
Jun-16
Dec-16
Jun-17
Dec-17
Month-Year
Infr
ingem
ents
per
Month
Red-light Warning Letters Red-light Infringements5 year
after period²
Casualty CrashesCasualty CrashesCasualty CrashesCasualty Crashes 15 11 ↓ 27%
Serious InjuriesSerious InjuriesSerious InjuriesSerious Injuries
FatalitiesFatalitiesFatalitiesFatalities
6 2 ↓ 67%
0 0 -
Pedestrian Casualties
Right Through Casualty Crashes
Adjacent Casualty Crashes
Rear End Casualty Crashes
0
0
0
8
0
0
0
6
-
-
-
↓ 25%
Speeding Infringements
0
200
400
600
800
1000
1200
1400
Dec-10
Jun-11
Dec-11
Jun-12
Dec-12
Jun-13
Dec-13
Jun-14
Dec-14
Jun-15
Dec-15
Jun-16
Dec-16
Jun-17
Dec-17
Month-Year
Infr
ingem
ents
per
Month
Speeding Warning Letters Speeding Infringements
Moderate InjuriesModerate InjuriesModerate InjuriesModerate Injuries 6 3 ↓ 50%
Minor / Other InjuriesMinor / Other InjuriesMinor / Other InjuriesMinor / Other Injuries 4 10 ↑ 150%
¹ Ending 91 days before the start of the warning letter period, 15 September 2010² Ending 31 December 2017
5 years before
installation¹
Total Casualties:Total Casualties:Total Casualties:Total Casualties: 15 ↓ 6%16
Percentage
change
Fatal and Serious CrashesFatal and Serious CrashesFatal and Serious CrashesFatal and Serious Crashes 5 2 ↓ 60%
• The camera at the intersection of Old Windsor Road and Cumberland Highway commenced issuing warning letters in December 2010.
Annual NSW Speed Camera Performance Review 2018 - Appendix B: Red-light speed cameras B119

• There is one camera at this intersection. This was previously a wet-film red-light camera location.
Casualties and FSI Crashes
0
1
2
3
4
-5Y -4Y -3Y -2Y -1Y 2011 2012 2013 2014 2015 2016 2017Number of years before and year after camera installation
Casualti
es / C
rashes
Uncategorised M inor/Other M oderate Injury
Serious Injury Killed FSI Crash
7151 Paddington - Moore Park Road at Lang Road
• The infringement graphs show the number of warning letters and infringements issued at this intersection as well as the trend in infringements since the camera began operation. Roadworks and camera maintenance may influence the number of infringements issued.
Status: Retain.
Casualties and casualty crashes at enforced intersection Infringements at enforced intersection
Red-Light Infringements
0
50
100
150
200
250
300
350
400
Oct-10
Apr-11
Oct-11
Apr-12
Oct-12
Apr-13
Oct-13
Apr-14
Oct-14
Apr-15
Oct-15
Apr-16
Oct-16
Apr-17
Oct-17
Month-Year
Infr
ingem
ents
per
Month
Red-light Warning Letters Red-light Infringements5 year
after period²
Casualty CrashesCasualty CrashesCasualty CrashesCasualty Crashes 6 2 ↓ 67%
Serious InjuriesSerious InjuriesSerious InjuriesSerious Injuries
FatalitiesFatalitiesFatalitiesFatalities
5 0 ↓ 100%
0 0 -
Pedestrian Casualties
Right Through Casualty Crashes
Adjacent Casualty Crashes
Rear End Casualty Crashes
2
1
1
1
0
1
0
1
↓ 100%
↓ 0%
↓ 100%
↓ 0%
Speeding Infringements
0
100
200
300
400
500
600
Oct-10
Apr-11
Oct-11
Apr-12
Oct-12
Apr-13
Oct-13
Apr-14
Oct-14
Apr-15
Oct-15
Apr-16
Oct-16
Apr-17
Oct-17
Month-Year
Infr
ingem
ents
per
Month
Speeding Warning Letters Speeding Infringements
Moderate InjuriesModerate InjuriesModerate InjuriesModerate Injuries 1 1 ↓ 0%
Minor / Other InjuriesMinor / Other InjuriesMinor / Other InjuriesMinor / Other Injuries 1 1 ↓ 0%
¹ Ending 91 days before the start of the warning letter period, 21 July 2010² Ending 31 December 2017
5 years before
installation¹
Total Casualties:Total Casualties:Total Casualties:Total Casualties: 2 ↓ 71%7
Percentage
change
Fatal and Serious CrashesFatal and Serious CrashesFatal and Serious CrashesFatal and Serious Crashes 5 0 ↓ 100%
• The camera at the intersection of Moore Park Road and Lang Road commenced issuing warning letters in October 2010.
Annual NSW Speed Camera Performance Review 2018 - Appendix B: Red-light speed cameras B120

• There are two cameras at this intersection. This was previously a wet-film red-light camera location.
Casualties and FSI Crashes
0
5
10
15
20
-5Y -4Y -3Y -2Y -1Y 2011 2012 2013 2014 2015 2016 2017Number of years before and year after camera installation
Casualti
es / C
rashes
Uncategorised M inor/Other M oderate Injury
Serious Injury Killed FSI Crash
7120|7121 Paddington / Surry Hills - South Dowling Street at Fitzroy Street / Moore Park Road
• The infringement graphs show the number of warning letters and infringements issued at this intersection as well as the trend in infringements since the camera began operation. Roadworks and camera maintenance may influence the number of infringements issued.
Status: Retain.
Casualties and casualty crashes at enforced intersection Infringements at enforced intersection
Red-Light Infringements
0
50
100
150
200
250
300
350
Jun-10
Dec-10
Jun-11
Dec-11
Jun-12
Dec-12
Jun-13
Dec-13
Jun-14
Dec-14
Jun-15
Dec-15
Jun-16
Dec-16
Jun-17
Dec-17
Month-Year
Infr
ingem
ents
per
Month
Red-light Warning Letters Red-light Infringements5 year
after period²
Casualty CrashesCasualty CrashesCasualty CrashesCasualty Crashes 38 15 ↓ 61%
Serious InjuriesSerious InjuriesSerious InjuriesSerious Injuries
FatalitiesFatalitiesFatalitiesFatalities
28 4 ↓ 86%
0 0 -
Pedestrian Casualties
Right Through Casualty Crashes
Adjacent Casualty Crashes
Rear End Casualty Crashes
2
1
27
5
0
1
4
4
↓ 100%
↓ 0%
↓ 85%
↓ 20%
Speeding Infringements
0
50
100
150
200
250
300
350
400
Jun-10
Dec-10
Jun-11
Dec-11
Jun-12
Dec-12
Jun-13
Dec-13
Jun-14
Dec-14
Jun-15
Dec-15
Jun-16
Dec-16
Jun-17
Dec-17
Month-Year
Infr
ingem
ents
per
Month
Speeding Warning Letters Speeding Infringements
Moderate InjuriesModerate InjuriesModerate InjuriesModerate Injuries 13 7 ↓ 46%
Minor / Other InjuriesMinor / Other InjuriesMinor / Other InjuriesMinor / Other Injuries 18 6 ↓ 67%
¹ Ending 91 days before the start of the warning letter period, 31 March 2010² Ending 31 December 2017
5 years before
installation¹
Total Casualties:Total Casualties:Total Casualties:Total Casualties: 17 ↓ 71%59
Percentage
change
Fatal and Serious CrashesFatal and Serious CrashesFatal and Serious CrashesFatal and Serious Crashes 20 4 ↓ 80%
• Both cameras at the intersection of South Dowling Street and Fitzroy Street commenced issuing warning letters in June 2010.
Annual NSW Speed Camera Performance Review 2018 - Appendix B: Red-light speed cameras B121

• There is one camera at this intersection.
Casualties and FSI Crashes
0
1
2
3
4
5
6
7
-5Y -4Y -3Y -2Y -1Y 1YNumber of years before and after camera installation
Casualti
es / C
rashes
Uncategorised M inor/Other M oderate Injury
Serious Injury Killed FSI Crash
7333 Parramatta - Great Western Highway at Marsden Street
• The infringement graphs show the number of warning letters and infringements issued at this intersection as well as the trend in infringements since the camera began operation. Roadworks and camera maintenance may influence the number of infringements issued.
Status: Insufficient data (<5 years) to reliably assess.
Casualties and casualty crashes at enforced intersection Infringements at enforced intersection
Red-Light Infringements
0
50
100
150
200
250
300
350
Oct-16
Nov-16
Dec-16
Jan-17
Feb-17
Mar-17
Apr-17
May-17
Jun-17
Jul-17
Aug-17
Sep-17
Oct-17
Nov-17
Dec-17
Month-Year
Infr
ingem
ents
per
Month
Red-light Warning Letters Red-light Infringements1 year and 81 days
after installation²
Casualty CrashesCasualty CrashesCasualty CrashesCasualty Crashes 14 0 ↓ 100%
Serious InjuriesSerious InjuriesSerious InjuriesSerious Injuries
FatalitiesFatalitiesFatalitiesFatalities
5 0 ↓ 100%
0 0 -
Pedestrian Casualties
Right Through Casualty Crashes
Adjacent Casualty Crashes
Rear End Casualty Crashes
1
0
1
5
0
0
0
0
↓ 100%
-
↓ 100%
↓ 100%
Speeding Infringements
0
5
10
15
20
25
30
35
40
45
50
Oct-16
Nov-16
Dec-16
Jan-17
Feb-17
Mar-17
Apr-17
May-17
Jun-17
Jul-17
Aug-17
Sep-17
Oct-17
Nov-17
Dec-17
Month-Year
Infr
ingem
ents
per
Month
Speeding Warning Letters Speeding Infringements
Moderate InjuriesModerate InjuriesModerate InjuriesModerate Injuries 2 0 ↓ 100%
Minor / Other InjuriesMinor / Other InjuriesMinor / Other InjuriesMinor / Other Injuries 11 0 ↓ 100%
¹ Ending 91 days before the start of the warning letter period, 12 July 2016² Ending 31 December 2017³ The percentage change is based on annualised crash data to allow for a direct comparison between the pre and post installation time periods. Red values indicate an increase.
5 years before
installation¹
Total Casualties:Total Casualties:Total Casualties:Total Casualties: 0 ↓ 100%18
Percentage
change³
Fatal and Serious CrashesFatal and Serious CrashesFatal and Serious CrashesFatal and Serious Crashes 5 0 ↓ 100%
• The camera at the intersection of Great Western Highway and Marsden Street commenced issuing warning letters in October 2016.
Annual NSW Speed Camera Performance Review 2018 - Appendix B: Red-light speed cameras B122

• There is one camera at this intersection.
Casualties and FSI Crashes
0
1
2
3
-5Y -4Y -3Y -2Y -1Y 1Y 2Y 3YNumber of years before and after camera installation
Casualti
es / C
rashes
Uncategorised M inor/Other M oderate Injury
Serious Injury Killed FSI Crash
7282 Parramatta - Macquarie Street at Marsden Street
• The infringement graphs show the number of warning letters and infringements issued at this intersection as well as the trend in infringements since the camera began operation. Roadworks and camera maintenance may influence the number of infringements issued.
Status: Insufficient data (<5 years) to reliably assess.
Casualties and casualty crashes at enforced intersection Infringements at enforced intersection
Red-Light Infringements
0
20
40
60
80
100
120
Feb-14
May-14
Aug-14
Nov-14
Feb-15
May-15
Aug-15
Nov-15
Feb-16
May-16
Aug-16
Nov-16
Feb-17
May-17
Aug-17
Nov-17
Month-Year
Infr
ingem
ents
per
Month
Red-light Warning Letters Red-light Infringements3 years and 321
days after installation²
Casualty CrashesCasualty CrashesCasualty CrashesCasualty Crashes 5 3 ↓ 23%
Serious InjuriesSerious InjuriesSerious InjuriesSerious Injuries
FatalitiesFatalitiesFatalitiesFatalities
2 0 ↓ 100%
0 0 -
Pedestrian Casualties
Right Through Casualty Crashes
Adjacent Casualty Crashes
Rear End Casualty Crashes
2
0
2
1
0
0
2
1
↓ 100%
-
↑ 29%
↑ 29%
Speeding Infringements
0
2
4
6
8
10
12
14
16
18
Feb-14
May-14
Aug-14
Nov-14
Feb-15
May-15
Aug-15
Nov-15
Feb-16
May-16
Aug-16
Nov-16
Feb-17
May-17
Aug-17
Nov-17
Month-Year
Infr
ingem
ents
per
Month
Speeding Warning Letters Speeding Infringements
Moderate InjuriesModerate InjuriesModerate InjuriesModerate Injuries 3 1 ↓ 57%
Minor / Other InjuriesMinor / Other InjuriesMinor / Other InjuriesMinor / Other Injuries 2 2 ↑ 29%
¹ Ending 91 days before the start of the warning letter period, 14 November 2013² Ending 31 December 2017³ The percentage change is based on annualised crash data to allow for a direct comparison between the pre and post installation time periods. Red values indicate an increase.
5 years before
installation¹
Total Casualties:Total Casualties:Total Casualties:Total Casualties: 3 ↓ 45%7
Percentage
change³
Fatal and Serious CrashesFatal and Serious CrashesFatal and Serious CrashesFatal and Serious Crashes 2 0 ↓ 100%
• The camera at the intersection of Macquarie Street and Marsden Street commenced issuing warning letters in February 2014.
Annual NSW Speed Camera Performance Review 2018 - Appendix B: Red-light speed cameras B123

• There is one camera at this intersection. This was previously a wet-film red-light camera location.
Casualties and FSI Crashes
0
2
4
6
8
10
12
-5Y -4Y -3Y -2Y -1Y 1Y 2Y 3Y 4YNumber of years before and after camera installation
Casualti
es / C
rashes
Uncategorised M inor/Other M oderate Injury
Serious Injury Killed FSI Crash
7249 Parramatta - O'Connell Street at Argyle Street
• The infringement graphs show the number of warning letters and infringements issued at this intersection as well as the trend in infringements since the camera began operation. Roadworks and camera maintenance may influence the number of infringements issued.
Status: Insufficient data (<5 years) to reliably assess.
Casualties and casualty crashes at enforced intersection Infringements at enforced intersection
Red-Light Infringements
0
50
100
150
200
250
May-13
Sep-13
Jan-14
May-14
Sep-14
Jan-15
May-15
Sep-15
Jan-16
May-16
Sep-16
Jan-17
May-17
Sep-17
Month-Year
Infr
ingem
ents
per
Month
Red-light Warning Letters Red-light Infringements4 years and 223
days after installation²
Casualty CrashesCasualty CrashesCasualty CrashesCasualty Crashes 14 5 ↓ 61%
Serious InjuriesSerious InjuriesSerious InjuriesSerious Injuries
FatalitiesFatalitiesFatalitiesFatalities
1 2 ↑ 117%
0 0 -
Pedestrian Casualties
Right Through Casualty Crashes
Adjacent Casualty Crashes
Rear End Casualty Crashes
1
0
11
1
0
0
2
0
↓ 100%
-
↓ 80%
↓ 100%
Speeding Infringements
0
10
20
30
40
50
60
70
80
90
May-13
Sep-13
Jan-14
May-14
Sep-14
Jan-15
May-15
Sep-15
Jan-16
May-16
Sep-16
Jan-17
May-17
Sep-17
Month-Year
Infr
ingem
ents
per
Month
Speeding Warning Letters Speeding Infringements
Moderate InjuriesModerate InjuriesModerate InjuriesModerate Injuries 10 4 ↓ 57%
Minor / Other InjuriesMinor / Other InjuriesMinor / Other InjuriesMinor / Other Injuries 9 0 ↓ 100%
¹ Ending 91 days before the start of the warning letter period, 20 February 2013² Ending 31 December 2017³ The percentage change is based on annualised crash data to allow for a direct comparison between the pre and post installation time periods. Red values indicate an increase.
5 years before
installation¹
Total Casualties:Total Casualties:Total Casualties:Total Casualties: 6 ↓ 67%20
Percentage
change³
Fatal and Serious CrashesFatal and Serious CrashesFatal and Serious CrashesFatal and Serious Crashes 1 2 ↑ 117%
• The camera at the intersection of O'Connell Street and Argyle Street commenced issuing warning letters in May 2013.
Annual NSW Speed Camera Performance Review 2018 - Appendix B: Red-light speed cameras B124

• There is one camera at this intersection. This was previously a wet-film red-light camera location.
Casualties and FSI Crashes
0
2
4
6
8
10
12
-5Y -4Y -3Y -2Y -1Y 2011 2012 2013 2014 2015 2016 2017Number of years before and year after camera installation
Casualti
es / C
rashes
Uncategorised M inor/Other M oderate Injury
Serious Injury Killed FSI Crash
7107 Parramatta - Victoria Road at Church Street
• The infringement graphs show the number of warning letters and infringements issued at this intersection as well as the trend in infringements since the camera began operation. Roadworks and camera maintenance may influence the number of infringements issued.
Status: Retain.
Casualties and casualty crashes at enforced intersection Infringements at enforced intersection
Red-Light Infringements
0
20
40
60
80
100
120
140
160
Jun-10
Dec-10
Jun-11
Dec-11
Jun-12
Dec-12
Jun-13
Dec-13
Jun-14
Dec-14
Jun-15
Dec-15
Jun-16
Dec-16
Jun-17
Dec-17
Month-Year
Infr
ingem
ents
per
Month
Red-light Warning Letters Red-light Infringements5 year
after period²
Casualty CrashesCasualty CrashesCasualty CrashesCasualty Crashes 26 18 ↓ 31%
Serious InjuriesSerious InjuriesSerious InjuriesSerious Injuries
FatalitiesFatalitiesFatalitiesFatalities
6 4 ↓ 33%
0 0 -
Pedestrian Casualties
Right Through Casualty Crashes
Adjacent Casualty Crashes
Rear End Casualty Crashes
3
15
0
4
2
2
0
5
↓ 33%
↓ 87%
-
↑ 25%
Speeding Infringements
0
5
10
15
20
25
30
35
Jun-10
Dec-10
Jun-11
Dec-11
Jun-12
Dec-12
Jun-13
Dec-13
Jun-14
Dec-14
Jun-15
Dec-15
Jun-16
Dec-16
Jun-17
Dec-17
Month-Year
Infr
ingem
ents
per
Month
Speeding Warning Letters Speeding Infringements
Moderate InjuriesModerate InjuriesModerate InjuriesModerate Injuries 19 3 ↓ 84%
Minor / Other InjuriesMinor / Other InjuriesMinor / Other InjuriesMinor / Other Injuries 12 17 ↑ 42%
¹ Ending 91 days before the start of the warning letter period, 25 March 2010² Ending 31 December 2017
5 years before
installation¹
Total Casualties:Total Casualties:Total Casualties:Total Casualties: 24 ↓ 35%37
Percentage
change
Fatal and Serious CrashesFatal and Serious CrashesFatal and Serious CrashesFatal and Serious Crashes 5 4 ↓ 20%
• The camera at the intersection of Victoria Road and Church Street commenced issuing warning letters in June 2010.
Annual NSW Speed Camera Performance Review 2018 - Appendix B: Red-light speed cameras B125

• There is one camera at this intersection. This was previously a wet-film red-light camera location.
Casualties and FSI Crashes
0
2
4
6
8
10
12
14
-5Y -4Y -3Y -2Y -1Y 2011 2012 2013 2014 2015 2016 2017Number of years before and year after camera installation
Casualti
es / C
rashes
Uncategorised M inor/Other M oderate Injury
Serious Injury Killed FSI Crash
7161 Pennant Hills - Pennant Hills Road at Beecroft Road (school zone)
• The infringement graphs show the number of warning letters and infringements issued at this intersection as well as the trend in infringements since the camera began operation. Roadworks and camera maintenance may influence the number of infringements issued.
Status: Retain.
Casualties and casualty crashes at enforced intersection Infringements at enforced intersection
Red-Light Infringements
0
5
10
15
20
25
30
35
40
Sep-10
Mar-11
Sep-11
Mar-12
Sep-12
Mar-13
Sep-13
Mar-14
Sep-14
Mar-15
Sep-15
Mar-16
Sep-16
Mar-17
Sep-17
Month-Year
Infr
ingem
ents
per
Month
Red-light Warning Letters Red-light Infringements5 year
after period²
Casualty CrashesCasualty CrashesCasualty CrashesCasualty Crashes 18 19 ↑ 6%
Serious InjuriesSerious InjuriesSerious InjuriesSerious Injuries
FatalitiesFatalitiesFatalitiesFatalities
5 1 ↓ 80%
0 0 -
Pedestrian Casualties
Right Through Casualty Crashes
Adjacent Casualty Crashes
Rear End Casualty Crashes
0
0
0
17
0
0
0
17
-
-
-
↓ 0%
Speeding Infringements
0
100
200
300
400
500
600
Sep-10
Mar-11
Sep-11
Mar-12
Sep-12
Mar-13
Sep-13
Mar-14
Sep-14
Mar-15
Sep-15
Mar-16
Sep-16
Mar-17
Sep-17
Month-Year
Infr
ingem
ents
per
Month
Speeding Warning Letters Speeding Infringements
Moderate InjuriesModerate InjuriesModerate InjuriesModerate Injuries 8 6 ↓ 25%
Minor / Other InjuriesMinor / Other InjuriesMinor / Other InjuriesMinor / Other Injuries 12 12 ↓ 0%
¹ Ending 91 days before the start of the warning letter period, 2 June 2010² Ending 31 December 2017
5 years before
installation¹
Total Casualties:Total Casualties:Total Casualties:Total Casualties: 19 ↓ 24%25
Percentage
change
Fatal and Serious CrashesFatal and Serious CrashesFatal and Serious CrashesFatal and Serious Crashes 5 1 ↓ 80%
• The camera at the intersection of Pennant Hills Road and Beecroft Road commenced issuing warning letters in September 2010.
Annual NSW Speed Camera Performance Review 2018 - Appendix B: Red-light speed cameras B126

• There is one camera at this intersection. This was previously a wet-film red-light camera location.
Casualties and FSI Crashes
0
1
2
3
4
5
-5Y -4Y -3Y -2Y -1Y 2011 2012 2013 2014 2015 2016 2017Number of years before and year after camera installation
Casualti
es / C
rashes
Uncategorised M inor/Other M oderate Injury
Serious Injury Killed FSI Crash
7157 Petersham - Gordon Street at New Canterbury Road
• The infringement graphs show the number of warning letters and infringements issued at this intersection as well as the trend in infringements since the camera began operation. Roadworks and camera maintenance may influence the number of infringements issued.
Status: Retain and Monitor. The previous wet-film red light camera may have influenced the before period data. Annual traffic counts have increased across NSW.
Casualties and casualty crashes at enforced intersection Infringements at enforced intersection
Red-Light Infringements
0
100
200
300
400
500
600
700
Oct-10
Apr-11
Oct-11
Apr-12
Oct-12
Apr-13
Oct-13
Apr-14
Oct-14
Apr-15
Oct-15
Apr-16
Oct-16
Apr-17
Oct-17
Month-Year
Infr
ingem
ents
per
Month
Red-light Warning Letters Red-light Infringements5 year
after period²
Casualty CrashesCasualty CrashesCasualty CrashesCasualty Crashes 9 9 ↓ 0%
Serious InjuriesSerious InjuriesSerious InjuriesSerious Injuries
FatalitiesFatalitiesFatalitiesFatalities
0 2 Increase
0 0 -
Pedestrian Casualties
Right Through Casualty Crashes
Adjacent Casualty Crashes
Rear End Casualty Crashes
1
3
2
2
3
1
2
3
↑ 200%
↓ 67%
↓ 0%
↑ 50%
Moderate InjuriesModerate InjuriesModerate InjuriesModerate Injuries 6 3 ↓ 50%
Minor / Other InjuriesMinor / Other InjuriesMinor / Other InjuriesMinor / Other Injuries 4 6 ↑ 50%
¹ Ending 91 days before the start of the warning letter period, 16 July 2010² Ending 31 December 2017
5 years before
installation¹
Total Casualties:Total Casualties:Total Casualties:Total Casualties: 11 ↑ 10%10
Percentage
change
Fatal and Serious CrashesFatal and Serious CrashesFatal and Serious CrashesFatal and Serious Crashes 0 2 Increase
• The camera at the intersection of Gordon Street and New Canterbury Road commenced issuing warning letters in October 2010. This camera enforces red-light running only.
Annual NSW Speed Camera Performance Review 2018 - Appendix B: Red-light speed cameras B127

• There is one camera at this intersection. This was previously a wet-film red-light camera location.
Casualties and FSI Crashes
0
2
4
6
8
10
12
-5Y -4Y -3Y -2Y -1Y 2011 2012 2013 2014 2015 2016 2017Number of years before and year after camera installation
Casualti
es / C
rashes
Uncategorised M inor/Other M oderate Injury
Serious Injury Killed FSI Crash
7156 Petersham - Parramatta Road at West Street
• The infringement graphs show the number of warning letters and infringements issued at this intersection as well as the trend in infringements since the camera began operation. Roadworks and camera maintenance may influence the number of infringements issued.
Status: Retain and Monitor. The previous wet-film red light camera may have influenced the before period data. Annual traffic counts have increased across NSW.
Casualties and casualty crashes at enforced intersection Infringements at enforced intersection
Red-Light Infringements
0
50
100
150
200
250
300
Sep-10
Mar-11
Sep-11
Mar-12
Sep-12
Mar-13
Sep-13
Mar-14
Sep-14
Mar-15
Sep-15
Mar-16
Sep-16
Mar-17
Sep-17
Month-Year
Infr
ingem
ents
per
Month
Red-light Warning Letters Red-light Infringements5 year
after period²
Casualty CrashesCasualty CrashesCasualty CrashesCasualty Crashes 16 8 ↓ 50%
Serious InjuriesSerious InjuriesSerious InjuriesSerious Injuries
FatalitiesFatalitiesFatalitiesFatalities
1 2 ↑ 100%
0 0 -
Pedestrian Casualties
Right Through Casualty Crashes
Adjacent Casualty Crashes
Rear End Casualty Crashes
1
6
3
6
0
3
2
2
↓ 100%
↓ 50%
↓ 33%
↓ 67%
Speeding Infringements
0
200
400
600
800
1000
1200
1400
1600
Sep-10
Mar-11
Sep-11
Mar-12
Sep-12
Mar-13
Sep-13
Mar-14
Sep-14
Mar-15
Sep-15
Mar-16
Sep-16
Mar-17
Sep-17
Month-Year
Infr
ingem
ents
per
Month
Speeding Warning Letters Speeding Infringements
Moderate InjuriesModerate InjuriesModerate InjuriesModerate Injuries 8 3 ↓ 63%
Minor / Other InjuriesMinor / Other InjuriesMinor / Other InjuriesMinor / Other Injuries 12 8 ↓ 33%
¹ Ending 91 days before the start of the warning letter period, 24 June 2010² Ending 31 December 2017
5 years before
installation¹
Total Casualties:Total Casualties:Total Casualties:Total Casualties: 13 ↓ 38%21
Percentage
change
Fatal and Serious CrashesFatal and Serious CrashesFatal and Serious CrashesFatal and Serious Crashes 1 2 ↑ 100%
• The camera at the intersection of Parramatta Road and West Street commenced issuing warning letters in September 2010.
Annual NSW Speed Camera Performance Review 2018 - Appendix B: Red-light speed cameras B128

• There is one camera at this intersection.
Casualties and FSI Crashes
0
2
4
6
8
10
12
14
-5Y -4Y -3Y -2Y -1Y 1YNumber of years before and after camera installation
Casualti
es / C
rashes
Uncategorised M inor/Other M oderate Injury
Serious Injury Killed FSI Crash
7334 Prospect - Great Western Highway at Clunies Ross Street
• The infringement graphs show the number of warning letters and infringements issued at this intersection as well as the trend in infringements since the camera began operation. Roadworks and camera maintenance may influence the number of infringements issued.
Status: Insufficient data (<5 years) to reliably assess.
Casualties and casualty crashes at enforced intersection Infringements at enforced intersection
Red-Light Infringements
0
10
20
30
40
50
60
70
80
90
100
Nov-16
Dec-16
Jan-17
Feb-17
Mar-17
Apr-17
May-17
Jun-17
Jul-17
Aug-17
Sep-17
Oct-17
Nov-17
Dec-17
Month-Year
Infr
ingem
ents
per
Month
Red-light Warning Letters Red-light Infringements1 year and 31 days
after installation²
Casualty CrashesCasualty CrashesCasualty CrashesCasualty Crashes 23 2 ↓ 60%
Serious InjuriesSerious InjuriesSerious InjuriesSerious Injuries
FatalitiesFatalitiesFatalitiesFatalities
14 2 ↓ 34%
0 0 -
Pedestrian Casualties
Right Through Casualty Crashes
Adjacent Casualty Crashes
Rear End Casualty Crashes
0
8
3
9
0
1
0
0
-
↓ 42%
↓ 100%
↓ 100%
Speeding Infringements
0
5
10
15
20
25
30
35
Nov-16
Dec-16
Jan-17
Feb-17
Mar-17
Apr-17
May-17
Jun-17
Jul-17
Aug-17
Sep-17
Oct-17
Nov-17
Dec-17
Month-Year
Infr
ingem
ents
per
Month
Speeding Warning Letters Speeding Infringements
Moderate InjuriesModerate InjuriesModerate InjuriesModerate Injuries 9 1 ↓ 49%
Minor / Other InjuriesMinor / Other InjuriesMinor / Other InjuriesMinor / Other Injuries 13 1 ↓ 65%
¹ Ending 91 days before the start of the warning letter period, 31 August 2016² Ending 31 December 2017³ The percentage change is based on annualised crash data to allow for a direct comparison between the pre and post installation time periods. Red values indicate an increase.
5 years before
installation¹
Total Casualties:Total Casualties:Total Casualties:Total Casualties: 4 ↓ 49%36
Percentage
change³
Fatal and Serious CrashesFatal and Serious CrashesFatal and Serious CrashesFatal and Serious Crashes 9 2 ↑ 3%
• The camera at the intersection of Great Western Highway and Clunies Ross Street commenced issuing warning letters in November 2016.
Annual NSW Speed Camera Performance Review 2018 - Appendix B: Red-light speed cameras B129

• There is one camera at this intersection. This was previously a wet-film red-light camera location.
Casualties and FSI Crashes
0
1
2
3
4
5
-5Y -4Y -3Y -2Y -1Y 1Y 2Y 3Y 4YNumber of years before and after camera installation
Casualti
es / C
rashes
Uncategorised M inor/Other M oderate Injury
Serious Injury Killed FSI Crash
7286 Ramsgate - Rocky Point Road at Ramsgate Road
• The infringement graphs show the number of warning letters and infringements issued at this intersection as well as the trend in infringements since the camera began operation. Roadworks and camera maintenance may influence the number of infringements issued.
Status: Insufficient data (<5 years) to reliably assess.
Casualties and casualty crashes at enforced intersection Infringements at enforced intersection
Red-Light Infringements
0
5
10
15
20
25
30
35
40
45
Sep-13
Dec-13
Mar-14
Jun-14
Sep-14
Dec-14
Mar-15
Jun-15
Sep-15
Dec-15
Mar-16
Jun-16
Sep-16
Dec-16
Mar-17
Jun-17
Sep-17
Dec-17
Month-Year
Infr
ingem
ents
per
Month
Red-light Warning Letters Red-light Infringements4 years and 95 days
after installation²
Casualty CrashesCasualty CrashesCasualty CrashesCasualty Crashes 9 1 ↓ 87%
Serious InjuriesSerious InjuriesSerious InjuriesSerious Injuries
FatalitiesFatalitiesFatalitiesFatalities
0 0 -
0 0 -
Pedestrian Casualties
Right Through Casualty Crashes
Adjacent Casualty Crashes
Rear End Casualty Crashes
0
0
3
4
0
0
0
0
-
-
↓ 100%
↓ 100%
Speeding Infringements
0
10
20
30
40
50
60
Sep-13
Jan-14
May-14
Sep-14
Jan-15
May-15
Sep-15
Jan-16
May-16
Sep-16
Jan-17
May-17
Sep-17
Month-Year
Infr
ingem
ents
per
Month
Speeding Warning Letters Speeding Infringements
Moderate InjuriesModerate InjuriesModerate InjuriesModerate Injuries 9 0 ↓ 100%
Minor / Other InjuriesMinor / Other InjuriesMinor / Other InjuriesMinor / Other Injuries 2 1 ↓ 41%
¹ Ending 91 days before the start of the warning letter period, 28 June 2013² Ending 31 December 2017³ The percentage change is based on annualised crash data to allow for a direct comparison between the pre and post installation time periods. Red values indicate an increase.
5 years before
installation¹
Total Casualties:Total Casualties:Total Casualties:Total Casualties: 1 ↓ 89%11
Percentage
change³
Fatal and Serious CrashesFatal and Serious CrashesFatal and Serious CrashesFatal and Serious Crashes 0 0 -
• The camera at the intersection of Rocky Point Road and Ramsgate Road commenced issuing warning letters in September 2013.
Annual NSW Speed Camera Performance Review 2018 - Appendix B: Red-light speed cameras B130

• There is one camera at this intersection.
Casualties and FSI Crashes
0
2
4
6
8
10
-5Y -4Y -3Y -2Y -1Y 1Y 2Y 3Y 4YNumber of years before and after camera installation
Casualti
es / C
rashes
Uncategorised M inor/Other M oderate Injury
Serious Injury Killed FSI Crash
7285 Randwick - Alison Street at Avoca Street
• The infringement graphs show the number of warning letters and infringements issued at this intersection as well as the trend in infringements since the camera began operation. Roadworks and camera maintenance may influence the number of infringements issued.
Status: Insufficient data (<5 years) to reliably assess.
Casualties and casualty crashes at enforced intersection Infringements at enforced intersection
Red-Light Infringements
0
50
100
150
200
250
Nov-13
Feb-14
May-14
Aug-14
Nov-14
Feb-15
May-15
Aug-15
Nov-15
Feb-16
May-16
Aug-16
Nov-16
Feb-17
May-17
Aug-17
Nov-17
Month-Year
Infr
ingem
ents
per
Month
Red-light Warning Letters Red-light Infringements4 years and 32 days
after installation²
Casualty CrashesCasualty CrashesCasualty CrashesCasualty Crashes 13 4 ↓ 62%
Serious InjuriesSerious InjuriesSerious InjuriesSerious Injuries
FatalitiesFatalitiesFatalitiesFatalities
4 0 ↓ 100%
0 0 -
Pedestrian Casualties
Right Through Casualty Crashes
Adjacent Casualty Crashes
Rear End Casualty Crashes
1
1
3
4
0
1
0
2
↓ 100%
↑ 22%
↓ 100%
↓ 39%
Speeding Infringements
0
2
4
6
8
10
12
14
Nov-13
Feb-14
May-14
Aug-14
Nov-14
Feb-15
May-15
Aug-15
Nov-15
Feb-16
May-16
Aug-16
Nov-16
Feb-17
May-17
Aug-17
Nov-17
Month-Year
Infr
ingem
ents
per
Month
Speeding Warning Letters Speeding Infringements
Moderate InjuriesModerate InjuriesModerate InjuriesModerate Injuries 8 3 ↓ 54%
Minor / Other InjuriesMinor / Other InjuriesMinor / Other InjuriesMinor / Other Injuries 5 3 ↓ 27%
¹ Ending 91 days before the start of the warning letter period, 30 August 2013² Ending 31 December 2017³ The percentage change is based on annualised crash data to allow for a direct comparison between the pre and post installation time periods. Red values indicate an increase.
5 years before
installation¹
Total Casualties:Total Casualties:Total Casualties:Total Casualties: 6 ↓ 57%17
Percentage
change³
Fatal and Serious CrashesFatal and Serious CrashesFatal and Serious CrashesFatal and Serious Crashes 4 0 ↓ 100%
• The camera at the intersection of Alison Road and Avoca Street commenced issuing warning letters in November 2013.
Annual NSW Speed Camera Performance Review 2018 - Appendix B: Red-light speed cameras B131

• There is one camera at this intersection. This was previously a wet-film red-light camera location.
Casualties and FSI Crashes
0
2
4
6
8
10
-5Y -4Y -3Y -2Y -1Y 2012 2013 2014 2015 2016 2017Number of years before and year after camera installation
Casualti
es / C
rashes
Uncategorised M inor/Other M oderate Injury
Serious Injury Killed FSI Crash
7199 Randwick - Avoca Street at Darley Road
• The infringement graphs show the number of warning letters and infringements issued at this intersection as well as the trend in infringements since the camera began operation. Roadworks and camera maintenance may influence the number of infringements issued.
Status: Retain.
Casualties and casualty crashes at enforced intersection Infringements at enforced intersection
Red-Light Infringements
0
10
20
30
40
50
60
70
80
Jun-11
Dec-11
Jun-12
Dec-12
Jun-13
Dec-13
Jun-14
Dec-14
Jun-15
Dec-15
Jun-16
Dec-16
Jun-17
Dec-17
Month-Year
Infr
ingem
ents
per
Month
Red-light Warning Letters Red-light Infringements5 year
after period²
Casualty CrashesCasualty CrashesCasualty CrashesCasualty Crashes 13 12 ↓ 8%
Serious InjuriesSerious InjuriesSerious InjuriesSerious Injuries
FatalitiesFatalitiesFatalitiesFatalities
3 2 ↓ 33%
0 0 -
Pedestrian Casualties
Right Through Casualty Crashes
Adjacent Casualty Crashes
Rear End Casualty Crashes
1
4
3
4
0
2
2
4
↓ 100%
↓ 50%
↓ 33%
↓ 0%
Speeding Infringements
0
5
10
15
20
25
30
Jun-11
Dec-11
Jun-12
Dec-12
Jun-13
Dec-13
Jun-14
Dec-14
Jun-15
Dec-15
Jun-16
Dec-16
Jun-17
Dec-17
Month-Year
Infr
ingem
ents
per
Month
Speeding Warning Letters Speeding Infringements
Moderate InjuriesModerate InjuriesModerate InjuriesModerate Injuries 6 7 ↑ 17%
Minor / Other InjuriesMinor / Other InjuriesMinor / Other InjuriesMinor / Other Injuries 11 5 ↓ 55%
¹ Ending 91 days before the start of the warning letter period, 22 March 2011² Ending 31 December 2017
5 years before
installation¹
Total Casualties:Total Casualties:Total Casualties:Total Casualties: 14 ↓ 30%20
Percentage
change
Fatal and Serious CrashesFatal and Serious CrashesFatal and Serious CrashesFatal and Serious Crashes 3 2 ↓ 33%
• The camera at the intersection of Avoca Street and Darley Road commenced issuing warning letters in June 2011.
Annual NSW Speed Camera Performance Review 2018 - Appendix B: Red-light speed cameras B132
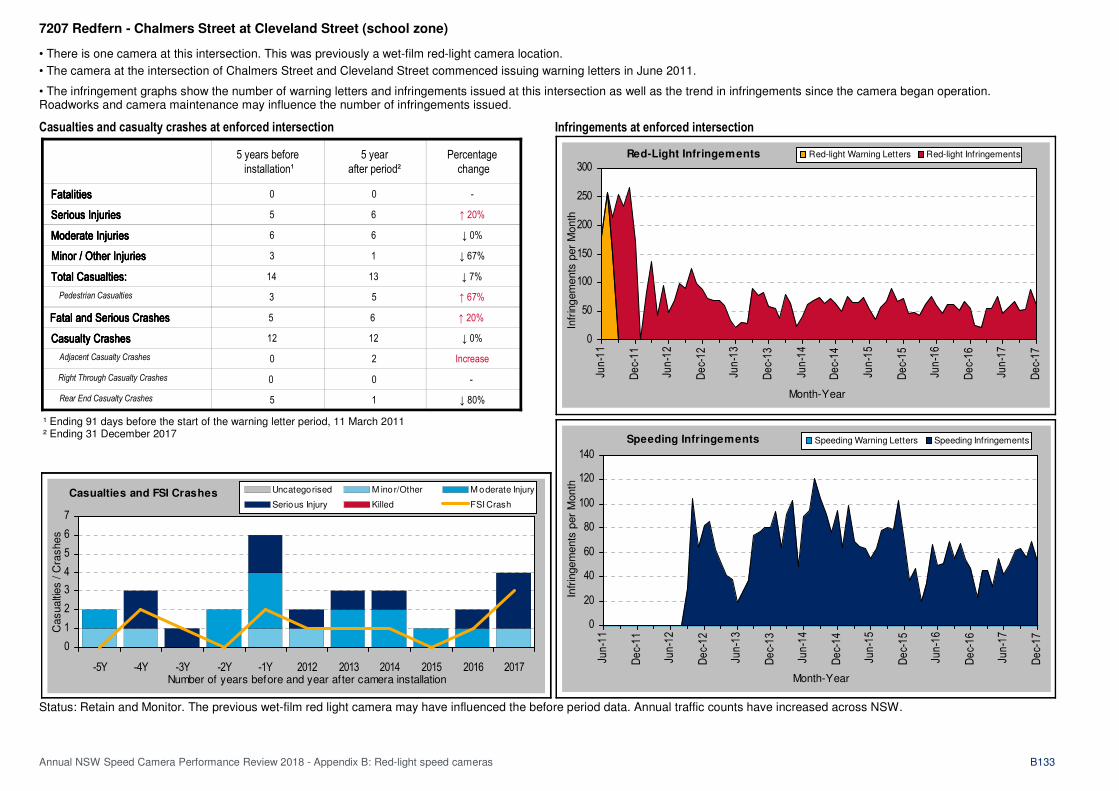
• There is one camera at this intersection. This was previously a wet-film red-light camera location.
Casualties and FSI Crashes
0
1
2
3
4
5
6
7
-5Y -4Y -3Y -2Y -1Y 2012 2013 2014 2015 2016 2017Number of years before and year after camera installation
Casualti
es / C
rashes
Uncategorised M inor/Other M oderate Injury
Serious Injury Killed FSI Crash
7207 Redfern - Chalmers Street at Cleveland Street (school zone)
• The infringement graphs show the number of warning letters and infringements issued at this intersection as well as the trend in infringements since the camera began operation. Roadworks and camera maintenance may influence the number of infringements issued.
Status: Retain and Monitor. The previous wet-film red light camera may have influenced the before period data. Annual traffic counts have increased across NSW.
Casualties and casualty crashes at enforced intersection Infringements at enforced intersection
Red-Light Infringements
0
50
100
150
200
250
300
Jun-11
Dec-11
Jun-12
Dec-12
Jun-13
Dec-13
Jun-14
Dec-14
Jun-15
Dec-15
Jun-16
Dec-16
Jun-17
Dec-17
Month-Year
Infr
ingem
ents
per
Month
Red-light Warning Letters Red-light Infringements5 year
after period²
Casualty CrashesCasualty CrashesCasualty CrashesCasualty Crashes 12 12 ↓ 0%
Serious InjuriesSerious InjuriesSerious InjuriesSerious Injuries
FatalitiesFatalitiesFatalitiesFatalities
5 6 ↑ 20%
0 0 -
Pedestrian Casualties
Right Through Casualty Crashes
Adjacent Casualty Crashes
Rear End Casualty Crashes
3
0
0
5
5
0
2
1
↑ 67%
-
Increase
↓ 80%
Speeding Infringements
0
20
40
60
80
100
120
140
Jun-11
Dec-11
Jun-12
Dec-12
Jun-13
Dec-13
Jun-14
Dec-14
Jun-15
Dec-15
Jun-16
Dec-16
Jun-17
Dec-17
Month-Year
Infr
ingem
ents
per
Month
Speeding Warning Letters Speeding Infringements
Moderate InjuriesModerate InjuriesModerate InjuriesModerate Injuries 6 6 ↓ 0%
Minor / Other InjuriesMinor / Other InjuriesMinor / Other InjuriesMinor / Other Injuries 3 1 ↓ 67%
¹ Ending 91 days before the start of the warning letter period, 11 March 2011² Ending 31 December 2017
5 years before
installation¹
Total Casualties:Total Casualties:Total Casualties:Total Casualties: 13 ↓ 7%14
Percentage
change
Fatal and Serious CrashesFatal and Serious CrashesFatal and Serious CrashesFatal and Serious Crashes 5 6 ↑ 20%
• The camera at the intersection of Chalmers Street and Cleveland Street commenced issuing warning letters in June 2011.
Annual NSW Speed Camera Performance Review 2018 - Appendix B: Red-light speed cameras B133

• There is one camera at this intersection.
Casualties and FSI Crashes
0
1
2
3
4
-5Y -4Y -3Y -2Y -1Y 1Y 2Y 3YNumber of years before and after camera installation
Casualti
es / C
rashes
Uncategorised M inor/Other M oderate Injury
Serious Injury Killed FSI Crash
7306 Richmond - March Street at East Market Street
• The infringement graphs show the number of warning letters and infringements issued at this intersection as well as the trend in infringements since the camera began operation. Roadworks and camera maintenance may influence the number of infringements issued.
Status: Insufficient data (<5 years) to reliably assess.
Casualties and casualty crashes at enforced intersection Infringements at enforced intersection
Red-Light Infringements
0
50
100
150
200
250
300
350
Aug-14
Nov-14
Feb-15
May-15
Aug-15
Nov-15
Feb-16
May-16
Aug-16
Nov-16
Feb-17
May-17
Aug-17
Nov-17
Month-Year
Infr
ingem
ents
per
Month
Red-light Warning Letters Red-light Infringements3 years and 126
days after installation²
Casualty CrashesCasualty CrashesCasualty CrashesCasualty Crashes 6 2 ↓ 50%
Serious InjuriesSerious InjuriesSerious InjuriesSerious Injuries
FatalitiesFatalitiesFatalitiesFatalities
1 0 ↓ 100%
0 0 -
Pedestrian Casualties
Right Through Casualty Crashes
Adjacent Casualty Crashes
Rear End Casualty Crashes
0
5
1
0
0
0
1
1
-
↓ 100%
↑ 49%
Increase
Speeding Infringements
0
0.5
1
1.5
2
2.5
3
3.5
Aug-14
Nov-14
Feb-15
May-15
Aug-15
Nov-15
Feb-16
May-16
Aug-16
Nov-16
Feb-17
May-17
Aug-17
Nov-17
Month-Year
Infr
ingem
ents
per
Month
Speeding Warning Letters Speeding Infringements
Moderate InjuriesModerate InjuriesModerate InjuriesModerate Injuries 4 2 ↓ 25%
Minor / Other InjuriesMinor / Other InjuriesMinor / Other InjuriesMinor / Other Injuries 3 0 ↓ 100%
¹ Ending 91 days before the start of the warning letter period, 28 May 2014² Ending 31 December 2017³ The percentage change is based on annualised crash data to allow for a direct comparison between the pre and post installation time periods. Red values indicate an increase.
5 years before
installation¹
Total Casualties:Total Casualties:Total Casualties:Total Casualties: 2 ↓ 63%8
Percentage
change³
Fatal and Serious CrashesFatal and Serious CrashesFatal and Serious CrashesFatal and Serious Crashes 1 0 ↓ 100%
• The camera at the intersection of March Street and East Market Street commenced issuing warning letters in August 2014.
Annual NSW Speed Camera Performance Review 2018 - Appendix B: Red-light speed cameras B134

• There is one camera at this intersection. This was previously a wet-film red-light camera location.
Casualties and FSI Crashes
0
2
4
6
8
10
-5Y -4Y -3Y -2Y -1Y 2011 2012 2013 2014 2015 2016 2017Number of years before and year after camera installation
Casualti
es / C
rashes
Uncategorised M inor/Other M oderate Injury
Serious Injury Killed FSI Crash
7175 Rockdale - Bestic Street at West Botany Street
• The infringement graphs show the number of warning letters and infringements issued at this intersection as well as the trend in infringements since the camera began operation. Roadworks and camera maintenance may influence the number of infringements issued.
Status: Retain.
Casualties and casualty crashes at enforced intersection Infringements at enforced intersection
Red-Light Infringements
0
20
40
60
80
100
120
140
160
180
200
Nov-10
May-11
Nov-11
May-12
Nov-12
May-13
Nov-13
May-14
Nov-14
May-15
Nov-15
May-16
Nov-16
May-17
Nov-17
Month-Year
Infr
ingem
ents
per
Month
Red-light Warning Letters Red-light Infringements5 year
after period²
Casualty CrashesCasualty CrashesCasualty CrashesCasualty Crashes 18 13 ↓ 28%
Serious InjuriesSerious InjuriesSerious InjuriesSerious Injuries
FatalitiesFatalitiesFatalitiesFatalities
7 5 ↓ 29%
0 0 -
Pedestrian Casualties
Right Through Casualty Crashes
Adjacent Casualty Crashes
Rear End Casualty Crashes
0
8
8
0
0
2
6
3
-
↓ 75%
↓ 25%
Increase
Speeding Infringements
0
0.5
1
1.5
2
2.5
3
3.5
4
4.5
Nov-10
May-11
Nov-11
May-12
Nov-12
May-13
Nov-13
May-14
Nov-14
May-15
Nov-15
May-16
Nov-16
May-17
Nov-17
Month-Year
Infr
ingem
ents
per
Month
Speeding Warning Letters Speeding Infringements
Moderate InjuriesModerate InjuriesModerate InjuriesModerate Injuries 17 9 ↓ 47%
Minor / Other InjuriesMinor / Other InjuriesMinor / Other InjuriesMinor / Other Injuries 6 3 ↓ 50%
¹ Ending 91 days before the start of the warning letter period, 12 August 2010² Ending 31 December 2017
5 years before
installation¹
Total Casualties:Total Casualties:Total Casualties:Total Casualties: 17 ↓ 43%30
Percentage
change
Fatal and Serious CrashesFatal and Serious CrashesFatal and Serious CrashesFatal and Serious Crashes 5 4 ↓ 20%
• The camera at the intersection of Bestic Street and West Botany Street commenced issuing warning letters in November 2010.
Annual NSW Speed Camera Performance Review 2018 - Appendix B: Red-light speed cameras B135

• There are two cameras at this intersection. This was previously a wet-film red-light camera location.
Casualties and FSI Crashes
0
2
4
6
8
10
12
-5Y -4Y -3Y -2Y -1Y 2011 2012 2013 2014 2015 2016 2017Number of years before and year after camera installation
Casualti
es / C
rashes
Uncategorised M inor/Other M oderate Injury
Serious Injury Killed FSI Crash
7131|7132 Rockdale - Princes Highway at Bay Street / The Seven Ways
• The infringement graphs show the number of warning letters and infringements issued at this intersection as well as the trend in infringements since the camera began operation. Roadworks and camera maintenance may influence the number of infringements issued.
Status: Retain.
Casualties and casualty crashes at enforced intersection Infringements at enforced intersection
Red-Light Infringements
0
50
100
150
200
250
300
Jul-10
Jan-11
Jul-11
Jan-12
Jul-12
Jan-13
Jul-13
Jan-14
Jul-14
Jan-15
Jul-15
Jan-16
Jul-16
Jan-17
Jul-17
Month-Year
Infr
ingem
ents
per
Month
Red-light Warning Letters Red-light Infringements5 year
after period²
Casualty CrashesCasualty CrashesCasualty CrashesCasualty Crashes 27 15 ↓ 44%
Serious InjuriesSerious InjuriesSerious InjuriesSerious Injuries
FatalitiesFatalitiesFatalitiesFatalities
9 2 ↓ 78%
0 0 -
Pedestrian Casualties
Right Through Casualty Crashes
Adjacent Casualty Crashes
Rear End Casualty Crashes
3
11
2
6
2
4
0
7
↓ 33%
↓ 64%
↓ 100%
↑ 17%
Speeding Infringements
0
10
20
30
40
50
60
70
Jul-10
Jan-11
Jul-11
Jan-12
Jul-12
Jan-13
Jul-13
Jan-14
Jul-14
Jan-15
Jul-15
Jan-16
Jul-16
Jan-17
Jul-17
Month-Year
Infr
ingem
ents
per
Month
Speeding Warning Letters Speeding Infringements
Moderate InjuriesModerate InjuriesModerate InjuriesModerate Injuries 15 8 ↓ 47%
Minor / Other InjuriesMinor / Other InjuriesMinor / Other InjuriesMinor / Other Injuries 10 8 ↓ 20%
¹ Ending 91 days before the start of the warning letter period, 30 April 2010² Ending 31 December 2017
5 years before
installation¹
Total Casualties:Total Casualties:Total Casualties:Total Casualties: 18 ↓ 47%34
Percentage
change
Fatal and Serious CrashesFatal and Serious CrashesFatal and Serious CrashesFatal and Serious Crashes 9 1 ↓ 89%
• The camera at the intersection of Princes Highway and The Seven Ways (northbound) commenced issuing warning letters in July 2010.
• The camera at the intersection of Princes Highway and Bay Street (southbound) commenced issuing warning letters in June 2011.
Annual NSW Speed Camera Performance Review 2018 - Appendix B: Red-light speed cameras B136

• There is one camera at this intersection.
Casualties and FSI Crashes
0
5
10
15
20
-5Y -4Y -3Y -2Y -1Y 1Y 2YNumber of years before and after camera installation
Casualti
es / C
rashes
Uncategorised M inor/Other M oderate Injury
Serious Injury Killed FSI Crash
7328 Rooty Hill - Woodstock Avenue at M7 northbound off-ramp
• The infringement graphs show the number of warning letters and infringements issued at this intersection as well as the trend in infringements since the camera began operation. Roadworks and camera maintenance may influence the number of infringements issued.
Status: Insufficient data (<5 years) to reliably assess.
Casualties and casualty crashes at enforced intersection Infringements at enforced intersection
Red-Light Infringements
0
20
40
60
80
100
120
140
160
180
Jul-15
Sep-15
Nov-15
Jan-16
Mar-16
May-16
Jul-16
Sep-16
Nov-16
Jan-17
Mar-17
May-17
Jul-17
Sep-17
Nov-17
Month-Year
Infr
ingem
ents
per
Month
Red-light Warning Letters Red-light Infringements2 years and 157
days after installation²
Casualty CrashesCasualty CrashesCasualty CrashesCasualty Crashes 17 4 ↓ 52%
Serious InjuriesSerious InjuriesSerious InjuriesSerious Injuries
FatalitiesFatalitiesFatalitiesFatalities
10 2 ↓ 59%
0 0 -
Pedestrian Casualties
Right Through Casualty Crashes
Adjacent Casualty Crashes
Rear End Casualty Crashes
0
0
1
2
0
1
0
0
-
Increase
↓ 100%
↓ 100%
Speeding Infringements
0
100
200
300
400
500
600
Jul-15
Sep-15
Nov-15
Jan-16
Mar-16
May-16
Jul-16
Sep-16
Nov-16
Jan-17
Mar-17
May-17
Jul-17
Sep-17
Nov-17
Month-Year
Infr
ingem
ents
per
Month
Speeding Warning Letters Speeding Infringements
Moderate InjuriesModerate InjuriesModerate InjuriesModerate Injuries 11 0 ↓ 100%
Minor / Other InjuriesMinor / Other InjuriesMinor / Other InjuriesMinor / Other Injuries 9 2 ↓ 54%
¹ Ending 91 days before the start of the warning letter period, 28 April 2015² Ending 31 December 2017³ The percentage change is based on annualised crash data to allow for a direct comparison between the pre and post installation time periods. Red values indicate an increase.
5 years before
installation¹
Total Casualties:Total Casualties:Total Casualties:Total Casualties: 4 ↓ 73%30
Percentage
change³
Fatal and Serious CrashesFatal and Serious CrashesFatal and Serious CrashesFatal and Serious Crashes 8 2 ↓ 49%
• The camera at the intersection of Woodstock Avenue and M7 Northbound off ramp (Northbound) commenced issuing warning letters in July 2015.
Annual NSW Speed Camera Performance Review 2018 - Appendix B: Red-light speed cameras B137

• There is one camera at this intersection. This was previously a wet-film red-light camera location.
Casualties and FSI Crashes
0
2
4
6
8
-5Y -4Y -3Y -2Y -1Y 2011 2012 2013 2014 2015 2016 2017Number of years before and year after camera installation
Casualti
es / C
rashes
Uncategorised M inor/Other M oderate Injury
Serious Injury Killed FSI Crash
7169 Roselands - King Georges Road at Moorefields Road
• The infringement graphs show the number of warning letters and infringements issued at this intersection as well as the trend in infringements since the camera began operation. Roadworks and camera maintenance may influence the number of infringements issued. Speed limit changed from 70 to 60 in October 2011.
Status: Retain.
Casualties and casualty crashes at enforced intersection Infringements at enforced intersection
Red-Light Infringements
0
20
40
60
80
100
120
140
160
180
200
Oct-10
Apr-11
Oct-11
Apr-12
Oct-12
Apr-13
Oct-13
Apr-14
Oct-14
Apr-15
Oct-15
Apr-16
Oct-16
Apr-17
Oct-17
Month-Year
Infr
ingem
ents
per
Month
Red-light Warning Letters Red-light Infringements5 year
after period²
Casualty CrashesCasualty CrashesCasualty CrashesCasualty Crashes 13 9 ↓ 31%
Serious InjuriesSerious InjuriesSerious InjuriesSerious Injuries
FatalitiesFatalitiesFatalitiesFatalities
2 0 ↓ 100%
0 0 -
Pedestrian Casualties
Right Through Casualty Crashes
Adjacent Casualty Crashes
Rear End Casualty Crashes
0
4
0
6
0
0
0
7
-
↓ 100%
-
↑ 17%
Speeding Infringements
0
100
200
300
400
500
600
700
800
900
Oct-10
Apr-11
Oct-11
Apr-12
Oct-12
Apr-13
Oct-13
Apr-14
Oct-14
Apr-15
Oct-15
Apr-16
Oct-16
Apr-17
Oct-17
Month-Year
Infr
ingem
ents
per
Month
Speeding Warning Letters Speeding Infringements
Moderate InjuriesModerate InjuriesModerate InjuriesModerate Injuries 14 2 ↓ 86%
Minor / Other InjuriesMinor / Other InjuriesMinor / Other InjuriesMinor / Other Injuries 6 8 ↑ 33%
¹ Ending 91 days before the start of the warning letter period, 2 July 2010² Ending 31 December 2017
5 years before
installation¹
Total Casualties:Total Casualties:Total Casualties:Total Casualties: 10 ↓ 55%22
Percentage
change
Fatal and Serious CrashesFatal and Serious CrashesFatal and Serious CrashesFatal and Serious Crashes 2 0 ↓ 100%
• The camera at the intersection of King Georges Road and Moorefields Road commenced issuing warning letters in October 2010.
Annual NSW Speed Camera Performance Review 2018 - Appendix B: Red-light speed cameras B138

• There are two cameras at this intersection.
Casualties and FSI Crashes
0
2
4
6
8
10
-5Y -4Y -3Y -2Y -1Y 2011 2012 2013 2014 2015 2016 2017Number of years before and year after camera installation
Casualti
es / C
rashes
Uncategorised M inor/Other M oderate Injury
Serious Injury Killed FSI Crash
7114|7115 Roselands / Wiley Park - Canterbury Road at King Georges Road
• The infringement graphs show the number of warning letters and infringements issued at this intersection as well as the trend in infringements since the camera began operation. Roadworks and camera maintenance may influence the number of infringements issued.
Status: Retain.
Casualties and casualty crashes at enforced intersection Infringements at enforced intersection
Red-Light Infringements
0
100
200
300
400
500
600
700
800
Jun-10
Dec-10
Jun-11
Dec-11
Jun-12
Dec-12
Jun-13
Dec-13
Jun-14
Dec-14
Jun-15
Dec-15
Jun-16
Dec-16
Jun-17
Dec-17
Month-Year
Infr
ingem
ents
per
Month
Red-light Warning Letters Red-light Infringements5 year
after period²
Casualty CrashesCasualty CrashesCasualty CrashesCasualty Crashes 26 15 ↓ 42%
Serious InjuriesSerious InjuriesSerious InjuriesSerious Injuries
FatalitiesFatalitiesFatalitiesFatalities
5 2 ↓ 60%
0 0 -
Pedestrian Casualties
Right Through Casualty Crashes
Adjacent Casualty Crashes
Rear End Casualty Crashes
0
3
1
15
0
1
0
9
-
↓ 67%
↓ 100%
↓ 40%
Speeding Infringements
0
20
40
60
80
100
120
140
160
180
200
Jun-10
Dec-10
Jun-11
Dec-11
Jun-12
Dec-12
Jun-13
Dec-13
Jun-14
Dec-14
Jun-15
Dec-15
Jun-16
Dec-16
Jun-17
Dec-17
Month-Year
Infr
ingem
ents
per
Month
Speeding Warning Letters Speeding Infringements
Moderate InjuriesModerate InjuriesModerate InjuriesModerate Injuries 13 1 ↓ 92%
Minor / Other InjuriesMinor / Other InjuriesMinor / Other InjuriesMinor / Other Injuries 13 15 ↑ 15%
¹ Ending 91 days before the start of the warning letter period, 30 March 2010² Ending 31 December 2017
5 years before
installation¹
Total Casualties:Total Casualties:Total Casualties:Total Casualties: 18 ↓ 42%31
Percentage
change
Fatal and Serious CrashesFatal and Serious CrashesFatal and Serious CrashesFatal and Serious Crashes 4 2 ↓ 50%
• The camera at the intersection of Canterbury Road and King Georges Road (westbound) commenced issuing warning letters in June 2010.
• The camera at the intersection of Canterbury Road and King Georges Road (eastbound) commenced issuing warning letters in August 2010.
Annual NSW Speed Camera Performance Review 2018 - Appendix B: Red-light speed cameras B139

• There is one camera at this intersection. This was previously a wet-film red-light camera location.
Casualties and FSI Crashes
0
1
2
3
4
5
6
7
-5Y -4Y -3Y -2Y -1Y 2011 2012 2013 2014 2015 2016 2017Number of years before and year after camera installation
Casualti
es / C
rashes
Uncategorised M inor/Other M oderate Injury
Serious Injury Killed FSI Crash
7163 Rozelle - Victoria Road at Evans Street
• The infringement graphs show the number of warning letters and infringements issued at this intersection as well as the trend in infringements since the camera began operation. Roadworks and camera maintenance may influence the number of infringements issued.
Status: Retain.
Casualties and casualty crashes at enforced intersection Infringements at enforced intersection
Red-Light Infringements
0
20
40
60
80
100
120
140
Oct-10
Apr-11
Oct-11
Apr-12
Oct-12
Apr-13
Oct-13
Apr-14
Oct-14
Apr-15
Oct-15
Apr-16
Oct-16
Apr-17
Oct-17
Month-Year
Infr
ingem
ents
per
Month
Red-light Warning Letters Red-light Infringements5 year
after period²
Casualty CrashesCasualty CrashesCasualty CrashesCasualty Crashes 18 10 ↓ 44%
Serious InjuriesSerious InjuriesSerious InjuriesSerious Injuries
FatalitiesFatalitiesFatalitiesFatalities
4 1 ↓ 75%
0 0 -
Pedestrian Casualties
Right Through Casualty Crashes
Adjacent Casualty Crashes
Rear End Casualty Crashes
2
2
8
3
1
0
2
6
↓ 50%
↓ 100%
↓ 75%
↑ 100%
Speeding Infringements
0
500
1000
1500
2000
2500
3000
Oct-10
Apr-11
Oct-11
Apr-12
Oct-12
Apr-13
Oct-13
Apr-14
Oct-14
Apr-15
Oct-15
Apr-16
Oct-16
Apr-17
Oct-17
Month-Year
Infr
ingem
ents
per
Month
Speeding Warning Letters Speeding Infringements
Moderate InjuriesModerate InjuriesModerate InjuriesModerate Injuries 7 5 ↓ 29%
Minor / Other InjuriesMinor / Other InjuriesMinor / Other InjuriesMinor / Other Injuries 10 4 ↓ 60%
¹ Ending 91 days before the start of the warning letter period, 16 July 2010² Ending 31 December 2017
5 years before
installation¹
Total Casualties:Total Casualties:Total Casualties:Total Casualties: 10 ↓ 52%21
Percentage
change
Fatal and Serious CrashesFatal and Serious CrashesFatal and Serious CrashesFatal and Serious Crashes 4 1 ↓ 75%
• The camera at the intersection of Victoria Road and Evans Street commenced issuing warning letters in October 2010.
Annual NSW Speed Camera Performance Review 2018 - Appendix B: Red-light speed cameras B140

• There is one camera at this intersection. This was previously a wet-film red-light camera location.
Casualties and FSI Crashes
0
2
4
6
8
10
12
14
-5Y -4Y -3Y -2Y -1Y 2011 2012 2013 2014 2015 2016 2017Number of years before and year after camera installation
Casualti
es / C
rashes
Uncategorised M inor/Other M oderate Injury
Serious Injury Killed FSI Crash
7152 Rozelle - Wellington Street at Victoria Road
• The infringement graphs show the number of warning letters and infringements issued at this intersection as well as the trend in infringements since the camera began operation. Roadworks and camera maintenance may influence the number of infringements issued.
Status: Retain.
Casualties and casualty crashes at enforced intersection Infringements at enforced intersection
Red-Light Infringements
0
50
100
150
200
250
Sep-10
Mar-11
Sep-11
Mar-12
Sep-12
Mar-13
Sep-13
Mar-14
Sep-14
Mar-15
Sep-15
Mar-16
Sep-16
Mar-17
Sep-17
Month-Year
Infr
ingem
ents
per
Month
Red-light Warning Letters Red-light Infringements5 year
after period²
Casualty CrashesCasualty CrashesCasualty CrashesCasualty Crashes 26 7 ↓ 73%
Serious InjuriesSerious InjuriesSerious InjuriesSerious Injuries
FatalitiesFatalitiesFatalitiesFatalities
6 1 ↓ 83%
0 0 -
Pedestrian Casualties
Right Through Casualty Crashes
Adjacent Casualty Crashes
Rear End Casualty Crashes
1
1
7
4
0
0
1
4
↓ 100%
↓ 100%
↓ 86%
↓ 0%
Moderate InjuriesModerate InjuriesModerate InjuriesModerate Injuries 16 4 ↓ 75%
Minor / Other InjuriesMinor / Other InjuriesMinor / Other InjuriesMinor / Other Injuries 15 3 ↓ 80%
¹ Ending 91 days before the start of the warning letter period, 29 June 2010² Ending 31 December 2017
5 years before
installation¹
Total Casualties:Total Casualties:Total Casualties:Total Casualties: 8 ↓ 78%37
Percentage
change
Fatal and Serious CrashesFatal and Serious CrashesFatal and Serious CrashesFatal and Serious Crashes 6 1 ↓ 83%
• The camera at the intersection of Wellington Street and Victoria Road commenced issuing warning letters in September 2010. This camera enforces red-light running only.
Annual NSW Speed Camera Performance Review 2018 - Appendix B: Red-light speed cameras B141

• There is one camera at this intersection. This was previously a wet-film red-light camera location.
Casualties and FSI Crashes
0
2
4
6
8
10
-5Y -4Y -3Y -2Y -1Y 2012 2013 2014 2015 2016 2017Number of years before and year after camera installation
Casualti
es / C
rashes
Uncategorised M inor/Other M oderate Injury
Serious Injury Killed FSI Crash
7203 Ryde - Victoria Road at Devlin Street
• The infringement graphs show the number of warning letters and infringements issued at this intersection as well as the trend in infringements since the camera began operation. Roadworks and camera maintenance may influence the number of infringements issued.
Status: Retain and Monitor. The previous wet-film red light camera may have influenced the before period data. Annual traffic counts have increased across NSW.
Casualties and casualty crashes at enforced intersection Infringements at enforced intersection
Red-Light Infringements
0
20
40
60
80
100
120
140
160
Jun-11
Dec-11
Jun-12
Dec-12
Jun-13
Dec-13
Jun-14
Dec-14
Jun-15
Dec-15
Jun-16
Dec-16
Jun-17
Dec-17
Month-Year
Infr
ingem
ents
per
Month
Red-light Warning Letters Red-light Infringements5 year
after period²
Casualty CrashesCasualty CrashesCasualty CrashesCasualty Crashes 13 11 ↓ 15%
Serious InjuriesSerious InjuriesSerious InjuriesSerious Injuries
FatalitiesFatalitiesFatalitiesFatalities
1 2 ↑ 100%
0 0 -
Pedestrian Casualties
Right Through Casualty Crashes
Adjacent Casualty Crashes
Rear End Casualty Crashes
0
6
0
3
1
2
0
4
Increase
↓ 67%
-
↑ 33%
Speeding Infringements
0
100
200
300
400
500
600
Jun-11
Dec-11
Jun-12
Dec-12
Jun-13
Dec-13
Jun-14
Dec-14
Jun-15
Dec-15
Jun-16
Dec-16
Jun-17
Dec-17
Month-Year
Infr
ingem
ents
per
Month
Speeding Warning Letters Speeding Infringements
Moderate InjuriesModerate InjuriesModerate InjuriesModerate Injuries 7 2 ↓ 71%
Minor / Other InjuriesMinor / Other InjuriesMinor / Other InjuriesMinor / Other Injuries 9 8 ↓ 11%
¹ Ending 91 days before the start of the warning letter period, 28 March 2011² Ending 31 December 2017
5 years before
installation¹
Total Casualties:Total Casualties:Total Casualties:Total Casualties: 12 ↓ 29%17
Percentage
change
Fatal and Serious CrashesFatal and Serious CrashesFatal and Serious CrashesFatal and Serious Crashes 1 2 ↑ 100%
• The camera at the intersection of Victoria Road and Devlin Street commenced issuing warning letters in June 2011.
Annual NSW Speed Camera Performance Review 2018 - Appendix B: Red-light speed cameras B142

• There is one camera at this intersection.
Casualties and FSI Crashes
0
2
4
6
8
-5Y -4Y -3Y -2Y -1Y 1Y 2Y 3YNumber of years before and after camera installation
Casualti
es / C
rashes
Uncategorised M inor/Other M oderate Injury
Serious Injury Killed FSI Crash
7273 Seven Hills - Abbott Road at Station Road
• The infringement graphs show the number of warning letters and infringements issued at this intersection as well as the trend in infringements since the camera began operation. Roadworks and camera maintenance may influence the number of infringements issued.
Status: Insufficient data (<5 years) to reliably assess.
Casualties and casualty crashes at enforced intersection Infringements at enforced intersection
Red-Light Infringements
0
50
100
150
200
250
300
Jan-14
Apr-14
Jul-14
Oct-14
Jan-15
Apr-15
Jul-15
Oct-15
Jan-16
Apr-16
Jul-16
Oct-16
Jan-17
Apr-17
Jul-17
Oct-17
Month-Year
Infr
ingem
ents
per
Month
Red-light Warning Letters Red-light Infringements3 years and 347
days after installation²
Casualty CrashesCasualty CrashesCasualty CrashesCasualty Crashes 11 11 ↑ 27%
Serious InjuriesSerious InjuriesSerious InjuriesSerious Injuries
FatalitiesFatalitiesFatalitiesFatalities
5 3 ↓ 24%
0 0 -
Pedestrian Casualties
Right Through Casualty Crashes
Adjacent Casualty Crashes
Rear End Casualty Crashes
0
3
1
3
0
1
1
4
-
↓ 58%
↑ 27%
↑ 69%
Speeding Infringements
0
50
100
150
200
250
Jan-14
Apr-14
Jul-14
Oct-14
Jan-15
Apr-15
Jul-15
Oct-15
Jan-16
Apr-16
Jul-16
Oct-16
Jan-17
Apr-17
Jul-17
Oct-17
Month-Year
Infr
ingem
ents
per
Month
Speeding Warning Letters Speeding Infringements
Moderate InjuriesModerate InjuriesModerate InjuriesModerate Injuries 3 2 ↓ 16%
Minor / Other InjuriesMinor / Other InjuriesMinor / Other InjuriesMinor / Other Injuries 5 8 ↑ 102%
¹ Ending 91 days before the start of the warning letter period, 19 October 2013² Ending 31 December 2017³ The percentage change is based on annualised crash data to allow for a direct comparison between the pre and post installation time periods. Red values indicate an increase.
5 years before
installation¹
Total Casualties:Total Casualties:Total Casualties:Total Casualties: 13 ↑ 27%13
Percentage
change³
Fatal and Serious CrashesFatal and Serious CrashesFatal and Serious CrashesFatal and Serious Crashes 4 3 ↓ 5%
• The camera at the intersection of Abbott Road and Station Road commenced issuing warning letters in January 2014.
Annual NSW Speed Camera Performance Review 2018 - Appendix B: Red-light speed cameras B143

• There is one camera at this intersection. This was previously a wet-film red-light camera location.
Casualties and FSI Crashes
0
5
10
15
20
-5Y -4Y -3Y -2Y -1Y 2011 2012 2013 2014 2015 2016 2017Number of years before and year after camera installation
Casualti
es / C
rashes
Uncategorised M inor/Other M oderate Injury
Serious Injury Killed FSI Crash
7113 Silverwater - Silverwater Road at M4 eastbound on-ramp
• The infringement graphs show the number of warning letters and infringements issued at this intersection as well as the trend in infringements since the camera began operation. Roadworks and camera maintenance may influence the number of infringements issued.
Status: Retain.
Casualties and casualty crashes at enforced intersection Infringements at enforced intersection
Red-Light Infringements
0
50
100
150
200
250
Jun-10
Dec-10
Jun-11
Dec-11
Jun-12
Dec-12
Jun-13
Dec-13
Jun-14
Dec-14
Jun-15
Dec-15
Jun-16
Dec-16
Jun-17
Dec-17
Month-Year
Infr
ingem
ents
per
Month
Red-light Warning Letters Red-light Infringements5 year
after period²
Casualty CrashesCasualty CrashesCasualty CrashesCasualty Crashes 28 23 ↓ 18%
Serious InjuriesSerious InjuriesSerious InjuriesSerious Injuries
FatalitiesFatalitiesFatalitiesFatalities
13 8 ↓ 38%
0 0 -
Pedestrian Casualties
Right Through Casualty Crashes
Adjacent Casualty Crashes
Rear End Casualty Crashes
0
19
0
3
0
4
0
12
-
↓ 79%
-
↑ 300%
Speeding Infringements
0
5
10
15
20
25
30
35
40
Jun-10
Dec-10
Jun-11
Dec-11
Jun-12
Dec-12
Jun-13
Dec-13
Jun-14
Dec-14
Jun-15
Dec-15
Jun-16
Dec-16
Jun-17
Dec-17
Month-Year
Infr
ingem
ents
per
Month
Speeding Warning Letters Speeding Infringements
Moderate InjuriesModerate InjuriesModerate InjuriesModerate Injuries 20 4 ↓ 80%
Minor / Other InjuriesMinor / Other InjuriesMinor / Other InjuriesMinor / Other Injuries 8 17 ↑ 113%
¹ Ending 91 days before the start of the warning letter period, 30 March 2010² Ending 31 December 2017
5 years before
installation¹
Total Casualties:Total Casualties:Total Casualties:Total Casualties: 29 ↓ 29%41
Percentage
change
Fatal and Serious CrashesFatal and Serious CrashesFatal and Serious CrashesFatal and Serious Crashes 11 8 ↓ 27%
• The camera at the intersection of Silverwater Road and M4 Eastbound On-ramp commenced issuing warning letters in June 2010.
Annual NSW Speed Camera Performance Review 2018 - Appendix B: Red-light speed cameras B144

• There is one camera at this intersection.
Casualties and FSI Crashes
0
2
4
6
8
10
-5Y -4Y -3Y -2Y -1Y 1Y 2Y 3Y 4YNumber of years before and after camera installation
Casualti
es / C
rashes
Uncategorised M inor/Other M oderate Injury
Serious Injury Killed FSI Crash
7280 Smithfield - Cumberland Highway at The Horsley Drive
• The infringement graphs show the number of warning letters and infringements issued at this intersection as well as the trend in infringements since the camera began operation. Roadworks and camera maintenance may influence the number of infringements issued.
Status: Insufficient data (<5 years) to reliably assess.
Casualties and casualty crashes at enforced intersection Infringements at enforced intersection
Red-Light Infringements
0
20
40
60
80
100
120
140
160
180
200
Nov-13
Feb-14
May-14
Aug-14
Nov-14
Feb-15
May-15
Aug-15
Nov-15
Feb-16
May-16
Aug-16
Nov-16
Feb-17
May-17
Aug-17
Nov-17
Month-Year
Infr
ingem
ents
per
Month
Red-light Warning Letters Red-light Infringements4 years and 32 days
after installation²
Casualty CrashesCasualty CrashesCasualty CrashesCasualty Crashes 19 13 ↓ 16%
Serious InjuriesSerious InjuriesSerious InjuriesSerious Injuries
FatalitiesFatalitiesFatalitiesFatalities
2 2 ↑ 22%
0 0 -
Pedestrian Casualties
Right Through Casualty Crashes
Adjacent Casualty Crashes
Rear End Casualty Crashes
1
1
7
5
0
1
0
6
↓ 100%
↑ 22%
↓ 100%
↑ 47%
Speeding Infringements
0
50
100
150
200
250
Nov-13
Feb-14
May-14
Aug-14
Nov-14
Feb-15
May-15
Aug-15
Nov-15
Feb-16
May-16
Aug-16
Nov-16
Feb-17
May-17
Aug-17
Nov-17
Month-Year
Infr
ingem
ents
per
Month
Speeding Warning Letters Speeding Infringements
Moderate InjuriesModerate InjuriesModerate InjuriesModerate Injuries 24 6 ↓ 69%
Minor / Other InjuriesMinor / Other InjuriesMinor / Other InjuriesMinor / Other Injuries 4 8 ↑ 145%
¹ Ending 91 days before the start of the warning letter period, 30 August 2013² Ending 31 December 2017³ The percentage change is based on annualised crash data to allow for a direct comparison between the pre and post installation time periods. Red values indicate an increase.
5 years before
installation¹
Total Casualties:Total Casualties:Total Casualties:Total Casualties: 16 ↓ 35%30
Percentage
change³
Fatal and Serious CrashesFatal and Serious CrashesFatal and Serious CrashesFatal and Serious Crashes 2 2 ↑ 22%
• The camera at the intersection of Cumberland Highway and The Horsley Drive commenced issuing warning letters in November 2013.
Annual NSW Speed Camera Performance Review 2018 - Appendix B: Red-light speed cameras B145

• There is one camera at this intersection.
Casualties and FSI Crashes
0
2
4
6
8
10
12
14
-5Y -4Y -3Y -2Y -1Y 1YNumber of years before and after camera installation
Casualti
es / C
rashes
Uncategorised M inor/Other M oderate Injury
Serious Injury Killed FSI Crash
7337 Smithfield - Polding Street at The Boulevarde
• The infringement graphs show the number of warning letters and infringements issued at this intersection as well as the trend in infringements since the camera began operation. Roadworks and camera maintenance may influence the number of infringements issued.
Status: Insufficient data (<5 years) to reliably assess.
Casualties and casualty crashes at enforced intersection Infringements at enforced intersection
Red-Light Infringements
0
10
20
30
40
50
60
70
80
Nov-16
Dec-16
Jan-17
Feb-17
Mar-17
Apr-17
May-17
Jun-17
Jul-17
Aug-17
Sep-17
Oct-17
Nov-17
Dec-17
Month-Year
Infr
ingem
ents
per
Month
Red-light Warning Letters Red-light Infringements1 year and 43 days
after installation²
Casualty CrashesCasualty CrashesCasualty CrashesCasualty Crashes 26 2 ↓ 66%
Serious InjuriesSerious InjuriesSerious InjuriesSerious Injuries
FatalitiesFatalitiesFatalitiesFatalities
11 0 ↓ 100%
0 0 -
Pedestrian Casualties
Right Through Casualty Crashes
Adjacent Casualty Crashes
Rear End Casualty Crashes
1
15
6
2
0
1
0
0
↓ 100%
↓ 70%
↓ 100%
↓ 100%
Speeding Infringements
0
5
10
15
20
25
30
Nov-16
Dec-16
Jan-17
Feb-17
Mar-17
Apr-17
May-17
Jun-17
Jul-17
Aug-17
Sep-17
Oct-17
Nov-17
Dec-17
Month-Year
Infr
ingem
ents
per
Month
Speeding Warning Letters Speeding Infringements
Moderate InjuriesModerate InjuriesModerate InjuriesModerate Injuries 15 2 ↓ 40%
Minor / Other InjuriesMinor / Other InjuriesMinor / Other InjuriesMinor / Other Injuries 19 0 ↓ 100%
¹ Ending 91 days before the start of the warning letter period, 19 August 2016² Ending 31 December 2017³ The percentage change is based on annualised crash data to allow for a direct comparison between the pre and post installation time periods. Red values indicate an increase.
5 years before
installation¹
Total Casualties:Total Casualties:Total Casualties:Total Casualties: 2 ↓ 80%45
Percentage
change³
Fatal and Serious CrashesFatal and Serious CrashesFatal and Serious CrashesFatal and Serious Crashes 10 0 ↓ 100%
• The camera at the intersection of Polding Street and The Boulevarde commenced issuing warning letters in November 2016.
Annual NSW Speed Camera Performance Review 2018 - Appendix B: Red-light speed cameras B146

• There is one camera at this intersection.
Casualties and FSI Crashes
0
2
4
6
8
10
-5Y -4Y -3Y -2Y -1Y 1Y 2Y 3Y 4YNumber of years before and after camera installation
Casualti
es / C
rashes
Uncategorised M inor/Other M oderate Injury
Serious Injury Killed FSI Crash
7281 Smithfield - The Horsley Drive at Gipps Street
• The infringement graphs show the number of warning letters and infringements issued at this intersection as well as the trend in infringements since the camera began operation. Roadworks and camera maintenance may influence the number of infringements issued.
Status: Insufficient data (<5 years) to reliably assess.
Casualties and casualty crashes at enforced intersection Infringements at enforced intersection
Red-Light Infringements
0
5
10
15
20
25
30
35
40
45
50
Aug-13
Dec-13
Apr-14
Aug-14
Dec-14
Apr-15
Aug-15
Dec-15
Apr-16
Aug-16
Dec-16
Apr-17
Aug-17
Dec-17
Month-Year
Infr
ingem
ents
per
Month
Red-light Warning Letters Red-light Infringements4 years and 126
days after installation²
Casualty CrashesCasualty CrashesCasualty CrashesCasualty Crashes 15 12 ↓ 8%
Serious InjuriesSerious InjuriesSerious InjuriesSerious Injuries
FatalitiesFatalitiesFatalitiesFatalities
4 4 ↑ 15%
0 0 -
Pedestrian Casualties
Right Through Casualty Crashes
Adjacent Casualty Crashes
Rear End Casualty Crashes
0
7
3
2
0
1
7
1
-
↓ 84%
↑ 168%
↓ 42%
Speeding Infringements
0
20
40
60
80
100
120
140
Aug-13
Dec-13
Apr-14
Aug-14
Dec-14
Apr-15
Aug-15
Dec-15
Apr-16
Aug-16
Dec-16
Apr-17
Aug-17
Dec-17
Month-Year
Infr
ingem
ents
per
Month
Speeding Warning Letters Speeding Infringements
Moderate InjuriesModerate InjuriesModerate InjuriesModerate Injuries 14 7 ↓ 42%
Minor / Other InjuriesMinor / Other InjuriesMinor / Other InjuriesMinor / Other Injuries 4 4 ↑ 15%
¹ Ending 91 days before the start of the warning letter period, 28 May 2013² Ending 31 December 2017³ The percentage change is based on annualised crash data to allow for a direct comparison between the pre and post installation time periods. Red values indicate an increase.
5 years before
installation¹
Total Casualties:Total Casualties:Total Casualties:Total Casualties: 15 ↓ 22%22
Percentage
change³
Fatal and Serious CrashesFatal and Serious CrashesFatal and Serious CrashesFatal and Serious Crashes 4 2 ↓ 42%
• The camera at the intersection of The Horsley Drive and Gipps Street commenced issuing warning letters in August 2013.
Annual NSW Speed Camera Performance Review 2018 - Appendix B: Red-light speed cameras B147

• There is one camera at this intersection. This was previously a wet-film red-light camera location.
Casualties and FSI Crashes
0
1
2
3
4
5
6
7
-5Y -4Y -3Y -2Y -1Y 2011 2012 2013 2014 2015 2016 2017Number of years before and year after camera installation
Casualti
es / C
rashes
Uncategorised M inor/Other M oderate Injury
Serious Injury Killed FSI Crash
7201 Smithfield - Victoria Street at Hassall Street
• The infringement graphs show the number of warning letters and infringements issued at this intersection as well as the trend in infringements since the camera began operation. Roadworks and camera maintenance may influence the number of infringements issued.
Status: Retain.
Casualties and casualty crashes at enforced intersection Infringements at enforced intersection
Red-Light Infringements
0
10
20
30
40
50
60
70
80
90
Nov-10
May-11
Nov-11
May-12
Nov-12
May-13
Nov-13
May-14
Nov-14
May-15
Nov-15
May-16
Nov-16
May-17
Nov-17
Month-Year
Infr
ingem
ents
per
Month
Red-light Warning Letters Red-light Infringements5 year
after period²
Casualty CrashesCasualty CrashesCasualty CrashesCasualty Crashes 11 7 ↓ 36%
Serious InjuriesSerious InjuriesSerious InjuriesSerious Injuries
FatalitiesFatalitiesFatalitiesFatalities
4 2 ↓ 50%
0 0 -
Pedestrian Casualties
Right Through Casualty Crashes
Adjacent Casualty Crashes
Rear End Casualty Crashes
0
5
3
1
0
3
2
2
-
↓ 40%
↓ 33%
↑ 100%
Speeding Infringements
0
10
20
30
40
50
60
Nov-10
May-11
Nov-11
May-12
Nov-12
May-13
Nov-13
May-14
Nov-14
May-15
Nov-15
May-16
Nov-16
May-17
Nov-17
Month-Year
Infr
ingem
ents
per
Month
Speeding Warning Letters Speeding Infringements
Moderate InjuriesModerate InjuriesModerate InjuriesModerate Injuries 6 5 ↓ 17%
Minor / Other InjuriesMinor / Other InjuriesMinor / Other InjuriesMinor / Other Injuries 6 3 ↓ 50%
¹ Ending 91 days before the start of the warning letter period, 12 August 2010² Ending 31 December 2017
5 years before
installation¹
Total Casualties:Total Casualties:Total Casualties:Total Casualties: 10 ↓ 38%16
Percentage
change
Fatal and Serious CrashesFatal and Serious CrashesFatal and Serious CrashesFatal and Serious Crashes 2 2 ↓ 0%
• The camera at the intersection of Victoria Street and Hassall Street commenced issuing warning letters in November 2010.
Annual NSW Speed Camera Performance Review 2018 - Appendix B: Red-light speed cameras B148

• There is one camera at this intersection. This was previously a wet-film red-light camera location.
Casualties and FSI Crashes
0
2
4
6
8
10
-5Y -4Y -3Y -2Y -1Y 2011 2012 2013 2014 2015 2016 2017Number of years before and year after camera installation
Casualti
es / C
rashes
Uncategorised M inor/Other M oderate Injury
Serious Injury Killed FSI Crash
7191 South Penrith - Parker Street at Jamison Road
• The infringement graphs show the number of warning letters and infringements issued at this intersection as well as the trend in infringements since the camera began operation. Roadworks and camera maintenance may influence the number of infringements issued.
Status: Retain.
Casualties and casualty crashes at enforced intersection Infringements at enforced intersection
Red-Light Infringements
0
50
100
150
200
250
Nov-10
May-11
Nov-11
May-12
Nov-12
May-13
Nov-13
May-14
Nov-14
May-15
Nov-15
May-16
Nov-16
May-17
Nov-17
Month-Year
Infr
ingem
ents
per
Month
Red-light Warning Letters Red-light Infringements5 year
after period²
Casualty CrashesCasualty CrashesCasualty CrashesCasualty Crashes 14 8 ↓ 43%
Serious InjuriesSerious InjuriesSerious InjuriesSerious Injuries
FatalitiesFatalitiesFatalitiesFatalities
2 1 ↓ 50%
0 0 -
Pedestrian Casualties
Right Through Casualty Crashes
Adjacent Casualty Crashes
Rear End Casualty Crashes
1
7
2
3
0
3
0
4
↓ 100%
↓ 57%
↓ 100%
↑ 33%
Speeding Infringements
0
20
40
60
80
100
120
Nov-10
May-11
Nov-11
May-12
Nov-12
May-13
Nov-13
May-14
Nov-14
May-15
Nov-15
May-16
Nov-16
May-17
Nov-17
Month-Year
Infr
ingem
ents
per
Month
Speeding Warning Letters Speeding Infringements
Moderate InjuriesModerate InjuriesModerate InjuriesModerate Injuries 14 5 ↓ 64%
Minor / Other InjuriesMinor / Other InjuriesMinor / Other InjuriesMinor / Other Injuries 5 2 ↓ 60%
¹ Ending 91 days before the start of the warning letter period, 12 August 2010² Ending 31 December 2017
5 years before
installation¹
Total Casualties:Total Casualties:Total Casualties:Total Casualties: 8 ↓ 62%21
Percentage
change
Fatal and Serious CrashesFatal and Serious CrashesFatal and Serious CrashesFatal and Serious Crashes 1 1 ↓ 0%
• The camera at the intersection of Parker Street and Jamison Road commenced issuing warning letters in November 2010.
Annual NSW Speed Camera Performance Review 2018 - Appendix B: Red-light speed cameras B149

• There is one camera at this intersection. This was previously a wet-film red-light camera location.
Casualties and FSI Crashes
0
2
4
6
8
10
12
14
-5Y -4Y -3Y -2Y -1Y 2012 2013 2014 2015 2016 2017Number of years before and year after camera installation
Casualti
es / C
rashes
Uncategorised M inor/Other M oderate Injury
Serious Injury Killed FSI Crash
7179 South Wentworthville - Cumberland Highway at Old Prospect Road
• The infringement graphs show the number of warning letters and infringements issued at this intersection as well as the trend in infringements since the camera began operation. Roadworks and camera maintenance may influence the number of infringements issued.
Status: Retain and Monitor. The previous wet-film red light camera may have influenced the before period data. Annual traffic counts have increased across NSW.
Casualties and casualty crashes at enforced intersection Infringements at enforced intersection
Red-Light Infringements
0
20
40
60
80
100
120
140
Apr-11
Oct-11
Apr-12
Oct-12
Apr-13
Oct-13
Apr-14
Oct-14
Apr-15
Oct-15
Apr-16
Oct-16
Apr-17
Oct-17
Month-Year
Infr
ingem
ents
per
Month
Red-light Warning Letters Red-light Infringements5 year
after period²
Casualty CrashesCasualty CrashesCasualty CrashesCasualty Crashes 15 16 ↑ 7%
Serious InjuriesSerious InjuriesSerious InjuriesSerious Injuries
FatalitiesFatalitiesFatalitiesFatalities
6 6 ↓ 0%
0 0 -
Pedestrian Casualties
Right Through Casualty Crashes
Adjacent Casualty Crashes
Rear End Casualty Crashes
1
5
1
5
0
3
2
5
↓ 100%
↓ 40%
↑ 100%
↓ 0%
Speeding Infringements
0
10
20
30
40
50
60
70
80
Apr-11
Oct-11
Apr-12
Oct-12
Apr-13
Oct-13
Apr-14
Oct-14
Apr-15
Oct-15
Apr-16
Oct-16
Apr-17
Oct-17
Month-Year
Infr
ingem
ents
per
Month
Speeding Warning Letters Speeding Infringements
Moderate InjuriesModerate InjuriesModerate InjuriesModerate Injuries 10 7 ↓ 30%
Minor / Other InjuriesMinor / Other InjuriesMinor / Other InjuriesMinor / Other Injuries 9 9 ↓ 0%
¹ Ending 91 days before the start of the warning letter period, 6 January 2011² Ending 31 December 2017
5 years before
installation¹
Total Casualties:Total Casualties:Total Casualties:Total Casualties: 22 ↓ 12%25
Percentage
change
Fatal and Serious CrashesFatal and Serious CrashesFatal and Serious CrashesFatal and Serious Crashes 3 5 ↑ 67%
• The camera at the intersection of Cumberland Highway and Old Prospect Road commenced issuing warning letters in April 2011.
Annual NSW Speed Camera Performance Review 2018 - Appendix B: Red-light speed cameras B150

• There are two cameras at this intersection. This was previously a wet-film red-light camera location.
Casualties and FSI Crashes
0
2
4
6
8
-5Y -4Y -3Y -2Y -1Y 1Y 2Y 3Y 4YNumber of years before and after camera installation
Casualti
es / C
rashes
Uncategorised M inor/Other M oderate Injury
Serious Injury Killed FSI Crash
7291|7292 Spring Hill - Springhill Road at Masters Road
• The infringement graphs show the number of warning letters and infringements issued at this intersection as well as the trend in infringements since the camera began operation. Roadworks and camera maintenance may influence the number of infringements issued.
Status: Insufficient data (<5 years) to reliably assess.
Casualties and casualty crashes at enforced intersection Infringements at enforced intersection
Red-Light Infringements
0
20
40
60
80
100
120
140
160
180
Dec-13
Mar-14
Jun-14
Sep-14
Dec-14
Mar-15
Jun-15
Sep-15
Dec-15
Mar-16
Jun-16
Sep-16
Dec-16
Mar-17
Jun-17
Sep-17
Dec-17
Month-Year
Infr
ingem
ents
per
Month
Red-light Warning Letters Red-light Infringements4 years and 17 days
after installation²
Casualty CrashesCasualty CrashesCasualty CrashesCasualty Crashes 15 8 ↓ 34%
Serious InjuriesSerious InjuriesSerious InjuriesSerious Injuries
FatalitiesFatalitiesFatalitiesFatalities
3 2 ↓ 18%
0 0 -
Pedestrian Casualties
Right Through Casualty Crashes
Adjacent Casualty Crashes
Rear End Casualty Crashes
0
5
1
5
1
1
0
2
Increase
↓ 75%
↓ 100%
↓ 51%
Speeding Infringements
0
50
100
150
200
250
Dec-13
Mar-14
Jun-14
Sep-14
Dec-14
Mar-15
Jun-15
Sep-15
Dec-15
Mar-16
Jun-16
Sep-16
Dec-16
Mar-17
Jun-17
Sep-17
Dec-17
Month-Year
Infr
ingem
ents
per
Month
Speeding Warning Letters Speeding Infringements
Moderate InjuriesModerate InjuriesModerate InjuriesModerate Injuries 8 7 ↑ 8%
Minor / Other InjuriesMinor / Other InjuriesMinor / Other InjuriesMinor / Other Injuries 9 1 ↓ 86%
¹ Ending 91 days before the start of the warning letter period, 14 September 2013² Ending 31 December 2017³ The percentage change is based on annualised crash data to allow for a direct comparison between the pre and post installation time periods. Red values indicate an increase.
5 years before
installation¹
Total Casualties:Total Casualties:Total Casualties:Total Casualties: 10 ↓ 38%20
Percentage
change³
Fatal and Serious CrashesFatal and Serious CrashesFatal and Serious CrashesFatal and Serious Crashes 3 2 ↓ 18%
• The camera at the intersection of Springhill Road and Masters Road (northbound) commenced issuing warning letters in December 2013.
• The camera at the intersection of Springhill Road and Masters Road (southbound) commenced issuing warning letters in January 2014.
Annual NSW Speed Camera Performance Review 2018 - Appendix B: Red-light speed cameras B151

• There are two cameras at this intersection.
Casualties and FSI Crashes
0
2
4
6
8
10
12
14
-5Y -4Y -3Y -2Y -1Y 2011 2012 2013 2014 2015 2016 2017Number of years before and year after camera installation
Casualti
es / C
rashes
Uncategorised M inor/Other M oderate Injury
Serious Injury Killed FSI Crash
7122|7123 St Marys - Great Western Highway at Charles Hackett Drive / Pages Road
• The infringement graphs show the number of warning letters and infringements issued at this intersection as well as the trend in infringements since the camera began operation. Roadworks and camera maintenance may influence the number of infringements issued.
Status: Retain.
Casualties and casualty crashes at enforced intersection Infringements at enforced intersection
Red-Light Infringements
0
50
100
150
200
250
Jul-10
Jan-11
Jul-11
Jan-12
Jul-12
Jan-13
Jul-13
Jan-14
Jul-14
Jan-15
Jul-15
Jan-16
Jul-16
Jan-17
Jul-17
Month-Year
Infr
ingem
ents
per
Month
Red-light Warning Letters Red-light Infringements5 year
after period²
Casualty CrashesCasualty CrashesCasualty CrashesCasualty Crashes 24 12 ↓ 50%
Serious InjuriesSerious InjuriesSerious InjuriesSerious Injuries
FatalitiesFatalitiesFatalitiesFatalities
5 1 ↓ 80%
2 0 ↓ 100%
Pedestrian Casualties
Right Through Casualty Crashes
Adjacent Casualty Crashes
Rear End Casualty Crashes
1
16
2
2
0
8
0
4
↓ 100%
↓ 50%
↓ 100%
↑ 100%
Speeding Infringements
0
200
400
600
800
1000
1200
1400
Jul-10
Jan-11
Jul-11
Jan-12
Jul-12
Jan-13
Jul-13
Jan-14
Jul-14
Jan-15
Jul-15
Jan-16
Jul-16
Jan-17
Jul-17
Month-Year
Infr
ingem
ents
per
Month
Speeding Warning Letters Speeding Infringements
Moderate InjuriesModerate InjuriesModerate InjuriesModerate Injuries 19 6 ↓ 68%
Minor / Other InjuriesMinor / Other InjuriesMinor / Other InjuriesMinor / Other Injuries 12 9 ↓ 25%
¹ Ending 91 days before the start of the warning letter period, 8 April 2010² Ending 31 December 2017
5 years before
installation¹
Total Casualties:Total Casualties:Total Casualties:Total Casualties: 16 ↓ 58%38
Percentage
change
Fatal and Serious CrashesFatal and Serious CrashesFatal and Serious CrashesFatal and Serious Crashes 6 1 ↓ 83%
• Both cameras at the intersection of Great Western Highway and Charles Hackett Drive commenced issuing warning letters in July 2010.
Annual NSW Speed Camera Performance Review 2018 - Appendix B: Red-light speed cameras B152

• There is one camera at this intersection.
Casualties and FSI Crashes
0
2
4
6
8
10
-5Y -4Y -3Y -2Y -1Y 1Y 2Y 3Y 4YNumber of years before and after camera installation
Casualti
es / C
rashes
Uncategorised M inor/Other M oderate Injury
Serious Injury Killed FSI Crash
7284 St Marys - Mamre Road at Saddington Street (school zone)
• The infringement graphs show the number of warning letters and infringements issued at this intersection as well as the trend in infringements since the camera began operation. Roadworks and camera maintenance may influence the number of infringements issued.
Status: Insufficient data (<5 years) to reliably assess.
Casualties and casualty crashes at enforced intersection Infringements at enforced intersection
Red-Light Infringements
0
20
40
60
80
100
120
Sep-13
Jan-14
May-14
Sep-14
Jan-15
May-15
Sep-15
Jan-16
May-16
Sep-16
Jan-17
May-17
Sep-17
Month-Year
Infr
ingem
ents
per
Month
Red-light Warning Letters Red-light Infringements4 years and 96 days
after installation²
Casualty CrashesCasualty CrashesCasualty CrashesCasualty Crashes 14 9 ↓ 25%
Serious InjuriesSerious InjuriesSerious InjuriesSerious Injuries
FatalitiesFatalitiesFatalitiesFatalities
5 1 ↓ 77%
0 0 -
Pedestrian Casualties
Right Through Casualty Crashes
Adjacent Casualty Crashes
Rear End Casualty Crashes
0
6
6
0
1
4
0
3
Increase
↓ 22%
↓ 100%
Increase
Speeding Infringements
0
50
100
150
200
250
300
350
400
450
500
Sep-13
Jan-14
May-14
Sep-14
Jan-15
May-15
Sep-15
Jan-16
May-16
Sep-16
Jan-17
May-17
Sep-17
Month-Year
Infr
ingem
ents
per
Month
Speeding Warning Letters Speeding Infringements
Moderate InjuriesModerate InjuriesModerate InjuriesModerate Injuries 5 8 ↑ 88%
Minor / Other InjuriesMinor / Other InjuriesMinor / Other InjuriesMinor / Other Injuries 12 2 ↓ 80%
¹ Ending 91 days before the start of the warning letter period, 27 June 2013² Ending 31 December 2017³ The percentage change is based on annualised crash data to allow for a direct comparison between the pre and post installation time periods. Red values indicate an increase.
5 years before
installation¹
Total Casualties:Total Casualties:Total Casualties:Total Casualties: 11 ↓ 41%22
Percentage
change³
Fatal and Serious CrashesFatal and Serious CrashesFatal and Serious CrashesFatal and Serious Crashes 4 1 ↓ 71%
• The camera at the intersection of Mamre Road and Saddington Street commenced issuing warning letters in September 2013.
Annual NSW Speed Camera Performance Review 2018 - Appendix B: Red-light speed cameras B153

• There is one camera at this intersection. This was previously a wet-film red-light camera location.
Casualties and FSI Crashes
0
1
2
3
-5Y -4Y -3Y -2Y -1Y 1Y 2YNumber of years before and after camera installation
Casualti
es / C
rashes
Uncategorised M inor/Other M oderate Injury
Serious Injury Killed FSI Crash
7317 St Peters - Princes Highway at Sydney Park Road
• The infringement graphs show the number of warning letters and infringements issued at this intersection as well as the trend in infringements since the camera began operation. Roadworks and camera maintenance may influence the number of infringements issued.
Status: Insufficient data (<5 years) to reliably assess.
Casualties and casualty crashes at enforced intersection Infringements at enforced intersection
Red-Light Infringements
0
200
400
600
800
1000
1200
Oct-15
Dec-15
Feb-16
Apr-16
Jun-16
Aug-16
Oct-16
Dec-16
Feb-17
Apr-17
Jun-17
Aug-17
Oct-17
Dec-17
Month-Year
Infr
ingem
ents
per
Month
Red-light Warning Letters Red-light Infringements2 years and 85 days
after installation²
Casualty CrashesCasualty CrashesCasualty CrashesCasualty Crashes 7 2 ↓ 36%
Serious InjuriesSerious InjuriesSerious InjuriesSerious Injuries
FatalitiesFatalitiesFatalitiesFatalities
2 0 ↓ 100%
1 0 ↓ 100%
Pedestrian Casualties
Right Through Casualty Crashes
Adjacent Casualty Crashes
Rear End Casualty Crashes
1
1
0
0
0
1
0
1
↓ 100%
↑ 124%
-
Increase
Speeding Infringements
0
5
10
15
20
25
Oct-15
Dec-15
Feb-16
Apr-16
Jun-16
Aug-16
Oct-16
Dec-16
Feb-17
Apr-17
Jun-17
Aug-17
Oct-17
Dec-17
Month-Year
Infr
ingem
ents
per
Month
Speeding Warning Letters Speeding Infringements
Moderate InjuriesModerate InjuriesModerate InjuriesModerate Injuries 2 1 ↑ 12%
Minor / Other InjuriesMinor / Other InjuriesMinor / Other InjuriesMinor / Other Injuries 2 1 ↑ 12%
¹ Ending 91 days before the start of the warning letter period, 9 July 2015² Ending 31 December 2017³ The percentage change is based on annualised crash data to allow for a direct comparison between the pre and post installation time periods. Red values indicate an increase.
5 years before
installation¹
Total Casualties:Total Casualties:Total Casualties:Total Casualties: 2 ↓ 36%7
Percentage
change³
Fatal and Serious CrashesFatal and Serious CrashesFatal and Serious CrashesFatal and Serious Crashes 3 0 ↓ 100%
• The camera at the intersection of Princes Highway and Sydney Park Road commenced issuing warning letters in October 2015.
Annual NSW Speed Camera Performance Review 2018 - Appendix B: Red-light speed cameras B154

• There is one camera at this intersection. This was previously a wet-film red-light camera location.
Casualties and FSI Crashes
0
2
4
6
8
10
12
14
-5Y -4Y -3Y -2Y -1Y 2011 2012 2013 2014 2015 2016 2017Number of years before and year after camera installation
Casualti
es / C
rashes
Uncategorised M inor/Other M oderate Injury
Serious Injury Killed FSI Crash
7154 Strathfield - Arthur Street at Centenary Drive
• The infringement graphs show the number of warning letters and infringements issued at this intersection as well as the trend in infringements since the camera began operation. Roadworks and camera maintenance may influence the number of infringements issued.
Status: Retain.
Casualties and casualty crashes at enforced intersection Infringements at enforced intersection
Red-Light Infringements
0
200
400
600
800
1000
1200
1400
Oct-10
Apr-11
Oct-11
Apr-12
Oct-12
Apr-13
Oct-13
Apr-14
Oct-14
Apr-15
Oct-15
Apr-16
Oct-16
Apr-17
Oct-17
Month-Year
Infr
ingem
ents
per
Month
Red-light Warning Letters Red-light Infringements5 year
after period²
Casualty CrashesCasualty CrashesCasualty CrashesCasualty Crashes 29 24 ↓ 17%
Serious InjuriesSerious InjuriesSerious InjuriesSerious Injuries
FatalitiesFatalitiesFatalitiesFatalities
14 1 ↓ 93%
1 0 ↓ 100%
Pedestrian Casualties
Right Through Casualty Crashes
Adjacent Casualty Crashes
Rear End Casualty Crashes
0
1
11
13
1
4
1
12
Increase
↑ 300%
↓ 91%
↓ 8%
Speeding Infringements
0
1
2
3
4
5
6
7
8
9
10
Oct-10
Apr-11
Oct-11
Apr-12
Oct-12
Apr-13
Oct-13
Apr-14
Oct-14
Apr-15
Oct-15
Apr-16
Oct-16
Apr-17
Oct-17
Month-Year
Infr
ingem
ents
per
Month
Speeding Warning Letters Speeding Infringements
Moderate InjuriesModerate InjuriesModerate InjuriesModerate Injuries 11 8 ↓ 27%
Minor / Other InjuriesMinor / Other InjuriesMinor / Other InjuriesMinor / Other Injuries 15 20 ↑ 33%
¹ Ending 91 days before the start of the warning letter period, 28 July 2010² Ending 31 December 2017
5 years before
installation¹
Total Casualties:Total Casualties:Total Casualties:Total Casualties: 29 ↓ 29%41
Percentage
change
Fatal and Serious CrashesFatal and Serious CrashesFatal and Serious CrashesFatal and Serious Crashes 10 1 ↓ 90%
• The camera at the intersection of Arthur Street and Centenary Drive commenced issuing warning letters in October 2010.
Annual NSW Speed Camera Performance Review 2018 - Appendix B: Red-light speed cameras B155

• There is one camera at this intersection.
Casualties and FSI Crashes
0
2
4
6
8
10
12
-5Y -4Y -3Y -2Y -1Y 2011 2012 2013 2014 2015 2016 2017Number of years before and year after camera installation
Casualti
es / C
rashes
Uncategorised M inor/Other M oderate Injury
Serious Injury Killed FSI Crash
7105 Surry Hills - Cleveland Street at South Dowling Street
• The infringement graphs show the number of warning letters and infringements issued at this intersection as well as the trend in infringements since the camera began operation. Roadworks and camera maintenance may influence the number of infringements issued.
Status: Retain.
Casualties and casualty crashes at enforced intersection Infringements at enforced intersection
Red-Light Infringements
0
50
100
150
200
250
300
Jun-10
Dec-10
Jun-11
Dec-11
Jun-12
Dec-12
Jun-13
Dec-13
Jun-14
Dec-14
Jun-15
Dec-15
Jun-16
Dec-16
Jun-17
Dec-17
Month-Year
Infr
ingem
ents
per
Month
Red-light Warning Letters Red-light Infringements5 year
after period²
Casualty CrashesCasualty CrashesCasualty CrashesCasualty Crashes 32 17 ↓ 47%
Serious InjuriesSerious InjuriesSerious InjuriesSerious Injuries
FatalitiesFatalitiesFatalitiesFatalities
11 3 ↓ 73%
1 0 ↓ 100%
Pedestrian Casualties
Right Through Casualty Crashes
Adjacent Casualty Crashes
Rear End Casualty Crashes
0
6
7
10
0
1
3
9
-
↓ 83%
↓ 57%
↓ 10%
Speeding Infringements
0
20
40
60
80
100
120
140
Jun-10
Dec-10
Jun-11
Dec-11
Jun-12
Dec-12
Jun-13
Dec-13
Jun-14
Dec-14
Jun-15
Dec-15
Jun-16
Dec-16
Jun-17
Dec-17
Month-Year
Infr
ingem
ents
per
Month
Speeding Warning Letters Speeding Infringements
Moderate InjuriesModerate InjuriesModerate InjuriesModerate Injuries 9 6 ↓ 33%
Minor / Other InjuriesMinor / Other InjuriesMinor / Other InjuriesMinor / Other Injuries 19 9 ↓ 53%
¹ Ending 91 days before the start of the warning letter period, 31 March 2010² Ending 31 December 2017
5 years before
installation¹
Total Casualties:Total Casualties:Total Casualties:Total Casualties: 18 ↓ 55%40
Percentage
change
Fatal and Serious CrashesFatal and Serious CrashesFatal and Serious CrashesFatal and Serious Crashes 11 3 ↓ 73%
• The camera at the intersection of Cleveland Street and South Dowling Street commenced issuing warning letters in June 2010.
Annual NSW Speed Camera Performance Review 2018 - Appendix B: Red-light speed cameras B156

• There is one camera at this intersection. This was previously a wet-film red-light camera location.
Casualties and FSI Crashes
0
1
2
3
4
5
6
-5Y -4Y -3Y -2Y -1Y 1YNumber of years before and after camera installation
Casualti
es / C
rashes
Uncategorised M inor/Other M oderate Injury
Serious Injury Killed FSI Crash
7332 Surry Hills - Crown Street at Albion Street
• The infringement graphs show the number of warning letters and infringements issued at this intersection as well as the trend in infringements since the camera began operation. Roadworks and camera maintenance may influence the number of infringements issued.
Status: Insufficient data (<5 years) to reliably assess.
Casualties and casualty crashes at enforced intersection Infringements at enforced intersection
Red-Light Infringements
0
10
20
30
40
50
60
70
80
Oct-16
Nov-16
Dec-16
Jan-17
Feb-17
Mar-17
Apr-17
May-17
Jun-17
Jul-17
Aug-17
Sep-17
Oct-17
Nov-17
Dec-17
Month-Year
Infr
ingem
ents
per
Month
Red-light Warning Letters Red-light Infringements1 year and 64 days
after installation²
Casualty CrashesCasualty CrashesCasualty CrashesCasualty Crashes 7 1 ↓ 39%
Serious InjuriesSerious InjuriesSerious InjuriesSerious Injuries
FatalitiesFatalitiesFatalitiesFatalities
6 1 ↓ 29%
0 0 -
Pedestrian Casualties
Right Through Casualty Crashes
Adjacent Casualty Crashes
Rear End Casualty Crashes
1
2
3
0
1
0
0
0
↑ 326%
↓ 100%
↓ 100%
-
Speeding Infringements
0
5
10
15
20
25
30
35
40
Oct-16
Nov-16
Dec-16
Jan-17
Feb-17
Mar-17
Apr-17
May-17
Jun-17
Jul-17
Aug-17
Sep-17
Oct-17
Nov-17
Dec-17
Month-Year
Infr
ingem
ents
per
Month
Speeding Warning Letters Speeding Infringements
Moderate InjuriesModerate InjuriesModerate InjuriesModerate Injuries 5 0 ↓ 100%
Minor / Other InjuriesMinor / Other InjuriesMinor / Other InjuriesMinor / Other Injuries 0 0 -
¹ Ending 91 days before the start of the warning letter period, 29 July 2016² Ending 31 December 2017³ The percentage change is based on annualised crash data to allow for a direct comparison between the pre and post installation time periods. Red values indicate an increase.
5 years before
installation¹
Total Casualties:Total Casualties:Total Casualties:Total Casualties: 1 ↓ 61%11
Percentage
change³
Fatal and Serious CrashesFatal and Serious CrashesFatal and Serious CrashesFatal and Serious Crashes 3 1 ↑ 42%
• The camera at the intersection of Crown Street and Albion Street commenced issuing warning letters in October 2016.
Annual NSW Speed Camera Performance Review 2018 - Appendix B: Red-light speed cameras B157

• There is one camera at this intersection.
Casualties and FSI Crashes
0
1
2
3
4
5
-5Y -4Y -3Y -2Y -1Y 1YNumber of years before and after camera installation
Casualti
es / C
rashes
Uncategorised M inor/Other M oderate Injury
Serious Injury Killed FSI Crash
7329 Surry Hills - Foveaux Street at Crown Street
• The infringement graphs show the number of warning letters and infringements issued at this intersection as well as the trend in infringements since the camera began operation. Roadworks and camera maintenance may influence the number of infringements issued.
Status: Insufficient data (<5 years) to reliably assess.
Casualties and casualty crashes at enforced intersection Infringements at enforced intersection
Red-Light Infringements
0
10
20
30
40
50
60
70
80
90
100
Oct-16
Nov-16
Dec-16
Jan-17
Feb-17
Mar-17
Apr-17
May-17
Jun-17
Jul-17
Aug-17
Sep-17
Oct-17
Nov-17
Dec-17
Month-Year
Infr
ingem
ents
per
Month
Red-light Warning Letters Red-light Infringements1 year and 64 days
after installation²
Casualty CrashesCasualty CrashesCasualty CrashesCasualty Crashes 12 0 ↓ 100%
Serious InjuriesSerious InjuriesSerious InjuriesSerious Injuries
FatalitiesFatalitiesFatalitiesFatalities
6 0 ↓ 100%
0 0 -
Pedestrian Casualties
Right Through Casualty Crashes
Adjacent Casualty Crashes
Rear End Casualty Crashes
5
1
3
2
0
0
0
0
↓ 100%
↓ 100%
↓ 100%
↓ 100%
Speeding Infringements
0
20
40
60
80
100
120
Oct-16
Nov-16
Dec-16
Jan-17
Feb-17
Mar-17
Apr-17
May-17
Jun-17
Jul-17
Aug-17
Sep-17
Oct-17
Nov-17
Dec-17
Month-Year
Infr
ingem
ents
per
Month
Speeding Warning Letters Speeding Infringements
Moderate InjuriesModerate InjuriesModerate InjuriesModerate Injuries 6 0 ↓ 100%
Minor / Other InjuriesMinor / Other InjuriesMinor / Other InjuriesMinor / Other Injuries 1 0 ↓ 100%
¹ Ending 91 days before the start of the warning letter period, 29 July 2016² Ending 31 December 2017³ The percentage change is based on annualised crash data to allow for a direct comparison between the pre and post installation time periods. Red values indicate an increase.
5 years before
installation¹
Total Casualties:Total Casualties:Total Casualties:Total Casualties: 0 ↓ 100%13
Percentage
change³
Fatal and Serious CrashesFatal and Serious CrashesFatal and Serious CrashesFatal and Serious Crashes 6 0 ↓ 100%
• The camera at the intersection of Foveaux Street and Crown Street commenced issuing warning letters in October 2016.
Annual NSW Speed Camera Performance Review 2018 - Appendix B: Red-light speed cameras B158

• There is one camera at this intersection.
Casualties and FSI Crashes
0
5
10
15
-5Y -4Y -3Y -2Y -1Y 1Y 2Y 3YNumber of years before and after camera installation
Casualti
es / C
rashes
Uncategorised M inor/Other M oderate Injury
Serious Injury Killed FSI Crash
7295 Sydney - Elizabeth Street at Park Street
• The infringement graphs show the number of warning letters and infringements issued at this intersection as well as the trend in infringements since the camera began operation. Roadworks and camera maintenance may influence the number of infringements issued.
Status: Insufficient data (<5 years) to reliably assess.
Casualties and casualty crashes at enforced intersection Infringements at enforced intersection
Red-Light Infringements
0
200
400
600
800
1000
1200
Sep-14
Dec-14
Mar-15
Jun-15
Sep-15
Dec-15
Mar-16
Jun-16
Sep-16
Dec-16
Mar-17
Jun-17
Sep-17
Dec-17
Month-Year
Infr
ingem
ents
per
Month
Red-light Warning Letters Red-light Infringements3 years and 92 days
after installation²
Casualty CrashesCasualty CrashesCasualty CrashesCasualty Crashes 25 6 ↓ 63%
Serious InjuriesSerious InjuriesSerious InjuriesSerious Injuries
FatalitiesFatalitiesFatalitiesFatalities
7 4 ↓ 12%
0 0 -
Pedestrian Casualties
Right Through Casualty Crashes
Adjacent Casualty Crashes
Rear End Casualty Crashes
9
2
2
2
4
0
0
0
↓ 32%
↓ 100%
↓ 100%
↓ 100%
Speeding Infringements
0
200
400
600
800
1000
1200
1400
1600
1800
2000
Sep-14
Dec-14
Mar-15
Jun-15
Sep-15
Dec-15
Mar-16
Jun-16
Sep-16
Dec-16
Mar-17
Jun-17
Sep-17
Dec-17
Month-Year
Infr
ingem
ents
per
Month
Speeding Warning Letters Speeding Infringements
Moderate InjuriesModerate InjuriesModerate InjuriesModerate Injuries 12 1 ↓ 87%
Minor / Other InjuriesMinor / Other InjuriesMinor / Other InjuriesMinor / Other Injuries 11 1 ↓ 86%
¹ Ending 91 days before the start of the warning letter period, 1 July 2014² Ending 31 December 2017³ The percentage change is based on annualised crash data to allow for a direct comparison between the pre and post installation time periods. Red values indicate an increase.
5 years before
installation¹
Total Casualties:Total Casualties:Total Casualties:Total Casualties: 6 ↓ 69%30
Percentage
change³
Fatal and Serious CrashesFatal and Serious CrashesFatal and Serious CrashesFatal and Serious Crashes 7 4 ↓ 12%
• The camera at the intersection of Elizabeth Street and Park Street commenced issuing warning letters in September 2014.
Annual NSW Speed Camera Performance Review 2018 - Appendix B: Red-light speed cameras B159

• There is one camera at this intersection. This was previously a wet-film red-light camera location.
Casualties and FSI Crashes
0
1
2
3
4
5
6
7
-5Y -4Y -3Y -2Y -1Y 2011 2012 2013 2014 2015 2016 2017Number of years before and year after camera installation
Casualti
es / C
rashes
Uncategorised M inor/Other M oderate Injury
Serious Injury Killed FSI Crash
7177 Thornleigh - Pennant Hills Road at Parkes Street
• The infringement graphs show the number of warning letters and infringements issued at this intersection as well as the trend in infringements since the camera began operation. Roadworks and camera maintenance may influence the number of infringements issued.
Status: Retain and Monitor. The previous wet-film red light camera may have influenced the before period data. Annual traffic counts have increased across NSW.
Casualties and casualty crashes at enforced intersection Infringements at enforced intersection
Red-Light Infringements
0
100
200
300
400
500
600
700
Dec-10
Jun-11
Dec-11
Jun-12
Dec-12
Jun-13
Dec-13
Jun-14
Dec-14
Jun-15
Dec-15
Jun-16
Dec-16
Jun-17
Dec-17
Month-Year
Infr
ingem
ents
per
Month
Red-light Warning Letters Red-light Infringements5 year
after period²
Casualty CrashesCasualty CrashesCasualty CrashesCasualty Crashes 14 14 ↓ 0%
Serious InjuriesSerious InjuriesSerious InjuriesSerious Injuries
FatalitiesFatalitiesFatalitiesFatalities
0 1 Increase
0 0 -
Pedestrian Casualties
Right Through Casualty Crashes
Adjacent Casualty Crashes
Rear End Casualty Crashes
0
1
0
9
0
1
1
9
-
↓ 0%
Increase
↓ 0%
Speeding Infringements
0
20
40
60
80
100
120
Dec-10
Jun-11
Dec-11
Jun-12
Dec-12
Jun-13
Dec-13
Jun-14
Dec-14
Jun-15
Dec-15
Jun-16
Dec-16
Jun-17
Dec-17
Month-Year
Infr
ingem
ents
per
Month
Speeding Warning Letters Speeding Infringements
Moderate InjuriesModerate InjuriesModerate InjuriesModerate Injuries 8 5 ↓ 38%
Minor / Other InjuriesMinor / Other InjuriesMinor / Other InjuriesMinor / Other Injuries 9 11 ↑ 22%
¹ Ending 91 days before the start of the warning letter period, 15 September 2010² Ending 31 December 2017
5 years before
installation¹
Total Casualties:Total Casualties:Total Casualties:Total Casualties: 17 ↓ 0%17
Percentage
change
Fatal and Serious CrashesFatal and Serious CrashesFatal and Serious CrashesFatal and Serious Crashes 0 1 Increase
• The camera at the intersection of Pennant Hills Road and Parkes Street commenced issuing warning letters in December 2010.
Annual NSW Speed Camera Performance Review 2018 - Appendix B: Red-light speed cameras B160

• There is one camera at this intersection. This was previously a wet-film red-light camera location.
Casualties and FSI Crashes
0
1
2
3
4
5
6
7
-5Y -4Y -3Y -2Y -1Y 2012 2013 2014 2015 2016 2017Number of years before and year after camera installation
Casualti
es / C
rashes
Uncategorised M inor/Other M oderate Injury
Serious Injury Killed FSI Crash
7188 Ultimo - Wattle Street at William Henry Street
• The infringement graphs show the number of warning letters and infringements issued at this intersection as well as the trend in infringements since the camera began operation. Roadworks and camera maintenance may influence the number of infringements issued.
Status: Retain.
Casualties and casualty crashes at enforced intersection Infringements at enforced intersection
Red-Light Infringements
0
50
100
150
200
250
300
Jun-11
Dec-11
Jun-12
Dec-12
Jun-13
Dec-13
Jun-14
Dec-14
Jun-15
Dec-15
Jun-16
Dec-16
Jun-17
Dec-17
Month-Year
Infr
ingem
ents
per
Month
Red-light Warning Letters Red-light Infringements5 year
after period²
Casualty CrashesCasualty CrashesCasualty CrashesCasualty Crashes 15 5 ↓ 67%
Serious InjuriesSerious InjuriesSerious InjuriesSerious Injuries
FatalitiesFatalitiesFatalitiesFatalities
1 0 ↓ 100%
0 0 -
Pedestrian Casualties
Right Through Casualty Crashes
Adjacent Casualty Crashes
Rear End Casualty Crashes
0
3
7
2
0
0
2
2
-
↓ 100%
↓ 71%
↓ 0%
Speeding Infringements
0
500
1000
1500
2000
2500
3000
Jun-11
Dec-11
Jun-12
Dec-12
Jun-13
Dec-13
Jun-14
Dec-14
Jun-15
Dec-15
Jun-16
Dec-16
Jun-17
Dec-17
Month-Year
Infr
ingem
ents
per
Month
Speeding Warning Letters Speeding Infringements
Moderate InjuriesModerate InjuriesModerate InjuriesModerate Injuries 5 2 ↓ 60%
Minor / Other InjuriesMinor / Other InjuriesMinor / Other InjuriesMinor / Other Injuries 14 5 ↓ 64%
¹ Ending 91 days before the start of the warning letter period, 11 March 2011² Ending 31 December 2017
5 years before
installation¹
Total Casualties:Total Casualties:Total Casualties:Total Casualties: 7 ↓ 65%20
Percentage
change
Fatal and Serious CrashesFatal and Serious CrashesFatal and Serious CrashesFatal and Serious Crashes 1 0 ↓ 100%
• The camera at the intersection of Wattle Street and William Henry Street commenced issuing warning letters in June 2011.
Annual NSW Speed Camera Performance Review 2018 - Appendix B: Red-light speed cameras B161

• There is one camera at this intersection.
Casualties and FSI Crashes
0
2
4
6
8
10
12
14
-5Y -4Y -3Y -2Y -1Y 2012 2013 2014 2015 2016 2017Number of years before and year after camera installation
Casualti
es / C
rashes
Uncategorised M inor/Other M oderate Injury
Serious Injury Killed FSI Crash
7217 Unanderra - Princes Highway at Five Islands Road
• The infringement graphs show the number of warning letters and infringements issued at this intersection as well as the trend in infringements since the camera began operation. Roadworks and camera maintenance may influence the number of infringements issued.
Status: Retain.
Casualties and casualty crashes at enforced intersection Infringements at enforced intersection
Red-Light Infringements
0
10
20
30
40
50
60
Apr-11
Oct-11
Apr-12
Oct-12
Apr-13
Oct-13
Apr-14
Oct-14
Apr-15
Oct-15
Apr-16
Oct-16
Apr-17
Oct-17
Month-Year
Infr
ingem
ents
per
Month
Red-light Warning Letters Red-light Infringements5 year
after period²
Casualty CrashesCasualty CrashesCasualty CrashesCasualty Crashes 12 9 ↓ 25%
Serious InjuriesSerious InjuriesSerious InjuriesSerious Injuries
FatalitiesFatalitiesFatalitiesFatalities
5 0 ↓ 100%
0 0 -
Pedestrian Casualties
Right Through Casualty Crashes
Adjacent Casualty Crashes
Rear End Casualty Crashes
0
10
0
1
0
2
0
4
-
↓ 80%
-
↑ 300%
Speeding Infringements
0
50
100
150
200
250
300
350
400
Apr-11
Oct-11
Apr-12
Oct-12
Apr-13
Oct-13
Apr-14
Oct-14
Apr-15
Oct-15
Apr-16
Oct-16
Apr-17
Oct-17
Month-Year
Infr
ingem
ents
per
Month
Speeding Warning Letters Speeding Infringements
Moderate InjuriesModerate InjuriesModerate InjuriesModerate Injuries 11 2 ↓ 82%
Minor / Other InjuriesMinor / Other InjuriesMinor / Other InjuriesMinor / Other Injuries 8 8 ↓ 0%
¹ Ending 91 days before the start of the warning letter period, 11 January 2011² Ending 31 December 2017
5 years before
installation¹
Total Casualties:Total Casualties:Total Casualties:Total Casualties: 10 ↓ 58%24
Percentage
change
Fatal and Serious CrashesFatal and Serious CrashesFatal and Serious CrashesFatal and Serious Crashes 4 0 ↓ 100%
• The camera at the intersection of Princes Highway and Five Islands Road commenced issuing warning letters in April 2011.
Annual NSW Speed Camera Performance Review 2018 - Appendix B: Red-light speed cameras B162

• There is one camera at this intersection.
Casualties and FSI Crashes
0
1
2
3
4
-5Y -4Y -3Y -2Y -1Y 1Y 2Y 3YNumber of years before and after camera installation
Casualti
es / C
rashes
Uncategorised M inor/Other M oderate Injury
Serious Injury Killed FSI Crash
7307 Waitara - Pacific Highway at Romsey Street (school zone)
• The infringement graphs show the number of warning letters and infringements issued at this intersection as well as the trend in infringements since the camera began operation. Roadworks and camera maintenance may influence the number of infringements issued.
Status: Insufficient data (<5 years) to reliably assess.
Casualties and casualty crashes at enforced intersection Infringements at enforced intersection
Red-Light Infringements
0
20
40
60
80
100
120
140
160
Sep-14
Dec-14
Mar-15
Jun-15
Sep-15
Dec-15
Mar-16
Jun-16
Sep-16
Dec-16
Mar-17
Jun-17
Sep-17
Dec-17
Month-Year
Infr
ingem
ents
per
Month
Red-light Warning Letters Red-light Infringements3 years and 92 days
after installation²
Casualty CrashesCasualty CrashesCasualty CrashesCasualty Crashes 7 3 ↓ 34%
Serious InjuriesSerious InjuriesSerious InjuriesSerious Injuries
FatalitiesFatalitiesFatalitiesFatalities
1 1 ↑ 54%
0 0 -
Pedestrian Casualties
Right Through Casualty Crashes
Adjacent Casualty Crashes
Rear End Casualty Crashes
1
3
1
0
0
2
0
1
↓ 100%
↑ 2%
↓ 100%
Increase
Speeding Infringements
0
100
200
300
400
500
600
700
Sep-14
Dec-14
Mar-15
Jun-15
Sep-15
Dec-15
Mar-16
Jun-16
Sep-16
Dec-16
Mar-17
Jun-17
Sep-17
Dec-17
Month-Year
Infr
ingem
ents
per
Month
Speeding Warning Letters Speeding Infringements
Moderate InjuriesModerate InjuriesModerate InjuriesModerate Injuries 3 0 ↓ 100%
Minor / Other InjuriesMinor / Other InjuriesMinor / Other InjuriesMinor / Other Injuries 3 2 ↑ 2%
¹ Ending 91 days before the start of the warning letter period, 1 July 2014² Ending 31 December 2017³ The percentage change is based on annualised crash data to allow for a direct comparison between the pre and post installation time periods. Red values indicate an increase.
5 years before
installation¹
Total Casualties:Total Casualties:Total Casualties:Total Casualties: 3 ↓ 34%7
Percentage
change³
Fatal and Serious CrashesFatal and Serious CrashesFatal and Serious CrashesFatal and Serious Crashes 1 1 ↑ 54%
• The camera at the intersection of Pacific Highway and Romsey Street commenced issuing warning letters in September 2014.
Annual NSW Speed Camera Performance Review 2018 - Appendix B: Red-light speed cameras B163

• There is one camera at this intersection.
Casualties and FSI Crashes
0
2
4
6
8
10
-5Y -4Y -3Y -2Y -1Y 1Y 2Y 3Y 4YNumber of years before and after camera installation
Casualti
es / C
rashes
Uncategorised M inor/Other M oderate Injury
Serious Injury Killed FSI Crash
7289 Wallsend - Thomas Street at Metcalfe Street
• The infringement graphs show the number of warning letters and infringements issued at this intersection as well as the trend in infringements since the camera began operation. Roadworks and camera maintenance may influence the number of infringements issued.
Status: Insufficient data (<5 years) to reliably assess.
Casualties and casualty crashes at enforced intersection Infringements at enforced intersection
Red-Light Infringements
0
10
20
30
40
50
60
70
80
90
100
Sep-13
Jan-14
May-14
Sep-14
Jan-15
May-15
Sep-15
Jan-16
May-16
Sep-16
Jan-17
May-17
Sep-17
Month-Year
Infr
ingem
ents
per
Month
Red-light Warning Letters Red-light Infringements4 years and 96 days
after installation²
Casualty CrashesCasualty CrashesCasualty CrashesCasualty Crashes 11 9 ↓ 4%
Serious InjuriesSerious InjuriesSerious InjuriesSerious Injuries
FatalitiesFatalitiesFatalitiesFatalities
1 3 ↑ 252%
0 1 Increase
Pedestrian Casualties
Right Through Casualty Crashes
Adjacent Casualty Crashes
Rear End Casualty Crashes
0
2
2
7
0
1
2
6
-
↓ 41%
↑ 17%
↑ 1%
Speeding Infringements
0
10
20
30
40
50
60
70
80
Sep-13
Jan-14
May-14
Sep-14
Jan-15
May-15
Sep-15
Jan-16
May-16
Sep-16
Jan-17
May-17
Sep-17
Month-Year
Infr
ingem
ents
per
Month
Speeding Warning Letters Speeding Infringements
Moderate InjuriesModerate InjuriesModerate InjuriesModerate Injuries 7 8 ↑ 34%
Minor / Other InjuriesMinor / Other InjuriesMinor / Other InjuriesMinor / Other Injuries 7 1 ↓ 83%
¹ Ending 91 days before the start of the warning letter period, 27 June 2013² Ending 31 December 2017³ The percentage change is based on annualised crash data to allow for a direct comparison between the pre and post installation time periods. Red values indicate an increase.
5 years before
installation¹
Total Casualties:Total Casualties:Total Casualties:Total Casualties: 13 ↑ 2%15
Percentage
change³
Fatal and Serious CrashesFatal and Serious CrashesFatal and Serious CrashesFatal and Serious Crashes 1 3 ↑ 252%
• The camera at the intersection of Thomas Street and Metcalfe Street commenced issuing warning letters in September 2013.
Annual NSW Speed Camera Performance Review 2018 - Appendix B: Red-light speed cameras B164

• There is one camera at this intersection.
Casualties and FSI Crashes
0
2
4
6
8
10
-5Y -4Y -3Y -2Y -1Y 1Y 2Y 3Y 4YNumber of years before and after camera installation
Casualti
es / C
rashes
Uncategorised M inor/Other M oderate Injury
Serious Injury Killed FSI Crash
7290 Warrawong - King Street (Grand Pacific Drive) at Cowper Street
• The infringement graphs show the number of warning letters and infringements issued at this intersection as well as the trend in infringements since the camera began operation. Roadworks and camera maintenance may influence the number of infringements issued.
Status: Insufficient data (<5 years) to reliably assess.
Casualties and casualty crashes at enforced intersection Infringements at enforced intersection
Red-Light Infringements
0
10
20
30
40
50
60
70
Oct-13
Jan-14
Apr-14
Jul-14
Oct-14
Jan-15
Apr-15
Jul-15
Oct-15
Jan-16
Apr-16
Jul-16
Oct-16
Jan-17
Apr-17
Jul-17
Oct-17
Month-Year
Infr
ingem
ents
per
Month
Red-light Warning Letters Red-light Infringements4 years and 70 days
after installation²
Casualty CrashesCasualty CrashesCasualty CrashesCasualty Crashes 8 5 ↓ 25%
Serious InjuriesSerious InjuriesSerious InjuriesSerious Injuries
FatalitiesFatalitiesFatalitiesFatalities
2 1 ↓ 40%
0 0 -
Pedestrian Casualties
Right Through Casualty Crashes
Adjacent Casualty Crashes
Rear End Casualty Crashes
1
1
2
3
2
1
0
0
↑ 139%
↑ 19%
↓ 100%
↓ 100%
Speeding Infringements
0
200
400
600
800
1000
1200
Oct-13
Feb-14
Jun-14
Oct-14
Feb-15
Jun-15
Oct-15
Feb-16
Jun-16
Oct-16
Feb-17
Jun-17
Oct-17
Month-Year
Infr
ingem
ents
per
Month
Speeding Warning Letters Speeding Infringements
Moderate InjuriesModerate InjuriesModerate InjuriesModerate Injuries 11 1 ↓ 89%
Minor / Other InjuriesMinor / Other InjuriesMinor / Other InjuriesMinor / Other Injuries 3 4 ↑ 59%
¹ Ending 91 days before the start of the warning letter period, 23 July 2013² Ending 31 December 2017³ The percentage change is based on annualised crash data to allow for a direct comparison between the pre and post installation time periods. Red values indicate an increase.
5 years before
installation¹
Total Casualties:Total Casualties:Total Casualties:Total Casualties: 6 ↓ 55%16
Percentage
change³
Fatal and Serious CrashesFatal and Serious CrashesFatal and Serious CrashesFatal and Serious Crashes 2 1 ↓ 40%
• The camera at the intersection of King Street (Grand Pacific Drive) and Cowper Street commenced issuing warning letters in October 2013.
Annual NSW Speed Camera Performance Review 2018 - Appendix B: Red-light speed cameras B165

• There is one camera at this intersection. This was previously a wet-film red-light camera location.
Casualties and FSI Crashes
0
2
4
6
8
10
12
14
-5Y -4Y -3Y -2Y -1Y 2011 2012 2013 2014 2015 2016 2017Number of years before and year after camera installation
Casualti
es / C
rashes
Uncategorised M inor/Other M oderate Injury
Serious Injury Killed FSI Crash
7176 Warwick Farm - Hume Highway at Bigge Street
• The infringement graphs show the number of warning letters and infringements issued at this intersection as well as the trend in infringements since the camera began operation. Roadworks and camera maintenance may influence the number of infringements issued.
Status: Retain.
Casualties and casualty crashes at enforced intersection Infringements at enforced intersection
Red-Light Infringements
0
10
20
30
40
50
60
70
80
90
100
Nov-10
May-11
Nov-11
May-12
Nov-12
May-13
Nov-13
May-14
Nov-14
May-15
Nov-15
May-16
Nov-16
May-17
Nov-17
Month-Year
Infr
ingem
ents
per
Month
Red-light Warning Letters Red-light Infringements5 year
after period²
Casualty CrashesCasualty CrashesCasualty CrashesCasualty Crashes 28 15 ↓ 46%
Serious InjuriesSerious InjuriesSerious InjuriesSerious Injuries
FatalitiesFatalitiesFatalitiesFatalities
7 3 ↓ 57%
0 0 -
Pedestrian Casualties
Right Through Casualty Crashes
Adjacent Casualty Crashes
Rear End Casualty Crashes
1
10
0
12
1
3
0
8
↓ 0%
↓ 70%
-
↓ 33%
Speeding Infringements
0
10
20
30
40
50
60
70
80
90
Nov-10
May-11
Nov-11
May-12
Nov-12
May-13
Nov-13
May-14
Nov-14
May-15
Nov-15
May-16
Nov-16
May-17
Nov-17
Month-Year
Infr
ingem
ents
per
Month
Speeding Warning Letters Speeding Infringements
Moderate InjuriesModerate InjuriesModerate InjuriesModerate Injuries 17 7 ↓ 59%
Minor / Other InjuriesMinor / Other InjuriesMinor / Other InjuriesMinor / Other Injuries 10 7 ↓ 30%
¹ Ending 91 days before the start of the warning letter period, 16 August 2010² Ending 31 December 2017
5 years before
installation¹
Total Casualties:Total Casualties:Total Casualties:Total Casualties: 17 ↓ 50%34
Percentage
change
Fatal and Serious CrashesFatal and Serious CrashesFatal and Serious CrashesFatal and Serious Crashes 7 3 ↓ 57%
• The camera at the intersection of Hume Highway and Bigge Street commenced issuing warning letters in November 2010.
Annual NSW Speed Camera Performance Review 2018 - Appendix B: Red-light speed cameras B166

• There is one camera at this intersection.
Casualties and FSI Crashes
0
2
4
6
8
10
12
14
-5Y -4Y -3Y -2Y -1Y 1YNumber of years before and after camera installation
Casualti
es / C
rashes
Uncategorised M inor/Other M oderate Injury
Serious Injury Killed FSI Crash
7331 Waterloo - McEvoy Street at Elizabeth Street
• The infringement graphs show the number of warning letters and infringements issued at this intersection as well as the trend in infringements since the camera began operation. Roadworks and camera maintenance may influence the number of infringements issued.
Status: Insufficient data (<5 years) to reliably assess.
Casualties and casualty crashes at enforced intersection Infringements at enforced intersection
Red-Light Infringements
0
10
20
30
40
50
60
70
Nov-16
Dec-16
Jan-17
Feb-17
Mar-17
Apr-17
May-17
Jun-17
Jul-17
Aug-17
Sep-17
Oct-17
Nov-17
Dec-17
Month-Year
Infr
ingem
ents
per
Month
Red-light Warning Letters Red-light Infringements1 year and 31 days
after installation²
Casualty CrashesCasualty CrashesCasualty CrashesCasualty Crashes 20 3 ↓ 31%
Serious InjuriesSerious InjuriesSerious InjuriesSerious Injuries
FatalitiesFatalitiesFatalitiesFatalities
6 3 ↑ 131%
0 0 -
Pedestrian Casualties
Right Through Casualty Crashes
Adjacent Casualty Crashes
Rear End Casualty Crashes
2
11
4
1
1
2
0
0
↑ 131%
↓ 16%
↓ 100%
↓ 100%
Speeding Infringements
0
0.2
0.4
0.6
0.8
1
1.2
Nov-16
Dec-16
Jan-17
Feb-17
Mar-17
Apr-17
May-17
Jun-17
Jul-17
Aug-17
Sep-17
Oct-17
Nov-17
Dec-17
Month-Year
Infr
ingem
ents
per
Month
Speeding Warning Letters Speeding Infringements
Moderate InjuriesModerate InjuriesModerate InjuriesModerate Injuries 9 1 ↓ 49%
Minor / Other InjuriesMinor / Other InjuriesMinor / Other InjuriesMinor / Other Injuries 9 3 ↑ 54%
¹ Ending 91 days before the start of the warning letter period, 31 August 2016² Ending 31 December 2017³ The percentage change is based on annualised crash data to allow for a direct comparison between the pre and post installation time periods. Red values indicate an increase.
5 years before
installation¹
Total Casualties:Total Casualties:Total Casualties:Total Casualties: 7 ↑ 35%24
Percentage
change³
Fatal and Serious CrashesFatal and Serious CrashesFatal and Serious CrashesFatal and Serious Crashes 6 3 ↑ 131%
• The camera at the intersection of McEvoy Street and Elizabeth Street commenced issuing warning letters in November 2016.
Annual NSW Speed Camera Performance Review 2018 - Appendix B: Red-light speed cameras B167

• There is one camera at this intersection. This was previously a wet-film red-light camera location.
Casualties and FSI Crashes
0
1
2
3
4
5
6
7
-5Y -4Y -3Y -2Y -1Y 2011 2012 2013 2014 2015 2016 2017Number of years before and year after camera installation
Casualti
es / C
rashes
Uncategorised M inor/Other M oderate Injury
Serious Injury Killed FSI Crash
7164 Wentworthville - Great Western Highway at Station Street
• The infringement graphs show the number of warning letters and infringements issued at this intersection as well as the trend in infringements since the camera began operation. Roadworks and camera maintenance may influence the number of infringements issued.
Status: Retain.
Casualties and casualty crashes at enforced intersection Infringements at enforced intersection
Red-Light Infringements
0
10
20
30
40
50
60
70
80
90
100
Sep-10
Mar-11
Sep-11
Mar-12
Sep-12
Mar-13
Sep-13
Mar-14
Sep-14
Mar-15
Sep-15
Mar-16
Sep-16
Mar-17
Sep-17
Month-Year
Infr
ingem
ents
per
Month
Red-light Warning Letters Red-light Infringements5 year
after period²
Casualty CrashesCasualty CrashesCasualty CrashesCasualty Crashes 15 9 ↓ 40%
Serious InjuriesSerious InjuriesSerious InjuriesSerious Injuries
FatalitiesFatalitiesFatalitiesFatalities
2 1 ↓ 50%
0 0 -
Pedestrian Casualties
Right Through Casualty Crashes
Adjacent Casualty Crashes
Rear End Casualty Crashes
0
2
4
6
0
0
0
6
-
↓ 100%
↓ 100%
↓ 0%
Speeding Infringements
0
5
10
15
20
25
30
35
Sep-10
Mar-11
Sep-11
Mar-12
Sep-12
Mar-13
Sep-13
Mar-14
Sep-14
Mar-15
Sep-15
Mar-16
Sep-16
Mar-17
Sep-17
Month-Year
Infr
ingem
ents
per
Month
Speeding Warning Letters Speeding Infringements
Moderate InjuriesModerate InjuriesModerate InjuriesModerate Injuries 9 3 ↓ 67%
Minor / Other InjuriesMinor / Other InjuriesMinor / Other InjuriesMinor / Other Injuries 7 6 ↓ 14%
¹ Ending 91 days before the start of the warning letter period, 28 June 2010² Ending 31 December 2017
5 years before
installation¹
Total Casualties:Total Casualties:Total Casualties:Total Casualties: 10 ↓ 44%18
Percentage
change
Fatal and Serious CrashesFatal and Serious CrashesFatal and Serious CrashesFatal and Serious Crashes 2 1 ↓ 50%
• The camera at the intersection of Great Western Highway and Station Street commenced issuing warning letters in September 2010.
Annual NSW Speed Camera Performance Review 2018 - Appendix B: Red-light speed cameras B168

• There is one camera at this intersection. This was previously a wet-film red-light camera location.
Casualties and FSI Crashes
0
1
2
3
4
5
6
7
-5Y -4Y -3Y -2Y -1Y 2011 2012 2013 2014 2015 2016 2017Number of years before and year after camera installation
Casualti
es / C
rashes
Uncategorised M inor/Other M oderate Injury
Serious Injury Killed FSI Crash
7165 West Pennant Hills - Pennant Hills Road at Eaton Road
• The infringement graphs show the number of warning letters and infringements issued at this intersection as well as the trend in infringements since the camera began operation. Roadworks and camera maintenance may influence the number of infringements issued.
Status: Retain.
Casualties and casualty crashes at enforced intersection Infringements at enforced intersection
Red-Light Infringements
0
50
100
150
200
250
Aug-10
Feb-11
Aug-11
Feb-12
Aug-12
Feb-13
Aug-13
Feb-14
Aug-14
Feb-15
Aug-15
Feb-16
Aug-16
Feb-17
Aug-17
Month-Year
Infr
ingem
ents
per
Month
Red-light Warning Letters Red-light Infringements5 year
after period²
Casualty CrashesCasualty CrashesCasualty CrashesCasualty Crashes 12 12 ↓ 0%
Serious InjuriesSerious InjuriesSerious InjuriesSerious Injuries
FatalitiesFatalitiesFatalitiesFatalities
5 4 ↓ 20%
1 0 ↓ 100%
Pedestrian Casualties
Right Through Casualty Crashes
Adjacent Casualty Crashes
Rear End Casualty Crashes
0
4
1
3
0
3
2
5
-
↓ 25%
↑ 100%
↑ 67%
Speeding Infringements
0
100
200
300
400
500
600
Aug-10
Feb-11
Aug-11
Feb-12
Aug-12
Feb-13
Aug-13
Feb-14
Aug-14
Feb-15
Aug-15
Feb-16
Aug-16
Feb-17
Aug-17
Month-Year
Infr
ingem
ents
per
Month
Speeding Warning Letters Speeding Infringements
Moderate InjuriesModerate InjuriesModerate InjuriesModerate Injuries 6 5 ↓ 17%
Minor / Other InjuriesMinor / Other InjuriesMinor / Other InjuriesMinor / Other Injuries 2 8 ↑ 300%
¹ Ending 91 days before the start of the warning letter period, 27 May 2010² Ending 31 December 2017
5 years before
installation¹
Total Casualties:Total Casualties:Total Casualties:Total Casualties: 17 ↑ 21%14
Percentage
change
Fatal and Serious CrashesFatal and Serious CrashesFatal and Serious CrashesFatal and Serious Crashes 5 4 ↓ 20%
• The camera at the intersection of Pennant Hills Road and Eaton Road commenced issuing warning letters in August 2010.
Annual NSW Speed Camera Performance Review 2018 - Appendix B: Red-light speed cameras B169

• There is one camera at this intersection. This was previously a wet-film red-light camera location.
Casualties and FSI Crashes
0
2
4
6
8
10
-5Y -4Y -3Y -2Y -1Y 2011 2012 2013 2014 2015 2016 2017Number of years before and year after camera installation
Casualti
es / C
rashes
Uncategorised M inor/Other M oderate Injury
Serious Injury Killed FSI Crash
7184 West Pymble - Ryde Road at Lady Game Drive
• The infringement graphs show the number of warning letters and infringements issued at this intersection as well as the trend in infringements since the camera began operation. Roadworks and camera maintenance may influence the number of infringements issued.
Status: Retain.
Casualties and casualty crashes at enforced intersection Infringements at enforced intersection
Red-Light Infringements
0
20
40
60
80
100
120
Dec-10
Jun-11
Dec-11
Jun-12
Dec-12
Jun-13
Dec-13
Jun-14
Dec-14
Jun-15
Dec-15
Jun-16
Dec-16
Jun-17
Dec-17
Month-Year
Infr
ingem
ents
per
Month
Red-light Warning Letters Red-light Infringements5 year
after period²
Casualty CrashesCasualty CrashesCasualty CrashesCasualty Crashes 16 6 ↓ 63%
Serious InjuriesSerious InjuriesSerious InjuriesSerious Injuries
FatalitiesFatalitiesFatalitiesFatalities
1 1 ↓ 0%
0 0 -
Pedestrian Casualties
Right Through Casualty Crashes
Adjacent Casualty Crashes
Rear End Casualty Crashes
0
2
0
10
0
0
0
6
-
↓ 100%
-
↓ 40%
Speeding Infringements
0
200
400
600
800
1000
1200
1400
1600
1800
2000
Dec-10
Jun-11
Dec-11
Jun-12
Dec-12
Jun-13
Dec-13
Jun-14
Dec-14
Jun-15
Dec-15
Jun-16
Dec-16
Jun-17
Dec-17
Month-Year
Infr
ingem
ents
per
Month
Speeding Warning Letters Speeding Infringements
Moderate InjuriesModerate InjuriesModerate InjuriesModerate Injuries 11 2 ↓ 82%
Minor / Other InjuriesMinor / Other InjuriesMinor / Other InjuriesMinor / Other Injuries 8 4 ↓ 50%
¹ Ending 91 days before the start of the warning letter period, 15 September 2010² Ending 31 December 2017
5 years before
installation¹
Total Casualties:Total Casualties:Total Casualties:Total Casualties: 7 ↓ 65%20
Percentage
change
Fatal and Serious CrashesFatal and Serious CrashesFatal and Serious CrashesFatal and Serious Crashes 1 1 ↓ 0%
• The camera at the intersection of Ryde Road and Lady Game Drive commenced issuing warning letters in December 2010.
Annual NSW Speed Camera Performance Review 2018 - Appendix B: Red-light speed cameras B170

• There is one camera at this intersection.
Casualties and FSI Crashes
0
2
4
6
8
10
12
-5Y -4Y -3Y -2Y -1Y 1Y 2Y 3Y 4YNumber of years before and after camera installation
Casualti
es / C
rashes
Uncategorised M inor/Other M oderate Injury
Serious Injury Killed FSI Crash
7245 Wiley Park - The Boulevarde at King Georges Road (school zone)
• The infringement graphs show the number of warning letters and infringements issued at this intersection as well as the trend in infringements since the camera began operation. Roadworks and camera maintenance may influence the number of infringements issued.
Status: Insufficient data (<5 years) to reliably assess.
Casualties and casualty crashes at enforced intersection Infringements at enforced intersection
Red-Light Infringements
0
20
40
60
80
100
120
140
160
Mar-13
Jul-13
Nov-13
Mar-14
Jul-14
Nov-14
Mar-15
Jul-15
Nov-15
Mar-16
Jul-16
Nov-16
Mar-17
Jul-17
Nov-17
Month-Year
Infr
ingem
ents
per
Month
Red-light Warning Letters Red-light Infringements4 years and 277
days after installation²
Casualty CrashesCasualty CrashesCasualty CrashesCasualty Crashes 15 19 ↑ 33%
Serious InjuriesSerious InjuriesSerious InjuriesSerious Injuries
FatalitiesFatalitiesFatalitiesFatalities
4 4 ↑ 5%
0 0 -
Pedestrian Casualties
Right Through Casualty Crashes
Adjacent Casualty Crashes
Rear End Casualty Crashes
2
5
4
3
3
7
1
5
↑ 58%
↑ 47%
↓ 74%
↑ 75%
Speeding Infringements
0
10
20
30
40
50
60
70
Mar-13
Jul-13
Nov-13
Mar-14
Jul-14
Nov-14
Mar-15
Jul-15
Nov-15
Mar-16
Jul-16
Nov-16
Mar-17
Jul-17
Nov-17
Month-Year
Infr
ingem
ents
per
Month
Speeding Warning Letters Speeding Infringements
Moderate InjuriesModerate InjuriesModerate InjuriesModerate Injuries 6 12 ↑ 110%
Minor / Other InjuriesMinor / Other InjuriesMinor / Other InjuriesMinor / Other Injuries 18 9 ↓ 47%
¹ Ending 91 days before the start of the warning letter period, 28 December 2012² Ending 31 December 2017³ The percentage change is based on annualised crash data to allow for a direct comparison between the pre and post installation time periods. Red values indicate an increase.
5 years before
installation¹
Total Casualties:Total Casualties:Total Casualties:Total Casualties: 25 ↓ 6%28
Percentage
change³
Fatal and Serious CrashesFatal and Serious CrashesFatal and Serious CrashesFatal and Serious Crashes 3 4 ↑ 40%
• The camera at the intersection of The Boulevarde and King Georges Road commenced issuing warning letters in March 2013.
Annual NSW Speed Camera Performance Review 2018 - Appendix B: Red-light speed cameras B171

• There is one camera at this intersection. This was previously a wet-film red-light camera location.
Casualties and FSI Crashes
0
1
2
3
4
5
6
-5Y -4Y -3Y -2Y -1Y 2012 2013 2014 2015 2016 2017Number of years before and year after camera installation
Casualti
es / C
rashes
Uncategorised M inor/Other M oderate Injury
Serious Injury Killed FSI Crash
7220 Windang - Windang Road at Boronia Avenue
• The infringement graphs show the number of warning letters and infringements issued at this intersection as well as the trend in infringements since the camera began operation. Roadworks and camera maintenance may influence the number of infringements issued.
Status: Retain.
Casualties and casualty crashes at enforced intersection Infringements at enforced intersection
Red-Light Infringements
0
5
10
15
20
25
30
35
40
45
50
May-11
Nov-11
May-12
Nov-12
May-13
Nov-13
May-14
Nov-14
May-15
Nov-15
May-16
Nov-16
May-17
Nov-17
Month-Year
Infr
ingem
ents
per
Month
Red-light Warning Letters Red-light Infringements5 year
after period²
Casualty CrashesCasualty CrashesCasualty CrashesCasualty Crashes 5 6 ↑ 20%
Serious InjuriesSerious InjuriesSerious InjuriesSerious Injuries
FatalitiesFatalitiesFatalitiesFatalities
3 1 ↓ 67%
0 0 -
Pedestrian Casualties
Right Through Casualty Crashes
Adjacent Casualty Crashes
Rear End Casualty Crashes
3
1
0
0
0
2
0
4
↓ 100%
↑ 100%
-
Increase
Speeding Infringements
0
100
200
300
400
500
600
700
800
900
May-11
Nov-11
May-12
Nov-12
May-13
Nov-13
May-14
Nov-14
May-15
Nov-15
May-16
Nov-16
May-17
Nov-17
Month-Year
Infr
ingem
ents
per
Month
Speeding Warning Letters Speeding Infringements
Moderate InjuriesModerate InjuriesModerate InjuriesModerate Injuries 2 6 ↑ 200%
Minor / Other InjuriesMinor / Other InjuriesMinor / Other InjuriesMinor / Other Injuries 2 2 ↓ 0%
¹ Ending 91 days before the start of the warning letter period, 25 February 2011² Ending 31 December 2017
5 years before
installation¹
Total Casualties:Total Casualties:Total Casualties:Total Casualties: 9 ↑ 29%7
Percentage
change
Fatal and Serious CrashesFatal and Serious CrashesFatal and Serious CrashesFatal and Serious Crashes 3 1 ↓ 67%
• The camera at the intersection of Windang Road and Boronia Avenue commenced issuing warning letters in May 2011.
Annual NSW Speed Camera Performance Review 2018 - Appendix B: Red-light speed cameras B172

• There is one camera at this intersection.
Casualties and FSI Crashes
0
2
4
6
8
10
-5Y -4Y -3Y -2Y -1Y 1Y 2YNumber of years before and after camera installation
Casualti
es / C
rashes
Uncategorised M inor/Other M oderate Injury
Serious Injury Killed FSI Crash
7325 Windsor - Macquarie Street at Hawkesbury Valley Way
• The infringement graphs show the number of warning letters and infringements issued at this intersection as well as the trend in infringements since the camera began operation. Roadworks and camera maintenance may influence the number of infringements issued.
Status: Insufficient data (<5 years) to reliably assess.
Casualties and casualty crashes at enforced intersection Infringements at enforced intersection
Red-Light Infringements
0
50
100
150
200
250
Jun-15
Aug-15
Oct-15
Dec-15
Feb-16
Apr-16
Jun-16
Aug-16
Oct-16
Dec-16
Feb-17
Apr-17
Jun-17
Aug-17
Oct-17
Dec-17
Month-Year
Infr
ingem
ents
per
Month
Red-light Warning Letters Red-light Infringements2 years and 185
days after installation²
Casualty CrashesCasualty CrashesCasualty CrashesCasualty Crashes 18 1 ↓ 89%
Serious InjuriesSerious InjuriesSerious InjuriesSerious Injuries
FatalitiesFatalitiesFatalitiesFatalities
10 0 ↓ 100%
0 0 -
Pedestrian Casualties
Right Through Casualty Crashes
Adjacent Casualty Crashes
Rear End Casualty Crashes
0
10
3
1
0
1
0
0
-
↓ 80%
↓ 100%
↓ 100%
Speeding Infringements
0
10
20
30
40
50
60
70
Jun-15
Aug-15
Oct-15
Dec-15
Feb-16
Apr-16
Jun-16
Aug-16
Oct-16
Dec-16
Feb-17
Apr-17
Jun-17
Aug-17
Oct-17
Dec-17
Month-Year
Infr
ingem
ents
per
Month
Speeding Warning Letters Speeding Infringements
Moderate InjuriesModerate InjuriesModerate InjuriesModerate Injuries 13 0 ↓ 100%
Minor / Other InjuriesMinor / Other InjuriesMinor / Other InjuriesMinor / Other Injuries 3 1 ↓ 33%
¹ Ending 91 days before the start of the warning letter period, 31 March 2015² Ending 31 December 2017³ The percentage change is based on annualised crash data to allow for a direct comparison between the pre and post installation time periods. Red values indicate an increase.
5 years before
installation¹
Total Casualties:Total Casualties:Total Casualties:Total Casualties: 1 ↓ 92%26
Percentage
change³
Fatal and Serious CrashesFatal and Serious CrashesFatal and Serious CrashesFatal and Serious Crashes 8 0 ↓ 100%
• The camera at the intersection of Macquarie Street and Hawkesbury Valley Way commenced issuing warning letters in June 2015.
Annual NSW Speed Camera Performance Review 2018 - Appendix B: Red-light speed cameras B173

• There is one camera at this intersection. This was previously a wet-film red-light camera location.
Casualties and FSI Crashes
0
2
4
6
8
10
-5Y -4Y -3Y -2Y -1Y 2012 2013 2014 2015 2016 2017Number of years before and year after camera installation
Casualti
es / C
rashes
Uncategorised M inor/Other M oderate Injury
Serious Injury Killed FSI Crash
7218 Wollongong - Corrimal Street at Burelli Street
• The infringement graphs show the number of warning letters and infringements issued at this intersection as well as the trend in infringements since the camera began operation. Roadworks and camera maintenance may influence the number of infringements issued.
Status: Retain.
Casualties and casualty crashes at enforced intersection Infringements at enforced intersection
Red-Light Infringements
0
10
20
30
40
50
60
70
80
Apr-11
Oct-11
Apr-12
Oct-12
Apr-13
Oct-13
Apr-14
Oct-14
Apr-15
Oct-15
Apr-16
Oct-16
Apr-17
Oct-17
Month-Year
Infr
ingem
ents
per
Month
Red-light Warning Letters Red-light Infringements5 year
after period²
Casualty CrashesCasualty CrashesCasualty CrashesCasualty Crashes 12 3 ↓ 75%
Serious InjuriesSerious InjuriesSerious InjuriesSerious Injuries
FatalitiesFatalitiesFatalitiesFatalities
4 1 ↓ 75%
0 0 -
Pedestrian Casualties
Right Through Casualty Crashes
Adjacent Casualty Crashes
Rear End Casualty Crashes
2
7
3
1
0
1
1
0
↓ 100%
↓ 86%
↓ 67%
↓ 100%
Speeding Infringements
0
20
40
60
80
100
120
140
Apr-11
Oct-11
Apr-12
Oct-12
Apr-13
Oct-13
Apr-14
Oct-14
Apr-15
Oct-15
Apr-16
Oct-16
Apr-17
Oct-17
Month-Year
Infr
ingem
ents
per
Month
Speeding Warning Letters Speeding Infringements
Moderate InjuriesModerate InjuriesModerate InjuriesModerate Injuries 11 1 ↓ 91%
Minor / Other InjuriesMinor / Other InjuriesMinor / Other InjuriesMinor / Other Injuries 8 1 ↓ 88%
¹ Ending 91 days before the start of the warning letter period, 18 January 2011² Ending 31 December 2017
5 years before
installation¹
Total Casualties:Total Casualties:Total Casualties:Total Casualties: 3 ↓ 87%23
Percentage
change
Fatal and Serious CrashesFatal and Serious CrashesFatal and Serious CrashesFatal and Serious Crashes 2 1 ↓ 50%
• The camera at the intersection of Corrimal Street and Burelli Street commenced issuing warning letters in April 2011.
Annual NSW Speed Camera Performance Review 2018 - Appendix B: Red-light speed cameras B174

• There is one camera at this intersection.
Casualties and FSI Crashes
0
1
2
3
4
5
6
7
-5Y -4Y -3Y -2Y -1Y 2012 2013 2014 2015 2016 2017Number of years before and year after camera installation
Casualti
es / C
rashes
Uncategorised M inor/Other M oderate Injury
Serious Injury Killed FSI Crash
7216 Wollongong - Gladstone Avenue at Princes Highway
• The infringement graphs show the number of warning letters and infringements issued at this intersection as well as the trend in infringements since the camera began operation. Roadworks and camera maintenance may influence the number of infringements issued.
Status: Retain.
Casualties and casualty crashes at enforced intersection Infringements at enforced intersection
Red-Light Infringements
0
20
40
60
80
100
120
140
160
180
200
Jun-11
Dec-11
Jun-12
Dec-12
Jun-13
Dec-13
Jun-14
Dec-14
Jun-15
Dec-15
Jun-16
Dec-16
Jun-17
Dec-17
Month-Year
Infr
ingem
ents
per
Month
Red-light Warning Letters Red-light Infringements5 year
after period²
Casualty CrashesCasualty CrashesCasualty CrashesCasualty Crashes 19 13 ↓ 32%
Serious InjuriesSerious InjuriesSerious InjuriesSerious Injuries
FatalitiesFatalitiesFatalitiesFatalities
4 3 ↓ 25%
0 0 -
Pedestrian Casualties
Right Through Casualty Crashes
Adjacent Casualty Crashes
Rear End Casualty Crashes
3
11
3
0
2
2
3
4
↓ 33%
↓ 82%
↓ 0%
Increase
Speeding Infringements
0
1
2
3
4
5
6
7
Jun-11
Dec-11
Jun-12
Dec-12
Jun-13
Dec-13
Jun-14
Dec-14
Jun-15
Dec-15
Jun-16
Dec-16
Jun-17
Dec-17
Month-Year
Infr
ingem
ents
per
Month
Speeding Warning Letters Speeding Infringements
Moderate InjuriesModerate InjuriesModerate InjuriesModerate Injuries 9 8 ↓ 11%
Minor / Other InjuriesMinor / Other InjuriesMinor / Other InjuriesMinor / Other Injuries 9 3 ↓ 67%
¹ Ending 91 days before the start of the warning letter period, 15 March 2011² Ending 31 December 2017
5 years before
installation¹
Total Casualties:Total Casualties:Total Casualties:Total Casualties: 14 ↓ 36%22
Percentage
change
Fatal and Serious CrashesFatal and Serious CrashesFatal and Serious CrashesFatal and Serious Crashes 3 3 ↓ 0%
• The camera at the intersection of Gladstone Avenue and Princes Highway commenced issuing warning letters in June 2011.
Annual NSW Speed Camera Performance Review 2018 - Appendix B: Red-light speed cameras B175

• There is one camera at this intersection.
Casualties and FSI Crashes
0
1
2
3
4
5
6
-5Y -4Y -3Y -2Y -1Y 1Y 2Y 3Y 4YNumber of years before and after camera installation
Casualti
es / C
rashes
Uncategorised M inor/Other M oderate Injury
Serious Injury Killed FSI Crash
7288 Woollahra - Queen Street at Ocean Street
• The infringement graphs show the number of warning letters and infringements issued at this intersection as well as the trend in infringements since the camera began operation. Roadworks and camera maintenance may influence the number of infringements issued.
Status: Insufficient data (<5 years) to reliably assess.
Casualties and casualty crashes at enforced intersection Infringements at enforced intersection
Red-Light Infringements
0
10
20
30
40
50
60
70
80
Oct-13
Jan-14
Apr-14
Jul-14
Oct-14
Jan-15
Apr-15
Jul-15
Oct-15
Jan-16
Apr-16
Jul-16
Oct-16
Jan-17
Apr-17
Jul-17
Oct-17
Month-Year
Infr
ingem
ents
per
Month
Red-light Warning Letters Red-light Infringements4 years and 74 days
after installation²
Casualty CrashesCasualty CrashesCasualty CrashesCasualty Crashes 10 5 ↓ 41%
Serious InjuriesSerious InjuriesSerious InjuriesSerious Injuries
FatalitiesFatalitiesFatalitiesFatalities
3 2 ↓ 21%
0 0 -
Pedestrian Casualties
Right Through Casualty Crashes
Adjacent Casualty Crashes
Rear End Casualty Crashes
0
3
6
1
3
1
0
0
Increase
↓ 60%
↓ 100%
↓ 100%
Speeding Infringements
0
2
4
6
8
10
12
Oct-13
Jan-14
Apr-14
Jul-14
Oct-14
Jan-15
Apr-15
Jul-15
Oct-15
Jan-16
Apr-16
Jul-16
Oct-16
Jan-17
Apr-17
Jul-17
Oct-17
Month-Year
Infr
ingem
ents
per
Month
Speeding Warning Letters Speeding Infringements
Moderate InjuriesModerate InjuriesModerate InjuriesModerate Injuries 6 2 ↓ 60%
Minor / Other InjuriesMinor / Other InjuriesMinor / Other InjuriesMinor / Other Injuries 2 1 ↓ 41%
¹ Ending 91 days before the start of the warning letter period, 19 July 2013² Ending 31 December 2017³ The percentage change is based on annualised crash data to allow for a direct comparison between the pre and post installation time periods. Red values indicate an increase.
5 years before
installation¹
Total Casualties:Total Casualties:Total Casualties:Total Casualties: 5 ↓ 46%11
Percentage
change³
Fatal and Serious CrashesFatal and Serious CrashesFatal and Serious CrashesFatal and Serious Crashes 3 2 ↓ 21%
• The camera at the intersection of Queen Street and Ocean Street commenced issuing warning letters in October 2013.
Annual NSW Speed Camera Performance Review 2018 - Appendix B: Red-light speed cameras B176

• There is one camera at this intersection.
Casualties and FSI Crashes
0
2
4
6
8
10
-5Y -4Y -3Y -2Y -1Y 1Y 2Y 3YNumber of years before and after camera installation
Casualti
es / C
rashes
Uncategorised M inor/Other M oderate Injury
Serious Injury Killed FSI Crash
7294 Yagoona - Rookwood Road at Brunker Road
• The infringement graphs show the number of warning letters and infringements issued at this intersection as well as the trend in infringements since the camera began operation. Roadworks and camera maintenance may influence the number of infringements issued.
Status: Insufficient data (<5 years) to reliably assess.
Casualties and casualty crashes at enforced intersection Infringements at enforced intersection
Red-Light Infringements
0
100
200
300
400
500
600
Jul-14
Oct-14
Jan-15
Apr-15
Jul-15
Oct-15
Jan-16
Apr-16
Jul-16
Oct-16
Jan-17
Apr-17
Jul-17
Oct-17
Month-Year
Infr
ingem
ents
per
Month
Red-light Warning Letters Red-light Infringements3 years and 159
days after installation²
Casualty CrashesCasualty CrashesCasualty CrashesCasualty Crashes 18 17 ↑ 37%
Serious InjuriesSerious InjuriesSerious InjuriesSerious Injuries
FatalitiesFatalitiesFatalitiesFatalities
5 5 ↑ 45%
0 0 -
Pedestrian Casualties
Right Through Casualty Crashes
Adjacent Casualty Crashes
Rear End Casualty Crashes
0
6
9
0
1
1
5
8
Increase
↓ 76%
↓ 19%
Increase
Speeding Infringements
0
100
200
300
400
500
600
Jul-14
Oct-14
Jan-15
Apr-15
Jul-15
Oct-15
Jan-16
Apr-16
Jul-16
Oct-16
Jan-17
Apr-17
Jul-17
Oct-17
Month-Year
Infr
ingem
ents
per
Month
Speeding Warning Letters Speeding Infringements
Moderate InjuriesModerate InjuriesModerate InjuriesModerate Injuries 10 7 ↑ 2%
Minor / Other InjuriesMinor / Other InjuriesMinor / Other InjuriesMinor / Other Injuries 9 11 ↑ 78%
¹ Ending 91 days before the start of the warning letter period, 25 April 2014² Ending 31 December 2017³ The percentage change is based on annualised crash data to allow for a direct comparison between the pre and post installation time periods. Red values indicate an increase.
5 years before
installation¹
Total Casualties:Total Casualties:Total Casualties:Total Casualties: 23 ↑ 39%24
Percentage
change³
Fatal and Serious CrashesFatal and Serious CrashesFatal and Serious CrashesFatal and Serious Crashes 4 5 ↑ 82%
• The camera at the intersection of Rookwood Road and Brunker Road commenced issuing warning letters in July 2014.
Annual NSW Speed Camera Performance Review 2018 - Appendix B: Red-light speed cameras B177

• There is one camera at this intersection. This was previously a wet-film red-light camera location.
Casualties and FSI Crashes
0
5
10
15
20
-5Y -4Y -3Y -2Y -1Y 2011 2012 2013 2014 2015 2016 2017Number of years before and year after camera installation
Casualti
es / C
rashes
Uncategorised M inor/Other M oderate Injury
Serious Injury Killed FSI Crash
7106 Zetland - Bourke Street at Botany Road
• The infringement graphs show the number of warning letters and infringements issued at this intersection as well as the trend in infringements since the camera began operation. Roadworks and camera maintenance may influence the number of infringements issued.
Status: Retain.
Casualties and casualty crashes at enforced intersection Infringements at enforced intersection
Red-Light Infringements
0
20
40
60
80
100
120
140
160
Jun-10
Dec-10
Jun-11
Dec-11
Jun-12
Dec-12
Jun-13
Dec-13
Jun-14
Dec-14
Jun-15
Dec-15
Jun-16
Dec-16
Jun-17
Dec-17
Month-Year
Infr
ingem
ents
per
Month
Red-light Warning Letters Red-light Infringements5 year
after period²
Casualty CrashesCasualty CrashesCasualty CrashesCasualty Crashes 38 11 ↓ 71%
Serious InjuriesSerious InjuriesSerious InjuriesSerious Injuries
FatalitiesFatalitiesFatalitiesFatalities
5 2 ↓ 60%
0 0 -
Pedestrian Casualties
Right Through Casualty Crashes
Adjacent Casualty Crashes
Rear End Casualty Crashes
3
10
6
7
0
6
0
2
↓ 100%
↓ 40%
↓ 100%
↓ 71%
Speeding Infringements
0
5
10
15
20
25
30
35
40
45
50
Jun-10
Dec-10
Jun-11
Dec-11
Jun-12
Dec-12
Jun-13
Dec-13
Jun-14
Dec-14
Jun-15
Dec-15
Jun-16
Dec-16
Jun-17
Dec-17
Month-Year
Infr
ingem
ents
per
Month
Speeding Warning Letters Speeding Infringements
Moderate InjuriesModerate InjuriesModerate InjuriesModerate Injuries 22 5 ↓ 77%
Minor / Other InjuriesMinor / Other InjuriesMinor / Other InjuriesMinor / Other Injuries 26 7 ↓ 73%
¹ Ending 91 days before the start of the warning letter period, 31 March 2010² Ending 31 December 2017
5 years before
installation¹
Total Casualties:Total Casualties:Total Casualties:Total Casualties: 14 ↓ 74%53
Percentage
change
Fatal and Serious CrashesFatal and Serious CrashesFatal and Serious CrashesFatal and Serious Crashes 5 2 ↓ 60%
• The camera at the intersection of Bourke Street and Botany Road commenced issuing warning letters in June 2010.
Annual NSW Speed Camera Performance Review 2018 - Appendix B: Red-light speed cameras B178

NSW Speed Camera Programs Annual Review 2018 – Appendix B: Red-light speed cameras B179
B. NSW red-light speed cameras
B.3 Red-light speed camera locations with the most infringements
In 2013, NRMA Motoring & Services called for an assessment of all high infringing speed camera locations across the state to determine whether the cameras were appropriately placed and clearly signposted.
The 10 red-light speed camera locations with the highest number of infringements for the 2017 calendar year are detailed in the table overleaf, and discussed below.
B.3.1 Total infringements
All of the 10 red-light speed camera locations with the most infringements are on roads with significant traffic volumes.
5 years of ‘after’ data is available for only three of the ten locations.
8. Darlinghurst - Craigend Street at McLachlan Avenue (commenced Aug 2010)
9. Granville – Woodville Road at M4 Westbound on-ramp (commenced Sept 2010)
10. Pennant Hills – Pennant Hills Road at Beecroft Road (commenced Sept 2010)
All three cameras will be retained based on the analysis included at pages B53, B72 and B126. The majority of infringements are issued for speeding offences at each of these locations.
B.3.2 Composition of speed and red-light infringements
Across the red-light speed camera program:
Approximately 59 per cent of infringements at red-light speed camera locations are attributed to running a red light, and
Approximately 41 per cent of infringements at red-light speed camera locations are attributed to speeding.
For the 10 highest infringing camera locations, the division between the two types of infringements is site-dependent, with six of the locations having a higher proportion of speed infringements and four having a higher proportion of red-light infringements.
B.3.3 Compliance rate
The compliance rate shown in the table overleaf compares the number of vehicles that pass a camera with the number of infringements issued by the camera.
All camera locations had high compliance rates with more than 99 per cent of drivers passing the cameras without being infringed for red-light running and/or speeding. This demonstrates that most drivers stop on a red signal and do not exceed the speed limit, with less than one per cent of drivers penalised. It is this high level of compliance that provides road safety benefits.

NSW Speed Camera Programs Annual Review 2018 – Appendix B: Red-light speed cameras B180
Red-light speed camera locations with the most infringements
Location (commencement date) Number of cameras
Infringements (Total: 2016)
Infringements (Total: 2017)
% of red light and speed infringements (2017)
Compliance rate (2017)
1 Sydney - Elizabeth Street at Park Street (September 2014) 1 11,427 14,290
72.86% speed 27.14% red-light
99.80%
2 Haymarket - George Street at Pitt Street / Quay Street (June 2013) 2 6,664 11,598
22.36% speed 77.64% red-light
99.64%
3 Darlinghurst - Oxford Street at Crown Street (September 2014) 2 12,400 8,887
70.29% speed 29.71% red-light
99.87%
4 North Ryde - Cox's Road at Lane Cove Road (school zone) (April 2013) 3 7,168 7,676
73.88% speed 26.12% red-light
99.90%
5 Bankstown - Stacey Street at Hume Highway (April 2013) 1 5,165 7,633
3.03% speed 96.97% red-light
99.91%
6 Darlinghurst - William Street at Crown Street (October 2014) 1 7,112 5,400
85.11% speed 14.89% red-light
99.92%
7 Neutral Bay - Falcon Street at Merlin Street (July 2014) 1 6,874 5,234
15.28% speed 84.72% red-light
99.96%
8 Darlinghurst - Craigend Street at McLachlan Avenue (August 2010) 1 6,022 5,222
69.13% speed 30.87% red-light
99.96%
9 Granville - Woodville Road at M4 Westbound on-ramp (September 2010) 1 4,981 4,954
7.23% speed 92.77% red-light
99.91%
10 Pennant Hills - Pennant Hills Road at Beecroft Road (school zone) (September 2010)
1 4,878 4,881 95.02% speed 4.98% red-light
99.96%

NSW Speed Camera Programs Annual Review 2018 – Appendix C: Mobile Speed Camera Program C1
C. NSW mobile speed cameras
C.1 The NSW Mobile Speed Camera Program
Mobile speed cameras work like fixed speed cameras, but are moved in vehicles from location to location. 7,000 hours of mobile speed enforcement are delivered per month, at 1,024 locations across NSW.
Mobile speed cameras are effective because they are unpredictable. Their operation creates a general deterrence against speeding and crash reduction across the whole network – not just at camera locations.
The NSW Mobile speed camera program has operated as follows since 2010:
NSW Mobile Speed Camera Program
Year Number of vehicles
Number of locations
Number of hours/month
Policy
2010-11 6 142 930 Bi-directional enforcement
2012-16 45 640
(by mid 2012)7,000
(by mid-2014)Enhanced visibility (vehicles & signage), single direction enforced
2017 45 1,024 7,000
C.2 Initial impact of the reintroduction of the program
The reintroduction of the mobile speed camera program resulted in an immediate reduction in the NSW road toll. In August 2011, the review of the NSW mobile speed camera program1 found that in the first year of operation there was a 19 per cent statistically significant reduction (p<0.001) in fatalities throughout NSW since the re-introduction of mobile speed cameras (chi-square test of independence at 0.05 probability level).
In the year before mobile speed cameras (19 July 2009 – 18 July 2010) there were 446 fatalities in NSW, whereas in the year after mobile speed cameras (19 July 2010 – 18 July 2011) there were 357 fatalities. This represents a saving of 89 lives and an estimated community saving of around $575 million (based on willingness-to-pay methodology 2011).
C.3 Impact on the NSW Road toll in recent years
The ongoing impact of the mobile speed camera program has also impacted the road toll in recent years.
C.3.1.1 NSW road fatalities
There were 389 fatlities on NSW roads in 2017. While this was an increase on the 2016 figure (380), it remains significantly below the 2009 figure of 453.
C.3.1.2 NSW fatality rate per 100,000 population
The NSW fatality rate per 100,000 population was 4.9 in 2017.
1 NSW Centre for Road Safety (2011). NSW Mobile Speed Camera Review. NSW Centre for Road Safety.

NSW Speed Camera Programs Annual Review 2018 – Appendix C: Mobile Speed Camera Program C2
This was the same as the 2016 rate, and remains significantly below the 2009 figure of 6.42.
C.3.1.3 Speed related fatalities and serious injuries
There were 167 fatalities from excessive speed in 2017. This represents a 19 per cent reduction on 2009 figures (before the mobile speed camera program was reintroduced in NSW).
There were 1,449 serious injuries from speed related crashes in 2017. This represents a 2 per cent decrease on 2009 figures:
Figure C1: Speed-related fatalities and injuries, 2009-2017
Speed related fatalities and serious injuries have also fallen more than all fatalities and serious injuries, across NSW, for the same period:
2009 2017 % Change NSW excessive speed fatalities 207 167 -19% NSW total fatalities 453 389 -14% NSW speed-related serious injuries 1,474 1449 -2% NSW total matched serious injuries 6,213 6,179 -1%
C.4 Annual speed survey
Data from the annual speed survey are presented overleaf, along with comparison data from 2009-2016.
0
50
100
150
200
250
0
500
1000
1500
2000
2500
2009 2010 2011 2012 2013 2014 2015 2016 2017
Fatalities
Injuries
Year
Seriously InjuredModerately InjuredMinor/Other InjuredKilled
Speed related fatalities and injuries

NSW Speed Camera Programs Annual Review 2018 – Appendix C: Mobile Speed Camera Program C3
Results are presented separately for light and heavy vehicles, and show:
mean speed;
85th percentile speed (i.e. speed that 85 per cent of vehicles are below and 15 per cent of vehicles are exceeding);
percentage exceeding the speed limit by up to 10km/h; and
percentage exceeding the speed limit by more than 10km/h.
Vehicle speeds are assessed state-wide through annual speed surveys undertaken by the Centre for Road Safety at the same locations every year. These speed surveys are conducted across NSW on a range of roads with a range of speed limits to gather current information about speeding behaviour of both light vehicles and heavy vehicles.
In 2017 annual speed surveys were conducted at 175 locations across NSW. They were not undertaken at specific speed camera enforcement locations. The annual speed surveys measure free travel speeds, with a headway of four seconds. That is, only the speeds of vehicles that are unimpeded by other traffic are measured. Therefore the survey provides a measure of the speed that drivers choose to travel rather than a measure of traffic congestion.

NSW Speed Camera Programs Annual Review 2018 – Appendix C: Mobile Speed Camera Program C4
Table C1: Mean speed and 85th percentile speed survey results, 2009-2017 Light vehicles:
Posted speed limitMean speeds (km/h) 85th percentile speeds (km/h)
2009 2010 2011 2012 2013 2014 2015 2016 2017 2009 2010 2011 2012 2013 2014 2015 2016 2017
40 km/h school zone 45.1 43.6 44.2 43.3 43.2 42.5 43.0 42.4 42.3 52.7 50.9 51.4 50.2 50.2 48.9 49.7 48.8 48.7
40 km/h 38.9 38.4 38.3 39.3 38.1 38.1 38.0 37.9 37.8 44.6 44.0 43.8 44.7 43.5 43.5 43.3 43.3 43.1
50 km/h 53.6 52.1 52.3 51.4 51.9 51.4 51.0 51.3 50.4 61.1 59.1 59.4 58.5 58.6 58.1 57.6 57.8 56.9
60km/h 58.7 57.7 57.4 58.1 57.1 56.5 55.9 55.9 55.5 65.6 64.2 64.3 65 63.8 63.1 62.6 62.6 62.1
70 km/h 69.6 67.9 67.8 67.6 67.9 67.8 67.6 67.9 66.6 77.8 75.8 75.6 75.3 75.6 75.2 75.1 75.5 74.2
80 km/h 77.8 76.1 76.4 77.2 75.4 74.3 74.0 74.2 73.8 85.9 84.5 86.4 85 83.3 82 81.6 81.9 81.3
90 km/h – small sample ^ 88.1 91.1 90.9 86.5 86.9 86.3 87.2 85.3 84.8 96.7 99.0 99.2 95.2 95 93.9 95 93.5 92.7
100 km/h 98.8 98.6 99.1 98.4 97.2 98.1 98.3 98.3 98.0 106.5 106.2 106.7 106 104.7 105.2 105.5 105.4 105.4
110 km/h 109.9 108.8 109.2 109.8 107.9 108.3 108.6 107.8 107.7 118.0 116.6 116.7 117.2 115.6 115.3 115.8 115 114.7
Heavy vehicles:
Posted speed limitMean speeds (km/h) 85th percentile speeds (km/h)
2009 2010 2011 2012 2013 2014 2015 2016 2017 2009 2010 2011 2012 2013 2014 2015 2016 2017
40 km/h school zone 41.9 41.2 42.4 40.8 41.0 40.6 41.2 40.8 40.6 48.3 47.1 49.2 46.4 46.5 45.8 46.8 46.1 45.4
40 km/h 38.6 37.7 37.3 39.1 37.3 37.5 37.4 37.4 37.3 44.2 42.7 42.4 44.9 42.5 42.1 42.7 42.5 42.4
50 km/h 53.2 51.8 51.2 50.3 50.2 50.5 50.2 50.7 50.2 60.3 58.6 58.1 57.2 56.5 56.8 56.2 57.6 56.6
60km/h 56.4 56.2 55.8 57.2 55.3 54.9 54.4 54.0 53.8 63.6 63.2 63.0 65.0 62.6 62.0 61.5 61.4 61.0
70 km/h 66.1 65.4 64.9 64.2 65.0 64.9 63.8 65.0 63.2 75.5 74.4 73.4 72.9 73.6 73.8 72.8 73.0 72.1
80 km/h 76.3 72 72.9 75.5 71.9 74.4 70.8 71.8 70.8 89.6 81.6 81.9 83.9 80.8 84.4 79.6 80.7 79.8
90 km/h – small sample ^ 85.0 91.1 90.0 85.6 86.6 84.7 87.3 84.3 83.7 94.5 99.4 98.9 95.5 95.0 93.1 95.8 92.8 92.0
100 km/h 97.4 98.0 98.0 97.6 95.9 97.4 97.2 97.4 97.1 103.5 104.4 104.4 104.0 102.1 102.9 103.2 103.5 102.8
110 km/h 100.7 101.8 100.6 101.8 99.0 101.9 99.7 100.0 99.8 106.4 109.0 106.8 107.4 105.1 108.9 106.2 105.4 105.7
^ Small samples may result in greater fluctuations year to year.

NSW Speed Camera Programs Annual Review 2018 – Appendix C: Mobile Speed Camera Program C5
Table C2: Percentage of vehicles exceeding the speed limit speed survey results, 2009-2017
Light vehicles: Posted speed limit
Exceeding the speed limit by up to 10 km/h (%) Exceeding the speed limit by 10 km/h or more (%)
2009 2010 2011 2012 2013 2014 2015 2016 2017 2009 2010 2011 2012 2013 2014 2015 2016 2017
40 km/h school zone
46.4% 44.0% 45.1% 44.0% 43.4% 45.0% 45.8% 44.3% 43.5% 23.0% 17.5% 19.7% 16.4% 17.0% 12.3% 13.6% 12.3% 12.0%
40 km/h 30.2% 27.8% 27.2% 32.6% 26.6% 26.8% 25.7% 25.5% 24.9% 4.5% 3.4% 3.7% 5.4% 3.4% 3.0% 3.0% 2.7% 2.4%
50 km/h 48.8% 46.4% 46.6% 44.9% 43.3% 45.3% 41.7% 41.0% 39.7% 16.8% 12.6% 13.2% 11.8% 14.1% 9.7% 9.8% 12.4% 8.5%
60km/h 32.3% 28.8% 28.2% 30.9% 25.9% 24.9% 22.9% 22.6% 21.1% 7.3% 5.4% 5.8% 6.7% 6.3% 3.9% 3.9% 3.7% 3.5%
70 km/h 35.9% 31.3% 30.2% 29.3% 29.5% 29.9% 28.6% 29.2% 25.4% 10.4% 6.6% 6.3% 6.2% 8.2% 6.4% 6.1% 7.3% 5.8%
80 km/h 29.8% 26.3% 26.1% 26.0% 21.1% 18.6% 18.0% 18.6% 17.5% 8.8% 6.3% 6.6% 5.9% 6.2% 4.9% 3.8% 4.1% 4.0%
90 km/h – small sample ^
29.6% 38.0% 38.5% 26.4% 24.8% 24.5% 25.8% 21.9% 21.3% 9.0% 11.8% 13.4% 8.7% 10.1% 6.7% 8.8% 5.9% 6.8%
100 km/h 34.5% 32.2% 34.4% 32.6% 27.6% 31.1% 32.3% 32.3% 30.5% 8.2% 9.0% 8.9% 7.8% 7.9% 6.7% 7.6% 6.9% 8.1%
110 km/h* 40.8% 37.5% 38.9% 42.5% 33.9% 34.1% 36.1% 31.8% 32.2% 9.3% 6.4% 7.0% 10.1% 6.0% 5.4% 5.9% 5.0% 5.3%
Heavy vehicles:
Posted speed limit
Exceeding the speed limit by up to 10 km/h (%) Exceeding the speed limit by 10 km/h or more (%)
2009 2010 2011 2012 2013 2014 2015 2016 2017 2009 2010 2011 2012 2013 2014 2015 2016 2017
40 km/h school zone 42.2% 36.2% 43.3% 40.3% 39.7% 39.9% 44.0% 40.7% 39.8% 10.1% 10.2% 12.6% 7.3% 2.6% 3.9% 6.8% 6.4% 5.8%
40 km/h 26.6% 22.8% 21.0% 30.9% 21.0% 22.3% 21.5% 20.8% 20.6% 5.4% 3.6% 3.0% 5.2% 7.1% 2.8% 2.8% 3.0% 2.4%
50 km/h 45.6% 44.7% 42.5% 42.9% 38.3% 41.8% 40.6% 38.0% 37.2% 16.7% 12.5% 10.7% 9.4% 7.8% 7.5% 6.9% 10.6% 8.4%
60km/h 26.7% 25.8% 25.4% 27.3% 22.7% 21.3% 19.9% 18.6% 17.8% 5.0% 3.9% 4.5% 7.4% 4.1% 3.2% 3.3% 2.8% 2.9%
70 km/h 28.6% 27.3% 23.7% 21.8% 24.1% 25.1% 21.0% 22.0% 19.1% 5.7% 4.2% 3.5% 3.2% 3.9% 4.2% 3.2% 4.6% 3.3%
80 km/h 23.6% 21.2% 23.2% 20.8% 18.2% 17.1% 15.7% 17.6% 15.6% 9.8% 5.1% 5.9% 4.8% 4.0% 13.1% 3.0% 3.8% 3.8%
90 km/h – small sample ^ 27.2% 41.3% 34.8% 30.7% 30.6% 23.5% 31.2% 24.1% 23.6% 6.3% 14.0% 13.6% 9.3% 8.5% 4.8% 9.3% 5.4% 5.1%
100 km/h 34.5% 34.1% 34.0% 34.3% 26.2% 32.1% 29.7% 29.6% 29.2% 3.2% 4.8% 4.8% 4.9% 2.2% 2.7% 3.2% 3.7% 3.8%
110 km/h* 48.1% 39.8% 44.9% 46.4% 44.0% 40.0% 36.5% 31.9% 31.8% 8.1% 12.9% 8.8% 10.3% 6.7% 11.7% 8.7% 7.6% 8.5%
^ Small samples may result in greater fluctuations year to year. * Note HV Speed Limit is 100 km/h and results presented indicate the percentage of HVs exceeding 100km/h in this section.

NSW Speed Camera Programs Annual Review – Appendix C: Mobile Speed Camera Program C6
C.4.1.1 Results for default urban and rural speed zones
Light vehicles
In 2017, light vehicle speed survey results indicate:
50km/h speed zones
o 39.7 per cent of drivers were travelling up to 10km/h above the posted speed limit, and a further 8.5 per cent were exceeding the speed limit by 10km/h or more.
o The 85th percentile speed was 56.9 km/h, the mean speed was 50.4 km/h.
100km/h speed zones
o 30.5 per cent of drivers were travelling up to 10km/h above the posted speed limit, and a further 8.1 per cent were exceeding the speed limit by 10km/h or more.
o The 85th percentile speed was 105.4 km/h, the mean speed was 98.0 km/h.
Heavy vehicles
In 2017, heavy vehicle speed survey results indicate:
50km/h speed zones
o 37.2 per cent of drivers were travelling up to 10km/h above the posted speed limit, and a further 8.4 per cent were exceeding the speed limit by 10km/h or more.
o The 85th percentile speed was 56.6 km/h, the mean speed was 50.2 km/h.
100km/h speed zones
o 29.2 per cent of drivers were travelling up to 10km/h above the posted speed limit, and a further 3.8 per cent were exceeding the speed limit by 10km/h or more.
o The 85th percentile speed was 102.8 km/h, the mean speed was 97.1 km/h.
C.4.1.2 Trends in speed survey results
Light vehicles
Over the last nine years the general trend has been an increase in the proportion of light vehicles complying with the speed limit across all speed zones. This can be seen in Figure A2 (presented overleaf), along with:
A significant increase in compliance in 2010, coinciding with the introduction of mobile speed cameras,
80km/h zones have had the highest rate of compliance since 2012, with almost 80 per cent of drivers driving within the speed limit.
40km/h school zones continue to have the lowest rate of compliance, with only approximately 40 per cent of drivers driving within the speed limit.

NSW Speed Camera Programs Annual Review – Appendix C: Mobile Speed Camera Program C7
Figure C2: Annual speed survey results, light vehicle compliance rate (percentage of vehicles travelling within the speed limit) by speed zone
The speed survey results show that there has been a decrease in the proportion of light vehicles exceeding the speed limit over the last nine years, for most speed zones. When comparing the 2017 results against the 2016 results there has been a decrease in the percentage of light vehicles exceeding the speed limit by up to 10km/h in all speed zones except for in the 110km/h zone. The percentage of vehicles exceeding the speed limit by 10km/h or more has decreased in all speed zones except in the 90km/h, 100km/h and 110km/h.
Heavy Vehicles
The speed survey results also indicate that there is a reduced proportion of heavy vehicles exceeding the speed limit over the last nine years; but while this is true for most speed zones, it is not the case for exceeding the speed limit by 10km/h or more in 100km/h and 110km/h zones.
Comparing the 2017 results against the 2016 results, there is an increased proportion of heavy vehicles exceeding the speed limit (up to 10km/h, and 10km/h or more), for approximately 15 per cent of the speed zones measured.
C.5 Mobile speed camera infringements
In 2017 there were a total of 21,347 infringements issued from mobile speed camera enforcement resulting in $4.6 million of fines. The cost of conducting the mobile speed camera program for the 2017 financial year was $22.8 million.
The total number of mobile speed camera infringements issued in 2017 decreased by 27 per cent compared to 2016.
The below graph shows the mobile speed camera program infringement data and the number of enforcement hours per month. The graph shows that there was a marked decrease in the number of infringements issued from the end of June 2014 onwards. At that time, the number of enforcement hours reached 7,000 per month, and have
0.00%
10.00%
20.00%
30.00%
40.00%
50.00%
60.00%
70.00%
80.00%
90.00%
2009 2010 2011 2012 2013 2014 2015 2016 2017
Compliance
Year
Light Vehicle Compliancewith NSW Speed Limits
40 km/h schoolzone
40 km/h
50 km/h
60km/h
70 km/h
80 km/h
90 km/h
100 km/h
110 km/h

NSW Speed Camera Programs Annual Review – Appendix C: Mobile Speed Camera Program C8
not increased over and above that point. It can be seen that the number of monthly infringements has decreased since that time, as motorists have changed their behaviour at the locations where mobile speed cameras enforce.
Figure C3: Speeding infringements issued and number of enforcement hours conducted by mobile speed cameras by month
The above graph depicts some peaks in infringement numbers when new sites are in use more frequently. In the months following the use of new sites, the number of infringements decreased or stabilised. This trend is to be anticipated; for example fixed speed enforcement follows the same type of pattern, with the difference being that fixed speed cameras remain in the same place and continually enforce meaning that reductions in infringements are more consistent.
The reduction in infringements from the start of 2012 can be attributed to the enhanced visibility of mobile speed camera vehicles as well as additional signage being placed before a mobile speed camera to ensure drivers see and recognised the enforcement activity. At the same time, mobile speed cameras also switched from enforcing in both directions to single direction enforcement, further contributing to the lower volume of infringements.
C.6 Compliance at all mobile speed camera locations
Figure C4 below shows the compliance rate of vehicles at mobile speed camera locations. Compliance data compares the number of vehicles that pass a camera with the number of fines detected by the camera. As can be seen below, over 99 per cent
0
1,000
2,000
3,000
4,000
5,000
6,000
7,000
8,000
9,000
Mobile Speed Camera Enforcement Hours and Infringements
Total MSC Enforcement Hours Total MSC Infringements

NSW Speed Camera Programs Annual Review – Appendix C: Mobile Speed Camera Program C9
of vehicles passing mobile cameras are not infringed for speeding. In 2017 the compliance rate was 99.9%. This high rate of compliance has remained consistent since 2010 when the program was reintroduced.
Figure C4: Compliance rate of vehicles at mobile speed camera locations
C.7 Supporting initiatives
CRS has developed and implemented a speed camera public education campaign that has supported the rollout of the mobile speed camera program.
Evidence shows that enforcement and strong public education campaigns change driver behaviour and help prevent speed-related crashes and trauma through awareness of enforcement.
C.8 Summary
Overall, the trend in road fatalities, infringements and annual speed survey data demonstrates that the mobile speed camera program has delivered road safety benefits over the years since the program was re-introduced in 2010.
99.85%
99.72%
99.74%
99.81%
99.85%
99.89%
99.88%
99.89%
99.72%
99.82%
99.81%
99.76%
99.75%
99.69%
99.31% 99.52%
99.45%
99.58%
99.62%
99.71%
99.63%
99.68%
99.74%
99.69%
99.67%
99.60%
99.69%
99.77%
99.71%
99.48%
99.53%
99.70%
99.65%
99.67%
99.59%
99.56%
99.66%
99.66%
99.57%
99.66%
99.75%
99.73%
99.66%
99.68%
99.73%
99.76%
99.75%
99.77%
99.89%
99.79%
99.79%
99.82%
99.84%
99.84%
99.83%
99.86%
99.84%
99.86%
99.85%
99.85%
99.84%
99.85%
99.84%
99.84%
99.87%
99.88%
99.89%
99.91%
99.90%
99.91%
99.89%
99.87%
99.88%
99.90%
99.89%
99.92%
95.00%
95.50%
96.00%
96.50%
97.00%
97.50%
98.00%
98.50%
99.00%
99.50%
100.00%
Percentage of vehicles assessed by NSW mobile speed cameraswithout being infringed

NSW Speed Camera Programs Annual Review 2018 – Appendix D: Heavy vehicle average speed cameras D1
D. NSW heavy vehicle average speed cameras
D.1 The NSW heavy vehicle average speed camera program
As at 31 December 2017, there were 25 average speed average speed enforcement lengths across NSW. The median commencement date for NSW average speed enforcement lengths was 16 December 2011.
The program addresses heavy vehicle speeding along travel routes with a demonstrated history of heavy vehicle crashes and/or speeding. The program targets heavy vehicles because they are over-represented in crashes on known heavy vehicle routes and when they are involved in accidents they tend to be more serious due to their size and weight.
Average speed camera enforcement works by measuring the amount of time it takes a heavy vehicle to travel between two points and then calculating the speed of the vehicle. If the vehicle’s average speed is faster than the speed limit for the length of road, the driver will be infringed for speeding.
D.2 NSW heavy vehicle average speed enforcement lengths
Road Section
Approximate Length (km)
1 Pacific Highway Between Harwood and New Italy 35 2 Great Western Highway Between Meadow Flat and Raglan 26 3 Federal Highway Between Goulburn and Collector 20 4 Pacific Highway Between Woodburn and Wardell 18 5 Pacific Highway Between Nabiac and Taree 17 6 Mitchell Highway Between Molong and Cundumbul 28 7 Hume Highway Between Coolac and Yass 72 8 Hume Highway Between Gundagai and Coolac 16 9 Monaro Highway Between Bredbo and Cooma 28 10 Gwydir Highway Between Glen Innes and Inverell 57 11 Pacific Highway Between Port Macquarie and Kempsey 36 12 Oxley Highway Between Gunedah and Tamworth 60 13 New England Highway Between Muswellbrook and Aberdeen 7 14 Newell Highway Between Peak Hill and Tomingley 10 15 Newell Highway Between Eumungerie and Gilgandra 30 16 New England Highway Between Muswellbrook and Singleton 36 17 Pacific Highway Between Kew and Port Macquarie 15 18 Pacific Highway Between Urunga and Valla 13 19 Picton Road Between Wilton and Cataract 17 20 Golden Highway Between Sandy Hollow to Merriwa 28 21 Newell Highway Between Forbes and West Wyalong 94 22 Pacific Highway Between Ballina and Wardell 16 23 Pacific Highway Between Tyndale and Harwood 21 24 Mount Ousley Road Between Bulli and Gwynneville 15 25 Great Western Highway Between Mount Victoria and Lithgow 15

NSW Speed Camera Programs Annual Review 2018 – Appendix D: Heavy vehicle average speed cameras D2
D.3 Enforcement periods
These lengths were installed as follows:
Year Lengths installed
2010 2 (5 years of crash data
is available for these lengths) 2011 14
2012 4
2013 1
(Less than 5 years of crash data is available for the lengths)
2014 3
2015 1
2016 0
2017 0
Total: 25
Crash and infringement data for the average speed camera program are presented in Table D1 overleaf.
D.4 Crash Data
Overall, there has been a reduction in fatal crashes and casualty crashes involving a heavy vehicle on NSW average speed enforcement lengths since those lengths were installed, compared with the five year period prior to installation.
Across heavy vehicle average speed camera lengths, there has been a:
22 per cent reduction in casualty crashes involving a heavy vehicle
44 per cent reduction in fatalities from crashes involving heavy vehicles
4 per cent reduction in serious injuries from crashes involving heavy vehicles.
The reduction in fatalitites and serious injuries represents a saving of $138 million to the community.
The trauma reductions at camera locations compare to the following rates of change observed across NSW over the same period for crashes involving heavy vehicles:
10 per cent reduction in casualty crashes involving a heavy vehicle
19 per cent reduction in fatalities from crashes involving heavy vehicles
10 per cent increase in serious injuries from crashes involving heavy vehicles.
It should also be noted, alongside the crash data discussed above, that there has been a notable increase in heavy vehicle traffic volumes. Over the periods that average speed enforcement lengths have been reviewed within this report, there has been a 11 per cent increase in heavy vehicle volume across NSW.1
1 Estimates for Vehicle Kilometres Travelled (VKT) estimated in Yearbook 2018: Australian Infrastructure Statistics, Statistical Report, BITRE

NSW Speed Camera Programs Annual Review 2018 – Appendix D: Heavy vehicle average speed cameras D3
Table D1: Crashes and infringements at heavy vehicle average speed enforcement locations
Fat
alit
ies
fro
m c
rash
es
invo
lvin
g h
eavy
veh
icle
s
Ser
iou
s in
juri
es f
rom
cra
shes
in
volv
ing
hea
vy v
ehic
les
Cas
ual
ty c
rash
es i
nvo
lvin
g
hea
vy v
ehic
les
Fat
alit
ies
fro
m c
rash
es
invo
lvin
g h
eavy
veh
icle
s
Ser
iou
s in
juri
es f
rom
cra
shes
in
volv
ing
hea
vy v
ehic
les
Cas
ual
ty c
rash
es i
nvo
lvin
g
hea
vy v
ehic
les
20
12
20
13
20
14
20
15
20
16
20
17
Pacific Highway 01. Between Harwood and New Italy(Commencement date: 31 Mar 2010)(Approximate length: 35 km)
4 9 18 1 8 10 11 136 1 9 13 14
Great Western Highway
02. Between Meadow Flat and Raglan(Commencement date: 31 May 2010)(Approximate length: 26 km)
2 2 11 0 3 4 12 3 0 0 1 6
Federal Highway 03. Between Goulburn and Collector(Commencement date: 30 May 2011)(Approximate length: 20 km)
0 1 2 0 0 3 120 121 114 99 98 174
Pacific Highway 04. Between Woodburn and Wardell(Commencement date: 28 Jun 2011)(Approximate length: 18 km)
4 9 17 3 8 11 49 62 38 11 14 49
Pacific Highway 05. Between Nabiac and Taree(Commencement date: 5 Aug 2011)(Approximate length: 17 km)
1 4 8 0 3 9 45 169 148 99 104 124
Mitchell Highway 06. Between Molong and Cundumbul(Commencement date: 5 Aug 2011)(Approximate length: 28 km)
0 4 3 0 3 4 0 3 20 10 5 7
Hume Highway 07. Between Coolac and Yass(Commencement date: 26 Aug 2011)(Approximate length: 72 km)
2 3 17 2 11 19 255 130 122 96 104 139
Hume Highway 08. Between Gundagai and Coolac(Commencement date: 26 Aug 2011)(Approximate length: 16 km)
1 6 7 1 1 4 264 214 134 57 123 114
Monaro Highway 09. Between Bredbo and Cooma(Commencement date: 17 Sep 2011)(Approximate length: 28 km)
1 0 1 0 0 2 5 9 3 4 1 2
Gwydir Highway 10. Between Glen Innes and Inverell(Commencement date: 25 Oct 2011)(Approximate length: 57 km)
0 0 2 0 0 0 4 1 2 1 2 0
Pacific Highway 11. Between Port Macquarie and Kempsey(Commencement date: 14 Dec 2011)(Approximate length: 36 km)
0 7 12 4 24 26 1 0 0 249 257 0
Oxley Highway 12. Between Gunedah and Tamworth(Commencement date: 30 Nov 2011)(Approximate length: 60 km)
1 0 4 0 1 2 4 8 9 11 11 3
New England Highway
13. Between Muswellbrook and Aberdeen(Commencement date: 16 Dec 2011)(Approximate length: 7 km)
0 3 4 0 3 3 1 2 2 4 0 1
Newell Highway 14. Between Peak Hill and Tomingley(Commencement date: 22 Dec 2011)(Approximate length: 10 km)
2 2 2 0 0 0 21 28 22 27 87 25
Newell Highway 15. Between Eumungerie and Gilgandra(Commencement date: 22 Dec 2011)(Approximate length: 30 km)
2 2 6 0 0 0 72 28 22 80 78 54
New England Highway
16. Between Muswellbrook and Singleton(Commencement date: 20 Dec 2011)(Approximate length: 36 km)
2 2 9 1 4 6 3 3 2 1 3 2
Pacific Highway 17. Between Kew and Port Macquarie(Commencement date: 17 Aug 2012)(Approximate length: 15 km)
1 9 14 3 3 8 0 199 402 527 366 245
Pacific Highway 18. Between Urunga and Valla(Commencement date: 29 Sep 2012)(Approximate length: 13 km)
4 7 10 1 0 4 0 79 73 30 72 0
Picton Road 19. Between Wilton and Cataract(Commencement date: 17 Oct 2012)(Approximate length: 17 km)
8 3 7 0 1 3 0 5 1 5 1 2
Golden Highway 20. Between Sandy Hollow to Merriwa(Commencement date: 1 Mar 2012)(Approximate length: 28 km)
0 2 3 1 0 1 7 10 2 9 1 4
Newell Highway 21. Between Forbes and West Wyalong(Commencement date: 22 Mar 2013)(Approximate length: 94 km)
0 6 10 1 5 9 0 21 18 29 6 34
Pacific Highway 22. Between Ballina and Wardell(Commencement date: 5 Feb 2014)(Approximate length: 16 km)
0 4 7 0 0 1 0 0 8 2 106 32
Pacific Highway 23. Between Tyndale and Harwood(Commencement date: 5 Feb 2014)(Approximate length: 21 km)
0 4 7 3 4 7 0 0 3 7 76 6
Mount Ousley Road
24. Between Bulli and Gwynneville(Commencement date: 28 Jan 2014)(Approximate length: 15 km)
0 12 24 0 14 24 0 0 401 654 464 488
Great Western Highway
25. Between Mount Victoria and Lithgow(Commencement date: 19 Jan 2015)(Approximate length: 15 km)
4 9 19 0 2 2 0 0 0 781 824 501
874 1,231 1,547 2,802 2,817 2,026
[x]
*
Road
Totals:
This shading indicates that the relevant length was not yet operational
(for the whole of that year).
Crash data Pre installation(5 years data)
Crash dataAfter installation
(5 years /up to 31 Dec 2017)
Notes:There have been notable increases in heavy vehicle traffic alongaverage speed enforcement routes.
Average Speed Enforcement Length
Heavy Vehicle Infringements(annual totals)
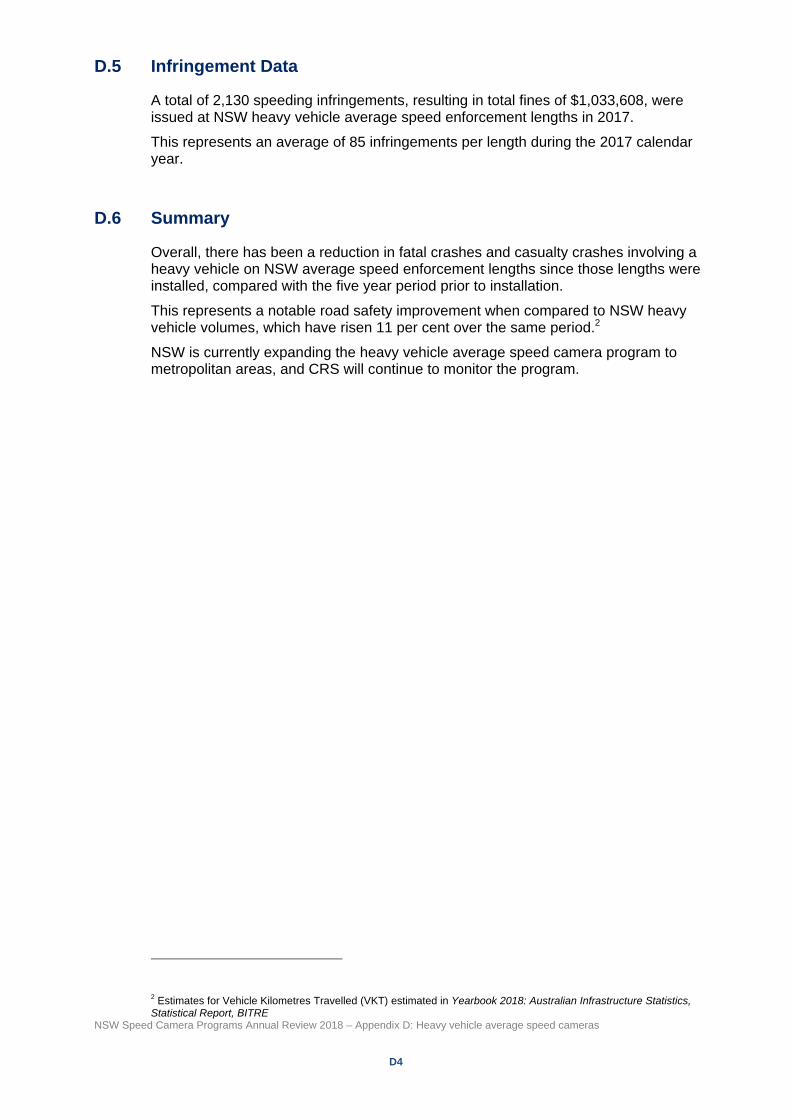
NSW Speed Camera Programs Annual Review 2018 – Appendix D: Heavy vehicle average speed cameras D4
D.5 Infringement Data
A total of 2,130 speeding infringements, resulting in total fines of $1,033,608, were issued at NSW heavy vehicle average speed enforcement lengths in 2017.
This represents an average of 85 infringements per length during the 2017 calendar year.
D.6 Summary
Overall, there has been a reduction in fatal crashes and casualty crashes involving a heavy vehicle on NSW average speed enforcement lengths since those lengths were installed, compared with the five year period prior to installation.
This represents a notable road safety improvement when compared to NSW heavy vehicle volumes, which have risen 11 per cent over the same period.2
NSW is currently expanding the heavy vehicle average speed camera program to metropolitan areas, and CRS will continue to monitor the program.
2 Estimates for Vehicle Kilometres Travelled (VKT) estimated in Yearbook 2018: Australian Infrastructure Statistics, Statistical Report, BITRE