speed of sound in water by a direct method - nist...
TRANSCRIPT

Journal of Rese arch of the National Bureau of Standards Vol. 59, No.4, October 1957 Research Paper 2795
Speed of Sound in Water by a Direct Method 1
Martin Greenspan and Carroll E. Tschiegg
The speed of sound in distilled water wa,s m eas ured over the temperature ra nge 0° to 100° C with an acc uracy of 1 part in 30,000. The results are given as a fifth-d egree polynomial and in tables . The water was contained in a cylindrical tank of fixed lengt h, terminated at each end by a plane transducer, and the end-to-end time of flight of a pulse of sound was determined from a measurement of t he pulse-repetition frequency required to set the success ive echoes into t im e coincidence.
1. Introduction
The speed of sound in water, c, is a physical property of fundamental interest; it, together with the density, determines the adiabatie compressibility, and eventually the ratio of specific heats. The variation with temperature is anomalous; water is the o nly pure liquid for which it is known that the speed of sound does not decrcase monotonically with temperature.
There is also a practical interest in c in that water is used as a standard liquid for the calibration of instruments that measure the speed of sound in liquids automatically, both in the laboratory and in the field. In fact , it was in connection with the calibration of such "velocimeters" [1] 2 that our interest in this work was first aroused. In the first place, the available data scatter widely, as recent summaries [2 , 3] clearly show. In many cases, the discrepancies far exceed the claimed accuracy or at least the precision of the methods, even when the methods compared are the same. In the second place, there exists no se t of data that gives a smooth variation with temperat ure over any considerable range. In particular, the best of these data yield calibration curves for OUT velocimeters which are badly curved instead of straight (as they should be), and about which the data scatter irregularly, but reproducibly. The results here presented are free of these objections .
2 . Method
At the top of figure 1 is a schematic of the apparatus. The sample is confined in a tube of which the ends are plane, parallel, electroacoustic transducers, quartz crystals in this case. If the left-hand crystal, say, is excited by a short pulse from the blocking oscillator, the oscilloscope, which measures the voltage on tne right-hand crystal, will show a received pulse and a series of echoes, as indicated in idealized form on the line below (fig. 1). The pulse repetition frequency of the blocking oscillator is controlled by a sine-wave oscillator, and if this frequency were adjusted so that each blocking oscillator pulse coincided with the first received pulse of the next preceding cycle, then the oscillator period would equal the time of flight of the pulse. However,
I 1'bis work was supported in part by the Omce of Naval R esearch under contract NA-oTU"-7<J-4S.
, Figures in brackets indicate the literature referen ces at the end of this paper.
as the two pulses have different shapes, the accurac.,' with which the coincidence could be set would be very poor. Instead, the oscillator is run at about half this frequency and the coincidence to be set is that among the first received pulses corresponding to a particular electrical pulse, the first echo corresponding to the electrical pulse next preceding, and so on . Figure 1 illustrates the uccessive signals corresponding to three electrical input pul es. The input pulses fall halfway between the pulses for which the coincidence is se t , so that they do not tend to overload the amplifier or distort the oscilloscope traces. The period of the oscillator, when properly se t, multiplied by twice the length of Ul e tank, is the speed of sound in the sample.
The oscilloscope trace actually looks like that shown in the in se t (fig. 1). The firs t cycle corresponds to sound reHected from the inner faces only of the transducers, whereas the succeeding cycle correspond to sound reflected. one or more times from an outer face . Therefore, the coincidence is set by maximizing the peak on eitllcr the firs t or second balf-cycle; the same result is obtained in either case but the second half cycle is easier to use because it is bigger. What we are mea uring h ere is the speed corresponding to the fi1" t arrival of the signal ; in a nondispersive liquid this is the same as the phase velocity. It is true that the coincidence is made at a
n
n I
I~I n FIGURE 1. Schematic of method.
'fhe three lower lines show in idealized form the events correspond ing to three sneccssh'e electri cal pulses. The short , thick line represents Lhe input pulse .
249 '
Lime one-fourth or three-quarters of the transducer period later Lhan the til!le o~ first arrival, by. which time there is opportumty for sOlll;d travclmg .by paths other than the shortest to affect the 10e~ tJOn of the maximum. However, the results are llldependent of whether til e first or second half c'ycl~ is used · they are also not affected by substltutmg crystals of twice the thickness, or by changing the diameters of tlle tank, or of the hot electrodes. These results lead us to believe that the error introduced by this maximization technique is negligible.
The question has been examined also in another way. Suppose a coin cidence to have been mac~e at frequency j; others can then be ma.de at submultlJ?les of j. At the frequency / /2 for lI1 stan?e, the. first received pulse correspondmg to a partIcular mput pulse coincides with the second echo (not the first, as before) corresponding to the electrical pulse next preceding, and so on. Effectively, the sOllnd pul~e is timed over a path twice as long as before. It IS found that the measurements at j and ncar j /2 are substantially identical, so that the error in question is less than, or at most comparable to , the expenmental error of the time meaSllrement.
3 . Appar a tus
3 .1. The Delay Line
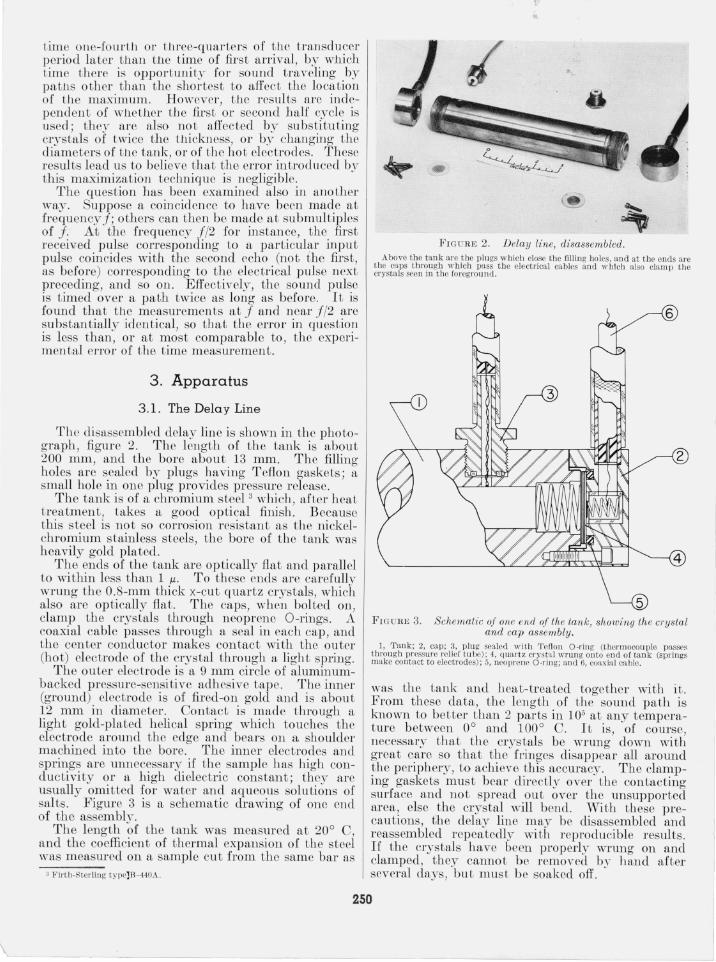
The disassembled delay line is shown in the photograph, figure 2. The length of the tank i s about 200 mm, and the bore about 13 mm. The filling holes are sealed by plugs having T eflon gaskets; a small hole in one plug provides pressure. release.
The tank is of a chromium steel 3 which, after heat treatmen t, takes a good optical fini sh. . Because this steel is not so corrosion r esistant as the nickelchromium stainless steels, the bore of the tank was heavily gold plated.
The ends of the tank are optically flat and parallel to within less than 1 f.1. To these ends are carefully wrung the 0.8-mm thick x-cut quartz crystals, which also are optically flat. The caps, when bolted on, clamp the crystals through neoprene O-rings. A coaxial cable passes through a seal in each cap , and the center conductor makes contact with the outer (hot) electrode of the crystal through a light spring.
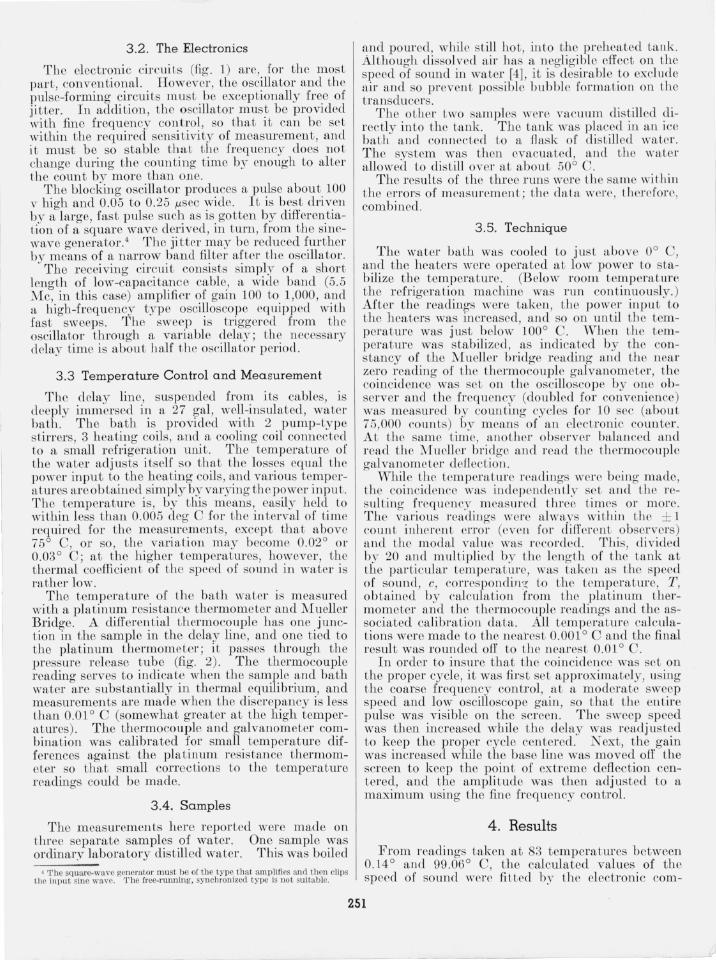
The outer electrode is a 9 mm circle of aluminumbacked pressure-sensitive adhesive tape. The inner (ground) electrode is of fired-on gold and is about 12 mm in diameter. Contact is made through a light gold-plated helical spring which touches the electrode around the edge and bears on a shoulder machined into the bore. The inner electrodes and springs are unnecessary if the sample has high conductivity or a high dielectric constant ; they are usually omitted for water and aqueous solutions of salts. Figure 3 is a schematic drawing of one end of the assembly.
The length of the tank was measured at 20° C, and the coefficient of thermal expansion of the steel was measured on a sample cu t from the same bar as
3 F irtb-Sterling typelB-440A.
FIGUR E 2. Delay line, disassembled. Abo ve tbe tank are tbe pl ugs whicb close the filling holes. and at the ends are
tbe caps tb rougb which pass the elect rical cables and wblcb a lso clam p t he crystals seen in the foreground .
FIGURE 3. Schematic oj one end of the tank, showing the crystal and cap assembly.
1. 'rank; 2. cap; 3. pl ug sealed wi th Teflon O-ring (thermocouple pasSf'S t hrough pressure relief t u be); 4. quartz crystal wrun g on to end of tank (springs make conta ct to electrodes) ; 5, neoprene O·ring; and 6, coaxial ca ble.
was th e tank and heat-treated together with it. From these data, the leng th of the sound path is known to better than 2 parts in 105 at any temperature between 0° and 100 0 C. It is, of course, necessary that t he crystals be wrung down with great care so that the fringes disappear all around the periphery, to achieve this accuracy. The clamping gaskets must bear direc tly over the contacting surface and not spread out over the unsupported area, else the crystal will benel. With these precautions, the delay line may be disassembled and reassembled repeatedly with reproducible results . If the crystals have been properly wTung on and clamped, they canno t be removed by hand after several days, but must b e soaked off.
250
'\- -- J
3 .2. The Electronics
Th e electronic eircuils (fLg. 1) are, for the most part, conventional. Howeve r, the oscillator and the pulse-forming circuits must be exceptionally free of jitter. In addition, the oscillatormus~ be provided with fine frequency control, so that it can be set within the r equired sensitivity of measurement, and it must be so s table that the frequency does not change during the counting time by enough to alter the count by more than one.
The blocking oscillator produces a pulse about 100 v high and 0.05 to 0.25 }.lsec wide. It is best driven by a large, fast pulse sucl~ as is. gotten by differen.tiation of a square wave derIved, m turn, from t he smewave generator.4 The jitter may be reduced further by means of a narrow band filter after the oscilla tor.
The receiving circuit consists simply of a short length of low-capacitance cable, a wide band (5.5 ).I[c, in this case) amplifier of gain 100 to 1,000, and a high-frequency type oscilloscope equipped with fast sweeps. The sweep is triggered from. the oscillator through a variable delay; t h e necessary delay time is abou t half the oscillator period.
3.3 Temperature Control and Measurement
Th e delay line, suspended from its cables, is deeply immersed in a 27 gal, well-insulated, water bath. The bath is provided wi th 2 pump-type stirrers, 3 heating coils, and a cooling coil connected Lo a small refrigeration unit. The temperature of t be water adjusts itself so that the losses equal the power input to the heating coils, and various temperatures arc 0 b tained simply by varying the power inpu t. The temperature is, by t hi s means, easily held to wi thin less than 0.005 deg C for the in terval of time required for the measurements , except that above 75° C, or so, t he variation may become 0.02° or 0.03 ° C; at the higher temperatures, however , tbe t hermal coeffi cient of tbe speed of sound in water is rather low.
The temperature of Lhe bath water is measured with a pla tinum resistance thermometer and Mueller Bridge. A differential th ermocouple has one junction in the sample in the delay line, and one tied to the platinum thermometer; i t passes through the pressure release tube (fig. 2). The thermocouple reading serves to indicate ,vhen the sample and bath water are substantially in thermal equilibrium, and measurements are mad e when the discrepancy is less than 0.01 ° C (somewhat greater at the high temperatures). The thermocouple and cralvanometer combination was calibrated for small temperature differences against the pla tinum resistance thermometer so t hat small correcLions to the temperature readings could be made.
3.4. Samples
The measurements here reported were made on three separate samples of water. One sample was ordinary laboratory distilled water. This was boiled
4 The squar~-wave generator must be of the type that amplifies and thon clips the input sine \\l'avc. 'I'l le free-running, synchronized type is not suitable.
and poured , while still hot, into th e preheated tank. Although dis sol ved air has a negligible effect on the speed of sound in water [4], i t is desirable to exclude air and so prevent possible bubble formation on the transducers.
The other two samples were vacuum distilled directly into the tank. The tank was placed in an icc bath and connected to a flask of di stilled water. The system was then evacua ted, and the water allowed to distill over at about 50° C.
The results of the three runs were the same wit,hin the errors of measurement; the data were, LhercJore, combi ned.
3.5. Technique
The water bath was cooled to just above 0° C, and the heaters were operated at low power to stabilize the temperature. (B elow room temperature the refrigeration machine was rLLn continuously. ) After the r eadings were taken, the power input to the heaters was increased, and so on until the temperature was just below 100° C . ,Vhen the temperature was stabilized, as indicated by the constancy of the Mueller bridge reading and the near zero reading of the thermocouple galvanomete r, the coincidence was set on the oscilloscope by one observer and the frequency (doubled for conven ience) was measured by cO LLnting cycles for 10 sec (about 75,000 co unts) by means of an electronic counter. At the same time, a nother observer balanced and read the Muell er bridge and read the thermoco uple galvanometer denection.
,Vhile the temperature readings were being made, the coincidence was independently set a nd the resulting frequenc.v measured t hree times or more. The various readings were always within the ± 1 countillherent error (e\Ten for different observers) and the modal valu e was reco rded. This, divided by 20 and multiplied by the length of the tank at the particular temperature, was taken as the speed of so und, c, correspondin'2; to the temperature, T, obtained by calculation from the platinum thermometer and the thermocouple readings and the associated calibration data. All temperature calculations were made to the nearest 0.001 ° C and the final result was rounded off to the nearest 0.01 ° C.
In order to insure that the coincidence was set on the proper cycle, it was first set approximately, using the coarse frequency control, at a moderate sweep speed and low oscilloscope gain, so tha t the entire pulse was visible on the screen . The sweep speed was then increased while the delay was readjusted to keep the proper cycle centered . N ext, the gain was increased while the base line was moved off the screen to keep the point of extrem e deflection centered, and the amplitude was then adjusted to a maximum using the fine frequ ency control.
4. Results
From readings taken at 83 temperatures between 0.14° and 99.06° C, the calculated values of the speed of sound wcrefit.ted by the electronic com-
251
.06
.04
I. _ •
'" . 0 2 -"-
. . .-~ ' . . vi 0 ...J . ' . . '
~ . 0
- /:)2 -Vi w -.0 4 Q:
-.06
0 10 20 30 40 50 60 70 eo 90 100
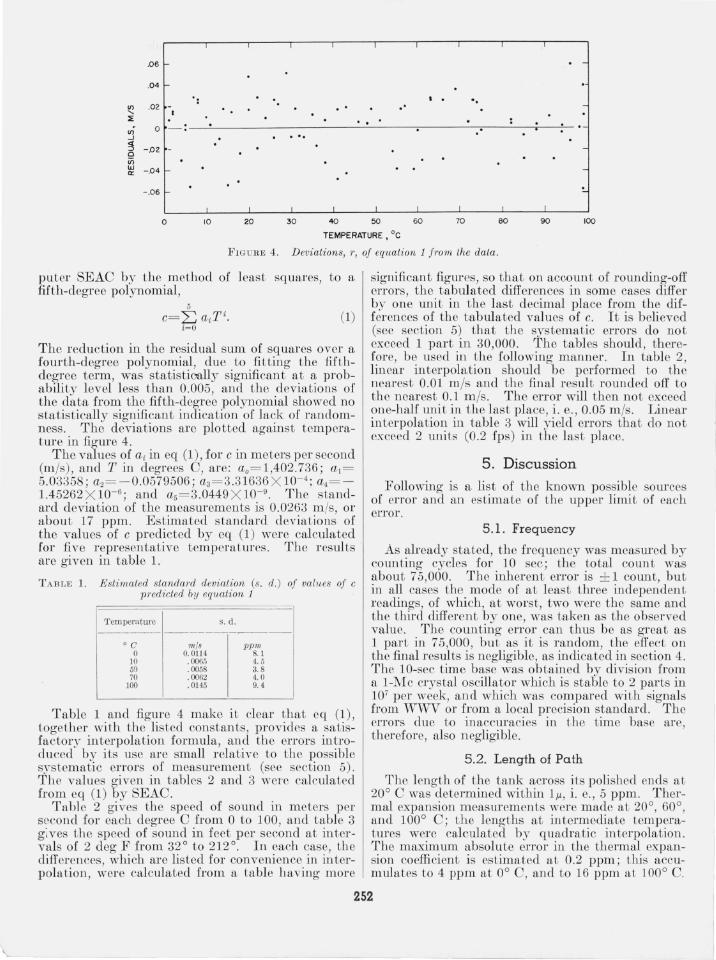
TEMPERATURE. °c FIGURE 4. Deviations, r, of eq1wtion 1 from the data.
putcr SEAC by the method of least squares, to a fifth-degree polynomial,
(1)
The reduction in the residual sum of squares over a fourth-degree polynomial, due to fitting the f-ifthdegree term, was statistioolly significant at a probability level less than 0.005, and the deviations of the data from the fifth-degree polynomial showed no statistically significant indication of lack of randomness. The deviations are plotted against temperature in figure 4.
The values of a, in eq (1), for c in meters per second (m/s), and T in degrees C, are: ao= 1,402.736; a[= 5.03358; a2= - 0.0579506; a3= 3.31636 X 10- 4 ; a4= -1.45262 X 10- 6 ; and a5=3.0449 X 10- 9 • The standard deviation of the measurements is 0.0263 m/s, or about 17 ppm. Estimated standard deviations of the values of c predicted by eq (1) were calculated for five representative temperatures. The results are given in table l.
TABLE l. E stimated standard deviation (s. d.) of values of c predicted by equation 1
Temperature
° C o
10 50 70
100
m/s 0. 0114 . 0065 . 0058 . 0062 .0145
s. d .
ppm 8.1 4.5 3.8 4.0 9.4
Table 1 and figure 4 make it clear that eq (1), together with the listed constants, provides a satisfactory interpolation formula, and the errors introduced by its usc are small relative to the possible systematic errors of measurement (sec section 5). The values given in tables 2 and 3 were calculated from eq (1) by SEAC.
Table 2 gives the speed of sound in meters per second for each degree C from 0 to 100, and table 3 gives the speed of sound in feet per second at intervals of 2 deg F from 32 ° to 212°. In each case, the differences, which are listed for convenience in interpolation, were calculated from a table hav ing more
significan t fig ures, so that on account of rounding-off errors, the tabulated differences in some cases differ by one unit in the last decimal place from the differ'ences of the tabulated values of c. It is believed (sec section 5) that the systematic errors do not exceed 1 part in 30,000 . The tables should, therefore , be used in the following manner. In table 2, linear interpolation should be performed to the nearest 0.01 m/s and the final resul t rounded off to the nearest 0.1 m/s. The error will then not exceed one-half unit ill the last place, i. e., 0.05 m/s. Linear interpolation in table 3 will yield errors that do not exceed 2 units (0.2 fps) in the last place.
5 . Discussion
Following is a list of the known possible sources of error and an estimate of the upper limit of each error.
5.1. Frequency
As already stated, the frequency was measured by counting cycles for 10 sec; the total count was about 75,000. The inherent error is ± 1 count, but in all cases the mode of at least three independent readings, of which, at worst, two were the same and the third different by one, was taken as the observed value. The counting error can thus be as great as 1 part in 75,000, but as it is random, the effect on the final results is negligible, as indicated in section 4. The 10-sec time base was obtained by division from a I-Me crystal oscillator which is stable to 2 parts in 107 per week, and which was compared with signals from W, VV 01' from a local precision standard. The errors due to inaccuracies in the time base are, therefore, also negligible.
5 .2. Length of Path
The length of the tank across its polished ends at 20° C was determined within IlL, i. e., 5 ppm. Thermal expansion measurements were made at 20°, 60°, and 100° C; the lengths at intermediate temperatures were calculated by quadratic interpolation. The maximum absolute error in the thermal expansion coefficient is estimated at 0.2 ppm; this accumulates to 4 ppm at 0° C, and to 16 ppm at 100° C.
252

T A BLE 2. Speed of sound in water, metric units
l' c '" T c Ll. T c Ll. l' c A
---- ---- ---- --------°C mls mls °e mls m!s °e mls mls °C mls mls
1, 400+ 1,400+ 1,500+ I, .500+ 0 2.74 ------ -- -- 25 97.00 2.71 50 42.87 1. 12 75 55.45 -0.01 I 7.71 4.97 26 99.64 2.64 51 43.93 1.07 76 55.40 -.05 2 ]2.57 4.86 27 '2.20 2.56 52 44.95 1. 02 77 55.3 1 -.09 ~ 17.32 4.75 28 4.68 2.49 53 45.92 0.97 78 55.18 -.]3
4 2l. 96 4.64 29 7.10 2.41 54 46.83 .92 79 55.02 -.17
I 5 26.50 4.53 30 9.44 2.34 55 47.70 .87 80 54.81 -.20 6 ~O. 92 4.43 31 II. 71 2.27 56 48.51 .82 81 54.57 -.24 7 3.1.24 4. ~2 32 13. 91 2.20 57 49.28 . 77 82 54.30 -.28 8 39.46 4.22 33 1605 2.14 58 50.00 .72 83 53.98 -.31 9 43.58 4.12 34 18. 12 2.07 59 50.68 .67 84 53.63 -.35
I 10 47.59 4.02 35 20. 12 2.00 60 51. 30 .63 85 53.25 -.39 II 51. 51 :1.92 36 22.06 1. 94 61 51. 88 .58 86 52.82 -.42 12 55.34 3.82 37 23.93 1. 87 62 52. 42 .53 87 52.37 -.46 13 59.07 3.73 38 25.74 1.81 63 52.91 . 49 88 51.88 -.49 14 62.70 3.64 39 27.49 1. 75 64 53.35 . 45 89 51.35 -.52
1.1 66.25 :3.0.1 40 29.18 1. 69 65 53.76 . 40 90 50. 79 -.56 16 69.70 3.4f> 41 30.80 1. 63 66 54.11 .36 91 50.20 - . 59
I 17 73.07 3.3, 42 32.37 1. 57 67 54. 4~ . 31 92 49.58 -.63 18 ifi.3 .1) :J.28 43 33.88 1. 51 68 54.70 .27 93 48.92 -.66 19 79.55 3 . . 19 44 35.33 1. 45 69 54.93 .23 94 48.23 -.69
20 82.66 3.11 45 36.72 I. 39 70 55. 12 . 19 95 47.50 -.72 21 85.69 3.03 46 3R06 1. 34 71 55.27 . 15 96 46.75 -.76
I
22 88.63 2.9.5 47 39.34 1. 28 72 55. :.i7 . 11 97 45.96 -.79 23 91.50 2.87 48 40.57 I. 23 73 55.44 .07 98 45. 14 -.82 24 94.29 2.79 49 41. 74 1.17 74 55.47 .03 99 44.29 -.85
25 97.00 2.71 50 42.87 I. 12 75 .):,),4.1 -.01 100 43.4 1 -. 88 1,400+ 1,.500+ 1. 500+ 1,500+
--- I ---
TM1L'E; 3. Speed of s01md in water, English 1U~its
T ..'> l' A
_.-- -.--
OF fps fps OF fps fps 4, 600+ 4.900+
30 80 25.7 9.4 32 2.1 82 34.8 9.1 :j4 20.3 18. I 84 43.7 8.8 3(1 37.9 17.7 86 52.2 8.6 38 55. 1 li.2 88 60.5 8.3
40 71.9 16.8 90 68.5 8.0 42 88.2 16. :l 92 76.2 7.7 44 104.1 15.9 94 83.6 7.4 4n 119.6 15. 5 96 90.8 7.2 48 134.6 1 ,i. I 98 97.7 6.9
,10 149.3 14. i 100 "'4.4 6.7 .12 163.6 14.3 102 10.8 6.4 54 177. 5 13.9 104 17.0 6.2 56 19l. 0 13.5 106 22.9 5. ~ 58 '4.1 13.1 108 28.6 5.7
60 16.9 12.8 lIO 34.0 5.4 62 29.3 12.4 112 39.2 5.2 64 41. 3 12.0 114 44.2 5.0 66 53.0 J I. i 116 48.9 4.8 68 64.4 I!. 4 118 53.5 4.5
70 7,1.4 II. 0 120 57.8 4.3 72 86. I 10.7 122 6J. 9 4. 1 74 96.4 10.4 124 65.8 3.9 76 106 .. 1 10.1 126 69.4 3.7 78 116.2 9.8 128 72.9 3.5
80 125.7 9.4 lao in,2 3.3 4,800+ 5.000+
Thus, the toLal uncertainty III the length of the tank is about 5 ppm at 20° 0, and increases with tempera tU1'c both ways; at 0° 0 it becomes abou t 9 ppm and at 100° C, about 21 ppm.
The quest ion arises as to how closely the length of the sound path in the sample, i. e., the distance bctween the inner faces of the transducers, approximates to the length of the tank across the ends to which the crystals are wrung. Experience with developmental models showed that unless the assembly \\:e['e very carefully made, with particular
T Ll. T ..'>
------------op fps fps OF fps fps
5,000+ 5.000+ 130 76.2 3.3 180 99.2 -1.0 132 79.2 3.1 182 98.0 -1.2 134 82. I 2.9 184 96.7 -1.3 136 84. 2. 7 186 95.2 -1.5 138 87.3 2.5 188 93.6 -1.6
140 89.6 2.3 190 91.8 -1.8 142 9 1. 7 2.1 192 89.9 -1.9 144 93. G 1.9 194 87.9 -2.1 146 95.3 1.7 190 85.7 -2.2 148 96.9 1.6 198 83.4 -2.3
150 98.3 1.4 200 81. 0 -2.5 152 99. ,I 1.2 202 78.4 -2.6 154 100. ,I 1.0 204 75.7 -2.7 156 lOt. 4 0.9 200 72.9 -2.8 158 102. 1 .7 208 70.0 -3.0
160 102.6 . 6 210 66.9 -3.1 162 103.0 .4 212 63.7 -3.2 164 !O3.2 .2 166 103.2 .0 168 !O3. I -.1
liO 102.8 -.3 172 102.4 -.4 174 101. B -.6 176 101. I -.8 178 100.2 -.9
180 99.2 - l.0 5.000+ ,i. 000+
attention to avoidance of clamping pressure too ncar the unsupported arcas of the crystals, the crystals might deflect enough to cause very sizable errors. The present design makes it possible to disassemble and reassemble the delay line repeatedly without affecting the resul t by a detectable amount; this holds true when the crystals normally used, which are 0.8 mm thick, are replaced by crystals 1.6 mm thiclc It, therefore, appears that errors produced by misplacement or deformation of the crystals arc insignifican t.
253
5 .3. Setting the Coincidence
As explained in section 2, it is believed that no measurable errol' is introduced by the technique of maximization of the second half cyele of the received pulse. However, a word should be said about the effect of personal bias on the part of the opera to!'. The operators report, to varying degrees, tendencies to adjust not only for maximum height of peak, but also for maximum symmetry and sharpness of peale Long experiment has convinced us that any of the three criteria lead to sensibly the same result, so that although different operators weigh the three criteria differently, they reproduce each o~h~r's settings so well that the discrepancies are neghgl?le relative to other sources of error. Tho assumptlOn is implicit that the errors of bias do not much exceed the discrepancies among individuals.
5.4. Temperature
The Mueller bridge with which the resistallce of the platinum thermometer was measured has a least count of 0.0001 ohm corresponding, for a 25-ohm thermometer Lo about 0.001 ° C. The bridge was calibrated internally so that the indicated resistance in terms of the in ternal standard is correct to abou t 0.0002 ohm aside from temperature effects and slow drifts in the arm ratio and in the zero. Allowing for these, it is estimated that the bridge error does not exceed 0.005° C; errors in the calibration of the platinum thermometer i tself and those due to heating by the bridge current are much smaller. More important is the OlTor that arises from thermal gradients in the bath. On the assumption that this does not exceed half the reading of the differential therm.ocouple which, it will be recalled, measures the difference between the temperature of the platinum element and that of the sample, an upper limit to the cOl'l'esponding uncertainty in the speed o~ sound, c, was calculated at various Lemperatures from the known thermal coefficient of c. This upper limit is zero at 74° C, where c is stationary and increases steadily in both directions, reaching about 25 ppm at 0° C, and about 14 ppm at 100° C.
5 .5. Purity of Sample
Because the results obtained on ordinary laboratory distilled water were indistinguishable from those obtained on the same water redistilled in vacuum directly into the apparatus, it is felt that the remaining impurities do not have a measurable effect. Several measurements made on local tap water gave resul ts about 30 ppm higher than for distilled water.
5 .6. Over-all Accuracy
From the foregoing discussion it appears that the major sources of errol' aTe Lhe uncertainties in the length of the path and in the temperature. Both of these are temperature dependent; their sum is an upper limit to the total errol' . This is about 35 ppm at 0° C; it falls to 15 ppm at 40° C and is almost
constant at t llis value out to 70 ° C, and rises to about 35 ppm at 100° C. It is upon these considerations that the recommendations for the use of the tables in secLion 4 are based.
The values of c here reported are lower than those of most other workers, in particular the value at 30° C is about 0.4 m ls below that of D el Grosso, Smura, and Fougere [3], whose work with the ultrasonic interferometer is perhaps the most carefully planned, executed, and analyzed work of this type to date. It was, therefore, felt desirable to perform an independent experiment using an apparatus a.ncl a method as difforent as possible from those of both Del Grosso, et aI. , and ourselves . An apparatus was constructed with which itis possible to measure, as a function of distance, t lte phase on the axis of a beam of progressive waves emitted b.\T a small pistonlike radiator. If the wave were plane, Lhe phase cp would vary linearly with distance x, and the phase speed c would be 271'fx /cp where f is frequency. In the present case, the wave is not plane and the slopo of the curve 271'fx versus cp depends on x and on the geometry of t he arrang?ment. However , tl.lC theory .enables us to select a dIstance Xo of the reCBlver from the source such that for x>xo the departure of 271'fdxldcp from c is as small as desired.
"Five runs werc made in distilled waLm' at temperatures between 15 ° and 25 ° C. The pripcipal uncertainties are t hought to be first , one of about 40 ppm corresponding to a possible errol' of 0.01 ° C in the temperature, and second, one of ahout 56 pJ;lm related directl v to the inaccuracies of Lhe screw Wi Lh which the receiver displacement was measured. These arc independen t . However, ill Lhe worst case of the 5, the result differed from the value gotten from table 2 b.\- only 27 ppm. The value of Del Grosso, et a1. [3] disagrees with that of table 2 b~T 272 ppm.
This work will be reported in detail elsewhere.
The authors are grateful to the perso nnel of the Engineering lIetrology Section and of the Length Section, in whose Laboratones the lengtll of the tank and its thermal expansio n, respectively, were measured. Thanks arc particularly due to Josoph !vf . Cameron of the Statistical Engineering Section who advised the authors on problems of data processing , and who performed the curve-fitting computations onSEAC.
6. References [1] Martin Greenspan and Carroll E. T schicgg, Sing-around
ultrasoni c velocimeter for liquids, Rcv. Sci. Instr. (in press).
[2] R. A. McConnell and ' V. F. Mruk, Microacoustic interferometer using 30 Mc pulses, J . Acoust. Soc. Amer. 27, 672 (1955).
[3] V. A. D el Grosso, E. J. Smura, and P . F . Fougere, Accuracy of ul trasonic interferom eter determinations, NRL Report 4439, Naval Research Laboratory, Washington , D. C. (Dec. 6, 1954) .
[4] Martin Greenspan a nd Carroll E. Tschiegg, Effect of dissolved air on the speed of sound in water, J. Acon st-. Soc. Amer. 28, 501 (1956).
IV ASHINGTON, March 27, 1957 .
254