speed time graph
DESCRIPTION
Form 5 Gradient And Area Under The GraphTRANSCRIPT
Gradient and Area Under A GraphSPEED – TIME GRAPH

SPEED – TIME GRAPH
• SPEED INCREASE
• ACCELERATION
• UNIFORM SPEED• ACCELERATION = 0
• SPEED DECREASE• DECELERATION
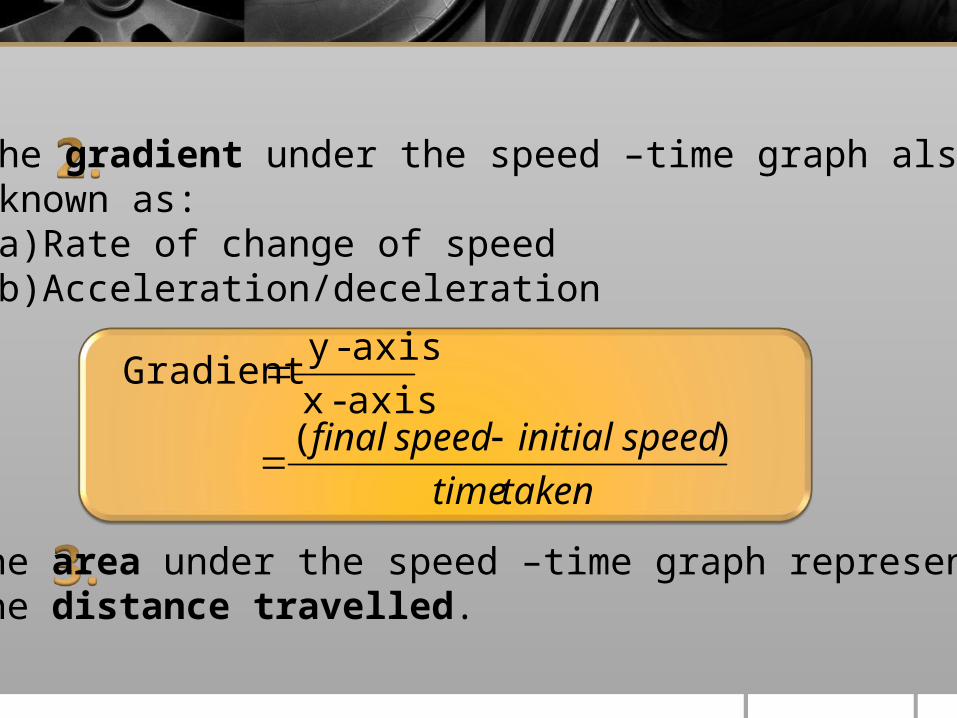
The gradient under the speed –time graph also known as:(a)Rate of change of speed(b)Acceleration/deceleration
The area under the speed –time graph represents the distance travelled.
takentime
speedinitialspeedfinal )(axis-x
axis-y Gradient

b arectangle a of area
(distance)graph under theArea
Speed (ms-1 )
time (s )a
b
0
b a2
1 triangleangled-right a of area
(distance)graph under theArea
Speed (ms-1 )
time (s )a
b
0

cba
)(2
1 trapeziuma of area
(distance)graph under theAreaSpeed (ms-1 )
time (s )c
b
0
B trapeziumof area
A rectangle of area(distance)graph under theArea
Speed (ms-1 )
time (s )0
a

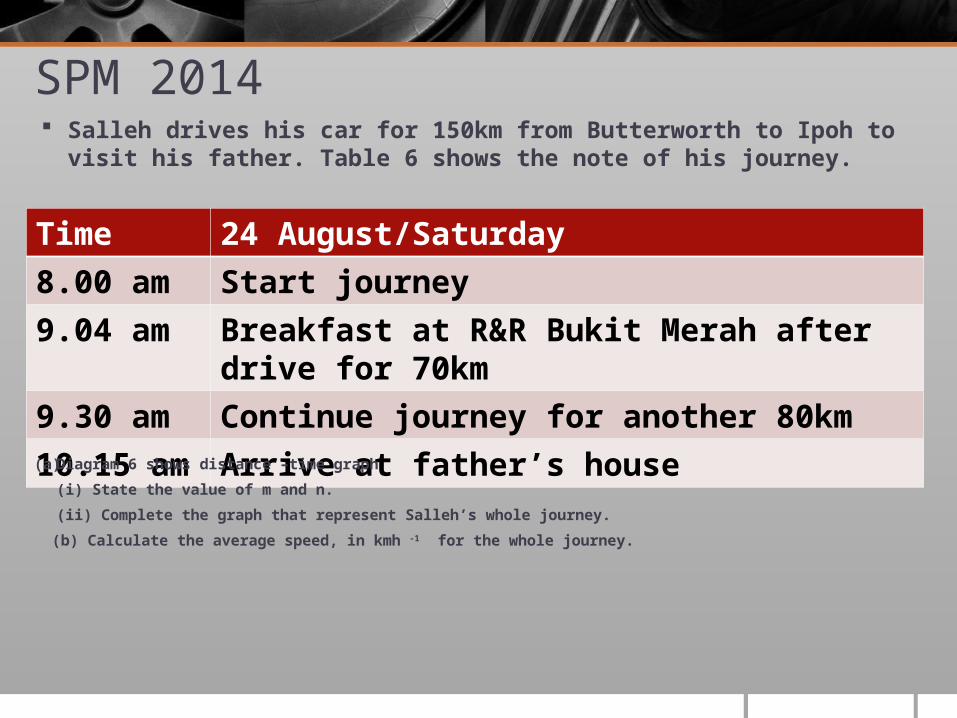
SPM 2014 Salleh drives his car for 150km from Butterworth to Ipoh to
visit his father. Table 6 shows the note of his journey.
Time 24 August/Saturday8.00 am Start journey9.04 am Breakfast at R&R Bukit Merah after drive for 70km9.30 am Continue journey for another 80km10.15 am Arrive at father’s house(a) Diagram 6 shows distance –time graph
(i) State the value of m and n.
(ii) Complete the graph that represent Salleh’s whole journey.
(b) Calculate the average speed, in kmh -1 for the whole journey.

Distance (km)
m=….
150
640 n=…. 135Time (min)
Diagram 6
(a) m = 150-70 =80km(b) n = 64+26 =90 min