spencer stuart board index - the new york stock … 1 spencer stuart perspective for 2015 6 s&p...
TRANSCRIPT

board index 2015 page 2
Spencer StuartBoard Index
2015

At Spencer Stuart, we know how much leadership matters. We are trusted by organizations around the world to help them make the senior-level leadership decisions that have a lasting impact on their enterprises. Through our executive search, board and leadership advisory services, we help build and enhance high-performing teams for select clients ranging from major multinationals to emerging companies to nonprofit institutions.
Privately held since 1956, we focus on delivering knowledge, insight and results though the collaborative efforts of a team of experts — now spanning 56 offices, 30 countries and more than 50 practice specialties. Boards and leaders consistently turn to Spencer Stuart to help address their evolving leadership needs in areas such as senior-level executive search, board recruitment, board effectiveness, succession planning, in-depth senior management assessment and many other facets of organizational effectiveness.
For more than 30 years, our Board Practice has helped boards around the world identify and recruit independent directors and provided advice to chairmen, CEOs and nominating committees on important governance issues. In the past year alone, we have conducted nearly 700 director searches. We are the firm of choice for both leading multinationals and smaller organizations, conducting more than one-third of our assignments for companies with revenues under $1 billion.
Our global team of board experts works together to ensure that our clients have unrivaled access to the best existing and potential director talent, and regularly assists boards in increasing the diversity of their composition. We have helped place women in more than 1,400 board director roles and recruited roughly 600 minority directors around the world.
In addition to our work with clients, Spencer Stuart has long played an active role in corporate governance by exploring — both on our own and with other prestigious institutions — key concerns of boards and innovative solutions to the challenges facing them. Publishing the Spencer Stuart Board Index (SSBI), now in its 30th edition, is just one of our many ongoing efforts:
> Each year, we sponsor and participate in several acclaimed director education programs including:
– The New York Stock Exchange (NYSE) Annual Boardroom Summit & Peer Exchange hosted by NYSE Governance Services
– The Global Board Leaders’ Summit hosted by the National Association of Corporate Directors
– The Global Institutes sponsored by the WomenCorporateDirectors (WCD) Foundation
– The Corporate Governance Conference at Northwestern University’s Kellogg School of Management
– The New Directors Program, a unique two-year development program designed to provide first-time, non-executive directors with an exclusive forum for peer dialogue on key issues and “unwritten rules” of corporate boards, produced in partnership with the Boston Consulting Group, Frederick W. Cook & Co., Gibson Dunn, Lazard and PricewaterhouseCoopers
About Spencer Stuart Board Services

Contents 1 Spencer Stuart perSpective for 2015
6 S&p 500 BoarDS: five- anD 10-Year trenDS
8 BoarD compoSition8 New Independent Directors
10 Recruiting New Directors
11 Director Onboarding
12 Board Size
12 Board Independence
12 Term Length and Resignation Policies
13 Restrictions on Other Corporate Directorships
14 Term Limits
14 Average Age
15 Mandatory Retirement
16 Director Tenure
16 Female Directors
17 Minority Directors
19 CEO Succession Planning
19 CEO Outside Board Service
20 Separation of Chairman and CEO Roles
20 Independent Chairman Background
22 Shareholder Engagement
23 Lead and Presiding Directors
25 BoarD organization anD proceSS25 Board Meetings
26 Committee Structure and Independence
26 Committee Meeting Frequency
27 Cybersecurity
27 Committee Chairman Background
29 Board Evaluations
30 Director compenSation30 Overall Compensation Mix
31 Board Retainers
32 Board Meeting Fees
32 Equity Compensation
33 Board Leadership Compensation
33 Committee Compensation
35 Averages by Industry, Region, Sales
37 comparative BoarD Data

spencer stuartpage 2
header (section title)

board index 2015 page 1
Investor attention to board performance and governance has escalated in the past several years, and it’s not just activists who have raised their expectations. “Passive” investors are becoming decidedly less passive in articulating their expectations for boards in areas such as board composition, disclosure and shareholder engagement. Large institutional shareholders of companies across industries and market caps are increasingly asking: How is the board performing? And many expect to engage with boards on a range of issues, including board succession and refreshment, compensation, risk management as well as strategic and governance concerns.
A particular focus has been board composition. Traditional institutional investors have become more explicit in calling on boards to demonstrate that they are being thoughtful about who is sitting around the board table and that directors are contributing. Firms such as State Street, BlackRock and Vanguard have put boards on notice that they are looking more closely at disclosures related to board refreshment, shareholder engagement, board performance and assessment practices, in some cases establishing formal policies.
> State Street Global Advisors established a voting policy on director tenure in 2014, intended to encourage boards with predominately long-tenured directors to better address director succession planning. The policy calls on boards to focus on the refreshment of director skills and plan for director succession in an orderly manner, and it articulates the ways tenure issues may influence State Street’s voting decisions.
> Vanguard has outlined six principles of governance, which it has communicated in various forums, including letters to independent leaders of the boards of its largest holdings. In particular, the firm has emphasized its expectation that directors will engage with shareholders. Chairman and CEO F. William McNabb III explained in a Financial Times article, “Independent directors are doing a good job, but we find they are not as engaged with shareholders as they should be. Directors are standing in on behalf of owners — it is an important concept — and there are many independent directors who have never met an investor.”
What’s driving this attention to corporate governance by these long-term, passive investors? Precisely because they are focused on long-term growth, they want to provide input to the board, and they rely on boards to oversee management and its strategy. The cornerstone of a board’s ability to provide independent oversight is appropriate board composition. For this reason, expectations are growing that boards will provide greater transparency about the skills directors bring and why they collectively possess the right expertise in light of the company’s strategic direction. They also want to know that boards are assessing their performance and holding directors to high standards.
Spencer Stuart Perspective for 2015
Focused on long-term
growth, institutional
shareholders want to
provide input to the
board, and they rely
on boards to oversee
management and
its strategy.

spencer stuartpage 2
spencer stuart perspective for 2015
Our analysis of the proxies of S&P 500 companies shows that some companies have become more transparent with shareholders about their composition and how they think about director succession planning. While boards are required to describe the skills and expertise each director brings, it’s more common today for boards to provide detailed skill matrices in their proxies. And some boards address topics such as director tenure and board succession strategies in their proxies. Nevertheless, in general, a gap remains between what boards are communicating and what shareholders want to know.
To get a better sense of the state of shareholder engagement, we surveyed corporate secretaries about the issues raised by shareholders and the board’s interaction with investors:
> 42% reported that the board or management was formally contacted by the company’s large institutional shareholders or largest shareholders specifically regarding a governance-related topic. 70% said management or the board pro-actively reached out to the company’s large investors in the past year, an in-crease from 62% in 2014.
> Public and private pension funds were the most likely to initiate contact with boards, representing 51% of the contacts. Activist shareholders accounted for 17% of the inquiries, and mutual funds, 16%.
> Proxy access and board composition and renewal were among the top issues raised by shareholders in the 2015 survey. Board composition and refreshment accounted for 14% of investor inquiries, and another 13% were related to direc-tor tenure. Director nominations accounted for another 11% of contacts.
A focus on performance: What boards can do With momentum quickly shifting behind issues such as board refreshment, rigor around composition and assessment, board directors have taken notice. Directors want to ensure that their boards contribute at the highest level, aligning with shareholder interests and expectations, and setting a positive tone at the top for the organization by holding themselves to a high standard. We have identified five best practices for boards related to board composition and shareholder engagement.
View director recruitment in terms of ongoing board succession planning, not one-off replacements.Investors expect that boards evaluate board composition holistically, in the context of the company’s long-term strategy, the current business environment and the diversity of stakeholders. Led by the nominating/governance committee, boards should periodically review the skills and expertise on the board to identify gaps based on changes in strategy or the business context. For example, the board of a company with a new first-time CEO may decide it needs someone able to serve as a mentor. When thinking about the contributions needed in the boardroom, boards also may want to consider valuable soft skills: Do we have someone who asks the tough questions of management? Who is a creative thinker who views issues with a fresh perspective? Who helps to bring closure on discussions?
376Number of independent directors added in 2015
3%Percentage of boards that
specify term limits

board index 2015 page 3
Proactively communicate the skill-sets and expertise in the boardroom — and the roadmap for future board succession.Investors are looking for a well-explained rationale for why the group of people sitting around the board table are the right ones based on the strategic priorities of the business. They also want assurances that the board has processes in place to continue to evolve board composition in light of emerging needs. More broadly, investors want to understand the board’s approach to board renewal and that it regularly evaluates the contributions and tenure of current board members as well as the relevance of their experience. Publishing a skill matrix and sharing the board’s thinking about the types of expertise needed on the board — and how individual directors provide that expertise — are increasingly considered best practice.
Set expectations for appropriate tenure both at the aggregate and individual levels. One way boards can combat the perceived stigma attached to leaving a board before the mandatory retirement age kicks in is to set term expectations when new directors join. Long-standing board members often are surprised when they are asked to leave because things have been left open-ended. Setting expectations at the outset reduces the element of surprise. Furthermore, individual directors should be encouraged to think critically about their own contributions and whether the experience they bring is as relevant today as when they joined the board. The best boards create an environment where directors are willing to acknowledge when the board would benefit from bringing on different expertise. They also refrain from changing or waiving mandatory retirement, except in unique cases.
Think like an activist and identify vulnerabilities in board renewal and performance. Boards may be confident in their current composition and level of refresh, but left unaddressed, it may put a board on the radar screen of an activist. Activists often conduct side-by-side comparisons of directors’ skill-sets and experiences against the company’s strategic agenda, looking for weaknesses in expertise or performance. Boards would do well to conduct “opposition research” on their own to identify potential vulnerabilities. The annual board evaluation is an important platform for thinking critically about board performance and composition and tackling any weaknesses, and it’s one that investors increasingly want to know more about. Proactive boards include individual director assessments in their annual board evaluations, periodically engaging third parties to manage the process, and are disciplined about identifying and holding themselves accountable for action items stemming from the assessment.
Establish a framework for engaging with investors. Given investors’ growing desire for direct engagement with directors, more boards are establishing frameworks for investors to raise questions and engage in meaningful, two-way discussions with the board. The conversation with investors begins with public disclosures. Proactive and creative disclosure demonstrates that the board has thought about its composition, performance and other specific issues. In addition, it’s valuable to have a protocol in place that enumerates
63.1Average age of
independent directors
34%Percentage of boards with retirement age
set at 75 or older

spencer stuartpage 4
spencer stuart perspective for 2015
responsibilities related to shareholder engagement. One approach is to adopt the 10-point protocol developed by the Shareholder Directors Exchange, which offers guidance to U.S. public company boards and shareholders on when such engagement is appropriate and how to make these engagements valuable and effective. For some boards, it may make sense to establish a shareholder engagement committee.
other highlightS from thiS Year’S inDex > S&P 500 boards included in our index elected 376 new independent directors
during the 2015 proxy year — averaging 0.78 new directors per board. Last year, S&P 500 boards added a total of 371 new directors. This class of new independent directors is the largest since 2008, when S&P 500 boards added 380 independent directors.
> More than half (53%) of new independent directors are active, compared with 47% in 2014, when the representation of fully employed executives dipped below 50% of all new directors for the first time.
> Only 20% of new independent directors are active CEOs, chairs, presidents and COOs, compared with 22% in 2014, 26% in 2010 and 32% in 2005.
> Just over one-quarter of new independent directors (26%) are first-time corpo-rate board members. Last year, 39% of new directors were serving on their first corporate board, the largest influx of first-time directors we have seen.
> Women represented 31% of new directors in 2015, up one percentage point from 2014 and nearly 50% over the past five years.
FIVE QUESTIONS FOR BOARD COMPOSITION1. When was the last time we conducted a side-by-side comparison of directors’ skill-sets and
experiences against the company’s strategic agenda?
2. Have we clearly communicated with investors a well-explained rationale for why directors are on the board?
3. Have we clearly communicated with investors that we have a process in place to ensure we continue to have the best group of people on the board?
4. How are we ensuring board refreshment?
5. Have we fostered an environment that encourages individual directors to think critically about their contributions and the relevance of their skills to the company strategy?
FIVE QUESTIONS FOR SHAREHOLDER ENGAGEMENT1. Do we have someone with investor relations skills?
2. What is our protocol for engaging with shareholders?
3. Who will communicate with shareholders in a crisis?
4. How do we make sure we are getting the necessary feedback from investors?
5. Are we empowering management to relay both negative and positive investor feedback?

board index 2015 page 5
> More than three-quarters of S&P 500 boards (77%) limit directors from accepting other corporate directorships, an increase from 71% in 2010. Boards have placed restrictions on outside board service to minimize the possibility of directors becom-ing “overboarded” with insufficient time to devote to board responsibilities.
> Directors themselves recognize the increased time commitment: 66% of inde-pendent directors have two or fewer boards.
> 13 S&P 500 boards (3%) set an explicit term limit for non-executive directors, a decrease from 24 (5%) in 2010. 66% of boards explicitly state in their corporate governance guidelines that they do not have term limits, while 31% do not mention term limits at all.
> The average age of S&P 500 independent directors is 63.1, unchanged from 2014 but more than two years older than a decade ago.
> Among the 73% of boards that have established a mandatory retirement age for directors, half set the retirement age at 72, which has remained relatively consistent in the past decade. However, 34% of boards set the retirement age at 75 or older, compared with 8% in 2005.
> The average tenure of S&P 500 boards is 8.5 years, roughly stable for the past five years. The majority of boards, 62%, have an average tenure between six and 10 years. 21% of boards have an average tenure of 11 or more years.
> Among proxies that addressed cybersecurity, the responsibility typically falls to the audit committee. There has not been any discernible increase in boards with technology committees; however, 12% of boards now have a standalone risk committee compared to 9% last year.
> Half of boards, 52%, evaluate the full board and committees, and one-third evalu-ate the full board, committees and individual directors annually. This represents an increase from 2010, when 24% examined the performance of the board, committees and individual directors as part of their annual evaluations.
> The average total compensation for S&P 500 directors is $277,237, 5% higher than the 2014 average. When compensation for the independent chairman is excluded, the average total compensation per director falls to $272,497.
Editor’s Note: The Spencer Stuart Board Index is based on our analysis of the most recent proxy reports from the S&P 500, plus an extensive supplemental survey. This edition of the SSBI draws on the latest proxy statements from 486 companies filed between May 20, 2014, and May 15, 2015, and responses from 85 companies to our governance survey conducted in the second quarter of 2015. Survey respondents are typically corporate secretaries, general counsel or chief governance officers. Proxy and survey data have been supplemented with information compiled in Spencer Stuart’s proprietary database.
31%Percentage of women among new independent directors
8.5 Average tenure of S&P 500 boards
years

spencer stuartpage 6
Board composition
Average board size 10.8 10.7 10.7 1% 1% Board size stable over 10 years
Independent directors 84% 84% 80% 0% 5% Share of independent directors grew in past decade
Average age of independent directors 63.1 62.1 60.8 2% 4% On average directors are more than two years older than in 2005
New independent directors
Total number 376 302 333 25% 13% The highest number of new directors since 2008
Women 31% 21% 20% 48% 55% Boards welcomed 117 new female directors, topping last year as the most ever
Active CEO/chair/president/COO 20% 26% 32% -23% -38% Sitting CEOs and other top executives continue to reduce their outside board commitments
Retired CEO/chair/president/COO 18% 17% 13% 6% 38% More retired senior executives tapped for board service
Financial backgrounds 24% 21% 20% 14% 20% Nearly a quarter of new directors bring financial expertise
Other corporate executives 25% 18% 16% 39% 56% Non-CEOs have become an important source of new directors
Women directors
Women as percentage of all directors 20% 16% 15% 25% 33% Female representation grew by 5 percentage points over the
past decade
Boards with at least one woman director 97% 90% 88% 8% 10% 13 boards have no female directors
CEO profile
CEOs who serve on an outside public company board 43% 46% 56% -7% -23% The number of CEOs who accept outside board directorships
continues to decline
Women CEOs 22 18 9 22% 144% Women lead only 4.4% of S&P 500 companies
Boards where CEO is the only non-independent 61% 53% 39% 14% 55% Significant decline in boards with more than one executive
member
Average age 57.0 56.1 55.4 2% 3% The average age of CEOs has fluctuated between 55 and 57 in past 10 years
Average tenure with company 18.8 15.5 14.9 21% 26% The average CEO company tenure has increased about 4 years
Board leadership independence
CEO is also chairman 52% 60% 71% -13% -27% Almost half of boards now split chair and CEO roles
Independent chairman 29% 19% 9% 53% 222% Prevalence of independent chairs reaches new high
Boards with lead or presiding director 98% 96% 95% 2% 3% Almost all boards without an independent chairman have a lead
or presiding director
Board meetings
Average number of board meetings 8.1 8.6 8.0 -6% 1% After slight rise, board meeting frequency returns to 2005 level
Median number of board meetings 7 8 7 -13% 0% Median returns to 2005 level
2015 (a) 2010 (b) 2005 (c) 5-year% change
10-year% change
Comments
S&P 500 Boards: Five-Year and 10-Year Trends

board index 2015 page 7
2015 (a) 2010 (b) 2005 (c) 5-year% change
10-year% change
Comments
Retirement age
Boards with mandatory retirement age 73% 74% 78% -1% -6% Small change in the number of boards with a mandatory
retirement age
Boards with mandatory retirement age of 75+ 34% 19% 8% 79% 325% Director retirement ages increasingly skew older
Boards with mandatory retirement age of 72+ 94% 79% 57% 19% 65% Nearly all boards with a retirement age place it at 72 or higher today
Committee meetings
Average number of audit committee meetings 8.8 8.8 9.4 0% -6% Audit committees do not meet as often as they did a decade ago
Average number of compensation committee meetings 6.1 6.7 5.8 -9% 5% Despite recent decline, compensation committees still meet more
often than 10 years ago
Audit committee chairmen
Active CEO/chair/president/COO 7% 13% 21% -46% -67% Others are tapped for audit committee leadership as time commitment increases
Financial exec/CFO/treas/public account executive 40% 30% 16% 33% 150% Boards more likely to turn to financial executives to chair audit
committee
Non-employee director compensation
Total average compensation (d) $277,237 $215,000 n/a 29% n/a Total average compensation grows 29% in five years
Average annual retainer (e) $112,144 $79,888 $56,550 40% 98% Average retainer nearly double over the 2005 value
Median annual retainer (e) $90,000 $65,000 $50,000 38% 80% Median retainer reaches new level
Boards paying retainer of at least $70,000 77% 48% 23% 60% 235% 45% pay a retainer of $100,000 or more
Boards paying board meeting fee 21% 41% 62% -49% -66% Percentage of boards paying meeting fees declines roughly 20% every five years
Average board meeting fee $2,041 $2,186 $1,846 -7% 11% Meeting attendance fees consistently average about $2,000
Boards offering stock option program 16% 33% 56% -52% -71% Stock option grants have fallen out of favor as a component of
compensation
Boards paying equity in addition to retainer 77% 79% 60% -3% 28% More than three-quarters of boards provide equity as well as
retainer
Committee compensation
Boards paying committee chair retainer 95% 90% 83% 6% 14% Committee chairs receive a retainer on almost all boards
Average committee chair retainer $14,399 $11,692 $8,158 23% 77% Committee chair retainers have increased significantly
Boards paying committee member retainer 41% 37% 27% 11% 52% Committee member retainers have become more common as
meeting fees are phased out
Average committee member retainer $8,926 $7,822 $6,422 14% 39% Member retainer average also rises
Boards paying committee meeting fees 26% 44% 61% -41% -57% About one-quarter of boards still pay committee meeting fees
Average committee meeting fees $1,678 $1,620 $1,463 4% 15% Meeting fee amounts have modestly increased
(a)Data based on proxy year May 20, 2014, through May 15, 2015. (b)Data based on proxy year May 15, 2009, through May 15, 2010. (c)Data based on proxy year June 1, 2004, through May 31, 2005. (d)Based on non-employee director compensation tables included in 486 and 489 proxies for 2015 and 2010, respectively. (e)Not including stock beyond retainer.

spencer stuartpage 8
Board Composition
BoarDS welcome largeSt claSS of new inDepenDent DirectorS Since 2008 > S&P 500 boards included in our index elected 376 new independent directors during the 2015 proxy year
— averaging 0.78 new directors per board. Last year, S&P 500 boards added a total of 371 directors.
> The 376 new directors joined 255 boards, with 91 boards welcoming more than one director.
> The number of new independent directors has been rising since 2012, when boards added only 291 new independent directors. This class of new independent directors is the largest since 2008, when S&P 500 boards added 380 independent directors.
376new independent directors
of new directorsare serving forthe first time
of new directors are female— an all-time high
of boards have anindependent chairman
All but
of boards haveannual director elections8%
2015 snapshot

board index 2015 page 9
more active executiveS are tappeD for BoarD Service > More than half (53%) of new independent directors are active senior executives and professionals. This
compares with 47% of new directors in 2014, when the representation of fully employed executives dipped below 50% of all new directors for the first time.
> While a higher percentage of new directors are actively employed, the representation of active CEOs, chairs, presidents and chief operating officers continues to decline. Only 20% of new independent directors are active senior executives, compared with 22% in 2014, 26% in 2010 and 32% in 2005. Nevertheless, active CEOs remain the single largest source by role of new independent directors.
> Making up for the decline in active CEOs is a rise in the number of active corporate executives a level or two down from the CEO. Other corporate executives — including active division and subsidiary presidents and line and functional leaders — make up 14% of new independent directors, compared with 9% last year. New active directors with financial backgrounds represent 12% of new independent directors in 2015, an increase from 9% last year.
> Among the line and functional leaders, 15% hold the chief information officer title, and an additional 11% hold technology, information systems or IT security roles.
fewer firSt-time DirectorS join S&p 500 BoarDS > Just over one-quarter of new independent directors (26%) are first-time corporate board members.
Last year, 39% of new directors were serving on their first corporate board, the largest influx of first-time directors we have seen.
> First-time directors are more likely to be actively employed than newly added directors with previous board experience (74% versus 47%).
> Current or retired CEOs are more likely to have outside public company board experience. Only 19% of new directors who are current or former CEOs are serving on an outside board for the first time.
cloSe to one-thirD of new DirectorS are women > Women are joining S&P 500 boards in greater numbers. Female representation among new directors
rose to 31% in 2015, from 30% in 2014 and 21% in 2010.
> New female independent directors are more likely than their male counterparts to be line and functional leaders (25% versus 12%). Conversely, 47% of new male directors are current or former CEOs, chairs, presidents and COOs, versus 19% of new female directors.
> 35% of new directors have global professional experience — defined in this report as having worked at an international location — compared with 33% in 2014. New directors have working experience in diverse global locations, including Africa, Asia, Europe and Latin America.

spencer stuartpage 10
Spencer Stuart Governance Survey: Board refreshment 69% of survey respondents said their board has a strategy to encourage regular board refresh-ment. When we asked a similar question in 2014, 41% reported having a long-term strategy for encouraging board turnover. During the past several years, board renewal has become a more prominent governance topic.
Respondents cited three main drivers of their refreshment strategies: director retirements (87%), the desire to add new skills (76%) and the goal to increase the diversity of the board (62%). Only 4% said investor influence is a primary reason for addressing board refreshment.
51% of respondents said their boards intend to add at least one new director in the current year. 47% said their boards will recruit one or more directors in 2016, and 32% said their boards will be adding directors in 2017. 81% cited director retirements as a primary reason for adding board members. Adding new skills (57%) and increasing the diversity of the board (43%) were the two other primary reasons for adding directors.
Director recruiting profiles When recruiting new directors, boards are prioritizing active CEO and COO profiles, the survey found. 65% of respondents said their boards are looking to recruit a working CEO or COO. Despite the desire for directors with these profiles, the representation of active CEOs among new directors has been declining for many years, and hit a new low this year. Only 20% of new directors in the 2015 proxy year are active CEOs, chairs, presidents and COOs.
Other recruiting priorities are women and executives with financial expertise, cited by 58% and 54% of respondents, respectively. And, in fact, we did see an uptick in the percentage of women and executives with finance backgrounds in the 2015 class of new directors.
52% of respondents said a global perspective is required, and 51% said finding minority directors is a priority.
Data in this and other sections labeled “Added Perspective” come from our governance survey, conducted in the second quarter of 2015. This year, we heard from 85 S&P 500 companies. Respondents include corporate secretaries, general counsel and chief governance officers.
added perspective
Wish List for New Director Backgrounds*
Active CEO/COO 65%
Women 58%
Financial expertise 54%
Global perspective 52%
Minority 51%
Retired CEO/COO 41%
Technology expertise 41%
Specific industry expertise 27%
Regulatory/government expertise 21%
Cybersecurity expertise 20%
Digital or social media expertise 16%
Marketing expertise 14%
Other 13%
N = 85 survey respondents* Percentages add up to more than 100 as respondents could select more than one category.

board index 2015 page 11
new DirectorS repreSent varieD inDuStrY anD functional BackgrounDS > Demand for financial backgrounds rose modestly; 24% of new directors are active or retired executives
with banking, finance, investment or accounting credentials, compared with 20% in 2014. The uptick in financial backgrounds is a result of an increase of directors coming from banking and investment management, together accounting for 15% of new directors, up from 10% last year.
> The top three industry backgrounds for new independent directors are tech/telecommunications, consumer goods and services, and financial services, representing 16%, 14% and 12% of new director backgrounds, respectively.
New Independent Director Backgrounds*
Year 2015
2005 2010 2015 Men Women
CEO/chair/president/COO 45% 43% 38% 47% 19%
Active 32% 26% 20% 25% 10%
Retired 13% 17% 18% 22% 9%
Other corporate executives 16% 18% 25% 21% 34%
Division/subsidiary presidents 5% 8% 9% 9% 9%
Line and functional leaders 11% 10% 16% 12% 25%
Financial backgrounds 20% 21% 24% 24% 23%
Financial executives/CFO/treasurers 8% 8% 7% 7% 9%
Bankers/investment bankers 4% 2% 6% 6% 4%
Investment managers/investors 6% 9% 9% 9% 9%
Public accounting executives** 2% 2% 2% 2% 1%
Academics/nonprofit 10% 8% 5% 3% 9%
Consultants 3% 4% 2% 0% 4%
Lawyers 4% 2% 1% 1% 2%
Others*** 2% 4% 5% 4% 9%
N = 259 men and 117 women in 2015 *Except where noted, all include both active and retired executives. **All former partners or executives of public accounting firms.*** Includes retired government officials, military personnel, medical executive, founder of architectural design firm, real estate developer
and philanthropist/explorer.
Spencer Stuart Governance Survey: Director onboarding > 95% said meeting with the company’s auditor is part of the director orientation program, and
46% have new directors meet with the company’s compensation adviser. 7% said new directors meet with outside legal counsel.
> 71% of respondents said new directors get to know the company through site visits. 18% said new directors participate in third-party development/education programs. 17% require new board members to attend all committee meetings during their first year.
> More than half of respondents indicated that director orientation includes meetings with a variety of company executives.
added perspective

spencer stuartpage 12
board composition
average BoarD Size StaBilizeS near 11 > The average size of S&P 500 boards has been consistent for more than 10 years, ranging between 10.7
and 10.9 members. The 2015 average is 10.8.
> Boards range in size from five to 25 members. 74% of boards have nine to 12 members, compared with 66% in 2005. Smaller boards, in particular, are less common; 9% of boards have eight or fewer directors, compared with 16% in 2005.
> CME Group tops the list of largest boards with 25 members, followed by BlackRock and BB&T, with 18 members each.
> The smallest boards — Microchip Technology and D.R. Horton — have five directors, and four boards have six members.
Board Size
inDepenDent Director repreSentation haS grown in paSt DecaDe > Independent directors now make up 84% of all S&P 500 board members, unchanged from last year.
S&P 500 boards have 9.1 independent directors and 1.7 non-independent directors on average. The ratio of independent directors to non-independent directors is 5.4 to 1.
> The CEO is the only non-independent director on 61% of S&P 500 boards today, a trend that has grown as boards have become more independent. In 2010, CEOs were the only non-independent director on 53% of boards, up from 39% in 2005.
DirectorS are electeD annuallY on moSt BoarDS > Directors stand for election on an annual basis on 92% of boards. The percentage of boards with
declassified boards has increased significantly over the past decade, likely in response to shareholder demands. 51% of boards in 2005 and 72% in 2010 had annual director elections.
> 86% of boards have established policies requiring directors who fail to secure a majority vote to offer their resignation, up from 71% in 2010. While these policies have become widespread, boards still retain the discretion to accept or decline a director’s resignation following his or her failure to receive a majority vote.
reSignation policieS in effect on manY BoarDS > Consistent with the past several years, 86% of S&P 500 boards have a provision in their corporate governance
guidelines requiring directors who experience a change in employment status or significant change in job
201520102005
8 or fewer directors
9 14 169 to 12
74 68 6613 or more
17 18 18

board index 2015 page 13
responsibilities to notify the chairman and/or the nominating committee and offer their resignation from the board. Typically, the chair or nominating committee has the discretion to accept or decline the resignation.
> 38% of boards report having a policy requiring the CEO to submit his or her resignation from the board when the CEO’s employment with the company ends. In all cases, however, boards retain the discretion to accept or decline the resignation. This provision is more common than in 2010, when 22% of boards had such a policy.
reStrictionS on other puBlic companY DirectorShipS have Become StanDarD > More than three-quarters of S&P 500 boards (77%) limit directors from accepting other public
company directorships, an increase from 71% in 2010. Boards have placed restrictions on outside board service to minimize the possibility of directors becoming “overboarded” with insufficient time to devote to board responsibilities.
> 59% of boards have a numerical limit for other board service for all directors; of those, 5% cap additional directorships at two, 33% cap additional directorships at three, 39% at four, and 23% at five or six. The higher caps (five to six) typically apply specifically to retired or not fully employed directors. No company limits other directorships to one.
> 45% of S&P 500 boards limit the number of other audit committees on which their members may serve; 92% of these boards limit the number of other audit committee memberships to two.
> 18% of boards restrict the number of additional boards on which fully employed directors or CEOs of public companies may serve, most commonly to two outside boards. No board allows directors who are employed executives to serve on more than three additional boards.
> Among the 113 boards that do not specify a limit on other corporate directorships, 92% require directors to notify the chairman prior to accepting an invitation to join another company board and/or encourage directors to “reasonably limit” their other board service.
> Most CEOs are not restricted from accepting outside board assignments. Only 20% of S&P 500 boards set a specific limit in their corporate governance guidelines on the CEO’s outside board service; 95% of those boards limit CEOs to one or two outside boards.
the average Director ServeS on two corporate BoarDS > Although independent directors generally could serve on more, the average S&P 500 director has 2.1
corporate board affiliations. This average has remained unchanged during the last four years.
> 65% of independent directors have two or more affiliations; 12% have four or more.
Number of Corporate Board Affiliations for Independent Directors
4+ boards12%
1 board35%
2 boards31%
3 boards22%

spencer stuartpage 14
board composition
verY few BoarDS uSe Director term limitS to promote turnover > 13 S&P 500 boards, 3%, set an explicit term limit for non-executive directors, a decrease from 24 (5%)
in 2010. 66% of boards explicitly state in their corporate governance guidelines that they do not have term limits, while 31% do not mention term limits at all.
> Of the 13 boards with a specific term limit, five cap director terms at 15 years, two at 10 years, two at 12 years and two at 20 years. The longest term limit is 20 years, and no board has a term limit less than 10 years.
> As an alternative to establishing term limits or mandatory retirement, many boards report that they consider whether individual directors should be re-nominated during the evaluation process.
Boards with Term Limits
Company Term limits
The AES Corporation 14 consecutive one-year terms
Allegion Public Company Limited 10 years
Frontier Communications Corporation 15 years
International Flavors & Fragrances 12 consecutive one-year terms
Juniper Networks 10 years
MasterCard 15 years
Patterson Companies 20 years
The Procter & Gamble Company 18 years
Target Corporation 20 years or 5 years after retirement from active employment
Varian Medical Systems 15 years
Wal-Mart Stores 12 years
The Walt Disney Company 15 years
Xcel Energy 15 years
trenD towarD olDer BoarDS perSiStS > The average age of S&P 500 independent directors is 63.1, unchanged from 2014 but roughly two years
older than a decade ago. 46% have an average age of 60 to 63.
> Fewer boards than in the past have an average age of 59 or younger: 15% of S&P 500 boards today compared with 30% in 2005.
Spencer Stuart Governance Survey: Director term limits > Scrutiny of board tenures has increased in recent years. Nevertheless, boards are not establishing
director term limits as a means of limiting tenure. Only 4% have term limits today and just 5% of survey respondents reported that their boards are considering setting term limits.
> 15% report that the board has other means of limiting board tenure, including mandatory retirement, an average tenure policy, tenure guidelines and a nomination process that considers tenure.
added perspective

board index 2015 page 15
> 39% of S&P 500 boards have an average age of 64 or older, compared with 18% of boards a decade ago, and 18 of those boards have an average age of 70 or greater.
> While the longer-term trend toward older boards is continuing, the percentage of boards with an average age of 64 to 69 fell to 36% from 43% in 2014.
> The average age of new independent directors dipped modestly since last year. The new independent director class of 2015 has an average age of 56.8, compared with 57.6 in 2014. The median age fell from 58 to 57. The oldest new director elected in the 2015 proxy year is 75, and the youngest is 31. Seven boards added a new independent director aged 70 or older.
Average Age of Independent Directors
2015 2010 2005
Average age of all independent directors 63.1 62.1 60.8
Youngest average board age 46 51 50
Oldest average board age 75 75 72
Percentage of all S&P 500 boards with average age of ...
59 and younger 15% 19% 30%
60-63 46% 47% 52%
64 and older 39% 34% 18%
manDatorY retirement ageS continue to increaSe > 27% of S&P 500 boards either do not discuss mandatory retirement in their proxies or report that they
do not have a mandatory retirement age.
> Among the 73% of boards that have established a mandatory retirement age for directors, half set the retirement age at 72, which has remained relatively consistent in the past decade.
> Boards setting their retirement ages at 75 or older is a trend that has accelerated in recent years. 34% of boards have retirement ages of 75 or higher compared with 30% in 2014 and just 8% in 2005. Three boards set retirement age at 80.
Mandatory Retirement Age
2015 2010 2005
70 and younger 5% 20% 42%
71 1% 1% 1%
72 50% 52% 45%
73 4% 4% 3%
74 6% 4% 1%
75 and older 34% 19% 8%
N = Boards that have set a mandatory retirement age: 357 for 2015, 363 for 2010, 374 for 2005

spencer stuartpage 16
board composition
one-fifth of BoarDS have tenure greater than 10 YearS > The average tenure of S&P 500 boards is 8.5 years, roughly stable for the past five years. The majority of
boards, 62%, have an average tenure between six and 10 years.
> 21% of boards have an average tenure of 11 or more years, compared with 16% in 2014 and 19% in 2010. 17% have an average tenure of five years or less, down from 18% last year and 21% in 2010.
> The longest average board tenure is 21 years, and the longest-tenured director has served 47 years.
> With the average tenure for sitting CEOs at 7.1 years, most boards will serve with two CEOs.
Board Average Tenure
female repreSentation on BoarDS now at 20% > The representation of women on S&P 500 boards has increased five percentage points over the past 10
years, from 15% in 2005 to 20% today. In that same period, the average number of women on all boards increased from 1.6 to 2.1.
> 13 S&P 500 boards, 3%, have no female directors, a decline from 2010, when 50 boards (10%) had no female directors. In 2005, 12% of companies had no women on their boards. Boards without female representation are most likely to be in the consumer discretionary, energy or information technology sectors.
> A more significant increase over the past decade can be seen in the number of boards with more than one female director. Almost three-quarters of S&P 500 companies, 73%, have two or more women on the board, up from 68% in 2014. A decade ago, 49% of boards had two or more female directors.
> 22 S&P 500 companies have a woman serving as CEO, one less than in 2014. Female CEOs now represent 4.4% of chief executives of the companies in this study.
> Traditionally, companies led by women have tended to have a greater number of female board directors than companies led by men. That continues to be true in absolute terms: 28% of directors on boards of companies with a female CEO are women, versus 19% for companies with a male CEO. When the female CEO is excluded, however, the gap narrows: 21% of the remaining directors are women.
16 yearsor more
4%
6 to 10 years62%
11 to 15 years17%
5 yearsor less
17%

board index 2015 page 17
S&P 500 Female CEOs and Their Boards*
Company CEO Total directors
Women directors
Women directors as % of total
Campbell Soup Company Denise M. Morrison 14 4 29%
Duke Energy Corporation Lynn J. Good 14 3 21%
E.I. du Pont de Nemours and Company Ellen J. Kullman1 12 3 25%
Gannett Co. Gracia C. Martore2 10 4 40%
General Dynamics Corporation Phebe N. Novakovic 11 3 27%
General Motors Company Mary T. Barra 12 5 42%
HCP Lauralee E. Martin 8 2 25%
Hewlett-Packard Company Margaret C. Whitman 12 3 25%
International Business Machines Corporation Virginia M. Rometty 14 3 21%
KeyCorp Elizabeth E. Mooney 14 5 36%
Lockheed Martin Corporation Marillyn A. Hewson 11 4 36%
Mondelez International Irene B. Rosenfeld 12 3 25%
Mylan Heather Bresch 13 4 31%
Oracle Corporation Safra A. Catz 11 2 18%
PepsiCo Indra K. Nooyi 14 4 29%
Reynolds American Susan M. Cameron 12 2 17%
Ross Stores Barbara Rentler 11 2 18%
Sempra Energy Debra L. Reed 13 3 23%
The TJX Companies Carol Meyrowitz 10 3 30%
Ventas Debra A. Cafaro 11 2 18%
Xerox Corporation Ursula M. Burns 9 4 44%
Yahoo! Marissa Mayer 9 3 33%
Average % women directors for companies with female CEOs 28%**
Average % women directors for companies with male CEOs 19%
*Accurate as of each company’s most recent proxy released by May 15, 2015, and verified as of publication date October 31, 2015.**Excluding the CEO, the average is 21%. 1Stepped down October 16, 2015. 2As of June 29, 2015, leads TEGNA, the broadcast and digital media company formerly known as Gannett Co.
more minoritieS join BoarDS, Yet fewer BoarDS incluDe a minoritY Director > More minority directors (defined as African-American, Hispanic/Latino and Asian) were appointed to
S&P 500 boards over the past year than in the recent past. 18% of the 376 new independent directors are minorities, an increase from 12% in 2014. Minority directors filled 68 vacant board seats.
> New minority directors are more likely than new non-minority directors to be line and functional leaders or division/subsidiary presidents, 38% versus 23%, and less likely to be active or retired senior leaders (such as CEO, chair, president or COO), 24% versus 41%.
> While the pool of new directors included more minorities, the total percentage of minority directors among the largest 200 S&P 500 companies held steady at 15%, and the percentage of the top 200 companies with at least one minority director declined from 90% in 2005 to 86% in 2015.

spencer stuartpage 18
board composition
> Despite increased attention to the topic of board diversity, representation of Hispanic/Latino and Asian directors has not improved over the past five years.
– 8.6% of directors are African-American, compared with 9.6% in 2010. 75% of boards have at least one African-American director, a decline from 82% in 2010.
– 4.8% of directors are Hispanic/Latino, compared to 4.2% in 2010. 47% of boards today have at least one Hispanic/Latino director, up from 44% in 2010.
– 1.8% of directors are of Asian descent, versus 1.3%, and 18% of boards have one or more Asian directors, up from 15% in 2010.
few top 200 companieS leD BY minoritieS > Only eight (4%) of the top 200 S&P 500 companies are led by African-Americans, Hispanics/Latinos
or Asians, one less than in 2014. In 2010, five of the top 200 companies were led by minority CEOs.
> 26% of the directors for these eight companies are minorities. However, minority representation drops to 16% when the CEO is excluded. Minority directors represent 15% of directors of the top 200 companies with a non-minority CEO.
Top 200 Minority-Led Companies and Their Boards*
Company CEO Total directors Minority directors Minority directors as % of total
AbbVie Richard A. Gonzalez 9 1 11%
The AES Corporation Andres R. Gluski 10 2 20%
American Express Company Kenneth I. Chenault 12 3 25%
Archer-Daniels-Midland Company Juan R. Luciano 13 5 38%
Carnival Corporation Arnold W. Donald 9 1 11%
Express Scripts Holding Co. George Paz 12 4 33%
Merck & Co. Kenneth C. Frazier 12 3 25%
Xerox Corporation Ursula M. Burns 9 3 33%
Average % of minority directors for companies with minority CEOs 26%**
Average % of minority directors for companies with non-minority CEOs 15%
*Accurate as of each company’s most recent proxy released by May 15, 2015. **Excluding the CEO, the average is 16%.
Top 200 Boards with at Least One Minority DirectorMinorities as % of Directors at Top 200 Boards
2015
2010
All minorities combined
African-American
Hispanic/Latino
Asian
86% 89% 75% 82% 47% 44% 18% 15%
All non-minorities76%
African-American9%
Hispanic/Latino5%
Asian2%
Non-U.S.8%

board index 2015 page 19
fewer than 10% of DirectorS have international BackgrounDS > A total of 191 directors of non-U.S. origin serve on the boards of the top 200 S&P 500 companies,
accounting for 8% of all directors, consistent with the past five years. For the purposes of this report, directors of Indian descent are included within the non-U.S. group.
> More than half of the top 200 S&P 500 companies, 55%, have at least one non-U.S. director, a figure which also has held steady since 2010.
> International directors represent 29 different countries, but the majority of non-U.S. directors, 61%, come from the following five countries: India (18%), the U.K. (14%), Canada (11%), France (9%) and Germany (9%).
> Among the S&P 500, 9% of all new independent directors are from outside the U.S., a decrease from 12% last year.
onlY 43% of ceoS Serve on an outSiDe puBlic companY BoarD, a new low > The number of CEOs who accept outside board assignments continues to decline. 57% of S&P 500
CEOs today do not serve on a public company board other than their own, compared with 54% last year and 44% in 2005.
> 36% of CEOs serve on one outside board, and 6% serve on two. 1% of CEOs have three outside board assignments. As a comparison, in 2005, 30% of CEOs sat on one board, 18% served on two outside boards and 7% (30) served on three. Another seven CEOs served on four outside boards.
Spencer Stuart Governance Survey: CEO succession planning > More than three-quarters of respondents, 78%, formally discuss CEO succession annually,
while 15% discuss succession two or three times a year. 7% report that the board addresses succession four or more times per year.
> 73% have a CEO succession plan for both emergency transition needs as well as a long-term planned succession. 25% have an emergency succession plan only. One company has only a long-term plan and one company has no CEO succession plan in place.
Getting to know internal candidates > 71% of respondents said their boards have a formal process for reviewing internal succession
candidates. 51% report that their succession process includes gaining insight on potential external candidates.
> Nearly all boards (98%) rely on regular interactions during board meetings and presentations to get to know internal succession candidates. 20% schedule meetings between board members and candidates, and 17% of respondents said boards get to know internal candidates through director site visits. Only 4% of survey respondents said directors have formal mentor roles with prospective CEO candidates. Others reported that the board gets to know succession candidates through informal board dinners and detailed reviews of candidates’ performance and skill-sets.
added perspective

spencer stuartpage 20
board composition
29% of BoarDS have a trulY inDepenDent chair, the higheSt Since we Began tracking the Data
> The number of S&P 500 boards that split the chair and CEO roles between two individuals grew modestly over 2014, from 47% to 48%. During the past decade, however, the trend has been more pronounced. 40% of S&P 500 boards in 2010 and 29% in 2005 split the roles.
> 29% of boards (139) now have a truly independent chair — an independent director or a former execu-tive who has met the applicable NYSE or NASDAQ rules for independence over time — compared with 28% last year and 9% in 2005. Nine of the indepen-dent chairs are founders or former CEOs or COOs who met indepen-dence standards over time.
> 14% of chairs are executives other than the CEO and 4% had been the CEO and are no longer a company executive.
> While more boards have moved to separate the chair and CEO roles, few have established policies formalizing the practice. Only 21 boards, 4% of the S&P 500, have formal policies requiring separation of the roles, although this represents a modest increase from 3% in 2014 and 1% in 2010.
> Among the 92 boards where the chair is separate but not independent, 87 (95%) have identified a lead or presiding independent director.
retireD Senior executiveS moSt likelY to Serve aS inDepenDent chair > 53% of the 139 independent chairs of S&P 500 companies are retired CEOs, chairmen, presidents or COOs.
Only 5% of independent chairs are active executives in these roles, including one current public-company CEO. In 2010, 48% of chairs were retired senior executives and 11% were active.
> 14% of the independent chairs are investors or investment managers, and another 13% are other corporate executives, active or retired, including division presidents and line and functional leaders.
Chairman’s Relationship with the Company
Current CEO
Independent director
Former CEO or current executive
Outside related director
52%
29%
18%
1%
Spencer Stuart Governance Survey: The chairman and CEO split > 34% of survey respondents said their board has recently separated the roles of chairman
and CEO.
> 19% of respondents expect their boards to consider splitting the roles within the next five years.
> Of those that have recently separated or expect to consider separating the chair and CEO roles, the most common reasons are a CEO transition and the belief that separating the roles represents the best governance model, each cited by 43% of respondents.
added perspective

board index 2015 page 21
> Academics, nonprofit executives, bankers/financial executives, and others make up the remaining independent chairs.
> Independent chairmen are older on average than their fellow directors: 66.6 versus 63.1.
> Independent chairmen serving today have been in the role for an average of 4.2 years. 54% have been in the role for three years or less, including 30% who have served as chair for one year or less. On the other end of the spectrum, 30% of independent chairmen have served in their roles for six or more years. The longest-serving S&P 500 independent chairman has been in the position for 18 years.
> 86% of the independent chairmen previously served as directors on the board before becoming chair, serving 8.1 years on average before moving into the chairman role.
Independent Chairman Tenure by Years
Average: 4.2 yearsN = 139 independent chairmen
0 to 130%
2 to 324%
4 to 516%
6 to 922%
10 or more8%
Independent Chairman Backgrounds
Retired CEO/chair/president/COO 53%
Investor/investment manager 14%
Active/retired other corporate executive 13%
Active CEO/chair/president/COO 5%
Banker/financial executive/CFO/public accounting9%
Academic/nonprofit executive1%
Other5%

spencer stuartpage 22
Spencer Stuart Governance Survey: Shareholder engagement > 42% of survey respondents reported that the board or management was formally contacted
by the company’s large institutional shareholders or largest shareholders specifically regarding a governance-related topic.
> Proxy access emerged as the top issue formally raised by shareholders during the most recent proxy year, accounting for 22% of shareholder contacts, followed by inquiries about companies’ political contributions and activities (18%).
> Board composition also was on the minds of shareholders. Board composition and refreshment accounted for 14% of shareholder contacts, and another 13% were related to director tenure. Director nominations accounted for 11% of contacts.
> Meanwhile, compensation declined as an issue for shareholders versus the previous year. 10% of formal investor inquiries were related to Say on Pay and 5% were related to CEO compensation, compared with 20% and 16%, respectively, in our 2014 report.
> Public and private pension funds were the most likely to initiate contact with boards, survey respondents reported. Accounting for 51% of the inquiries, pension funds were most likely to contact boards about proxy access, political contributions and activity, director tenure and board composition and refreshment.
> Activist shareholders accounted for 17% of the inquiries. Top issues for activist investors were companies’ political contributions/activities, director nominations and board chair independence.
> Inquiries from mutual funds, which represented 16% of shareholder contacts, tended to be about board composition and refreshment, Say on Pay, proxy access and political contributions/activity.
> 70% of survey respondents said management or the board proactively reached out to the company’s large institutional investors or largest shareholders, an increase from 62% the year prior. The most common topic about which companies engaged with shareholders was Say on Pay (45%), followed by board composition and refreshment (34%), proxy access (33%), CEO compensation (33%) and director tenure (29%). Other topics included the director slate (18%) and chairman independence (15%).
Issues Formally Raised by Shareholders
Proxy access 22%
Disclosure of political contributions/activities 18%
Board composition and refreshment 14%
Director tenure 13%
Director nominations 11%
Say on Pay 10%
Independent board chair 9%
CEO compensation 5%
Sources of Shareholder Contacts
Public/private pension fund 51%
Activist shareholder 17%
Mutual fund 16%
Hedge fund/private equity 5%
Other 11%
added perspective

board index 2015 page 23
> Survey respondents also wrote in more than a dozen additional topics, including company strategy, shareholder engage-ment, general governance overview and written consent rights (which enable share-holders to take action on important issues that arise between annual meetings).
> Despite the growing interest by shareholders in board composition, only 7% of survey respondents reported that their companies’ large institutional shareholders recom-mended changes to board composition.
> The CEO is responsible for representing the board in non-routine matters with the public and investors for most companies responding to the survey. 43% said the chairman/CEO had the responsibility for representing the board and 35% said the CEO had the responsibility when there was a separate chair. Another 35% said the lead director represented the board with investors and the public.
Responsible for Representing the Board in Non-routine Matters with the Public/Investors*
Chairman/CEO (if combined) 43%
CEO (if split) 35%
Lead director 35%
Chairman (if split) 23%
Other 23%
* Multiple answers allowed. Others included CFO, chairs of the governance and compensation committees and the head of investor relations.
added perspective
leaD or preSiDing Director continueS to Be preferreD inDepenDent BoarD leaDerShip Structure
> 98% of S&P 500 boards without an independent chairman report having a lead or presiding director, nearly all of whom (96%) are identified by name in the proxy. Today only 2% of boards rotate the role among independent directors and committee chairs compared to 7% of boards five years ago.
> The number of lead and presiding directors has increased slightly over the past decade as boards without an independent chairman have moved toward this model. 96% of S&P 500 boards had a lead or presiding director in 2010, up one percentage point from 95% in 2005.
> Among the 433 boards with one of these positions, 66% have lead directors and 34% have presiding directors, including those identified as “chair” of executive sessions. Ten years ago, among the boards that had a designated lead or presiding director, the reverse was true: 32% of boards had a lead director and 68% had a presiding director.
> 87 independent chairs are also identified as the lead or presiding director. Another seven boards report having an independent lead/presiding director in addition to the independent chair.
> Only eight S&P 500 boards do not report having a form of independent board leadership — neither an independent chairman nor a lead/presiding director. Often, this is a temporary situation during a leadership transition and restructuring.
Lead versus Presiding Directors
2015 2010 2005
Lead directors 66% 52% 32%
Presiding directors 34% 48% 68%

spencer stuartpage 24
board composition
> 325 boards disclosed how long their lead/presiding director has been serving in the role, reporting an average tenure of 3.8 years. 29% have served in the role one year or less, 39% have served for two to four years, while 32% have been serving for six years or more.
> Active CEOs, COOs, presidents and/or chairs are more likely to serve as lead or presiding directors than independent chairmen. Sitting senior executives account for 13% of lead/presiding directors but only 5% of independent chairs. 44% of lead/presiding directors are retired CEOs, chairmen, presidents and/or COOs, 12% are investors or investment managers, and 10% are active or retired other corporate executives.
Lead and Presiding Director Backgrounds*
N = 415 lead or presiding directors identified by name*All active and retired unless where specifically stated.
Retired CEO/chair/president/COO
Active CEO/chair/president/COO
Investor/investment manager
Other corporate executive
Academic/nonprofit executive
Financial executive/CFO/treasurer/public accounting executive
Banker/investment banker
Consultant/other
Lawyer
44%
13%
12%
10%
5%
5%
4%
4%
3%
Spencer Stuart Governance Survey: Lead director > 71% of survey respondents reported that the lead or presiding director is selected by the full
board. The lead or presiding director is chosen by the nominating and governance committee at 14% of responding companies and by independent directors at 12%.
> Among boards with a lead or presiding director, about half define some term length. Of those that do, 57% have a one-year term, 14% have a two-year term and 17% have a three-year term, according to survey respondents. Other approaches include a three-to-five-year term guideline, a five-year term or a minimum one-year commitment.
> 92% said the lead/presiding director’s term is renewable.
added perspective

board index 2015 page 25
Board Organization and Process
BoarDS average eight meetingS annuallY > Boards met an average of 8.1 times, the same as last
year and down modestly from 8.6 five years ago. The median number of meetings is seven, compared with eight five years ago. This included in-person and tele-phonic regular and special meetings.
> The majority of boards, 54%, met six to nine times. Eight boards met 19 times or more.
of boards meetsix to ninetimes annually54%
71%of boards havemore than the threeNYSE-mandated committees
1/3of boards conduct an evaluationof the full board and directors
2015 snapshot
Only 7% of audit committee chairs areactive CEOs and chairs versus 21% a decade ago
13 or more9%
10 to 1217%
6 to 954%
5 or fewermeetings
20%
Distribution of Board Meetings*
*Includes in-person and telephonic regular and special meetings.

spencer stuartpage 26
board organization and process
moSt BoarDS have at leaSt four committeeS > S&P 500 boards have an average of 4.3 standing committees and a median of four committees, which
has remained consistent during the past decade.
> A majority of boards, 71%, have more than the three NYSE-mandated committees (compensation/HR, audit and nominating/governance). 14% have six or more standing committees.
> The most common committees beyond the compensation, audit and nominating committees are the executive committee (34%) and finance committee (31%).
> Among proxies that addressed cybersecurity, typically the audit committee is responsible for managing risks related to technology. There has not been any discernible increase in boards with technology committees; however, 12% of boards now have a standalone risk committee compared with 9% last year.
Prevalence and Independence of Standing Committees
% with this committee % composed entirely of independent directors
2015 2010 2015 2010
Audit 100% 100% 100% 100%
Compensation/HR 100%* 100% 100% 99%
Nominating/governance 99%** 99% 100% 99%
Executive 34% 36% 3% 3%
Finance 31% 33% 83% 67%
Risk 12% 4% 81% 65%
Public policy/social & corporate responsibility 10% 14% 84% 81%
Science & technology 9% 6% 83% 74%
Environment, health & safety 8% 5% 90% 83%
Legal/compliance 5% 4% 91% 89%
Strategy & planning 3% 3% 50% 71%
Investment/pension 3% 2% 75% 67%
Acquisitions/corporate development 1% 2% 71% 44%
*13 boards have a combined compensation and nominating committee. They are counted as separate committees for the purpose of this analysis.** Includes two boards that have standing corporate governance committees in addition to their nominating committees. Controlled companies are not
required to have nominating committees; there are 14 controlled companies this year.
auDit Still the moSt time-conSuming committee > Audit committees averaged 8.8 meetings a year, almost twice as many as the nominating committee (4.6)
and roughly a third more often than the compensation committee (6.1).
> 70% of S&P 500 audit committees met eight or more times annually, including 48% that had eight, nine or 10 meetings. 22% of audit committees met 11 times or more, compared with 25% in 2010 and 35% in 2005.
Number of Standing Committees
3 or fewer
4
5
6
7 or more
29%
34%
23%
11%
3%

board index 2015 page 27
> 61% of compensation committees held four, five or six meetings annually.
> 77% of nominating/governance committees met five times or fewer annually, with one-third meeting four times.
Distribution of Committee Meetings*
Audit committee Compensation committee Nominating/governance committee
3 or fewer meetings 0% 5% 20%
4 4% 14% 33%
5 10% 23% 24%
6 7% 24% 14%
7 9% 13% 6%
8-10 48% 19% 3%
11-13 17% 2% 0%
14 or more 5% 0% 0%
Average 8.8 6.1 4.6
Median 9.0 6.0 4.0
Maximum 21 20 12
*Includes in-person and telephonic regular and special meetings.
retireD executiveS anD finance profeSSionalS leaD moSt auDit committeeS > Audit committee chairmen are most likely to be retired CEOs, chairs, presidents and COOs or active/
retired financial executives. These two sources account for 54% of audit committee chairs. Retired public accounting executives are the next largest source, representing 13% of audit committee chairs.
Spencer Stuart Governance Survey: Cybersecurity > Major information security breaches to business or government systems hit the news reg-
ularly, and boards increasingly recognize that cyber crime is a risk management issue that affects the entire organization and belongs on the board agenda.
> 69% of survey respondents said the board has assigned cybersecurity oversight to a specific board committee. Of those, 76% said the audit committee oversees cybersecurity risk, and 14% said the risk committee is responsible.
> 89% of boards surveyed have discussed the company’s response plan for a major infor-mation security breach in the past year. A majority of companies, 64%, have insurance that covers cyber risk.
> In those cases where companies have not purchased insurance, 94% of respondents report directors don’t have exposure.
added perspective

spencer stuartpage 28
board organization and process
> Reflecting the increased workload and demands of audit committee service, active CEOs, chairs, presidents and COOs are much less likely to head an audit committee than in the past. Just 7% of S&P 500 audit committee chairs are fully employed/active CEOs, chairs, presidents and COOs, compared with 21% a decade ago.
> 23% of all S&P 500 directors have been identified as audit committee financial experts.
committee leaDerShip roleS moSt likelY to Be filleD BY retireD male top executiveS > Retired CEOs, chairs, presidents and COOs are the most common backgrounds of compensation and
nominating/governance committee chairs; 42% of compensation chairs and 31% of nominating/governance committee chairs are retired top senior executives.
> CEOs and active top senior executives are more likely to serve as chair of the compensation and nominating/governance committees than the audit committee. 17% of directors with these profiles serve as compensation committee chair, and 16% as nominating/governance committee chair. Five years ago, 20% of compensation committee chairs and 15% of nominating/governance committee chairs were filled by active CEOs, chairs, presidents and COOs.
> Women now represent 20% of all directors, but the rate of women holding committee leadership roles is lower; 16% of nominating committees are chaired by a female director, 13% of audit committees and 10% of compensation committees.
Committee Chairman Backgrounds*
% of chairmen
Audit committee
Compensation committee
Nominating/governance committee
Retired CEO/chair/president/COO 27% 42% 31%
Active CEO/chair/president/COO 7% 17% 16%
Financial executive/CFO/treasurer 27% 1% 3%
Public accounting executive 13% 1% 1%
Investor/investment manager 6% 9% 11%
Other corporate executive 7% 15% 13%
Academic/nonprofit 4% 5% 10%
Consultant 3% 4% 4%
Banker/investment banker 5% 3% 4%
Lawyer 1% 1% 5%
Other 1% 2% 2%
Total number of chairmen listed in proxies 476 478 472
*Except where noted, all categories include active and retired executives.

board index 2015 page 29
all But 2% of BoarDS report conDucting an annual performance evaluation > Only eight S&P 500 boards, 2%, do not report whether they conduct some sort of annual evaluation.
> Half of boards, 52%, evaluate the full board and committees, and one-third evaluate the full board, com-mittees and individual directors annually. This represents an increase from 2010, when 24% examined the performance of the board, committees and individual directors as part of their annual evaluations.
> Four boards disclosed they had engaged an independent third-party to facilitate and conduct all or a por-tion of the board evaluation process.
Board, Committee and Director Evaluations
N = 478 companies; 8 others did not mention evaluations in their proxies or corporate governance guidelines
Full board and committees
Full board, committees and directors
Full board only
Full board and directors
52%
33%
10%
5%
Spencer Stuart Governance Survey: Board evaluations > 40% of survey respondents report that they assess the full board, board committees and
individual directors as part of a board evaluation. 61% evaluate the full board and committees, but not individual directors. 14% said only an evaluation of the full board is conducted. Respondents could select multiple responses.
> Evaluations are most often conducted by a director, typically the chairman, lead director or a committee chair, according to 66% of respondents. A wide range of internal and external parties also are tapped to conduct board assessments, including in-house and external legal counsel, the corporate secretary and board consulting firms. Several respondents said their board uses director self-assessments.
added perspective

spencer stuartpage 30
Director Compensation
all-in annual Director compenSation growS BY 5% > The average total compensation for S&P 500 directors is $277,237, 5% higher than the 2014 average.
When compensation for the independent chairman is excluded, the average total compensation per director falls to $272,497.
> Stock grants and options represent the largest share of director compensation, 54% and 5%, respectively. In 2010, stock grants represented 43% of director compensation and options accounted for 14%.
> Cash payments represent 38% of total compensation, down slightly from 40% in 2014.
> 73% of boards have deferred compensation plans.
Average per-directorcompensation rose 5%
of S&P 500 boards provide stock grants todirectors in addition to paying a cash retainer77%
Additional compensation forindependent chairmen averages $168,780
Director compensation for thehealthcare sector averages
24% higherthan the S&P 500 average
2015 snapshot
grew by 4%Annual retainers
over last year
to

board index 2015 page 31
Breakdown of Director Compensation*
* Based on non-employee director compensation tables in 486 proxies for 2015. Includes all board and committee retainers and meeting fees, non-executive chairman and lead/presiding director supplemental fees when applicable, the value of equity compensation and all other compensation paid to non-employee directors in 2014. Retiring and new directors are included when paid compensation for at least three quarters of the year.
**Includes deferred compensation amounts.***Includes, for example, insurance premiums, charitable award programs and incremental cost to company of products provided.
Changes in Non-employee Director Compensation
% of boards paying this type Average paid % of change in value
Type of compensation 2015 2010 2015 2010 2010-15
Board retainer* 99.6% 99.6% $112,144 $79,888 40%
Board meeting fee 21% 41% $2,041 $2,186 -7%
Committee chair retainer 95% 90% $14,399 $11,692 23%
Committee member retainer 41% 37% $8,926 $7,917 13%
Committee member meeting fee 26% 44% $1,678 $1,620 4%
Stock option program 16% 33% n/a n/a n/a
Stock grants paid in addition to retainer 77% 79% n/a n/a n/a
*Dollar amounts for retainer do not include boards that do not pay a retainer or boards that do not provide a dollar value equivalent for the retainer equity amount.
annual BoarD retainerS have nearlY DouBleD in 10 YearS > The average annual retainer for S&P 500 directors is $112,144, 98% more than the 2005 average
retainer of $56,550. During the past decade, one-year increases have ranged from as little as 1% to as much as 14%. The average annual retainer increased 4% from last year’s average of $107,383.
> The median annual retainer is now $90,000, up from $65,000 five years ago and $50,000 in 2005.
> 45% of boards provide an annual retainer of $100,000 or more, up from 23% in 2010 and just 10% in 2005. Three boards pay a retainer of $300,000 or more (paid partly in equity), but do not provide meeting attendance fees.
> 5% of boards today have retainers less than $50,000, compared with 18% five years ago and 45% 10 years ago. Two companies provide no retainer; one of these pays $900 per meeting and the other, a $15,000 per-meeting fee (not to exceed $60,000 per year).
Stock awards
Options grants
Cash fees**
All other compensation***
54%
5%
38%
3%

spencer stuartpage 32
director compensation
Annual Board Retainers and Yearly Increases
uSe of meeting attenDance feeS continueS to Decline > Only 21% of S&P 500 boards today pay board meeting attendance fees, down from 25% last year and
62% in 2005.
> The average board meeting attendance fee declined 8% from last year to $2,041. Fees range from a low of $900 to a high of $15,000 at one company, where meeting fees are paid in lieu of a retainer and capped at $60,000 per year. 39% of companies pay $1,500 per meeting, 30% pay $2,000 and 19% pay more than $2,000.
> Among the 103 boards that compensate directors for board meetings, 27 boards (6%) pay a lower fee for telephonic meetings. The average telephonic meeting fee is $1,097, 8% less than last year and 5% less than in 2010. Four boards only pay a telephonic meeting fee.
> Among the boards that pay meeting fees, 25 boards pay a fee averaging $2,118 only for meetings in excess of regularly scheduled board meetings. Eleven other boards pay only for attendance at special board meetings. The average special board meeting fee is $1,955.
three-quarterS of BoarDS incluDe Stock grantS in Director compenSation > 77% of S&P 500 boards provide stock grants to directors in addition to paying a cash retainer, compared
with 60% a decade ago. The average targeted dollar value of annual stock grants is $148,608.
> By comparison, stock options for directors have become much less common. 16% of S&P 500 companies now offer option plans, compared with 56% in 2005. The average targeted value of annual stock option grants is $89,188.
> More than half of boards, 54%, allow directors to choose to receive their compensation in cash, stock or stock units, but only 3% offer stock options as an alternative choice.
> Nine boards, 2% of the total, pay director retainers fully in stock.
> 90% of boards disclose having share ownership guidelines for directors, which are meant to align directors’ interests with those of stockholders. Typically, these guidelines require directors to own a certain number of shares or a multiple of the retainer value within a specified number of years.
0
$20,000
$40,000
$60,000
$80,000
$100,000
$120,000
4%
2015
5%
2014
6%
2013
9%
2012
11%
2011
5%
2010
1%
2009
9%
2008
8%
2007
12%
2006
14%
2005
2015 annual board retainerPast years annual board retainerYearly percentage increase

board index 2015 page 33
Equity Compensation% of S&P 500 boards providing
2015 2010 2005
Stock option program exists 16% 33% 56%
Equity paid in addition to retainer 77% 79% 60%
Equity paid as a part of retainer 21% 17% 24%
Director can elect to receive compensation in cash, stock or stock units 54% 59% 61%
Director can elect to receive compensation in stock options 3% 6% 9%
Retainer paid fully in stock 2% 2% 2%
premium paiD to DirectorS in BoarD leaDerShip roleS > 96% of the 139 independent chairmen of S&P 500 boards receive an additional fee, which ranges from $20,000
to $822,290 and averages $168,780. The median premium paid to independent chairmen is $150,000.
> 62% of the 433 S&P 500 boards with a lead or presiding director provide additional compensation to directors serving in those roles, compared with 44% of boards five years ago.
> Lead directors are more likely than presiding directors to receive additional compensation: 53% versus 9%. The average lead director premium is $33,273, 45% more than the $22,961 average premium for presiding directors.
> Supplemental compensation for lead and presiding directors ranges from a minimum of $5,000 to a maximum of $210,000 and averages $31,626.
nearlY all BoarDS proviDe aDDitional compenSation to committee chairS > 95% of S&P 500 boards included in our study provide a retainer to committee chairmen, an increase
from 90% in 2010 and 83% in 2005. Among these boards, 88% pay a larger retainer to the audit committee chair, and 57% pay more to the compensation committee chair.
> The average retainer for all committee chairs is $14,399, a 2% increase from last year’s average of $14,110. The retainers for audit and compensation committee chairs are higher, averaging $24,125 and $19,972, respectively.
> The lowest committee chair retainer is $3,000, while the highest committee chair retainer — paid to an audit chair — is $75,000.

spencer stuartpage 34
director compensation
more DirectorS receive premiumS for compenSation committee Service > 41% of boards pay a retainer for committee member service, averaging $8,926. This represents a 6%
increase over last year’s average.
> 88% provide a different retainer for audit committee service, which averages $12,426.
> 37% of boards now provide a higher premium for compensation committee service, an increase from 23% in 2010 and 10% in 2005. The average compensation committee member retainer is $11,777.
Committee Retainers
Average committee retainers % of boards paying this type
2015 2010 2015 2010
All committee members $8,926 $7,822 41% 37%
Compensation committee members $11,777 $10,445 37% 23%
Audit committee members $12,426 $11,157 88% 86%
All committee chairs $14,399 $11,692 95% 90%
Compensation committee chairs $19,972 $16,547 57% 34%
Audit committee chairs $24,125 $20,300 88% 84%
one-quarter of BoarDS paY committee meeting feeS > Like board meeting attendance fees, use of committee meeting fees as a component of director com-
pensation is declining. 26% of S&P 500 boards pay committee meeting fees, down from 44% in 2010 and 61% in 2005. The average committee meeting fee is $1,678, a slight decrease from last year.
> 14% of the 126 boards that provide committee meeting fees pay a higher amount for audit committee meetings. The $2,553 average audit committee meeting fee is 52% higher than the average for all committees. Just four companies pay a higher meeting fee for compensation committee meetings, averaging $2,250.
> 24% of the boards providing committee meeting fees pay a different amount for telephonic meetings, which averages $907. One board pays a higher fee for telephonic audit committee meetings, at $1,000.
> Only six boards (1%) pay meeting fees to committee chairs, compared with 12% 10 years ago. The average chair committee meeting fee is $2,530.
Special committee Service garnerS incremental compenSation > Eight boards (2%) reported providing additional compensation to directors serving on a special
committee. Supplemental retainers for service on special committees provided to chairmen and members ranged in amounts from $10,000 to $22,500.
> Among boards that disclosed the special committee purpose, reasons included CEO search or succession planning (three boards), addressing shareholder demands (one board) and overseeing equity investments (one board).

board index 2015 page 35
Director compenSation higheSt in the healthcare Sector > Director compensation for the healthcare sector averages $342,813, 24% higher than the S&P 500 average
and 44% higher than the utility sector average, which has the lowest compensation of all sectors.
> The sectors at the lower end of the compensation spectrum tend to rely more heavily on cash fees for director compensation than others. Cash fees represent 47% of director compensation for utility companies, but just 31% in the information technology sector and 33% for healthcare.
> Stock awards account for 60% of director compensation among information technology companies, 6% more than the S&P 500 average. By comparison, stock awards represent less than half of director compensation in the materials and healthcare sectors.
Average Compensation per Non-Employee Director by Industry*
% of total compensation
Industry Total average compensation Cash fees** Stock awards Option grants All other
compensation***
Consumer discretionary $254,197 39% 53% 5% 3%
Consumer staples $278,663 38% 58% 2% 2%
Energy $319,619 35% 59% 3% 3%
Financials $249,232 42% 53% 2% 3%
Healthcare $342,813 33% 49% 16% 2%
Industrials $259,356 44% 51% 3% 2%
Information technology $311,656 31% 60% 8% 1%
Materials $261,457 43% 48% 5% 4%
Telecommunication services $271,358 44% 54% 0% 2%
Utilities $237,756 47% 50% 0% 3%
Average $277,237 38% 54% 5% 3%
* Based on non-employee director compensation tables in 486 proxies for 2015. Includes all board and committee retainers and meeting fees, non-executive chairman and lead/presiding director supplemental fees when applicable, the value of equity compensation and all other compensation paid to non-employee directors in fiscal year 2014. Retiring and new directors are included when paid compensation for at least three quarters of the year.
** Includes deferred compensation amounts.***Includes insurance premiums, charitable award programs and the incremental cost to the company of products provided to directors.
Director compenSation gainS the moSt in the northeaSt > The largest one-year increase across regions was 7% for Northeast boards, bringing average director
compensation to $285,403. Boards in the Northwest region had the smallest increase in average director compensation, rising 2% to $261,076.
> Average director compensation for companies in the West, already the region with the highest director compensation, rose 3% to $302,539.
> Average director compensation in the Southwest region rose 4% to $295,202.
> The spread between the highest- and lowest-paying regions has decreased since last year. This year the difference between the regions with the highest and lowest average director compensation was $51,468, compared with $54,798 in 2014, $39,050 in 2013 and $68,661 in 2012.
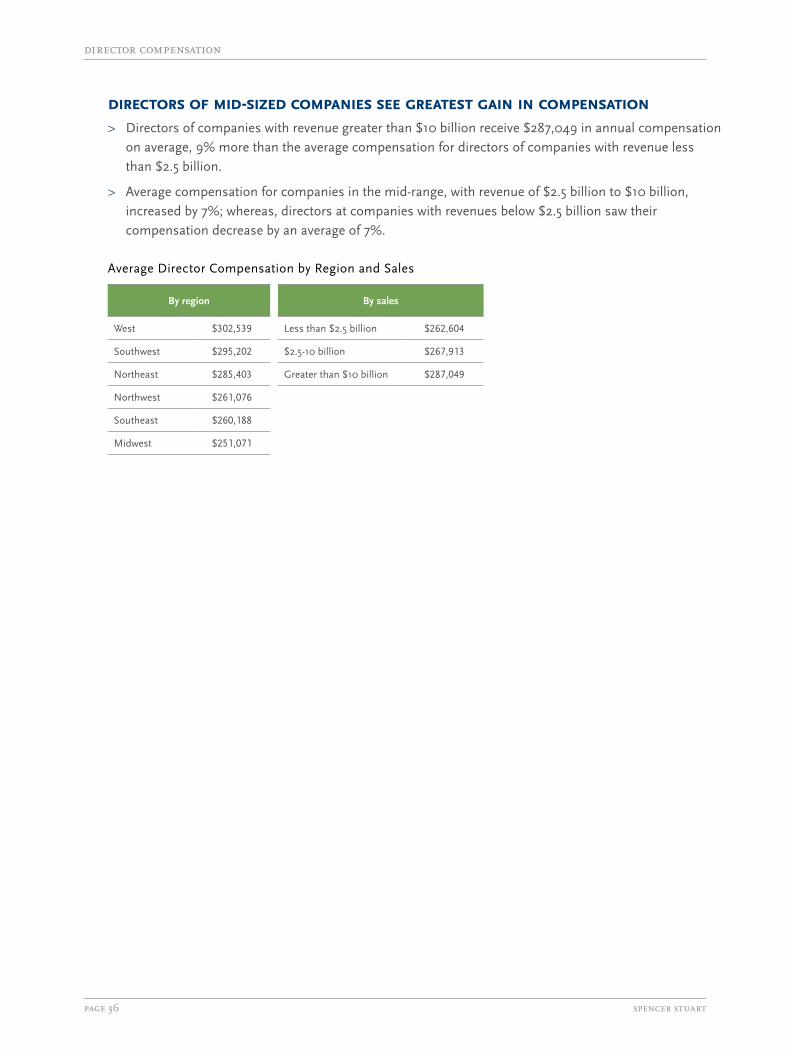
spencer stuartpage 36
director compensation
DirectorS of miD-SizeD companieS See greateSt gain in compenSation > Directors of companies with revenue greater than $10 billion receive $287,049 in annual compensation
on average, 9% more than the average compensation for directors of companies with revenue less than $2.5 billion.
> Average compensation for companies in the mid-range, with revenue of $2.5 billion to $10 billion, increased by 7%; whereas, directors at companies with revenues below $2.5 billion saw their compensation decrease by an average of 7%.
Average Director Compensation by Region and Sales
By region By sales
West $302,539 Less than $2.5 billion $262,604
Southwest $295,202 $2.5-10 billion $267,913
Northeast $285,403 Greater than $10 billion $287,049
Northwest $261,076
Southeast $260,188
Midwest $251,071

board index 2015 page 37
Methodology:Based on the S&P 500 as of May 15, 2015. Company sales data obtained from Hoovers as of May 18, 2015. Industry/sector categoriesobtained from Capital IQ. All remaining data were culled from the most recent proxies released between May 20, 2014, and May 15, 2015.Total average compensation per non-employee director is based on non-employee director compensation tables included in 486 proxies.The number includes all board and committee retainers and meeting fees, supplemental non-executive chairman and lead/presiding director fees, the value of equity compensation, and all other compensation paid in 2014. Retiring and new non-employee directorsare included when they received paid compensation for at least three-quarters of fiscal year 2014.
Comparative Board Data

spencer stuartpage 38
com
pany sales
($ in m
illion
s)
total
ind
epend
ent
directo
rs
average ag
e
retiremen
t age
meetin
gs per year a
meetin
g
attendan
ce fee
ann
ual bo
ard fees b
cash
stock
optio
ns
all oth
er
board retain
er
average co
mpen
sation
per no
n-em
ployee
director
number of directors
independent directors
board fees ($) percentage of total compensation
Comparative Board Data
conSumer DiScretionarY
AdvertisingThe Interpublic Group of Companies 7,537.1 10 9 63 74 13 100,000 c - 100,000 277,013 40% 54% 0% 6%
Omnicom Group 15,317.8 13 11 71 - 13 75,000 c,d 2,000 101,000 264,182 53% 47% 0% 0%
Apparel RetailThe Gap 16,435.0 10 9 61 72 6 75,000 c - 75,000 243,331 40% 56% 0% 4%
L Brands 11,454.0 12 8 70 - 7 223,800 e - 223,800 233,211 52% 48% 0% 0%
Ross Stores 11,041.7 11 7 60 - 7 185,000 e 1,500 195,500 226,315 37% 63% 0% 0%
The TJX Companies 29,078.4 10 9 62 75 7 75,000 c 1,500 85,500 268,328 40% 60% 0% 0%
Urban Outfitters 3,323.1 8 6 63 - 4 100,000 f - 100,000 240,400 42% 0% 58% 0%
Apparel, Accessories & Luxury GoodsCoach 4,806.2 8 7 53 - 6 75,000 c,d,f - 75,000 237,906 36% 32% 32% 0%
Fossil 3,509.7 11 8 61 - 4 60,000 c - 60,000 201,257 40% 60% 0% 0%
Hanesbrands 5,324.7 11 10 64 72 6 90,000 c - 90,000 226,929 45% 55% 0% 0%
Michael Kors Holdings Limited 3,310.8 9 5 65 - 4 60,000 c 1,500 66,000 229,000 34% 66% 0% 0%
PVH Corporation 8,241.2 11 9 57 72 6 70,000 c - 70,000 227,472 41% 59% 0% 0%
Ralph Lauren Corporation 7,450.0 12 9 69 - 4 60,000 c,f - 60,000 180,758 45% 27% 28% 0%
Under Armour 3,084.4 10 8 62 75 10 75,000 c,d - 75,000 142,143 47% 53% 0% 0%
V.F. Corporation 12,282.2 11 10 60 72 6 60,000 c,d,f 1,500 69,000 230,815 40% 29% 30% 1%
Auto Parts & EquipmentBorgWarner 8,305.1 11 10 66 72 4 80,000 c 1,500 86,000 228,693 50% 50% 0% 0%
Delphi Automotive 17,023.0 11 10 66 75 8 250,000 d,e - 250,000 280,556 40% 60% 0% 0%
Johnson Controls 42,828.0 10 9 61 72 9 265,000 d,e - 265,000 254,309 48% 52% 0% 0%
Automobile ManufacturersFord Motor Company 144,077.0 15 12 62 72 9 250,000 d,e,g - 250,000 290,450 37% 52% 0% 11%
General Motors Company 155,929.0 12 9 63 72 11 250,000 d,e,g - 250,000 269,226 91% 0% 0% 9%
Automotive RetailAutoNation 19,108.8 9 8 54 - 14 50,000 c - 50,000 335,767 20% 80% 0% 0%
AutoZone 9,475.3 11 10 59 75 4 200,000 e,h,i - 200,000 248,076 9% 91% 0% 0%
CarMax 12,574.3 11 10 63 76 7 205,000 e 1,500 215,500 238,590 43% 54% 0% 3%
O’Reilly Automotive 7,216.1 9 5 68 78 4 42,500 c 2,500 52,500 172,597 36% 64% 0% 0%
Broadcasting
CBS Corporation 13,806.0 14 9 74 - 7 100,000 c,d - 100,000 323,762 36% 62% 0% 2%
Discovery Communications 6,265.0 10 8 66 - 13 90,000 c,f - 90,000 222,508 46% 26% 26% 2%
Scripps Networks Interactive 2,665.5 12 11 58 72 7 50,000 c,d,f 2,500 67,500 237,454 36% 32% 32% 0%
Cable & SatelliteCablevision Systems Corporation 6,460.9 18 8 75 - 7 100,000 c 2,000 114,000 198,985 45% 55% 0% 0%
Comcast Corporation 68,775.0 12 9 65 72 12 100,000 c,d - 100,000 335,252 44% 56% 0% 0%

page 39 board index 2015
com
pany sales
($ in m
illion
s)
total
ind
epend
ent
directo
rs
average ag
e
retiremen
t age
meetin
gs per year a
meetin
g
attendan
ce fee
ann
ual bo
ard fees b
cash
stock
optio
ns
all oth
er
board retain
er
average co
mpen
sation
per no
n-em
ployee
director
number of directors
independent directors
board fees ($) percentage of total compensation
Computer & Electronics RetailBest Buy Co. 40,339.0 9 8 58 75 5 80,000 c,d - 80,000 277,221 32% 68% 0% 0%
GameStop Corporation 9,296.0 11 8 61 72 10 140,000 c - 140,000 350,350 40% 40% 0% 20%
Consumer ElectronicsGarmin 2,870.7 6 4 66 - 4 85,000 c - 85,000 166,500 40% 60% 0% 0%
Harman International Industries 5,348.5 9 8 67 75 8 80,000 c 1,500 92,000 230,081 46% 54% 0% 0%
Department StoresKohl’s Corporation 19,023.0 9 8 58 72 6 100,000 c - 100,000 228,010 56% 44% 0% 0%
Macy’s 28,105.0 13 12 61 74 8 70,000 c,d - 70,000 264,649 36% 53% 0% 11%
Nordstrom 13,506.0 13 10 60 72 6 85,000 c,d - 85,000 308,892 39% 59% 0% 2%
DistributorsGenuine Parts Company 15,341.6 12 9 64 72 4 60,000 c 1,500 66,000 244,461 29% 71% 0% 0%
FootwearNIKE 27,799.0 14 11 61 72 5 85,000 c - 85,000 222,517 39% 53% 0% 8%
General Merchandise StoresDollar General Corporation 18,909.6 8 7 58 76 16 85,000 c - 85,000 232,015 47% 21% 32% 0%
Dollar Tree 8,602.2 11 8 64 - 4 180,000 d,j - 180,000 191,500 97% 0% 0% 3%
Target Corporation 72,618.0 10 9 57 72 11 260,000 d,e - 260,000 306,068 30% 69% 0% 1%
Home Furnishing RetailBed Bath & Beyond 11,881.2 10 7 63 - 7 100,000 c,d - 100,000 202,917 56% 44% 0% 0%
Home FurnishingsLeggett & Platt 3,782.3 11 8 66 72 5 195,000 d,e - 195,000 298,428 24% 50% 0% 26%
Mohawk Industries 7,803.4 9 6 66 75 5 80,000 c,d - 80,000 181,685 48% 52% 0% 0%
Home Improvement RetailThe Home Depot 83,176.0 10 9 56 72 8 280,000 d,e,g - 280,000 297,300 21% 77% 0% 2%
Lowe’s Companies 56,223.0 11 10 63 72 6 80,000 c,d - 80,000 239,156 37% 63% 0% 0%
The Sherwin-Williams Company 11,129.5 10 9 61 72 4 110,000 c,d - 110,000 222,210 48% 52% 0% 0%
HomebuildingD.R. Horton 8,024.9 5 4 63 75 5 - c,f 15,000 k 60,000 130,447 55% 28% 17% 0%
Lennar Corporation 7,779.8 9 8 66 - 5 90,000 e,f - 90,000 230,365 37% 54% 7% 2%
PulteGroup 5,822.4 9 8 59 75 6 235,000 e - 235,000 250,625 44% 56% 0% 0%
Hotels, Resorts & Cruise LinesCarnival Corporation 15,884.0 9 7 64 75 6 110,000 c - 110,000 242,395 48% 49% 0% 3%
Marriott International 13,796.0 11 8 62 72 5 75,000 c,d - 75,000 217,888 39% 57% 0% 4%
Royal Caribbean Cruises Ltd. 8,073.9 11 10 62 - 6 80,000 c - 80,000 212,121 44% 55% 0% 1%
Starwood Hotels & Resorts Worldwide 5,983.0 10 9 62 72 6 80,000 c,e,h,i - 80,000 263,625 18% 74% 0% 8%
Wyndham Worldwide Corporation 5,281.0 7 6 65 75 4 210,000 c,d,e - 210,000 446,278 30% 46% 0% 24%

spencer stuartpage 40
com
pany sales
($ in m
illion
s)
total
ind
epend
ent
directo
rs
average ag
e
retiremen
t age
meetin
gs per year a
meetin
g
attendan
ce fee
ann
ual bo
ard fees b
cash
stock
optio
ns
all oth
er
board retain
er
average co
mpen
sation
per no
n-em
ployee
director
number of directors
independent directors
board fees ($) percentage of total compensation
Comparative Board Data
Household AppliancesWhirlpool Corporation 19,872.0 11 9 60 72 8 125,000 c - 125,000 273,061 46% 49% 0% 5%
Housewares & SpecialtiesNewell Rubbermaid 5,727.0 12 11 63 72 7 100,000 c - 100,000 247,715 50% 50% 0% 0%
Internet RetailAmazon.com 88,988.0 10 9 66 - 5 265,000 e,h - 265,000 265,000 0% 100% 0% 0%
Expedia 5,763.5 10 5 64 - 5 45,000 c,d - 45,000 319,953 22% 78% 0% 0%
NetFlix 5,504.7 9 8 56 - 5 - f,h,l -in options
100% 333,891 5% 0% 95% 0%
The Priceline Group 8,442.0 11 9 61 - 9 50,000 c - 50,000 336,360 22% 78% 0% 0%
TripAdvisor 1,246.0 9 6 46 - 8 50,000 c,d - 50,000 215,564 30% 70% 0% 0%
Leisure ProductsHasbro 4,277.2 11 10 59 72 12 85,000 c,d - 85,000 329,444 24% 56% 0% 20%
Mattel 6,023.8 10 9 59 72 6 100,000 c - 100,000 265,988 43% 49% 0% 8%
Motorcycle ManufacturersHarley-Davidson 6,228.5 11 9 65 75 5 100,000 c,d - 100,000 218,636 50% 50% 0% 0%
Movies & EntertainmentTime Warner 27,359.0 12 11 65 75 10 145,000 c,d,f - 145,000 289,292 50% 35% 15% 0%
Twenty-First Century Fox 31,867.0 12 7 54 - 8 250,000 e,g - 250,000 271,461 45% 55% 0% 0%
Viacom 13,783.0 12 7 62 - 7 100,000 c,d - 100,000 308,821 43% 57% 0% 0%
The Walt Disney Company 48,813.0 10 9 59 - 7 105,000 c,d - 105,000 293,141 41% 53% 0% 6%
PublishingGannett Co. 6,008.2 10 9 58 - 8 100,000 c,d - 100,000 198,169 32% 65% 0% 3%
News Corporation 8,574.0 12 7 51 - 8 225,000 e,g - 225,000 237,222 47% 53% 0% 0%
RestaurantsChipotle Mexican Grill 4,108.3 9 7 61 - 4 195,000 e 2,000 203,000 207,227 42% 58% 0% 0%
Darden Restaurants 6,285.6 12 11 59 73 14 85,000 c,d,j - 85,000 284,338 48% 42% 0% 10%
McDonald’s Corporation 27,441.3 13 12 65 - 8 100,000 c,d - 100,000 248,511 40% 56% 0% 4%
Starbucks Corporation 16,447.8 12 10 61 75 8 240,000 d,j - 240,000 235,704 5% 65% 30% 0%
Yum! Brands 13,279.0 12 9 59 72 6 170,000 c,e,f,h,i - 170,000 215,034 4% 78% 15% 3%
Specialized Consumer ServicesH&R Block 3,024.3 9 8 61 - 7 190,000 e,g 2,000 m 204,000 247,988 36% 63% 0% 1%
Specialty StoresStaples 22,492.4 11 10 58 72 9 75,000 c - 75,000 266,708 29% 71% 0% 0%
Tiffany & Co. 4,249.9 10 7 68 74 6 75,000 c,f - 75,000 267,626 32% 28% 28% 12%
Tractor Supply Co. 5,711.7 9 8 62 72 5 65,000 c - 65,000 178,786 50% 50% 0% 0%

page 41 board index 2015
com
pany sales
($ in m
illion
s)
total
ind
epend
ent
directo
rs
average ag
e
retiremen
t age
meetin
gs per year a
meetin
g
attendan
ce fee
ann
ual bo
ard fees b
cash
stock
optio
ns
all oth
er
board retain
er
average co
mpen
sation
per no
n-em
ployee
director
number of directors
independent directors
board fees ($) percentage of total compensation
Tires & RubberThe Goodyear Tire & Rubber Company 18,138.0 13 11 62 72 8 120,000 c,d - 120,000 261,506 51% 49% 0% 0%
TOTAL CONSUMER DISCRETIONARY
Average 10.6 8.5 61.9 73.2 7.1 121,662 122,891 254,197 39% 53% 5% 3%
Median 11.0 9.0 62.0 72.0 7.0 100,000 100,000 243,331
conSumer StapleS
Agricultural ProductsArcher-Daniels-Midland Company 81,201.0 13 11 60 72 7 275,000 d,e - 275,000 305,880 35% 65% 0% 0%
BrewersMolson Coors Brewing Company 4,146.3 13 8 59 - 5 100,000 c,d - 100,000 272,924 42% 46% 0% 12%
Distillers & VintnersBrown-Forman Corporation 2,991.0 12 6 60 71 8 175,000 d,e,g - 175,000 223,339 59% 41% 0% 0%
Constellation Brands 6,028.0 10 8 60 70 6 70,000 c,f 2,500 85,000 224,679 45% 32% 23% 0%
Drug RetailCVS Health Corporation 139,367.0 11 10 63 72 8 280,000 d,e - 280,000 327,849 27% 73% 0% 0%
Walgreens Boots Alliance 33,010.8 12 9 59 72 14 85,000 c,d - 85,000 326,537 37% 54% 0% 9%
Food DistributorsSysco Corporation 46,516.7 10 8 69 - 12 100,000 c,d - 100,000 337,771 44% 55% 0% 1%
Food RetailThe Kroger Co. 108,465.0 11 10 64 72 5 85,000 c - 85,000 266,829 38% 62% 0% 0%
Household ProductsThe Clorox Company 5,591.0 11 9 64 72 7 95,000 c,d - 95,000 228,593 45% 55% 0% 0%
Colgate-Palmolive Company 17,277.0 10 9 64 72 9 50,000 c,d,f,i - 50,000 280,717 23% 59% 16% 2%
Kimberly-Clark Corporation 19,724.0 11 10 63 72 6 100,000 c - 100,000 257,536 35% 63% 0% 2%
The Procter & Gamble Company 83,062.0 11 10 61 70 10 110,000 c,d - 110,000 293,222 40% 60% 0% 0%
Hypermarkets & Super CentersCostco Wholesale Corporation 112,640.0 14 8 72 - 4 30,000 c 1,000 34,000 313,693 12% 88% 0% 0%
Wal-Mart Stores 485,651.0 15 10 58 75 5 75,000 c,d - 75,000 286,317 37% 61% 0% 2%
Packaged Foods & MeatsCampbell Soup Company 8,268.0 14 13 64 72 6 225,000 d,e - 225,000 263,571 50% 50% 0% 0%
ConAgra Foods 17,702.6 12 11 65 72 8 85,000 c - 85,000 256,675 33% 64% 0% 3%
General Mills 17,909.6 13 12 67 74 6 75,000 c,d - 75,000 293,682 28% 61% 0% 11%
The Hershey Company 7,421.8 11 10 63 72 7 100,000 c,d - 100,000 266,800 48% 51% 0% 1%

spencer stuartpage 42
com
pany sales
($ in m
illion
s)
total
ind
epend
ent
directo
rs
average ag
e
retiremen
t age
meetin
gs per year a
meetin
g
attendan
ce fee
ann
ual bo
ard fees b
cash
stock
optio
ns
all oth
er
board retain
er
average co
mpen
sation
per no
n-em
ployee
director
number of directors
independent directors
board fees ($) percentage of total compensation
Comparative Board Data
Packaged Foods & Meats (continued)Hormel Foods Corporation 9,316.3 14 12 59 72 8 70,000 c,d - 70,000 257,428 34% 62% 0% 4%
The J.M. Smucker Company 5,610.6 13 8 62 72 4 80,000 c,d - 80,000 205,000 44% 56% 0% 0%
Kellogg Company 14,580.0 13 11 64 72 9 100,000 c,d - 100,000 261,599 41% 59% 0% 0%
Keurig Green Mountain 4,707.7 11 10 60 75 6 205,000 d,e 2,000 217,000 230,353 50% 50% 0% 0%
Kraft Foods Group 18,205.0 10 9 61 75 9 110,000 c - 110,000 254,931 47% 49% 0% 4%
McCormick & Company 4,243.2 9 8 59 72 8 75,000 c,f - 75,000 238,002 39% 41% 20% 0%
Mead Johnson Nutrition Company 4,409.3 13 10 62 75 9 100,000 c - 100,000 320,070 40% 60% 0% 0%
Mondelez International 34,244.0 12 11 65 75 12 110,000 c - 110,000 277,736 42% 54% 0% 4%
Tyson Foods 37,580.0 9 6 61 72 15 80,000 c,d - 80,000 225,469 45% 55% 0% 0%
Personal ProductsThe Estee Lauder Companies 10,968.8 15 9 61 - 6 150,000 c,e,f - 150,000 266,372 35% 28% 37% 0%
Soft DrinksThe Coca-Cola Company 45,998.0 15 13 64 74 5 250,000 d,e,g - 250,000 267,102 22% 75% 0% 3%
Coca-Cola Enterprises 8,264.0 12 11 61 72 5 230,000 d,e - 230,000 242,806 50% 49% 0% 1%
Dr Pepper Snapple Group 6,121.0 9 8 61 70 10 100,000 c - 100,000 236,250 41% 59% 0% 0%
PepsiCo 66,683.0 14 13 62 72 6 275,000 d,e - 275,000 284,667 41% 58% 0% 1%
TobaccoAltria Group 24,522.0 11 10 65 75 7 100,000 c,d - 100,000 312,180 40% 56% 0% 4%
Phillip Morris International 80,106.0 12 10 65 - 6 125,000 c,d - 125,000 339,688 48% 52% 0% 0%
Reynolds American 8,471.0 12 9 62 72 20 60,000 c,d 1,500 90,000 476,999 32% 67% 0% 1%
TOTAL CONSUMER STAPLES
Average 11.9 9.7 62.5 72.5 7.9 123,857 125,600 278,663 38% 58% 2% 2%
Median 12.0 10.0 61.9 72.0 7.0 100,000 100,000 266,829
energY
Coal & Consumable FuelsCONSOL Energy 3,726.8 11 8 63 75 8 120,000 c,d - 120,000 282,500 47% 53% 0% 0%
Integrated Oil & GasChevron Corporation 211,970.0 12 11 63 72 6 150,000 c,d,j - 150,000 397,611 35% 59% 4% 2%
Exxon Mobil Corporation 411,939.0 12 11 65 72 10 110,000 c - 110,000 363,240 31% 69% 0% 0%
Occidental Petroleum Corporation 21,947.0 10 9 64 75 6 125,000 c - 125,000 398,804 29% 68% 0% 3%
Oil & Gas DrillingDiamond Offshore Drilling 2,814.7 11 6 70 - 9 50,000 f 1,500 63,500 169,693 42% 25% 33% 0%
Ensco plc 4,564.5 9 8 63 70 6 100,000 c - 100,000 399,952 25% 68% 0% 7%

page 43 board index 2015
com
pany sales
($ in m
illion
s)
total
ind
epend
ent
directo
rs
average ag
e
retiremen
t age
meetin
gs per year a
meetin
g
attendan
ce fee
ann
ual bo
ard fees b
cash
stock
optio
ns
all oth
er
board retain
er
average co
mpen
sation
per no
n-em
ployee
director
number of directors
independent directors
board fees ($) percentage of total compensation
Helmerich & Payne 3,719.7 10 8 66 - 4 80,000 d,f - 80,000 236,607 37% 0% 63% 0%
Noble Corporation 3,232.5 8 7 58 72 5 50,000 c,d 2,500 62,500 336,584 31% 69% 0% 0%
Transocean Ltd. 9,174.0 11 10 59 72 8 100,000 c - 100,000 377,259 31% 56% 0% 13%
Oil & Gas Equipment & ServicesBaker Hughes 24,551.0 13 12 67 72 15 100,000 c,j - 100,000 295,877 40% 59% 0% 1%
Cameron International Corporation 10,381.0 11 9 62 72 7 50,000 c,d 2,500 67,500 337,675 26% 74% 0% 0%
FMC Technologies 7,942.6 12 11 65 73 6 60,000 c,d - 60,000 336,531 20% 79% 0% 1%
Halliburton Company 32,870.0 12 10 63 72 9 115,000 c,d - 115,000 408,312 29% 44% 0% 27%
National Oilwell Varco 21,440.0 9 8 62 72 6 75,000 c,f 1,500 84,000 274,588 36% 64% 0% 0%
Schlumberger Limited 10,774.0 11 10 62 70 4 100,000 c - 100,000 389,488 41% 59% 0% 0%
Oil & Gas Exploration & ProductionAnadarko Petroleum Corporation 18,470.0 10 9 61 72 8 110,000 c,d 2,000 126,000 362,162 29% 70% 0% 1%
Apache Corporation 13,851.0 11 10 60 75 15 100,000 c,d - 100,000 270,923 43% 57% 0% 0%
Cabot Oil & Gas Corporation 2,173.0 6 1 69 73 7 75,000 c - 75,000 295,175 29% 68% 0% 3%
Chesapeake Energy Corporation 20,951.0 10 9 62 80 10 100,000 c,d - 100,000 410,991 23% 77% 0% 0%
Cimarex Energy Co. 2,424.2 9 7 70 - 6 250,000 e 1,800 260,800 280,970 36% 64% 0% 0%
ConocoPhillips 55,517.0 11 10 61 72 6 115,000 c,d - 115,000 367,223 37% 60% 0% 3%
Devon Energy Corporation 19,566.0 9 7 63 73 7 70,000 c 2,000 84,000 366,752 29% 71% 0% 0%
EOG Resources 18,035.3 7 6 70 80 5 140,000 c,d - 140,000 374,505 37% 41% 8% 14%
EQT Corporation 2,469.7 11 10 65 74 7 60,000 c,d 1,500 70,500 259,796 30% 62% 0% 8%
Hess Corporation 11,439.0 14 13 65 75 10 110,000 c - 110,000 297,535 46% 53% 0% 1%
Marathon Oil Corporation 11,258.0 8 7 62 72 7 150,000 c - 150,000 345,144 49% 51% 0% 0%
Murphy Oil Corporation 5,476.1 12 10 62 72 8 60,000 c 2,000 76,000 340,039 35% 59% 0% 6%
Newfield Exploration Company 2,288.0 8 7 63 72 4 75,000 c - 75,000 289,998 31% 69% 0% 0%
Noble Energy 5,101.0 10 9 64 75 11 75,000 c,f 2,000 97,000 303,706 40% 33% 27% 0%
Pioneer Natural Resources Company 5,055.0 11 9 61 - 15 275,000 e - 275,000 288,057 18% 82% 0% 0%
QEP Resources 3,414.3 7 6 63 72 8 70,000 c - 70,000 277,222 28% 72% 0% 0%
Range Resources Corporation 2,711.7 10 8 66 - 10 50,000 c,d 1,000 60,000 321,687 22% 78% 0% 0%
Southwestern Energy Company 4,038.0 9 7 64 75 9 50,000 c,f 1,500 63,500 271,674 33% 43% 21% 3%
Oil & Gas Refining & MarketingMarathon Petroleum Corporation 98,102.0 10 9 65 72 8 150,000 c - 150,000 328,636 52% 46% 0% 2%
Phillips 66 164,093.0 8 6 65 75 6 115,000 c,d - 115,000 334,838 41% 51% 0% 8%
Tesoro Corporation 40,633.0 9 8 66 75 8 270,000 d,e - 270,000 294,468 49% 50% 0% 1%
Oil & Gas Storage & TransportationKinder Morgan 16,226.0 16 13 68 - 8 200,000 d - 200,000 200,000 100% 0% 0% 0%
ONEOK 12,195.1 10 8 63 73 12 200,000 d,e - 200,000 225,809 39% 61% 0% 0%

spencer stuartpage 44
com
pany sales
($ in m
illion
s)
total
ind
epend
ent
directo
rs
average ag
e
retiremen
t age
meetin
gs per year a
meetin
g
attendan
ce fee
ann
ual bo
ard fees b
cash
stock
optio
ns
all oth
er
board retain
er
average co
mpen
sation
per no
n-em
ployee
director
number of directors
independent directors
board fees ($) percentage of total compensation
Comparative Board Data
Oil & Gas Storage & Transportation (continued)Spectra Energy Corporation 5,903.0 11 10 64 74 7 225,000 e - 225,000 237,589 48% 51% 0% 1%
The Williams Companies 7,637.0 13 12 61 75 16 250,000 e - 250,000 304,684 46% 51% 0% 3%
TOTAL ENERGY
Average 10.3 8.7 63.9 73.4 8.2 118,250 122,383 319,619 35% 59% 3% 3%
Median 10.0 9.0 63.4 72.5 8.0 100,000 100,000 313,186
financialS
Asset Management & Custody BanksAffiliated Managers Group 2,510.9 8 8 53 - 6 80,000 c,f - 80,000 257,314 44% 24% 32% 0%
Ameriprise Financial 12,268.0 9 8 66 75 7 205,000 d,e - 205,000 273,530 37% 47% 0% 16%
The Bank of New York Mellon Corporation 16,386.0 14 13 65 75 21 110,000 c,d - 110,000 279,633 50% 47% 0% 3%
BlackRock 11,081.0 18 14 65 75 7 75,000 c,d,e 1,500 85,500 267,408 19% 81% 0% 0%
Franklin Resources 8,491.4 10 7 59 75 5 85,000 c,d - 85,000 230,490 35% 65% 0% 0%
Invesco 84.9 9 8 66 75 11 120,000 c - 120,000 257,516 49% 51% 0% 0%
Legg Mason 2,741.8 12 11 66 72 6 50,000 c,i - n 52,000 229,477 42% 57% 0% 1%
Northern Trust Corporation 4,512.6 11 10 58 72 10 220,000 d,e - 220,000 213,889 52% 47% 0% 1%
State Street Corporation 10,285.0 12 11 62 75 8 75,000 c,d 1,500 87,000 293,902 34% 60% 0% 6%
T. Rowe Price Group 3,982.1 12 9 67 72 7 100,000 c,d,f,o - 100,000 343,122 36% 49% 12% 3%
Consumer FinanceAmerican Express Company 35,999.0 12 9 63 72 9 95,000 c,d - 95,000 309,800 40% 50% 0% 10%
Capital One Financial Corporation 23,869.0 10 8 62 72 13 90,000 c - 90,000 327,778 45% 52% 0% 3%
Discover Financial Services 9,611.0 11 10 62 - 12 90,000 c - 90,000 235,161 45% 55% 0% 0%
Navient Corporation 2,946.0 13 12 62 75 6 100,000 c 1,500 109,000 292,901 48% 37% 0% 15%
Diversified BanksBank of America Corporation 95,181.0 13 11 64 72 26 80,000 c,d - 80,000 276,332 35% 65% 0% 0%
Citigroup 90,572.0 13 12 63 72 21 75,000 c,d - 75,000 342,955 56% 44% 0% 0%
Comerica 2,618.0 9 8 58 72 9 45,000 c,d 1,500 58,500 169,674 56% 44% 0% 0%
JPMorgan Chase & Co. 102,102.0 11 10 64 72 10 75,000 c,d - 75,000 323,000 30% 70% 0% 0%
U.S. Bancorp 21,392.0 14 13 63 72 8 90,000 c,d - 90,000 251,803 44% 56% 0% 0%
Wells Fargo & Company 88,372.0 16 15 64 70 9 75,000 c,d 2,000 93,000 305,073 48% 52% 0% 0%
Healthcare REITsHCP 2,266.3 8 7 67 - 13 75,000 c,d - 75,000 231,034 46% 54% 0% 0%
Health Care REIT 3,343.5 9 8 65 75 5 80,000 c - p 81,500 198,371 52% 48% 0% 0%
Ventas 3,075.7 11 9 63 75 7 90,000 c,d - 90,000 239,722 46% 54% 0% 0%

page 45 board index 2015
com
pany sales
($ in m
illion
s)
total
ind
epend
ent
directo
rs
average ag
e
retiremen
t age
meetin
gs per year a
meetin
g
attendan
ce fee
ann
ual bo
ard fees b
cash
stock
optio
ns
all oth
er
board retain
er
average co
mpen
sation
per no
n-em
ployee
director
number of directors
independent directors
board fees ($) percentage of total compensation
Hotel & Resort REITsHost Hotels & Resorts 5,354.0 9 7 64 - 5 180,000 d,e - 180,000 237,742 35% 49% 0% 16%
Industrial REITsProLogis 1,760.8 10 9 63 72 4 95,000 c - 95,000 251,136 41% 58% 0% 1%
Insurance BrokersAon plc 12,045.0 11 10 66 - 6 115,000 c,d - 115,000 319,401 35% 56% 0% 9%
Marsh & McLennan Companies 12,951.0 12 11 64 75 11 110,000 c,d - 110,000 273,273 48% 51% 0% 1%
Investment Banking & BrokerageThe Charles Schwab Corporation 6,058.0 15 13 67 - 7 100,000 c,d,f,j - 100,000 272,266 46% 27% 26% 1%
E*TRADE Financial Corporation 2,019.0 11 10 65 - 13 50,000 c 2,500 82,500 259,000 54% 46% 0% 0%
The Goldman Sachs Group 40,085.0 13 10 61 75 14 75,000 c,e,h,i - 75,000 599,666 4% 93% 0% 3%
Morgan Stanley 37,953.0 14 11 62 72 16 75,000 c,d - 75,000 347,652 28% 72% 0% 0%
Life & Health InsuranceAFLAC 22,728.0 13 9 65 75 5 115,000 c,d,f,j,o - 115,000 264,522 49% 26% 24% 1%
Lincoln National Corporation 13,554.0 11 10 69 75 4 247,000 d,e,g - 247,000 303,689 37% 57% 0% 6%
MetLife 73,316.0 12 11 62 72 7 260,000 e - 260,000 281,291 52% 47% 0% 1%
Principal Financial Group 10,477.6 11 9 63 72 9 225,000 d,e - 225,000 236,548 51% 49% 0% 0%
Prudential Financial 54,105.0 11 9 64 74 10 300,000 d,e - 300,000 319,500 53% 47% 0% 0%
Torchmark Corporation 3,964.3 11 9 65 74 5 210,000 d,e,f,j - 210,000 202,089 46% 49% 5% 0%
Unum Group 10,509.7 14 12 64 72 7 95,000 c,d - 95,000 264,966 44% 53% 0% 3%
Multi-line InsuranceAmerican International Group 64,406.0 13 12 65 75 16 280,000 d,e,g - 280,000 293,402 64% 34% 0% 2%
Assurant 10,381.7 10 9 64 73 7 100,000 c,d - 100,000 228,444 53% 44% 0% 3%
Genworth Financial 9,565.0 10 9 65 73 8 230,000 d,e,g - 230,000 270,167 36% 60% 0% 4%
The Hartford Financial Services Group 18,614.0 11 10 61 75 12 100,000 c,d - 100,000 303,323 44% 55% 0% 1%
Loews Corporation 14,325.0 14 11 68 - 7 100,000 f - 100,000 180,879 64% 36% 0% 0%
Multi-sector HoldingsBerkshire Hathaway 194,673.0 12 8 68 - 3 - 900 2,700 4,236 100% 0% 0% 0%
Leucadia National Corporation 11,486.5 11 8 65 - 12 120,000 c - 120,000 252,813 53% 47% 0% 0%
Office REITsBoston Properties 2,397.0 11 8 67 75 9 60,000 c,d 1,500 73,500 203,433 44% 56% 0% 0%
SL Green Realty Corporation 1,520.0 8 5 68 - 5 50,000 c,d 1,500 57,500 410,625 27% 73% 0% 0%
Vornado Realty Trust 2,635.9 9 7 74 - 10 75,000 c - 75,000 184,730 51% 49% 0% 0%
Property & Casualty InsuranceACE Limited 19,171.0 14 13 64 74 6 260,000 d,e - 260,000 329,366 32% 54% 0% 14%
The Allstate Corporation 35,239.0 10 9 61 72 6 105,000 c,d - 105,000 238,002 35% 65% 0% 0%

spencer stuartpage 46
com
pany sales
($ in m
illion
s)
total
ind
epend
ent
directo
rs
average ag
e
retiremen
t age
meetin
gs per year a
meetin
g
attendan
ce fee
ann
ual bo
ard fees b
cash
stock
optio
ns
all oth
er
board retain
er
average co
mpen
sation
per no
n-em
ployee
director
number of directors
independent directors
board fees ($) percentage of total compensation
Comparative Board Data
Property & Casualty Insurance (continued)The Chubb Corporation 14,098.0 14 13 65 74 8 90,000 c,d - 90,000 263,229 45% 49% 0% 6%
Cincinnati Financial Corporation 4,945.0 15 10 60 73 5 80,000 e 4,500 q 102,500 193,184 49% 45% 0% 6%
The Progressive Corporation 19,391.4 10 9 63 80 8 225,000 e,h - 225,000 241,678 0% 100% 0% 0%
The Travelers Companies 27,162.0 12 11 66 74 5 118,942 c,d - 118,942 291,169 45% 55% 0% 0%
XL Group 6,602.3 11 10 67 - 7 105,000 c,d,f - 105,000 294,766 49% 51% 0% 0%
Real Estate ServicesCBRE Group 9,049.9 10 9 68 - 4 75,000 c,d - 75,000 235,413 36% 64% 0% 0%
Regional BanksBB&T Corporation 9,926.0 18 16 65 72 13 60,000 c 1,500 79,500 164,532 57% 43% 0% 0%
Fifth Third Bancorp 6,504.0 12 11 60 70 9 50,000 c,d 2,000 68,000 269,211 53% 42% 0% 5%
Huntington Bancshares 2,955.6 11 9 61 72 12 35,000 c,d 2,000 59,000 231,193 52% 48% 0% 0%
KeyCorp 4,351.0 14 13 59 72 8 50,000 c,d 1,500 62,000 159,129 50% 50% 0% 0%
M&T Bank Corporation 4,736.2 13 10 71 - 13 85,000 d 2,000 111,000 151,457 46% 54% 0% 0%
People’s United Financial 1,348.0 12 9 67 76 12 24,000 c,d 950 35,400 178,964 48% 52% 0% 0%
The PNC Financial Services Group 16,281.0 13 12 65 72 11 60,000 c,d 1,500 r 73,500 299,707 37% 44% 0% 19%
Regions Financial Corporation 5,409.0 12 11 65 72 12 155,000 d,e 1,500 173,000 206,229 54% 46% 0% 0%
SunTrust Banks 8,707.0 12 11 65 72 5 60,000 c - 60,000 230,200 46% 52% 0% 2%
Zions Bancorporation 2,361.6 13 11 62 72 22 35,000 c,d 1,500 68,000 167,058 58% 42% 0% 0%
Residential REITsApartment Investment and Management Company 984.4 7 6 68 - 4 - e,h,l 1,000 4,000
plus stock 170,940 13% 87% 0% 0%
AvalonBay Communities 1,685.1 10 9 63 72 6 60,000 c,d - 60,000 191,135 28% 69% 0% 3%
Equity Residential 2,614.7 12 10 59 72 6 180,000 e,f,j - 180,000 202,583 41% 39% 20% 0%
Essex Property Trust 969.3 13 11 65 - 5 30,000 f,o 1,000 35,000 107,125 43% 12% 45% 0%
Retail REITsGeneral Growth Properties 2,535.6 9 8 55 - 9 175,000 c,d - 175,000 180,004 46% 54% 0% 0%
Kimco Realty Corporation 993.9 8 6 73 - 8 50,000 c,d - 50,000 248,030 40% 60% 0% 0%
The Macerich Co. 1,105.2 12 9 63 - 11 60,000 c,d - 60,000 207,469 45% 55% 0% 0%
Realty Income Corporation 933.5 8 7 62 - 17 15,000 c 1,000 32,000 224,993 23% 77% 0% 0%
Simon Property Group 4,870.8 10 7 68 - 11 70,000 c 2,000 92,000 206,183 56% 44% 0% 0%
Specialized FinanceCME Group 3,112.5 25 19 63 - 8 60,000 c,d - 60,000 193,562 40% 60% 0% 0%
IntercontinentalExchange 3,092.0 10 9 67 75 6 85,000 c,d - 85,000 326,556 32% 54% 0% 14%
McGraw-Hill Financial 5,051.0 12 10 65 72 10 70,000 c,d 1,500 85,000 229,249 49% 50% 0% 1%
Moody’s Corporation 3,334.3 9 8 64 - 11 75,000 c - 75,000 241,961 36% 63% 0% 1%
The Nasdaq OMX Group 3,500.0 11 10 58 - 14 80,000 c,d 1,500 101,000 243,902 41% 59% 0% 0%

page 47 board index 2015
com
pany sales
($ in m
illion
s)
total
ind
epend
ent
directo
rs
average ag
e
retiremen
t age
meetin
gs per year a
meetin
g
attendan
ce fee
ann
ual bo
ard fees b
cash
stock
optio
ns
all oth
er
board retain
er
average co
mpen
sation
per no
n-em
ployee
director
number of directors
independent directors
board fees ($) percentage of total compensation
Specialized REITsAmerican Tower Corporation 4,100.0 9 8 62 - 8 75,000 c,f - 75,000 246,886 40% 30% 30% 0%
Crown Castle International Corp. 3,689.9 11 9 64 - 5 75,000 c - 75,000 221,272 37% 60% 0% 3%
Plum Creek Timber Company 1,476.0 10 9 65 - 7 60,000 c,d 2,000 74,000 204,085 46% 54% 0% 0%
Public Storage 2,195.4 8 5 64 70 6 120,000 f - 120,000 211,807 54% 0% 46% 0%
Thrifts & Mortgage FinanceHudson City Bancorp 1,278.1 9 7 70 75 19 50,000 c 1,500 78,500 235,592 54% 32% 0% 14%
TOTAL FINANCIALS
Average 11.5 9.8 64.1 73.3 9.2 103,734 107,774 249,232 42% 53% 2% 3%
Median 11.0 9.0 64.3 72.0 8.0 85,000 90,000 241,961
healthcare
BiotechnologyAlexion Pharmaceuticals 2,233.7 10 8 65 - 9 95,000 c,f - 95,000 402,452 24% 38% 38% 0%
Amgen 20,063.0 13 12 65 72 7 100,000 c - 100,000 357,456 37% 56% 0% 7%
Biogen Idec 9,703.3 11 10 60 75 10 65,000 c 2,500 90,000 405,970 29% 70% 0% 1%
Celgene Corporation 7,670.4 9 8 67 - 7 75,000 c,f - 75,000 829,342 14% 23% 63% 0%
Gilead Sciences 24,890.0 10 9 72 - 4 75,000 c,d,f - 75,000 422,222 28% 36% 36% 0%
Regeneron Pharmaceuticals 2,819.6 12 9 70 - 7 55,000 f - 55,000 1,767,782 4% 0% 96% 0%
Vertex Pharmaceuticals 580.4 10 9 58 - 10 50,000 f - 50,000 820,234 9% 91% 0% 0%
Healthcare TechnologyCerner Corporation 3,402.7 9 7 69 75 4 66,000 c - 66,000 369,463 23% 77% 0% 0%
Healthcare DistributorsAmerisourceBergen Corporation 119,569.1 10 8 64 75 4 100,000 c,d - 100,000 246,877 45% 53% 0% 2%
Cardinal Health 91,084.0 11 10 62 75 9 90,000 c - 90,000 258,037 37% 62% 0% 1%
Henry Schein 10,371.4 15 10 73 - 8 50,000 c 2,000 66,000 267,275 31% 69% 0% 0%
McKesson Corporation 137,609.0 9 8 67 75 10 75,000 c 1,500 90,000 293,239 42% 52% 0% 6%
Patterson Companies 4,063.7 9 8 61 75 6 62,000 c,f - 62,000 169,256 41% 59% 0% 0%
Healthcare EquipmentAbbott Laboratories 20,247.0 11 10 63 75 7 126,000 c,d - 126,000 272,033 49% 46% 0% 5%
Baxter International 16,671.0 13 12 68 72 8 65,000 c,f 2,000 81,000 291,696 43% 38% 17% 2%
Becton, Dickinson and Company 8,446.0 14 13 65 72 12 92,000 c,d - 92,000 263,203 34% 65% 0% 1%
Boston Scientific Corporation 7,380.0 11 10 61 - 6 90,000 c,d,j - 90,000 292,227 37% 63% 0% 0%
C.R. Bard 3,323.6 11 9 67 74 6 50,000 c,d 1,650 59,900 245,225 38% 32% 0% 30%
Edwards Lifesciences Corporation 2,322.9 9 8 67 75 7 40,000 c,d,f,j - 40,000 251,333 9% 78% 13% 0%
Intuitive Surgical 2,131.7 8 2 63 - 5 50,000 c,f - 50,000 333,413 21% 43% 36% 0%
Medtronic 17,005.0 10 9 61 72 6 80,000 c - 80,000 231,559 40% 60% 0% 0%

spencer stuartpage 48
com
pany sales
($ in m
illion
s)
total
ind
epend
ent
directo
rs
average ag
e
retiremen
t age
meetin
gs per year a
meetin
g
attendan
ce fee
ann
ual bo
ard fees b
cash
stock
optio
ns
all oth
er
board retain
er
average co
mpen
sation
per no
n-em
ployee
director
number of directors
independent directors
board fees ($) percentage of total compensation
Comparative Board Data
Healthcare Equipment (continued)St. Jude Medical 5,622.0 8 7 62 75 5 100,000 c,d - 100,000 257,559 42% 58% 0% 0%
Stryker Corporation 9,675.0 9 8 59 - 9 60,000 c,f - 60,000 307,331 44% 28% 28% 0%
Varian Medical Systems 3,049.8 10 8 60 75 5 100,000 c,d - 100,000 299,145 47% 53% 0% 0%
Zimmer Holdings 4,673.3 10 9 58 72 11 95,000 c,d,e,g - 95,000 294,877 34% 64% 0% 2%
Healthcare FacilitiesHCA Holdings 36,918.0 11 10 60 75 7 100,000 c - 100,000 322,584 37% 63% 0% 0%
Tenet Healthcare Corporation 16,615.0 10 9 66 75 9 95,000 c,d - s 101,000 339,625 48% 52% 0% 0%
Universal Health Services 8,065.3 7 4 68 - 6 40,000 f - 40,000 312,640 18% 0% 82% 0%
Healthcare ServicesDaVita Healthcare Partners 12,795.1 9 8 62 75 13 80,000 c,f - 80,000 303,555 42% 33% 25% 0%
Express Scripts Holding Co. 100,887.1 12 11 64 75 5 40,000 c,f 2,000 50,000 269,150 26% 37% 37% 0%
Laboratory Corporation of America Holdings 6,011.6 9 8 59 75 10 90,000 c - 90,000 246,708 38% 62% 0% 0%
Quest Diagnostics 7,435.0 11 10 64 - 8 55,000 c,d,j 1,500 67,000 271,372 32% 67% 1% 0%
Healthcare SuppliesDENTSPLY International 2,922.6 10 9 65 75 6 45,000 c,d,f 1,500 54,000 197,000 34% 33% 33% 0%
Life Sciences Tools & ServicesAgilent Technologies 6,981.0 9 8 68 75 6 90,000 c,d - 90,000 300,714 40% 60% 0% 0%
PerkinElmer 2,237.2 8 7 63 72 8 80,000 c - 80,000 245,000 37% 41% 22% 0%
Thermo Fisher Scientific 16,889.6 11 10 60 72 6 100,000 c,d - 100,000 285,600 44% 53% 0% 3%
Waters Corporation 1,989.3 9 8 61 72 8 75,000 c,d,f 1,500 87,000 352,110 29% 43% 28% 0%
Managed HealthcareAetna 58,003.2 13 11 68 76 11 85,000 c,d - 85,000 305,685 34% 53% 0% 13%
Anthem 73,874.1 10 9 65 72 9 95,000 c - 95,000 323,191 42% 54% 0% 4%
CIGNA Corporation 34,914.0 11 10 61 72 7 275,000 d,e - 275,000 319,787 43% 56% 0% 1%
Humana 48,500.0 10 9 58 73 8 105,000 c,d - 105,000 286,882 43% 49% 0% 8%
UnitedHealth Group 130,474.0 10 8 69 - 10 125,000 c,d - 125,000 331,784 50% 45% 0% 5%
PharmaceuticalsAbbVie 19,960.0 9 8 64 75 17 126,000 c,d,j - 126,000 292,748 46% 49% 0% 5%
Actavis plc 13,062.3 12 10 63 - 17 65,000 c 4,000 133,000 385,380 23% 62% 0% 15%
Bristol-Myers Squibb Company 15,879.0 11 9 63 75 8 90,000 c,d - 90,000 312,384 41% 55% 0% 4%
Eli Lilly & Company 19,615.6 14 13 63 72 9 100,000 c,d - 100,000 271,533 42% 53% 0% 5%
Endo International plc 2,616.9 9 8 63 - 4 140,000 c,d - 140,000 536,990 44% 56% 0% 0%
Hospira 4,463.7 10 9 67 - 10 65,000 c,d - 65,000 297,386 32% 68% 0% 0%
Johnson & Johnson 74,331.0 11 10 64 72 7 110,000 c - 110,000 261,047 43% 54% 0% 3%
Mallinckrodt Public Limited Company 2,540.4 12 11 63 72 9 100,000 c - 100,000 357,551 33% 67% 0% 0%
Merck & Co. 42,237.0 12 11 64 72 8 100,000 c,d - 100,000 279,776 40% 60% 0% 0%

page 49 board index 2015
com
pany sales
($ in m
illion
s)
total
ind
epend
ent
directo
rs
average ag
e
retiremen
t age
meetin
gs per year a
meetin
g
attendan
ce fee
ann
ual bo
ard fees b
cash
stock
optio
ns
all oth
er
board retain
er
average co
mpen
sation
per no
n-em
ployee
director
number of directors
independent directors
board fees ($) percentage of total compensation
Perrigo Company Public Limited Company 3,539.8 11 10 62 72 10 75,000 c - 75,000 328,395 31% 69% 0% 0%
Pfizer 49,605.0 11 10 62 73 16 137,500 c,d - 137,500 328,680 48% 49% 0% 3%
Zoetis 4,785.0 10 8 63 - 13 270,000 e,g - 270,000 266,042 47% 53% 0% 0%
TOTAL HEALTHCARE
Average 10.4 9.0 63.9 73.7 8.3 89,991 93,674 342,813 33% 49% 16% 2%
Median 10.0 9.0 63.4 75.0 8.0 90,000 90,000 298,266
inDuStrialS
Aerospace & DefenseThe Boeing Company 90,762.0 10 9 63 74 7 130,000 c,d - 130,000 302,630 43% 50% 0% 7%
General Dynamics Corporation 30,852.0 11 9 63 75 8 70,000 c,d,f 3,000 94,000 250,741 51% 24% 24% 1%
Honeywell International 40,306.0 13 12 63 72 7 100,000 c,d,f - 100,000 285,902 66% 13% 13% 8%
L-3 Communications Holdings 12,124.0 10 9 69 - 10 110,000 c,d - 110,000 240,445 50% 50% 0% 0%
Lockheed Martin Corporation 45,600.0 11 10 65 75 9 260,000 d,e - 260,000 269,928 52% 47% 0% 1%
Northrop Grumman Corporation 23,979.0 12 11 65 72 9 255,000 d,e,g - 255,000 272,325 49% 48% 0% 3%
Precision Castparts Corporation 9,616.0 8 7 64 71 5 80,000 c,d - 80,000 241,857 42% 58% 0% 0%
Raytheon Company 22,826.0 10 9 64 74 11 90,000 c,d 1,500 106,500 292,713 48% 50% 0% 2%
Rockwell Collins 4,979.0 9 8 66 74 6 100,000 c,d - 100,000 222,194 44% 54% 0% 2%
Textron 13,878.0 11 10 68 75 6 215,000 d,e,g - 215,000 250,312 58% 40% 0% 2%
United Technologies Corporation 65,100.0 11 10 68 72 8 280,000 d,e,g - t 285,000 283,069 17% 83% 0% 0%
Agricultural & Farm MachineryDeere & Company 36,066.9 12 11 65 72 5 120,000 c,d - 120,000 244,943 50% 49% 0% 1%
Air Freight & LogisticsC.H. Robinson Worldwide 13,470.1 9 8 61 - 5 80,000 c,d - 80,000 143,889 65% 35% 0% 0%
Expeditors International of Washington 6,564.7 10 8 65 72 8 30,000 c 1,000 38,000 269,458 26% 74% 0% 0%
FedEx Corporation 45,567.0 12 11 59 72 7 111,000 f - 111,000 266,975 44% 56% 0% 0%
United Parcel Service 58,232.0 12 10 60 72 6 100,000 c - 100,000 265,385 40% 60% 0% 0%
AirlinesAmerican Airlines Group 42,650.0 11 10 62 75 13 90,000 c - 90,000 415,892 27% 68% 0% 5%
Delta Air Lines 40,362.0 16 13 65 72 7 90,000 c - 90,000 300,039 40% 55% 0% 5%
Southwest Airlines Co. 18,605.0 10 9 68 75 6 70,000 c 1,500 79,000 205,003 51% 49% 0% 0%
Building ProductsAllegion Public Limited Company 2,045.6 6 5 61 70 5 140,000 c - 140,000 245,768 85% 4% 0% 11%
Masco Corporation 8,521.0 11 9 60 72 8 230,000 e - 230,000 264,296 54% 45% 0% 1%

spencer stuartpage 50
com
pany sales
($ in m
illion
s)
total
ind
epend
ent
directo
rs
average ag
e
retiremen
t age
meetin
gs per year a
meetin
g
attendan
ce fee
ann
ual bo
ard fees b
cash
stock
optio
ns
all oth
er
board retain
er
average co
mpen
sation
per no
n-em
ployee
director
number of directors
independent directors
board fees ($) percentage of total compensation
Comparative Board Data
Construction & EngineeringFluor Corporation 21,531.6 11 10 63 75 5 115,000 c - 115,000 261,318 47% 52% 0% 1%
Jacobs Engineering Group 12,695.2 10 9 65 - 7 88,000 c,f - 88,000 256,567 35% 35% 30% 0%
Quanta Services 7,851.3 10 9 62 73 8 75,000 c - 75,000 246,697 41% 59% 0% 0%
Construction Machinery & Heavy TrucksCaterpillar 55,184.0 12 11 60 72 7 275,000 d,e - 275,000 289,544 54% 42% 0% 4%
Cummins 19,221.0 10 9 62 72 5 250,000 e - 250,000 281,739 40% 55% 0% 5%
Joy Global 3,778.3 9 8 66 - 9 85,000 c 1,500 98,500 235,375 49% 51% 0% 0%
PACCAR 18,997.0 11 9 60 72 4 100,000 c,d - 100,000 228,305 56% 44% 0% 0%
Diversified Support ServicesCintas Corporation 4,551.8 9 6 63 73 6 46,000 c,d,f 3,150 64,900 162,629 46% 27% 27% 0%
Iron Mountain 3,117.7 10 9 59 75 11 70,000 c,d - 70,000 244,648 42% 55% 3% 0%
Electrical Components & EquipmentAMETEK 4,022.0 9 8 66 75 7 70,000 c,d,f - 70,000 179,936 42% 33% 25% 0%
Eaton Corporation 22,552.0 12 11 62 72 4 290,000 d,e - 290,000 308,174 50% 43% 0% 7%
Emerson Electric Company 24,537.0 13 11 63 72 11 240,000 e 1,500 256,500 247,581 45% 50% 0% 5%
Rockwell Automation 6,623.5 11 10 63 72 7 150,000 c,d,e - 150,000 219,581 45% 52% 0% 3%
Environmental & Facilities ServicesRepublic Services 8,788.3 10 9 61 - 6 80,000 c - 80,000 352,756 30% 70% 0% 0%
Stericycle 2,555.6 10 8 66 - 4 125,000 f,h,i - 125,000 103,822 0% 0% 100% 0%
Waste Management 13,996.0 9 8 65 72 7 110,000 c - 110,000 279,643 47% 53% 0% 0%
Human Resource & Employment ServicesRobert Half International 4,695.0 6 4 64 - 6 40,000 c 1,500 49,000 345,870 19% 81% 0% 0%
Industrial Conglomerates3M Company 31,821.0 10 9 64 72 9 270,000 d,e - 270,000 283,195 47% 53% 0% 0%
Danaher Corporation 19,913.8 10 7 65 72 13 100,000 c,d,f - 100,000 243,746 38% 42% 20% 0%
General Electric Company 148,589.0 16 15 62 75 14 250,000 d,e,g - 250,000 273,381 24% 76% 0% 0%
Roper Technologies 3,549.5 10 9 65 76 6 42,500 c 2,000 54,500 622,036 10% 90% 0% 0%
Industrial MachineryDover Corporation 7,752.7 12 11 66 75 11 240,000 e - 240,000 256,818 52% 48% 0% 0%
Flowserve Corporation 4,877.9 11 10 61 72 12 60,000 c,d - 60,000 224,098 44% 56% 0% 0%
Illinois Tool Works 14,484.0 11 10 59 75 5 135,000 c,d - 135,000 279,711 54% 46% 0% 0%
Ingersoll-Rand 12,891.4 12 11 65 75 6 285,000 e - 285,000 302,253 53% 47% 0% 0%
Pall Corporation 2,789.1 11 10 61 72 11 55,000 c,d - 55,000 210,322 37% 62% 0% 1%
Parker-Hannifin Corporation 13,216.0 12 11 62 75 7 120,000 c - 120,000 255,180 49% 50% 0% 1%
Pentair Ltd. 3,456.7 11 10 60 72 5 123,000 c,f - 123,000 261,290 60% 20% 20% 0%
Snap-on 3,492.6 10 9 62 75 8 85,000 c,d - 85,000 250,334 39% 52% 0% 9%
Stanley Black & Decker 11,338.6 11 10 63 72 5 125,000 c,d - 125,000 262,432 52% 47% 0% 1%
Xylem 3,916.0 10 9 62 72 7 100,000 c,d - 100,000 238,787 47% 53% 0% 0%

page 51 board index 2015
com
pany sales
($ in m
illion
s)
total
ind
epend
ent
directo
rs
average ag
e
retiremen
t age
meetin
gs per year a
meetin
g
attendan
ce fee
ann
ual bo
ard fees b
cash
stock
optio
ns
all oth
er
board retain
er
average co
mpen
sation
per no
n-em
ployee
director
number of directors
independent directors
board fees ($) percentage of total compensation
Office Services & SuppliesPitney Bowes 3,821.5 10 9 64 72 8 75,000 c - 75,000 215,588 49% 47% 0% 4%
RailroadsCSX Corporation 12,669.0 13 11 64 72 7 75,000 c,d - 75,000 268,262 31% 56% 0% 13%
Kansas City Southern 2,577.1 8 7 64 75 8 50,000 c,d 4,000 82,000 226,824 52% 39% 0% 9%
Norfolk Southern Corporation 11,624.0 13 11 61 72 6 50,000 c - 50,000 273,878 37% 55% 0% 8%
Union Pacific Corporation 23,988.0 12 10 68 75 6 250,000 d,e,g - 250,000 304,412 87% 0% 0% 13%
Research & Consulting ServicesThe Dun & Bradstreet Corporation 1,681.8 9 8 56 72 8 70,000 c,d,f - 70,000 229,092 40% 52% 0% 8%
Equifax 2,436.4 10 9 63 72 4 75,000 c,d - 75,000 222,580 40% 60% 0% 0%
Security & Alarm ServicesThe ADT Corporation 3,408.0 9 8 61 72 12 80,000 c - 80,000 230,345 47% 53% 0% 0%
Tyco International 10,340.0 11 9 63 72 10 100,000 c - 100,000 237,618 49% 51% 0% 0%
Trading Companies & DistributorsFastenal Company 3,733.5 9 6 57 74 4 55,000 4,000 71,000 99,714 100% 0% 0% 0%
United Rentals 5,685.0 12 11 63 - 6 80,000 c - 80,000 250,662 46% 54% 0% 0%
W.W. Grainger 9,965.0 11 10 63 75 5 85,000 c,d - 85,000 222,143 42% 57% 0% 1%
TruckingRyder System 6,638.8 11 10 61 72 7 65,000 c,d - 65,000 243,336 44% 55% 0% 1%
TOTAL INDUSTRIALS
Average 10.6 9.3 63.1 73.1 7.4 124,008 126,783 259,356 44% 51% 3% 2%
Median 11.0 9.0 63.0 72.0 7.0 100,000 100,000 250,741
information technologY
Application SoftwareAdobe Systems 4,147.1 13 12 62 72 5 60,000 c,d - 60,000 328,445 27% 73% 0% 0%
Autodesk 2,512.2 10 9 59 - 4 75,000 c,d - 75,000 546,742 16% 84% 0% 0%
Citrix Systems 3,142.9 10 9 56 - 12 40,000 c - 40,000 338,680 23% 77% 0% 0%
Intuit 4,506.0 9 6 61 75 4 60,000 c,d - 60,000 387,573 28% 72% 0% 0%
salesforce.com 5,373.6 11 8 63 - 9 50,000 c - 50,000 629,424 13% 87% 0% 0%
Communications EquipmentCisco Systems 47,142.0 10 8 61 70 5 75,000 c - 75,000 294,164 37% 63% 0% 0%
F5 Networks 1,732.0 9 8 58 - 9 50,000 c - 50,000 285,308 30% 70% 0% 0%
Harris Corporation 5,012.0 12 11 64 72 6 55,000 c,d 2,000 67,000 232,096 46% 53% 0% 1%
Juniper Networks 4,627.1 10 7 59 75 19 55,000 c - 55,000 340,618 25% 75% 0% 0%
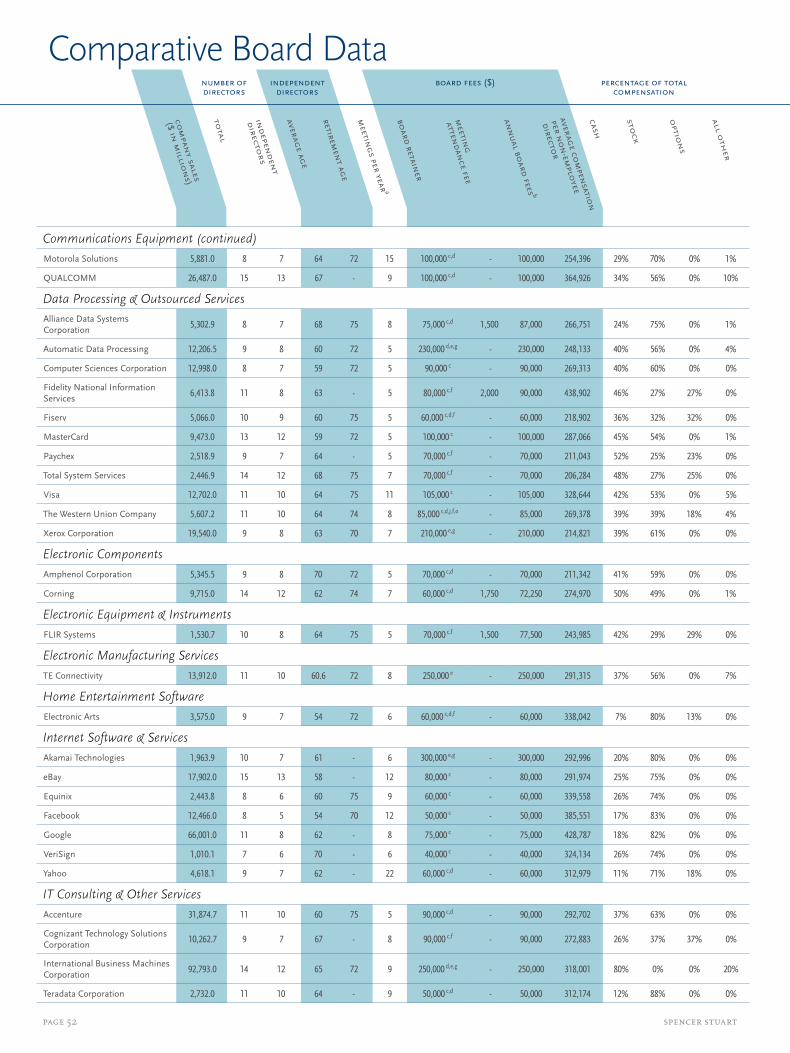
spencer stuartpage 52
com
pany sales
($ in m
illion
s)
total
ind
epend
ent
directo
rs
average ag
e
retiremen
t age
meetin
gs per year a
meetin
g
attendan
ce fee
ann
ual bo
ard fees b
cash
stock
optio
ns
all oth
er
board retain
er
average co
mpen
sation
per no
n-em
ployee
director
number of directors
independent directors
board fees ($) percentage of total compensation
Comparative Board Data
Communications Equipment (continued)Motorola Solutions 5,881.0 8 7 64 72 15 100,000 c,d - 100,000 254,396 29% 70% 0% 1%
QUALCOMM 26,487.0 15 13 67 - 9 100,000 c,d - 100,000 364,926 34% 56% 0% 10%
Data Processing & Outsourced ServicesAlliance Data Systems Corporation 5,302.9 8 7 68 75 8 75,000 c,d 1,500 87,000 266,751 24% 75% 0% 1%
Automatic Data Processing 12,206.5 9 8 60 72 5 230,000 d,e,g - 230,000 248,133 40% 56% 0% 4%
Computer Sciences Corporation 12,998.0 8 7 59 72 5 90,000 c - 90,000 269,313 40% 60% 0% 0%
Fidelity National Information Services 6,413.8 11 8 63 - 5 80,000 c,f 2,000 90,000 438,902 46% 27% 27% 0%
Fiserv 5,066.0 10 9 60 75 5 60,000 c,d,f - 60,000 218,902 36% 32% 32% 0%
MasterCard 9,473.0 13 12 59 72 5 100,000 c - 100,000 287,066 45% 54% 0% 1%
Paychex 2,518.9 9 7 64 - 5 70,000 c,f - 70,000 211,043 52% 25% 23% 0%
Total System Services 2,446.9 14 12 68 75 7 70,000 c,f - 70,000 206,284 48% 27% 25% 0%
Visa 12,702.0 11 10 64 75 11 105,000 c - 105,000 328,644 42% 53% 0% 5%
The Western Union Company 5,607.2 11 10 64 74 8 85,000 c,d,j,f,o - 85,000 269,378 39% 39% 18% 4%
Xerox Corporation 19,540.0 9 8 63 70 7 210,000 e,g - 210,000 214,821 39% 61% 0% 0%
Electronic ComponentsAmphenol Corporation 5,345.5 9 8 70 72 5 70,000 c,d - 70,000 211,342 41% 59% 0% 0%
Corning 9,715.0 14 12 62 74 7 60,000 c,d 1,750 72,250 274,970 50% 49% 0% 1%
Electronic Equipment & InstrumentsFLIR Systems 1,530.7 10 8 64 75 5 70,000 c,f 1,500 77,500 243,985 42% 29% 29% 0%
Electronic Manufacturing ServicesTE Connectivity 13,912.0 11 10 60.6 72 8 250,000 e - 250,000 291,315 37% 56% 0% 7%
Home Entertainment SoftwareElectronic Arts 3,575.0 9 7 54 72 6 60,000 c,d,f - 60,000 338,042 7% 80% 13% 0%
Internet Software & ServicesAkamai Technologies 1,963.9 10 7 61 - 6 300,000 e,g - 300,000 292,996 20% 80% 0% 0%
eBay 17,902.0 15 13 58 - 12 80,000 c - 80,000 291,974 25% 75% 0% 0%
Equinix 2,443.8 8 6 60 75 9 60,000 c - 60,000 339,558 26% 74% 0% 0%
Facebook 12,466.0 8 5 54 70 12 50,000 c - 50,000 385,551 17% 83% 0% 0%
Google 66,001.0 11 8 62 - 8 75,000 c - 75,000 428,787 18% 82% 0% 0%
VeriSign 1,010.1 7 6 70 - 6 40,000 c - 40,000 324,134 26% 74% 0% 0%
Yahoo 4,618.1 9 7 62 - 22 60,000 c,d - 60,000 312,979 11% 71% 18% 0%
IT Consulting & Other ServicesAccenture 31,874.7 11 10 60 75 5 90,000 c,d - 90,000 292,702 37% 63% 0% 0%
Cognizant Technology Solutions Corporation 10,262.7 9 7 67 - 8 90,000 c,f - 90,000 272,883 26% 37% 37% 0%
International Business Machines Corporation 92,793.0 14 12 65 72 9 250,000 d,e,g - 250,000 318,001 80% 0% 0% 20%
Teradata Corporation 2,732.0 11 10 64 - 9 50,000 c,d - 50,000 312,174 12% 88% 0% 0%

page 53 board index 2015
com
pany sales
($ in m
illion
s)
total
ind
epend
ent
directo
rs
average ag
e
retiremen
t age
meetin
gs per year a
meetin
g
attendan
ce fee
ann
ual bo
ard fees b
cash
stock
optio
ns
all oth
er
board retain
er
average co
mpen
sation
per no
n-em
ployee
director
number of directors
independent directors
board fees ($) percentage of total compensation
Semiconductor EquipmentApplied Materials 9,072.0 10 8 61 70 6 65,000 c,d - 65,000 282,447 31% 69% 0% 0%
KLA-Tencor Corporation 2,929.4 11 10 63 72 9 90,000 c - 90,000 239,746 49% 51% 0% 0%
Lam Research Corporation 4,607.3 11 9 60 75 8 60,000 c - 60,000 277,189 28% 69% 0% 3%
SemiconductorsAltera Corporation 1,932.1 9 8 64 - 6 65,000 c,d - 65,000 232,296 33% 67% 0% 0%
Analog Devices 2,864.8 11 9 64 - 12 60,000 c,f - 60,000 269,916 34% 33% 33% 0%
Avago Technologies Limited 4,269.0 9 8 62 70 9 65,000 c - 65,000 278,527 31% 39% 30% 0%
Broadcom Corporation 8,428.0 9 7 64 - 9 70,000 c - 70,000 382,006 22% 78% 0% 0%
First Solar 3,391.8 11 9 64 - 10 225,000 e - 225,000 245,059 46% 54% 0% 0%
Intel Corporation 55,870.0 11 9 59 72 10 90,000 c,d - 90,000 322,678 26% 69% 0% 5%
Linear Technology Corporation 1,388.4 7 5 72 - 4 60,000 c 1,500 66,000 195,580 38% 62% 0% 0%
Microchip Technology 1,931.2 5 4 67 - 7 63,000 c 3,000 84,000 159,085 43% 57% 0% 0%
Micron Technology 16,358.0 8 7 59 70 6 100,000 c,d - 100,000 368,676 35% 65% 0% 0%
Nvidia Corporation 4,681.5 12 11 62 - 5 75,000 f,j,o - 75,000 284,971 26% 62% 12% 0%
Skyworks Solutions 2,291.5 8 7 60 - 10 60,000 c - 60,000 288,241 26% 69% 5% 0%
Texas Instruments 13,045.0 11 10 61 70 9 80,000 c,d,f - 80,000 289,000 30% 35% 35% 0%
Xilinx 2,382.5 8 7 67 - 4 60,000 c - 60,000 244,415 34% 66% 0% 0%
Systems SoftwareCA 4,515.0 11 10 62 75 10 325,000 e,g,h,i - 325,000 304,495 25% 71% 0% 4%
Microsoft Corporation 86,833.0 10 8 57 75 12 250,000 d,e - 250,000 273,630 41% 59% 0% 0%
Oracle Corporation 38,275.0 11 7 68 - 6 52,500 f 3,000 u 68,500 670,727 23% 0% 77% 0%
Red Hat 1,789.5 9 8 62 75 9 50,000 c,d - 50,000 332,878 18% 82% 0% 0%
Symantec Corporation 6,676.0 9 8 59 - 12 50,000 c,d - 50,000 335,834 30% 70% 0% 0%
Technology Hardware, Storage & PeripheralsApple 182,795.0 7 6 62 75 6 100,000 c - 100,000 334,065 28% 71% 0% 1%
EMC Corporation 24,440.0 12 10 63 - 12 50,000 c 3,000 86,000 352,548 32% 68% 0% 0%
Hewlett-Packard Company 111,454.0 12 9 59 - 17 275,000 d,e,j -v 289,000 309,011 25% 61% 12% 2%
NetApp 6,325.1 10 9 63 70 9 60,000 d,f,j,o - 60,000 331,129 25% 37% 38% 0%
SanDisk Corporation 6,627.7 8 6 65 70 7 50,000 c,f - 50,000 368,127 25% 34% 41% 0%
Seagate Technology Public Limited Company 13,724.0 11 10 64 - 5 80,000 c - 80,000 402,494 27% 73% 0% 0%
Western Digital Corporation 15,130.0 9 8 62 72 7 75,000 c,d - 75,000 336,358 31% 69% 0% 0%
TOTAL INFORMATION TECHNOLOGY
Average 10.1 8.5 62.3 72.7 8.2 94,780 97,004 311,656 31% 60% 8% 1%
Median 10.0 8.0 62.0 72.0 8.0 70,000 75,000 292,849

spencer stuartpage 54
com
pany sales
($ in m
illion
s)
total
ind
epend
ent
directo
rs
average ag
e
retiremen
t age
meetin
gs per year a
meetin
g
attendan
ce fee
ann
ual bo
ard fees b
cash
stock
optio
ns
all oth
er
board retain
er
average co
mpen
sation
per no
n-em
ployee
director
number of directors
independent directors
board fees ($) percentage of total compensation
Comparative Board Data
materialS
AluminumAlcoa 23,906.0 12 11 66 75 8 240,000 d - 240,000 256,386 95% 0% 0% 5%
Commodity ChemicalsLyondellBasell Industries 45,608.0 11 9 62 - 4 285,000 e - 285,000 341,728 39% 55% 0% 6%
Construction MaterialsMartin Marietta Materials 2,958.0 10 8 68 75 7 32,500 c,d 1,250 41,250 225,405 31% 49% 0% 20%
Vulcan Materials 2,994.2 13 11 62 74 6 45,000 c,d 5,000 75,000 221,208 42% 57% 0% 1%
Diversified ChemicalsThe Dow Chemical Company 58,167.0 13 12 62 72 11 115,000 c - 115,000 266,296 49% 51% 0% 0%
Eastman Chemical Company 9,527.0 11 10 64 75 8 100,000 c,d - 100,000 247,361 45% 31% 0% 24%
FMC Corporation 4,037.7 10 9 61 72 8 100,000 c,d - 100,000 213,988 16% 78% 0% 6%
Diversified Metals and MiningFreeport-McMoRan 21,438.0 16 13 68 - 6 75,000 c,d 3,000 93,000 448,322 31% 60% 0% 9%
Fertilizers & Agricultural ChemicalsCF Industries Holdings 4,743.2 9 8 62 74 13 100,000 c - 100,000 246,109 46% 54% 0% 0%
Monsanto Company 15,855.0 13 12 60 75 8 245,000 d,e,g - 245,000 244,582 50% 50% 0% 0%
The Mosaic Company 9,055.8 12 11 60 72 8 90,000 c,i - 90,000 276,245 38% 60% 0% 2%
Forest ProductsWeyerhaeuser Company 7,403.0 10 9 61 72 9 200,000 d,e - 200,000 246,265 51% 49% 0% 0%
GoldNewmont Mining Corporation 7,292.0 9 8 62 75 15 115,000 c - 115,000 316,750 56% 44% 0% 0%
Industrial GasesAir Products & Chemicals 10,439.0 11 10 63 72 12 100,000 c,d - 100,000 277,902 56% 44% 0% 0%
Airgas 5,072.5 11 9 66 75 6 40,000 f - 40,000 214,785 29% 0% 71% 0%
Praxair 12,273.0 10 9 66 72 6 100,000 c,d - 100,000 275,094 40% 58% 0% 2%
Metal & Glass ContainersBall Corporation 8,570.0 9 7 64 - 5 85,000 c - w 85,000 248,775 32% 52% 0% 16%
Owens-Illinois 6,784.0 12 10 63 - 9 67,500 c,d 2,000 85,500 213,002 53% 47% 0% 0%
Paper PackagingAvery Dennison Corporation 6,330.3 9 8 60 72 5 90,000 c,d - 90,000 220,913 44% 53% 0% 3%
Sealed Air Corporation 7,750.5 10 9 65 75 8 185,000 d,e - 185,000 217,036 28% 72% 0% 0%
Paper ProductsInternational Paper Company 23,617.0 12 11 63 72 11 230,000 d,e - 230,000 259,945 23% 74% 0% 3%
Specialty ChemicalsEcolab 14,280.5 16 15 61 72 6 105,000 c,d,f - 105,000 240,284 46% 30% 24% 0%
International Flavors & Fragrances 3,088.5 10 9 64 72 6 225,000 e,g - 225,000 232,116 51% 46% 0% 3%
PPG Industries 15,360.0 10 9 62 72 10 250,000 d,e - 250,000 266,911 50% 47% 0% 3%

page 55 board index 2015
com
pany sales
($ in m
illion
s)
total
ind
epend
ent
directo
rs
average ag
e
retiremen
t age
meetin
gs per year a
meetin
g
attendan
ce fee
ann
ual bo
ard fees b
cash
stock
optio
ns
all oth
er
board retain
er
average co
mpen
sation
per no
n-em
ployee
director
number of directors
independent directors
board fees ($) percentage of total compensation
Sigma-Aldrich Corporation 2,785.0 10 9 62 72 15 80,000 c,f - x 92,000 301,531 33% 29% 38% 0%
SteelAllegheny Technologies 4,223.4 11 10 65 72 8 225,000 e - 225,000 222,432 54% 43% 0% 3%
Nucor Corporation 21,105.1 8 7 63 72 4 95,000 c,d - 95,000 240,367 42% 58% 0% 0%
TOTAL MATERIALS
Average 11.0 9.7 63.2 73.1 8.2 134,074 137,287 261,457 43% 48% 5% 4%
Median 11.0 9.0 62.5 72.0 8.0 100,000 100,000 246,735
telecommunication ServiceS
Alternative CarriersLevel 3 Communications 6,777.0 11 10 63 73 10 75,000 c - 75,000 273,583 37% 63% 0% 0%
Integrated Telecommunication Services
AT&T 132,447.0 12 11 61 72 10 95,000 c,d 2,000 115,000 315,394 48% 48% 0% 4%
CenturyLink 18,031.0 12 10 64 75 9 65,000 c 2,000 83,000 287,311 42% 58% 0% 0%
Frontier Communications Corporation 4,772.5 12 10 61 - 7 215,000 d,e,i - 215,000 190,556 52% 48% 0% 0%
Verizon Communications 127,079.0 11 10 59 72 11 100,000 c - y 108,000 272,132 44% 55% 0% 1%
TOTAL TELECOMMUNICATION SERVICES
Average 11.6 10.2 61.3 73.0 9.4 110,000 119,200 271,358 44% 54% 0% 2%
Median 12.0 10.0 61.4 72.5 10.0 95,000 108,000 273,583
utilitieS
UtilitiesThe AES Corporation 17,146.0 10 9 62 72 9 80,000 c,d,e,g - 80,000 281,637 30% 70% 0% 0%
AGL Resources 5,385.0 15 14 67 75 8 190,000 d,e - 190,000 197,169 44% 56% 0% 0%
Ameren Corporation 6,053.0 11 10 63 72 6 55,000 c,d 2,000 67,000 218,298 53% 46% 0% 1%
American Electric Power Company 17,020.0 12 11 62 72 8 100,000 c,d - 100,000 261,833 45% 55% 0% 0%
CenterPoint Energy 9,226.0 9 7 61 73 7 90,000 c - 90,000 227,631 43% 55% 0% 2%
CMS Energy Corporation 7,179.0 11 10 63 75 8 95,000 c,d - 95,000 217,566 53% 46% 0% 1%
Consolidated Edison 12,919.0 10 8 65 75 15 90,000 c,d - 90,000 263,741 52% 47% 0% 1%
Dominion Resources 12,436.0 10 8 62 72 12 205,000 d,e 2,000 229,000 283,809 46% 45% 0% 9%
DTE Energy Company 12,301.0 12 11 65 75 6 75,000 c,d 2,000 87,000 215,087 50% 49% 0% 1%
Duke Energy Corporation 23,925.0 14 13 67 71 11 200,000 d,e 2,000 222,000 301,493 56% 42% 0% 2%
Edison International 13,413.0 9 8 62 72 11 65,000 c 2,000 87,000 249,690 43% 46% 0% 11%

spencer stuartpage 56
com
pany sales
($ in m
illion
s)
total
ind
epend
ent
directo
rs
average ag
e
retiremen
t age
meetin
gs per year a
meetin
g
attendan
ce fee
ann
ual bo
ard fees b
cash
stock
optio
ns
all oth
er
board retain
er
average co
mpen
sation
per no
n-em
ployee
director
number of directors
independent directors
board fees ($) percentage of total compensation
Comparative Board Data
Utilities (continued)Entergy Corporation 12,494.9 12 11 66 74 11 50,000 c 1,500 66,500 237,801 46% 44% 0% 10%
Eversource Energy 7,741.9 12 11 67 75 7 100,000 c - 100,000 205,930 51% 49% 0% 0%
Exelon Corporation 27,429.0 13 11 65 75 8 80,000 c 2,000 96,000 276,825 60% 37% 0% 3%
FirstEnergy Corporation 15,049.0 13 12 65 72 10 230,000 d,e - 230,000 239,226 46% 51% 0% 3%
NextEra Energy 17,021.0 13 12 63 72 7 210,000 e 2,000 224,000 243,396 46% 54% 0% 0%
NiSource 6,470.6 11 10 63 - 14 210,000 e - 210,000 241,738 47% 50% 0% 3%
NRG Energy 15,868.0 13 11 59 - 6 225,000 d,e,g - 225,000 258,313 41% 59% 0% 0%
PG&E Corporation 17,090.0 12 11 71 72 10 70,000 c,d 1,750 87,500 223,745 53% 47% 0% 0%
Pinnacle West Capital Corporation 3,491.6 10 9 67 - 7 95,000 c,d - 95,000 232,798 42% 43% 0% 15%
PPL Corporation 11,499.0 13 12 63 75 8 235,000 d,e,g - 235,000 238,730 45% 54% 0% 1%
Public Service Enterprise Group 10,886.0 10 9 66 72 9 85,000 c,d - 85,000 236,529 49% 51% 0% 0%
SCANA Corporation 4,951.0 10 9 60 70 10 181,500 d,e - 181,500 187,722 42% 58% 0% 0%
Sempra Energy 11,035.0 13 12 67 75 11 85,000 c,d - 85,000 258,470 58% 42% 0% 0%
Southern Company 18,467.0 15 14 64 72 7 100,000 c,d - 100,000 231,621 48% 51% 0% 1%
TECO Energy 2,566.4 9 7 70 75 9 65,000 c,d - z 71,000 180,689 53% 44% 0% 3%
Wisconsin Energy Corporation 4,997.1 9 8 64 72 10 75,000 c,d - 75,000 187,764 43% 48% 0% 9%
Xcel Energy 11,686.1 11 10 62 72 6 80,000 c,d - 80,000 211,026 22% 78% 0% 0%
TOTAL UTILITIES
Average 11.5 10.3 64.3 73.1 9.0 122,196 127,982 237,756 47% 50% 0% 3%
Median 11.5 10.5 64.1 72.0 8.5 92,500 95,000 237,165
TOTAL S&P 500
Average 10.8 9.2 63.1 73.1 8.1 112,144 115,214 277,237 38% 54% 5% 3%
Median 11.0 9.0 63.0 72.0 7.0 90,000 92,000 266,334

page 57 board index 2015
footnoteSa Includes regular, special and telephonic board meetings.
b Retainer plus board meeting fees assuming full attendance (does not include committee or special fees).
c Equity (stock or stock units) is paid in addition to stated retainer.
d Directors can elect to receive cash compensation fully or partially in stock.
e Equity (stock or stock units) is paid as part of retainer.
f Stock option program for directors exists.
g Equity portion of retainer paid in deferred stock.
h Retainer paid 100% in stock.
i Directors can elect to receive equity retainer fully or partially in cash.
j Directors can elect to receive cash and/or stock compensation in stock options.
k Not to exceed $60,000 per year.
l Dollar value equivalent for retainer not provided in proxy.
m Subject to a maximum of 10 board meetings per fiscal year.
n Per-meeting fee of $2,000 for in-person meetings and $1,000 per telephonic meeting beginning with the sixth meeting in the year. Annual board fees include one in-person meeting at $2,000.
o Directors can elect to receive stock in lieu of stock option grant.
p Per-meeting fee of $1,500 for meetings in excess of four per year. Annual board fees include one excess meeting at $1,500.
q Cash meeting fees are matched with stock up to a maximum of $60,000 per year.
r Per-meeting fee of $750 for quarterly scheduled telephonic meetings. Annual board fees include four telephonic meetings at $750 each.
s Per-meeting fee of $3,000 for meetings in excess of seven per year. Annual board fees include two excess board meetings at $3,000 each.
t Per-meeting fee of $5,000 for special meetings. Annual board fees include one special board meeting.
u Per-meeting fee of $2,000 for special meetings. Annual board fees include two special meetings at $2,000 each.
v Per-meeting fee of $2,000 for meetings attended in excess of 10 per year. Annual board fees include seven excess meetings at $2,000.
w Board retainer includes $15,000 cash annual incentive achieved for 2014.
x Per-meeting fee of $2,000 for meetings in excess of nine per year. Annual board fees include six excess board meetings at $2,000 each.
y Per-meeting fee of $2,000 for meetings held on any other date except the day before or the day of a regularly scheduled board meeting. Annual board fees include four meetings at $2,000 each.
z Per-meeting fee of $1,500 for meetings in excess of five per year. Annual board fees include four excess board meetings at $1,500 each.

© 201 5 Spencer Stuart. All rights reserved. For information about copying, distributing and displaying this work, contact [email protected].
StaY connecteD to Spencer Stuart
@Spencer Stuart
Amsterdam T 31 (0) 20.305.73.05
Frankfurt T 49 (0) 69.61.09.27.0
Minneapolis/St. PaulT 1.612.313.2000
Sao PauloT 55 11.2050.8000
AtlantaT 1.404.504.4400
Geneva T 41 22.312.36.38
Montreal T 1.514.288.3377
SeattleT 1 206.224.5660
Bangalore T 91 80.6660.5713
Hong KongT 852.2521.8373
MoscowT 7 495.797.36.37
Shanghai T 86 21.2326.2828
Barcelona T 34.93.487.23.36
HoustonT 1.713.225.1621
Mumbai T 91 22 6616.1414
Silicon Valley T 1.650.356.5500
BeijingT 86.10.6535.2100
IstanbulT 90 212.315.0400
Munich T 49 (0) 89.45.55.53.0
SingaporeT 65 6586.1186
BogotaT 57 1.618.2488
JohannesburgT 27.11.557.5300
New DelhiT 91.124.485.4444
Stamford T 1.203.324.6333
BostonT 1.617.531.5731
Lima T 51 1.710.3297
New YorkT 1.212.336.0200
StockholmT 46 8.5348015 0
BrusselsT 32.2.732.26.25
London T 44 20 7298.3333
Orange CountyT 1.949.930.8000
SydneyT 61.2.9240.0100
Buenos AiresT 54.11.4310.9100
Los AngelesT 1.310.209.0610
Paris T 33 (0) 1.53.57.81.23
TokyoT 81 3.5223.9510
CalgaryT 1.403.538.8658
Madrid T 34.91.745.85.00
PhiladelphiaT 1.215.814.1600
TorontoT 1.416.361.0311
ChicagoT 1.312.822.0080
Melbourne T 61.3.8661.0100
Prague T 420.221.411.341
Vienna T 43.1.36.88.700.0
Copenhagen T 45 3334.6700
Mexico CityT 52.55.5002.4950
RomeT 39.06.802071
Warsaw T 48.22.321.02.00
DallasT 1.214.672.5200
MiamiT 1.305.443.9911
San FranciscoT 1.415.495.4141
Washington, D.C. T 1.202.639.8111
DubaiT 971.4.426.6500
Milan T 39.02.771251
SantiagoT 56.2.2.940.2700
Zurich T 41.44.257.17.17

board index 2015 page 59

spencer stuartpage 1
header (section title)
Amsterdam
Atlanta
Bangalore
Barcelona
Beijing
Bogota
Boston
Brussels
Buenos Aires
Calgary
Chicago
Copenhagen
Dallas
Dubai
Frankfurt
Geneva
Hong Kong
Houston
Istanbul
Johannesburg
Lima
London
Los Angeles
Madrid
Melbourne
Mexico City
Miami
Milan
Minneapolis/St. Paul
Montreal
Moscow
Mumbai
Munich
New Delhi
New York
Orange County
Paris
Philadelphia
Prague
Rome
San Francisco
Santiago
Sao Paulo
Seattle
Shanghai
Silicon Valley
Singapore
Stamford
Stockholm
Sydney
Tokyo
Toronto
Vienna
Warsaw
Washington, D.C.
Zurich