spermidine exodus and oxidation in the apoplast induced by ... · pdf filespermidine exodus...
TRANSCRIPT
Spermidine Exodus and Oxidation in the Apoplast Induced byAbiotic Stress Is Responsible for H2O2 Signatures That DirectTolerance Responses in Tobacco W
Panagiotis N. Moschou, Konstantinos A. Paschalidis, Ioannis D. Delis, Athina H. Andriopoulou,
George D. Lagiotis, Dimitrios I. Yakoumakis, and Kalliopi A. Roubelakis-Angelakis1
Department of Biology, University of Crete, 71409 Heraklion, Greece
Polyamines (PAs) exert a protective effect against stress challenges, but their molecular role in this remains speculative. In
order to detect the signaling role of apoplastic PA-derived hydrogen peroxide (H2O2) under abiotic stress, we developed a
series of tobacco (Nicotiana tabacum cv Xanthi) transgenic plants overexpressing or downregulating apoplastic polyamine
oxidase (PAO; S-pao and A-pao plants, respectively) or downregulating S-adenosyl-L-methionine decarboxylase (samdc
plants). Upon salt stress, plants secreted spermidine (Spd) into the apoplast, where it was oxidized by the apoplastic PAO,
generating H2O2. A-pao plants accumulated less H2O2 and exhibited less programmed cell death (PCD) than did wild-type
plants, in contrast with S-pao and samdc downregulating plants. Induction of either stress-responsive genes or PCD was
dependent on the level of Spd-derived apoplastic H2O2. Thus, in wild-type and A-pao plants, stress-responsive genes were
efficiently induced, although in the latter at a lower rate, while S-pao plants, with higher H2O2 levels, failed to accumulate
stress-responsive mRNAs, inducing PCD instead. Furthermore, decreasing intracellular PAs, while keeping normal
apoplastic Spd oxidation, as in samdc downregulating transgenic plants, caused enhanced salinity-induced PCD. These re-
sults reveal that salinity induces the exodus of Spd into the apoplast, where it is catabolized by PAO, producing H2O2. The
accumulated H2O2 results in the induction of either tolerance responses or PCD, depending also on the levels of intracellular PAs.
INTRODUCTION
Plant polyamine (PA) metabolism is highly modulated by endog-
enous cues and environmental factors, especially those impos-
ing stress (Bouchereau et al., 1999). Salt stress in many plant
species has been linked to readjustment of PA titers, mostly by
changing the levels of the diamine putrescine (Put), the triamine
spermidine (Spd), and the tetramine spermine (Spm), through
activation of PA biosynthetic genes. Arginine decarboxylase
(ADC; EC 4.1.1.19) was vital for Arabidopsis thaliana adaptation
during salt stress (Kasinathan and Wingler, 2004), and ADC
activity increased in salt-tolerant Oryza sativa cultivars during
prolonged salt stress (Chattopadhyay et al., 1997). S-Adenosyl-
L-methionine decarboxylase (SAMDC; EC 4.1.1.50), spermidine
synthase (SPDS; EC 2.5.1.16), and spermine synthase (SPMS;
EC 2.5.1.22), enzymes that synthesize higher PAs, have also
been implicated in salt tolerance (Kasukabe et al., 2004). Trans-
genic plants overexpressing genes encoding PA-synthesizing
enzymes, such as adc (Capell et al., 2004), odc (Kumria and
Rajam, 2002), samdc (Wi et al., 2006), and spds (Kasukabe et al.,
2004), exhibited increased stress tolerance; on the contrary,
decreases in ADC (Kasinathan and Wingler, 2004) or SPMS
(Yamaguchi et al., 2006), through the use of antisense tech-
nology and mutants, exerted opposite effects. What is more
interesting is that in plants overexpressing spds, a subset of
stress-inducible genes was modulated (Kasukabe et al., 2004).
Recently, overexpression of stress-related transcription factors,
such as Hahb-4 and Ca PF1, led to tolerance, through their ability
to retain PA homeostasis (Manavella et al., 2006; Tang et al.,
2007; Agalou et al., 2008). However, most of the previous studies
did not give any conclusive evidence for an underlying mecha-
nism by which PAs exert their tolerance effects.
A nodal point in the reaction of plant cells to stress is reactive
oxygen species (ROS) generation. The identification of ROS-
generating enzymes, such as the plant homolog of respiratory
burst NADPH oxidase, revealed that plant cells, like their mam-
malian counterparts, can initiate and amplify ROS production for
signaling purposes. In addition, apoplastic ROS generation can
be mediated by the cell wall oxidase peroxidase, amine oxi-
dases, and oxalate oxidase. The apoplastic flavoprotein poly-
amine oxidase (PAO; EC 1.5.3.3), which oxidizes Spd and Spm,
yields D1-pyrroline and 1,5-diazabicyclononane, respectively,
along with 1,3-diaminopropane (1,3-Dap) and hydrogen perox-
ide (H2O2). Overexpression of the maize (Zea mays) pao gene in
tobacco (Nicotiana tabacum) plants, and the associated de-
crease in PAs, resulted in H2O2 generation, which then induced
the antioxidant genes necessary for cell survival/adaptation (Rea
et al., 2004; Moschou et al., 2008). However, despite the en-
hanced antioxidant machinery, further increase in the intracellu-
lar ROS, by directly providing H2O2 or prooxidants such as
methylviologen or menadione in the transgenics, resulted in an
1 Address correspondence to [email protected] author responsible for distribution of materials integral to thefindings presented in this article in accordance with the policy describedin the Instructions for Authors (www.plantcell.org) is: Kalliopi A.Roubelakis-Angelakis ([email protected]).W Online version contains Web-only data.www.plantcell.org/cgi/doi/10.1105/tpc.108.059733
The Plant Cell, Vol. 20: 1708–1724, June 2008, www.plantcell.org ª 2008 American Society of Plant Biologists
oxidative burst that transgenics were unable to cope with. The
detrimental effect of the oxidative burst was due to the inability of
transgenic cells to further respond, whereas induction of anti-
oxidant enzymes in the wild type was evident soon after treat-
ment. Thus, although the higher levels of H2O2 generated by the
overexpression of PAO in the transgenic plants were success-
fully regulated by the concomitant activation of the antioxidant
machinery, further increase of ROS was detrimental to cellular
functions and induced programmed cell death (PCD) (Moschou
et al., 2008).
In a recent study, Yoda et al. (2006) identified PAO as one of the
key elements in the execution of the PCD that takes place during the
hypersensitive reaction (HR), but the role of PAO during abiotic stress
is largely unknown. In addition, levels of higher PAs (i.e., Spd and
Spm) are tightly regulated, and PAO is considered to contribute to
this. Moreover, increased diamine oxidase (DAO; EC 1.4.3.6) activity
found in transgenic tobacco plants overexpressing samdc resulted
in tolerance to salinity (Waie and Rajam, 2003). However, it is not
clear whether the enhanced tolerance is due to increased PA
catabolism or increased PA titers (the latter being the main charac-
teristic caused by the overexpression of a biosynthetic enzyme).
To unravel the possible contribution of apoplastic PAs to the
signaling of tolerance responses, we have developed and used
transgenic tobacco plants with modified PAO levels, through
sense (Moschou et al., 2008) and antisense (this work) technol-
ogy. The results presented here show that upon abiotic stress,
Spd is secreted into the apoplast and catabolized by PAO to
produce H2O2, which acts as a second messenger either to
trigger additional cell-protective stress responses or to induce
PCD in a dose-responsive manner. To further establish the
potential role of the ratio of PA anabolism to catabolism in plant
tolerance, we developed and used transgenic tobacco plants
with downregulated SAMDC via RNA interference (RNAi). Re-
sults obtained with these transgenic tobacco plants showed that
lowering the PA anabolism-to-catabolism ratio is sufficient to
promote PCD under abiotic stress, reinforcing the view that the
regulation of PA catabolism in the apoplast is a key factor that
exerts a specific role in abiotic stress responses.
RESULTS
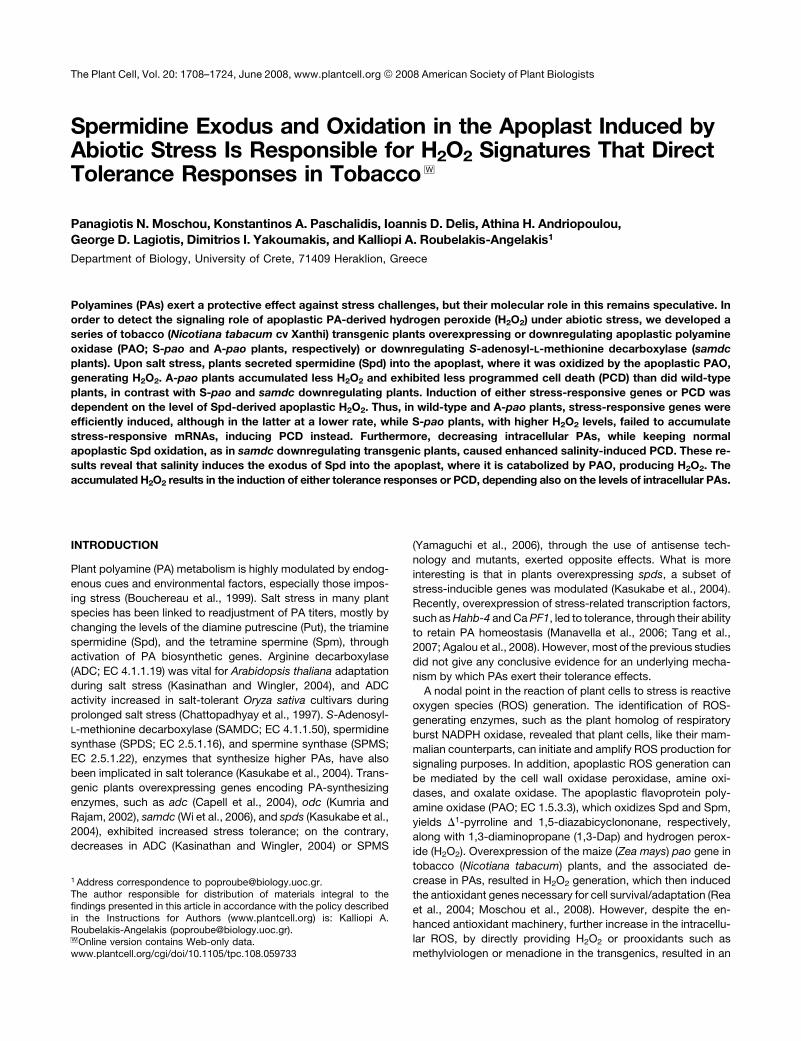
Production and Screening of Antisense pao Tobacco
Transgenic Lines: Downregulation of the pao Gene
Results in Decreased PAO Protein and PAO Activity
We have already developed transgenic tobacco (cv Xanthi) plants
carrying the full-length maize pao (m pao) cDNA in the sense
orientation (S-pao), under the control of the 35S promoter
(Moschou et al., 2008). In this work, we have generated plants
expressing antisense pao (A-pao) cDNA (Figure 1A). All eight
regenerated transgenic lines exhibited decreased PAO levels
(Figure 1; see Supplemental Figure 1 online). The pao antisense
and endogenous transcript levels were assessed by RNA gel
Figure 1. A-pao Generation and Analysis of PAO mRNA, Protein, and Activity Levels.
(A) Construct used for the production of stable A-pao lines. RB, right border; nptII, neomycin phosphotransferase II; 35S CaMV, 35S promoter from the
Cauliflower mosaic virus; pao, m pao cDNA expressed in the antisense direction; ocs ter, octopine synthase transcription terminator; LB, left border.
(B) RT-PCR (top) showing endogenous pao (Nt pao) and actin mRNA levels and RNA gel blot analysis of the antisense m pao transcript (middle, with gel
showing equal loading below). Densitometric analysis (bottom) is shown for both m pao and Nt pao. In both cases, mRNAs were equalized against actin.
(C) PAO protein levels in wild-type, A2, and A6 antisense lines (80 mg total protein/well). Numbers above the bands correspond to the relative intensities
of the signals compared with wild-type plants. For comparison, a protein gel blot of PAO from the sense lines S2.2, S4, and S6.5 (Moschou et al., 2008)
is shown (30 mg total protein/well).
(D) PAO activity levels in wild-type, A2, and A6 antisense lines (milliunits/mg protein). The numbers above the bars represent relative activities of the lines
with respect to wild-type plants. Data are means 6 SE of three independent experiments, and asterisks indicate statistical significance at P < 0.05.
PAO Deregulation Alters Stress Responses 1709
blotting and RT-PCR, respectively. The m pao and tobacco pao
(Nt pao) cDNAs shared 77.5% sequence similarity over 0.3 kb in
their C termini, whereas in the remaining part of the cDNAs
sequence similarity was lower (60%). Interestingly, the levels of
both the antisense and endogenous pao transcripts were higher
than in the wild type (Figure 1B; m pao and Nt pao, respectively).
This was correlated with low PAO protein levels (Figure 1C; see
Supplemental Figure 1 online) and reduced enzymatic activities
(Figure 1D; see Supplemental Figure 1 online). The reduction in
PAO protein levels in the A2 and A6 lines (50 and 60%, respec-
tively), correlated well with reduced PAO activity, although the Nt
pao transcript levels increased, suggesting that the low endog-
enous PAO levels are the result of translational inhibition rather
than posttranscriptional inactivation, as suggested previously by
Purnell et al. (2005) (Figure 1).
A-pao Plants Exhibit Increased Soluble Spd Levels
PA titers in all fractions, namely soluble (S), soluble hydrolyzed
(SH), and pellet hydrolyzed (PH), were determined in A-pao plants
(see Supplemental Figure 1 online). S-Spd was 2-fold greater in
line A2 and slightly higher in A6 than in wild-type plants (Figure 2).
SH and PH levels did not change significantly (Figure 2). To the
contrary, S-pao transgenic tobacco plants contained significantly
lower S-PA and SH-PA levels (Figure 2) (Moschou et al., 2008).
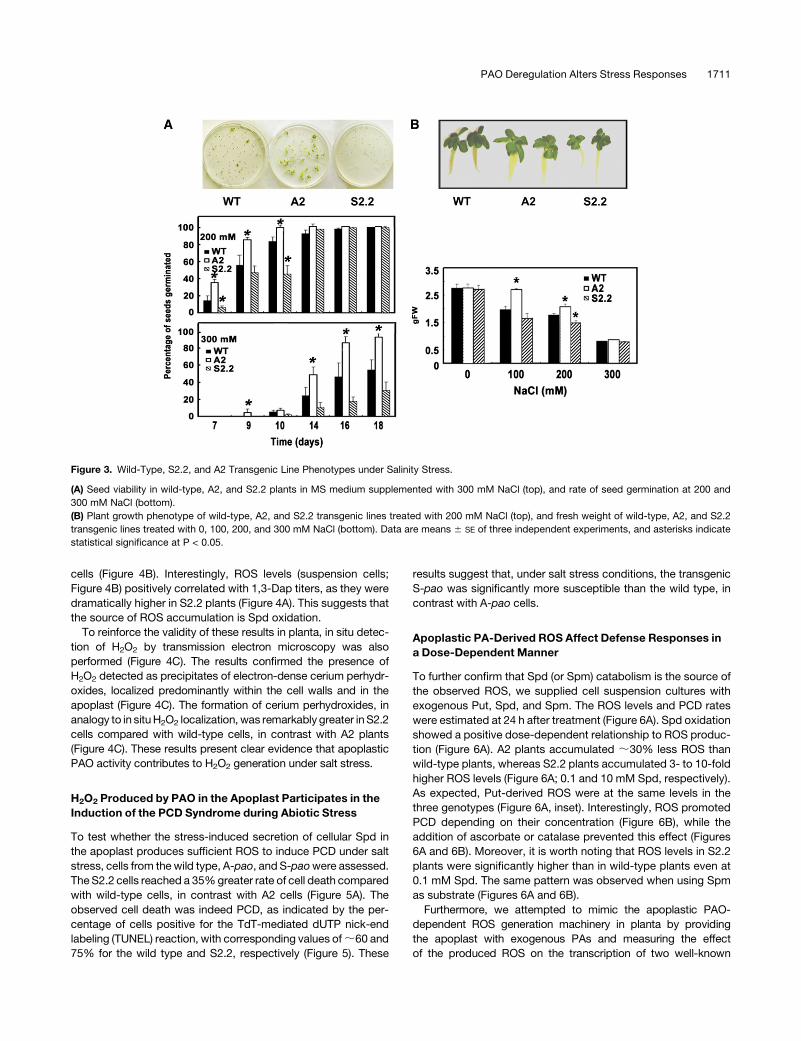
PAO Affects Seed Germinability, Biomass Production, and
Tolerance to Salinity
Transgenic tobacco A-pao and S-pao plants were tested to
examine whether deregulation of PAO affects physiological
characteristics, such as seed germinability, biomass production,
and tolerance to salinity. Transgenic T2 seeds were grown in vitro
on Murashige and Skoog (MS) medium supplemented with NaCl.
A2 seeds germinated faster (Figure 3A; days 7 and 9) and
showed increased viability, mostly at 300 mM NaCl, at which
level a 2-fold increase in seed germination was observed on day
14. To the contrary, S2.2 seeds exhibited a profound decrease in
germination, reaching a 2.6-fold decrease at 300 mM (Figure 3A).
Although a 100% germination of wild-type, A2, and S2.2 seeds
was achieved by day 14 at 200 mM, the rate of germination
differed significantly (Figure 3A). Furthermore, A2 plants grown in
vitro on MS medium supplemented with NaCl showed increased
biomass production of ;40% at 100 mM and 17% at 200 mM
(Figure 3B). At 300 mM NaCl, biomass increased only slightly.
The same trend was observed for the A6 and A8 lines (see
Supplemental Figure 2A online). Conversely, S2.2 plants grown
under the same conditions produced ;20% less biomass than
the wild type (Figure 3B).
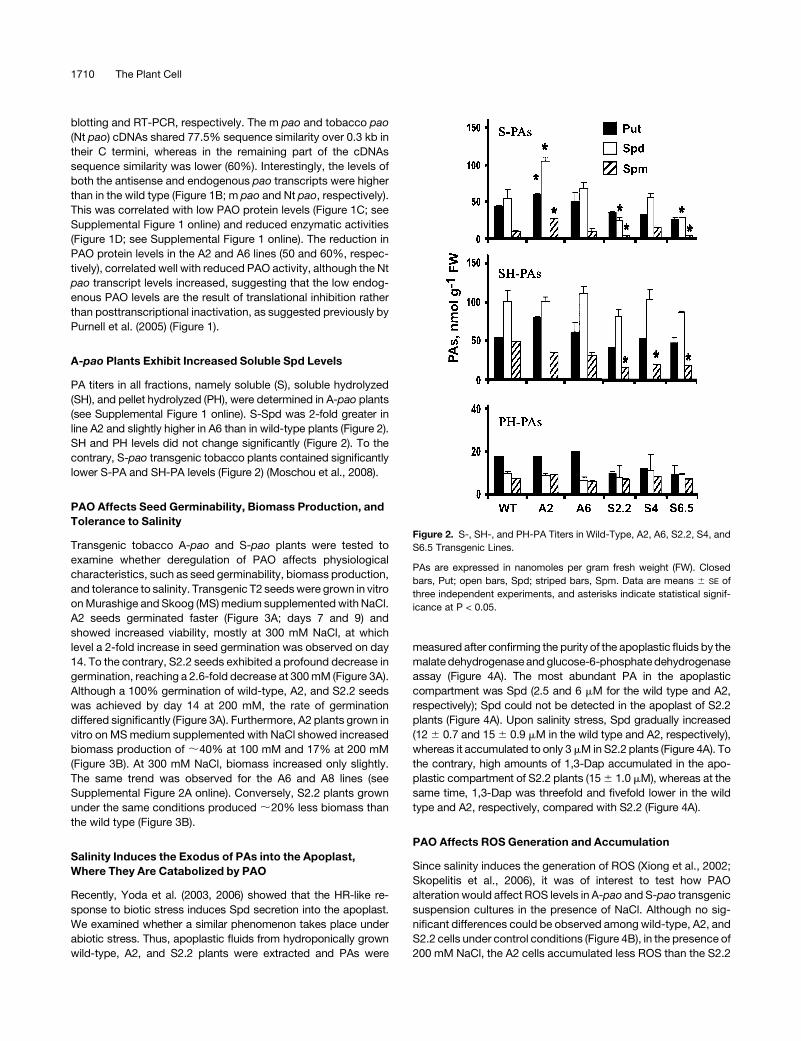
Salinity Induces the Exodus of PAs into the Apoplast,
Where They Are Catabolized by PAO
Recently, Yoda et al. (2003, 2006) showed that the HR-like re-
sponse to biotic stress induces Spd secretion into the apoplast.
We examined whether a similar phenomenon takes place under
abiotic stress. Thus, apoplastic fluids from hydroponically grown
wild-type, A2, and S2.2 plants were extracted and PAs were
measured after confirming the purity of the apoplastic fluids by the
malate dehydrogenase and glucose-6-phosphate dehydrogenase
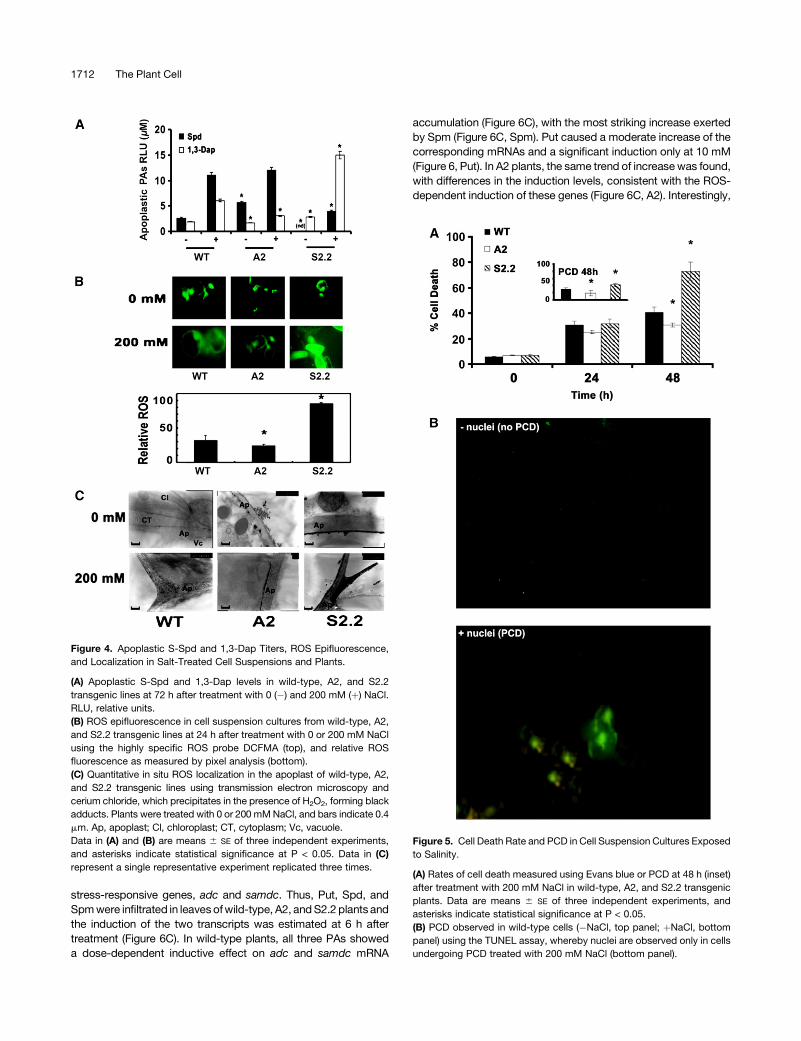
assay (Figure 4A). The most abundant PA in the apoplastic
compartment was Spd (2.5 and 6 mM for the wild type and A2,
respectively); Spd could not be detected in the apoplast of S2.2
plants (Figure 4A). Upon salinity stress, Spd gradually increased
(12 6 0.7 and 15 6 0.9 mM in the wild type and A2, respectively),
whereas it accumulated to only 3 mM in S2.2 plants (Figure 4A). To
the contrary, high amounts of 1,3-Dap accumulated in the apo-
plastic compartment of S2.2 plants (15 6 1.0 mM), whereas at the
same time, 1,3-Dap was threefold and fivefold lower in the wild
type and A2, respectively, compared with S2.2 (Figure 4A).
PAO Affects ROS Generation and Accumulation
Since salinity induces the generation of ROS (Xiong et al., 2002;
Skopelitis et al., 2006), it was of interest to test how PAO
alteration would affect ROS levels in A-pao and S-pao transgenic
suspension cultures in the presence of NaCl. Although no sig-
nificant differences could be observed among wild-type, A2, and
S2.2 cells under control conditions (Figure 4B), in the presence of
200 mM NaCl, the A2 cells accumulated less ROS than the S2.2
Figure 2. S-, SH-, and PH-PA Titers in Wild-Type, A2, A6, S2.2, S4, and
S6.5 Transgenic Lines.
PAs are expressed in nanomoles per gram fresh weight (FW). Closed
bars, Put; open bars, Spd; striped bars, Spm. Data are means 6 SE of
three independent experiments, and asterisks indicate statistical signif-
icance at P < 0.05.
1710 The Plant Cell
cells (Figure 4B). Interestingly, ROS levels (suspension cells;
Figure 4B) positively correlated with 1,3-Dap titers, as they were
dramatically higher in S2.2 plants (Figure 4A). This suggests that
the source of ROS accumulation is Spd oxidation.
To reinforce the validity of these results in planta, in situ detec-
tion of H2O2 by transmission electron microscopy was also
performed (Figure 4C). The results confirmed the presence of
H2O2 detected as precipitates of electron-dense cerium perhydr-
oxides, localized predominantly within the cell walls and in the
apoplast (Figure 4C). The formation of cerium perhydroxides, in
analogy to in situ H2O2 localization, was remarkably greater in S2.2
cells compared with wild-type cells, in contrast with A2 plants
(Figure 4C). These results present clear evidence that apoplastic
PAO activity contributes to H2O2 generation under salt stress.
H2O2 Produced by PAO in the Apoplast Participates in the
Induction of the PCD Syndrome during Abiotic Stress
To test whether the stress-induced secretion of cellular Spd in
the apoplast produces sufficient ROS to induce PCD under salt
stress, cells from the wild type, A-pao, and S-pao were assessed.
The S2.2 cells reached a 35% greater rate of cell death compared
with wild-type cells, in contrast with A2 cells (Figure 5A). The
observed cell death was indeed PCD, as indicated by the per-
centage of cells positive for the TdT-mediated dUTP nick-end
labeling (TUNEL) reaction, with corresponding values of ;60 and
75% for the wild type and S2.2, respectively (Figure 5). These
results suggest that, under salt stress conditions, the transgenic
S-pao was significantly more susceptible than the wild type, in
contrast with A-pao cells.
Apoplastic PA-Derived ROS Affect Defense Responses in
a Dose-Dependent Manner
To further confirm that Spd (or Spm) catabolism is the source of
the observed ROS, we supplied cell suspension cultures with
exogenous Put, Spd, and Spm. The ROS levels and PCD rates
were estimated at 24 h after treatment (Figure 6A). Spd oxidation
showed a positive dose-dependent relationship to ROS produc-
tion (Figure 6A). A2 plants accumulated ;30% less ROS than
wild-type plants, whereas S2.2 plants accumulated 3- to 10-fold
higher ROS levels (Figure 6A; 0.1 and 10 mM Spd, respectively).
As expected, Put-derived ROS were at the same levels in the
three genotypes (Figure 6A, inset). Interestingly, ROS promoted
PCD depending on their concentration (Figure 6B), while the
addition of ascorbate or catalase prevented this effect (Figures
6A and 6B). Moreover, it is worth noting that ROS levels in S2.2
plants were significantly higher than in wild-type plants even at
0.1 mM Spd. The same pattern was observed when using Spm
as substrate (Figures 6A and 6B).
Furthermore, we attempted to mimic the apoplastic PAO-
dependent ROS generation machinery in planta by providing
the apoplast with exogenous PAs and measuring the effect
of the produced ROS on the transcription of two well-known
Figure 3. Wild-Type, S2.2, and A2 Transgenic Line Phenotypes under Salinity Stress.
(A) Seed viability in wild-type, A2, and S2.2 plants in MS medium supplemented with 300 mM NaCl (top), and rate of seed germination at 200 and
300 mM NaCl (bottom).
(B) Plant growth phenotype of wild-type, A2, and S2.2 transgenic lines treated with 200 mM NaCl (top), and fresh weight of wild-type, A2, and S2.2
transgenic lines treated with 0, 100, 200, and 300 mM NaCl (bottom). Data are means 6 SE of three independent experiments, and asterisks indicate
statistical significance at P < 0.05.
PAO Deregulation Alters Stress Responses 1711
stress-responsive genes, adc and samdc. Thus, Put, Spd, and
Spm were infiltrated in leaves of wild-type, A2, and S2.2 plants and
the induction of the two transcripts was estimated at 6 h after
treatment (Figure 6C). In wild-type plants, all three PAs showed
a dose-dependent inductive effect on adc and samdc mRNA
accumulation (Figure 6C), with the most striking increase exerted
by Spm (Figure 6C, Spm). Put caused a moderate increase of the
corresponding mRNAs and a significant induction only at 10 mM
(Figure 6, Put). In A2 plants, the same trend of increase was found,
with differences in the induction levels, consistent with the ROS-
dependent induction of these genes (Figure 6C, A2). Interestingly,
Figure 4. Apoplastic S-Spd and 1,3-Dap Titers, ROS Epifluorescence,
and Localization in Salt-Treated Cell Suspensions and Plants.
(A) Apoplastic S-Spd and 1,3-Dap levels in wild-type, A2, and S2.2
transgenic lines at 72 h after treatment with 0 (�) and 200 mM (þ) NaCl.
RLU, relative units.
(B) ROS epifluorescence in cell suspension cultures from wild-type, A2,
and S2.2 transgenic lines at 24 h after treatment with 0 or 200 mM NaCl
using the highly specific ROS probe DCFMA (top), and relative ROS
fluorescence as measured by pixel analysis (bottom).
(C) Quantitative in situ ROS localization in the apoplast of wild-type, A2,
and S2.2 transgenic lines using transmission electron microscopy and
cerium chloride, which precipitates in the presence of H2O2, forming black
adducts. Plants were treated with 0 or 200 mM NaCl, and bars indicate 0.4
mm. Ap, apoplast; Cl, chloroplast; CT, cytoplasm; Vc, vacuole.
Data in (A) and (B) are means 6 SE of three independent experiments,
and asterisks indicate statistical significance at P < 0.05. Data in (C)
represent a single representative experiment replicated three times.
Figure 5. Cell Death Rate and PCD in Cell Suspension Cultures Exposed
to Salinity.
(A) Rates of cell death measured using Evans blue or PCD at 48 h (inset)
after treatment with 200 mM NaCl in wild-type, A2, and S2.2 transgenic
plants. Data are means 6 SE of three independent experiments, and
asterisks indicate statistical significance at P < 0.05.
(B) PCD observed in wild-type cells (�NaCl, top panel; þNaCl, bottom
panel) using the TUNEL assay, whereby nuclei are observed only in cells
undergoing PCD treated with 200 mM NaCl (bottom panel).
1712 The Plant Cell
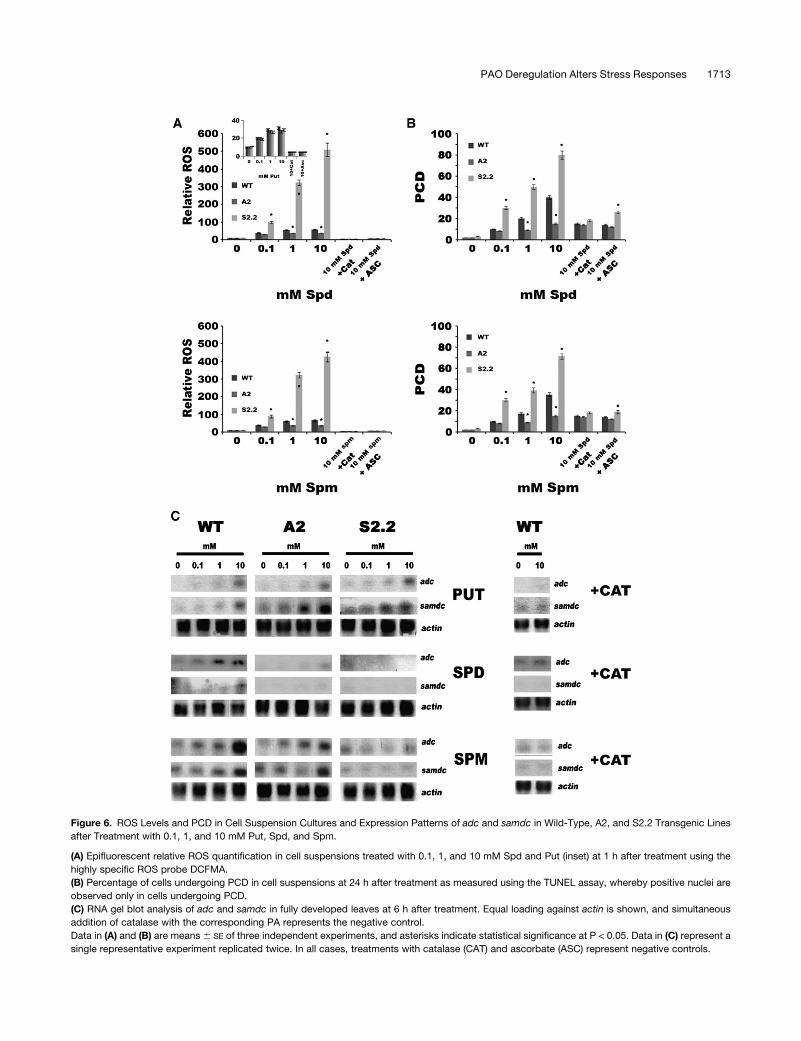
Figure 6. ROS Levels and PCD in Cell Suspension Cultures and Expression Patterns of adc and samdc in Wild-Type, A2, and S2.2 Transgenic Lines
after Treatment with 0.1, 1, and 10 mM Put, Spd, and Spm.
(A) Epifluorescent relative ROS quantification in cell suspensions treated with 0.1, 1, and 10 mM Spd and Put (inset) at 1 h after treatment using the
highly specific ROS probe DCFMA.
(B) Percentage of cells undergoing PCD in cell suspensions at 24 h after treatment as measured using the TUNEL assay, whereby positive nuclei are
observed only in cells undergoing PCD.
(C) RNA gel blot analysis of adc and samdc in fully developed leaves at 6 h after treatment. Equal loading against actin is shown, and simultaneous
addition of catalase with the corresponding PA represents the negative control.
Data in (A) and (B) are means 6 SE of three independent experiments, and asterisks indicate statistical significance at P < 0.05. Data in (C) represent a
single representative experiment replicated twice. In all cases, treatments with catalase (CAT) and ascorbate (ASC) represent negative controls.
PAO Deregulation Alters Stress Responses 1713
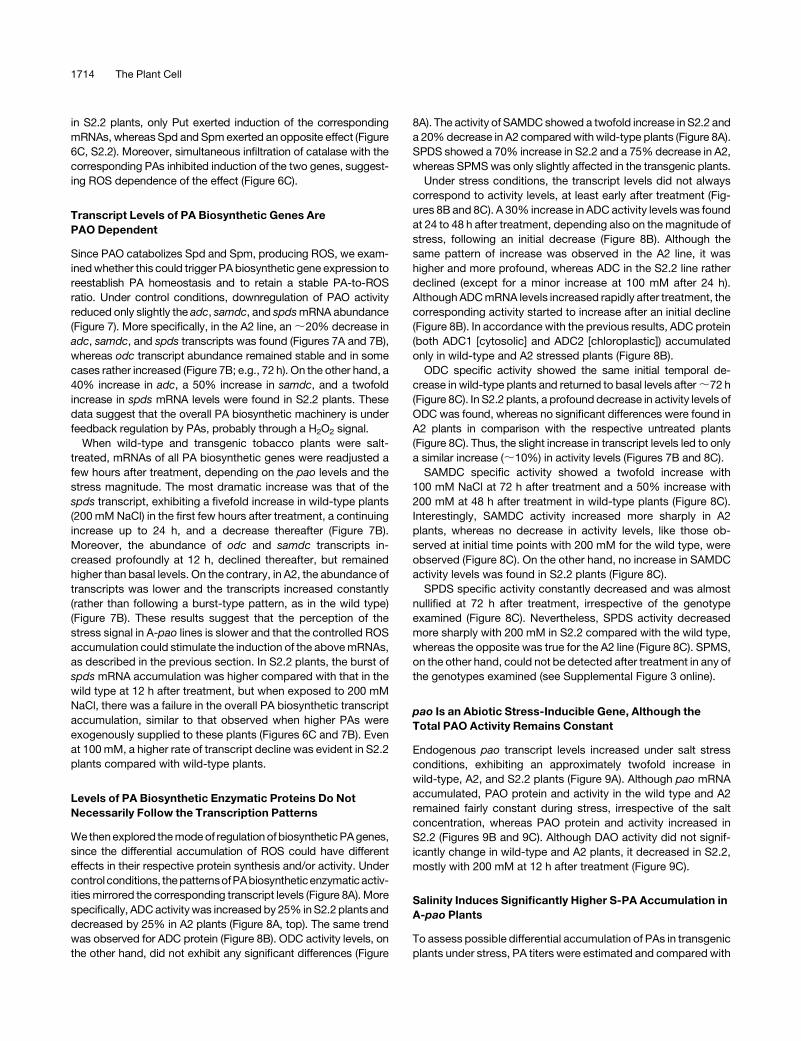
in S2.2 plants, only Put exerted induction of the corresponding
mRNAs, whereas Spd and Spm exerted an opposite effect (Figure
6C, S2.2). Moreover, simultaneous infiltration of catalase with the
corresponding PAs inhibited induction of the two genes, suggest-
ing ROS dependence of the effect (Figure 6C).
Transcript Levels of PA Biosynthetic Genes Are
PAO Dependent
Since PAO catabolizes Spd and Spm, producing ROS, we exam-
ined whether this could trigger PA biosynthetic gene expression to
reestablish PA homeostasis and to retain a stable PA-to-ROS
ratio. Under control conditions, downregulation of PAO activity
reduced only slightly the adc, samdc, and spds mRNA abundance
(Figure 7). More specifically, in the A2 line, an ;20% decrease in
adc, samdc, and spds transcripts was found (Figures 7A and 7B),
whereas odc transcript abundance remained stable and in some
cases rather increased (Figure 7B; e.g., 72 h). On the other hand, a
40% increase in adc, a 50% increase in samdc, and a twofold
increase in spds mRNA levels were found in S2.2 plants. These
data suggest that the overall PA biosynthetic machinery is under
feedback regulation by PAs, probably through a H2O2 signal.
When wild-type and transgenic tobacco plants were salt-
treated, mRNAs of all PA biosynthetic genes were readjusted a
few hours after treatment, depending on the pao levels and the
stress magnitude. The most dramatic increase was that of the
spds transcript, exhibiting a fivefold increase in wild-type plants
(200 mM NaCl) in the first few hours after treatment, a continuing
increase up to 24 h, and a decrease thereafter (Figure 7B).
Moreover, the abundance of odc and samdc transcripts in-
creased profoundly at 12 h, declined thereafter, but remained
higher than basal levels. On the contrary, in A2, the abundance of
transcripts was lower and the transcripts increased constantly
(rather than following a burst-type pattern, as in the wild type)
(Figure 7B). These results suggest that the perception of the
stress signal in A-pao lines is slower and that the controlled ROS
accumulation could stimulate the induction of the above mRNAs,
as described in the previous section. In S2.2 plants, the burst of
spds mRNA accumulation was higher compared with that in the
wild type at 12 h after treatment, but when exposed to 200 mM
NaCl, there was a failure in the overall PA biosynthetic transcript
accumulation, similar to that observed when higher PAs were
exogenously supplied to these plants (Figures 6C and 7B). Even
at 100 mM, a higher rate of transcript decline was evident in S2.2
plants compared with wild-type plants.
Levels of PA Biosynthetic Enzymatic Proteins Do Not
Necessarily Follow the Transcription Patterns
We then explored the mode of regulation of biosynthetic PA genes,
since the differential accumulation of ROS could have different
effects in their respective protein synthesis and/or activity. Under
control conditions, the patternsofPAbiosyntheticenzymaticactiv-
ities mirrored the corresponding transcript levels (Figure 8A). More
specifically, ADC activity was increased by 25% in S2.2 plants and
decreased by 25% in A2 plants (Figure 8A, top). The same trend
was observed for ADC protein (Figure 8B). ODC activity levels, on
the other hand, did not exhibit any significant differences (Figure
8A). The activity of SAMDC showed a twofold increase in S2.2 and
a 20% decrease in A2 compared with wild-type plants (Figure 8A).
SPDS showed a 70% increase in S2.2 and a 75% decrease in A2,
whereas SPMS was only slightly affected in the transgenic plants.
Under stress conditions, the transcript levels did not always
correspond to activity levels, at least early after treatment (Fig-
ures 8B and 8C). A 30% increase in ADC activity levels was found
at 24 to 48 h after treatment, depending also on the magnitude of
stress, following an initial decrease (Figure 8B). Although the
same pattern of increase was observed in the A2 line, it was
higher and more profound, whereas ADC in the S2.2 line rather
declined (except for a minor increase at 100 mM after 24 h).
Although ADC mRNA levels increased rapidly after treatment, the
corresponding activity started to increase after an initial decline
(Figure 8B). In accordance with the previous results, ADC protein
(both ADC1 [cytosolic] and ADC2 [chloroplastic]) accumulated
only in wild-type and A2 stressed plants (Figure 8B).
ODC specific activity showed the same initial temporal de-
crease in wild-type plants and returned to basal levels after ;72 h
(Figure 8C). In S2.2 plants, a profound decrease in activity levels of
ODC was found, whereas no significant differences were found in
A2 plants in comparison with the respective untreated plants
(Figure 8C). Thus, the slight increase in transcript levels led to only
a similar increase (;10%) in activity levels (Figures 7B and 8C).
SAMDC specific activity showed a twofold increase with
100 mM NaCl at 72 h after treatment and a 50% increase with
200 mM at 48 h after treatment in wild-type plants (Figure 8C).
Interestingly, SAMDC activity increased more sharply in A2
plants, whereas no decrease in activity levels, like those ob-
served at initial time points with 200 mM for the wild type, were
observed (Figure 8C). On the other hand, no increase in SAMDC
activity levels was found in S2.2 plants (Figure 8C).
SPDS specific activity constantly decreased and was almost
nullified at 72 h after treatment, irrespective of the genotype
examined (Figure 8C). Nevertheless, SPDS activity decreased
more sharply with 200 mM in S2.2 compared with the wild type,
whereas the opposite was true for the A2 line (Figure 8C). SPMS,
on the other hand, could not be detected after treatment in any of
the genotypes examined (see Supplemental Figure 3 online).
pao Is an Abiotic Stress-Inducible Gene, Although the
Total PAO Activity Remains Constant
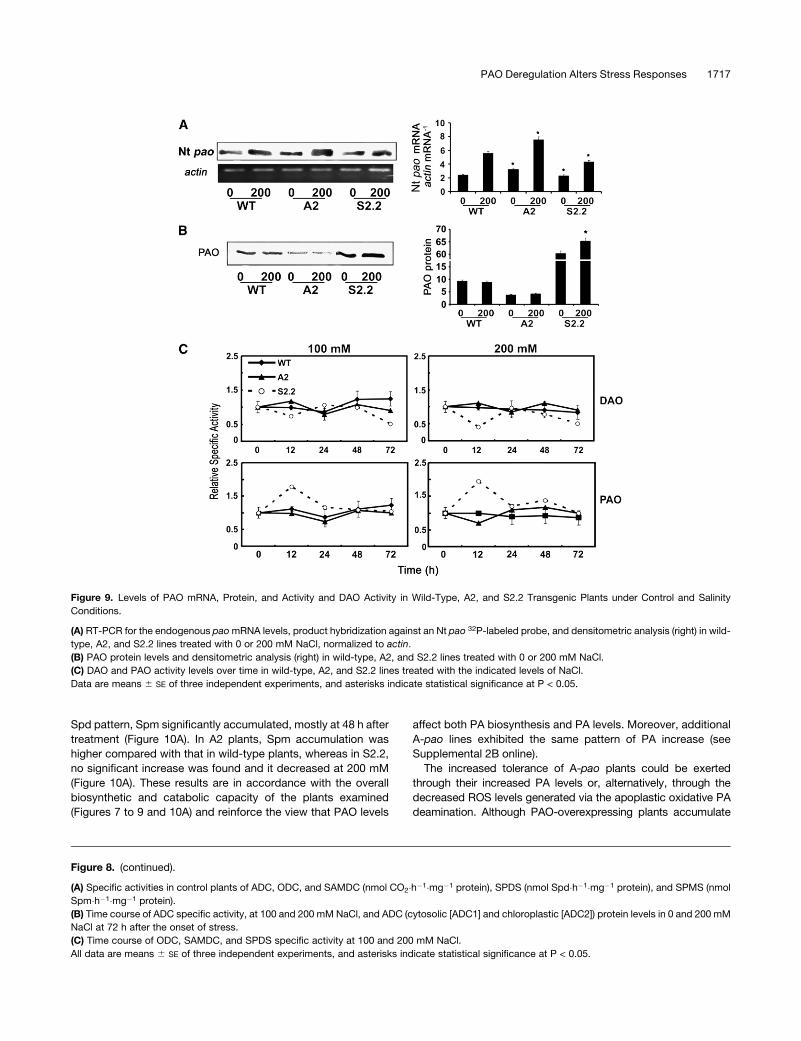
Endogenous pao transcript levels increased under salt stress
conditions, exhibiting an approximately twofold increase in
wild-type, A2, and S2.2 plants (Figure 9A). Although pao mRNA
accumulated, PAO protein and activity in the wild type and A2
remained fairly constant during stress, irrespective of the salt
concentration, whereas PAO protein and activity increased in
S2.2 (Figures 9B and 9C). Although DAO activity did not signif-
icantly change in wild-type and A2 plants, it decreased in S2.2,
mostly with 200 mM at 12 h after treatment (Figure 9C).
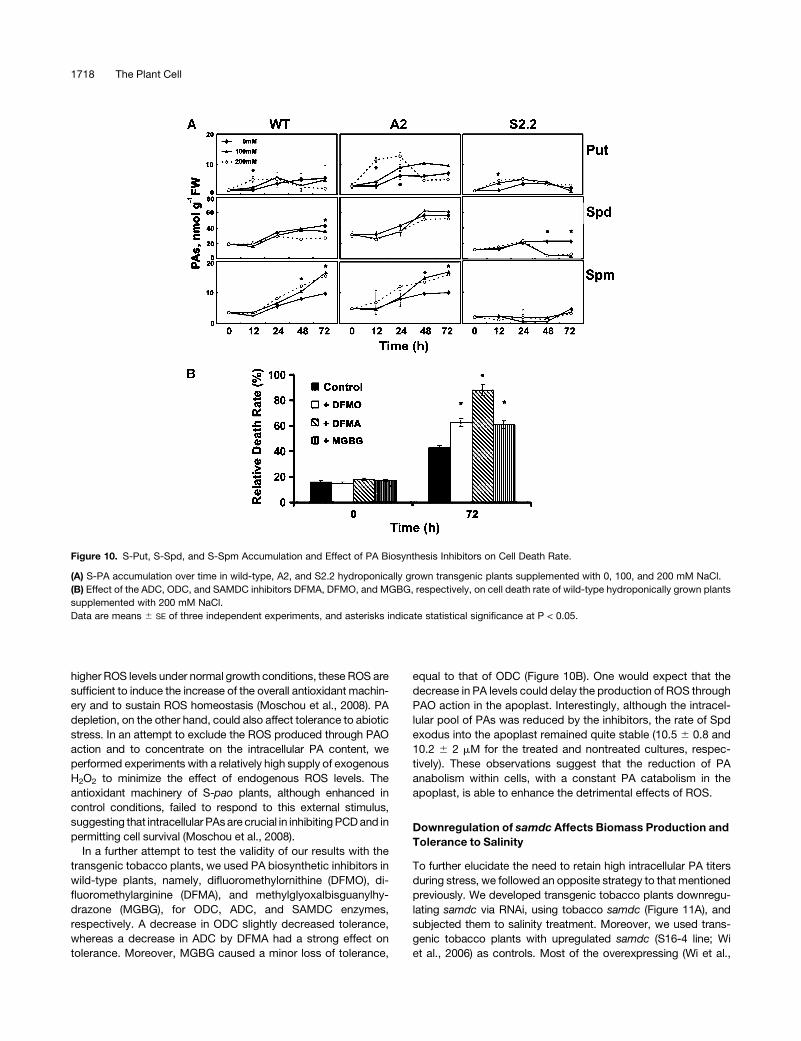
Salinity Induces Significantly Higher S-PA Accumulation in
A-pao Plants
To assess possible differential accumulation of PAs in transgenic
plants under stress, PA titers were estimated and compared with
1714 The Plant Cell
the corresponding biosynthetic and catabolic enzymatic activi-
ties (Figure 10). Soon after the onset of stress, Put increased in all
transgenic lines and in wild-type plants (Figure 10A). This in-
crease was more profound in A2 plants, exhibiting an up to four-
fold transient increase (Figure 10A, 24 h) followed by a decrease
(Figure 10A), in accordance with the higher ADC activity in these
plants (Figure 8B). On the other hand, Spd rather decreased in all
genotypes, mainly at 24 h after treatment, except for a slight
increase in A2 plants with 100 mM at 48 h after treatment (Figure
10A). Spd was more profoundly decreased in S2.2 plants,
consistent with both the lower overall biosynthetic activities
and the higher catabolic activities (Figures 9 and 10A). Moreover,
the lack of increase in Spd titers could be due to its redistribution
to the apoplast, where it is catabolized. In contrast with the
Figure 7. Expression Patterns of adc, odc, samdc, and spds in Wild-Type, A2, and S2.2 Transgenic Plants under Control and Salinity Conditions using
100 and 200 mM NaCl.
(A) RNA gel blot analysis of the expression of adc, odc, samdc, and spds genes at 12 h after the onset of salt stress.
(B) mRNA level quantification (mRNA/actin) at 12, 24, 48, and 72 h after treatment. Data represent a single representative experiment replicated
three times.
PAO Deregulation Alters Stress Responses 1715
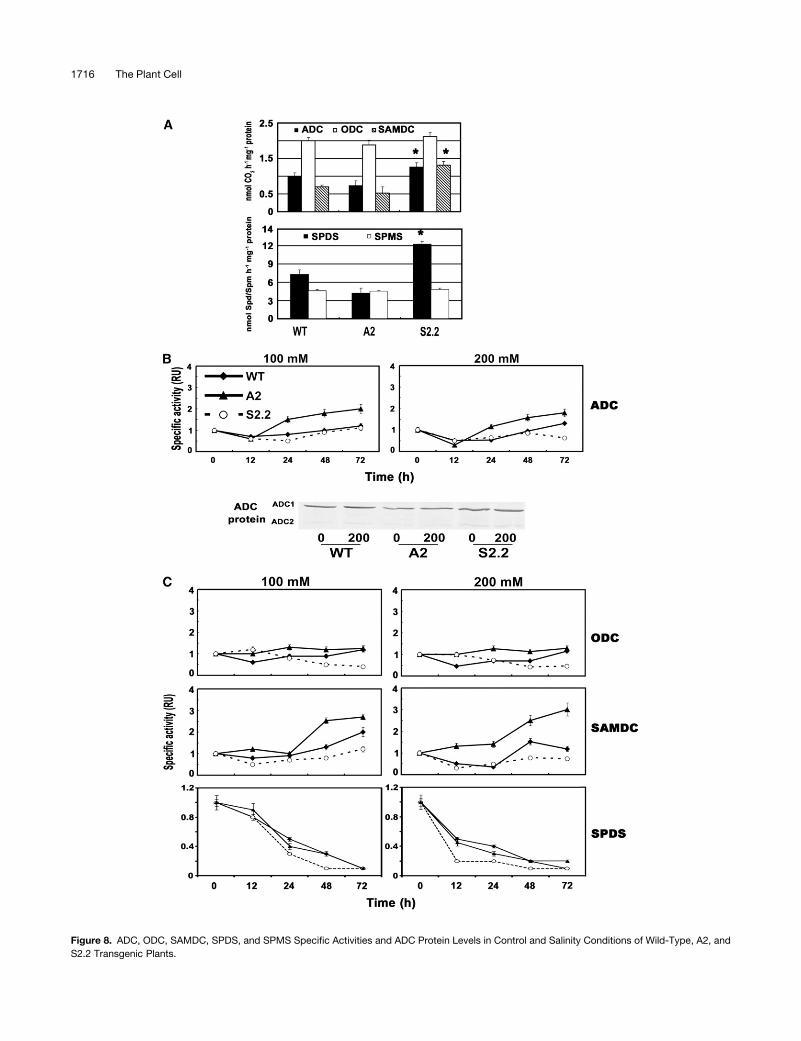
Figure 8. ADC, ODC, SAMDC, SPDS, and SPMS Specific Activities and ADC Protein Levels in Control and Salinity Conditions of Wild-Type, A2, and
S2.2 Transgenic Plants.
1716 The Plant Cell
Spd pattern, Spm significantly accumulated, mostly at 48 h after
treatment (Figure 10A). In A2 plants, Spm accumulation was
higher compared with that in wild-type plants, whereas in S2.2,
no significant increase was found and it decreased at 200 mM
(Figure 10A). These results are in accordance with the overall
biosynthetic and catabolic capacity of the plants examined
(Figures 7 to 9 and 10A) and reinforce the view that PAO levels
affect both PA biosynthesis and PA levels. Moreover, additional
A-pao lines exhibited the same pattern of PA increase (see
Supplemental 2B online).
The increased tolerance of A-pao plants could be exerted
through their increased PA levels or, alternatively, through the
decreased ROS levels generated via the apoplastic oxidative PA
deamination. Although PAO-overexpressing plants accumulate
Figure 8. (continued).
(A) Specific activities in control plants of ADC, ODC, and SAMDC (nmol CO2�h�1�mg�1 protein), SPDS (nmol Spd�h�1�mg�1 protein), and SPMS (nmol
Spm�h�1�mg�1 protein).
(B) Time course of ADC specific activity, at 100 and 200 mM NaCl, and ADC (cytosolic [ADC1] and chloroplastic [ADC2]) protein levels in 0 and 200 mM
NaCl at 72 h after the onset of stress.
(C) Time course of ODC, SAMDC, and SPDS specific activity at 100 and 200 mM NaCl.
All data are means 6 SE of three independent experiments, and asterisks indicate statistical significance at P < 0.05.
Figure 9. Levels of PAO mRNA, Protein, and Activity and DAO Activity in Wild-Type, A2, and S2.2 Transgenic Plants under Control and Salinity
Conditions.
(A) RT-PCR for the endogenous pao mRNA levels, product hybridization against an Nt pao 32P-labeled probe, and densitometric analysis (right) in wild-
type, A2, and S2.2 lines treated with 0 or 200 mM NaCl, normalized to actin.
(B) PAO protein levels and densitometric analysis (right) in wild-type, A2, and S2.2 lines treated with 0 or 200 mM NaCl.
(C) DAO and PAO activity levels over time in wild-type, A2, and S2.2 lines treated with the indicated levels of NaCl.
Data are means 6 SE of three independent experiments, and asterisks indicate statistical significance at P < 0.05.
PAO Deregulation Alters Stress Responses 1717
higher ROS levels under normal growth conditions, these ROS are
sufficient to induce the increase of the overall antioxidant machin-
ery and to sustain ROS homeostasis (Moschou et al., 2008). PA
depletion, on the other hand, could also affect tolerance to abiotic
stress. In an attempt to exclude the ROS produced through PAO
action and to concentrate on the intracellular PA content, we
performed experiments with a relatively high supply of exogenous
H2O2 to minimize the effect of endogenous ROS levels. The
antioxidant machinery of S-pao plants, although enhanced in
control conditions, failed to respond to this external stimulus,
suggesting that intracellular PAs are crucial in inhibiting PCD and in
permitting cell survival (Moschou et al., 2008).
In a further attempt to test the validity of our results with the
transgenic tobacco plants, we used PA biosynthetic inhibitors in
wild-type plants, namely, difluoromethylornithine (DFMO), di-
fluoromethylarginine (DFMA), and methylglyoxalbisguanylhy-
drazone (MGBG), for ODC, ADC, and SAMDC enzymes,
respectively. A decrease in ODC slightly decreased tolerance,
whereas a decrease in ADC by DFMA had a strong effect on
tolerance. Moreover, MGBG caused a minor loss of tolerance,
equal to that of ODC (Figure 10B). One would expect that the
decrease in PA levels could delay the production of ROS through
PAO action in the apoplast. Interestingly, although the intracel-
lular pool of PAs was reduced by the inhibitors, the rate of Spd
exodus into the apoplast remained quite stable (10.5 6 0.8 and
10.2 6 2 mM for the treated and nontreated cultures, respec-
tively). These observations suggest that the reduction of PA
anabolism within cells, with a constant PA catabolism in the
apoplast, is able to enhance the detrimental effects of ROS.
Downregulation of samdc Affects Biomass Production and
Tolerance to Salinity
To further elucidate the need to retain high intracellular PA titers
during stress, we followed an opposite strategy to that mentioned
previously. We developed transgenic tobacco plants downregu-
lating samdc via RNAi, using tobacco samdc (Figure 11A), and
subjected them to salinity treatment. Moreover, we used trans-
genic tobacco plants with upregulated samdc (S16-4 line; Wi
et al., 2006) as controls. Most of the overexpressing (Wi et al.,
Figure 10. S-Put, S-Spd, and S-Spm Accumulation and Effect of PA Biosynthesis Inhibitors on Cell Death Rate.
(A) S-PA accumulation over time in wild-type, A2, and S2.2 hydroponically grown transgenic plants supplemented with 0, 100, and 200 mM NaCl.
(B) Effect of the ADC, ODC, and SAMDC inhibitors DFMA, DFMO, and MGBG, respectively, on cell death rate of wild-type hydroponically grown plants
supplemented with 200 mM NaCl.
Data are means 6 SE of three independent experiments, and asterisks indicate statistical significance at P < 0.05.
1718 The Plant Cell
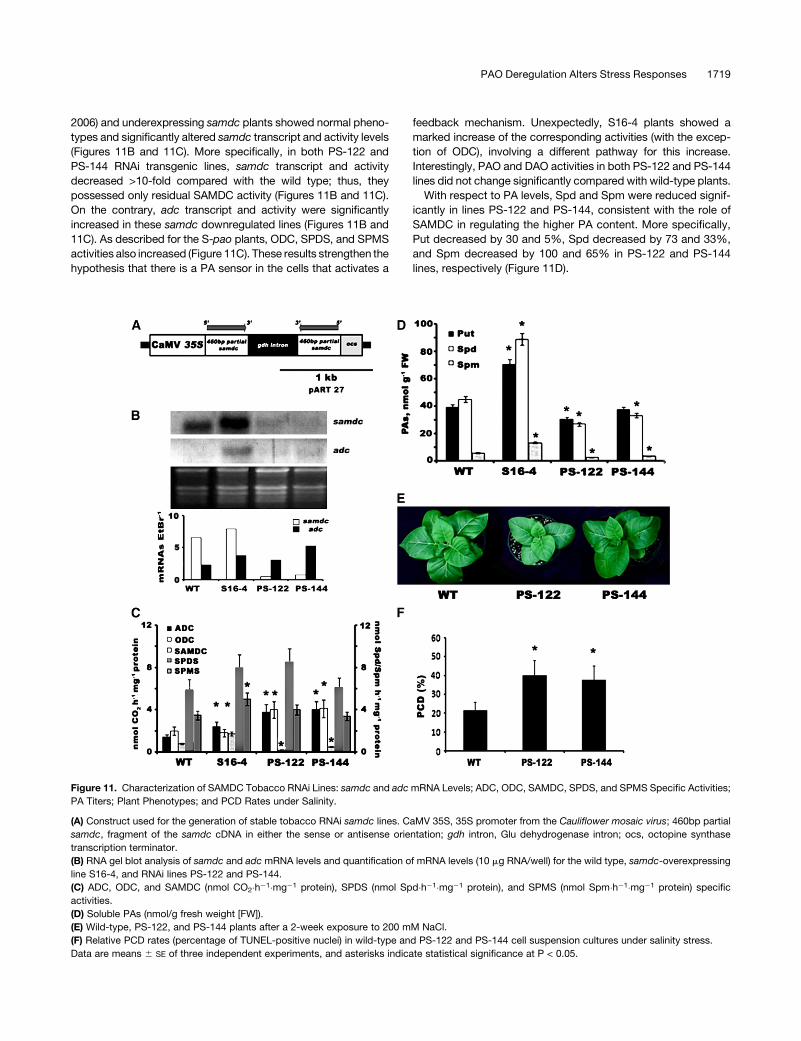
2006) and underexpressing samdc plants showed normal pheno-
types and significantly altered samdc transcript and activity levels
(Figures 11B and 11C). More specifically, in both PS-122 and
PS-144 RNAi transgenic lines, samdc transcript and activity
decreased >10-fold compared with the wild type; thus, they
possessed only residual SAMDC activity (Figures 11B and 11C).
On the contrary, adc transcript and activity were significantly
increased in these samdc downregulated lines (Figures 11B and
11C). As described for the S-pao plants, ODC, SPDS, and SPMS
activities also increased (Figure 11C). These results strengthen the
hypothesis that there is a PA sensor in the cells that activates a
feedback mechanism. Unexpectedly, S16-4 plants showed a
marked increase of the corresponding activities (with the excep-
tion of ODC), involving a different pathway for this increase.
Interestingly, PAO and DAO activities in both PS-122 and PS-144
lines did not change significantly compared with wild-type plants.
With respect to PA levels, Spd and Spm were reduced signif-
icantly in lines PS-122 and PS-144, consistent with the role of
SAMDC in regulating the higher PA content. More specifically,
Put decreased by 30 and 5%, Spd decreased by 73 and 33%,
and Spm decreased by 100 and 65% in PS-122 and PS-144
lines, respectively (Figure 11D).
Figure 11. Characterization of SAMDC Tobacco RNAi Lines: samdc and adc mRNA Levels; ADC, ODC, SAMDC, SPDS, and SPMS Specific Activities;
PA Titers; Plant Phenotypes; and PCD Rates under Salinity.
(A) Construct used for the generation of stable tobacco RNAi samdc lines. CaMV 35S, 35S promoter from the Cauliflower mosaic virus; 460bp partial
samdc, fragment of the samdc cDNA in either the sense or antisense orientation; gdh intron, Glu dehydrogenase intron; ocs, octopine synthase
transcription terminator.
(B) RNA gel blot analysis of samdc and adc mRNA levels and quantification of mRNA levels (10 mg RNA/well) for the wild type, samdc-overexpressing
line S16-4, and RNAi lines PS-122 and PS-144.
(C) ADC, ODC, and SAMDC (nmol CO2�h�1�mg�1 protein), SPDS (nmol Spd�h�1�mg�1 protein), and SPMS (nmol Spm�h�1�mg�1 protein) specific
activities.
(D) Soluble PAs (nmol/g fresh weight [FW]).
(E) Wild-type, PS-122, and PS-144 plants after a 2-week exposure to 200 mM NaCl.
(F) Relative PCD rates (percentage of TUNEL-positive nuclei) in wild-type and PS-122 and PS-144 cell suspension cultures under salinity stress.
Data are means 6 SE of three independent experiments, and asterisks indicate statistical significance at P < 0.05.
PAO Deregulation Alters Stress Responses 1719
PS-122 and PS-144 transgenic T2 plants grown in vitro and
supplemented with 200 mM NaCl showed increased susceptibility
and decreased biomass production upon salinity (Figure 11E).
Moreover, cell suspension cultures derived from these genotypes
showed significantly increased salinity-induced PCD (at 200 mM
NaCl) compared with the wild type (Figure 11F). Furthermore, the
PA biosynthetic machinery of the RNAi samdc lines failed to
respond, in agreement with the corresponding observations for
the S-pao plants (see Supplemental Figure 3 online). Finally, no
significant differences in the PA catabolic activity were observed
during salt stress for any of the genotypes examined, while Spd
exodus to the apoplast remained constant in these plants.
DISCUSSION
That PAs play a pivotal role in plant adaptation to stress condi-
tions has been shown by classical experimental approaches
(Alcazar et al., 2006). Stress-tolerant genotypes show enhanced
PA biosynthesis in response to abiotic stress compared with
stress-sensitive genotypes. In spite of the fact that genetic
manipulation of PA biosynthesis leads to enhanced stress toler-
ance against multiple stresses, the role of PA catabolism in this
response is obscure (Cona et al., 2006). In this work, a series of
transgenic tobacco plants overexpressing and downregulating
pao and samdc (Moschou et al., 2008; this work) were used. As
expected, PAO increase in S-pao plants resulted in significantly
lower Spd and Spm titers, while decrease of PAO activity in
A-pao plants resulted in increased Spd and Spm titers (Figure 2).
As A-pao plants were more tolerant to salinity in contrast with
S-pao plants (Figure 3), this led us to hypothesize that pao may
exert a specific role in abiotic stress adaptation, and it was
tempting to examine the effect of PA catabolism on plant adapta-
tion to stress.
Previously, Yoda et al. (2006) showed the involvement of PAO
in vitro in PCD induction during the HR-like response. Similar to
these results, in which Spd was secreted from the cells upon
elicitation, we show here that abiotic stress triggers Spd exodus
to the apoplast in planta. Thus, under salinity, A-pao plants
showed significantly higher levels of apoplastic Spd and lower
titers of 1,3-Dap, in contrast with S-pao plants (Figure 4). Since
1,3-Dap and H2O2 are produced equimolarly, S-pao plants
accumulated higher ROS levels, particularly in the apoplast,
consistent with the localization of PAO protein in this compart-
ment (Figure 4). The stress-induced constitutive supply of the
apoplast with Spd in S-pao plants initiated a futile cycle of Spd
exodus and catabolism, resulting in a remarkable ROS accumu-
lation, similar to that induced by the HR (Bestwick et al., 1997).
ROS produced during the HR response were both necessary and
sufficient to induce PCD rapidly (Yoda et al., 2006). Thus, it was of
interest to examine whether the Spd-derived apoplastic H2O2
production under abiotic stress conditions was sufficient to
induce PCD. To answer this, we applied salt stress to A-pao and
S-pao cell suspension cultures to induce Spd exodus. A-pao
plants retained lower ROS titers and PCD rates, compared with
wild-type plants, in contrast with S-pao cells (Figure 5). When
PAs were exogenously supplied rather than secreted, lower ROS
and PCD levels were found in A-pao, in contrast with S-pao cell
cultures (Figure 6). These observations reinforce the view that
apoplastic ROS titers are produced via PA oxidation and that the
size and rate of ROS accumulation determine PCD induction.
Furthermore, apoplastic ROS could also exert parallel signaling
effects, such as the expression of ROS stress–responsive genes.
Interestingly, S-pao plants failed to accumulate mRNAs of
stress-responsive genes, such as adc and samdc, as a response
to the application of PAs in the apoplast, whereas in A-pao plants
the corresponding mRNAs accumulated at a slower rate com-
pared with wild-type plants (Figure 6). Taken together, these
results suggest that apoplastic ROS generation induces either
the expression of effector stress–responsive genes or the PCD
syndrome, depending on a specific threshold.
Gene coregulation during stress is one of the most interesting
topics of the ongoing research in plant biology, since the under-
standing of orchestrated responses gives evidence of the met-
abolic pathways and transduction signals important for stress
compensation. To expand the previous results under stress
conditions in vivo, we applied salt stress to S-pao and A-pao
transgenic plants in order to induce Spd exodus and the con-
comitant responses. Depending on the stress magnitude, PA
biosynthetic mRNAs, particularly those of spds, accumulated as
an early response to treatment (Figure 7), as was the case in rice
(Oryza sativa) (Kawasaki et al., 2001). A-pao plants responded to
salt stress with a delay in increasing their corresponding PA
biosynthetic genes. On the other hand, although in S-pao to-
bacco plants an increase in all biosynthetic PA mRNAs was
evident under moderate salt stress treatments, no further re-
sponse to more severe stress was found. This is consistent with
the idea that, depending on the stress magnitude, cells induce
defense genes or promote PCD, depending on the levels of
apoplastic ROS.
To examine the role of the differential PA anabolism and/or
ROS accumulation downstream of gene expression, we studied
the PA biosynthetic rate. Under physiological conditions, the
patterns of biosynthetic PA gene transcription were mirrored by
their corresponding activities in A-pao and S-pao plants, with
reduced PA anabolism in A-pao plants in contrast with S-pao
plants (Figure 8). Under stress conditions, A-pao plants showed
higher biosynthetic activity levels compared with wild-type and
S-pao plants (Figure 8). In addition, S-pao plants were incapable
of retaining high PA biosynthetic activities, suggesting that
vulnerability could be correlated not only with higher ROS
production but also with low biosynthetic activities, as well as
high catabolic activities and vice versa. The fast increase in
mRNAs of PA biosynthetic genes, especially in S-pao plants,
could reflect an attempt to restore normal PA biosynthesis in a
background with redistributed protein synthesis due to stress
conditions. Thus, the early response involves the increase in
transcript levels with no concomitant increase in their translation,
but in a better stress-responsive background like A-pao plants,
activity increases were more profound.
Since an increase of PA biosynthetic rate is considered impor-
tant for stress-induced PA accumulation, we monitored PA titers
under stress conditions (Figure 10). Indeed, higher PA levels were
present under stress in A-pao plants, in contrast with S-pao plants.
Both S-Put and S-Spm increased. On the other hand, the de-
crease of S-Spd could be, at least partly, the result of its secretion
into the apoplastic compartment, where it is catabolized by PAO
1720 The Plant Cell
activity. To elucidate the role of inhibition of PA anabolism in
intracellular PA titers and in PCD occurrence, we investigated the
contribution of the PA anabolism-to-catabolism ratio to the oc-
currence of PCD in a normal catabolic background, this time using
transgenic tobacco plants downregulating samdc via RNAi.
SAMDC is considered the finest choice due to its ability to affect
higher PA levels (Thu-Hang et al., 2002). Although these plants
synthesized less Spd and Spm, they retained a normal PA catab-
olism (Figure 11). When they were exposed to salt stress (although
retaining similar to wild-type Spd exodus and oxidation to the
apoplast as well as similar to wild-type PA-derived apoplastic ROS
production), they failed to respond and adapt, a result that
reinforces the notion that increased PA anabolism is necessary
for PCD inhibition/defense as a response to abiotic stress.
Taken together, the results reported here suggest that plants
efficiently regulate the compartmentalization of PAs. Under phys-
iological conditions, apoplastic PA titers and oxidation-derived
ROS are below the threshold required to trigger stress responses,
while stress induces the accumulation of apoplastic Spd. Plants
may follow this strategy because the apoplast possesses low
antioxidant potential and ROS-derived signals could be more
efficiently transduced when produced in this compartment. Equal
amounts of ROS generated within the cellular compartment could
be scavenged through the highly efficient antioxidant machinery.
However, when higher amounts of PAs are secreted from cells into
the apoplast and catabolized by the high apoplastic PAO activity,
ROS levels exceed a specific threshold and no longer signal the
expression of defense genes but, instead, trigger PCD. This sug-
gests that ROS, as in the case of Ca2þ, could have specific
apoplastic signatures, whereby a downstream array of events acts
in concert to distinguish between the different signals. This pro-
motes differential responses varying between two extremes,
defense signaling and PCD. Overall, our data are in accordance
with an emerging picture for apoplastic PA catabolism, which
seems to contribute to abiotic stress responses/adaptation. We
propose that PCD is strictly regulated by the ratio of PA anabolism
to catabolism, while ROS generation/accumulation is a nodal point
in cell fate decision. When PA anabolism predominates over
PA catabolism, PCD fails to occur, whereas when the opposite
occurs, PCD is induced.
METHODS
Plant Material and Growth Conditions
Tobacco plants (Nicotiana tabacum cv Xanthi) were grown in a growth
chamber with irradiance of ;100 mmol�m�2�s�1, temperature of 25 6
28C, 16-h/8-h photoperiod, and 75% RH. Calluses and cell suspension
cultures were generated from leaf explants (Primikirios and Roubelakis-
Angelakis, 2001).
pao and samdc Tobacco cDNA Cloning and RT-PCR
Total mRNA from petioles was extracted according to Iandolino et al.
(2004) and was subjected to reverse transcription using the Omniscript
reverse transcription kit according to the manufacturer’s instructions
(Invitrogen). To partially clone the pao described by Yoda et al. (2006), the
primers FW (59-GGCAGGATAAGGAAGGA-39) and Rv (59-GTCTGTTAG-
CATTGGTGTTCT-39) were used, and the 621-bp product was cloned into
pGEM-T easy vector (Promega) and sequenced. To clone the tobacco
samdc cDNA, the primers Fw (59-TCTAGATGGATTCGGCCTTG-39) and
Rv (59-GGTACCCAGAGTAAACATGC-39) were used, and the 1104-bp
product was introduced into a pGEM-T easy vector (Promega) and
directly sequenced. For quantitative reactions, total mRNA from leaves
was extracted and treated with RNase-free DNase I for 45 min at 378C.
The samples were then subjected to RT-PCR using polyT as primer and
the Super RT enzyme according to the manufacturer’s instructions (HT
Biotechnology). The samples were normalized according to actin using
the primers Fw (59-GATTTGCTGGTGATGATGC-39) and Rv (59-AAGGG-
TGCTTCAGTAAGTAG-39). More specifically, samples were used for 30,
35, 37, and 40 cycles of PCR (1 min at 948C initial denaturation, 35 s at
948C cycling denaturation, 538C primer annealing, a 30-s extension, and a
5-min final extension) and analyzed using gel electrophoresis to estimate
whether the reaction was still in the logarithmic phase. The actin signal
was radioactively detected following DNA gel blotting of the products,
and this was shown to be quantitative over this range of amplification by
estimating the product density using image analysis (see Supplemental
Figure 4 online). The primers for pao were used for 30 to 35 cycles
(logarithmic phase) of quantitative RT-PCR (2 min at 948C initial denatur-
ation, 40 s at 948C cycling denaturation, 558C primer annealing, a 1-min
extension, and a 7-min final extension). Products were radioactively
detected following DNA gel blotting of the products and quantified using
image analysis (see Supplemental Figure 4 online). Reactions with sam-
ples treated with DNase I but not subjected to reverse transcription were
also used as negative controls.
Vector Construction and Plant Transformation
The m pao cDNA (Tavladoraki et al., 1998) was introduced into a pART7
vector using EcoRI sites. PCR was performed on tobacco samdc cDNA
using the primers Fw (59-GCTCTAGATGGATTCGGCCTTG-39) and Rv
(59-GGGGTACCCAGAGTAAACATGC-39) to obtain a 460-bp fragment
that was introduced in both the sense and antisense orientations (RNAi
samdc), separated by a 600-bp intron, into the pART7 vector. The pART7
vectors in both cases were digested with NotI to give the pao cDNA and
the RNAi samdc, downstream of the 35S cauliflower mosaic virus
promoter. The excised fragments were introduced into the pART27
vector, which was used to transform Agrobacterium tumefaciens strain
LBA4404 (Wi et al., 2006). Stable transformation was achieved using
tobacco leaf discs, and transformants were selected against 150 mg/L
kanamycin in MS medium (Murashige and Skoog, 1962). Preparation of
transgenic tobacco plants overexpressing samdc and m pao was de-
scribed previously (Wi et al., 2006; Moschou et al., 2008).
PA Analysis, Protein Extraction, and Enzyme Assays
S-, SH-, and PH-PA fractions were determined as described previously
(Kotzabasis et al., 1993) using an HP 1100 high-performance liquid chro-
matograph (Hewlett-Packard). Apoplastic PAs were analyzed as described
previously (Yoda et al., 2003, 2006), and the purity of apoplastic fluids was
confirmed using malate dehydrogenase (EC 1.1.1.37) and glucose-6-
phosphate dehydrogenase (EC 1.1.1.49) as cytoplasmic markers, as
described previously (Boudart et al., 2005). Apoplastic fluids were further
tested by measuring PAO activity and by protein gel blot against PAO.
Total proteins were extracted as described (Primikirios and Roubelakis-
Angelakis, 2001). For PAO and DAO assays, a spectrophotometric method
developed by Federico et al. (1985) was used with minor modifications.
More specifically, K-phosphate buffer instead of Na-phosphate buffer was
used, while for S-pao plants, 10 mL of extracts was used instead of 50 mL in
wild-type and A-pao plants. A radiometric method was also used for PAO
and DAO assays according to Paschalidis and Roubelakis-Angelakis
(2005b). ADC, ODC, and SAMDC were assayed by measuring the release
PAO Deregulation Alters Stress Responses 1721
of 14CO2. L-[1-14C]Arg, L-[1-14C]Orn, and adenosyl-L-Met S-[carboxyl-14C],
respectively (American Radiolabeled Chemicals), were used as radioactive
substrates. Labeled CO2 was counted in an LS 6000SE (Beckman) scin-
tillation counter (Paschalidis and Roubelakis-Angelakis 2005a). SPDS and
SPMS were assayed by measuring the formation of Spd and Spm,
respectively, according to Paschalidis and Roubelakis-Angelakis (2005a).
Protein Gel Blotting, RNA Extraction, and DNA and RNA Gel Blotting
Total protein extracts were electrophoretically resolved, transferred to
membranes, and hybridized against an anti-PAO maize (Zea mays)
polyclonal antibody (Angelini et al., 1995) and an anti-ADC grape (Vitis
vinifera) polyclonal antibody (Primikirios and Roubelakis-Angelakis,
2001). DNA gel blotting was performed as described previously (Wi
et al., 2006). For RNA gel blotting, total RNA was extracted with the
optimized hot-phenol method according to Iandolino et al. (2004), trans-
ferred to a membrane, and hybridized to the corresponding 32P-labeled
probe prepared using the RadPrime DNA labeling kit as described by the
manufacturer (Invitrogen). Probes for adc, odc, samdc, spds, and m pao
were prepared as described previously (Paschalidis and Roubelakis-
Angelakis, 2005a, 2005b), while the probe for Nt pao was prepared using
the partially cloned cDNA. X-ray films (Kodak) were used for visualization.
DNA Fragmentation and Epifluorescent ROS Detection
For the detection of nuclear DNA fragmentation, the method described by
Skopelitis et al. (2006) was used. After a 24-h treatment, the cells were
fixed in 4% (w/v) paraformaldehyde in PBS buffer (pH 7.4). Nuclei were
stained with propidium iodide (1 mg/mL) and the free 39-OH groups of
fragmented DNA molecules were labeled by the TUNEL (Promega), as
instructed by the manufacturer.
In situ localization of ROS was performed using the highly sensitive, cell-
permeable probe 29,79-dichlorodihydrofluorescein diacetate (DCFMA;
Molecular Probes). For PA treatments, the corresponding PA solution
was supplied to the cell suspension culture. Cells were harvested, after
centrifugation at 800g, and were incubated in 1 mL of buffer (20 mM
K-phosphate, pH 6.0, supplemented with 50 mM DCFMA and 3 mg/mL
horseradish peroxidase [Sigma-Aldrich]) for 10 min at 258C in darkness. An
aliquot of cells (0.1 mL) was removed, washed in the same buffer, and
visualized immediately.
Photographs were taken using an epifluorescence microscope (Nikon
Eclipse E800) with excitation/emission filter 450 to 490/520 nm using a
SONY 655 DXC-950P camera. Positive controls for TUNEL assay with
DNase I and menadione treatments, menadione for in situ ROS localiza-
tion, and negative controls without terminal transferase for TUNEL assay
and treatments with ascorbate and catalase for in situ ROS localization
were also used.
Transmission Electron Microscopy for H2O2 Localization
H2O2 localization was also detected by the cerium chloride method, as
described by Bestwick et al. (1997). In brief, small pieces (2 to 5 mm3) of
tissues from the central laminae region of tobacco third leaves were
incubated in freshly prepared 50 mM MOPS buffer, pH 7.2, containing
5 mM cerium chloride for 1 h. Subsequently, the samples were fixed in a
mixture of 1.25% (v/v) glutaraldehyde and 1.25% (v/v) paraformaldehyde
in 50 mM cacodylate buffer, pH 7.2, for 1 h. After washing in cacodylate
buffer, samples were postfixed overnight in 1% osmium tetroxide (pre-
pared in cacodylate buffer), dehydrated in a graded ethanol series, and
embedded in London Resin White. Ultrathin sections were examined with
a transmission electron microscope at 80 kV without poststaining. To
confirm the specificity of cerium chloride staining for H2O2, samples were
incubated for 20 min in 50 mM MOPS, pH 7.2, containing either 1 mM
sodium azide (to inhibit peroxidase) or 25 mg/mL bovine liver catalase (to
decompose H2O2). They were then transferred to cerium chloride solu-
tion, incubated for 1 h, and processed for transmission electron micros-
copy, as described above. Some samples were fixed without the cerium
chloride treatment. After postfixation in OsO4, samples were processed
for transmission electron microscopy, as outlined above.
Salt Stress Treatments and Inhibitor Applications
For all salt stress treatments, T2 generation S-pao, A-pao, and samdc
RNAi transgenic tobacco plants were used. For the germination assess-
ment, S-pao and A-pao seeds were surface-sterilized and placed on MS
agar medium with 0, 200, and 300 mM NaCl. For growth assessment,
seeds were first sown in MS medium; after 2 weeks, plants of the same
size were transferred to 0, 100, 200, and 300 mM NaCl-containing MS
medium for 1 month, and plant biomass was estimated as fresh weight.
For the whole plant treatments, 1-month-old plants grown in pots were
transferred to hydroponic cultures and supplemented with increasing
concentrations of MS solution up to half-strength MS medium. After 2 d,
the half-strength MS medium was supplemented with NaCl. For the cell
suspension treatments, exponentially grown cell suspension cultures
were supplemented with NaCl.
Inhibitor studies were performed in hydroponically grown wild-type
plants. Concentrations were as follows: 0.1 mM DFMA, 1 mM DFMO,
and 1 mM MGBG. Each inhibitor was sterilized using a 0.2-mm Supor
Membrane PALL Acrodisc syringe filter (Pall).
Image and Statistical Analysis
Image and pixel analyses and mRNA quantification were performed with
ImageJ 1.37v (rsb.info.nih.gov/ij), and statistical analysis was performed
with SPSS 14v (www.spss.com).
Accession Numbers
Sequence data from this article can be found in the GenBank/EMBL data
libraries under the following accession numbers: adc, AB110952; odc,
AF321138; spds, DQ536198; samdc, AF321142; Nt pao, AB200262; m
pao, AJ002204; actin, AB158612.
Supplemental Data
The following materials are available in the online version of this article.
Supplemental Figure 1. Molecular and Biochemical Analysis of the
A-pao Plants.
Supplemental Figure 2. Biomass of the Wild Type and A2, A6, and
A8 Transgenic Lines Exposed to Salt Stress.
Supplemental Figure 3. Difference in Activity Levels of the PA
Biosynthetic Enzymes and PA Accumulation in the Wild Type and
S16-4, PS-124, and PS-144 Transgenic Lines.
Supplemental Figure 4. Quantitative RT-PCR Analysis of the actin
and Nt pao Genes within the Exponential Phase.
ACKNOWLEDGMENTS
We are grateful to P. Tavladoraki (University Roma Tre), to K. Samejima
(Musashino University), and to K. Park (Sunchon National University) for
the generous gifts of anti-MPAO polyclonal antibody and m Pao cDNA,
decarboxylated S-adenosyl-L-methionine, and samdc-overexpressing
plants, respectively. We also thank Eleftherios Zouros (University of
1722 The Plant Cell
Crete) for critically reading the manuscript and Alexandra Siakouli and
Eva Papadogiorgaki for excellent technical assistance. This project was
cofunded by national and European resources (EPEAEKII-Pythagoras-
Herakleitos) and implemented in the frame of COST Actions 858 and 0605.
Received March 27, 2008; revised May 7, 2008; accepted June 2, 2008;
published June 24, 2008.
REFERENCES
Agalou, A., et al. (2008). A genome-wide survey of HD-Zip genes in rice
and analysis of drought-responsive family members. Plant Mol. Biol.
66: 87–103.
Alcazar, R., Marco, F., Cuevas, J.C., Patron, M., Ferrando, A.,
Carrasco, P., Tiburcio, A.F., and Altabella, T. (2006). Involvement
of polyamines in plant response to abiotic stress. Biotechnol. Lett. 28:
1867–1876.
Angelini, R., Federico, R., and Bonfante, P. (1995). Maize polyamine
oxidase: Antibody production and ultrastructural localization. J. Plant
Physiol. 145: 686–692.
Bestwick, C.S., Brown, I.R., Bennet, M.H., and Mansfield, J.W.
(1997). Localization of hydrogen peroxide accumulation during the
hypersensitive reaction of lettuce cells to Pseudomonas syringae pv
phaseoliocola. Plant Cell 9: 209–221.
Bouchereau, A., Aziz, A., Larher, F., and Martin-Tanguy, J. (1999).
Polyamines and environmental challenges: Recent development.
Plant Sci. 140: 103–125.
Boudart, G., Jamer, E., Rossignol, M., Lafitte, C., Borderies, G.,
Jauneau, A., Esquerre-Tugaye, M.T., and Pont-Lezica, R. (2005).
Cell wall proteins in apoplastic fluids of Arabidopsis thaliana rosettes:
Identification by mass spectrometry and bioinformatics. Proteomics
5: 212–221.
Capell, T., Bassie, L., and Christou, P. (2004). Modulation of the
polyamine biosynthetic pathway in transgenic rice confers tolerance
to drought stress. Proc. Natl. Acad. Sci. USA 101: 9909–9914.
Chattopadhyay, M.K., Gupta, S., Sengupta, D.N., and Ghosh, B.
(1997). Expression of arginine decarboxylase in seedlings of indica
rice (Oryza sativa L.) cultivars as affected by salinity stress. Plant Mol.
Biol. 34: 477–483.
Cona, A., Rea, G., Angelini, R., Federico, R., and Tavladoraki, P.
(2006). Functions of amine oxidases in plant development and de-
fense. Trends Plant Sci. 11: 80–88.
Federico, R., Angelini, R., Cesta, A., and Pini, C. (1985). Determination
of diamine oxidase in lentil seedlings by enzymic activity and immu-
noreactivity. Plant Physiol. 79: 62–64.
Iandolino, A.B., da Silva, F.G., Lim, H., Choi, H., Williams, L.E. and
Cook, D.R. (2004). High-quality RNA, cDNA, and derived EST libraries
from grapevine (Vitis vinifera L.). PMB Rep. 22: 269–278.
Kasinathan, V., and Wingler, A. (2004). Effect of reduced arginine
decarboxylase activity on salt tolerance and on polyamine for-
mation during salt stress in Arabidopsis thaliana. Physiol. Plant. 121:
101–107.
Kasukabe, Y., He, L., Nada, K., Misawa, S., Ihara, I., and Tachibana,
S. (2004). Overexpression of spermidine synthase enhances tolerance
to multiple environmental stresses and up-regulates the expression of
various stress-regulated genes in transgenic Arabidopsis thaliana.
Plant Cell Physiol. 45: 712–722.
Kawasaki, S., Borchert, C., Deyholos, M., Wang, H., Brazille, S.,
Kawai, K., Galbraith, D., and Bohnert, H.J. (2001). Gene expres-
sion profiles during the initial phase of salt stress in rice. Plant Cell 13:
889–905.
Kotzabasis, K., Christakis-Hampsas, M.D., and Roubelakis-
Angelakis, K.A. (1993). A narrow-bore HPLC method for the identi-
fication and quantitation of free, conjugated and bound polyamines.
Anal. Biochem. 214: 484–489.
Kumria, R., and Rajam, M.V. (2002). Ornithine decarboxylase trans-
gene in tobacco affects polyamines, in vitro-morphogenesis and
response to salt stress. J. Plant Physiol. 159: 983–990.
Manavella, P.A., Arce, A.L., Dezar, C.A., Bitton, F., Renou, F.P.,
Crespi, M., and Chan, R.L. (2006). Cross-talk between ethylene and
drought signalling pathways is mediated by the sunflower Hahb-4
transcription factor. Plant J. 48: 125–137.
Moschou, P.N., Delis, I.D., Paschalidis, K.A., and Roubelakis-
Angelakis, K.A. (2008). Transgenic tobacco plants overexpressing
polyamine oxidase are not able to cope with oxidative burst gener-
ated by abiotic factors. Physiol. Plant. 133: 140–156.
Murashige, T., and Skoog, F. (1962). A revised medium for rapid
growth and bioassays with tobacco tissue culture. Physiol. Plant. 15:
473–497.
Paschalidis, K.A., and Roubelakis-Angelakis, K.A. (2005a). Spatial
and temporal distribution of polyamine levels and polyamine anabo-
lism in different organs/tissues of the tobacco plant. Correlations with
age, cell division/expansion, and differentiation. Plant Physiol. 138:
142–152.
Paschalidis, K.A., and Roubelakis-Angelakis, K.A. (2005b). Sites and
regulation of polyamine catabolism in the tobacco plant. Correlations
with cell division/expansion, cell cycle progression, and vascular
development. Plant Physiol. 138: 2174–2184.
Primikirios, N.I., and Roubelakis-Angelakis, K.A. (2001). Indications
for posttranslational regulation of Vitis vinifera L. arginine decarbox-
ylase. Plant Mol. Biol. 45: 669–678.
Purnell, P.M., Skopelitis, D., Roubelakis-Angelakis, K.A., and
Botella, J.R. (2005). Modulation of higher-plant NAD(H)-dependent
glutamate dehydrogenase activity in transgenic tobacco via alteration
of beta subunit levels. Planta 222: 167–180.
Rea, G., Concetta, P.M., Tavazza, R., Biondi, S., Gobbi, V., Ferrante,
P., De Gara, L., Federico, R., Angelini, R., and Tavladoraki, P.
(2004). Ectopic expression of maize polyamine oxidase and pea
copper amine oxidase in the cell wall of tobacco plants. Plant Physiol.
134: 1414–1426.
Skopelitis, D.S., Paranychianakis, N.V., Paschalidis, K.A., Pliakonis,
E.D., Delis, I.D., Yakoumakis, D.I., Kouvarakis, A., Papadakis,
A.K., Stephanou, E.G., and Roubelakis-Angelakis, K.A. (2006).
Abiotic stress generates ROS that signal expression of anionic glu-
tamate dehydrogenases to form glutamate for proline synthesis in
tobacco and grapevine. Plant Cell 18: 2767–2781.
Tang, W., Newton, R.J., Li, C., and Charles, T.M. (2007). Enhanced
stress tolerance in transgenic pine expressing the pepper CaPF1
gene is associated with the polyamine biosynthesis. Plant Cell Rep.
26: 115–124.
Tavladoraki, P., Schinina, M.E., Cecconi, F., Di Agostino, S., Manera,
F., Rea, G., Mariottini, P., Federico, R., and Angelini, R. (1998).
Maize polyamine oxidase: Primary structure from protein and cDNA
sequencing. FEBS Lett. 426: 62–66.
Thu-Hang, P., Bassie, L., Safwat, G., Trung-Nghia, P., Christou, P., and
Capell, T. (2002). Expression of a heterologous S-adenosylmethionine
decarboxylase cDNA in plants demonstrates that changes in
S-adenosyl-L-methionine decarboxylase activity determine levels of
the higher polyamines spermidine and spermine. Plant Physiol. 129:
1744–1754.
Waie, B., and Rajam, M.V. (2003). Effect of increased polyamine
biosynthesis on stress responses in transgenic tobacco by in-
troduction of human S-adenosylmethionine gene. Plant Sci. 164:
727–734.
PAO Deregulation Alters Stress Responses 1723

Wi, S.J., Kim, W.T., and Park, K.Y. (2006). Overexpression of carna-
tion S-adenosylmethionine decarboxylase gene generates a broad-
spectrum tolerance to abiotic stresses in transgenic tobacco plants.
Plant Cell Rep. 25: 1111–1121.
Xiong, L., Schumaker, K.S., and Zhu, J.K. (2002). Cell signaling during
cold, drought, and salt stress. Plant Cell 14 (suppl.): S165–S183.
Yamaguchi, K., Takahashi, Y., Berberich, T., Imai, A., Miyazaki, A.,
Takahashi, T., Michael, A., and Kusano, T. (2006). The polyamine
spermine protects against high salt stress in Arabidopsis thaliana.
FEBS Lett. 22: 6783–6788.
Yoda, H., Hiroi, Y., and Sano, H. (2006). Polyamine oxidase is one of
the key elements for oxidative burst to induce programmed cell death
in tobacco cultured cells. Plant Physiol. 142: 193–206.
Yoda, H., Yamaguchi, Y., and Sano, H. (2003). Induction of hypersen-
sitive cell death by hydrogen peroxide produced through polyamine
degradation in tobacco plants. Plant Physiol. 132: 1973–1981.
1724 The Plant Cell
DOI 10.1105/tpc.108.059733; originally published online June 24, 2008; 2008;20;1708-1724Plant Cell
D. Lagiotis, Dimitrios I. Yakoumakis and Kalliopi A. Roubelakis-AngelakisPanagiotis N. Moschou, Konstantinos A. Paschalidis, Ioannis D. Delis, Athina H. Andriopoulou, George
Signatures That Direct Tolerance Responses in Tobacco2O2Spermidine Exodus and Oxidation in the Apoplast Induced by Abiotic Stress Is Responsible for H
This information is current as of May 24, 2018
Supplemental Data /content/suppl/2008/06/06/tpc.108.059733.DC1.html
References /content/20/6/1708.full.html#ref-list-1
This article cites 34 articles, 12 of which can be accessed free at:
Permissions https://www.copyright.com/ccc/openurl.do?sid=pd_hw1532298X&issn=1532298X&WT.mc_id=pd_hw1532298X
eTOCs http://www.plantcell.org/cgi/alerts/ctmain
Sign up for eTOCs at:
CiteTrack Alerts http://www.plantcell.org/cgi/alerts/ctmain
Sign up for CiteTrack Alerts at:
Subscription Information http://www.aspb.org/publications/subscriptions.cfm
is available at:Plant Physiology and The Plant CellSubscription Information for
ADVANCING THE SCIENCE OF PLANT BIOLOGY © American Society of Plant Biologists