sphiwe hleziphi molefi - unisa
TRANSCRIPT

Utilization and management of beef cattle farming as a contributor to income of households in communal areas of Chief Albert Luthuli Local Municipality in Mpumalanga Province
by
SPHIWE HLEZIPHI MOLEFI
submitted in partial fulfilment of the requirements
for the degree of
MASTER OF SCIENCE
in the subject
AGRICULTURE
at the
UNIVERSITY OF SOUTH AFRICA
SUPERVISOR: PROF C A MBAJIORGU
NOVEMBER 2015

i
DECLARATION
I Sphiwe Hleziphi Molefi declare that “Utilization and management of beef cattle farming as a contributor to income of households in communal areas of Chief Albert Luthuli Local Municipality in Mpumalanga Province” is my own work, that all
the resources used or quoted have been indicated and acknowledged by means of a
complete reference list, and that this dissertation has not previously been submitted by
me for a degree at another university.
SIGNED DATE: 25 November 2015
………………………………………….
Name: SPHIWE HLEZIPHI MOLEFI
Student Number: 55740057

ii
ACKNOWLEDGEMENTS
I would like to thank Almighty God for giving me strength and wisdom throughout my
study. It was not easy, but with HIM on my side I was able to complete this work.
I thank my supervisor Prof Christian Mbajiorgu. I greatly appreciate your tireless
guidance and supervision from the beginning to the end of this work. I also thank Prof
Mike Antwii for his assistance in the statistical analysis of the survey data. Profs, I really
appreciate the support and encouragement you gave me throughout my study.
Thanks also go to my colleagues who contributed to this study, specifically Ms Grace
Ndlovu, Mr Mduduzi Shongwe, Ms Muchaki Munyamane at Chief Albert Luthuli
Municipality and Mr. Andries Zwane at Nooitgedacht Research Station for their
assistance and support on data collection. I also acknowledge the farmers from
Elukwatini, Tjakastaad, Mooiplaas and Dondonald for their time and contributions to the
study.
Lastly, my sincere gratitude and appreciation go to my family members, particularly my
late husband, Mr. Sifiso Molefi, and my sons, Forgive and Oratile Molefi, for their
unwavering support during the course of the study.

iii
ABSTRACT
The study was conducted in four rural communities of the Chief Albert Luthuli
Municipality in the Mpumalanga Province of South Africa. The objective of the study
was to determine the contribution of beef cattle farming to the income of communal
households in Chief Luthuli Municipality. Data were analysed descriptively. Multiple
regression analysis was used to identify the factors that affect the contribution of beef
cattle to income in the study area. It was found that beef cattle farming in the communal
areas studied were practiced equally by women (50%) and men (50%). Over 50.5% of
respondents were over 51 years old and 9.5% of youth participated in beef cattle
farming. The literacy rate among respondents in the study area was 55%, including
Grade 11 or below, Grade 12 and post matric education. Approximately 48% of the
respondents relied on pension income, while 28.5% reported that the main source of
income in their households came from a combination of beef cattle production and
pension. 60.5% of the respondents were found to have more than 20 years of beef
cattle farming experience, while 36.5% have between one and twelve years’
experience. The majority of the respondents (80%) grazed their cattle on the
mountainside, 14.5% said they used communal grazing and 5.5% grazed their animals
in their backyard. It was also found that 50% of respondents maintained up to ten head
of cattle and the other 50% had more than ten cattle in their herds. Of the households
that sold their beef cattle, 77% earned R 10,000 or less per annum while 23% earned
between R 11,000 and R 60,000 per annum. Beef cattle farming were therefore found to
constitute 19% of household income in the communal areas in Chief Albert Luthuli
Municipality. The independent variables which collectively have a statistically significant
influence on the income from beef cattle production at 5% level of significance were:
number of beef cattle (t = 16.8, P < 0.000) and age at mortality (t = -2.59, P< 0.010).
The number of beef cattle has a positive and statistically significant effect and mortality
age a negative effect. It was concluded that the 19% contribution to household income
coming from beef cattle farming in the study area was to be expected in light of the fact
more than half (50.5%) of the respondents were older than 51 years old and 48% of
respondents relied on pensions as a source of income. The danger is that because beef
iv
cattle farming in the study area have been marginalised as an agricultural activity, the
rural poor are decreasingly engaging in beef cattle production as a source of income.

v
TABLE OF CONTENTS
DECLARATION…………………………………………………………………………..i
ACKNOWLEDGEMENTS……………………………………………………………...ii
ABSTRACT……………………………………………………………………………...iii
LIST OF TABLES……………………………………………………………………...viii
LIST OF FIGURES…………………………………………………………………….viii
LIST OF ACRONYMS………………………………………………………………….ix
CHAPTER 1: INTRODUCTION..............................................................................1
1.1 Introduction ...................................................................................................... 1
1.2 Background to the study .................................................................................. 2
1.3 Rationale of the study ...................................................................................... 3
1.4 Statement of the research problem ................................................................. 3
1.5 Research aim .................................................................................................. 4
1.6 Overall objective .............................................................................................. 4
1.6.1 Specific objectives....................................................................................4
1.7 Research question ........................................................................................... 4
1.8 Research assumption/hypothesis .................................................................... 5
1.9 Limitation of the study ...................................................................................... 5
1.10 Definition of key concepts ............................................................................. 5
1.11 Organisation of the dissertation ..................................................................... 6
CHAPTER 2: LITERATURE REVIEW....................................................................8
2.1 Overview of livestock production globally ........................................................ 8
2.2 Overview of beef cattle production in South Africa .......................................... 8
2.3 Land use in communal beef cattle producing areas ........................................ 9
2.4 Reproductive constraints impacting on beef cattle enterprises in communal
areas in South Africa.......................................................................................10
2.4.1 Reproductive performance, age at first calving and calving interval.....10
2.4.2 Breeding system...................................................................................11
2.4.3 Herd size..............................................................................................12
2.4.4 Weaning rate........................................................................................14

vi
2.5 Production constraints impacting on beef cattle enterprises in communal
areas in South Africa ..................................................................................... 15
2.5.1 Management..........................................................................................15
2.5.2 Disease................................................................................................16
2.6 The impact of poor body condition and inadequate infrastructure on
marketing ...................................................................................................... 17
2.7 Contribution of beef cattle production to household income and livelihood in
communal areas in South Africa .................................................................... 18
2.8 Summary ....................................................................................................... 21
CHAPTER 3: RESEARCH METHODOLOGY......................................................22
3.1 Description of the study area ......................................................................... 22
3.1.1 Gert Sibande District..............................................................................22
3.2 Sampling design and sample size ................................................................. 23
3.2.1 Data collection......................................................................................23
3.3 Parameters studied........................................................................................ 24
3.3.1 Demographic and socio-economic characteristics of the smallholder
beef cattle farmers...............................................................................24
3.3.2 Reasons for and details about the keeping of beef cattle....................24
3.3.3 Production and management practices................................................24
3.4 Data processing ............................................................................................ 24
3.5 Data analysis ................................................................................................ 25
3.6 The model specification ................................................................................ 25
CHAPTER 4: RESULTS.......................................................................................29
Section 4.1 .......................................................................................................... 29
4.1.1 Demographic characteristics of the respondents.................................29
4.1.2 Socio-economic characteristics of the respondents.............................30
Section 4.2 .......................................................................................................... 33
4.2.1 Reasons for keeping beef cattle...........................................................33
4.2.2 Rearing of beef cattle for sale..............................................................35
4.2.3 Ranking of beef cattle as a source of income......................................35
4.2.4 Rearing of beef cattle for own consumption.........................................36

vii
4.2.5 Use of beef cattle for draught power....................................................36
4.2.6 Use of cattle for socio-cultural functions..............................................37
4.2.7 Cattle breeds and breeding systems...................................................38
4.2.8 Mating, calving, weaning and mortality in beef cattle...........................39
4.2.9 Farming management practices...........................................................40
4.2.10 Challenges faced by beef cattle farmers.............................................43
Section 4.3...........................................................................................................47
4.3.1 Results of inferential (regression) analyses...........................................47
CHAPTER 5: DISCUSSION.................................................................................49
Section 5.1...........................................................................................................49
5.1.1 Demographics and socio-economic characteristics of the
respondents.........................................................................................49
Section 5.2...........................................................................................................54
5.2.1 Reasons for keeping beef cattle............................................................54
5.2.2 Cattle breeds and breeding practices....................................................56
5.2.3 Beef cattle production............................................................................57
5.2.4 Farming management............................................................................58
5.2.5 Beef cattle farming challenges and solutions.........................................61
Section 5.3...........................................................................................................633
5.3.1 Regression analysis results...................................................................63
CHAPTER 6: CONCLUSION AND RECOMMENDATIONS................................65
REFERENCES.....................................................................................................67
APPENDIX 1: SEMI-STRUCTURED QUESTIONNAIRE.....................................80
APPENDIX 2: DESCRIPTIVE STATISTICS.........................................................91

viii
LIST OF TABLES
1.1 Independent variables and their expected effects........................................ 28
4.1 Demographic characteristics of the respondents......................................... 30
4.2 Socio-economic characteristics of the respondents..................................... 31
4.3 Reasons for keeping beef cattle................................................................... 34
4.4 Draught animals used by the farmers.......................................................... 37
4.5 Use of cattle for socio-cultural functions...................................................... 38
4.6 Farming management practices................................................................... 42
4.7 Challenges faced by beef cattle farmers...................................................... 44
4.8 Possible solutions to challenges faced by beef cattle farmers..................... 46
4.9 Regression analyses.................................................................................... 48
LIST OF FIGURES
3.1 Map of the study area.................................................................................. 22
4.1 Farming experience, land size, number of cattle and income from the sale of beef cattle.................................................................................................
32
4.2 Herd composition......................................................................................... 33
4.3 Selling of beef cattle..................................................................................... 35
4.4 Ranking of beef cattle as a source of income.............................................. 36
4.5 Beef cattle consumption............................................................................... 37
4.6 Preferred breeds, breeding systems and breeding bull sources.................. 39
4.7 Production records with respect to mating, calving, weaning and mortality 41

ix
LIST OF ACRONOMYS
AIDS Acquired Immune Deficiency Syndrome
CRDP Comprehensive Rural Development Project
DACE Department of Agriculture, Conservation and Environment
DAFF Department of Agriculture, Forestry and Fisheries
DoA Department of Agriculture
DARDLEA Department of Agriculture, Rural Development, Land and Environmental
Affairs
FAO Food and Agriculture Organization
GDP Gross Domestic Product
HIV Human Immunodeficiency Virus
KNP Kruger National Park
ME Masibuyele Emasimini
NDA National Department of Agriculture
OLS Ordinary Least Squares
SA South Africa
SSA Statistic South Africa
SPSS Statistic Package of Social Science

1
CHAPTER 1: INTRODUCTION
1.1 Introduction
In 2010, the Department of Agriculture, Fisheries and Forestry (DAFF) reported that
there were approximately 14.1 million beef cattle in South Africa, 60% of which were
owned by commercial farmers and 40% by emerging and communal farmers (DAFF,
2010). This marked demographic imbalance in ownership is accompanied by a
substantial difference in the income of commercial and communal beef cattle producers
with the result that income inequality and poverty are prevalent in South African farming
communities, particularly those with higher density populations.
The revitalisation of beef cattle farming in communal farming areas could be a
promising key solution in the fight against this inequality and poverty. As suggested by
Ogukonya (2014), the advantage of beef cattle farming in the agricultural sector lies in
its potential to provide sustenance for most metropolitan and rural communities. Apart
from this, cattle also strengthen household economies as a source of draught power,
hides, organic fertiliser and fuel, and as a source of income through the sale of animals
and animal products (Moyo and Swanepoel, 2010).
Indeed, beef cattle farming are critical for many poor people in developing countries,
often meeting multiple livelihood objectives and offering ways out of poverty. Similarly,
in deeply rural South African communities, livestock and beef cattle in particular are a
valuable asset as potential collateral should credit be needed when times are hard
(DAFF, 2010).
However, despite the clear advantages that beef cattle farming has for communal
households, the contribution of this form of farming to household income remains
unknown. This is even the case in Gert Sibande District in Mpumalanga Province which
has been a major contributor to South African beef exports, commanding the highest
market share during the periods 2002 to 2004, 2006, 2008 and 2009 (DAFF, 2012).

2
This study aims to ascertain and assess the extent of beef cattle farming utilisation and
management as a contributor to the income of communal households in Chief Albert
Luthuli Municipality in South Africa’s Mpumalanga Province.
1.2 Background to the study
According to Statistics South Africa (SSA) mid-year estimates, the population of
Mpumalanga Province in 2010 was approximately 3.6 million people, representing 7.2%
of South Africa‘s population and making it the sixth most densely populated of the nine
provinces in the country (SSA, 2011). However, Mpumalanga is largely rural and the
majority of its residents rely on subsistence farming for their livelihood. Many rural
residents continue to be marginalised economically and are highly dependent on social
grants. Mpumalanga Province had the highest unemployment rate in the country in
2010 (28.7%) (Department of Agriculture, Rural Development and Land Administration;
Mpumalanga Province, 2012). Almost 49% of households were reported to be earning
less than R3, 500 per month, with pensions and grants making up 22.1% of total income
(Department of Agriculture, Rural Development and Land Administration; Mpumalanga
Province, 2012).
Mpumalanga Province contributes significantly to the country‘s economic growth
through its mining, energy, agriculture, conservation and tourism sectors. Agriculture,
the backbone of the province’s economy, employs 8.1% of the total workforce, as
compared to the national average of 4.7% (Mpumalanga Economic Growth &
Development Path, 2012). However, slow and fluctuating growth in the agricultural
sector led to a decline in its contribution to the economy. The province implemented the
Comprehensive Rural Development Programme (CRDP) in an effort to stimulate
economic growth and alleviate poverty in rural areas such as Chief Albert Luthuli
Municipality. Although the Mpumalanga Department of Agriculture, Rural Development,
Land and Environmental Affairs (DARDLEA) introduced a livestock improvement
programme in 2011 to help farmers increase their livestock production, very little data
was gathered regarding income from beef cattle farming in communal areas in Chief
Albert Luthuli Municipality.

3
1.3 Rationale of the study
Data on the contribution of beef cattle farming to household income in Gert Sibande
District and Chief Albert Luthuli Municipality in particular is limited, particularly in terms
of its potential for reducing the over-dependence on government social grants and
pensions among the rural poor. Information in this regard will help with the introduction
of a sustainable income opportunity for the rural poor, particularly in light of the fact that
estimates indicate that there are more animals in South Africa’s rural livestock farming
sector than in the formal livestock sector, and the demand for beef is increasing
(Phillips, 2013). This is particularly the case in Mpumalanga Province where 74% of
rural community households keep one to ten head of cattle, goats and pigs (SSA, 2011;
2013).
Since there is so little information available about the contribution of cattle farming to
sustainable income generation in rural areas and Chief Albert Luthuli Municipality in
particularly, a need exists to assess this contribution and augment the data with a view
to improving nutritional standards and the socio-economic status of rural farming
households.
1.4 Statement of the research problem
Mpumalanga is a rural province and the majority of its communities rely on subsistence
farming for their livelihoods. As a result, vibrant economic activity tends to be lacking
and households are highly dependent on social grants and pensions. The province had
the highest unemployment rate in the country in 2010 (28.7%) (Department of
Agriculture, Rural Development and Land Administration; Mpumalanga Province, 2012).
One possible way of reducing this ongoing dependence on social grants and pensions
among the rural poor in communal areas in Mpumalanga Province is to revitalise beef
cattle farming by households in these areas. It is envisaged that, in addition to creating
employment opportunities and contributing to the income of rural households,
increasing beef cattle farming would reduce the demand for social grants and pensions
which is a burden on Government. Economically speaking, studies have identified beef

4
cattle as “a living bank” resource for poor rural people, since cattle can easily be
converted into cash should the need arise (Ogukonya, 2014).
The study was designed with a view to augmenting data on the contribution of beef
cattle farming to the income of rural households in communal areas in Chief Albert
Luthuli Municipality in Mpumalanga Province.
1.5 Research aim
The aim of the study is to determine the contribution of beef cattle farming to household
income in Chief Albert Luthuli Municipality in Mpumalanga Province, South Africa.
1.6 Overall objective
The main objective of the study is to determine the contribution of beef cattle farming to
household income in Chief Albert Luthuli Municipality in Mpumalanga Province, South
Africa.
1.6.1 Specific objectives
The specific objectives emanating from the main objective are to investigate:
• The demographic and socio-economic characteristics of smallholder beef cattle
farmers in Chief Albert Luthuli Municipality.
• The factors affecting the contribution of beef cattle farming to household income
in Chief Albert Luthuli Municipality.
1.7 Research question
The study attempts to answer the following research question:
How and to what extent does beef cattle farming in rural communal areas in Chief Albert
Luthuli Municipality of Mpumalanga Province, South Africa contribute to household
income?

5
1.8 Research assumption/hypothesis
The study is based on the following research hypothesis:
Beef cattle farming does not contribute to household income in rural communal areas in
Chief Albert Luthuli Municipality of Mpumalanga Province, South Africa.
1.9 Limitation of the study
Due to the high proportion of agricultural households in communal areas in Chief Albert
Luthuli Municipality which are entirely dependent on animal farming (46.7%) as well as
the high unemployment rate among the youth and other age groups in the study area
who are not engaged in agricultural enterprises (80.5%) (SSA, 2011), it might not be
possible to generalise and apply the results of the present study to other communities in
Mpumalanga Province.
1.10 Definition of key concepts
Livestock farming: Farming in which domesticated animals are raised for the purpose
of producing agricultural commodities such as food, fibre and labour.
Beef cattle: Cows raised for meat production.
Commercial farmers: Farmers who farm for profit, employing few workers to assist on
the farm and relying extensively on technology.
Emerging farmers: Underprivileged farmers who are dependent on farmland received
from Government through land reform programmes and who rely on indigenous
knowledge and techniques in farming for their own consumption.
Smallholder farmers: Farmers whose production exceeds their own requirements and
who sell excess produce directly to consumers or to collection centres or co-operatives
which process and market the products. Due to the variability of production, fair and
stable market access is a huge challenge for such individuals.
Communal areas: Areas where people are sharing work and land.

6
Household: A group of people who are generally bound together by kinship or joint
financial decision-making and who live together under a single roof or in a compound.
These people are normally answerable to one person as head of the household, and
share food provisions.
Household income: A measure of the combined income of all people living in a
particular household, including salaries and wages, retirement or investment income,
and near cash Government transfers such as food stamps.
1.11 Organisation of the dissertation
The dissertation is made up of six chapters structured as follows:
Chapter 1 contains the introduction, background, rationale, overall and specific
objectives of the study, the statement of the research problem, the research question
and research hypothesis, the limitations of the study, definitions of theoretical concepts
used in the study, and the structure of the dissertation.
Chapter 2 explains the history of livestock production globally and the history of beef
cattle production in South Africa. The use of land in communal beef cattle production
areas is explained. This chapter also highlights the reproductive and production
constraints in beef cattle enterprises in communal areas in South Africa. Marketing and
infrastructure and the contribution of beef cattle to household income are discussed.
Chapter 3 gives details of the location and nature of the study area. The chapter also
discusses the sampling design and sample size determination, data collection,
parameters studied, data processing and analysis, and the model specification.
Chapter 4 presents the results of the study in three sections. The first section contains
findings regarding the demographics of the farmers, primarily in socio- economic terms.
The second section focuses on the importance of farming with beef cattle as well as the
contribution of beef cattle to household income in the study area. The third section
presents the results of the regression analysis of factors influencing the income of
farmers from beef cattle production.

7
Chapter 5 gives a detailed discussion of the results of the study based on farmer
demographics focusing on socio-economic aspects.
Chapter 6 contains the conclusion, recommendations in terms of the factors affecting
the contribution of beef cattle farming to household income in communal areas, and
lastly suggestions for further research.

8
CHAPTER 2: LITERATURE REVIEW
2.1 Overview of livestock production globally
According to Nouman et al. (2014), livestock farming accounts for the majority of land
use globally and is expected to double by 2020 with an annual increase of 2.7% in meat
production and 3.2% in milk production. The livestock sector globally is highly dynamic
and evolves in response to rapid increases in the demand for livestock products in
developing countries (Thornton, 2010). Population growth and associated demand for
livestock products means that the sector is currently experiencing an expansion which
presents both challenges and opportunities for rural households in emerging economies
(Ogukonya, 2014). Furthermore, it is projected that people living in rapidly emerging
economies and developing countries such as South Africa and its rural communities will
demand improved animal-based foods in the future (Smith et al., 2013). Research
shows that the increased demand for livestock products can be a key opportunity for
reducing poverty and stimulating economic growth in both developed and developing
countries.
Mwangi (2013) also notes that socio-economic and environmental factors such as
population growth, urbanisation and economic development, changing livestock market
demands, the impacts of climate variability and trends in science and technology have
played a role in variations in livestock numbers and by implication, livestock products.
Moreover, according to Thornton (2010), developments in breeding, nutrition and animal
health will potentially continue to contribute to increased production and further
efficiency and genetic advancements.
2.2 Overview of beef cattle production in South Africa
Beef production is a large and important segment of the farming sector in South Africa
with a highly developed commercial element. However, as beef cattle farming in South
Africa are primarily in the formal sector, more than 75% of the cattle slaughtered are fed
on maize and maize by-products (Scholtz et al., 2013). Webb (2013) observes that beef
production in South Africa increased from 512,000 tons in 2000 to 750,000 tons in 2009,

9
which represents an increase in beef consumption of 20% per annum. He concludes
that the South African beef industry cannot meet the local demand for beef since there
is a consistent shortfall of about 10% per annum. The Department of Agriculture,
Forestry and Fisheries (DAFF) also confirms an increase of 37,000 in cattle production
from 13.5 million in 2004 to 13.87 million in 2011 (DAFF, 2010), while the areas
available for grazing are decreasing due to the expansion of human settlements and
other activities.
South Africa produces 85% of its meat requirements from beef farming, with the
remaining 15% being imported from Namibia, Botswana, Swaziland, Australia, New
Zealand and the European Union (Tyasi et al., 2015). However, the beef industry in
South Africa is affected by external factors such as the fluid and unpredictable national
political milieu, the recent large-scale labour unrest in the agriculture, mining and
transport sectors, and decreases in local foreign investment. Measures need to be put
in place to address factors such as low productivity and shrinkage in grazing area in
light of the projected growth in population to two billion people by 2050 which will be
accompanied by an increase in the demand for red meat (Phillips, 2013).
2.3 Land use in communal beef cattle producing areas
A total of 70% of agricultural land in South Africa is utilised for livestock farming
(Meissner et al., 2013). In communal areas, cattle production often involves extensive
grazing systems, with cattle relying mainly on communally managed natural rangelands
for nutrition (Gwelo, 2013). However, there are many challenges associated with these
communal lands, including poor management, overgrazing, overstocking, uncontrolled
movement of animals, bush encroachment, loss of palatable plant species and land
degradation. Lack of fencing, large numbers of unproductive beef cattle, inadequate
management strategies and almost no marketing have all played a role in low
conception rates and high herd mortality rates in communal cattle farming areas.
Uncontrolled breeding and inbreeding have contributed to low conception rates, and
contagious diseases spread through the uncontrolled movement of cattle result in high
mortality rates in these areas.

10
Although beef cattle production contributes significantly to household food security, land
use privileges in communal areas need to be addressed to ensure that community
members have equal access to the benefits of communal rangelands (National
Department of Agriculture, 2010).
A good understanding of the impact of rangeland management and climatic factors on
beef cattle production is essential for sustainable beef cattle farming. Communities
which improve their farming management practices and adopt technological
developments will improve the productivity of their natural vegetation or planted
pastures, which will in turn have a positive impact on present and future beef cattle
production and food security (Registrar: Livestock Improvement and Identification,
2011).
2.4 Reproductive constraints impacting on beef cattle enterprises in communal areas in South Africa
It is essential that reproduction performance constraints that impact on beef cattle
rearing by closely monitored in order to allow for the development of appropriate
mitigation measures that will help to enhance the reproductivity and productivity of cattle
herds in communal areas. Examples of these constraints are reproductive performance,
age at first calving and calving interval, breeding system, herd size and weaning rate.
2.4.1 Reproductive performance, age at first calving and calving interval
Reproductive efficiency is a major determining factor in production and ultimately the
profitability of beef cow enterprises. The best cows are those which have their first
calves at an early age, have minimal calving intervals and show longevity. Thus the
most important measures of reproductive performance in females are age at first
calving, length of calving interval and length of productive life. However, the
reproductive performance of cows is best indicated by calving rate which is the total
number of calves born out of the total number of breeding cows in a herd. A breeding
cow can be defined as a cow that is susceptible to pregnancy, although study results

11
vary in terms of the age in puberty at which a cow can first bear a calf. Nqeno et al.
(2011) report 1.5 to 2 years and Siegmund-Schultze et al. (2012) report 2 to 2.5 years.
Commercial sectors usually report a calving rate of 55% while a rate of 40% is the
accepted norm for communal sectors (Scholtz & Bester, 2010). The primary reasons for
the low calving rate among communal cattle are delayed age at puberty and at the first
calving interval, and insufficient number of bulls (Nqeno et al., 2011).
As noted by Tada et al. (2012), the majority of farmers in South Africa’s Eastern Cape
Province experienced a long calving interval in heifers, reporting 36 to 48 months as the
age of first calving and 24 to 48 months long calving intervals. Malnutrition rather than
embryonic death or abortion appears to be the most important factor in low calving
rates, causing poor body condition and failure of the dam to conceive (Nqeno et al.,
2010). Nowers et al. (2013) state that since the majority of cows with poor fertility are
not usually culled and nutrition management is not prioritised in communal areas,
inadequate supplementary feeding leads to malnutrition and poor reproduction rates.
Proper management strategies such as providing supplementary feed during dry
seasons can correct or improve the calving rate in communal beef cattle herds.
2.4.2 Breeding system
Most farmers in communal areas still practice natural mating, and without a breeding
system and related infrastructure it is difficult to practice controlled mating. In order to
increase production, a breeding system needs to be implemented in communal areas
(Scholtz et al., 2008).
In addition to the fact that 95% of farmers in communal areas have an open breeding
system whereby neighbouring herds mix freely due to poor infrastructure, inferior bulls
are not castrated which results in uncontrolled breeding or progeny of inferior quality
(Hove et al., 1991; Khombe, 1998; Moyo, 1995). Furthermore, most farmers in
communal areas do not have a restricted breeding season with the result that calves
are born in the winter months when the nutritional status of the rangeland is at its lowest
(Muchenje et al., 2008; Ndlovu, 2007; Sibanda, 1999).

12
These findings are supported by the work of Khombe and Tawonezvi (1995) and
Mhlanga (2000) who indicate that most communal farmers do not own breeding bulls
which has a negative impact during the breeding season (Agritex, 1993). Contrary to the
commercial farming sector where performance plays an important role, communal
farmers still believe that size is the most significant factor in bull selection, followed by
conformation and performance. The presence and appearance of horns are still
important to these farmers, although not favoured in the commercial sector at all
(Scholtz et al., 2008). Furthermore, some communal farmers keep their bulls for more
than eight years which increases the likelihood of their mating with their daughters, and
no bull rotation is practiced among farmers in order to prevent inbreeding (Hove et al.,
1991; Moyo et al., 1993; Nitter, 2000).
Chimonyo et al. (1999) report that most farmers keep only one bull for breeding
purposes, castrating a substantial number of bulls in order to have oxen for draught
power purposes. On the other hand, according to Mapiye et al. (2007), the large number
of bulls in communal areas is an opportunity to be selective and to minimise inbreeding
and low bull fertility rates.
In addition, 50% of cows in communal areas only come on heat after six months of
calving due to poor nutrition after parturition, the shortage of bulls and lack of a weaning
system (Chimonyo et al., 2000; Khombe, 1998; Ngongoni et al., 2006). A higher bulling
rate in communal areas can lower the production input and is therefore justified as a
way of increasing the chances of conception given harsh terrain, low water availability
and the low carrying capacity of rangelands (Nqeno et al., 2010). A bulling rate of as low
as 17% has been reported in communal areas due to the absence of reproductive
techniques to manipulate birth sex ratio, and some farmers are discouraged from
castrating young males (Fuller, 2006). Sereno et al. (2002) report a bull to cow breeding
ratio of 1:6 in Brazil as opposed to the recommended 1:25 in South Africa.
2.4.3 Herd size
Swanepoel and De Lange (1993) and Muchena et al. (1997) have named herd size as a
critical factor in determining herd productivity efficiency, while Nthakheni (1993)

13
suggests that the smaller the herd, the lower the chances of making a living out of
livestock farming. Kadzere (1996) indicate that the quality and productivity of the
animals is not a priority in communal areas in South Africa and that farmers are only
concerned about the number of cattle they own as a reflection of their wealth as an
African. The proportion of young cows and heifers in cattle herds and the percentage of
farmers with young cows and heifers in their herds are both however very low and are
limiting factors which affect both the productivity and reproduction rate of the herds.
Ainslie et al. (2002) suggest that the larger herd sizes observed in group-owned farming
enterprises can be attributed to lower mortality rates and a higher proportion of breeding
females as well as the lower incidence of theft in comparison to the villages. Mortality
rates in heifers and bulls are higher due to the failure to test bulls before breeding and
to cull infected bulls as well as inconsistent vaccination of the herd.
According to Palmer et al. (1999), communal area cattle production does not contribute
significantly to formal agricultural output. However, communal herd sizes vary
considerably between and within regions. In addition, cattle ownership is highly skewed,
with a small number of people owning large herds while the majority own few cattle. In
2013 however, the National Department of Agriculture (NDA) estimated that the number
of cattle in communal areas in South Africa was 5,696, of which 701 were beef cattle in
communal areas in Mpumalanga (NDA, 2013).
According to Stevens and Jabara (1988), some of the challenges that contribute to the
poor body condition of cattle in the communal areas as compared to the commercial
farming sector are the low number of cattle produced and the low average weight of the
animals due to poor management. Mapiye et al. (2009b) suggest that the reason why
households in some rural areas have few cattle is the lack of good quality rangelands.
In another study, Mapiye et al. (2009a) attribute this to the lack of palatable and
nutritious grazing land due to different rainfall patterns which in turn impact on
vegetation growth.

14
2.4.4 Weaning rate
In some communal areas, weaning is left to nature and there is no distinction between
calves, heifers, steers and bulls. Some communal farmers do use systematic weaning
but this is difficult due to poor infrastructure and management practices. Calves will stay
with cows until the age of one year or older and the poor body condition of the cows
often results in low production performance.
A study of performance trends in beef cattle production in communal areas in South
Africa conducted by the National Department of Agriculture (NDA, 2002) indicated that
poor management practices result in the weaning of only five calves per farm at an
average weight of 150 kg each. Mapekula (2009) suggests that weaning weight
depends on the weaning method used as well as several other factors such as the age
and size of the dam and the sex of the calf. Castration of weaned bulls is normal
practice in communal areas in order to have more steers and oxen for use as draught
animals, while some farmers have been reported to delay castration for the purposes of
improving body strength and conformation for draught usage (Abel & Blaikie, 1989).
Birth season and breed affect the weaning weight of calves along with the sex of the
calf and the age of the dam. Calves born during drought or winter season shows poor
growth and weaning weight.
Most of the calves in communal areas experience health related issues, such as
diarrhoea resulting from poor nutritional status of the veld, with the result that the
mortality rate among calves before weaning is high. Some farmers prevent mortalities
by providing supplementary feed but this has not been observed as common practice in
communal areas. It has also been noted that the performance of calves in these areas
is affected by poor milk production in the cows, since first time calving cows need more
feed to maintain their body growth and milk production. Cows which receive no
supplementary feed lose body reserves and experience lactation stress which often
impacts on the growth rate and weaning weight of their calves (McDonald et al., 1995).
To reduce lactation stress and improve calf performance in communal production
systems, farmers need to introduce a fodder flow programme to provide feed for
lactating cows.

15
2.5 Production constraints impacting on beef cattle enterprises in communal areas in South Africa
Apart from reproduction constraints, there are also production factors which have an
effect on beef cattle productivity and the success of cattle production enterprises in
communal areas. It is imperative that farmers have a clear understanding of these
factors and be able to manage them for sustainable cattle improvement and
productivity. The factors include poor management, marketing and infrastructure, lack of
information, and poor body condition and disease in the herds.
2.5.1 Management
Good management is the only way to improve production levels in communal farming.
Very few management practices are routinely applied by farmers in communal areas.
While Government assistance does encourage certain practices such as vaccination
and tick control, deworming and other important practices are mostly lacking. The
animals in these developing areas are generally subject to natural selection where only
the fittest survive. The effect of improved management on the reproduction and
production rates of cattle in communal areas has not as yet been quantitatively
compared to commercial farming (Nowers et al., 2013).
Since beef cattle rely mainly on natural grazing, communally managed rangelands are
critical for nutrition. In this regard, the wealth of indigenous knowledge about cattle and
rangeland management in rural communities should be taken into account when
planning for production. Farmers need to be aware of the nutritional elements of forages
as a basis for strategies that will allow their natural rangelands to continue providing
livestock with adequate nutrients for sustained growth and reproduction, and to cope
with feed scarcity during winter so that beef cattle are not affected (Gwelo, 2013).
There is also a need to implement profit-maximising programmes that can encourage a
shift in perspective around the culture of beef cattle farming and the management of
feeding, breeding and controlling common diseases in communal areas. The
establishment of pest and disease control measures and more available grazing land
and water for agricultural purposes will also greatly enhance production (Adeyeme et

16
al., 2015). It is believed that combining indigenous knowledge with modern animal
husbandry will improve beef cattle production in South Africa’s communal areas.
2.5.2 Disease
Disease and parasites are major constraints faced by communal beef cattle producers
in developing countries due to the unavailability and high cost of drugs (Ndebele et al.,
2007) and inadequate veterinary services (Chawatama et al., 2005). Kaewthamasorn
and Wongsamee (2006) and Rajput et al. (2006) also confirm that disease and
parasitism are rife and a major threat to beef cattle production in communal areas,
where the most common diseases are blackleg, heartwater, babesiosis, anthrax and
anaplasmolisis (Masikati, 2010; Mavedzenge et al. 2006).
Poor management also contributes to the occurrence of common diseases such as
heartwater, gall sickness, black leg, tuberculosis, lumpy skin disease and contagious
abortion (Hanyani-Mlambo et al., 1998). These diseases lead to declines in production
due to increased morbidity and mortality in communal beef cattle (Chawatama et al.,
2005; Duvel & Stephanus, 2000; Mwacharo & Drucker, 2005). Ticks are also a factor in
substantial losses in cattle production, reduced productivity, a decline in fertility and
often death, and are economically the most important ecto-parasite in terms of cattle
production (Rajput et al., 2006).
Mashoko et al. (2006) observed that inadequate access to veterinary extension
services during dipping affected beef cattle production, especially when weekly dipping
was recommended during the rainy season in tropical areas. However, communal
farmers rarely use drugs to treat their cattle, only treating minor diseases using ethno-
veterinary medicine, while medium-scale farmers use modern veterinary medicine
(Francis & Sibanda, 2001).
Disease and death in beef cattle due to poisonous plants has also been reported, with
calves being the most affected group especially during the dry season (Chawatama et
al., 2005). It is important that farmers know which poisonous plants occur in their
grazing areas so that they can be avoided.

17
2.6 The impact of poor body condition and inadequate infrastructure on marketing
Communal farmers generally do not have access to information on recent production
techniques and market conditions such as what products are in demand, quality and
quantity requirements, pricing and market opportunities (Bailey et al., 1999). Despite the
existence of communication systems such as telephones, cell phones and radio,
communal farmers are still for the most part uninformed when it comes to production
techniques, market trends, prices and auction dates (Motshwe, 2006). The transfer of
knowledge and skills through the medium of English makes information inaccessible to
uneducated farmers in particular, and for this reason it is recommended that an effort be
made to use local languages (Coetzee et al., 2005).
Makhura (2001) has also indicated that poor body condition and limited numbers of
marketable cows deter buyers from coming to purchase cattle since they face very high
transactional costs. In addition, farmers get low prices per kilogram especially during dry
spells. Livestock auctioneers and speculators are not prepared to pay competitive
prices for animals in poor body condition, and it was also observed that the age of
animals affects their price in the market, with animals that are too old selling for very
little (Nkhori, 2004).
Stroebel (2004) found that inadequate marketing infrastructure, limited marketable herd
size, high transaction costs and the low purchasing power of buyers are the major
constraints in the efficient marketing of livestock in the Eastern Cape Province of South
Africa. According to Fidzani (1993) on the other hand, poor infrastructure does not
influence livestock marketing since most buyers provide their own loading and transport
services. The National Department of Agriculture noted that farmers located in areas
which lack both physical and institutional infrastructure are isolated from major markets
(NDA, 2005). Some communities have marketing facilities which are in a poor state as a
result of insufficient funds for their maintenance (Frisch, 1999).
However, De Bruyn et al. (2001) found that a number of transaction cost variables (herd
size, distance from auction points, information and risk) have a significant effect on the

18
proportion of produce sold to parastatals and thus indirectly on the choice of marketing
channels, while Jooste (2001) holds that the marketing of livestock is one of the most
complex policy issues that need to be addressed in order to enhance sustainable
smallholder agriculture. The cattle of small scale communal farmers do not meet market
requirements due to the fact that farmers are not making use of breeds with good body
conformation which attract buyers. As a result, most farmers use informal marketing
channels and their animals fetch low prices (Nkosi & Kristen, 1993).
2.7 Contribution of beef cattle production to household income and livelihood in communal areas in South Africa
Commercially, the livestock sector contributes 49% of South Africa’s agricultural Gross
Domestic product (GDP) while Mpumalanga contributes 23% of beef production in the
country (NDA, 2013). However, the contribution of smallholder beef farmers appears to
be minimal, partly due to poor management systems and partly due to lack of
documentation.
The contribution of livestock to the income and financial security of rural households has
been underestimated for several reasons including, but not limited to, a focus on
productivity, minimal consideration of non-monetised products or services, and
overlooking small stock such as goats or poultry. However, the relative contribution of
products and services varies between locations depending on agro-ecological
conditions, markets and income from other sources. In deeply rural areas with adequate
rainfall, the use of cattle for draught and transport may contribute the most to total
value, while this may not be the case in areas where cropping is less prominent and
milk and meat are major value contributors.
In their studies of the contribution and direct-use value of livestock in terms of rural
livelihood, Shackleton et al. (2005) observed that cattle are used for a greater variety of
goods and services than are goats. The savings from livestock sales represented the
most important use, followed by milk and then manure. In addition, non-owners of
livestock benefited by being given manure, milk, draught and meat for free or at a
cheaper rate than otherwise the case.

19
In some areas livestock contribute to communal livelihood as a store of wealth, although
this is underestimated. While most farmers have few animals, the function of livestock
as a safety net is an important contribution to the household. Vulnerable rural
households have managed to ward off the destitution that often follows the loss of a
breadwinner by selling livestock (Shackleton et al., 2000), an unfortunate trend that is
likely to increase as the HIV/AIDS pandemic spreads. As noted by Bembridge and
Tapson (1993), the uses of cattle for transport and in rituals are also undervalued as
contributors to rural livelihoods.
Vetter (2013) suggests that rural households benefit from livestock production in both
cash and non-cash terms. This is important because it contributes to livelihood
diversification and hence resilience. Poorer households tend to rely on a wider range of
benefits from their livestock than wealthier owners (Shackleton et al., 2001). They
derive little cash from livestock sales (Ainslie, 2002; 2005; Mapiye et al., 2009b), with
the direct-use value of products such as milk and meat exceeding that of cash sales
(Shackleton et al. 2005).
Ogukonya (2014) adds that sales per year have a significant and positive effect on
livestock numbers. However, for smallholder farmers the sale of livestock is their only
means of accessing the cash economy. Livestock sales make up 78% of the cash
income of smallholder mixed crop and livestock farmers (Kariuki et al., 2013). At the
same time, livestock production contributes significantly to food security and the
conservation of biodiversity. Livestock therefore makes a multifaceted contribution to
the social and economic development of the rural population (Mandleni & Anim, 2012).
This means that farmers generate enough income from the sale of livestock to cover the
costs of purchasing more breeding stock, feed and supplements, and other expenses
related to improving the productivity and overall performance of the livestock they keep.
Most rural households however keep livestock for a variety of reasons, both economic
and non-economic. They do not make effective use of livestock and cannot be
considered commercial farmers.
There are a number of factors that impact on the contribution of cattle to household
income. The declining economic fortunes of many rural households is fuelling an ever
20
increasing need for livestock as a source of income to supplement cash earnings from
work in urban areas or income claimed from the state such as pensions and grants
(Cousins, 1999; Düvel & Afful, 1996). At the same time, the role of livestock as a form of
savings and insurance safety net is more important than its role as a source of regular
income for the majority of livestock owners in communal areas (Ainslie, 2002; 2005;
Shackleton et al., 2005).
As noted by Vetter (2013), the contribution of livestock to the livelihood of people in non-
livestock owning households has not received enough attention in policy. However, crop
damage caused by livestock constitutes a cost to non-owning households (Shackleton
et al., 2005). While non-owners may receive compensation for crop damage from the
owners of the animals, the cost of preventative fencing is borne solely by the non-
owning households.
Vetter (2013) also draws attention to the importance of natural resources harvested
from rangeland commons as a financial safety net for the rural poor, but the contribution
of these resources to diverse and resilient rural households requires further
investigation, particularly as compared to the contribution of livestock. Uncultivated land
in communal areas is used more extensively and intensively by rural households for
purposes other than livestock. Cousins (1999) refers to these secondary communal land
resources as “hidden capital”. They are used by rural households to provide for their
domestic needs, to save money (for example by using wood fuel instead of electricity)
and to generate income through the sale of raw and processed natural products (Babulo
et al., 2008; Shackleton & Shackleton, 2004; Shackleton et al., 2008;Twine et al., 2003).
The increased reliance on these resources in times of crisis, such as the death of a
primary income earner, contributes to the resilience of many rural households (Hunter et
al., 2007; McGarry & Shackleton, 2009;Paumgarten, 2005;Shackleton & Shackleton,
2004). Income from secondary resources typically contributes more to total household
income than do livestock sales and services, particularly in poorer households (Babulo
et al., 2008; Cavendish, 2000; Thondhlana et al., 2012).
On the other hand, only a small minority of rural households are able to generate
substantial income from the sale of agricultural and natural resource products. In order

21
to alleviate poverty in rural areas, a proper management programme is needed that
promotes communal farming and livelihood diversification by leveraging the contribution
of land-based activities and resources to household income. If this is to be achieved,
issues such as land shortages, tenure security, support services and effective access to
markets for inputs and outputs must be addressed.
2.8 Summary
The general management and farming practices adopted by small-scale beef cattle
farmers in communal areas in South Africa are still traditional and largely unproductive
in nature. They are characterised by communal grazing, overstocking of the veld, small
and unbalanced herds, uncontrolled breeding and crossbreeding, poor reproductive
performance, natural weaning, low milk production and lack of basic disease control.
This results in poor performance in terms of cattle production and its contribution to the
income of households in communal areas in South Africa. The present study was
carried out to assess the potential of beef cattle farming as a contributor to income in
communal households in Chief Albert Luthuli Municipality, Mpumalanga.
22
CHAPTER 3: RESEARCH METHODOLOGY
3.1 Description of the study area
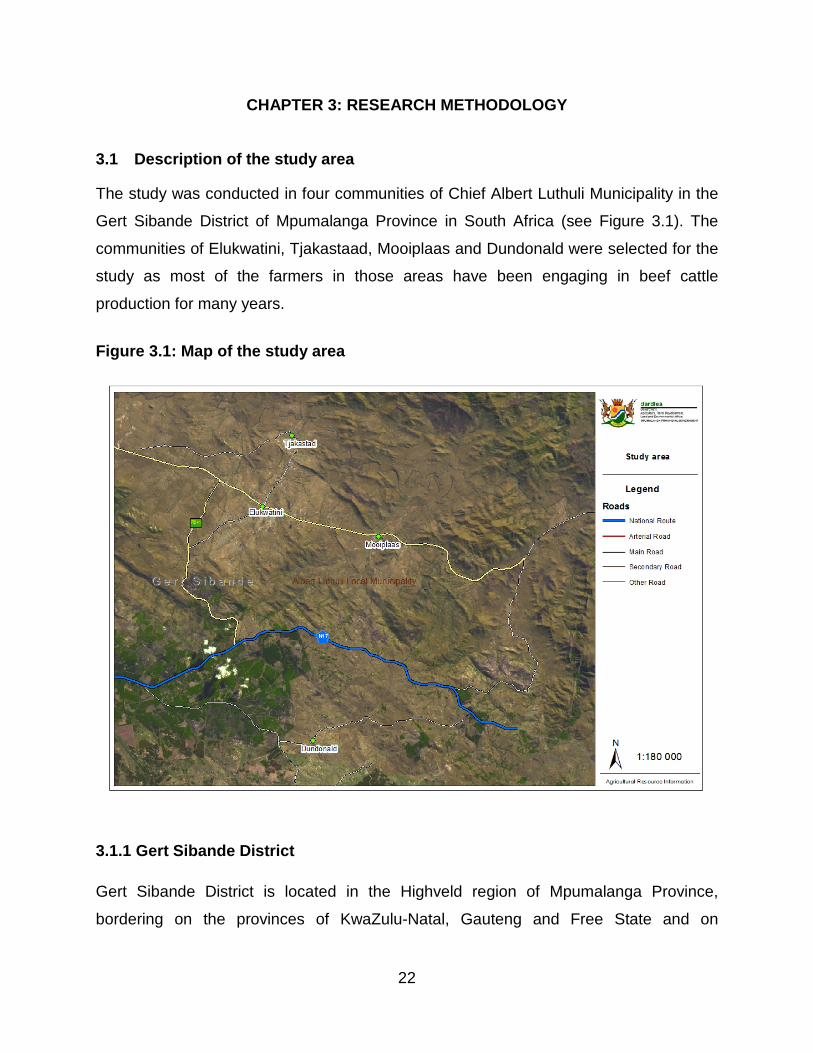
The study was conducted in four communities of Chief Albert Luthuli Municipality in the
Gert Sibande District of Mpumalanga Province in South Africa (see Figure 3.1). The
communities of Elukwatini, Tjakastaad, Mooiplaas and Dundonald were selected for the
study as most of the farmers in those areas have been engaging in beef cattle
production for many years.
Figure 3.1: Map of the study area
3.1.1 Gert Sibande District
Gert Sibande District is located in the Highveld region of Mpumalanga Province,
bordering on the provinces of KwaZulu-Natal, Gauteng and Free State and on

23
Swaziland (Mpumalanga DACE, 2003). The Chief Albert Luthuli municipal area covers
the eastern part of Mpumalanga including the Highveld, Lowveld and eastern regions.
The area has a sub-tropical climate with hot summers and mild to cold winters, with an
average daily temperature of 240C in summer and 14.80C in winter (Mpumalanga
DACE, 2003). The average rainfall is 767 mm per annum, with approximately ten times
more rain in summer than in winter. The annual rainfall is higher in the eastern part (160
mm per annum) than in the west (600 mm per annum) (Mpumalanga DALA, 2006).
The main economic activities in the district are mining, crop production and livestock
production. Subsistence crops grown in the area include maize, soya beans and
vegetables. Livestock species kept in the area include beef cattle, goats, pigs, chickens
and sheep.
3.2 Sampling design and sample size
The heads of households which engage in beef cattle production were randomly
selected and interviewed using a semi-structured questionnaire (see Appendix 1). A
total of 200 smallholder farmers who were willing to participate were involved in the
study, 50 from each of the selected communities of Elukwatini, Tjakastaad, Mooiplaas
and Dundonald. They were briefed on the objectives and nature of the study.
3.2.1 Data collection
The compiled questionnaire was pre-tested before the study commenced for the
purposes of correction and refinement.
The researcher made appointments to visit the participating farmers individually at their
premises. An initial visit was made to build confidence and trust so that the farmers
would participate in the interview fully and without reservation. Although the
questionnaire was compiled in English, local language was used for the interviews.
Data collection was in the form of face-to-face interviews with household heads
engaged in beef cattle production.

24
3.3 Parameters studied
3.3.1 Demographic and socio-economic characteristics of the smallholder beef cattle farmers
The interviews included questions to determine the demographic and socio-economic
characteristics of the respondents. Information was gathered on gender, age and level
of education, main occupation, household size, land size, farming experience, number
of cattle owned and herd composition. Information was also gathered about the amount
and sources of income (with particular reference to income from beef cattle production)
and ranking of income in terms of importance.
3.3.2 Reasons for and details about the keeping of beef cattle
The participants were questioned about the number of people in the household who
raised beef cattle for sale, consumption, draught power and socio-cultural functions
respectively, including which types of socio-cultural functions. Information was also
gathered on breed preferences, breeding systems and sources of breeding bulls.
3.3.3 Production and management practices
In terms of production, cow mating age, calving percentage, weaning age, weaning
percentage, and age and causes of mortality were recorded. Information about
management practices included feed sources used by the farmers, provision of
supplements and supplementation time, body condition of their cattle, and when and
through what channels beef cattle were sold. The participants were also asked about
the constraints that face beef cattle farmers and their views on possible solutions.
3.4 Data processing
Data obtained from the questionnaire were coded and summarised before being
imported into Statistics Package of Social Science (2015) version 22.0 for further
analysis. Descriptive statistics were also used for analysis, and graphs and tables were
used to summarise the results.

25
3.5 Data analysis
Regression analysis was done to establish the social-economic factors affecting the
contribution of beef cattle farming to household income. The multiple regression model
specification applied to the data is described below.
3.6 The model specification
The Ordinary Least Squares (OLS) linear multiple regression model specification was
used to investigate the factors influencing household income from beef cattle keeping.
The dependent variable (incomes) is continuous, and OLS linear multiple regression
models can be used to model a continuous dependent variable.
In this respect, the OLS estimates are linear, unbiased, consistent and normally
distributed, and have minimum variance (Gujarati, 2003). According to Gujarati (2003)
the OLS model may be expressed as:
Yi = β0 + β iXi + ε i (1)
Where Yi is the amount of annual household income of participants, β i are parameters
to be estimated, β0 is a constant and Xi are the factors which influence the income of
the participating households as specified in Table 3.1. The Ordinary Least Squares
principle states that the sum of the squares of the deviation for all values of population
Yi and sample Ŷi, is to be a minimum, i.e.
Σni=1(Yi - Ŷi)2 (2)
Where n is the number of data points composing the sample.
If Y is considered to be dependent upon more than one variable, then
(3)
(4)

26
The sample regression equation, containing the statistics to be used to estimate the
population parameters when there are m independent variables, is
(5)
(6)
From equation (6), b can be determined as
(7)
Then,
The dependent and independent variables used and the parameters estimated are
presented in Table 1. The assumptions of linearity, normality, homoscedasticity and
independence of error were considered to ensure the validity of the model.
Autocorrelation and multicollinearity were checked by the Durbin-Watson statistic and
the VIF values respectively. The Statistical Package for Social Sciences (SPSS)
version 22.0 was used to analyse the OLS model, and the parameter estimates to be

27
provided included regression coefficients βi, constant, standard error, R2, adjusted R2,
VIF, residual analysis, Durbin-Watson, t-values and the F-statistic.
Multiple regression analysis was used to determine the factors affecting the contribution
of beef cattle in household income as follows:
Y = b0 + b1 X1 +b2 X2 +b3 X3 +b4 X4 +b5 X5 +b6 X6 +b7 X7 + e
Where:
Y = Annual household income of participants X1 = Respondent’s age (in years) X2 = Number of household members (people) X3 = Beef cattle farming experience (in years) X4 = Number of beef cattle owned X5 = Non-farming income (IDR/year) X6 = Farming income other than from beef cattle (IDR/year) X7 = Practice herd and veld management (Y/N) b0 = Intercept b0+b1,b2 .. b7 = Regression coefficients associated with X1, X2 .. X7 respectively e = Error

28
Table 1.1: Independent variables and their expected effects
ID Independent variables (Xi)
Variable description Expected sign
1 X1 Respondent’s age (in years) Positive
2 X2 Number of household members (people) Positive
3 X3 Beef cattle farming experience (in years) Positive
4 X4 Number of beef cattle owned Positive
5 X5 Non-farming income (IDR/year) Positive
6 X6 Farming income other than from beef cattle (IDR/year)
Positive
7 X7 Practice veld and herd management (Yes=1, No=0)
Positive
21 Y (dependent variable)
Continuous variable: Annual household income (in Rand)
Source: Information from this study
The values with a significant T test result at p<0.05 were considered.

29
CHAPTER 4: RESULTS
The research results are presented in three sections in this chapter. The first section
focuses on the findings in terms of the demographics and socio-economic
characteristics of the participating farmers. The second section presents the findings
regarding the importance of farming with beef cattle as well as the production and
management systems used by the farmers. The third section presents the results of the
regression analysis on factors influencing income from beef cattle production.
SECTION 4.1
4.1.1 Demographic characteristics of the respondents
The demographics of the respondents are presented in Table 4.1.
It was found that beef cattle rearing in the study area are practiced equally by women
(50%) and men (50%).
Over 50.5% of the respondents were older than 51 years and 9.5% were 30 years old or
younger.
The majority of the respondents (55%) attended school up to Grade 11 or below,
obtained their Grade 12 or had some post matric education, while 45% had received no
schooling at all.
Christianity was found to be the dominant religious affiliation among the respondents
(52%), while 30.5% reported practicing traditional religion and 17.5% said they practiced
both.

30
Table 4.1: Demographic characteristics of the respondents
Variable Range
No. of respondents
(n) Frequency
(%)
Gender Male 100 50.0
Female 100 50.0
Age 21-30 years 3 1.5
31-40 years 16 8.0
41-50 years 80 40.0
>51 years 101 50.5
Education No schooling 90 45.0
Grade 11 or below 81 40.5
Grade 12 28 14.0
Post matric or above 1 0.5
Religious affiliation Christian 104 52.0
Traditional 61 30.5
Christian and traditional 35 17.5
4.1.2 Socio-economic characteristics of the respondents
The socio-economic characteristics of the respondents are presented in Table 4.2
The main source of income for 28.5% of the respondents was found to be a
combination of cattle income and pensions, while 19.5% of the respondents said they
rely on income from salaries and their cattle. However, 43.5% of the respondents
indicated that pension was their most important source of income.
Of the respondents, 81.5% reported having more than four household members while
18.5% have one to two members.

31
Table 4.2: Socio-economic characteristics of the respondents
Variable Range
No. of respondents
(n) Frequency
(%)
Occupation Pensioner 96 48.0
Employed 44 22.0
Self employed 31 15.5
Unemployed 29 14.5
Sources of income Salary 17 8.5
Salary and other 6 3.0
Pension, farming and cattle 1 0.5
Other 7 3.5
Pension 37 18.5
Cattle 17 8.5
Farming 4 2.0
Pension and cattle 57 28.5
Salary and cattle 39 19.5
Pension and farming 1 0.5
Cattle and farming 11 5.5
Cattle and other 3 1.5
Primary source of income Salary 57 28.5
Pension 87 43.5
Cattle 28 19.0
Farming 13 6.5
Other 5 2.5
Household members 1-2 14 7.0
3-4 23 11.5
>4 71 35.5
Other 92 46.0

32
As shown in Figure 4.1, it was noted that 60.5% of the respondents reported having
more than 20 years of experience in beef cattle farming, while 36.5% have been farming
for one to twelve years.
Over 80% of the farmers graze their cattle on the mountains, while 14.5% use
communal grazing land and 5.5% of respondents limit grazing to their backyard.
Furthermore, 50% of respondents reported having between one and ten beef cattle in
their herds, while the other 50% had more than ten.
Of the households that raised beef cattle for sale, 77% said they earn R 10,000 or less
per year and 23% between R 11,000 and R 60,000 per year.
Figure 4.1: Farming experience, land size, number of cattle and income from the sale of beef cattle
Data with regard to herd composition are presented in Figure 4.2.
The respondents keep different animals in their herds. However, herds composed
exclusively of cows account for 34.5% of the herds, while 0.5% of the farmers reported
0.0%
10.0%
20.0%
30.0%
40.0%
50.0%
60.0%
70.0%
80.0%
90.0%
1 - 1
0 y
ears
11 -1
2 ye
ars
>20
year
s
Oth
er
1 - 2
ha
>2 h
a
Oth
er
>4 c
attle
4 -1
0 ca
ttle
>10
catt
le
Oth
er
0 - 5
000
6000
-100
00
1100
0 -2
0000
2100
0 - 4
0000
4100
0 - 6
0000
Farming experience Hectares size Number of cattle Income from beef cattle
Perc
enta
ge re
spon
dent
s

33
keeping only bulls, heifers or calves respectively. Herds comprising a combination of
cows, heifers, calves, bulls and oxen are kept by 62.5% of the farmers.
Figure 4.2: Herd composition
SECTION 4.2
4.2.1 Reasons for keeping beef cattle
The respondents’ reasons for keeping beef cattle are given in Table 4.3. Traditionally,
beef cattle are used for draught power, ceremonies and lobola, and as a symbol of
status. However in the study area, 10.5% of the respondents reported keeping beef
cattle for sale and for their own consumption. A further 10.5% gave their reasons as
manure, ceremonies and milk as well as sale. Only 4% of the respondents said they
keep beef cattle for status only and 2% reported using beef cattle in ceremonies.
0.0%
5.0%
10.0%
15.0%
20.0%
25.0%
30.0%
35.0%
40.0%
Perc
enta
ge re
spon
dent
s
Herd size

34
Table 4.3: Reasons for keeping beef cattle
Reason
No. of respondents
(n) Frequency
(%)
Meat 2 1.0
Milk and sale 10 5.0
Manure, milk and sale 12 6.0
Manure, sale, ceremonies and milk 21 10.5
Manure, sale, skin and ceremonies 11 5.5
Meat, sale, manure and milk 6 3.0
Manure, sale and meat 2 1.0
Meat, sale, draught power, manure and milk 13 6.5
Draught power, sale, manure, milk and ceremonies 18 9.0
Ceremonies, status and sale 13 6.5
Meat, milk and sale 4 2.0
Manure and sale 8 4.0
Draught power 3 1.5
Meat, sale, manure and skin 14 7.0
Manure and status 14 7.0
Manure 2 1.0
Skin 2 1.0
Sales 8 4.0
Status 8 4.0
Ceremonies 4 2.0
Milk 4 2.0
Meat and sales 21 10.5

35
4.2.2 Rearing of beef cattle for sale
Data with respect to the selling of beef cattle are presented in Figure 4.3. Most of the
farmers (63%) sold 10% to 30% of their cattle while 13% reared and sold more than
40% of their herds.
Figure 4.3: Selling of beef cattle
4.2.3 Ranking of beef cattle as a source of income
How the respondents ranked their beef cattle as a source of income is shown in Figure
4.4. Most farmers (47%) ranked beef cattle as their second most important source of
income, while 17.5% and 15% ranked beef cattle as their first and third source of
income respectively.
0.0%
5.0%
10.0%
15.0%
20.0%
25.0%
30.0%
35.0%
40.0%
45.0%
0% 10 -20% 20 -30 % >40%
Percentage of cattle sold
Perc
ent o
f res
pond
ents

36
Figure 4.4: Ranking of beef cattle as a source of income
4.2.4 Rearing of beef cattle for own consumption
The use of beef cattle for own consumption is summarised in Figure 4.5. The majority
of the farmers (54.5%) used 10% to 30% of their cattle for their consumption while
45.5% reported no own consumption at all.
4.2.5 Use of beef cattle for draught power
In terms of draught animals (see Table 4.4), over 67.5% of farmers stated that they use
donkeys for draught power, while 25% said they use their cattle and 7.5% said they hire
beef cattle for draught power purposes.
0.0%5.0%
10.0%15.0%20.0%25.0%30.0%35.0%40.0%45.0%50.0%
1st 2nd 3rd Other
Ranking of beef cattle as a source of income
Perc
enta
ge re
spon
dent
s

37
Figure 4.5: Beef cattle consumption
Table 4.4: Draught animals used by the farmers
Animal draught
No. of respondents
(n) Frequency
(%)
Own cattle 50 25.0
Hired cattle 15 7.5
Donkeys 135 67.5
4.2.6 Use of cattle for socio-cultural functions
The respondents’ use of cattle for socio-cultural functions is shown in Table 4.5. Most
of the farmers (37%) use beef cattle for funeral ceremonies and 19.5% for ancestor
worship (ukuphahla). A combination of use for weddings, funerals and lobola was
reported by 10% of the respondents.
0.0%
10.0%
20.0%
30.0%
40.0%
50.0%
60.0%
0% 10 -20% 20 -30% >40%
Percentage of beef cattle used for own consumption
Perc
enta
ge o
f res
pond
ents

38
Table 4.5: Use of cattle for socio-cultural functions
Socio-cultural function No. of
respondents (n) Frequency
(%)
Weddings 17 8.5
Lobola 14 7.0
Ancestor worship 39 19.5
Funerals 74 37.0
Funeral and ancestor worship 5 2.5
Birthdays 2 1.0
Child naming 2 1.0
Wedding and funerals 16 8.0
Funerals and lobola 8 4.0
Weddings, funerals and lobola 20 10.0
Other 3 1.5
4.2.7 Cattle breeds and breeding systems
The data gathered with respect to preferred cattle breeds, breeding systems used and
sources of breeding bulls are presented in Figure 4.6.
With mountainsides being the predominant grazing location, the vast majority of the
respondents (69%) stated that the preferred mixed breeds, although the remaining 31%
also considered keeping the exotic Brahman, Nguni, Bonsmara and Drakensberger
breeds for production.
In terms of breeding systems, 91.5% of the farmers reported practicing continuous
breeding, while 5% considered seasonal breeding for production purposes and 2.5%
only sold calves for fattening.
In terms of breeding systems, 91.5% of the farmers reported practicing continuous
breeding, while 5% considered seasonal breeding for production purposes and 2.5%
reported not breeding at all but only selling calves from auction for fattening purposes.

39
A marked shortage of bulls was noted in the present study. Only 12% of the
respondents reported selecting breeding bulls from their own herds, while 68.5% relied
upon neighbours for their bulls. Breeding bulls were obtained from auctions and stud
breeders by 8% and 6.5% of the farmers interviewed.
Figure 4.6: Preferred breeds, breeding systems and breeding bull sources
4.2.8 Mating, calving, weaning and mortality in beef cattle
The data gathered in this regard are presented in Figure 4.7.
With continuous breeding being the predominant practice among the respondents, the
majority (90%) reported mating heifers at younger than two years, while the remaining
10% farmers bred after two years. As a result, 43.5% of the farmers reported calving
percentages of between 50% and 70% and 34% achieved calving percentages of more
than 80%. It was also found that 77.5% of the farmers weaned their calves at five to
seven months while 18% kept to a seven to nine month weaning interval.
0.0%10.0%20.0%30.0%40.0%50.0%60.0%70.0%80.0%90.0%
100.0%
Ngu
ni
Mix
ed
Bons
mar
a
Brah
man
Drak
ensb
erge
r
Oth
er
Cont
inuo
us b
reed
ing
Seas
onal
Bre
edin
g
No
mat
ing
Oth
er
Stud
bre
eder
Nei
ghbo
ur
Rela
tives
Sele
cted
from
you
r bul
ls
Auct
ion
Oth
er
Percentage of breed used Breeding system Sources of breeding bulls
Perc
enta
ge re
spon
dent
s

40
With respect to weaning, 4.5% of the farmers stated that they did not wean their calves.
The majority (54.5%) reported 50% to 60% weaning and 16% of farmers achieved
weaning percentages of more than 60%.
Due to calves being weaned at an early age, most of the respondents (36%) reported
mortality at weaning, while 20% and 16.5% of farmers experienced mortality at breeding
and birth respectively. With communal mountainsides being a predominant source of
grazing in the study area, 42% of the respondents reported mortality due to disease and
29% mortality due to malnutrition. Other causes of mortality including snakes, predators,
still birth and lightning were reported by 19% of the farmers interviewed.
4.2.9 Farming management practices
Data with regard to type of grazing system, feed sources, provision of supplementary
feed, supplementation time, body condition, time of selling and sales channels used by
farmers are presented in Table 4.6.
Since the communal land in the study area has no boundary fencing, all of the farmers
(100%) freely grazed their beef cattle on the mountainside. Over 93.5% of farmers said
they use the veld as a source of feed, while only 2.5% use planted pasture and 4%
bring in feed. However, 82% of farmers reported supplementing their beef cattle
depending on the season. Only 18% said they do not provide supplementary feed.
Supplementary feed was provided in winter by 56% of the respondents, while 22%
considered supplementing throughout the year.
The data on body condition of the beef cattle in the study area confirm that most of the
farmers practiced supplementation. It was noted that 87.5% of the farmers had beef
cattle with good body condition.
Most of the farmers (56.5%) reported selling their beef in cases of emergency, with
39.5% saying private sales were the quickest under these circumstances and 33.5%
saying auctions worked best. Of the respondents who reared beef cattle for sale, 23%
said they sold under normal (non-emergency) circumstances.

Figure 4.7: Production records with respect to mating, calving, weaning and mortality
0.0%
10.0%
20.0%
30.0%
40.0%
50.0%
60.0%
70.0%
80.0%
90.0%
100.0%
<2 y
ears
>2 y
ears
Oth
er
<40
%
50 -7
0 %
>80%
Oth
er
5 -7
mon
ths
7 -9
mon
ths
Oth
er
< 40
%
50 -6
0%
> 60
%
Oth
er
At b
irth
At w
eani
ng
At b
reed
ing
At w
eani
ng a
nd b
irth
At w
eani
ng a
nd b
reed
ing
At b
irth
and
bree
ding
At b
irth,
wea
ning
and
bre
edin
g
Oth
er
Mal
nutr
ition
Pred
ator
s and
still
birt
h
Oth
er
Dise
ase
Pred
ator
s
Still
birt
h
Snak
es
Mal
nutr
ition
and
dise
ase
Mal
nutr
ition
and
still
birt
h
Dise
ase
and
still
birt
h
Age ofmating in
cows
Calvingpercentage
Weaning age Weaningpercentage
Mortality age Cause of mortality
Perc
enta
ge re
spon
dent
s

42
Table 4.6: Farming management practices
Variable Range
No. of respondents
(n) Frequency
(%)
Feeding system Free grazing 200 100.0 Feed source Veld 187 93.5 Pasture 5 2.5 Bought in feed 8 4.0
Supplementation Yes 165 82.5 No 35 17.5
Supplementation period Rainy season 1 0.5 Winter 111 55.5 Drought 7 3.5 All year round 44 22.0 Other 37 18.5
Body condition Poor 15 7.5 Good 175 87.5 Moderate 8 4.0 Excellent 2 1.0
Selling time Rainy season 6 3.0 Winter 5 2.5 Dry season 8 4.0 All year around 22 11.0 Emergency 113 56.5 Other 46 23.0
Selling channels Auction 67 33.5 Abattoirs 5 2.5 Butcheries 3 1.5 Private sales 79 39.5 Emergency 46 23.0
43
4.2.10 Challenges faced by beef cattle farmers
The data recorded in terms of challenges are summarised in Table 4.7.
The main challenges reported by the respondents were disease (26%) and malnutrition
(18%) during the dry season. Ticks (reported by 1% of the respondents) were amongst
the challenges which lead to disease.
Feed shortages during winter and in the case of drought were reported as a constraint
by 10% of the farmers, and 9.5% named drought during the winter months as a
challenge. Poor management and low production were noted by 1.5% and 2% of the
respondents respectively. Further challenges noted were continuous breeding (0.5%)
and shortage of breeding bulls (1.5%).
As a result of poor management practices, unfenced grazing camps (11%), unavailability
of handling facilities (0.5%) and veld fires (1%) during the dry season were also
confirmed to be challenges experienced in the study area. Theft (9%) and water
shortages (2%) in grazing areas were also named. Lack of knowledge about beef cattle
production was reported as a performance and production challenge by 0.5% of the
respondents, while 1% and 0.5% also mentioned marketing issues and low prices as
constraining factors in their production.
Possible solutions that were named by the respondents are presented in Table 4.8.
Vaccination programmes were named by 15.5% of the farmers as a solution to the
problem of disease and ticks, while 2% mentioned the development of a fodder bank to
address issues of malnutrition and drought in the study area. The provision of winter
feeds to assist with feed shortages was recommended by 29.0% of the respondents.
With respect to management challenges and difficulties around continuous breeding and
the availability of breeding bulls, the respondents recommended the demarcation and
fencing of grazing camps (12.0%) and implementation of a proper management
programme (4.5%), the donation of breeding bulls (5.0%) and seasonal breeding (6.5%).
A combination of fenced camps, feeding and vaccination programmes was named by

44
0.5% of the respondents as a way of dealing with the high mortality rate experienced in
the study area.
Table 4.7: Challenges faced by beef cattle farmers
Challenges No. of
respondents (n) Frequency
(%)
Health
Disease 52 26.0
Ticks 2 1.0
Infrastructure
Grazing camps 22 11.0
Water shortages 4 2.0
Handling facilities 1 0.5
Management
Breeding bulls 3 1.5
Continuous breeding 1 0.5
Poor management 3 1.5
Low pricing 1 0.5
Low production 4 2.0
High mortality 2 1.0
Lack of knowledge 1 0.5
Veld fires 2 1.0
Malnutrition 36 18.0
Theft 18 9.0
Drought 19 9.5
Shortage of feed 20 10.0
Marketing 2 1.0
Other 7 3.5

45
The construction of boreholes or tanks was proposed by 3.0% of the respondents to
remedy the issue of water shortages, and the construction of handling facilities was
named by 0.5% of the farmers to assist with the transportation of beef cattle to market.
Training in beef cattle production was named by 1.0% of the respondents as a solution
to their lack of knowledge. This would help them to produce good quality beef cattle, a
factor that was proposed by 0.5% of the respondents as a solution to the challenge of
cattle fetching low prices. Access to marketing knowledge was also a solution proposed
by 0.5% of the respondents.
In order to address theft issues, 2.0% of the farmers proposed the development of a
livestock theft policy, while 0.5% believed that the application of firebreaks around
grazing camps would solve the problem of uncontrolled veld fires in the study area.

46
Table 4.8: Possible solutions to challenges faced by beef cattle farmers
Solution
No. of respondents
(n) Frequency
(%)
Health
Vaccination programme 31 15.5
Infrastructure
Demarcation and fenced grazing camps 24 12.0
Construction of boreholes or tanks 6 3.0
Construction of handling facilities 1 0.5
Management
Donation of breeding bulls 10 5.0
Seasonal breeding 13 6.5
Proper management programme 9 4.5
Good quality beef cattle 1 0.5
Fenced camps, feeding and vaccination programme 1 0.5
Feeding and vaccination programme 23 11.5
Fenced camps and feeding programme 2 1.0
Training on beef cattle production 2 1.0
Application of firebreaks 1 0.5
Livestock theft policy 4 2.0
Development of fodder bank 4 2.0
Provision of winter feeds 58 29.0
Marketing knowledge 2 1.0
Other 8 4.0

47
SECTION 4.3
4.3.1 Results of inferential (regression) analyses
The results of the Ordinary Least Square linear multiple regression analyses of the effect
of the set of explanatory variables in the income from beef cattle production are
presented in Table 4.9.
The coefficient of determination R-Square is 0.653 which implies that the independent
variables account for 65.3% of the variation in the dependent variable (income from beef
cattle production). The adjusted R-Square of 0.629 is not very different from the value of
the R-Square (0.653), implying that the number of independent variables included in the
regression was sufficient. The Durbin-Watson statistic of 2.00 shows that there was no
autocorrelation present. The F-Statistic value is 26.928 and statistically significant (sig.
0.000). This indicates that the combined effect of the independent variables on the
dependent variable is very significant. All the VIF values are between 1.00 and 6.770
showing that there was no multi-collinearity among variables.
The results in Table 4.9 show that the independent variables which have a statistically
significant influence on the income from beef cattle production at 5% level of significance
are: number of beef cattle (t = 16.8, sig. 0.000) and age at mortality (t = -2.59, sig.
0.010). The fact that the number of beef cattle has a positive and significant influence
on the farmers’ income from beef cattle production at 5% level of significance means
that a unit increase in the number of beef cattle will increase a farmer’s income by
75.7% with all other factors being constant. On the other hand, the mortality age of cattle
has a negative and statistically significant influence on the farmers’ income which means
that a unit increase in the age of mortality in cattle will decrease a farmer’s income by
12.3% with all other factors being constant.

48
Table 4.9: Regression analyses
Independent variables
Unstandardised coefficients
Standardised coefficients
t Sig.
Collinearity statistics
B Std. error Beta Tolerance VIF
(Constant) 456.313 5462.149 0.084 0.934
Age of respondents -20.230 29.726 -0.031 -0.681 0.497 0.878 1.140
Important income 126.565 463.415 0.012 0.273 0.785 0.919 1.088
No. of household members 126.247 491.690 0.011 0.257 0.798 0.952 1.050
Farming experience 553.762 383.884 0.067 1.443 0.151 0.852 1.174
Farm size -493.500 836.730 -0.027 -0.590 0.556 0.891 1.122
No. of beef cattle 472.828 28.008 0.757 16.882 0.000 0.929 1.077
% calving of the herd 806.921 754.480 0.065 1.070 0.286 0.510 1.962
% weaning of the herd 698.361 795.462 0.054 0.878 0.381 0.501 1.995
Body condition of cattle 48.412 1141.516 0.002 0.042 0.966 0.928 1.078
Mortality age of cattle -542.606 209.112 -0.123 -2.595 0.010 0.835 1.198
Type of breeding system -4268.517 2382.770 -0.201 -1.791 0.075 0.148 6.770
Age of mating cows 4441.675 2548.469 0.192 1.743 0.083 0.154 6.483
Source of feed -539.922 743.730 -0.033 -0.726 0.469 0.929 1.076
Dependent variable: Income; R-Square 0.653; Adjusted R-Square 0.629; Durbin-Watson 2.00; F-Statistic 26.928 (sig. 0.000)

49
CHAPTER 5: DISCUSSION
This chapter gives a detailed discussion of the results of the study focusing on the
demographics and socio-economic characteristics of the respondents, the importance of
beef cattle for the farmers in the study area and the contribution of beef cattle farming to
household income in the Chief Albert Luthuli Municipality communal areas. The
regression analysis of factors affecting income from beef cattle production is discussed
in Section 5.3.
SECTION 5.1
5.1.1 Demographics and socio-economic characteristics of the respondents
The results of the study indicate that beef cattle farming in the communal areas of Chief
Albert Luthuli Municipality are practiced equally by women and men. This was
unexpected as it was thought that beef cattle farming, especially in communal areas,
would be the exclusive duty of men (Amimo et al., 2011; Tada et al., 2013; Covarrubias
et al., 2012; and Munyai, 2012). The reason for this equality is not known, but it is
possible that the unexpectedly high number of female farmers is related to the fact that
their husbands work far from home and only come back every two months. This leaves
the women with no alternative but to take responsibility for the cattle. Similar results
have been reported by Munyai (2012) at Muduluni village in the Makhado Municipality in
Vhembe district in Limpopo Province, where the author found that women took
responsibility for managing livestock on behalf of their husbands when they moved to
towns in order to look for work. However, this is contrary to the findings of Amimo et al.
(2011) who reported that more men than women participated in beef cattle farming in
communal areas of Teso and Suba Districts in the western part of Kenya.
According to the results of the present study, 50.5% of the respondents were over 51
years of age, so older people are clearly actively participating in beef cattle rearing in the
communal areas of Chief Albert Luthuli Municipality. This is a risk to both global and
national food security if no succession planning is taking place, and is a matter that
should be addressed in any plans to improve beef cattle rearing in the study area itself

50
and elsewhere in South Africa. Planning should of necessity consider the inclusion of
younger people (20 to 50 years) in order to close the gap created by the ageing
population of farmers and to ensure continuity. Similar results have been reported in
communities in South Africa’s Eastern Cape Province by Katiyatiya et al. (2014) and
Musenwa et al. (2010), where farmers 51 years and older were found to rely on grants
or pensions for their income. In both of the above-mentioned studies, the authors further
observed that the participation of youth in agriculture was low, while on the other hand
Mngomezulu (2010) reported high participation by youth in KwaMasele village in the
Peddie District of South African’s Eastern Cape Province. Umeh et al. (2011) found that
the majority of the youth in Anambra State, Nigeria took part in crop production projects
rather than livestock production. However, Munyai (2012) noted that livestock farming
was forced on the young by their parents but would be abandoned as they grew older.
In the present study, more respondents were found to have some level of education
rather than none. This finding was also unexpected in light of the number of older
participants in the study area who depend on pensions for their income and who grew
up in the apartheid era and had limited access to formal education (De Cock et al.,
2013). The literacy of respondents could be a major asset in terms of the potential
adoption and dissemination of new beef cattle production and farming management
techniques. It is also a major advantage for the integration of communal area farmers
into beef cattle value chain development projects.
A study by Modirwa and Oladele (2012) suggests that a sound educational background
can reinforce natural talent. Education can provide a theoretical foundation for informed
decisions. The authors further observe that successful farming requires knowledge of
aspects such as marketing, purchasing and finance. In addition, education is likely to
enhance managerial ability in terms of improved formulation and execution of
development programmes and the acquisition of better information in order to improve
marketing abilities. According to Sakyi (2012), there is a strong correlation between
education, empowerment and food security. The Food and Agriculture Organisation of
the United Nations (FAO) emphasises that education, whether formal, non–formal or in
the form of skills training, is very useful as develops the capacity of people to ensure

51
food security (FAO, 2009b). Sakyi (2012) argues that a level of education contributes to
food security and poverty reduction since it opens up opportunities to improve on
livelihood strategies. Lemke (2001) also observes that data on education and literacy in
developing countries reflects the level of human resource development and the potential
for economic growth and development.
More than half of the respondents in the present study (57%) stated that their income
came from a combination of pension and cattle income, followed by a combination of
salary and cattle income. However, the most important source of income was pension
reported by respondents (87%) and 28% of respondents reported cattle as their most
important source of income. The fact that only 19% of the households reported income
from beef cattle was perhaps to be expected. More than half of the respondents were
older than 51 years old and no longer productive due to health problems, relying heavily
therefore on disability grants. This over-reliance on pension income to ensure food for
the household can partly be explained by the fact that in the study area cattle represent
wealth to be drawn on only in emergencies or special circumstances such as funerals
and weddings, as also observed by Lemke (2001). This view is supported by the fact
that 56.5% of farmers in the present study reported that they only sold their beef cattle
when absolutely necessary. Similar results were reported by Munyai (2012) in a study in
Maduluni village in Limpopo Province, where the majority of cattle owners were found to
be elderly and dependent on pensions. Katiyatiya et al. (2014), in a study of four
communities in South Africa’s Eastern Cape Province also found that most farmers
depended on grants or pensions as a source of income. However, in Vhembe District of
Limpopo, Sikhweni and Hassan (2014) found that farmers named livestock as their
primary source of income and as insurance against unforeseen circumstances.
The 19.0% household income derived from beef cattle farming by farmers in the present
study does however suggest that there is still potential to improve the income from beef
cattle sales in the study area. One way of doing so would be to revitalise interest in
agricultural activities in the communal areas, and particularly in beef cattle farming. The
danger is that because beef cattle farming has been marginalised or neglected as an
agricultural practice, there has been a decline in the engagement of the rural poor in

52
agricultural production as a source of income, as similarly observed by Drimie and
Casale (2009). As reasons for the marginalisation of agricultural production in rural
areas, these authors list poor access to agricultural land and inputs (including labour)
along with biophysical factors, diminishing agricultural knowledge, inappropriate
extension services, poor credit facilities, the HIV and AIDS pandemic, climate change
and increasing water shortages. They also comment that changes in the perceived value
of engaging in agricultural production are linked to changes in the culture and livelihoods
of rural households, and that urgent action is needed in the form of supportive
government policies to encourage increased participation in beef cattle farming in
communal areas such as those of the Chief Albert Luthuli Municipality.
The vast majority of farmers in the present study (80%) reported that they owned
communal land while somewhat fewer farmers rented two plots for grazing purposes.
This is to be expected since the communal areas in Chief Albert Luthuli Municipality still
belong to traditional councils or chiefs, where mountainsides and backyard areas are
used for grazing. Grazing land is often regarded as communal land for use by all the
farmers in a village. During winter, the fields used for crop production by individual
farmers are used communally for grazing. Plots allocated to smallholder farmers are
measured in yards, which explain why some farmers reported renting two plots for
grazing. In general, the availability of land was a thorny issue, with the respondents
being of the opinion that Government should allocate more land to support their food
production activities and ensure food security. Similar results were obtained in a study in
Takisung District, Tanah Laut Regency, in South Kalimantan, Indonesia, where Hartono
and Rohaeni (2014) found that more farmers made use of more than two plots. Sikhweni
and Hassan (2014) however report that in Vhembe District in Limpopo, farmers owned
two hectares allocated by the chief, while Mngomezulu (2010) observed less than two
hectares in a study in Eastern Cape Province.
In the present study, half of the respondents reported owning up to ten head of cattle
and the other half, more than ten. It therefore appears that there were different herd
sizes in the study area despite the limited space available for grazing. Apart from this,
cattle numbers were adversely affected by theft and fatal road accidents as

53
unsupervised cattle strayed far from home to find grazing. Hartono and Rohaeni (2014),
Ogunkoya (2014) and Sikhweni and Hassan (2014) made similar observations. In these
three studies it was found that lack of cattle farming knowledge and scarcity of good
quality breeding bulls were reasons why farmers owned fewer cattle in Takisung District,
Tanah Laut Regency, South Kalimantan Province in Indonesia, as well as in Vhembe
District in Limpopo and Lejweleputswa District in Free State respectively.
The finding that the majority of respondents (77%) earned R 10,000 or less per annum
was unexpected in the present study in light of the fact that half of the farmers owned at
least one head of cattle and half owned ten or more. This indicates that one group of the
farmers in the study area sold beef cattle only in cases of emergency. Sikhweni and
Hassan (2014) also reported moderate annual income generation from beef cattle sales
in the Vhembe District of Limpopo Province. However, in a study in North West
Province, Sekoto and Oladele (2012) found that farmers reported higher annual income
from beef cattle farming.
While the proportion of cows in the herds was found to be important in terms of
breeding, the shortage of bulls was a critical factor in the present study. The participating
farmers reported that they either selected breeding bulls from their own herds or bought
bulls from stud breeders. This situation was confirmed by the fact that more cows than
heifers were observed in the communal farming areas in Chief Albert Luthuli
Municipality. Most of the cows were observed to be dry and in good body condition.
This could be attributed to the long calving interval and low production of calves due to
the shortage of breeding bulls coupled with poor management practices such as
allowing cows to run with calves older than a year. Musemwa et al. (2010) and Munyai
(2012) have similarly found that breeding females make up the largest proportion of
cattle herds. In the Eastern Cape Province of South Africa, Nqeno et al. (2011) also
reported the prevalence of cows rather than heifers as a result of calf numbers being
negatively affected by long calving intervals or mortality. On the other hand, Katiyativa et
al. (2014) found that bulls to be in the majority in four Eastern Cape communities, and a
study by Sibanda (2014) in the Matobo District of Zimbabwe found herd composition to
be highly skewed towards male animals.

54
SECTION 5.2
5.2.1 Reasons for keeping beef cattle
The present study was conducted in a communal and traditional rural environment so
the reasons the respondents gave for keeping beef cattle were not unexpected. The
majority of farmers reported keeping beef cattle for manure, sale, ceremonies and milk,
while some did so for own consumption and sale. Most of the respondents preferred
unpasteurised milk to pasteurised milk, and cattle dung was used for a variety of
purposes such as for manure, as a floor polish in thatched house and for cooking.
Although some farmers mentioned selling their beef cattle, the income generated in this
way was used for school fees or emergencies (in which case meat came from animals
slaughtered for socio-cultural events). These findings differ from those of Musemwa et
al. (2010) who found that milk was the primary reason for keeping cattle in two Eastern
Cape municipalities.
In addition to the above, most of the farmers in the present study said that the rearing
and sale of beef cattle contributed 10% to 20% towards their income. This could be
explained by the previously mentioned finding that 19% farmers named beef cattle as a
source of income, clearly indicating a reluctance to sell their cattle and then only to cover
the costs of socio-cultural events or other emergencies. Other reasons for selling could
be livelihood demands or the need to sacrifice income in order to buy breeding cows,
which would account for the relatively low ranking of beef cattle as a source of income
among the respondents. This is supported by the fact that most respondents stated that
pension was the most important source of income for their households. One possible
negative consequence of this approach is that the majority of farmers will be reluctant to
reduce their livestock numbers under adverse agricultural conditions such as during
winter when the communal grazing areas are unproductive. This impacts negatively on
grazing conditions and nutrient availability, as also observed by Munyai (2012). Farmers
did however state those only oxen were sold. This supports the findings of Musemwa et
al. (2010) who observed that oxen are seen as “cash banks” while cows are kept for
production.

55
At the same time, farmers ranked own consumption (milking and slaughtering for
funerals and weddings) as 10% to 30% of their reasons for keeping beef cattle. The
farmers rarely slaughtered for meat for their households, suggesting that beef cattle are
regarded as wealth for use only when absolutely necessary such as for funerals or
weddings. According to Lemke (2001), livestock is seen as an asset that can be sold in
times of shortage, as symbol of wealth and as personal insurance against food
insecurity. However, the use of beef cattle is governed by cultural norms and only men
may decide when to slaughter or sell.
The majority of the respondents in the present study reported using donkeys rather than
beef cattle for transportation and farm activities cattle. However, 25% of the farmers
owned beef cattle and 7.5% rented cattle from their neighbours for draught purposes.
This is an indication that draught power is not a very important reason for keeping beef
cattle in communal areas in Chief Albert Luthuli Municipality. This could be attributed to
the fact that in the past most of the farmers received ploughing assistance from the
Department of Agriculture, Rural Development, Land and Environmental Affairs
(DARDLEA) through the Masibuyele Emasimini (ME) programme in Mpumalanga
Province. However, since the programme has come to an end some farmers now use
beef cattle and particularly oxen for draught power rather than hiring tractors for
ploughing. Contrary to these findings, Bettencourt et al. (2014) reported that the majority
of animals owned by farmers in Tapo-Memo and Aidabaleten in the Bobonaro district of
Timor-Leste were kept for draught power purposes.
Funerals and ancestor worship were amongst the socio-cultural practices reported by
farmers in the present study, and the use of cattle for these purposes was not
unexpected since most farmers still believe that when the head of the family passes on,
beef cattle must be slaughtered for the funeral and the hide used to cover the coffin.
The animals are also used to cleanse the widow after a year of mourning. Furthermore,
talking to the ancestors (ukuphahla) is still common practice among the farmers in Chief
Albert Luthuli Municipality, and some farmers use beef cattle in celebrations to welcome
someone back from initiation school, selecting only cattle of a specific gender and colour
for these ceremonies. Similar findings have been reported by Maburutse et al. (2012)

56
who observed that the majority of farmers in Simbe and Gokwe South Districts in
Zimbabwe use beef cattle for the appeasement of the ancestors. In the present study,
weddings, lobola and child naming ceremonies were also mentioned as socio-cultural
events involving beef cattle. In the case of lobola, however, the use was indirect in the
sense that cattle were sold to raise money for lobola, as also observed by Munyai
(2012). Similar findings have been reported by Bettencourt et al. (2014) who observed
that farmers in Tapo–tas, Tapo-memo and Aidabalen used cattle for funerals and
weddings. Similar findings have been reported by Bettencourt et al. (2014) who
observed that farmers in Tapo-Tas (mountain area), Tapo-Memo (irrigation plain) and
Aidabaleten (coastal area) in the district of Bobonaro in Timor-Leste used cattle for
funerals and weddings.
5.2.2 Cattle breeds and breeding practices
Most of the farmers in the present study said they preferred to keep mixed cattle breeds
for production, while some said they would consider exotic breeds such as Brahman,
Nguni and Bonsmara. The reason for the mixed breed preference was the larger body
frame of these cattle which is believed to indicate good quality animals for production
purposes. The high percentage of mixed breed cattle in the communal areas included in
the study is the result of continuous breeding with unknown breeding bulls. Some of the
reasons given for keeping Brahman and Nguni cattle were the hardiness and tolerance
of the breeds for the harsh conditions in the study area which is dry during the winter
season and has high temperatures in the summer, particularly the Gert Sibande region
of Mpumalanga. Munyai (2012) also found that continuous breeding resulted in an
unspecified breed of cattle in Mudulini village in Limpopo Province. On the other hand,
Bidi et al. (2015) reported herds of several different breeds of White Brahman, Black
Brahman, Tuli and Nguni cattle respectively in Mangwe district in Zimbabwe.
The present study indicated that the majority of the respondents did not own breeding
bulls and relied on their neighbours for bulls for mating purposes. This was expected in
light of the poor farming management practices observed in the study area. Farmers
were reluctant to purchase bulls for mating purposes due to the fear of venereal disease
and that untested breeding bulls could result in high mortality in cows and calves.

57
Munyai (2012) also found that farmers in Mudulini village in Limpopo did not buy their
own breeding bulls and depended on the bulls of neighbours for breeding. However,
Siegmund-Schultze et al. (2012) reported that some farmers in Okamboro in Namibia
owned breeding bulls and replaced them when they were old to prevent mating with their
own daughters.
5.2.3 Beef cattle production
Mating age appears to be the most critical factor affecting beef cattle production in the
communal areas in Chief Albert Luthuli Municipality. The majority of farmers reported
mating their heifers at younger than two years of age, with fewer practicing mating after
two years. This could be explained by the uncontrolled breeding and long calving
intervals observed in the study area. Some farmers reported that heifers or cows
conceived but later died from dystocia as a result of the poor nutritional quality of the
grazing. Some also reported a long calving interval due to a low bull:cow ratio and poor
nutrition. In a study by Nqeno et al. (2011) it was found that late bulling resulted in the
birth of calves during the winter months when the nutritional status of the rangeland is at
its poorest condition. Tavirimirwa et al. (2013) cites Mashoko et al. (2007) as similarly
observed mating at 28 to 36 months on communal farms, while Gusha et al. (2014)
reported heifer mating ages of between 18 and 27 months in Zimbabwe. Contrary to
these findings, Tada et al. (2013) found that most heifers in the Eastern Cape had a calf
before reaching four years of age.
Due to the uncontrolled mating prevalent in the study area, the majority of the farmers
reported a calving percentage of between 50% and 70%, unexpectedly high in light of
the low bull:cow ratio and poor feeding before the breeding season due to overgrazing
and overstocking in the grazing areas. Siegmund-Schultze et al. (2012) also found a
60% calving rate in Okamboro in Namibia, while Sibanda (2014) reported a 56% calving
percentage in four communal districts in Zimbabwe as compared to the national average
of 46%.
Early weaning was the most common practice reported by the majority of farmers in the
present study, with most making use of weaning rings to prevent ongoing suckling.
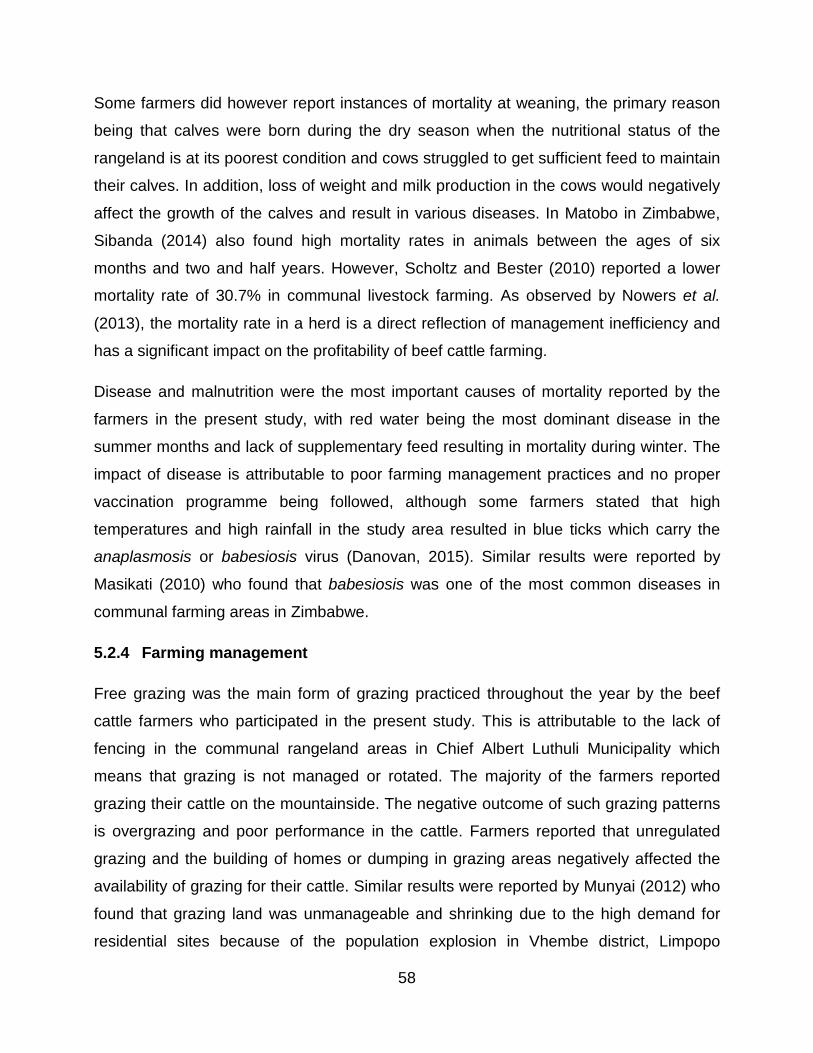
58
Some farmers did however report instances of mortality at weaning, the primary reason
being that calves were born during the dry season when the nutritional status of the
rangeland is at its poorest condition and cows struggled to get sufficient feed to maintain
their calves. In addition, loss of weight and milk production in the cows would negatively
affect the growth of the calves and result in various diseases. In Matobo in Zimbabwe,
Sibanda (2014) also found high mortality rates in animals between the ages of six
months and two and half years. However, Scholtz and Bester (2010) reported a lower
mortality rate of 30.7% in communal livestock farming. As observed by Nowers et al.
(2013), the mortality rate in a herd is a direct reflection of management inefficiency and
has a significant impact on the profitability of beef cattle farming.
Disease and malnutrition were the most important causes of mortality reported by the
farmers in the present study, with red water being the most dominant disease in the
summer months and lack of supplementary feed resulting in mortality during winter. The
impact of disease is attributable to poor farming management practices and no proper
vaccination programme being followed, although some farmers stated that high
temperatures and high rainfall in the study area resulted in blue ticks which carry the
anaplasmosis or babesiosis virus (Danovan, 2015). Similar results were reported by
Masikati (2010) who found that babesiosis was one of the most common diseases in
communal farming areas in Zimbabwe.
5.2.4 Farming management
Free grazing was the main form of grazing practiced throughout the year by the beef
cattle farmers who participated in the present study. This is attributable to the lack of
fencing in the communal rangeland areas in Chief Albert Luthuli Municipality which
means that grazing is not managed or rotated. The majority of the farmers reported
grazing their cattle on the mountainside. The negative outcome of such grazing patterns
is overgrazing and poor performance in the cattle. Farmers reported that unregulated
grazing and the building of homes or dumping in grazing areas negatively affected the
availability of grazing for their cattle. Similar results were reported by Munyai (2012) who
found that grazing land was unmanageable and shrinking due to the high demand for
residential sites because of the population explosion in Vhembe district, Limpopo

59
Province. Contrary to the present study, Katiyatiya et al. (2014) found that cattle were
grazed in camps populated by canopy shade trees in four villages in the Eastern Cape.
As one would expect in such communal areas, most of the farmers in the present study
said that they used the veld as the main source of feed for their herds, while some
reported using planted pasture or bringing in feed. This is attributable to the fact that the
veld is the cheapest and most freely available source of feed in communal areas, but
such free grazing can however lead to deterioration of the veld due to overgrazing,
injudicious grazing and poor land use management including the under-estimation of
long-term veld grazing capacity. Farmers also confirmed that Chief Albert Luthuli
Municipality experienced seasonal variations in both the quantity and quality of grasses,
with winter being the worst season in this regard. Bayene et al. (2014) similarly observed
that natural veld grazing is a cheap source of livestock feed in communal areas of South
Africa, and Mutibvu et al. (2012) found that natural veld was the major source of feed for
livestock in Gokwe in the southern region of Zimbabwe. On the other hand, Valbuena et
al. (2012) found that crop residues were the most important source of livestock feed
across mixed smallholder systems in sub-tropical Africa and Asia.
The majority of the respondents in the present study considered supplementary feeding
while some believed that it was a waste of money. Due to poor veld management, most
of the farmers had to supplement their cattle during the nutritionally deficient dry season
although the input cost was high. It must however be emphasised that these
supplementary feeds were not nutritionally balanced so as to meet the nutritional
deficiencies in the cattle and furthermore were given to the animals only every three
days in order to save on feed and therefore costs. Acocks (1988) found that some
farmers in sourveld areas often fed their cattle eragrotis curvula while some used raw
salt as a supplementary feed. Similar findings were also reported by De Lange (2011)
who emphasised that supplementation of grazing animals was critical to successful
livestock production under South African conditions. De Lange also noted that while
cattle gained mass during the four to six summer months, 20% to 30% of the maximum
summer mass was lost during winter. As a result of his findings in Matobo District in
Zimbabwe, Sibanda (2014) recommended the use of high protein supplements to

60
ensure the survival of livestock during drought, and Mutibvu et al. (2012) have also
recommended winter feed supplementation. However, Tavirimirwa et al. (2013) found
that communal cattle in Zimbabwe were rarely supplemented, and that low intake of
poor quality feed limited livestock productivity. According to Masikati (2010), farmers
should be encouraged to use cheap technologies for supplementary cattle feeding
during the dry season, such as urea treatment of crop residue which can increase crude
protein content from 3% to 14%.
In the present study, most of the farmers reported good body condition in their cattle due
to the provision of supplementary feeding during the winter and dry seasons. This was
nonetheless unexpected considering the overgrazed state of grazing land in the study
area and the fact that supplementary feed was incorrectly rationed. Despite this, the
body condition of the beef cattle in the area was average in terms of performance and
production. In order to improve breeding programmes, Tavirimirwa et al. (2013) suggest
the use of weigh belts to estimate calving, weaning and 400 day weights respectively,
particularly in the case of the small framed indigenous cattle breeds.
In terms of cattle sales, the majority of farmers in the present study reported having no
handling facilities, including loading zones and weighing scales. Private sales appeared
to be the preferred option for quick and simple selling. This was to be expected in light of
the high input costs involved in transporting cattle as well as the fact that prices in
various sales channels are regulated and determined on the basis of the weight of the
animals. Most of the participating farmers therefore said they would rather sell to
neighbours in which case they were free to charge whatever they wanted and there was
no need to weigh the animals. Since cattle purchases in the communal areas were
generally for the purpose of socio-cultural events, people had no choice but to pay
whatever the selling farmers asked, no matter how expensive. Similar results have been
reported elsewhere. Sikhweni and Hassan (2014) found that 60% of farmers sold their
cattle to local people. Contrary to these findings however, Thomas et al. (2014) reported
that most farmers in the rural constituency of Katima Mulilo in the Zambezi region sold
their cattle to abattoirs rather than on the open market.

61
5.2.5 Beef cattle farming challenges and solutions
Farmers in the communal areas in Chief Albert Luthuli Municipality face health
challenges such as disease as well as difficulties arising from malnutrition, feed
shortages, low production, continuous breeding, bull shortages, veld fires, theft and lack
of marketing support. Lack of knowledge about beef cattle farming as well as
infrastructure issues such as inadequate fencing of grazing camps, water shortages and
lack of handling facilities were also mentioned by the farmers who participated in the
study.
The finding that disease was a major challenge faced by the farmers was highly
expected in light of their lack of knowledge about health matters. DARDLEA veterinary
services were assisting with a vaccination programme, but not all the farmers were
following the programme due to the high input cost of the vaccines and treatments.
Amimo et al. (2011) highlighted disease as the major factor affecting production and
mortality rates in cattle in two districts in Western Kenya. Similarly, Tavirimirwa et al.
(2013) found disease and parasites to be a major challenge in most farming districts in
communal areas in Zimbabwe. On the other hand, Sikhweni and Hassan (2014)
reported that most farmers lost cattle due to theft and predation from animals that
escaped from Kruger National Park.
Feed shortages in winter as a result of continuous grazing and seasonal variations in the
study area were found to result in malnutrition and consequently high mortality rates, low
productivity and marketing challenges due to poor body condition. This finding was
expected in light of the fact that the communal areas in Chief Albert Luthuli Municipality
fall in South Africa’s sourveld area and are located at high altitude in areas with high
rainfall. This means that palatable, high quality grazing is available in the summer
months but this decline in the dry winter months, resulting in crude protein levels of less
than 7% in winter grazing (De Lange, 2011). Amimo et al. (2011), Bidi et al. (2015),
Mngomezulu (2010), Sibanda (2014) and Tavirimirwa et al. (2013) also report cases of
crude protein dropping below 5% in various communal areas.

62
In light of the high proportion of older farmers in the study area, the reported lack of
knowledge about animal husbandry was to be expected. These farmers still rely on
traditional farming methods, treating sick animals with medicinal plants rather than
conventional veterinary drugs, due to their availability, easy accessibility, low cost and
apparent effectiveness. Soyelu and Masika (2009) also reported the use of traditional
remedies to treat cattle for disease by the majority of farmers in the Amatola Basin in the
Eastern Cape. Furthermore, only 12% of the respondents in the present study selected
breeding bulls from their own herds. This suggests that the majority of farmers did not
normally practice culling or selection and used old cows for breeding, thereby increasing
the risk of inbreeding. According to Tavirimirwa et al. (2013), inbreeding contributes to
poor growth rate in cattle.
Cattle theft was a common challenge reported by farmers in the present study. This is
attributable to the lack of fencing around grazing camps and the fact that cattle often
walk unsupervised to graze far from homesteads, increasing the risk of their being stolen
or impounded or getting lost. Sikhweni and Hassan (2014) also noted loss of cattle due
to theft, and Mngomezulu (2010) found cattle theft to be a major challenge in
KwaMasele village in the Eastern Cape.
It is clear from the present study that an intensive and comprehensive beef cattle
training programme is urgently needed for the farmers in the communal areas of Chief
Albert Luthuli Municipality in order to address their challenges in terms of the prevalence
of disease, poor reproductive performance, limited feed availability, theft, veld fires,
continuous breeding and poor marketing. In this way farmers can be helped to improve
the productivity of their cattle.

63
SECTION 5.3
5.3.1 Regression analysis results
The results of the inferential analyses (regression) indicate that the independent
variables which collectively have a statistically significant influence on the income of
farmers from beef cattle production at 5% level of significance are number of beef cattle
(t = 16.8, P< 0.000) and age of mortality (t = -2.59, P<0.010).
The fact that the number of beef cattle has a positive and statistically significant effect on
the contribution of beef cattle to household income means that every unit increase in the
number of beef cattle will increase a farmer’s income by 75.7%, all other independent
factors being constant. Furthermore, the fact that mortality age in cattle has a negative
and statistically significant influence on income from beef cattle production means that a
unit increase in mortality will decrease a farmer’s income by 12.3%, all other
independent factors being constant.
One possible explanation for the limited income from beef cattle is that 36% of the
farmers reported mortality at weaning, 20% at breeding and 16.5% at birth. This implies
that mortality occurs throughout the year, but is more prevalent at the weaning stage.
Perhaps the main reason for mortality at weaning is the early weaning of calves born
during dry season when the nutritional status of the rangeland is at its poorest and
weaned calves are therefore exposed to inadequate nutrition. The fact that cows
struggle to get sufficient feed at this time also leads to low milk production which
negatively affects the growth of the calves. Poor performance of the calves contributes
to the mortality rate in the herd and negatively affects the contribution of the cattle to
household income, as observed in the present study.
Sibanda (2014) also reported high mortality rates in cattle between the ages of six
months and two and half years in the Matobo area in Zimbabwe, while Scholtz and
Bester (2010) reported 30.7% pre-weaning mortality in the communal farming sector of
South Africa. These findings contradict those of Hartono and Rohaeni (2014) who found
agricultural land area to be the only variable with a statistically significant effect (P<0.01)

64
on the contribution of beef cattle to household income in Takisung District, Tanah Laut
Regency in South Kalimantan Province, Indonesia. Hartono and Rohaeni concluded that
the agricultural land owned in the area is more extensive and mainly used for crop
farming rather than cattle grazing. When farmers in these areas have money they tend
to buy land for crop production rather than beef cattle rearing since crop farming offers
high income from a short term investment while beef cattle farming requires a longer
term investment.

65
CHAPTER 6: CONCLUSION AND RECOMMENDATIONS
The following conclusions were drawn from the present study.
• In terms of demographics, it appears that beef cattle farming in Chief Albert Luthuli
Municipality are practiced equally by men and women, with 50.5% of the
respondents being older than 51 years and only 9.5% of the youth participating in
the farming. While 55% of the respondents had some level of education, 45% had
none. As a result, 48% of the respondents were found to rely on pensions or income
from both pension and beef cattle for their livelihood. However, pension was the
most important and stable source of income for those farmers with more than four
dependants (81.5%) in their households. It was also found that 60.5% of the
respondents have more than 20 years of experience in beef farming but 50% of
them kept one to ten head of cattle while the other 50% had more than ten in their
herds.
• The contribution of beef cattle farming to household income in the communal areas
of Chief Albert Luthuli Municipality is only 19%.
• The independent variables which collectively have a statistically significant influence
on the farmers’ income from beef cattle production at 5% level of significance were:
number of beef cattle (t = 16.8, P < 0.000) and mortality age (t = -2.59, P< 0.010). The
number of beef cattle has a positive and statistically significant influence on the
contribution of beef cattle to household income, while age at mortality has a negative
and statistically significant influence on the farmers’ income from beef cattle
production.
The most important challenges named by the respondents were disease (26%),
malnutrition (18%), lack of fencing for grazing areas (11%) and feed shortages (10%),
particularly in the winter months. The provision of winter feeds to assist with feed
shortages was recommended by 29.0% of the respondents.
Interestingly, very few of the farmers (0.5%) said that they experienced lack of
knowledge about beef cattle farming as a challenge, yet one could hypothesise that

66
more knowledge and information would contribute to better farming practices and help
the farmers overcome a number of the difficulties they reported, particularly with regard
to disease management, malnutrition and feed availability.
In the interests of increasing the productivity of communal beef farmers in Chief Albert
Luthuli Municipality and contributing to economic growth in Mpumalanga Province, it is
recommended that farmers be assisted through greater provision of infrastructure and
training. Specific recommendations are as follows:
• Chief Albert Luthuli Municipality be approached to assist in the planning and
erection of fencing that will enable beef cattle farmers in the communal areas to
practice better grazing management and thus more continuity in feed availability.
• The Mpumalanga Provincial Government consult with cattle farmers in the
communal areas to determine what infrastructural support can be provided to
improve their access to beef cattle markets that will boost their income from sales.
• The National Department of Agriculture implement a skills development and
training programme among beef cattle farmers in the communal areas to improve
their knowledge and understanding of modern farming technologies and practices
that promote good feed management and the maintenance of healthy animals.
• In light of the fact that 14% of the respondents have completed Grade 12, efforts
be made by the National Department of Higher Education and Training to
encourage the youth in communal farming areas to study further towards careers
in the agricultural sector and beef cattle farming in particular. Greater expertise
could not only greatly improve the farming practices currently found in the study
area but could potentially contribute to decreasing the unemployment rate in
Mpumalanga Province.
It is further recommended that initiatives such as the above be followed by further
research to assess their effectiveness and to find new ways of ensuring a sustainable
future for beef cattle production in communal farming areas, thereby contributing to
economic growth in Mpumalanga Province and the country as a whole.

67
REFERENCES
Abel, NOJ. and Blaikie, PM., 1989. Land Degradation, Stocking Rates and Conservation Policies in the Communal Rangelands of Botswana and Zimbabwe. Land Degradation and Rehabilitation 1:1-23.
Acocks, JPH., 1988. Veld Types of South Africa. 3rd Edition. Memoirs of the Botanical Survey of South Africa 57:1-146. Government Printer, Pretoria
Ayedemo, A., Letty B. and Nsahlai, LV., 2015. Gender Ownership and its Impact on Livestock Productivity: A Case Study of the small-holder Farming System at Msinga. Institute of Natural Resources, PMB, South Africa, Poster Communal Livestock: SASAS Congress 2015.
Agritex, 1993. Planning Report for Farm 172 Gwayi Small Scale Farming Area 55 CFA, Bulawayo, Zimbabwe.
Ainslie, A., 2002. A review of cattle production in Peddie District, in Cattle ownership and production in the communal areas of the Eastern Cape, South Africa, edited by Andrew Ainslie. Cape Town: Programme for Land and Agrarian Studies, University of the Western Cape: 98– 120. (Research report; no. 10.)
Ainslie, A., Kepe, T., Ntsebeza, L., Ntshona, Z. and Turner, S., 2002. Cattle ownership and production in the communal areas of the Eastern Cape (No. 10). South Africa. Research Report.
Ainslie, A., 2005. Farming Cattle, Cultivating Relationships: Cattle Ownership and Cultural Politics in Peddie District, Eastern Cape. Social Dynamics 31(1): 129–56.
Amimo, J.O., Thumbi, S., Inyangala, B.O., Junga, J.O. and Mosi, R.O., 2011. Socioeconomic characteristics and perceptions of cattle keepers and constraints to cattle production in Western Kenya. Livestock Research for Rural Development, 23(138).
Babulo, B., Muys, B., Nega, F., Tollens, E., Nyssen, J., Deckers, J. and Mathijs, E., 2008. Household Livelihood Strategies and Forest Dependence in the Highlands of Tigray, Northern Ethiopia. Agricultural Systems 98(2): 147-155.
Bailey, D., Barrett, C.B., Little, P.D. and Chabari, F., 1999. Livestock markets and risk management among East African pastoralists: A review and research agenda. Available at SSRN 258370.

68
Bembridge, T. and Tapson, D., 1993. Communal livestock systems, in Livestock production systems, edited by C Maree and NH Casey. Pretoria: Agri Development Foundation.
Bettencourt, EMV., Tilman, M., Narciso, V., Silva Carvalho, MLD. and Henriques, PDDS., 2014. The Role of Livestock Functions in the Wellbeing and Development of Timor-Leste Rural Communities. Livestock Research for Rural Development 26.
Beyene, ST., Mlisa, L. and Gxasheka, M., 2014. Local Perceptions of Livestock Husbandry and Rangeland Degradation in the Highlands of South Africa: Implications for Development Interventions. Journal of Human Ecology 47(3): 257-268.
Bidi, NT., Dube, AB., Khombe, CT. and Assan, N., 2015. Community Based Small Scale Commercial Cattle Breeding Programme in Mangwe District of Zimbabwe. Agricultural Advances 4(3): 22-33.
Cavendish, W., 2000. Empirical Regularities in the Poverty-Environment Relationship of Rural Households: Evidence from Zimbabwe. World Development 28(11): 1979-2003.
Chawatama, S., Mutisi, C. and Mupawaenda, A.C., 2005. The socio-economic status of smallholder livestock production in Zimbabwe: a diagnostic study. Livestock Research for Rural Development, 17(12), pp.988-1003.
Chimonyo, M., Kusina, NT., Hamudikuwanda, H. and Nyoni, O., 1999. A Survey on Land Use and Usage of Cattle for Draught in a Smallholder Farming Area of Zimbabwe. Journal of Applied Science 2: 111-12.
Chimonyo, M., Kusina, NT., Hamudikuwanda, H., Nyoni, O. and Ncube, I., 2000. Effects of Dietary Supplementation and Work Stress on Ovarian Activity in Non-lactating Mashona Cows in a Smallholder Farming Area of Zimbabwe. Animal Science 70 (2): 317-323.
Coetzee, L., Montshwe, BD. and Jooste, A., 2005. The Marketing of Livestock on Communal Lands in the Eastern Cape Province: Constraints, Challenges and Implications for the Extension Services. South African Journal of Agricultural Extension 1: 81-103.
Cousins, B., 1999. Invisible Capital: The Contribution of Communal Rangelands to Rural Livelihoods in South Africa. Development Southern Africa 16(2): 299-318.
Covarrubias, K., Nsiima, L. and Zezza, A., 2012. “Livestock and livelihoods in rural Tanzania. A descriptive analysis of the 2009 National Panel Survey”, joint paper of the World Bank, FAO, AUIBAR, ILRI, and the Tanzania Ministry of Livestock and Fisheries Development, July 2012.

69
Donovan P., 2015. How to identify different ticks. www.farmersweekly.co.za/article.aspx?id=68878&h. Issued on 9 February 2015.
De Bruyn, P., De Bruyn, JN., Vink, N. and Kirsten, JF., 2001. How Transaction Costs Influence Cattle Marketing Decisions in the Northern Communal Areas of Namibia. Agrekon 40(3): 405-425.
De Cock, KM., Simone, PM., Davison, V. and Slutsker, L., 2013. The New Global Health. Emerging Infectious Diseases 19(8): 1192.
De Lange, AO., 2011. Communal Farming in Arid Regions. Grootfontein Agricultural Development Institute Fort Hare University. Karoo Agric, Vol. 6, No 1, 1994 (12-16).
Department of Agriculture, Fisheries and Forestry (DAFF)., 2010. A Profile of the South African Beef Market Value Chain. www.daff.gov.za/docs/AMCP/BeefMVCP2010-11.pdf (Accessed in March 2012).
Department of Agriculture, Fisheries and Forestry (DAFF)., 2012. A profile of the South
African beef market value chain. Available from
www.daff.gov.za/docs/AMCP/BeefMVCP2011- 12.pdf (Accessed in March 2012).
Department of Agriculture., 2002. Abstract of Agricultural Statistics - 2002. (National Department of Agriculture: Pretoria).
Department of Agriculture., 2005. Abstract of Agricultural Statistics - 2005. (National Department of Agriculture: Pretoria).
Drimie, S. and Casale, M., 2009. Multiple Stressors in Southern Africa: The Link between HIV/AIDS, Food Insecurity, Poverty and Children's Vulnerability Now and in the Future. Aids Care 21(S1): 28-33.
Düvel, GH. and Stephanus, AL., 2000. Production Constraints and Perceived Marketing Problems of Stock Farmers in Some Districts of the Northern Communal Areas of Namibia. South African Journal of Agricultural Extension 29: 89-104.
Food and Agriculture Organization., 2009b. The Role of Education, Training and Capacity Development in Poverty Reduction and Food Security. (United Nations: Rome). www.fao.org/3/a-i0760e.pdf. (Accessed May 2009).
Fidzani, NH., 1993. Understanding Cattle Offtake Rates in Botswana. PhD Thesis: Boston University.
Francis, J.and Sibanda, S., 2001. Participatory Action Research Experiences in Smallholder Dairy Farming in Zimbabwe. Livestock Research for Rural Development, 13(3): 1-6.

70
Frisch, JE., 1999. Towards a Permanent Solution for Controlling Cattle Ticks. International Journal for Parasitology 29: 57-71.
Fuller, A., 2006. The sacred hide of Nguni; the rise of an ancient breed of cattle is giving South Africa new opportunity. Miracles that are changing the Nation. Industrial Development Corporation (IDC) Newsletter, 34.
Gujarati, DN., 2003. Basic Econometrics. McGraw Hill: (New York).
Gusha, J., Manyuchi, CR., Imbayarwo-Chikosi, VE., Hamandishe, VR., Katsande, S. and Zvinorova, PI., 2014. Production and Economic Performance of F1-crossbred Dairy Cattle fed Non-conventional Protein Supplements in Zimbabwe. Tropical Animal Health and Production 46(1): 229-234.
Gwelo, AF., Tefera, S. and Muchenje, V., 2015. Temporal and Spatial Dynamics of Mineral Levels of Forage, Soil and Cattle Blood Serum in Two Semi-arid Savannas of South Africa. African Journal of Range & Forage Science 32(4): 279-287.
Hanyani-Mlambo, BT., Sibanda, S. and Østergaard, V., 1998. Socio-economic Aspects of Smallholder Dairying in Zimbabwe. Livestock Research for Rural Development 10(2): 1-14.
Hartono, B. and Rohaeni, ES., 2014. Contribution to Income of Traditional Beef Cattle Farmer Households in Tanah Laut Regency, South Kalimantan, Indonesia. Livestock Research for Rural Development 26(8): 10.
Hove, L., Beffa, ML.and Ndlovu, LR., 1991. Effects of Inbreeding on Fertility and Calf Mortality in Africander Cattle. Zimbabwean Journal of Agricultural Research 29(1):11- 15.
Hunter, LM., Twine, W. and Patterson, L., 2007. “Locusts are now our beef'': Adult Mortality and Household Dietary Use of Local Environmental Resources in Rural South Africa. Scandinavian Journal of Public Health 35(69 suppl.): 165-174.
Jooste, A., 2001. Economic Implications of Trade Liberalisation in the South African Red Meat industry. PhD Thesis: University of the Free State.
Kadzere, C.T., 1996. Animal Production Level: A Measure of Social Development in Southern Africa. Journal of Social Development in Africa, 11(1), pp.17-31.
Kaewthamasorn, M. and Wongsamee, S., 2006. A Preliminary Survey of Gastrointestinal and Haemoparasites of Beef Cattle in the Tropical Livestock Farming System in Nan Province, Northern Thailand. Parasitology Research 99(3): 306-308.

71
Katiyatiya, CLF., Muchenje, V. and Mushunje, A., 2014. Farmers’ Perceptions and Knowledge of Cattle Adaptation to Heat Stress and Tick Resistance in the Eastern Cape, South Africa. Asian-Australasian Journal of Animal Sciences 27(11): 1663.
Kariuki, J., Njuki, J., Mburu, S. and Waithanji, E., 2013. Women, livestock ownership and food security. WOMEN, LIVESTOCK OWNERSHIP AND MARKETS, p.95.
Khombe, CT. and Tawonezvi, HPR., 1995. Beef Performance Recording in Zimbabwe: The Way Forward. In Dzama K, Ngwerume FN & Bhebhe E (Eds) Proceedings of the International Symposium on Livestock Production through Animal Breeding and Genetics, 10-11 May 1995. (University of Zimbabwe: Harare) pp. 135-138.
Khombe, CT., 1998. A Description of the Response in Weaning Weight realised in One Generation when Improved Bulls are introduced into a Randomly Mating Unimproved Population. In Proceedings of the 6th World Congress on Genetics Applied to Livestock Production. Armidale (Vol. 25) pp. 285-288.
Lemke, S., 2001. Food Security in African 'Households': An Interdisciplinary Approach of Social Factors and Gender Relations. PhD Thesis: University of Pretoria.
Maburutse, BE., Mutibvu, T., Mbiriri, DT. and Kashangura, MT., 2012. Communal Livestock Production in Simbe, Gokwe South District of Zimbabwe. Online Journal of Animal and Feed Research 2(4): 351-360.
Makhura, M., 2001. Overcoming Transaction Costs Barriers to Market Participation of Smallholder Farmers in the Northern Province of South Africa. Unpublished PhD Thesis: University of Pretoria.
Mandleni, B. and Anim, F., 2012. Climate Change and Adaptation of Small-scale Cattle and Sheep Farmers. African Journal of Agricultural Research 7(7): 2639-2646.
Mapekula, M., 2009. Milk Production and Calf Performance in Nguni and Crossbred Cattle raised on Communal Rangelands of the Eastern Cape Province of South Africa. PhD Thesis: University of Fort Hare.
Mapiye, C., Chimonyo, M. and Dzama, K., 2009a. Seasonal Dynamics, Production Potential and efficiency of Cattle in the Sweet and Sour Communal Rangelands in South Africa. Journal of Arid Environments 73(4): 529-536.
Mapiye, C., Chimonyo, M., Dzama, K., Raats, J. G. and Mapekula, M., 2009b. Opportunities for improving Nguni cattle production in the smallholder farming systems of South Africa. Livestock Science, 124(1), 196-204.

72
Mapiye, C., Chimonyo, M., Muchenje, V., Dzama, K., Marufu, MC. and Raats, JG., 2007. Potential for Value-addition of Nguni Cattle Products in the Communal Areas of South Africa: A Review. African Journal of Agricultural Research 2(10): 488-495.
Masikati, P., 2010. Improving the Water Productivity of Integrated Crop-Livestock Systems in the Semi-Arid Tropics of Zimbabwe: An Ex-Ante Analysis using Simulation Modeling. http://www.zef.de/fileadmin/webfiles/downloads/zefc_ecology_development/eds_78_masikati_text.pdf. (Accessed 17 January 2012).
Mashoko, E., Muchenje, V., Ndlovu, T., Mapiye, C., Chimonyo, M. and Musemwa, L., 2007. Beef Cattle Production in a Peri-Urban Area of Zimbabwe. Journal of Sustainable Development in Africa 9:121-132.
Mavedzenge, BZ., Mahenehene, J., Murimbarimba, F., Scoones, I., Wolmer, W. and Hotel, C., 2006. Changes in the Livestock Sector in Zimbabwe following Land Reform: The case of Masvingo Province. Institute for Development Studies, Brighton. http://www.ids.ac.uk/ids/KNOTS/AgLivestock.html (Accessed 1 May 2006).
McDonald, P., Edwards, R.A., Greenhalgh, J.F.D. and Morgan, C.A., 1995. Animal Nutrition 5th. Essex: Pearson Education Publishers, pp.49-127.
McGarry, DK. and Shackleton, CM., 2009. Children Navigating Rural Poverty: Rural Children's Use of Wild Resources to counteract Food Insecurity in the Eastern Cape, South Africa. Journal of Children and Poverty 15(1): 19-37.
Meissner, HH., Scholtz, MM. and Engelbrecht, FA., 2014. Sustainability of the South African Livestock Sector towards 2050 Part 2: Challenges, Changes and Required Implementations. South African Journal of Animal Science 43(3): 289-319.
Mhlanga, F.N., 2000. Module CASD 303: Animal Breeding 2. Zimbabwe Open University, Harare, Zimbabwe.
Mngomezulu, S., 2010. Formal marketing of cattle by communal farmers in the Eastern Cape Province of South Africa, Can they take part (MSc thesis, Wageningen University, Netherlands).
Modirwa, S. and Oladele, OI., 2012. Food Security among Male and Female-Headed Households in Eden District Municipality of the Western Cape, South Africa. Journal of Human Ecology 37(1): 29-35.
Motshwe, DB., 2006. Factors affecting Participation in Mainstream Cattle Markets by Small-Scale Cattle Farmers in South Africa. MSc Thesis. University of Free State.

73
Moyo, S., 1995. Evaluation of breeds for beef production in Zimbabwe. In Dzama K, Ngwerume FN and Bhebhe E (Eds) Proceedings of the International Symposium on Livestock Production through Animal Breeding and Genetics, 10-11 May 1995. (University of Zimbabwe: Harare) pp. 135-138.
Moyo,S., Ndlovu, K. and Magwenzi., 1993. Comparative Study of the Performance of Tuli, Brahman, Hereford, Simmental and their Resultant Crosses. In Annual Report of the Division of Livestock and Pastures, Department of Research and Specialist Services, Zimbabwe. (DLR: Harare).
Moyo, S. and Swanepoel, F.J.C., 2010. Multifunctionality of livestock in developing communities. The role of livestock in developing communities: Enhancing multifunctionality, p.1.
Mpumalanga Department of Agriculture, Conservation and Environment., 2003. Mpumalanga State of the Environment Report. (DACE: Nelspruit).
Mpumalanga DALA., 2006: Integrated Resource Information Report: Albert Luthuli.
Mpumalanga Provincial Government. (DALA: Nelspruit).
Mpumalanga Department of Agriculture, Rural Development, Land and Environmental Affairs., 2012. Terms of Reference for Strategic Partnerships/Investors for the GIBA Community Land Reform Project. (DARDLEA: Nelspruit).
Mpumalanga Economic Growth & Development Path., 2012. (MEGP: Nelspruit).
Muchena, M., Piesse, J., Thirtle, C. and Townsend, R.F., 1997. Herd size and efficiency in mixed crop and livestock farms: case studies of Chiweshe and Gokwe, Zimbabwe. Agrekon, 36(1), pp.59-80.
Muchenje, V., Dzama, K., Chimonyo, M., Raats, JG. and Strydom, PE., 2008. Meat Quality of Nguni, Bonsmara and Aberdeen Angus Steers raised on Natural Pasture in the Eastern Cape, South Africa. Meat Science 79(1): 20-28.
Munyai, FR., 2012. An Evaluation of Socio-Economic and Biophysical Aspects of Small-Scale Livestock Systems Based on a Case Study from Limpopo Province: Muduluni Village. PhD Thesis: University of the Free State.
Musemwa, L., Mushunje, A., Chimonyo, M. and Mapiye, C., 2010. Low Cattle Market Offtake Rates in Communal Production Systems of South Africa: Causes and Mitigation Strategies. Journal of Sustainable Development in Africa 12(5): 209-226.

74
Mutibvu, T., Maburutse, B.E., Mbiriri, D.T. and Kashangura, M.T., 2012. Constraints and opportunities for increased livestock production in communal areas: A case study of Simbe, Zimbabwe. Livestock Research for Rural Development 24, p.165.
Mwacharo, JM. and Drucker, AG., 2005. Production Objectives and Management Strategies of Livestock-Keepers in Southeast Kenya: Implications for a Breeding Programme. http://www.ilri.org/html/ZebuBreeding%20_Mwacharo_Drucker_%20Accepted%20TAHP.pdf (Accessed on 4 May 2010).
Mwangi, JG., 2013. Developing a Vibrant Livestock Industry in East Africa through Market Driven Research. Journal of US-China Public Administration 10(6): 608-617.
National Department of Agriculture., 2013. National Livestock Statistics – May 2013. In Newsletter on National Livestock Statistics. (National Department of Agriculture: Pretoria).
National Department of Agriculture., 2010. Strategic Plan for the Department of Agriculture 2003 to 2006. (NDA Directorate Agricultural Information Services: Pretoria).
Ndebele, J J., Muchenje, V., Mapiye, C., Chimonyo, M., Musemwa, L. and Ndlovu, T., 2007. Cattle breeding management practices in the Gwayi smallholder farming area of South-western Zimbabwe. Livestock Research for Rural Development 19 (12). http://www.lrrd.org/lrrd19/12/ndeb19183.htm.
Ndlovu, T., 2007. Prevalence of Internal Parasites and Levels of Nutritionally-Related Blood Metabolites in Nguni, Bonsmara and Angus Steers raised on Veld. MSc Thesis. University of Fort Hare.
Ngongoni, NT., Mapiye, C., Mwale, M. and Mupeta, B., 2006. Factors affecting Milk Production in the Smallholder Dairy Sector of Zimbabwe. Livestock Research for Rural Development 18(05): 1-21.
Nitter, G., 2000. Developing Crossbreeding Structures for Extensive Grazing Systems utilising only Indigenous Animal Genetic Resources. In Galal S, Boyazoglu J & Hammond K (Eds) Workshop on Developing Breeding Strategies for Lower Input Animal Production, 22-25 September 1999, Bella, Italy. ICAR Technical Series No. 3. pp. 179-206.
Nkhori, PA., 2004. The Impact of Transaction Costs on the Choice of Cattle Markets in Mahalapyed District, Botswana. MSc Dissertation: University of Pretoria.

75
Nkosi, SA. and Kirsten, JF., 1993. The Marketing of Livestock in South Africa's developing Areas: A Case Study of the Role of Speculators, Auctioneers, Butchers, and Private Buyers in Lebowa. Agrekon 4: 230-237.
Nouman, W., Basra, SMA., Siddiqui, MT., Yasmeen, A., Gull, T. and Alcayde, MAC., 2014. Potential of Moringa oleifera L. as Livestock Fodder Crop: A Review. Turkish Journal of Agriculture and Forestry 38(1): 1-14.
Nowers, CB., Nobumba, LM. and Welgemoed, J., 2013. Reproduction and Potential of Communal Cattle on Sourveld in the Eastern Cape Province, South Africa. Applied Animal Husbandry and Rural Development 6: 48-54.
Nqeno, N., Chimonyo, M., Mapiye, C. and Marufu, MC., 2010. Ovarian Activity, Conception and Pregnancy Patterns of Cows in the Semi-Arid Communal Rangelands in the Eastern Cape Province of South Africa. Animal Reproduction Science 118: 140-147.
Nqeno, N., Chimonyo, M. and Mapiye, C., 2011. Farmers’ Perceptions of the Causes of Low Reproductive Performance in Cows kept under Low-Input Communal Production Systems in South Africa. Tropical Animal Health Production 43: 315–321.
Nthakheni, DN., 1993. Productivity Measures and Dynamics of Cattle Herds of Small Scale Producers in Venda. MSc Dissertation: University of Pretoria.
Ogunkoya, FT., 2014. Socio-Economic Factors that affect Livestock Numbers: A Case Study of Smallholder Cattle and Sheep Farmers in the Free State Province of South Africa. MSc Dissertation: University of South Africa.
Palmer, AR., Ainslie, AM. and Hoffman, MT., 1999. Sustainability of Commercial and Communal Rangeland Systems in Southern Africa. In Proceedings of the 6th International Rangeland Congress, 17-23 July 1999, Townsville, Australia.
Paumgarten, F., 2005. The Role of Non-Timber Forest Products as Safety-Nets: A Review of Evidence with a Focus on South Africa. GeoJournal 64(3): 189-197.
Phillips, L., 2013. South Africa’s Beef Industry: What does the Future hold? www.farmersweekly.co.za/article.aspx?id=44228 issued date: 9 August 2013.
Rajput, ZI., Hu, SH., Chen, WJ., Arijo, AG. and Xiao, CW., 2006. Importance of Ticks and their Chemical and Immunological Control in Livestock. Journal of Zhejiang University Science B 7(11): 912-921.
Registrar: Livestock Improvement and Identification., 2011. Business Plan for the Development of the Livestock Industry in the Resource-Poor Sector by providing Integrated Management and Marketing Services. (NDA Sub-Directorate Animal Genetic Resources: Pretoria)

76
Sakyi, P., 2012. Determinants of Food Accessibility of Rural Households in the Limpopo Province, South Africa. Unpublished MSc Dissertation: Gent University.
Scholtz, MM. and Bester, J., 2010. The Effect of Stock Theft and Mortalities on the Livestock Industry in South Africa. Applied Animal Husbandry & Rural Development 3: 15-18.
Scholtz, MM., Van Ryssen, JBJ., Meissner, HH. and Laker, MC., 2013. A South African Perspective on Livestock Production in relation to Greenhouse Gases and Water Usage. South African Journal of Animal Science 43(3): 247-254.
Scholtz, MM., Bester, J., Mamabolo, JM. and Ramsay, KA., 2008. Results of the National Cattle Survey undertaken in South Africa, with Emphasis on Beef. Applied Animal Husbandry & Rural Development 1:1-19.
Sekoto, KS. and Oladele, OI., 2012. Analysis of Support Service Needs and Constraints facing Farmers Under Land Reform Agricultural Projects in North West Province, South Africa. Life Science Journal 9(4): 1444-1452.
Sereno, J.R.B., Costa e Silva, E.V.D. and Mores, C.M., 2002. Reduction of the bull: cow ratio in the Brazilian Pantanal. Pesquisa Agropecuária Brasileira, 37(12), pp.1811-1817.
Shackleton, S., Shackleton, C. and Cousins, B., 2000. Re-valuing the Communual Lands of Southern Africa: New Understandings of Rural Livelihoods. London: Overseas Development Institute.
Shackleton, CM., Shackleton, SE. and Cousins, B., 2001. The Role of Land-Based Strategies in Rural Livelihoods: The Contribution of Arable Production, Animal Husbandry and Natural Resource Harvesting in Communal Areas in South Africa. Development Southern Africa Journal 18: 581-604.
Shackleton, C. and Shackleton, S., 2004. The Importance of Non-Timber Forest Products in Rural Livelihood Security and as Safety Nets: A Review of Evidence from South Africa. South African Journal of Science 100(11&12): 658.
Shackleton, CM,. Shackleton, SE., Netshiluvhi, TR. and Mathabela, FR., 2005. The Contribution and Direct-Use Value of Livestock to Rural Livelihoods in the Sand River Catchment, South Africa. African Journal of Range and Forage Science 22(2): 127-140.
Shackleton, S., Campbell, B., Lotz-Sisitka, H. and Shackleton, C., 2008. Links between the Local Trade in Natural Products, Livelihoods and Poverty Alleviation in a Semi-Arid Region of South Africa. World Development 36(3): 505-526.

77
Sibanda, BS., 2014. Beef Cattle Development Initiatives: A Case of Matobo A2 Resettlement farms in Zimbabwe. Global Journal of Animal Scientific Research 2(3): 197-204.
Sibanda, S., 1999. Animal Production and Management. Module 1 CASD 301. (Zimbabwe Open University: Harare) p. 213.
Siegmund-Schultze, M., Lange, F., Schneiderat, U. and Steinbach, J., 2012. Performance, management and Objectives of Cattle Farming on Communal Ranges in Namibia. Journal of Arid Environments 80: 65-73.
Sikhweni, N P. and Hassan, R., 2014. Opportunities and Challenges facing Small-Scale Cattle Farmers living adjacent to Kruger National Park, Limpopo Province. Journal of Emerging Trends in Economics and Management Sciences 5(1): 38-43.
Smith, J., Tarawali, S., Grace, D. and Sones, K., 2013. Feeding the World in 2050: Trade-Offs, Synergies and Tough Choices for the Livestock Sector. Tropical Grasslands – Forajes Tropicales 1: 125-136.
Soyelu, OT. and Masika, PJ., 2009. Traditional Remedies used for the Treatment of Cattle Wounds and Myiasis in Amatola Basin, Eastern Cape Province, South Africa. Onderstepoort Journal of Veterinary Research 76(4): 393.
SPSS Inc., 2015. SPSS version 22.0 for Windows User's Guide. (SPSS Inc.: Chicago)
Statistics South Africa (SSA)., 2011. Republic South Africa. www.statssa.gov.za/?page_id=993&id=albert-luthuli-municipality. (Accessed 30 May 2012)
Statistics South Africa (SSA)., 2013. Mid-Year Population Estimates 2013. (SSA: Pretoria)
Stevens, RD. and Jabara CL., 1988. Agricultural Development Principles: Economic Theory and Empirical Evidence. Johns Hopkins Studies in Development (USA). America.
Stroebel, A., 2004. Socio-Economic Complexities of Smallholder Resource-Poor Ruminant Livestock Production Systems in Sub-Saharan Africa. PhD Thesis: University of Free State.
Swanepoel, FJC. and De Lange, AO., 1993. Critical Determinants for Successful Small Scale Livestock Production. Livestock Farmer Support Programme Workshop, Venda Agricultural Training Centre, 22–23 March 1993, Venda, South Africa.

78
Tada, O., Muchenje, V. and Dzama, K., 2012. Monetary value, current roles, marketing options, and farmer concerns of communal Nguni cattle in the Eastern Cape Province, South Africa. African Journal of Business Management, 6(45), p.11304.
Tada, O, Muchenje, V. and Dzama, K., 2013. Preferential Traits for Breeding Nguni Cattle in Low-Input In-Situ Conservation Production Systems. Springerplus 2(2): 195.
Tavirimirwa, B., Mwembe, R., Ngulube, B., Banana, N.Y.D., Nyamushamba, G.B., Ncube, S. and Nkomboni, D., 2013. Communal cattle production in Zimbabwe: A. Development, 25, p.12.
Thomas, B., Togarepi, C. and Simasiku, A., 2014. Analysis of the Determinants of the Sustainability of Cattle Marketing Systems in Zambezi Region of North-Eastern Communal Area of Namibia. International Journal of Livestock Production 5(7): 129-136.
Thondhlana, G., Vedeld, P. and Shackleton, S., 2012. Natural Resource Use, Income and Dependence among San and Mier Communities bordering Kgalagadi Transfrontier Park, Southern Kalahari, South Africa. International Journal of Sustainable Development & World Ecology 19(5): 460-470.
Thornton, PK., 2010. Livestock Production: Recent Trends, Future Prospects. Philosophical Transactions of the Royal Society of London B: Biological Sciences 365(1554): 2853-2867.
Twine, W., Moshe, D., Netshiluvhi, T. and Siphugu, V., 2003. Consumption and Direct-Use Values of Savanna Bio-Resources used by Rural Households in Mametja, a Semi-Arid Area of Limpopo Province, South Africa: Research Letter. South African Journal of Science 99(9&10): 467.
Tyasi, TL., Ngayo, M., Qin, N., Lyu, ZC. and Gxasheka, M., 2015. The Use of Nguni in Crossbreeding Programmes as a way to improve both the Communal and Commercial Beef Enterprises in South Africa. African Journal of Agricultural Science and Technology 3(5): 244-249.
Umeh, GN. and Odom, CN., 2011. Role and Constraints of Youth Associations in Agricultural and Rural Development: Evidence from Aguata LGA of Anambra State, Nigeria. World Journal of Agricultural Sciences 7(5): 515-519.
Valbuena, D., Erenstein, O, Tui, SHK., Abdoulaye, T., Claessens, L., Duncan, AJ. and Van Wijk, MT., 2012. Conservation Agriculture in Mixed Crop–Livestock Systems: Scoping Crop Residue Trade-Offs in Sub-Saharan Africa and South Asia. Field Crops Research 132: 175-184.

79
Vetter, S., 2013. Development and Sustainable Management of Rangeland Commons – Aligning Policy with the Realities of South Africa's Rural Landscape. African Journal of Range & Forage Science 30(1-2): 1-9.
Webb, EC., 2013. The Ethics of Meat Production and Quality - A South African Perspective. South African Journal of Animal Science 43: 1-9.

80
APPENDIX 1: SEMI-STRUCTURED QUESTIONNAIRE ___________________________________________________________________
QUESTIONNAIRE
UTILIZATION AND MANAGEMENT OF BEEF CATTLE FARMING AS
CONTRIBUTOR TO INCOME OF HOUSEHOLDS IN COMMUNAL AREAS OF CHIEF
ALBERT LUTHULI LOCAL MUNICIPALITY IN MPUMALANGA PROVINCE
Dear Sir / Madam
The survey is conducted in Mpumalanga Province, in four rural communal areas of Chief Albert
Luthuli to evaluate the contribution of beef cattle farming to communal household income. Please
do not enter your name on the questionnaire. It remains anonymous. Information provided by you
remains confidential and will be reported in summary format only. Your participation in this
research is confidential and in the event of a publication or presentation resulting from the
research, no personally identifiable information will be shared. Your decision to be part of this
research is voluntary and you may stop at any time you wish. You do not have to answer any
questions if you do not want to.
Should you have any queries or comments regarding this survey, you are welcome to contact me
telephonically at 076 502 7572 or e-mail us at [email protected]
Kindly complete questionnaire and return it to Private Bag X 9019, Ermelo, 2350
Yours sincerely
Sphiwe Hleziphi Molefi
MSc. Student at University of South Africa

81
Questionnaire number
Name of the location
Co-ordinates
PLEASE ANSWER THE FOLLOWING QUESTIONS BY CROSSING (X) TO THE
RELEVENT BLOCK OR WRITING DOWN YOUR ANSWER IN THE SPACE PROVIDED.
A. SECTION A
Example of how to complete this questionnaire
Your gender? (If you are Male)
Male 1
Female 2
Or
(If you are Female)
Male 1
Female 2

82
This section of the questionnaire refers to the bibliographic information and characteristics of
respondents. Although we are aware of the sensitivity of the question in this section, the
information will allow us to compare groups of responds. Once again, we assure you that your
response will remain anonymous. Your co-operation is appreciated
1. Gender
1 Male
2 Female
2. Age of respondent
1 < 20
2 21 - 30
3 31 – 40
4 41- 50
5 >51
3. Level of education
1 No schooling
2 Grade 11 or below
3 Grade 12
4 Post – matric or above
5 Others please specify

83
4. What is your main occupation?.......................................................
5. What is your source of income (tick first column appropriate and rank 1 as the most important
income
Sources Amount raise Rank
Cattle
Salary
Pension
Other (specify)
6. What is your religion? Christianity Traditional Muslim Others
(specify)………..........
7. Number of household member
1 1-2 people
2 3 – 4 people
3 >4 people
4 Others please specify

84
8. Farming experience (years)
1 1-10 years
2 11-12 years
3 >20 years
4 Others please specify
9. Agriculture land area (Farm size)
1 <1
2 1-2
3 >2
4 Others please specify
10. Number of beef cattle owned
1 <4
2 4-10
3 >10
4 Others please specify
11. What is the composition of your cattle herd?
Heifers Cows Bulls Calves Oxen Steers

85
SECTION B
This section is about the importance of keeping beef cattle
12. Why do you keep cattle? (Tick and rank 1 as the most common use)
Use Rank Use Rank
Meat Sales
Draught power Status
Manure Ceremonies
Skin Other (specify)
13. Number of household that rear beef cattle and sell
1 0
2 10-20
3 20-30
4 >40
14. Household ranking of beef cattle as a source of income
1 1st
2 2nd
3 3rd
4 Others

86
15. Number of household that rear beef cattle for human consumption
1 0
2 10-20
3 20-30
4 >40
16. Number of household that rear beef cattle for animal draught, power
1 Animal draught
2 Owned
3 Rented
17. Number of household that used beef cattle for socio cultural functions
1 Wedding
2 Funeral
3 Lobola
4 birthdays
5 Child naming ceremonies
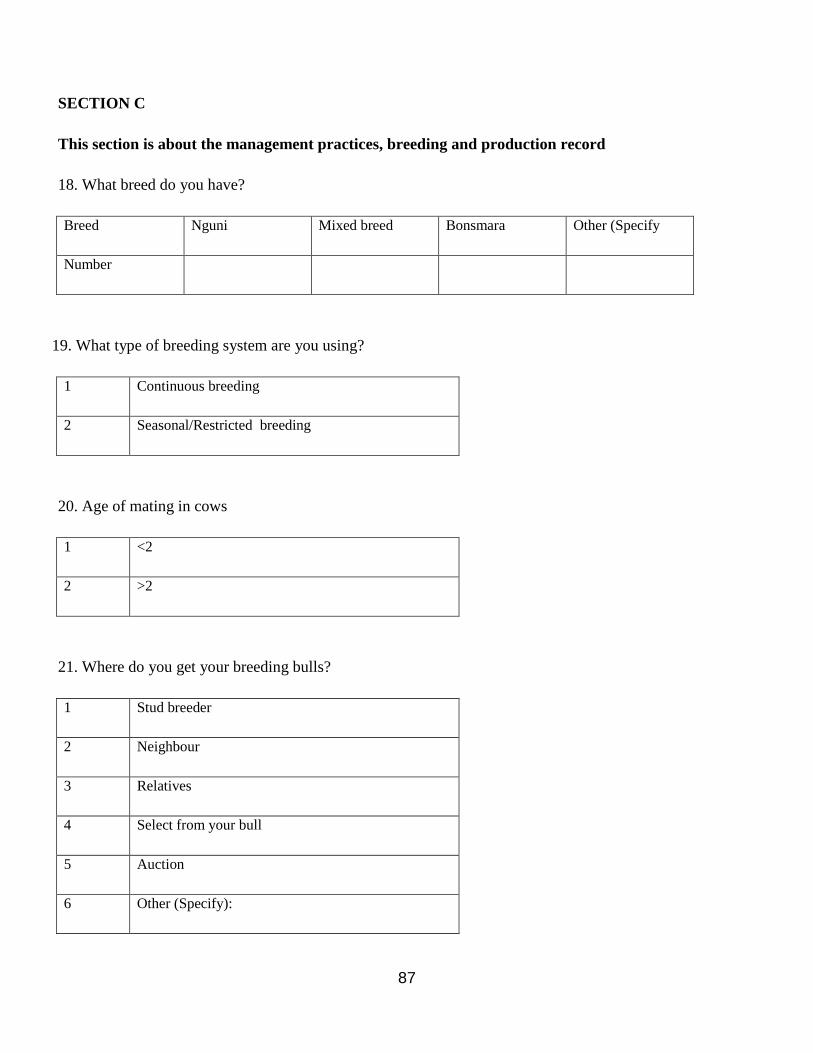
87
SECTION C
This section is about the management practices, breeding and production record
18. What breed do you have?
Breed Nguni Mixed breed Bonsmara Other (Specify
Number
19. What type of breeding system are you using?
1 Continuous breeding
2 Seasonal/Restricted breeding
20. Age of mating in cows
1 <2
2 >2
21. Where do you get your breeding bulls?
1 Stud breeder
2 Neighbour
3 Relatives
4 Select from your bull
5 Auction
6 Other (Specify):

88
22. What calving percentage do you get in your farm?
1 <40 %
2 50-70%
3 >80%
23. At what age do you wean?
1 5-7 months
2 7-9 months
24. What is the weaning percentage?
1 <40%
2 50-60 %
3 >60 %
25. What type of feeding system do you use?
Herding Paddock Free grazing Other (Specify)…………..
26. What are the sources of feed for your cattle?
Veld Pasture Crop residues bought in feed Other (Specify)……….
27. Do you provide supplementary feeding to your cattle? Yes No
28. If yes, when do you provide supplements to your cattle?
Rainy season Winter Drought season All year around Other (specify)……….
29. What is the general body condition of the animals?
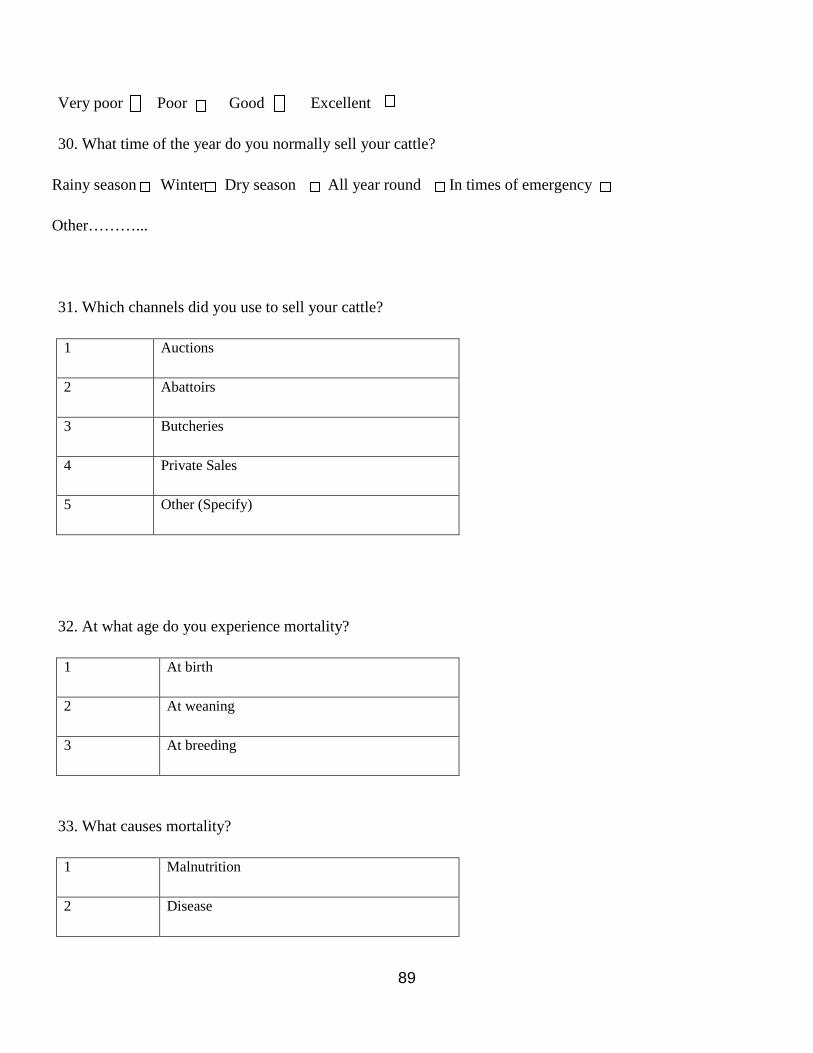
89
Very poor Poor Good Excellent
30. What time of the year do you normally sell your cattle?
Rainy season Winter Dry season All year round In times of emergency
Other………...
31. Which channels did you use to sell your cattle?
1 Auctions
2 Abattoirs
3 Butcheries
4 Private Sales
5 Other (Specify)
32. At what age do you experience mortality?
1 At birth
2 At weaning
3 At breeding
33. What causes mortality?
1 Malnutrition
2 Disease

90
3 Predators
4 Still birth
5 Others (Specify)
34. What problems do you face in cattle production?...............................................................................
……………………………………………………………………………………………………………
…………………………………………………………………………………………………………..
……………………………………………………………………………………………………………
35. What are the possible solutions to the problem you have mentioned above?......................................
……………………………………………………………………………………………………………
……………………………………………………………………………………………………………
……………………………………………………………………………………………………………
Thank you for your co-operation in completing this questionnaire

91
APPENDIX 2: DESCRIPTIVE STATISTICS ______________________________________________________________________
Frequency Table
Location of the respondents
VARIABLE Frequency Percent Percent Cumulative
Percent Dundonald 50 25.0 25.0 25.0
Elukwatini 50 25.0 25.0 50.0 Mooiplaas 50 25.0 25.0 75.0 Tjakastaad 50 25.0 25.0 100.0 Total 200 100.0 100.0
Gender of respondents
Frequency Percent Valid Percent Cumulative Percent Valid Male 159 79.5 79.5 79.5
Female 41 20.5 20.5 100.0 Total 200 100.0 100.0
Age of respondents
Frequency Percent Valid Percent Cumulative Percent Valid 27 1 0.5 0.5 0.5
29 2 1.0 1.0 1.5 31 1 0.5 0.5 2.0 33 2 1.0 1.0 3.0 34 1 0.5 0.5 3.5 35 2 1.0 1.0 4.5 36 1 0.5 0.5 5.0 37 3 1.5 1.5 6.5 38 3 1.5 1.5 8.0 39 1 0.5 0.5 8.5 40 1 0.5 0.5 9.0 41 2 1.0 1.0 10.0 42 8 4.0 4.0 14.0 43 10 5.0 5.0 19.0 44 11 5.5 5.5 24.5 45 6 3.0 3.0 27.5 46 8 4.0 4.0 31.5 47 13 6.5 6.5 38.0 48 7 3.5 3.5 41.5 49 10 5.0 5.0 46.5 50 2 1.0 1.0 47.5

92
52 2 1.0 1.0 48.5 54 3 1.5 1.5 50.0 55 2 1.0 1.0 51.0 56 1 0.5 0.5 51.5 57 1 0.5 0.5 52.0 60 4 2.0 2.0 54.0 61 5 2.5 2.5 56.5 62 2 1.0 1.0 57.5 63 1 0.5 0.5 58.0 64 2 1.0 1.0 59.0 65 2 1.0 1.0 60.0 66 6 3.0 3.0 63.0 67 5 2.5 2.5 65.5 68 7 3.5 3.5 69.0 69 9 4.5 4.5 73.5 70 2 1.0 1.0 74.5 71 3 1.5 1.5 76.0 72 5 2.5 2.5 78.5 73 2 1.0 1.0 79.5 74 3 1.5 1.5 81.0 75 4 2.0 2.0 83.0 76 3 1.5 1.5 84.5 77 7 3.5 3.5 88.0 78 4 2.0 2.0 90.0 79 5 2.5 2.5 92.5 80 1 0.5 0.5 93.0 81 1 0.5 0.5 93.5 82 1 0.5 0.5 94.0 83 1 0.5 0.5 94.5 84 2 1.0 1.0 95.5 86 2 1.0 1.0 96.5 87 3 1.5 1.5 98.0 88 2 1.0 1.0 99.0 89 1 0.5 0.5 99.5 90 1 0.5 0.5 100.0 Total 200 100.0 100.0
Age range of respondents
Frequency Percent Valid Percent Cumulative
Percent Valid 21 - 30 3 1.5 1.5 1.5
31 - 40 16 8.0 8.0 9.5 41 - 50 80 40.0 40.0 49.5 >51 101 50.5 50.5 100.0

93
Total 200 100.0 100.0
Education level
Frequency Percent Valid Percent Cumulative
Percent Valid No schooling 90 45.0 45.0 45.0
Grade 11 or below 81 40.5 40.5 85.5
Grade 12 28 14.0 14.0 99.5 Post matric or above 1 0.5 0.5 100.0
Total 200 100.0 100.0
Occupation
Frequency Percent Valid Percent Cumulative
Percent Valid Pensioner 96 48.0 48.0 48.0
Employed 44 22.0 22.0 70.0 Self employed 31 15.5 15.5 85.5 Unemployed 29 14.5 14.5 100.0 Total 200 100.0 100.0
Source of income
Frequency Percent Valid Percent Cumulative Percent Valid Salary 17 8.5 8.5 8.5
Other and salary 6 3.0 3.0 11.5 Farming, pension and cattle 1 0.5 0.5 12.0 Other 7 3.5 3.5 15.5 Pension 37 18.5 18.5 34.0 Cattle 17 8.5 8.5 42.5 Farming 4 2.0 2.0 44.5 Cattle and pension 57 28.5 28.5 73.0 Salary and cattle 39 19.5 19.5 92.5 Pension and farming 1 0.5 0.5 93.0 Cattle and farming 11 5.5 5.5 98.5 Other and cattle 3 1.5 1.5 100.0 Total 200 100.0 100.0

94
Amount received from beef cattle per year Frequency Percent Valid Percent Cumulative Percent Valid 0 42 21.0 21.0 21.0
10000 4 2.0 2.0 23.0 11000 2 1.0 1.0 24.0 12000 2 1.0 1.0 25.0 14000 5 2.5 2.5 27.5 1500 2 1.0 1.0 28.5 15000 6 3.0 3.0 31.5 16000 4 2.0 2.0 33.5 17000 3 1.5 1.5 35.0 18000 4 2.0 2.0 37.0 19000 1 0.5 0.5 37.5 2000 2 1.0 1.0 38.5 20000 3 1.5 1.5 40.0 22000 2 1.0 1.0 41.0 2500 5 2.5 2.5 43.5 25000 3 1.5 1.5 45.0 26000 2 1.0 1.0 46.0 27000 1 0.5 0.5 46.5 3000 10 5.0 5.0 51.5 30000 3 1.5 1.5 53.0 3500 6 3.0 3.0 56.0 4000 16 8.0 8.0 64.0 4500 6 3.0 3.0 67.0 45000 2 1.0 1.0 68.0 47000 1 0.5 0.5 68.5 5000 11 5.5 5.5 74.0 50000 2 1.0 1.0 75.0 5500 1 0.5 0.5 75.5 6000 13 6.5 6.5 82.0 60000 1 0.5 0.5 82.5 6200 1 0.5 0.5 83.0 6500 1 0.5 0.5 83.5 6700 1 0.5 0.5 84.0 7000 10 5.0 5.0 89.0 7500 4 2.0 2.0 91.0 8000 7 3.5 3.5 94.5 8500 1 0.5 0.5 95.0 9000 10 5.0 5.0 100.0 Total 200 100.0 100.0

95
Amount Range
Frequency Percent Valid Percent Cumulative Percent Valid 0 - 5000 98 49 49 52.5
6000 -10 000 56 28 28 72.0 11 000 - 20 000 29 14.5 14.5 20.0 21 000 - 40 000 11 5.5 5.5 98.5 41 000 - 60 000 6 3 3 100.0 Total 200 100.0 100.0
Important income
Frequency Percent Valid Percent Cumulative Percent Valid Salry 57 28.5 28.5 28.5
Pension 87 43.5 43.5 72.0 Cattle 38 19.0 19.0 91.0 Farming 13 6.5 6.5 97.5 Other 5 2.5 2.5 100.0 Total 200 100.0 100.0
Affiliation of respondents
Frequency Percent Valid Percent Cumulative
Percent Valid Christianity 104 52.0 52.0 52.0
Traditional 61 30.5 30.5 82.5 Christianity and traditional 35 17.5 17.5 100.0
Total 200 100.0 100.0
Household member
Frequency Percent Valid Percent Cumulative
Percent Valid 1- 2 14 7.0 7.0 7.0
3 -4 23 11.5 11.5 18.5 > 4 71 35.5 35.5 54.0 Other 92 46.0 46.0 100.0 Total 200 100.0 100.0

96
Farming Experience
Frequency Percent Valid Percent Cumulative Percent Valid 1 - 10 51 25.5 25.5 25.5
11 -12 28 14.0 14.0 39.5 > 20 42 21.0 21.0 60.5 Other 79 39.5 39.5 100.0 Total 200 100.0 100.0
Farm size
Frequency Percent Valid Percent Cumulative Percent Valid 1 -2 11 5.5 5.5 5.5
> 2 29 14.5 14.5 20.0 Other 160 80.0 80.0 100.0 Total 200 100.0 100.0
No of cattle (range)
Frequency Percent Valid Percent Cumulative Percent Valid <4 17 8.5 8.5 8.5
4 -10 80 40.0 40.0 48.5 > 10 67 33.5 33.5 82.0 Other 36 18.0 18.0 100.0 Total 200 100.0 100.0
Number of cattle
Frequency Percent Valid Percent Cumulative Percent Valid 10 7 3.5 3.5 3.5
100 2 1.0 1.0 4.5 11 6 3.0 3.0 7.5 12 9 4.5 4.5 12.0 120 1 0.5 0.5 12.5 13 3 1.5 1.5 14.0 14 3 1.5 1.5 15.5 15 10 5.0 5.0 20.5 16 3 1.5 1.5 22.0 17 7 3.5 3.5 25.5 18 6 3.0 3.0 28.5 19 3 1.5 1.5 30.0 2 8 4.0 4.0 34.0 20 6 3.0 3.0 37.0 21 3 1.5 1.5 38.5 22 2 1.0 1.0 39.5 23 2 1.0 1.0 40.5

97
24 3 1.5 1.5 42.0 25 3 1.5 1.5 43.5 26 4 2.0 2.0 45.5 27 1 0.5 0.5 46.0 28 1 0.5 0.5 46.5 29 2 1.0 1.0 47.5 3 9 4.5 4.5 52.0 30 6 3.0 3.0 55.0 31 1 0.5 0.5 55.5 32 2 1.0 1.0 56.5 33 1 0.5 0.5 57.0 34 1 0.5 0.5 57.5 35 3 1.5 1.5 59.0 36 1 0.5 0.5 59.5 4 11 5.5 5.5 65.0 40 1 0.5 0.5 65.5 42 1 0.5 0.5 66.0 43 2 1.0 1.0 67.0 47 1 0.5 0.5 67.5 49 1 0.5 0.5 68.0 5 10 5.0 5.0 73.0 50 1 0.5 0.5 73.5 56 1 0.5 0.5 74.0 6 17 8.5 8.5 82.5 68 1 0.5 0.5 83.0 7 11 5.5 5.5 88.5 8 12 6.0 6.0 94.5 9 11 5.5 5.5 100.0 Total 200 100.0 100.0
Herd composition
Frequency Percent Valid Percent Cumulative
Percent Valid Cows 69 34.5 34.5 34.5
Cows, bulls, calves and oxen 4 2.0 2.0 36.5
Heifers, cows, calves and oxen 6 3.0 3.0 39.5
Cows and bulls 15 7.5 7.5 47.0 Cows, calves and oxen 7 3.5 3.5 50.5 Cows and oxen 5 2.5 2.5 53.0 Heifers and cows 3 1.5 1.5 54.5 Heifers, cows and oxen 2 1.0 1.0 55.5 Bulls 1 0.5 0.5 56.0

98
Calves 1 0.5 0.5 56.5 Oxen 2 1.0 1.0 57.5 Heifers 1 0.5 0.5 58.0 Heifer, cows, bulls and calves 13 6.5 6.5 64.5
Cows, bulls and calve 22 11.0 11.0 75.5 Heifers, cows and calves 12 6.0 6.0 81.5 Cows and calves 37 18.5 18.5 100.0 Total 200 100.0 100.0
Reason of keeping beef cattle
Frequency Percent Valid Percent Cumulative
Percent Meat 2 1.0 1.0 1.0
Milk and sales 10 5.0 5.0 6.0 Manure, milk and sale 12 6.0 6.0 12.0
Manure, sales, ceremonies and milk 21 10.5 10.5 22.5 Manure, sales, skin and ceremonies 11 5.5 5.5 28.0
Meat, sales, manure and milk 6 3.0 3.0 31.0 Manure, sales and meat 2 1.0 1.0 32.0
Meat, sales, draught power, manure and milk 13 6.5 6.5 38.5
Ceremonies, status and sales 13 6.5 6.5 45.0 Meat, milk and sales 4 2.0 2.0 47.0
Manure and sale 8 4.0 4.0 51.0 Draught power 3 1.5 1.5 52.5
Meat, sales, manure and skin 14 7.0 7.0 59.5 Draught power, sales, manure, milk, and
ceremonies 18 9.0 9.0 68.5
Manure and status 14 7.0 7.0 75.5 Manure 2 1.0 1.0 77.0
Skin 2 1 1 77.5 Sales 8 4.0 4.0 81.5 Status 8 4.0 4.0 85.5
Ceremonies 4 2.0 2.0 87.5 Milk 4 2.0 2.0 89.5
Meat and sales 21 10.5 10.5 100.0 Total 200 100.0 100.0

99
Percentage rearing & selling beef cattle Frequency Percent Valid Percent Cumulative Percent Valid 0 48 24.0 24.0 24.0
10 - 20 84 42.0 42.0 66.0 20 - 30 42 21.0 21.0 87.0 > 40 26 13.0 13.0 100.0 Total 200 100.0 100.0
Ranking of beef cattle as source of income Frequency Percent Valid Percent Cumulative Percent Valid 1st 35 17.5 17.5 17.5
2nd 94 47.0 47.0 64.5 3rd 27 13.5 13.5 78.0 Other 44 22.0 22.0 100.0 Total 200 100.0 100.0
Percentage of farmers kept beef cattle for consumption Frequency Percent Valid Percent Cumulative Percent Valid 0 91 45.5 45.5 45.5
10 -20 107 53.5 53.5 99.0 20 -30 2 1.0 1.0 100.0 Total 200 100.0 100.0
Used of beef cattle for draught power Frequency Percent Valid Percent Cumulative Percent Valid Owned 50 25.0 25.0 25.0
Rented 15 7.5 7.5 32.5 Other 135 67.5 67.5 100.0 Total 200 100.0 100.0

100
Socio cultural functions practiced with beef cattle
Frequency Percent Valid Percent Cumulative
Percent Valid Wedding 17 8.5 8.5 8.5
Funeral and ancestors 5 2.5 2.5 11.0 Other 39 19.5 19.5 30.5 Funeral 74 37.0 37.0 67.5 Lobola 14 7.0 7.0 74.5 Birth days 2 1.0 1.0 75.5 Child naming 2 1.0 1.0 76.5 Wedding and funerals 16 8.0 8.0 84.5 Funeral and lobola 8 4.0 4.0 88.5 Funeral and birthday 3 1.5 1.5 90.0 Wedding, funeral and lobola 20 10.0 10.0 100.0
Total 200 100.0 100.0
Preferable beef cattle breed Frequency Percent Valid Percent Cumulative Percent Valid Nguni 12 6.0 6.0 6.0
Mixed 139 69.5 69.5 75.5 Bonsmara 1 0.5 0.5 76.0 Brahman 22 11.0 11.0 87.0 Drakensberger 9 4.5 4.5 91.5 Other 17 8.5 8.5 100.0 Total 200 100.0 100.0
Type of breeding system used
Frequency Percent Valid Percent Cumulative Percent Valid Continuous 183 91.5 91.5 91.5
Seasonal 10 5.0 5.0 96.5 No mating 5 2.5 2.5 99.0 Other 2 1.0 1.0 100.0 Total 200 100.0 100.0
Age of mating cows
Frequency Percent Valid Percent Cumulative Percent Valid <2 180 90.0 90.0 90.0
>2 13 6.5 6.5 96.5 Other 7 3.5 3.5 100.0 Total 200 100.0 100.0

101
Source of breeding bulls
Frequency Percent Valid Percent Cumulative
Percent Valid Stud breeder 13 6.5 6.5 6.5
Neighbour 137 68.5 68.5 75.0 Relatives 4 2.0 2.0 77.0 Selected from your bulls 24 12.0 12.0 89.0 Auction 16 8.0 8.0 97.0 Other 6 3.0 3.0 100.0 Total 200 100.0 100.0
Calving percentage of beef cattle
Frequency Percent Valid Percent Cumulative Percent Valid <40 35 17.5 17.5 17.5
50 -70 87 43.5 43.5 61.0 > 80 68 34.0 34.0 95.0 Other 10 5.0 5.0 100.0 Total 200 100.0 100.0
Weaning age of the calves Frequency Percent Valid Percent Cumulative Percent Valid 5 - 7 months 155 77.5 77.5 77.5
7 -9 months 36 18.0 18.0 95.5 Other 9 4.5 4.5 100.0 Total 200 100.0 100.0
Weaning percentage of the herd
Frequency Percent Valid Percent Cumulative Percent Valid < 40 50 25.0 25.0 25.0
50 - 60 109 54.5 54.5 79.5 > 60 32 16.0 16.0 95.5 Other 9 4.5 4.5 100.0 Total 200 100.0 100.0
Feeding system practiced
Frequency Percent Valid Percent Cumulative Percent Valid Free grazing 200 100.0 100.0 100.0

102
Source of feeding
Frequency Percent Valid Percent Cumulative Percent Valid Veld 187 93.5 93.5 93.5
Pasture 5 2.5 2.5 96.0 Bought in feed 8 4.0 4.0 100.0 Total 200 100.0 100.0
Do you provide supplementation
Frequency Percent Valid Percent Cumulative Percent Valid Yes 165 82.5 82.5 82.5
No 35 17.5 17.5 100.0 Total 200 100.0 100.0
If yes when
Frequency Percent Valid Percent Cumulative Percent Valid Rainy season 1 0.5 0.5 0.5
Winter 111 55.5 55.5 56.0 Drought season 7 3.5 3.5 59.5 All year around 44 22.0 22.0 81.5 Other 37 18.5 18.5 100.0 Total 200 100.0 100.0
What is the body condition of beef cattle Frequency Percent Valid Percent Cumulative Percent Valid Poor 15 7.5 7.5 7.5
Good 175 87.5 87.5 95.0 Moderate 8 4.0 4.0 99.0 Excellent 2 1.0 1.0 100.0 Total 200 100.0 100.0
At what time do you sell
Frequency Percent Valid Percent Cumulative Percent Valid Rainy season 6 3.0 3.0 3.0
Winter 5 2.5 2.5 5.5 Dry season 8 4.0 4.0 9.5 All year around 22 11.0 11.0 20.5 Emergency 113 56.5 56.5 77.0 Other 46 23.0 23.0 100.0 Total 200 100.0 100.0

103
Where do you sell Frequency Percent Valid Percent Cumulative Percent Valid Auction 67 33.5 33.5 33.5
Abattoirs 5 2.5 2.5 36.0 Butcheries 3 1.5 1.5 37.5 Private sales 79 39.5 39.5 77.0 Emergency 46 23.0 23.0 100.0 Total 200 100.0 100.0
Mortality age of beef cattle
Frequency Percent Valid Percent Cumulative
Percent Valid At birth 33 16.5 16.5 16.5
At weaning 72 36.0 36.0 52.5 At breeding 40 20.0 20.0 72.5 At weaning and birth 4 2.0 2.0 74.5 At weaning and breeding 10 5.0 5.0 79.5 At birth and breeding 12 6.0 6.0 85.5 At birth, weaning and breeding 4 2.0 2.0 87.5
Other 25 12.5 12.5 100.0 Total 200 100.0 100.0
Causes of mortality
Frequency Percent Valid Percent Cumulative
Percent Valid Malnutrition 58 29.0 29.0 29.0
Predators and stillbirth 2 1.0 1.0 30.0 Other 23 11.5 11.5 41.5 Disease 84 42.0 42.0 83.5 Predators 1 0.5 0.5 84.0 Still birth 4 2.0 2.0 86.0 Snakes 2 1.0 1.0 87.0 Malnutrition and disease 20 10.0 10.0 97.0 Malnutrition and stillbirth 2 1.0 1.0 98.0 Disease and still birth 4 2.0 2.0 100.0 Total 200 100.0 100.0

104
Challenges in beef cattle production Frequency Percent Valid Percent Cumulative Percent Valid Disease 52 26.0 26.0 26.0
Breeding bulls 3 1.5 1.5 27.5 Veld fires 2 1.0 1.0 28.5 Low pricing 1 .5 0.5 29.0 Low production 4 2.0 2.0 31.0 Continuous breeding 1 .5 0.5 31.5 High mortality 2 1.0 1.0 32.5 Lack of knowledge 1 .5 0.5 33.0 Shortage of water 4 2.0 2.0 35.0 Markerting 2 1.0 1.0 36.0 Feeding 20 10.0 10.0 46.0 Other 7 3.5 3.5 49.5 Malnutrition 36 18.0 18.0 67.5 Theft 18 9.0 9.0 76.5 Grazing camps 22 11.0 11.0 87.5 Handling facilities 1 .5 0.5 88.0 Poor management 3 1.5 1.5 89.5 Ticks 2 1.0 1.0 90.5 Drought 19 9.5 9.5 100.0 Total 200 100.0 100.0
Possible solution to challenges
Frequency Percent Valid Percent Cumulative
Percent Valid Feeds for winter 58 29.0 29.0 29.0
Beef training 2 1.0 1.0 30.0 Feeding and vaccination programme 23 11.5 11.5 41.5
Fenced camps and feeding programme 2 1.0 1.0 42.5
Seasonal breeding 13 6.5 6.5 49.0 Fenced camps, feeding and vaccination programme
1 0.5 0.5 49.5
Bore hole or tanks 6 3.0 3.0 52.5 Fodder flow programme 4 2.0 2.0 54.5 Marketing 2 1.0 1.0 55.5 Other 8 4.0 4.0 59.5 Livestock theft policy 4 2.0 2.0 61.5

105
Vaccination programme 31 15.5 15.5 77.0 Handling facilities 1 0.5 0.5 77.5 Management programme 9 4.5 4.5 82.0 Donation of breeding bulls 10 5.0 5.0 87.0 Good quality beef cattle 1 0.5 0.5 87.5 Fenced grazing camps 24 12.0 12.0 99.5 Application of firebreaks 1 0.5 0.5 100.0 Total 200 100.0 100.0
Regression
Variables Entered/Removeda
Model Variables Entered Variables Removed Method
1 Source of feeding, No of cattle, Important income, Age of respondents, No of member, Age of mating on cows, What is the body condition, Hectare size, Experience on farming, Age of mortality, Calving % of the herd, Weaning percentage of the herd, Type of breeding systemb
. Enter
a. Dependent Variable: Amount b. All requested variables entered.

106
Model Summaryb
Model R R Square Adjusted R
Square Std. Error of the Estimate Durbin-Watson
1 0.808a 0.653 0.629 6117.298 2.261 a. Predictors: (Constant), Source of feeding, No of cattle, Important income, Age of respondents, No of member, Age of mating on cows, What is the body condition, Hectare size, Experience on farming, Age of mortality, Calving % of the herd, Weaning percentage of the herd, Type of breeding system b. Dependent Variable: Amount
ANOVAa Model Sum of Squares df Mean Square F Sig. 1 Regression 13099927885.250 13 1007686760.404 26.928 0.000b
Residual 6960368064.750 186 37421333.681 Total 20060295950.000 199
a. Dependent Variable: Amount

Coefficientsa
Model
Unstandardized Coefficients
Standardized Coefficients
t Sig.
Collinearity Statistics
B Std. Error Beta Toleranc
e VIF (Constant)
456.313 5462.149 0.084 0.934
Age of respondents -20.230 29.726 -0.031 -0.681 0.497 0.878 1.140 Important income 126.565 463.415 0.012 0.273 0.785 0.919 1.088 No of member 126.247 491.690 0.011 0.257 0.798 0.952 1.050 Experience on farming 553.762 383.884 0.067 1.443 0.151 0.852 1.174 Hectare size -493.500 836.730 -0.027 -0.590 0.556 0.891 1.122 No of cattle 472.828 28.008 0.757 16.882 0.000 0.929 1.077 Calving % of the herd 806.921 754.480 0.065 1.070 0.286 0.510 1.962 Weaning percentage of the herd 698.361 795.462 0.054 0.878 0.381 0.501 1.995
What is the body condition 48.412 1141.516 0.002 0.042 0.966 0.928 1.078
Age at mortality -542.606 209.112 -0.123 -2.595 0.010 0.835 1.198 Type of breeding system -4268.517 2382.770 -0.201 -1.791 0.075 0.148 6.770 Age of mating on cows 4441.675 2548.469 0.192 1.743 0.083 0.154 6.483 Source of feeding -539.922 743.730 -0.033 -0.726 0.469 0.929 1.076
a. Dependent variable: Amount