spice briefing election 2011 - scottish parliament€¦ · the scottish parliament and scottish...
TRANSCRIPT
The Scottish Parliament and Scottish Parliament Infor mation C entre l ogos .
SPICe Briefing
Election 2011
10 May 2011
11/29
Stephen Herbert, Ross Burnside, Murray Earle, Greig Liddell and Iain McIver
This paper provides an analysis of the 2011 Scottish Parliament election. In particular, it considers the Scottish Parliament electoral system, the election campaign, electoral behaviour, the impact of the result upon the political parties, and the new composition of the Parliament.
The briefing also contains perspectives on the election from a range of external commentators. The views expressed by these authors are their own and do not represent the views of SPICe or of the Scottish Parliament. The external commentators are:
Angus MacLeod, Scottish Political Editor, The Times
Charlie Jeffrey, Professor of Politics and Director of the Academy of Government at the University of Edinburgh
John Curtice, Professor of Politics, University of Strathclyde
Paul Cairney, Senior Lecturer in Politics, University of Aberdeen
Peter Lynch, Senior Lecturer in Politics, University of Stirling
The electoral data set out in this paper are provisional, based primarily upon the returns from Returning Officers, available at the time of publication. The authors wish to express their thanks to Professor David Denver, of Lancaster University, for permission to use his 2007 notional results data.
2
CONTENTS
THE ELECTION RESULT: SUMMARY ....................................................................................................................... 3
THE 2011 ELECTION CONTEXT ................................................................................................................................ 4
The implications of the 2011 election result for Scottish Governance ................................................................. 7
THE ELECTION CAMPAIGN ....................................................................................................................................... 9
THE MANIFESTOS .................................................................................................................................................. 9 CAMPAIGN ISSUES .............................................................................................................................................. 11
BBC poll ............................................................................................................................................................. 11 UK Budget and the Macro-economic environment ............................................................................................ 12 Budget Cuts and their implications .................................................................................................................... 12 Leadership ......................................................................................................................................................... 13 Strength of respective front-bench teams .......................................................................................................... 14 Justice and associated issues ........................................................................................................................... 14 University funding ............................................................................................................................................... 14 TV debates ......................................................................................................................................................... 14 Other issues ....................................................................................................................................................... 15 What the papers said ......................................................................................................................................... 15 The election campaign from a media perspective ............................................................................................. 16
VOTING INTENTIONS ............................................................................................................................................... 18
Opinion Polls ...................................................................................................................................................... 18
TURNOUT .................................................................................................................................................................. 22
Electoral behaviour ............................................................................................................................................ 26
STATE OF THE PARTIES ......................................................................................................................................... 29
The implications of the election result for the political parties............................................................................ 31
REGIONAL VOTE ...................................................................................................................................................... 35
THE IMPACT OF THE ELECTION RESULT ON THE FUTURE CONSTITUTIONAL DIRECTION OF
SCOTLAND AND THE UNITED KINGDOM ...................................................................................................... 37
MSPS WHO DID NOT STAND FOR RE-ELECTION ................................................................................................ 40
COMPOSITION OF THE PARLIAMENT ................................................................................................................... 40
MSPS WHO LOST THEIR SEAT AT THE 2011 ELECTION ................................................................................. 41 NEW MSPS ............................................................................................................................................................ 42 CLASS OF „99 ........................................................................................................................................................ 43
CANDIDATES ............................................................................................................................................................ 43
SOURCES .................................................................................................................................................................. 46
ANNEX ONE – REFERENCE MAPS ......................................................................................................................... 48
INDEX OF PARLIAMENTARY CONSTITUENCIES AND REGIONS ....................................................................... 51
3
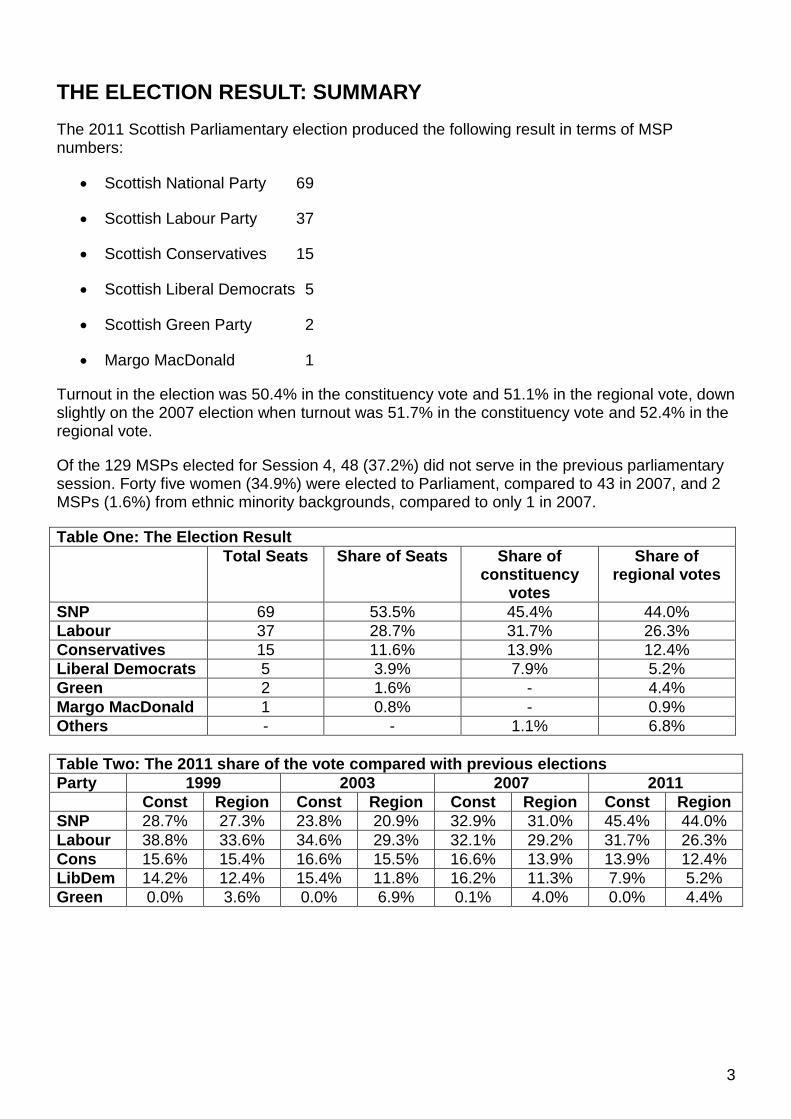
THE ELECTION RESULT: SUMMARY
The 2011 Scottish Parliamentary election produced the following result in terms of MSP numbers:
Scottish National Party 69
Scottish Labour Party 37
Scottish Conservatives 15
Scottish Liberal Democrats 5
Scottish Green Party 2
Margo MacDonald 1
Turnout in the election was 50.4% in the constituency vote and 51.1% in the regional vote, down slightly on the 2007 election when turnout was 51.7% in the constituency vote and 52.4% in the regional vote.
Of the 129 MSPs elected for Session 4, 48 (37.2%) did not serve in the previous parliamentary session. Forty five women (34.9%) were elected to Parliament, compared to 43 in 2007, and 2 MSPs (1.6%) from ethnic minority backgrounds, compared to only 1 in 2007.
Table One: The Election Result
Total Seats Share of Seats Share of constituency
votes
Share of regional votes
SNP 69 53.5% 45.4% 44.0%
Labour 37 28.7% 31.7% 26.3%
Conservatives 15 11.6% 13.9% 12.4%
Liberal Democrats 5 3.9% 7.9% 5.2%
Green 2 1.6% - 4.4%
Margo MacDonald 1 0.8% - 0.9%
Others - - 1.1% 6.8%
Table Two: The 2011 share of the vote compared with previous elections
Party 1999 2003 2007 2011
Const Region Const Region Const Region Const Region
SNP 28.7% 27.3% 23.8% 20.9% 32.9% 31.0% 45.4% 44.0%
Labour 38.8% 33.6% 34.6% 29.3% 32.1% 29.2% 31.7% 26.3%
Cons 15.6% 15.4% 16.6% 15.5% 16.6% 13.9% 13.9% 12.4%
LibDem 14.2% 12.4% 15.4% 11.8% 16.2% 11.3% 7.9% 5.2%
Green 0.0% 3.6% 0.0% 6.9% 0.1% 4.0% 0.0% 4.4%
4
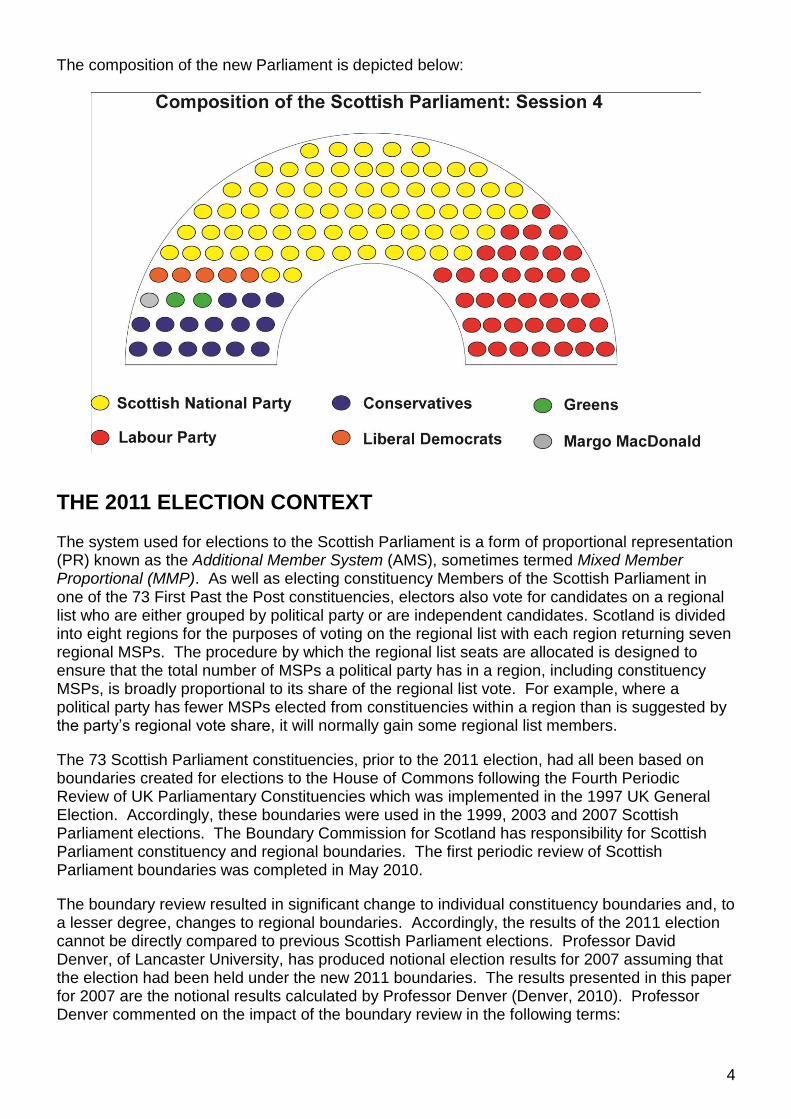
The composition of the new Parliament is depicted below:
THE 2011 ELECTION CONTEXT The system used for elections to the Scottish Parliament is a form of proportional representation (PR) known as the Additional Member System (AMS), sometimes termed Mixed Member Proportional (MMP). As well as electing constituency Members of the Scottish Parliament in one of the 73 First Past the Post constituencies, electors also vote for candidates on a regional list who are either grouped by political party or are independent candidates. Scotland is divided into eight regions for the purposes of voting on the regional list with each region returning seven regional MSPs. The procedure by which the regional list seats are allocated is designed to ensure that the total number of MSPs a political party has in a region, including constituency MSPs, is broadly proportional to its share of the regional list vote. For example, where a political party has fewer MSPs elected from constituencies within a region than is suggested by the party‟s regional vote share, it will normally gain some regional list members.
The 73 Scottish Parliament constituencies, prior to the 2011 election, had all been based on boundaries created for elections to the House of Commons following the Fourth Periodic Review of UK Parliamentary Constituencies which was implemented in the 1997 UK General Election. Accordingly, these boundaries were used in the 1999, 2003 and 2007 Scottish Parliament elections. The Boundary Commission for Scotland has responsibility for Scottish Parliament constituency and regional boundaries. The first periodic review of Scottish Parliament boundaries was completed in May 2010.
The boundary review resulted in significant change to individual constituency boundaries and, to a lesser degree, changes to regional boundaries. Accordingly, the results of the 2011 election cannot be directly compared to previous Scottish Parliament elections. Professor David Denver, of Lancaster University, has produced notional election results for 2007 assuming that the election had been held under the new 2011 boundaries. The results presented in this paper for 2007 are the notional results calculated by Professor Denver (Denver, 2010). Professor Denver commented on the impact of the boundary review in the following terms:
5
“The boundary review has instituted a considerable upheaval with 42 of the 73 constituencies being subject to at least a major change. Across Scotland, about one in every six electors (17%) is now in a different constituency as compared with the relevant „base‟ constituency in 2007” (p.3).
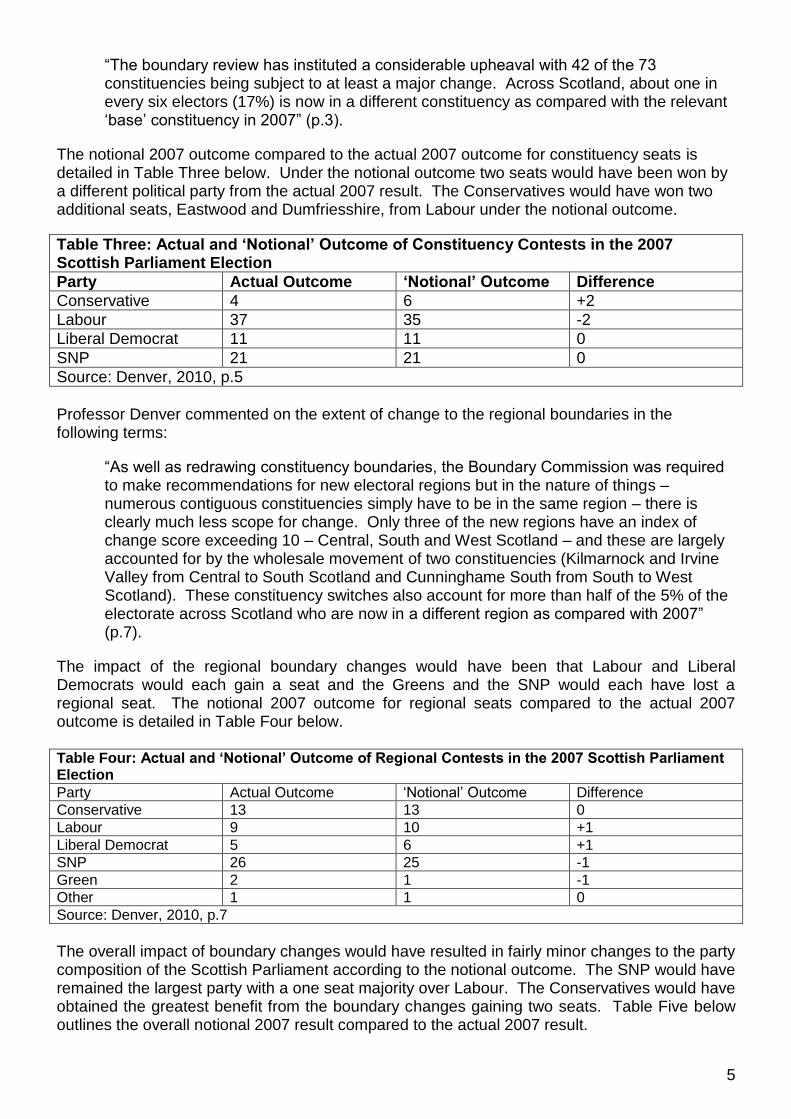
The notional 2007 outcome compared to the actual 2007 outcome for constituency seats is detailed in Table Three below. Under the notional outcome two seats would have been won by a different political party from the actual 2007 result. The Conservatives would have won two additional seats, Eastwood and Dumfriesshire, from Labour under the notional outcome.
Table Three: Actual and ‘Notional’ Outcome of Constituency Contests in the 2007 Scottish Parliament Election
Party Actual Outcome ‘Notional’ Outcome Difference
Conservative 4 6 +2
Labour 37 35 -2
Liberal Democrat 11 11 0
SNP 21 21 0
Source: Denver, 2010, p.5
Professor Denver commented on the extent of change to the regional boundaries in the following terms:
“As well as redrawing constituency boundaries, the Boundary Commission was required to make recommendations for new electoral regions but in the nature of things – numerous contiguous constituencies simply have to be in the same region – there is clearly much less scope for change. Only three of the new regions have an index of change score exceeding 10 – Central, South and West Scotland – and these are largely accounted for by the wholesale movement of two constituencies (Kilmarnock and Irvine Valley from Central to South Scotland and Cunninghame South from South to West Scotland). These constituency switches also account for more than half of the 5% of the electorate across Scotland who are now in a different region as compared with 2007” (p.7).
The impact of the regional boundary changes would have been that Labour and Liberal Democrats would each gain a seat and the Greens and the SNP would each have lost a regional seat. The notional 2007 outcome for regional seats compared to the actual 2007 outcome is detailed in Table Four below. Table Four: Actual and ‘Notional’ Outcome of Regional Contests in the 2007 Scottish Parliament Election
Party Actual Outcome „Notional‟ Outcome Difference
Conservative 13 13 0
Labour 9 10 +1
Liberal Democrat 5 6 +1
SNP 26 25 -1
Green 2 1 -1
Other 1 1 0
Source: Denver, 2010, p.7
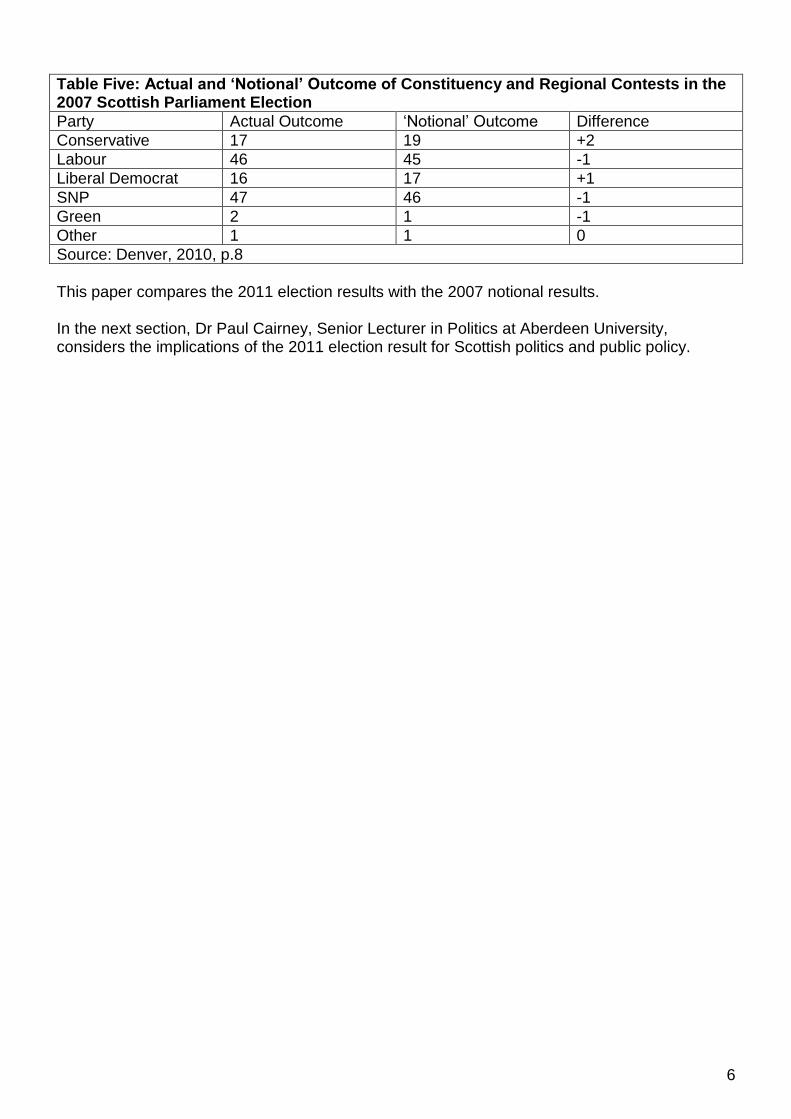
The overall impact of boundary changes would have resulted in fairly minor changes to the party composition of the Scottish Parliament according to the notional outcome. The SNP would have remained the largest party with a one seat majority over Labour. The Conservatives would have obtained the greatest benefit from the boundary changes gaining two seats. Table Five below outlines the overall notional 2007 result compared to the actual 2007 result.
6
Table Five: Actual and ‘Notional’ Outcome of Constituency and Regional Contests in the 2007 Scottish Parliament Election
Party Actual Outcome „Notional‟ Outcome Difference
Conservative 17 19 +2
Labour 46 45 -1
Liberal Democrat 16 17 +1
SNP 47 46 -1
Green 2 1 -1
Other 1 1 0
Source: Denver, 2010, p.8
This paper compares the 2011 election results with the 2007 notional results. In the next section, Dr Paul Cairney, Senior Lecturer in Politics at Aberdeen University, considers the implications of the 2011 election result for Scottish politics and public policy.
7
The implications of the 2011 election result for Scottish Governance
Paul Cairney
The Scottish Election of 2011 has to go down as the most exciting in the Scottish Parliament‟s short history (and probably for decades to come). The size of the SNP win was staggering for at least three reasons. First, it achieved a majority of seats (69, 53% of 129) under a system designed to make it unlikely that one party achieves a majority without a majority of the vote (it secured 45.4% of the constituency and 44% of the regional vote). Second, it was built on a reversal-of-fortunes, with the SNP now dominating the constituency vote at the expense of Labour when, in the past, it received most of its seats from the regional lists. Third, it won in key Labour strongholds such as Glasgow. But what are the wider or longer term consequences? Are they, or will they be, as dramatic?
Public Policy. The most immediate and significant effect is that there is now a clear mandate for SNP policies. The SNP will almost certainly introduce a bill to hold a referendum on independence and pursue policies for which it had insufficient parliamentary support in 2007 – including a minimum price on a unit of alcohol and a replacement for the council tax (it has already promised to maintain a freeze on council tax). However, there are three main qualifications to consider. First, its ability to pursue policy innovation is limited by the financial climate and many of its decisions will relate to which aims to prioritise or drop, rather than which new policies to fund. Second, the SNP Government has built a reputation for governing competence, which is often about the management of people and existing resources rather than constant innovation. Third, its plans for the delivery of policies is perhaps less certain. In particular, a key part of its governing strategy in 2007 was to devolve more responsibility to local government. While it agreed „single outcome agreements‟ with (and set some national priorities for) local authorities, the emphasis was on reducing „ring fenced‟ budgets and giving local authorities the space to make their own decisions. This caused a degree of tension at a national level, with many organisations (including the Scottish Parliament) often expressing frustration at their ability to be involved in policy at only one stage of the process, and the Scottish Government under a degree of pressure to deliver on its commitments. We may detect a partial shift back to national direction from 2011. For example, the high profile issue of class sizes will return, with the Scottish Government still only recommending a limit of 18 in P1-3 but now willing to set a legal maximum of 25. The MSPs. The proportion of new MSPs has risen to 37% (48) from 33% in 2007 and 20% in 2003. Despite some concerns about the departure of key Labour women, and a huge reduction in the parliamentary Labour party (traditionally the source of more than half of the Scottish Parliament‟s female members), the gender balance remains largely unaltered at 65% men and 35% women with 45 female MSPs elected to the fourth session of the Scottish Parliament. The Parliament is now not exclusively white (note that Bashir Ahmad served from 2007 until his death in 2009), with two new Scottish–Asian MSPs representing 1.6% of MSPs (black and ethnic minorities represent 2% of the Scottish population). Yet, more work is required to tell if the occupational background of MSPs has changed. Political parties in many countries have an increasing reputation for recruiting candidates from „politics facilitating‟ occupations (such as party, interest group and think tank workers) and the Scottish Parliament is no exception.
From Coalition to Minority to Majority Government. The first eight years of devolution showed us that the Scottish Parliament was not the powerful body that it was cracked up to be. The Scottish Executive coalition held a majority of MSPs in plenary and all committees, allowing it to introduce the vast majority of legislation and ensure control over its amendment during
8
parliamentary scrutiny. Four years of minority government showed that, while the Scottish Government had fewer Bills passed in four years (42, compared to 50 from 2003 and 53 from 1999) and required the support of other parties to pass annual budgets, the balance of power did not change dramatically. The Scottish Parliament‟s role is limited largely to departmental and legislative scrutiny. It does not have the resources to present an alternative legislative agenda. For example, committee bills are generally limited to parliamentary reform and standards. Members‟ bills either take a long time to produce (the fox hunting ban took two years) or relate to issues in which non-complex legislation can be used (in areas such as dog fouling and the ability of shops to open at Christmas). The committees‟ ability to undertake agenda-setting inquires is limited. The election of a majority party may further tip the balance of power to government, with a single party now able to command a majority in plenary and committees.
The Scottish Government and UK Government relationship. From 1999-2007 the Scottish-UK government relationship was low key; discussions were conducted informally and almost entirely through political parties, ministers and civil servants. Formal mechanisms for negotiation and dispute were used rarely and the Scottish Executive played a minimal role in EU policy making. These relationships did not change markedly following the election of the SNP in 2007 and the coalition government in the UK in 2010. Although there were more instances of high profile disagreements from 2007, there was a still tendency for this charged atmosphere to give way to a more humdrum, day-to-day relationship as different civil servants worked through the details. David Cameron also seemed determined to „govern Scots with respect‟ from 2010. This process may continue, because both governments recognise the value of a smooth working relationship, or it may not – partly because their relationship will form the backdrop to the agenda on independence from 2013. A UK Conservative government in office during a period of economic retrenchment probably provides the best chance for the SNP Government to demonstrate that it would be better making all of its own decisions, and it would be a surprise if it did not exploit that opportunity.
The Parties. Scottish Labour will elect a new leader in the Autumn, following a „root and branch‟ review initiated by Iain Gray before his departure. The Liberal Democrats will surely have to do more work to distance themselves from their UK counterparts (although it is already a federal party). The Conservatives may look back on their position in 2007 with a degree of nostalgia since they may return to the less influential role in the Scottish Parliament that they played from 1999-2007. From 2007-11 they often propped up the SNP, securing small policy concessions for support on key votes (most notably on the budget, but note that they voted in agreement with the SNP over 70% of the time). Now, Annabel Goldie, or rather her successor as Leader, may be reduced to „keeping an eye‟ on Alex Salmond rather than „having him by the short and curlies‟. Perhaps the immediate future of the SNP will become the most interesting. Minority government, combined with opposition party opposition to an independence referendum, may have produced a strong them-and-us mentality and the coherence of the SNP within both Government and Parliament was remarkable. However, if we remove both constraints (and add the notion that majorities sometimes produce divisions within parties) we may find that the party becomes more difficult to manage.
9
THE ELECTION CAMPAIGN
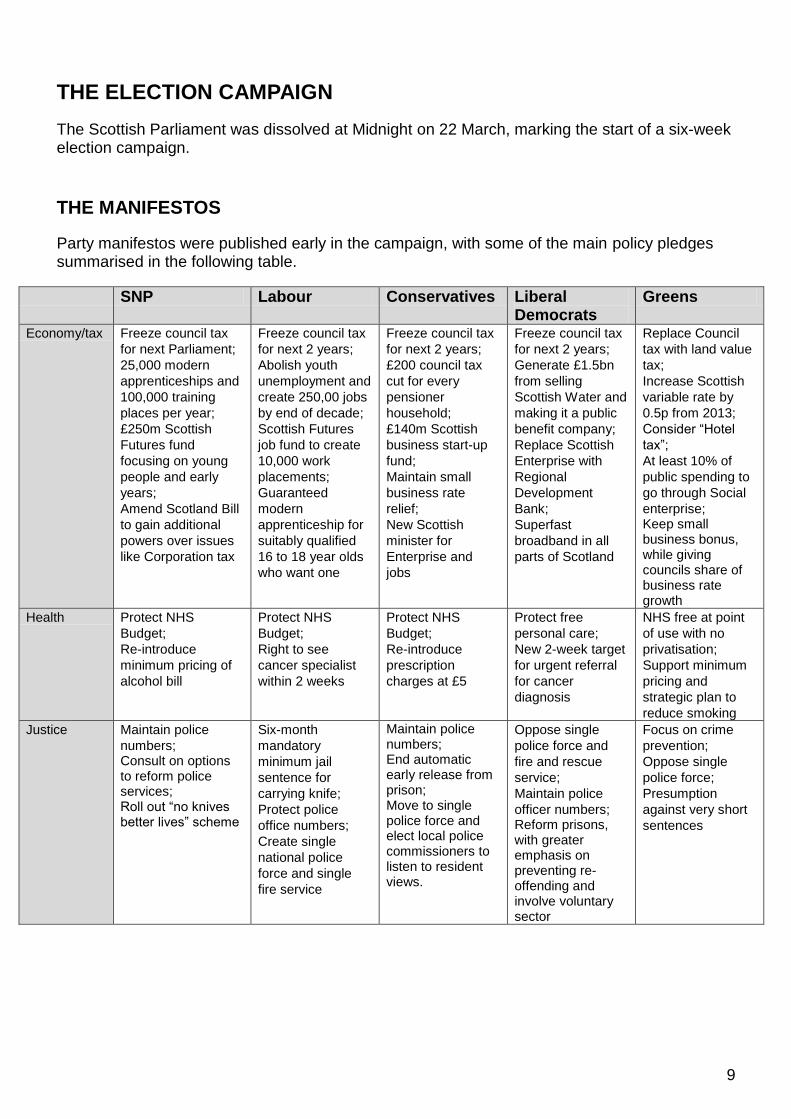
The Scottish Parliament was dissolved at Midnight on 22 March, marking the start of a six-week election campaign.
THE MANIFESTOS
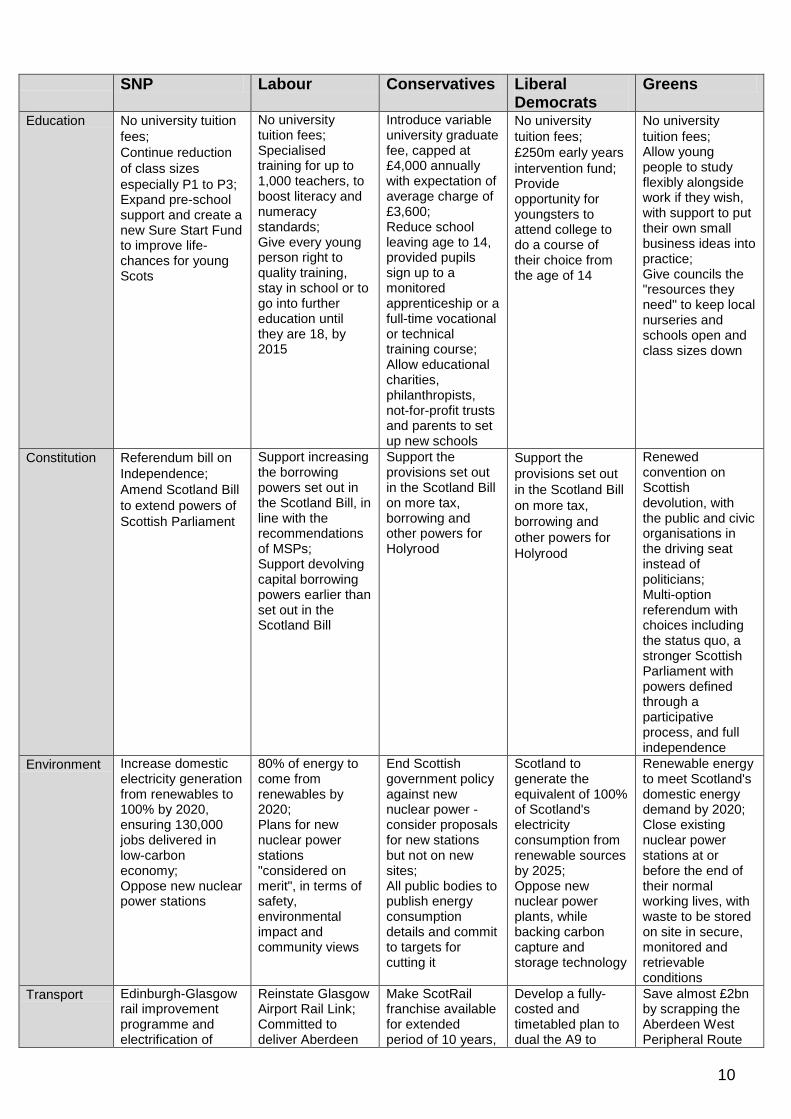
Party manifestos were published early in the campaign, with some of the main policy pledges summarised in the following table.
SNP Labour Conservatives Liberal Democrats
Greens
Economy/tax Freeze council tax
for next Parliament;
25,000 modern
apprenticeships and
100,000 training
places per year;
£250m Scottish
Futures fund
focusing on young
people and early
years;
Amend Scotland Bill
to gain additional
powers over issues
like Corporation tax
Freeze council tax
for next 2 years;
Abolish youth
unemployment and
create 250,00 jobs
by end of decade;
Scottish Futures
job fund to create
10,000 work
placements;
Guaranteed
modern
apprenticeship for
suitably qualified
16 to 18 year olds
who want one
Freeze council tax
for next 2 years;
£200 council tax
cut for every
pensioner
household;
£140m Scottish
business start-up
fund;
Maintain small
business rate
relief;
New Scottish
minister for
Enterprise and
jobs
Freeze council tax
for next 2 years;
Generate £1.5bn
from selling
Scottish Water and
making it a public
benefit company;
Replace Scottish
Enterprise with
Regional
Development
Bank;
Superfast
broadband in all
parts of Scotland
Replace Council
tax with land value
tax;
Increase Scottish
variable rate by
0.5p from 2013;
Consider “Hotel
tax”;
At least 10% of
public spending to
go through Social
enterprise; Keep small business bonus, while giving councils share of business rate growth
Health Protect NHS
Budget;
Re-introduce
minimum pricing of
alcohol bill
Protect NHS
Budget;
Right to see
cancer specialist
within 2 weeks
Protect NHS
Budget;
Re-introduce
prescription
charges at £5
Protect free
personal care;
New 2-week target
for urgent referral
for cancer
diagnosis
NHS free at point
of use with no
privatisation;
Support minimum
pricing and
strategic plan to
reduce smoking
Justice Maintain police
numbers; Consult on options to reform police services; Roll out “no knives better lives” scheme
Six-month
mandatory
minimum jail
sentence for
carrying knife;
Protect police
office numbers;
Create single
national police
force and single
fire service
Maintain police numbers; End automatic early release from prison; Move to single police force and elect local police commissioners to listen to resident views.
Oppose single
police force and
fire and rescue
service;
Maintain police
officer numbers; Reform prisons, with greater emphasis on preventing re-offending and involve voluntary sector
Focus on crime
prevention;
Oppose single
police force;
Presumption
against very short
sentences
10
SNP Labour Conservatives Liberal
Democrats Greens
Education No university tuition
fees;
Continue reduction
of class sizes
especially P1 to P3; Expand pre-school support and create a new Sure Start Fund to improve life-chances for young Scots
No university tuition fees; Specialised training for up to 1,000 teachers, to boost literacy and numeracy standards; Give every young person right to quality training, stay in school or to go into further education until they are 18, by 2015
Introduce variable university graduate fee, capped at £4,000 annually with expectation of average charge of £3,600; Reduce school leaving age to 14, provided pupils sign up to a monitored apprenticeship or a full-time vocational or technical training course; Allow educational charities, philanthropists, not-for-profit trusts and parents to set up new schools
No university
tuition fees;
£250m early years
intervention fund; Provide opportunity for youngsters to attend college to do a course of their choice from the age of 14
No university
tuition fees; Allow young people to study flexibly alongside work if they wish, with support to put their own small business ideas into practice; Give councils the "resources they need" to keep local nurseries and schools open and class sizes down
Constitution Referendum bill on
Independence;
Amend Scotland Bill
to extend powers of
Scottish Parliament
Support increasing the borrowing powers set out in the Scotland Bill, in line with the recommendations of MSPs; Support devolving capital borrowing powers earlier than set out in the Scotland Bill
Support the provisions set out in the Scotland Bill on more tax, borrowing and other powers for Holyrood
Support the
provisions set out
in the Scotland Bill
on more tax,
borrowing and
other powers for
Holyrood
Renewed convention on Scottish devolution, with the public and civic organisations in the driving seat instead of politicians; Multi-option referendum with choices including the status quo, a stronger Scottish Parliament with powers defined through a participative process, and full independence
Environment Increase domestic electricity generation from renewables to 100% by 2020, ensuring 130,000 jobs delivered in low-carbon economy; Oppose new nuclear power stations
80% of energy to come from renewables by 2020; Plans for new nuclear power stations "considered on merit", in terms of safety, environmental impact and community views
End Scottish government policy against new nuclear power - consider proposals for new stations but not on new sites; All public bodies to publish energy consumption details and commit to targets for cutting it
Scotland to generate the equivalent of 100% of Scotland's electricity consumption from renewable sources by 2025; Oppose new nuclear power plants, while backing carbon capture and storage technology
Renewable energy to meet Scotland's domestic energy demand by 2020; Close existing nuclear power stations at or before the end of their normal working lives, with waste to be stored on site in secure, monitored and retrievable conditions
Transport Edinburgh-Glasgow rail improvement programme and electrification of
Reinstate Glasgow Airport Rail Link; Committed to deliver Aberdeen
Make ScotRail franchise available for extended period of 10 years,
Develop a fully-costed and timetabled plan to dual the A9 to
Save almost £2bn by scrapping the Aberdeen West Peripheral Route
11
"much" of the central Scotland rail network; Take forward projects including Borders Railway and M8 Baillieston to Newhouse, M74 Raith Junction and M8, M73 and M74 network improvements
bypass, M8 Baillieston to Newhouse upgrade, and M74 Raith interchange
from next renewal, in return for savings, improved investment in rolling stock or better services; Abolish regional transport partnerships, with the exception of Strathclyde Partnership for Transport
Inverness; Fairer fares charter for rail passengers
and new Forth road bridge, while repairing the existing one; £75m-a-year to cut fares
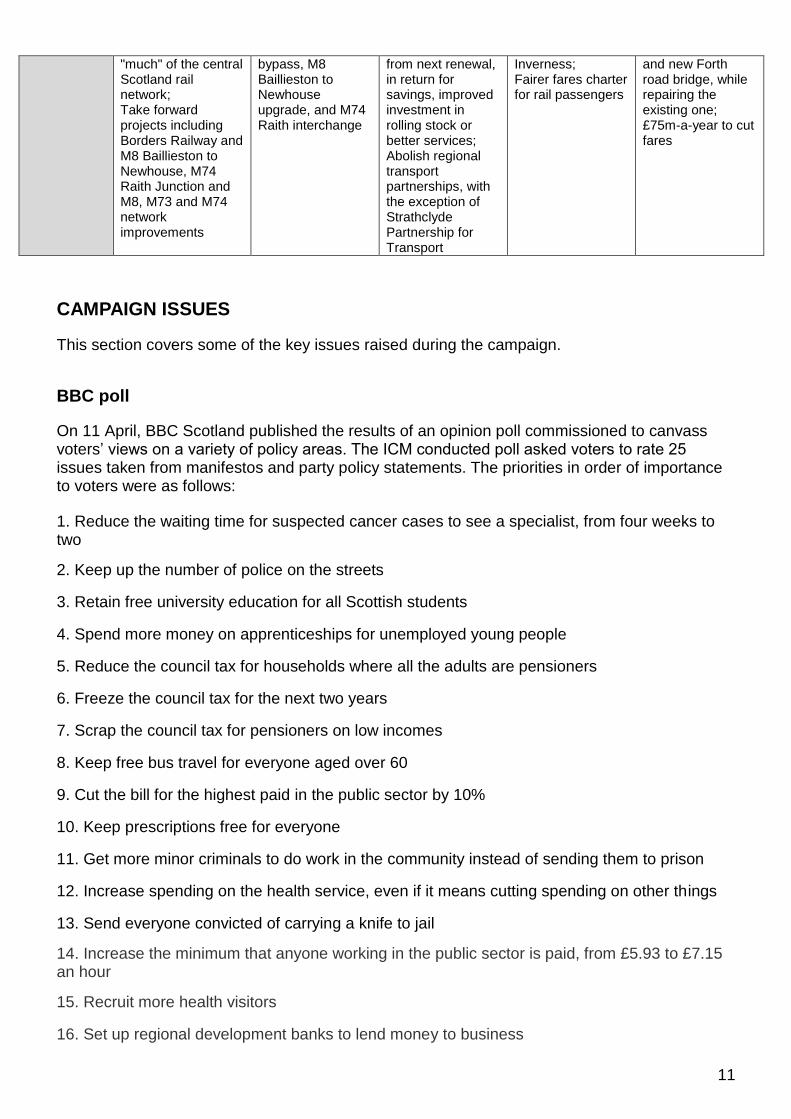
CAMPAIGN ISSUES
This section covers some of the key issues raised during the campaign.
BBC poll
On 11 April, BBC Scotland published the results of an opinion poll commissioned to canvass voters‟ views on a variety of policy areas. The ICM conducted poll asked voters to rate 25 issues taken from manifestos and party policy statements. The priorities in order of importance to voters were as follows:
1. Reduce the waiting time for suspected cancer cases to see a specialist, from four weeks to two
2. Keep up the number of police on the streets
3. Retain free university education for all Scottish students
4. Spend more money on apprenticeships for unemployed young people
5. Reduce the council tax for households where all the adults are pensioners
6. Freeze the council tax for the next two years
7. Scrap the council tax for pensioners on low incomes
8. Keep free bus travel for everyone aged over 60
9. Cut the bill for the highest paid in the public sector by 10%
10. Keep prescriptions free for everyone
11. Get more minor criminals to do work in the community instead of sending them to prison
12. Increase spending on the health service, even if it means cutting spending on other things
13. Send everyone convicted of carrying a knife to jail
14. Increase the minimum that anyone working in the public sector is paid, from £5.93 to £7.15 an hour
15. Recruit more health visitors
16. Set up regional development banks to lend money to business
12
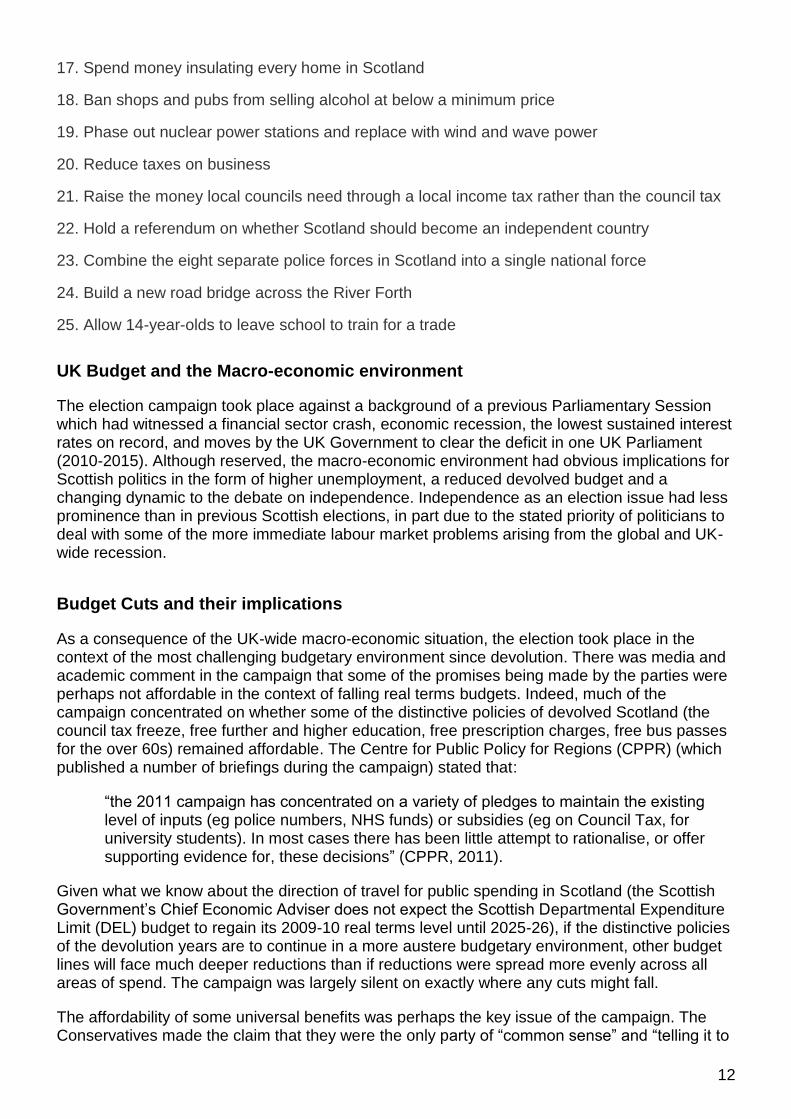
17. Spend money insulating every home in Scotland
18. Ban shops and pubs from selling alcohol at below a minimum price
19. Phase out nuclear power stations and replace with wind and wave power
20. Reduce taxes on business
21. Raise the money local councils need through a local income tax rather than the council tax
22. Hold a referendum on whether Scotland should become an independent country
23. Combine the eight separate police forces in Scotland into a single national force
24. Build a new road bridge across the River Forth
25. Allow 14-year-olds to leave school to train for a trade
UK Budget and the Macro-economic environment
The election campaign took place against a background of a previous Parliamentary Session which had witnessed a financial sector crash, economic recession, the lowest sustained interest rates on record, and moves by the UK Government to clear the deficit in one UK Parliament (2010-2015). Although reserved, the macro-economic environment had obvious implications for Scottish politics in the form of higher unemployment, a reduced devolved budget and a changing dynamic to the debate on independence. Independence as an election issue had less prominence than in previous Scottish elections, in part due to the stated priority of politicians to deal with some of the more immediate labour market problems arising from the global and UK-wide recession.
Budget Cuts and their implications
As a consequence of the UK-wide macro-economic situation, the election took place in the context of the most challenging budgetary environment since devolution. There was media and academic comment in the campaign that some of the promises being made by the parties were perhaps not affordable in the context of falling real terms budgets. Indeed, much of the campaign concentrated on whether some of the distinctive policies of devolved Scotland (the council tax freeze, free further and higher education, free prescription charges, free bus passes for the over 60s) remained affordable. The Centre for Public Policy for Regions (CPPR) (which published a number of briefings during the campaign) stated that:
“the 2011 campaign has concentrated on a variety of pledges to maintain the existing level of inputs (eg police numbers, NHS funds) or subsidies (eg on Council Tax, for university students). In most cases there has been little attempt to rationalise, or offer supporting evidence for, these decisions” (CPPR, 2011).
Given what we know about the direction of travel for public spending in Scotland (the Scottish Government‟s Chief Economic Adviser does not expect the Scottish Departmental Expenditure Limit (DEL) budget to regain its 2009-10 real terms level until 2025-26), if the distinctive policies of the devolution years are to continue in a more austere budgetary environment, other budget lines will face much deeper reductions than if reductions were spread more evenly across all areas of spend. The campaign was largely silent on exactly where any cuts might fall.
The affordability of some universal benefits was perhaps the key issue of the campaign. The Conservatives made the claim that they were the only party of “common sense” and “telling it to
13
the people straight” and that there would have to be savings made by charging for higher and further education (something rejected by the other parties) and changing the eligibility criteria for the over 60s‟ free bus pass. However, the Conservatives were criticised for being able to find £140m to provide a £200 cut in Council tax for all pensioner households (regardless of income). All the main parties signed up to a Council tax freeze for at least two years (Labour, Liberal Democrats, Conservatives) or five years (SNP). This was criticised by some on affordability and equity grounds (CPPR), as well as not being deliverable by central Government alone (COSLA claimed that any deal on Council tax would have to be negotiated with them).
Overall, the campaign dwelt little on what pain may lie in store given the real terms reductions coming into force from 2011 on. The CPPR talked of the tendency amongst politicians to “wish away” budgetary difficulties or outsource them to unelected bodies like the Christie Commission or the Independent Budget Review. The CPPR reported that the election signalled a diminishing role for voters and that “serious questions have to be asked of all the four main parties as to whether what they have outlined in their manifestos is sufficient to meet the challenges facing them in terms of real terms cuts to their budgets over the next four years.”
Leadership
Another issue that arose in the campaign related to the popularity of the various party leaders, with a number of polls specifically on the matter. This had the effect of moving the campaign away from discussion of policy towards the issue of leadership. Polls found that Alex Salmond was the most popular candidate for First Minister, which resulted in the SNP conducting what some described as a more presidential campaign. Alex Salmond was at the forefront of the SNP campaign literature and broadcasts, and they also used “Scottish National Party (SNP) Alex Salmond for First Minister” on the second ballot paper. Given the similarities between the parties on several issues (unanimity amongst the big four parties on freezing council tax; Labour, SNP and Liberal Democrat support for free further and higher education), the focus on personalities over policy was perhaps inevitable. Indeed, the Scotsman endorsement of the SNP for a second term (newspaper endorsements are covered below) was more of an endorsement of Salmond for First Minister than it was support for the SNP:
“So, the SNP‟s record is mixed. It failed on some big-ticket items but delivered in other areas. What has been more important, however, has been the style of government, and particularly of Mr Salmond as First Minister. He has dominated his party for many years – his party‟s fortunes in the years he stepped back from leadership are in stark contrast to its success today – and he came to dominate the machinery of government in a way that some believe is overbearing, even bullying. But dominate it he did. He grew in government from the astute street fighter of opposition to become the most popular First Minister since Donald Dewar, a fact our Scotsman/YouGov polls confirm. Like him or loathe him, Mr Salmond is, as we have said in these columns before, the only Big Beast of Holyrood politics…….
In contrast to the statesman-like presence of Mr Salmond, Labour's Iain Gray, though clearly a sincere and decent man, often looked ill at ease as a front-line politician. His retreat to a sandwich shop when pursued by an anti-cuts activist seemed to symbolise his party's campaign. Instead of being bold on telling voters of the hard choices ahead, Labour tried to hide. For reasons of political timidity, for their failure to spell out any compelling vision for Scotland and for Mr Gray's lack of leadership, we cannot support Labour at this election” (Scotsman, 4 May 2011).
14
Strength of respective front-bench teams
Despite his personal popularity, Alex Salmond was keen to state during the campaign that he was not a “one man band”, and emphasised what he considered was a record of achievement by his Government team. By mirroring SNP policies such as the Council tax freeze and Further and Higher Education and not creating distinctive policy divides, some commentators (Iain MacWhirter in the Herald, Lorraine Davidson on Newsnight Scotland) argued that Labour played into SNP hands by removing policy dividing lines and making the contest about which leader or front-bench would make the more competent government.
Justice and associated issues
A number of justice related issues played a big role in the election campaign. Tackling knife-crime via mandatory jail sentences for carrying a knife was a key component of the Labour campaign. Labour claimed that the cost of knife crime in Scotland was £500m per annum, a figure their Justice spokesman, Richard Baker, was challenged on during an edition of Newsnight Scotland. The Liberal Democrats were unique amongst the main parties in opposing the creation of a single police force (or a reduced number of police forces) in Scotland (the Green Party also opposed the creation of a single police force). Police numbers were also a prominent issue during the campaign with the Conservatives emphasising that the 1,000 extra police officers delivered in the last Parliament was due to Conservative MSP votes.
Related to the criminal justice debate is the issue of Scotland‟s relationship with alcohol which was also a factor in the campaign and was raised during the final TV debate on 3 May. The SNP manifesto committed them to the reintroduction of minimum pricing for alcohol legislation in the next Parliament.
University funding
The funding of higher and further education was highlighted during the campaign as a potentially prominent budgetary issue in the next Parliament as Scottish institutions attempt to keep up in financial terms with institutions south of the border which are able to charge up to £9,000 per annum in fees. The SNP, Labour and Liberal Democrat manifestos all committed to retaining free further and higher education and claimed that the funding gap with England (which the previous Government put at £93m) can be filled by public spending. Universities Scotland, however, put the funding gap figure at over £200m annually.
TV debates
There were three TV leaders debates (two on STV with Bernard Ponsonby and one on BBC Scotland with Glen Campbell). Not surprisingly, given that many of the issues raised had been well-rehearsed during the campaign, there was a general consensus that no leader was able to land any „knock-out punches‟. In addition, Gordon Brewer interviewed the Party leaders on Newsnight Scotland, and BBC Scotland also aired an „economy debate‟ where the respective party Finance spokespeople were joined by Budget Adviser to the Session Three Finance Committee, Professor David Bell, and Crawford Beveridge, Chair of the Independent Budget Review Committee.
15
Other issues
Some issues that perhaps might have featured in the campaign, did not really develop in importance. For instance, the release of Al Megrahi was the most high profile moment of the previous Parliament, but aside from a question in the first TV debate, did not particularly feature. The international intervention in Libya which commenced at the start of the campaign did not enter into the campaign in any way (unlike Kosovo in 1999 and Iraq in 2003).
The media coverage of Iain Gray‟s Glasgow Central Station incident with a cuts protester was significant and is mentioned in the contribution by Angus McLeod.
Alex Salmond‟s appearance on Question Time gave him a high profile opportunity to differentiate the Scottish and English health service and angered the other Scottish parties who felt that he was given an unfair advantage during the campaign.
Overall there was a general feeling that the election campaign never really got going. Lorraine Davidson on Newsnight Scotland on the eve of polling day described the election as having been “absolutely dire” and pointed to the significance of the Iain Gray “Subway” incident as highlighting just “how small and how petty and how pathetic the whole campaign has been”. Panelists on Newsnight Scotland (4 May 2011) agreed that the electorate (described as “the most sophisticated in the world”) had been let down by politicians, who in a mirror image of the 2010 UK election were not really presenting a true picture of the difficult decisions that lay ahead.
What the papers said
The extent to which newspapers influence election results in Scotland is doubtful. For example, in the last Scottish election in 2007 the SNP become the largest party despite not having the explicit endorsement of any major newspaper during the campaign (although at the end of the 2007 campaign, several editorials came out in favour of an SNP led coalition). In the 2011 election, however, the SNP was backed by the Sun, the News of the World, the Scotsman, the Scotland on Sunday, the Sunday Herald and the Scottish Sunday Express.
This highest profile newspaper intervention during the campaign came from the Sun which, in a reversal of its position in 2007, endorsed the SNP on 19 April. Scotland‟s other main tabloid paper, the Daily Record, continued its strong support of Labour.
Angus MacLeod, Scottish political editor of the Times, discusses the election campaign from a media perspective in the section below.
16
The election campaign from a media perspective
Angus Macleod, Scottish Political Editor, The Times
The first problem the Scottish media had to address in the Holyrood election campaign was its sheer length. Keeping the attention of viewers and readers for three or four weeks is difficult enough, but asking them to remain interested for 42 days was a Herculean task.
How did we adapt? Starting with newspapers, the answer has to be not all that well. Too many papers fell back on the tried and trusted election coverage formulae of endless constituency profiles, interviews with the party leaders and opinion polls (some, it has to be said, far more accurate than others). Few papers innovated and tried different ways of covering the contest.
In The Times, for example, we had a weekly campaign diary written by a candidate and concentrating on the very personal experience of being on the campaign trail - both humorous and not-so-humourous. It was an attempt to get under the skin of the election and make it more accessible to readers who are interested in politics but not obsessed by it. Other papers did a daily diary of the bizarre and strange things that can happen to politicians at election time. Too many papers, however, fell into the trap of thinking that readers would read about the election out of a sense of democratic duty. That doesn‟t happen anymore.
The papers were, I feel, dutiful in their coverage rather than inspired. Perhaps the biggest talking point thrown up by newspapers‟ coverage was the decision of The Sun to back the SNP and Alex Salmond. It was a case of a paper actually being the story. Indeed, one big feature of the papers‟ coverage this time is that they were all much more positive about the Nationalists and much more critical of Labour than in previous Scottish elections. That may have a lot to do with the perception that the SNP is not simply seen as an independence party these days but as a realistic devolved alternative to Labour.
It was noticeable in last year‟s general election coverage that the broadcasters, at UK level, were pushing at the boundaries of the rules on how elections were covered. They dared to pass judgement on individual events (Gordon Brown‟s „confrontation‟ with Labour supporter Gillian Duffy in Rochdale) and how they might affect the outcome. There was also more broadcast judgements on how the campaign was developing - which party was up, which party was down.
But the broadcasters in Scotland seemed much more strait-laced and reticent in this election. There were one or two honourable exceptions but there seemed to be a reluctance to accept that it is possible to give listeners and viewers some idea of where things stand without breaking the rules on neutrality. Unlike the general election last year, the televised leaders‟ debates in Scotland could not be said to have been even temporary game-changers. Indeed, there was hardly a story out of any of the three, other than the usual individual claims about who won and who lost.
That said, there was one game-changing moment and it came early in the campaign, courtesy of Iain Gray‟s poorly-handled „Subway‟ sandwich shop retreat from public spending cuts protesters. The media coverage of this, both broadcast and print, was appalling for Mr Gray and his party. There is no doubt in my mind that many uncommitted voters made their minds up about his potential as a First Minister, or lack of it, on the basis of how that incident was covered on their screens and in the papers.
I have heard so much in recent years about the next election, UK or Scottish being a ‟Twitter‟ election or a „Facebook‟ election but I am still waiting for it to happen. Yes, social media are
17
becoming more and more important for the parties and some, not all, are becoming more and more adept at using the various platforms available to push core messages and reach more and more voters. But I remain sceptical that party supporters tweeting and retweeting or posting on Facebook actually change minds. But there can be no doubt that while it might not have happened this time to any great extent, these are undoubtedly new dimensions to campaigning which will over time become more and more important in affecting voter sentiment about a party or an individual politician.
18
VOTING INTENTIONS
Opinion Polls
Two months before the election, polls came out in Labour‟s favour. On 7 March the Sunday Herald published the findings of the TNS-BMRB poll that suggested Labour could achieve a working majority in coalition with the Greens. Despite falls in Labour‟s popularity, the beneficiaries were the Conservatives and the Liberal Democrats and not the Scottish National Party. On 15 March the Press Association announced that Labour was ahead in the race to power following a poll commissioned by the Scottish Mail on Sunday. If translated into seats, that would have given Labour 63 seats and the SNP 47. That poll also showed the Liberal Democrats suffering large losses, decreasing their seats from 16 to five, while the Conservatives would lose 5 seats, leaving the party with 12.
A fortnight later, on 30 March, the Scotsman published the findings of a poll the newspaper had commissioned, which indicated that the Greens had pushed the Liberal Democrats into fifth place, although the newspaper argued that, “The anger over the role Nick Clegg's party has played in supporting Tory cuts has led to a Scottish slump that would see the Lib Dems fall from having 16 MSPs in the Scottish parliament to just five” and also that, “the battle for power now stands on a knife edge.” The balance began to tip after that.
On 4 April the Herald said that, “the SNP is leading Labour for the first time in the election campaign, according to the latest poll.” Although the two parties polled equally on the constituency vote, on the regional vote the SNP led Labour by 37% to 32%, although that sort of lead would still have seen either a coalition or a minority government in Scotland. Significantly, however, the survey also:
“ … tested voters‟ recognition of the main party leaders. Some 85% of those asked could name Alex Salmond when shown his photograph, 39% the Scottish Tory leader Annabel Goldie, 27% the Labour leader Iain Gray and 19% the LibDem leader Tavish Scott.”
Opinions swung back in Labour‟s favour following the results of a ScotlandVotes.com opinion poll published in the Herald (p.6) and the Daily Express (p.2) on 14 April. The Herald argued that, “Labour leader Iain Gray is on course to be First Minister after next month‟s election with the SNP trailing by six seats although they are continuing to close the gap.” And yet, both Labour and the SNP claimed the analysis showed voters were swinging behind them. On the basis of that poll, Labour stood to win 57 seats (+11), the SNP 51 (+4), the Conservatives 13 (-4) and the Liberal Democrats 11 (-5), whereas the Greens would retain their 2 seats, and Margo MacDonald would retain her seat too.
By 17 April the Scottish National Party had moved ahead in the polls, according to a YouGov poll commissioned by Scotland on Sunday which showed the SNP winning a 6 seat lead over Labour if the results were replicated in the 5 May Election. Yet such a result would allow the SNP to form only a minority government again, unless a coalition deal could be done. Again, this poll also considered voters‟ choice of First Minister, and found that 57% of respondents would choose Alex Salmond over Iain Gray for First Minister. The paper reported that, “According to an analysis by John Curtice, professor of politics at Strathclyde University, the poll would give the SNP 55 seats, Labour 49, the Conservatives 14, the LibDems 6 and the Greens 5.” This analysis indicated the Liberal Democrats losing more ground than the Conservatives, and the Greens more than doubling their current number of seats.
19
Less than a week later, on 21 April, an Ipsos-MORI survey, commissioned by the Times, indicated an increased SNP lead over Labour. The poll showed the SNP with an 11 point lead over Labour in the constituency vote and a 10 point lead in the list vote, which would give the SNP 20 more seats than Labour. This would, as the Herald noted in commenting on the poll, “put the SNP within reach of a Holyrood majority.”
The gap between the two main parties was shown to have widened in a poll-of-polls published on 28 April in the Scotsman (p.11) and Herald (p1) which would give the SNP 60 seats and could see Iain Gray lose his constituency. The Scotsman article said,
“Translated into seats, Webber Shandwick predicts 60 for the SNP, an increase of 13 from 2007. Labour would drop three seats to 43, the Tories would be reduced to 12 and Lib Dem seats would be halved to eight. The Scottish Green Party would win an extra three seats, taking its tally to five, and Independent candidate Margo MacDonald would return to parliament.
“For Labour and the SNP, the results show a reversal of fortunes in a month. Weber Shandwick predicted Labour would win 60 seats and the SNP 45 in a poll of polls on 22 March” (Scotsman, 28 April 2011).
A few days later, on 1 May, Labour had recovered some ground from the Scottish National Party, according to a YouGov opinion poll commissioned by Scotland on Sunday (published 2 May, p.1). The poll would give the SNP 55 seats and Labour 48, which Professor John Curtice, writing in the same newspaper, called “crumbs of comfort for Labour.”
By polling day, the Scottish Sun (5 May) saw the election as a „one horse race‟, and reported that the bookmaker Paddy Power had already paid out on the SNP winning the election. Results of polls that were published on 5 May showed newspapers split in their interpretation of the polls. According to the Scotsman, “it will be very surprising if Alex Salmond does not win” while the Herald (p.1) concentrated on Labour‟s claim that “two million undecided voters hold the key to today‟s Holyrood election.” The paper also noted:
“The analysis on the ScotlandVotes.com election predictor showed 59 seats for the SNP, 12 more than in the last parliament. It puts Labour on 42, the Conservatives 12, Greens eight and Liberal Democrats down to just seven seats. Margo MacDonald would also return” (The Herald, 5 May 2011).
The Daily Record, on the other hand (p.4) argued that the result of the YouGov poll showed:
“The fight for Scotland's future is balanced on a knife edge with the final poll of the campaign showing Labour breathing down the SNP's neck. “A YouGov poll published just hours before the ballot opened in the Holyrood election showed Scottish Labour rapidly gaining ground on the SNP” (Daily Record, 5 May 2011).
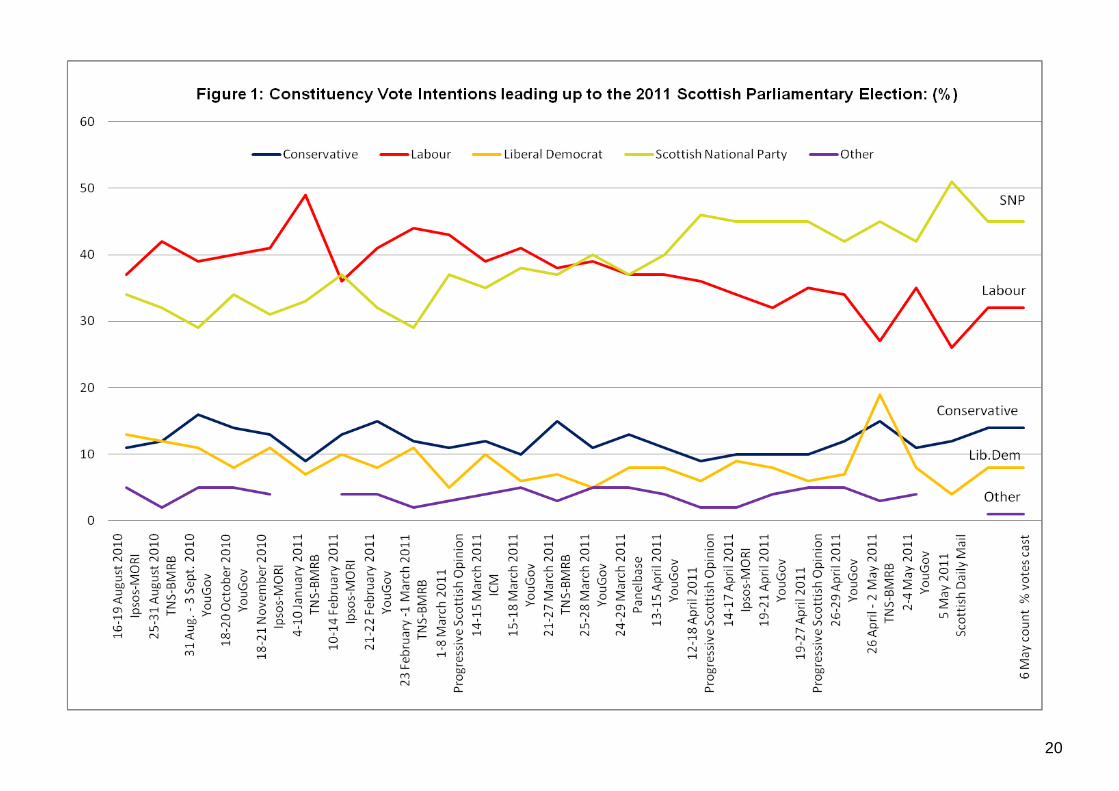
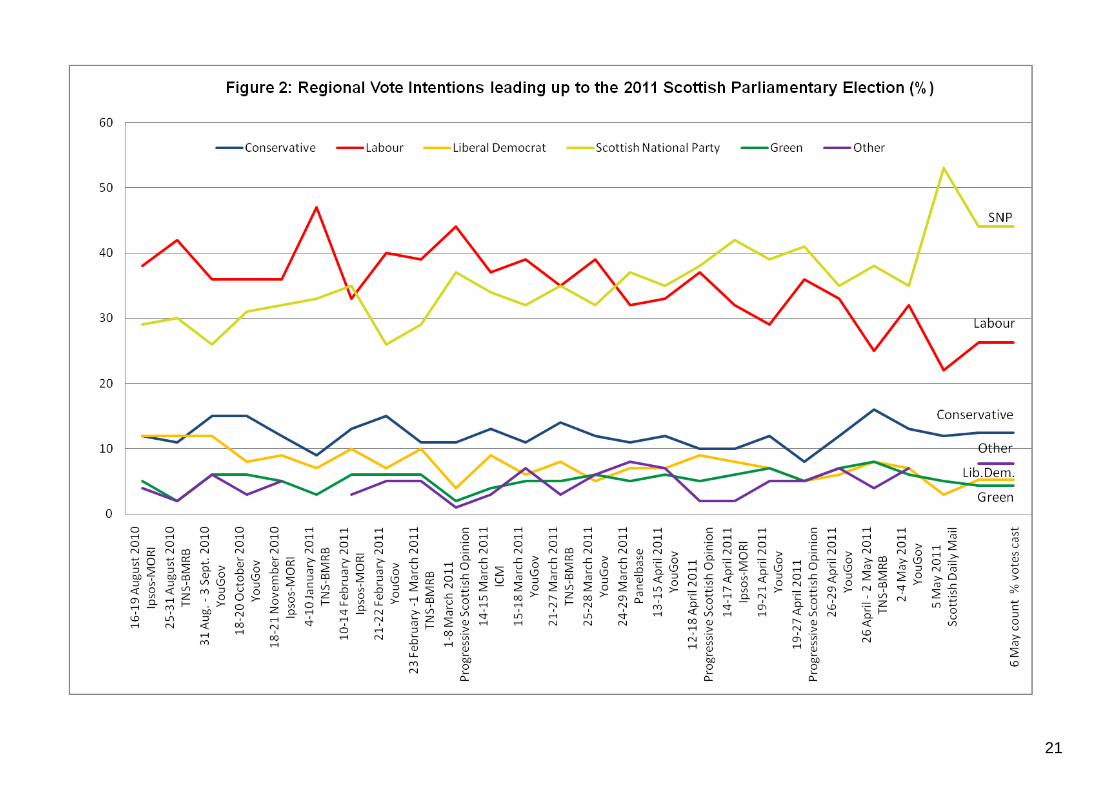
The graphs below, map the opinion polls showing firstly, constituency vote intentions and secondly, regional vote intentions leading up to the 2011 election.
The graphs show that the opinion polls fluctuated considerably over the course of the election campaign with broadly an initial lead for Labour gradually being replaced by an SNP lead. However, no poll foresaw the scale of the SNP‟s electoral performance in terms of number of the seats won in the Scottish Parliament.
20
21
22
TURNOUT
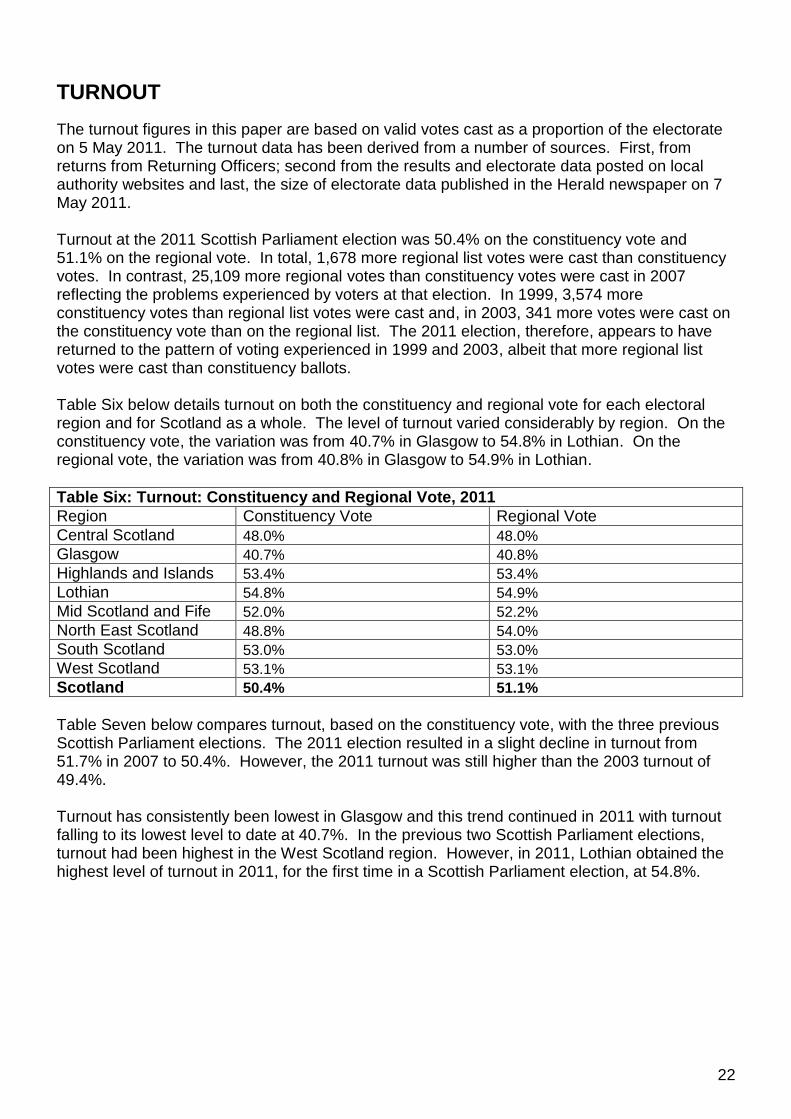
The turnout figures in this paper are based on valid votes cast as a proportion of the electorate on 5 May 2011. The turnout data has been derived from a number of sources. First, from returns from Returning Officers; second from the results and electorate data posted on local authority websites and last, the size of electorate data published in the Herald newspaper on 7 May 2011. Turnout at the 2011 Scottish Parliament election was 50.4% on the constituency vote and 51.1% on the regional vote. In total, 1,678 more regional list votes were cast than constituency votes. In contrast, 25,109 more regional votes than constituency votes were cast in 2007 reflecting the problems experienced by voters at that election. In 1999, 3,574 more constituency votes than regional list votes were cast and, in 2003, 341 more votes were cast on the constituency vote than on the regional list. The 2011 election, therefore, appears to have returned to the pattern of voting experienced in 1999 and 2003, albeit that more regional list votes were cast than constituency ballots. Table Six below details turnout on both the constituency and regional vote for each electoral region and for Scotland as a whole. The level of turnout varied considerably by region. On the constituency vote, the variation was from 40.7% in Glasgow to 54.8% in Lothian. On the regional vote, the variation was from 40.8% in Glasgow to 54.9% in Lothian.
Table Six: Turnout: Constituency and Regional Vote, 2011
Region Constituency Vote Regional Vote
Central Scotland 48.0% 48.0%
Glasgow 40.7% 40.8%
Highlands and Islands 53.4% 53.4%
Lothian 54.8% 54.9%
Mid Scotland and Fife 52.0% 52.2%
North East Scotland 48.8% 54.0%
South Scotland 53.0% 53.0%
West Scotland 53.1% 53.1%
Scotland 50.4% 51.1%
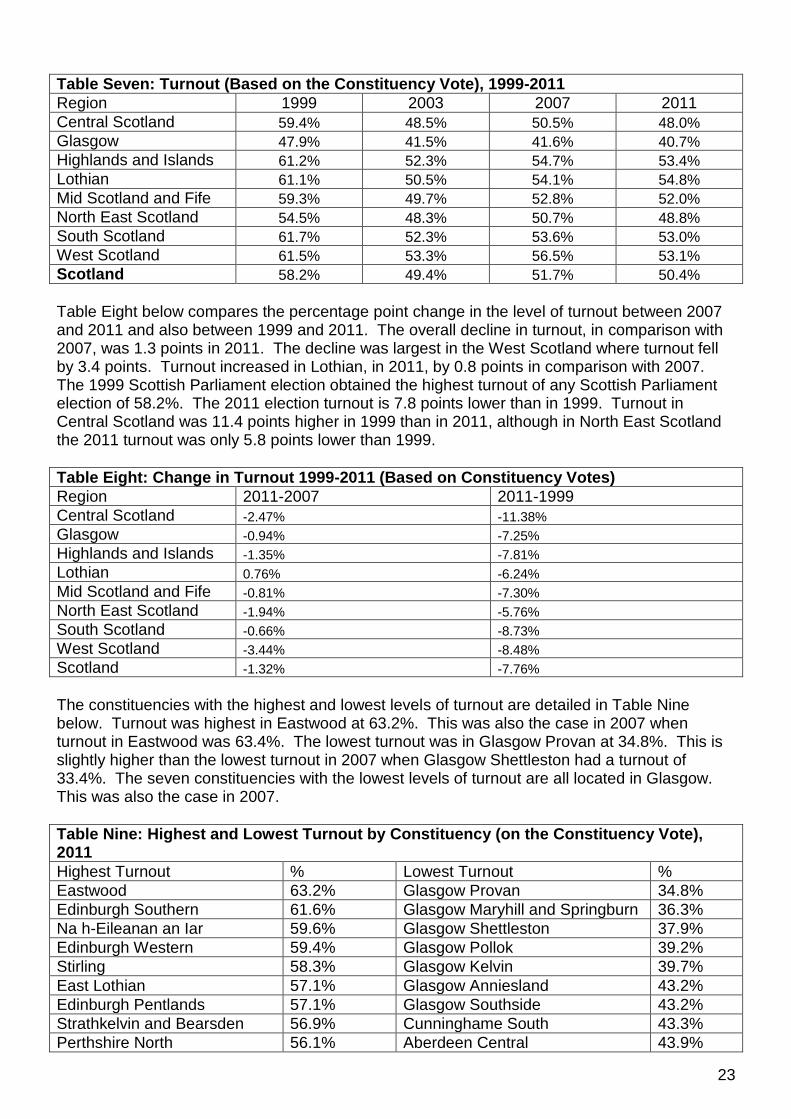
Table Seven below compares turnout, based on the constituency vote, with the three previous Scottish Parliament elections. The 2011 election resulted in a slight decline in turnout from 51.7% in 2007 to 50.4%. However, the 2011 turnout was still higher than the 2003 turnout of 49.4%. Turnout has consistently been lowest in Glasgow and this trend continued in 2011 with turnout falling to its lowest level to date at 40.7%. In the previous two Scottish Parliament elections, turnout had been highest in the West Scotland region. However, in 2011, Lothian obtained the highest level of turnout in 2011, for the first time in a Scottish Parliament election, at 54.8%.
23
Table Seven: Turnout (Based on the Constituency Vote), 1999-2011
Region 1999 2003 2007 2011
Central Scotland 59.4% 48.5% 50.5% 48.0%
Glasgow 47.9% 41.5% 41.6% 40.7%
Highlands and Islands 61.2% 52.3% 54.7% 53.4%
Lothian 61.1% 50.5% 54.1% 54.8%
Mid Scotland and Fife 59.3% 49.7% 52.8% 52.0%
North East Scotland 54.5% 48.3% 50.7% 48.8%
South Scotland 61.7% 52.3% 53.6% 53.0%
West Scotland 61.5% 53.3% 56.5% 53.1%
Scotland 58.2% 49.4% 51.7% 50.4%
Table Eight below compares the percentage point change in the level of turnout between 2007 and 2011 and also between 1999 and 2011. The overall decline in turnout, in comparison with 2007, was 1.3 points in 2011. The decline was largest in the West Scotland where turnout fell by 3.4 points. Turnout increased in Lothian, in 2011, by 0.8 points in comparison with 2007. The 1999 Scottish Parliament election obtained the highest turnout of any Scottish Parliament election of 58.2%. The 2011 election turnout is 7.8 points lower than in 1999. Turnout in Central Scotland was 11.4 points higher in 1999 than in 2011, although in North East Scotland the 2011 turnout was only 5.8 points lower than 1999.
Table Eight: Change in Turnout 1999-2011 (Based on Constituency Votes)
Region 2011-2007 2011-1999
Central Scotland -2.47% -11.38%
Glasgow -0.94% -7.25%
Highlands and Islands -1.35% -7.81%
Lothian 0.76% -6.24%
Mid Scotland and Fife -0.81% -7.30%
North East Scotland -1.94% -5.76%
South Scotland -0.66% -8.73%
West Scotland -3.44% -8.48%
Scotland -1.32% -7.76%
The constituencies with the highest and lowest levels of turnout are detailed in Table Nine below. Turnout was highest in Eastwood at 63.2%. This was also the case in 2007 when turnout in Eastwood was 63.4%. The lowest turnout was in Glasgow Provan at 34.8%. This is slightly higher than the lowest turnout in 2007 when Glasgow Shettleston had a turnout of 33.4%. The seven constituencies with the lowest levels of turnout are all located in Glasgow. This was also the case in 2007.
Table Nine: Highest and Lowest Turnout by Constituency (on the Constituency Vote), 2011
Highest Turnout % Lowest Turnout %
Eastwood 63.2% Glasgow Provan 34.8%
Edinburgh Southern 61.6% Glasgow Maryhill and Springburn 36.3%
Na h-Eileanan an Iar 59.6% Glasgow Shettleston 37.9%
Edinburgh Western 59.4% Glasgow Pollok 39.2%
Stirling 58.3% Glasgow Kelvin 39.7%
East Lothian 57.1% Glasgow Anniesland 43.2%
Edinburgh Pentlands 57.1% Glasgow Southside 43.2%
Strathkelvin and Bearsden 56.9% Cunninghame South 43.3%
Perthshire North 56.1% Aberdeen Central 43.9%
24
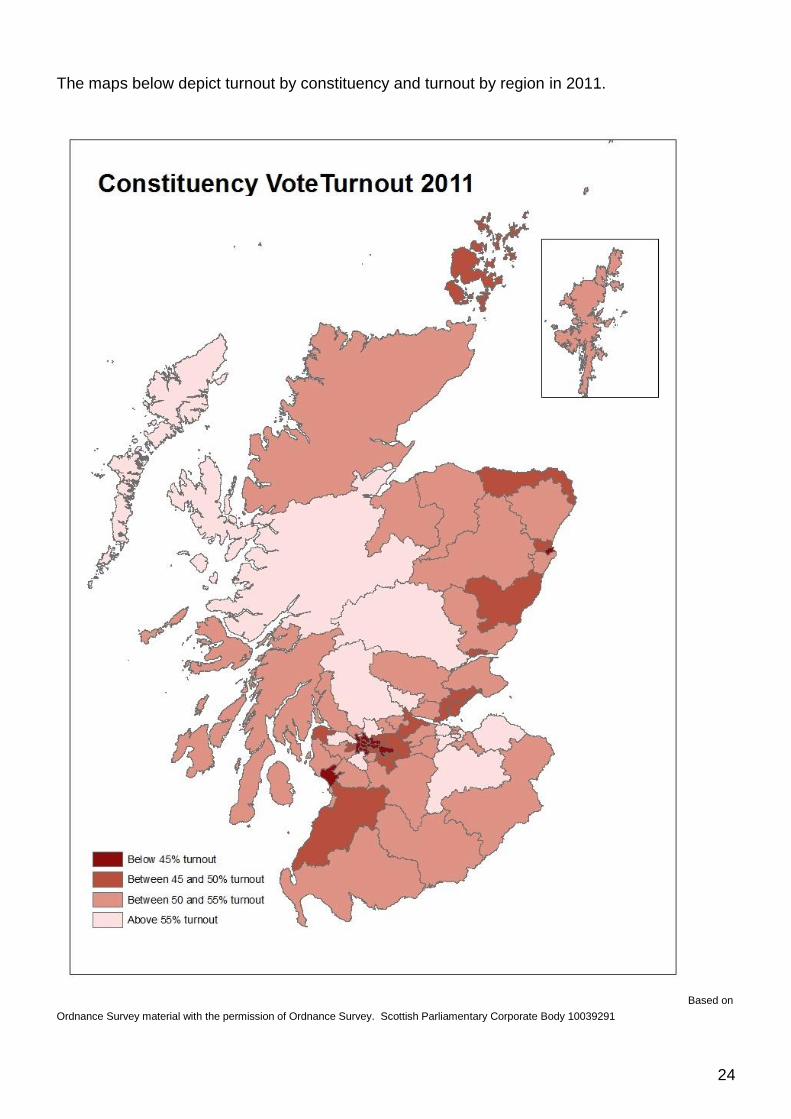
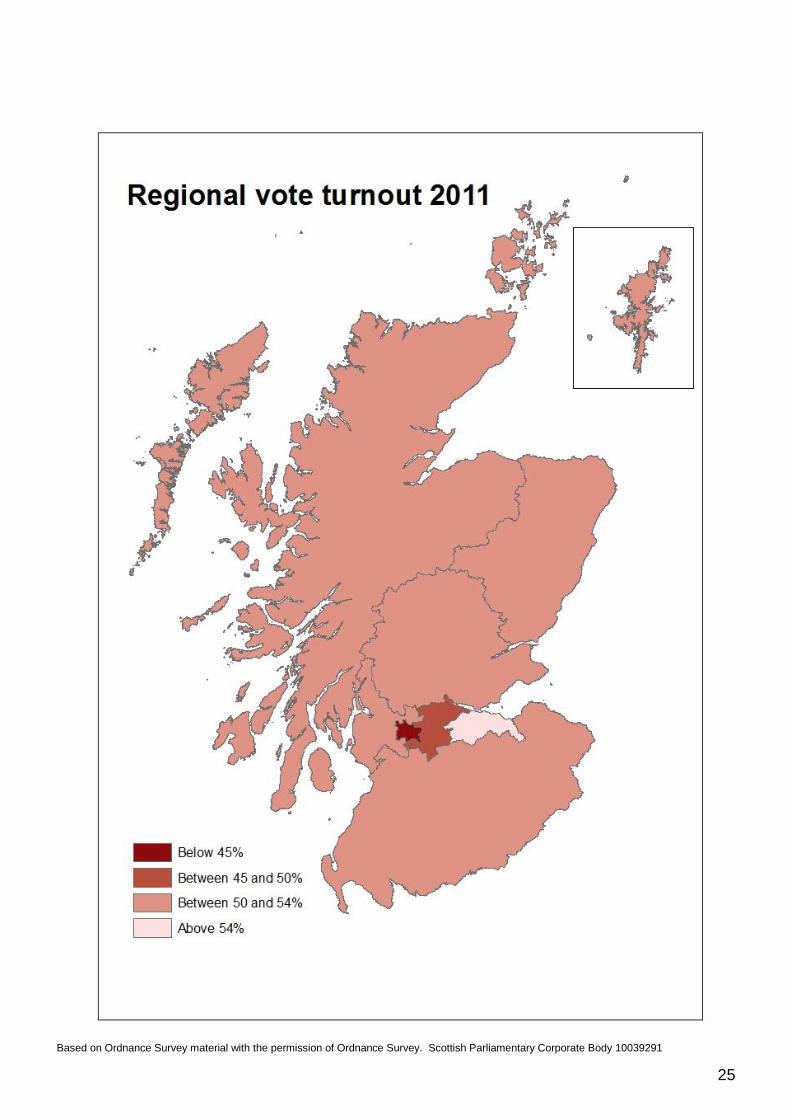
The maps below depict turnout by constituency and turnout by region in 2011.
Based on
Ordnance Survey material with the permission of Ordnance Survey. Scottish Parliamentary Corporate Body 10039291
25
Based on Ordnance Survey material with the permission of Ordnance Survey. Scottish Parliamentary Corporate Body 10039291
26
John Curtice discusses turnout and electoral behaviour in the section below.
Electoral behaviour
John Curtice, Professor of Politics, University of Strathclyde
Scotland‟s fourth devolved election added a number of important entries to the record books. The SNP secured by far its largest share of the vote ever. Leaving aside various European elections, the Conservatives‟ share of the constituency vote was the party‟s lowest ever, Labour‟s share the lowest since 1923, while in the case of the Liberal Democrats we have to go back to February 1974 to find a worse performance. Each of these three parties secured an even lower share of the list vote.
The combined effect of these record highs and lows was to give the SNP the first Scottish Parliament majority ever to be obtained by a single party. In 2007 the party was heavily dependent on winning list seats in obtaining its narrow one seat victory. Labour were able to win an overall majority of the 73 constituency seats even though the party won a slightly smaller share of the overall constituency vote than the nationalists. The SNP only managed to win 21 constituency seats, while rather more, 26, of the party‟s MSPs came from the regional lists.
This time the nationalists won no less than 53 constituency seats, matching the number obtained by Labour in the first Holyrood election in 1999. The party won just 16 list seats. It won a majority of the constituency seats in seven of the eight parliamentary regions, and actually secured a clean sweep in the North East. Taking the broadcasting organisations‟ estimates of what would have happened in 2007 under the new boundaries as the baseline, the party made 22 gains at the expense of Labour and eight from the Liberal Democrats together with a solitary gain from the Conservatives.
One potentially important feature of the Holyrood electoral system is that a party may win more constituency seats than its proportionate share of the total number of constituency and list seats in a region and thereby be „over-represented‟. In previous elections both Labour and the Liberal Democrats have benefitted from this feature and in 2003 it was essential to their combined ability to command a majority in the chamber. On this occasion, it was the SNP that profited. In the Lothians the party won one more constituency seat than its proportionate entitlement, thereby denying the Liberal Democrats a seat.
Nevertheless, the SNP‟s overall majority was obtained on the back of considerably less than half of the overall list vote, a reminder that even the use of a proportional electoral system does not ensure that any majority government necessarily commands the expressed support of at least half of all those who voted. The SNP were helped by the fact that in winning just 5.2% of the list vote the Liberal Democrats failed to secure any representation in half the regions, while the Greens, with just 4.4%, only gained representation in two. In addition, 6.8% of the list vote was cast for candidates and parties that did not win any seats at all.
In the constituency contests the SNP vote increased most, by 21.9 points, in Cunninghame North, a seat it won only narrowly in 2007. It fell in just one constituency, Shetland, by 4.5%, a result doubtless occasioned by the success of an Independent in winning 30.3% of the vote. More generally, SNP support increased most in Glasgow, in constituencies that were being defended by Labour and in seats where over 90% of the population was born in Scotland. It increased least in the South of Scotland and in areas being defended by the Conservatives.
At 31.7% Labour‟s share of the constituency vote was only half a percentage point lower than in
27
2007. But this time that performance yielded the party just 15 constituency seats, its lowest tally at any parliamentary election since 1931, not the 37 it secured in 2007. This was because this time the SNP enjoyed a 13.7 point lead over Labour rather than one of less than one point. Two of the seats that Labour won, Dumfriesshire and Eastwood, were notional gains from the Conservatives, thanks to the success of the incumbent MSP in overcoming the anticipated adverse effects of constituency boundary changes. Indeed, the 9.7 point increase in Ken MacIntosh‟s vote in Eastwood was the biggest Labour increase of all. In contrast, in five seats being defended by the party where the incumbent Labour MSP stood down, Labour‟s vote fell on average by 4.6 points, well above the figure of 1.4 points for all seats that the party was notionally defending.
Labour‟s difficulties in retaining constituency seats were compounded by the fact that the party performed least well in places where it was previously relatively strong. Labour‟s vote fell on average by 3.3 points in constituencies where its share of the vote was estimated to have been over 40% in 2007, whereas it actually increased slightly, by 0.6 of a point elsewhere. Not surprisingly this means that, in general, Labour‟s vote also fell more heavily in areas with more working class voters and in areas with relatively high levels of social deprivation.
In a reversal of the experience of the SNP, for the first time Labour secured more list seats (22) than constituency ones, even though the gap between the party‟s share of the overall constituency vote and its share of the list vote was bigger than that suffered by any of its three principal rivals. However, because most Labour candidates who stood in a constituency contest were not placed on a regional party list, this element of the electoral system only provided a lifeline for two of the incumbent Labour MSPs who lost their constituency contest. As many as 14 of Labour‟s list members are new to the Parliament.
As at previous Holyrood elections, the Conservatives‟ representation consists primarily of regional list seats, this time totalling twelve. The party won three constituency contests as opposed to four in 2007. Easily its best constituency performance was in Ettrick, Roxburgh and Berwickshire, where the party‟s share of the vote increased by 5.8 points. First won by the party in 2007, the incumbent MSP, John Lamont, has evidently been successful in consolidating his electoral support in the ensuing four years. Otherwise the party‟s vote fell in 69 of the 73 constituencies. Typically, falling tended to be greater in places where the party was previously stronger, but this probably simply reflects the fact that in some constituencies the party‟s share of the vote was already too low to fall much further. With the party‟s vote down by between one and three points in every region too, the most notable feature of the Conservative performance was the relative consistency of its decline.
That decline was, however, nothing like as serious as that suffered by the Liberal Democrats, whose share of both the constituency and the list vote was more than halved. The party lost all but the two constituencies in the Northern Isles, making it the first time since 1959 that the party has not won a constituency seat on the Scottish mainland. Indeed the party is left without representation of any kind throughout the central belt. Although some of the party‟s incumbent MSPs once again secured a much bigger share of the constituency vote in their area than the party obtained on the list vote locally, their personal support was unable to insulate them from the collapse in their party‟s popularity. Indeed, almost inevitably given the scale of the decline, the party‟s share of the constituency vote fell most heavily in seats where it was previously strongest, a pattern from which seats that the party was trying to defend were not immune.
The Greens managed to retain the two list seats they won in 2007, but the 0.3 of a point increase in their overall level of support on the list vote left them below the 5-6% mark at which the party could have hoped to win a seat in most regions. The party‟s vote increased most in Glasgow (by 0.8 of a point) where the party‟s co-convenor, Patrick Harvie, retained his seat. The party‟s share of the vote continues to be highest in the Lothians, where Independent MSP, Margo MacDonald, maintained the 6.6% share of the list vote she won in 2007 and thereby also
28
her seat.
At 50%, the proportion of valid votes cast was a couple of points down on 2007, though still marginally higher than in 2003. Evidently turnouts of around the 50% mark have become the norm for Scottish Parliament elections. In a familiar pattern turnout was higher in more affluent suburban and urban Scotland than in less affluent urban areas. The highest turnout was in Eastwood (63.2%), while the lowest was in Glasgow Provan (34.8%) in the east end of the city. However, thankfully, following the reversion to two ballot papers this time nowhere reported a particularly high number of spoilt ballot papers. At least those who made it to the polls did have their votes counted.
29
STATE OF THE PARTIES
The 2011 Election resulted in the SNP being the largest Party with 69 seats (+23 on the notional 2007 result); Labour second with 37 (-8 on the notional result); the Conservatives on 15 (-4 on notionals); the Liberal Democrats with 5 (-12 on notionals); the Greens with 2 (+1 on the notional result) and Margo MacDonald the sole independent MSP.
In terms of the share of the constituency vote and the number of seats gained, the SNP improved on its 2007 position by 12.5 percentage points and 32 seats; Labour fell by 0.5 percentage points and 22 seats; the Conservatives fell by 2.7 percentage points and 1 seat; and the Liberal Democrats share of the constituency vote fell by 8.2 percentage points and 9 seats.
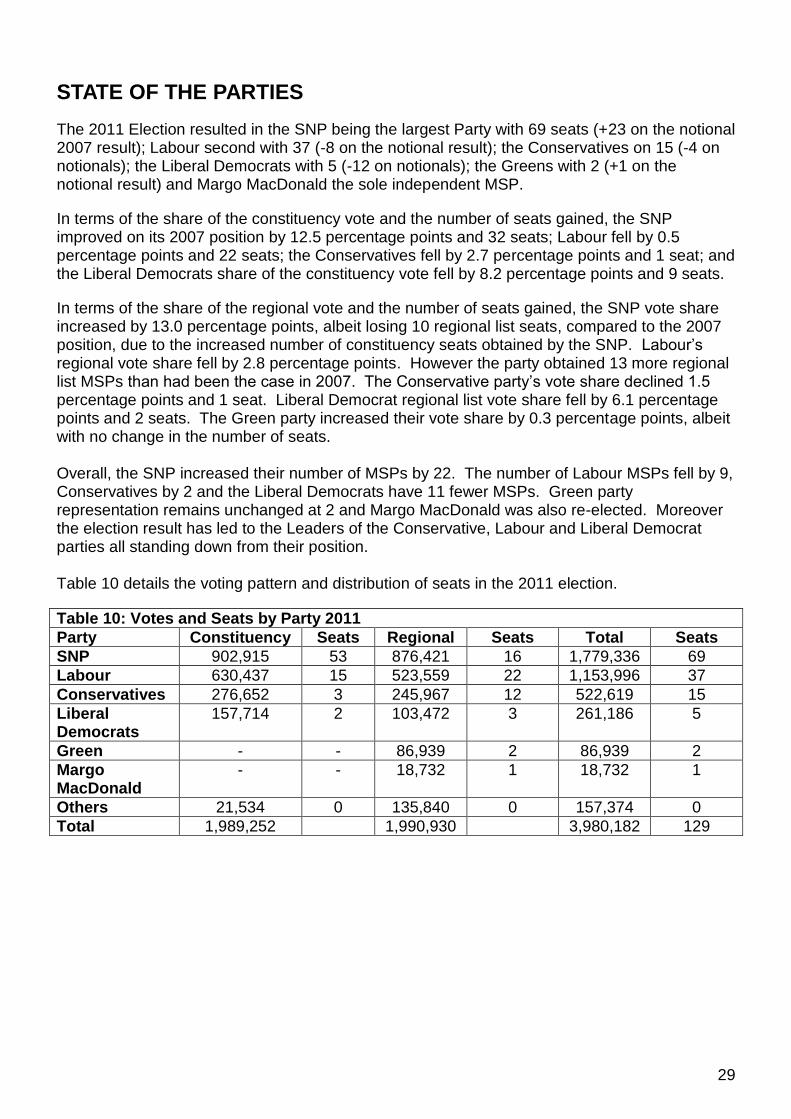
In terms of the share of the regional vote and the number of seats gained, the SNP vote share increased by 13.0 percentage points, albeit losing 10 regional list seats, compared to the 2007 position, due to the increased number of constituency seats obtained by the SNP. Labour‟s regional vote share fell by 2.8 percentage points. However the party obtained 13 more regional list MSPs than had been the case in 2007. The Conservative party‟s vote share declined 1.5 percentage points and 1 seat. Liberal Democrat regional list vote share fell by 6.1 percentage points and 2 seats. The Green party increased their vote share by 0.3 percentage points, albeit with no change in the number of seats. Overall, the SNP increased their number of MSPs by 22. The number of Labour MSPs fell by 9, Conservatives by 2 and the Liberal Democrats have 11 fewer MSPs. Green party representation remains unchanged at 2 and Margo MacDonald was also re-elected. Moreover the election result has led to the Leaders of the Conservative, Labour and Liberal Democrat parties all standing down from their position. Table 10 details the voting pattern and distribution of seats in the 2011 election.
Table 10: Votes and Seats by Party 2011
Party Constituency Seats Regional Seats Total Seats
SNP 902,915 53 876,421 16 1,779,336 69
Labour 630,437 15 523,559 22 1,153,996 37
Conservatives 276,652 3 245,967 12 522,619 15
Liberal Democrats
157,714 2 103,472 3 261,186 5
Green - - 86,939 2 86,939 2
Margo MacDonald
- - 18,732 1 18,732 1
Others 21,534 0 135,840 0 157,374 0
Total 1,989,252 1,990,930 3,980,182 129
30
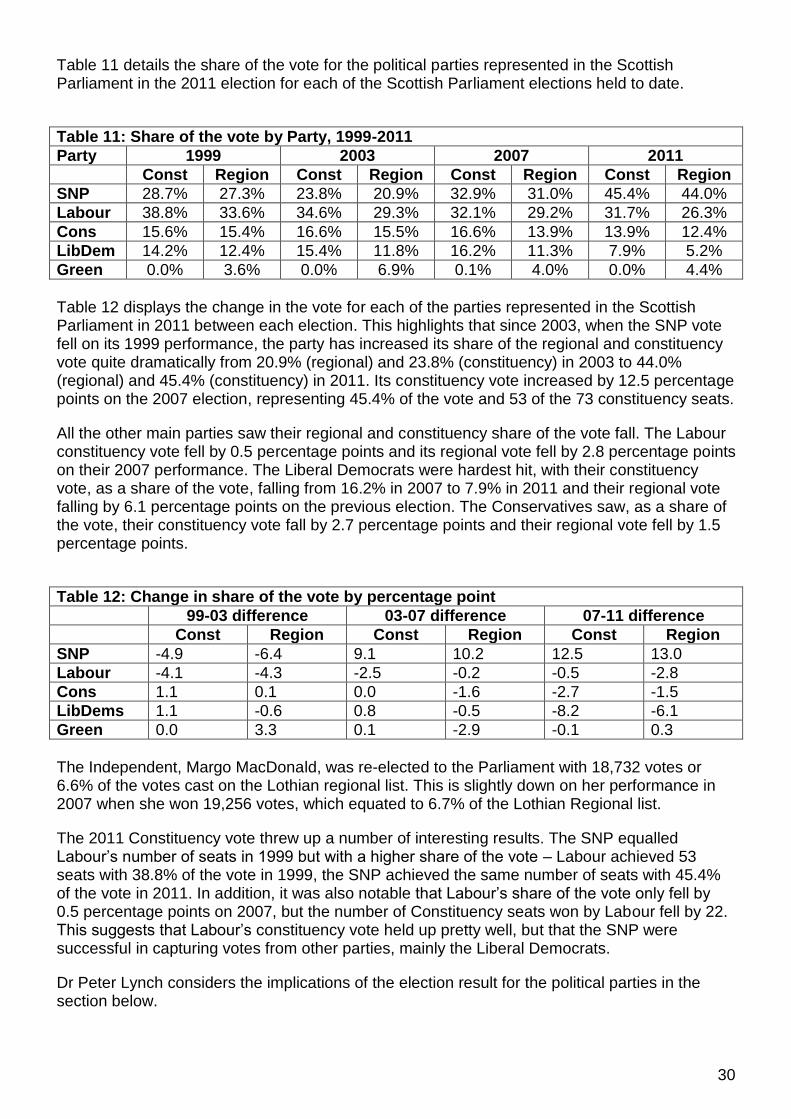
Table 11 details the share of the vote for the political parties represented in the Scottish Parliament in the 2011 election for each of the Scottish Parliament elections held to date.
Table 11: Share of the vote by Party, 1999-2011
Party 1999 2003 2007 2011
Const Region Const Region Const Region Const Region
SNP 28.7% 27.3% 23.8% 20.9% 32.9% 31.0% 45.4% 44.0%
Labour 38.8% 33.6% 34.6% 29.3% 32.1% 29.2% 31.7% 26.3%
Cons 15.6% 15.4% 16.6% 15.5% 16.6% 13.9% 13.9% 12.4%
LibDem 14.2% 12.4% 15.4% 11.8% 16.2% 11.3% 7.9% 5.2%
Green 0.0% 3.6% 0.0% 6.9% 0.1% 4.0% 0.0% 4.4%
Table 12 displays the change in the vote for each of the parties represented in the Scottish Parliament in 2011 between each election. This highlights that since 2003, when the SNP vote fell on its 1999 performance, the party has increased its share of the regional and constituency vote quite dramatically from 20.9% (regional) and 23.8% (constituency) in 2003 to 44.0% (regional) and 45.4% (constituency) in 2011. Its constituency vote increased by 12.5 percentage points on the 2007 election, representing 45.4% of the vote and 53 of the 73 constituency seats.
All the other main parties saw their regional and constituency share of the vote fall. The Labour constituency vote fell by 0.5 percentage points and its regional vote fell by 2.8 percentage points on their 2007 performance. The Liberal Democrats were hardest hit, with their constituency vote, as a share of the vote, falling from 16.2% in 2007 to 7.9% in 2011 and their regional vote falling by 6.1 percentage points on the previous election. The Conservatives saw, as a share of the vote, their constituency vote fall by 2.7 percentage points and their regional vote fell by 1.5 percentage points.
Table 12: Change in share of the vote by percentage point
99-03 difference 03-07 difference 07-11 difference
Const Region Const Region Const Region
SNP -4.9 -6.4 9.1 10.2 12.5 13.0
Labour -4.1 -4.3 -2.5 -0.2 -0.5 -2.8
Cons 1.1 0.1 0.0 -1.6 -2.7 -1.5
LibDems 1.1 -0.6 0.8 -0.5 -8.2 -6.1
Green 0.0 3.3 0.1 -2.9 -0.1 0.3
The Independent, Margo MacDonald, was re-elected to the Parliament with 18,732 votes or 6.6% of the votes cast on the Lothian regional list. This is slightly down on her performance in 2007 when she won 19,256 votes, which equated to 6.7% of the Lothian Regional list.
The 2011 Constituency vote threw up a number of interesting results. The SNP equalled Labour‟s number of seats in 1999 but with a higher share of the vote – Labour achieved 53 seats with 38.8% of the vote in 1999, the SNP achieved the same number of seats with 45.4% of the vote in 2011. In addition, it was also notable that Labour‟s share of the vote only fell by 0.5 percentage points on 2007, but the number of Constituency seats won by Labour fell by 22. This suggests that Labour‟s constituency vote held up pretty well, but that the SNP were successful in capturing votes from other parties, mainly the Liberal Democrats.
Dr Peter Lynch considers the implications of the election result for the political parties in the section below.
31
The implications of the election result for the political parties
Peter Lynch, Senior Lecturer in Politics, University of Stirling
Both the conditions and result of this election were remarkable. It was the first election in which the SNP had to defend its record in government and followed a commanding Scottish performance by Labour in the UK election in 2010. Both the Conservatives and Liberal Democrats also faced the unique position of being in the UK Government and required to defend the consequences of the coalition‟s first year in power: a requirement that proved impossible for the Lib Dems.
If the context was remarkable, the result was stunning and confounded expectations in spectacular fashion: a majority government that the electoral system was designed to prevent. However, a note of caution is necessary. This was a Scottish election to elect a Scottish government – something the SNP understood but Labour didn‟t. The results cannot simply be mapped onto the Westminster scene. Similarly, gaining the first ever majority government meant the post-election period was focused on the independence referendum and a variety of policies, rather than coalition formation: very different territory to normal as every party besides the SNP has been marginalised by the election result and it is clearly in the driving seat.
Despite all informed predictions and evidence of Scottish elections since 1999, the Nationalists tore up the election rule book, set it on fire and dumped it into the North Sea when they completed the North East clean-up of all FPTP seats in the region and then won a regional list seat too. The SNP won a joint record number of FPTP seats on a record share of the vote – some seats were predictable gains given such a strong showing, but others were stunning. The Nationalists shattered Labour‟s central belt domination as well as crushing the Lib Dems everywhere except Orkney and Shetland. The political map across central Scotland is now very yellow.
The SNP success was multi-faceted – meaning huge success on the regional list vote which delivered MSPs as well as FPTP gains in seats that were not marginal at all. The SNP campaign and resources were deployed across non-marginals at the election and yielded spectacular gains from Labour, which, it may be argued, fought the campaign in the wrong seats. Even so, seats like Carrick, Cumnock and Doon, Clydebank and Milngavie, Glasgow Anniesland and Kirkcaldy were off the radar gains and yet, the party nearly won more. The SNP was able to benefit from organisation and incumbency in many places, with list MSPs as well as councillors from all across Scotland finding their way to FPTP success. It will probably never get better than this for the SNP and the result defied the party‟s electoral history of major gains followed by serious losses.
The 5th May was a traumatic experience for the Lib Dems. Jonathan Freedland‟s post-election front page story in The Guardian was headlined „Lib Dems slapped, punched, kicked, knifed and left for dead‟: a pretty accurate image. The party lost the AV referendum heavily, hundreds of English councillors and Scotland almost completely. In FPTP terms, the Lib Dems are now the Orkney and Shetland party. They lost seats all over Scotland in huge swings to the SNP – and many of these losses involved absolute collapse. Thirty years of progress in the Edinburgh suburbs was overturned at one go, whilst Highland strongholds like Caithness, Sutherland and Ross saw the SNP winning almost 50% to take the seat from the Lib Dems. The SNP went after Lib Dems votes and seats and found the party was defenceless. The Lib Dems came fourth in Argyll and Bute (it holds the Westminster seat) and third in Aberdeen South, Dunfermline, Edinburgh Central and Edinburgh Southern. – seats it held. The party ended up with three list
32
seats by very small margins too – they were very close to no list seats at all.
Coalition meant the Lib Dems became identified with the Conservatives. Alignment with the Tories led Lib Dem voters to desert in droves and as the Lib Dems at Westminster move to the centre-right, they found their Scottish voters went in the opposite direction: all of which was entirely predictable. How the party gets back from this is hugely problematic due to the UK coalition – which may have a long-lasting toxic legacy for the party in Scotland for many years to come as Lib Dem voters have a comfortable home to defect to.
Everyone can agree that this was a very bad election for Labour but it actually could have been much worse. Labour has become a list party of “second class” MSPs – something they unwisely accused the SNP of being in 1999 and went about trying to deny list MSPs offices, staff and parliamentary resources. The boot is on the other foot now though. Moreover, only one of Labour‟s FPTP seats can be considered safe – Eastwood - but only because the SNP is in third place there. Everywhere else, Labour‟s formerly safe seats are highly vulnerable to a small swing to the Nationalists. That‟s how awful the election was – Labour has no heartland left.
Labour didn‟t seem to learn lessons from the 2007 Scottish election defeat and appeared to run its campaign as if it was the 2010 Westminster election combined with the Scottish election of 1999. The result was disastrous as everything that could go wrong went wrong during the campaign in terms of organisation, policy, campaigning and leadership. The party‟s leadership in the parliament has been decimated, its leader has resigned and it has promised to reform and learn the lessons of electoral defeat. Given the party failed to do this after 2007, it might be optimistic to think they will manage to do so now, despite the electoral catastrophe visited on the party.
The Tories may appear to have had a decent election given the disasters visited on Labour and the Lib Dems. However, this is to misread the election. Despite winning 15 seats in all, the Tories lost FPTP seats to the SNP and Labour and their share of the vote fell to their worst ever: 13.9%. The Tories campaigned on their policy relevance in 2011 – meaning the concessions the party had negotiated with the SNP minority government from 2007. However, this seemed to have had little impact at the election and any repetition of policy relevance has disappeared with the SNP‟s majority win. The party mobilised its small constituency of voters and survived but will have little influence now in Scotland. It must now focus on implementing the deep reforms suggested in the Sanderson report.
The Greens are the only party besides the SNP to have developed a successful second vote strategy and one that has always delivered seats. However, like 2007, the party‟s prospects were severely dented by the SNP‟s success in gathering huge numbers of second votes and having list MSPs elected despite sweeping the board in FPTP constituencies. And besides Margo MacDonald in Lothians, it was a bad night for Independents and the smaller parties as the SNP swept the board.
What happens now? Well, it is not post-devolution business as usual. The SNP has already put pressure on the UK government to give more economic powers to the Scottish Parliament and discussion about the timing and tactics of the independence referendum is constant. The SNP will set about forming its government and make decisions about the Parliament‟s committees, Presiding Officer, etc., whilst its opponent‟s are now focused on choosing new Scottish leaders and party reform.
The map below depicts constituency seats by party.
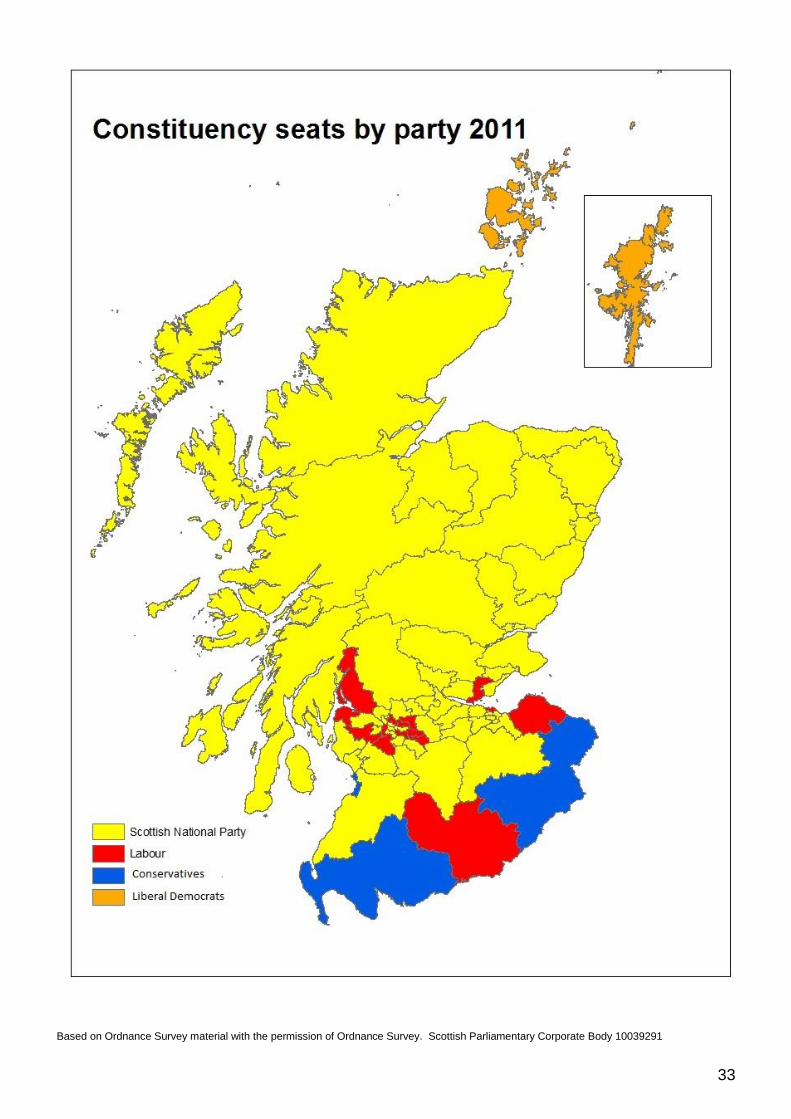
33
Based on Ordnance Survey material with the permission of Ordnance Survey. Scottish Parliamentary Corporate Body 10039291
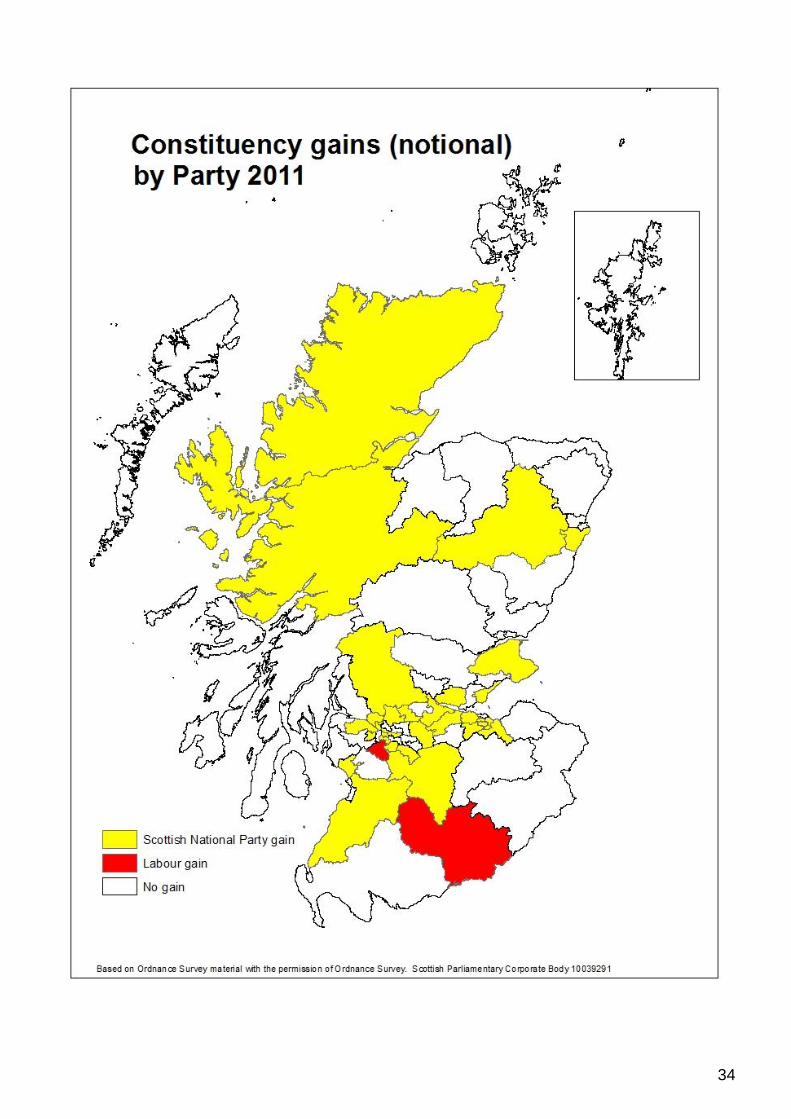
34
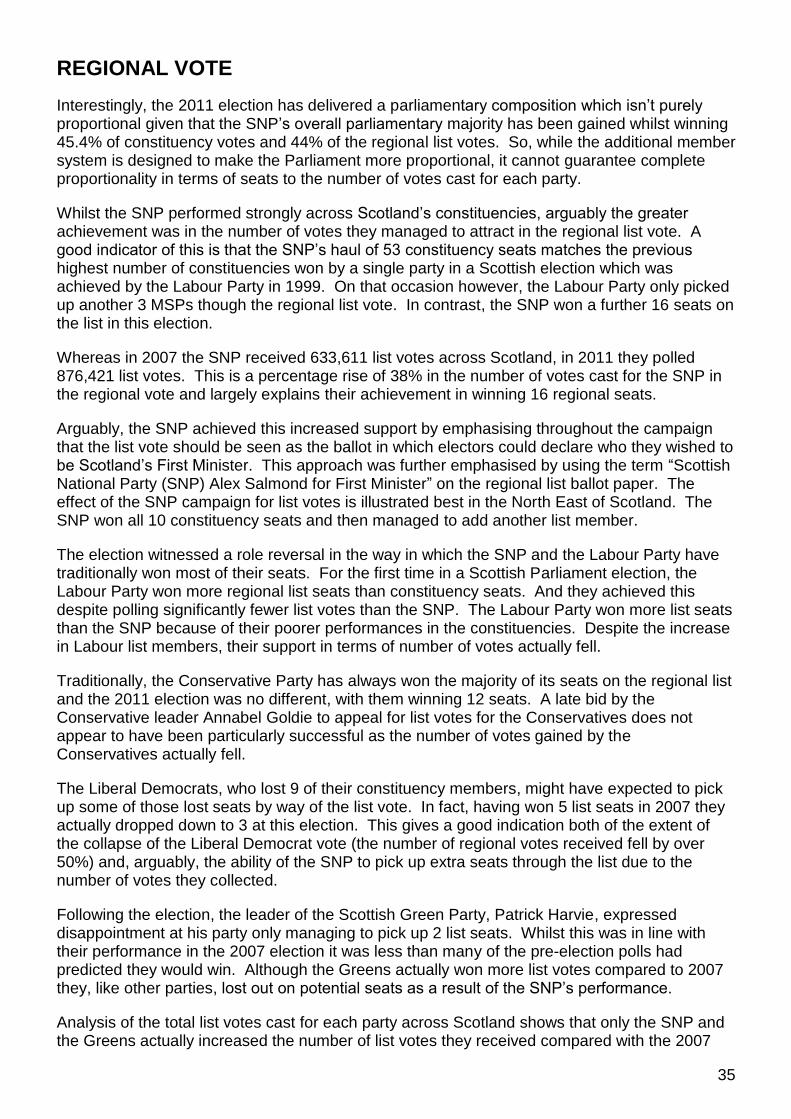
35
REGIONAL VOTE
Interestingly, the 2011 election has delivered a parliamentary composition which isn‟t purely proportional given that the SNP‟s overall parliamentary majority has been gained whilst winning 45.4% of constituency votes and 44% of the regional list votes. So, while the additional member system is designed to make the Parliament more proportional, it cannot guarantee complete proportionality in terms of seats to the number of votes cast for each party.
Whilst the SNP performed strongly across Scotland‟s constituencies, arguably the greater achievement was in the number of votes they managed to attract in the regional list vote. A good indicator of this is that the SNP‟s haul of 53 constituency seats matches the previous highest number of constituencies won by a single party in a Scottish election which was achieved by the Labour Party in 1999. On that occasion however, the Labour Party only picked up another 3 MSPs though the regional list vote. In contrast, the SNP won a further 16 seats on the list in this election.
Whereas in 2007 the SNP received 633,611 list votes across Scotland, in 2011 they polled 876,421 list votes. This is a percentage rise of 38% in the number of votes cast for the SNP in the regional vote and largely explains their achievement in winning 16 regional seats.
Arguably, the SNP achieved this increased support by emphasising throughout the campaign that the list vote should be seen as the ballot in which electors could declare who they wished to be Scotland‟s First Minister. This approach was further emphasised by using the term “Scottish National Party (SNP) Alex Salmond for First Minister” on the regional list ballot paper. The effect of the SNP campaign for list votes is illustrated best in the North East of Scotland. The SNP won all 10 constituency seats and then managed to add another list member.
The election witnessed a role reversal in the way in which the SNP and the Labour Party have traditionally won most of their seats. For the first time in a Scottish Parliament election, the Labour Party won more regional list seats than constituency seats. And they achieved this despite polling significantly fewer list votes than the SNP. The Labour Party won more list seats than the SNP because of their poorer performances in the constituencies. Despite the increase in Labour list members, their support in terms of number of votes actually fell.
Traditionally, the Conservative Party has always won the majority of its seats on the regional list and the 2011 election was no different, with them winning 12 seats. A late bid by the Conservative leader Annabel Goldie to appeal for list votes for the Conservatives does not appear to have been particularly successful as the number of votes gained by the Conservatives actually fell.
The Liberal Democrats, who lost 9 of their constituency members, might have expected to pick up some of those lost seats by way of the list vote. In fact, having won 5 list seats in 2007 they actually dropped down to 3 at this election. This gives a good indication both of the extent of the collapse of the Liberal Democrat vote (the number of regional votes received fell by over 50%) and, arguably, the ability of the SNP to pick up extra seats through the list due to the number of votes they collected.
Following the election, the leader of the Scottish Green Party, Patrick Harvie, expressed disappointment at his party only managing to pick up 2 list seats. Whilst this was in line with their performance in the 2007 election it was less than many of the pre-election polls had predicted they would win. Although the Greens actually won more list votes compared to 2007 they, like other parties, lost out on potential seats as a result of the SNP‟s performance.
Analysis of the total list votes cast for each party across Scotland shows that only the SNP and the Greens actually increased the number of list votes they received compared with the 2007
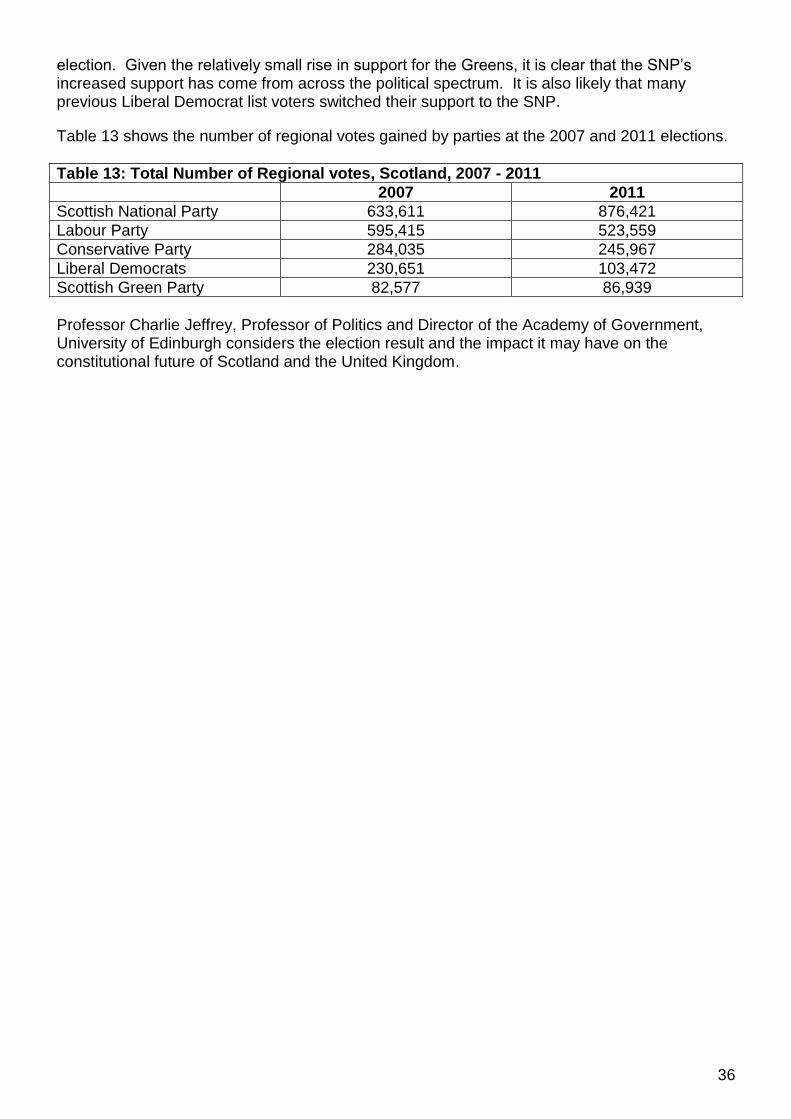
36
election. Given the relatively small rise in support for the Greens, it is clear that the SNP‟s increased support has come from across the political spectrum. It is also likely that many previous Liberal Democrat list voters switched their support to the SNP.
Table 13 shows the number of regional votes gained by parties at the 2007 and 2011 elections.
Table 13: Total Number of Regional votes, Scotland, 2007 - 2011
2007 2011
Scottish National Party 633,611 876,421
Labour Party 595,415 523,559
Conservative Party 284,035 245,967
Liberal Democrats 230,651 103,472
Scottish Green Party 82,577 86,939
Professor Charlie Jeffrey, Professor of Politics and Director of the Academy of Government, University of Edinburgh considers the election result and the impact it may have on the constitutional future of Scotland and the United Kingdom.
37
THE IMPACT OF THE ELECTION RESULT ON THE FUTURE CONSTITUTIONAL DIRECTION OF SCOTLAND AND THE UNITED KINGDOM
Professor Charlie Jeffrey
The SNP‟s victory is an extraordinary one. In 2007 it was the biggest party by a whisker. This time round there is a chasm between it and Labour. Its victory is extraordinary too for its constitutional significance, even though the SNP‟s campaign focused very explicitly on its record in government, not on its constitutional ambitions.
The commitment to a referendum on independence was still there, of course, but it was by no means in the foreground. The scale of the SNP‟s victory hauls it immediately into the spotlight. Alex Salmond has confirmed he will look to hold a referendum in the second half of this term of office. And this time he will have a majority in the Scottish Parliament to deliver it.
So some time in 2014 or after we will have a definitive answer to the question that more than anything else has kept Scotland‟s pollsters in business: do the Scots want an independent state? The pollsters will tell us the most likely answer to that question is no.
That of course immediately brings out the gambler‟s twinkle in Alex Salmond‟s eye. After all he did transform a fifteen point deficit in the polls in March into a crushing victory by 5th May. So what‟s to say he couldn‟t repeat the trick?
But that twinkle has another source. Salmond knows the cards are stacked in the SNP‟s favour referendum or not, yes vote or not. Scotland is headed anyway for a much looser relationship with the rest of the UK. There are four reasons for this.
The first is the scale of the SNP‟s victory. With 45% of the constituency vote, 44% of the regional vote and an overall majority of seats the SNP‟s programme for government – including the commitment to test opinion on independence – simply has much more legitimacy than it could have in the last Parliament.
That majority also means the SNP can no longer be steam-rollered by the unionist parties, as it was in the Committee that scrutinised the Scotland Bill earlier this year. The resolution in that Committee‟s report that the Bill should come back to the Scottish Parliament after it had gone through Westminster‟s committees – no doubt made in the expectation that there would be a unionist majority, with Labour the biggest party, after Thursday‟s election – now gives the SNP a chance to press for further far-reaching powers, especially on tax.
That is a short term effect of the election. There will be a hugely significant longer term one as well, and it concerns Labour. Labour fought most of the Scottish election campaign on a platform focused on Westminster politics, about how a strong Labour showing was the best way for Scotland to ward off the Westminster bogeymen, Cameron and Clegg. It no doubt chose to pitch its appeal in this way because of its trend-bucking success in Scotland in last year‟s UK election when it won 42% of the Scottish vote.
But all the evidence from all the elections in Scotland since 1999 is that Scots make different kinds of electoral calculation in Westminster and Scottish elections. What worked last year – fighting David Cameron – was not the right basis on which to fight a Scottish election. Scots want Scottish elections to be fought around things that Scottish governments have done or might do, and around the leaders the parties put up as candidates for office in Scotland.
38
The SNP made exactly the same mistake in reverse in last year‟s UK election, fighting that election on its record of government in Scotland, and setting a target of twenty Westminster seats on that basis. They got nowhere near that target because that wasn‟t what the election was about. It was about UK-level issues and ultimately, as Scots voters well know, the SNP is only ever going to be a marginal player in the UK Parliament.
The challenge for Labour is now to avoid dwindling into a marginal force in the Scottish Parliament. To do that it has to disentangle itself from the UK Labour Party, build up its own made-in-Scotland identity, and reserve for itself the right to disagree with whatever Labour is doing at UK level.
Labour in other words has to become a national, even nationalist party in Scotland if it wants to compete more effectively with the SNP in Scottish elections. Labour in Scotland had begun, albeit rather timidly, to think in this direction under Iain Gray. Whoever takes the party forward will need to cast off that timidity and move more wholeheartedly to compete with the SNP on its own turf. Driven by Scottish electoral logic Labour has to compete with the SNP around that party‟s defining project: marking out Scotland as a political arena distinct from the rest of the UK.
That distinctiveness, thirdly, is precisely what the Scots appear to want. Even if they appear as yet unpersuaded by independence, opinion polls tell us the Scots want a significantly stronger Scottish Parliament than they currently have. They would like it to have powers in social security, one of the areas currently reserved to Westminster. They certainly want the Parliament to have a much fuller responsibility itself for raising the money used to finance its policies. And they think that Scottish MPs should play a reduced role at Westminster, especially on legislation that concerns England; even the Scots find the issues raised by the West Lothian Question untenable.
The English think much the same. They are happy for the Scots to have their own Parliament, think it should raise its own taxes, and think Scottish MPs should keep out of English business. Like the Scots, the English too seem to want to see a clearer distinction of the Scottish from the UK/English political arena. The SNP‟s victory will do nothing to dissuade the English from that view.
So if the SNP now has the numbers, Labour now needs to move onto the SNP‟s turf, and the Scots and the English are already on it, a strengthening of the Scottish Parliament – whether through a beefed-up Scotland Bill in the short term, or a referendum or further UK legislation in the medium term – looks inevitable.
Will the UK government resist? If it had to face up to a yes vote in an independence referendum it would be sure to negotiate hard on questions like oil and national debt. But it could hardly deny the force of a popular vote while supporting people power in other settings. Indeed, both John Major and Tony Blair each conceded that the constituent parts of the UK have the right of self-determination, the right to decide whether to be part of the UK or not.
But even without a yes vote the machinery of the UK state is set up to ease the process of the Scots (or the Northern Irish or the Welsh) demarcating their own political system from the rest of the UK. Devolution was not accompanied by new structures to bring all the UK‟s governments together to identify and pursue common purposes. Apart from periodic set piece meetings, most UK-devolved coordination happens on an ad hoc, informal and predominantly bilateral basis.
The absence of shared UK-wide purpose, and the reliance on bilateral relations between governments has enabled Scottish policies increasingly to diverge from UK government policies in England, and the policies devolved government enacts in Wales and Northern Ireland. The UK state is – inadvertently but probably irreversibly – set up in a way which facilitates difference.

39
This is the fourth reason why Scotland has its own, increasingly distinctive political system, ever more loosely bound together with those in the other parts of the UK. No wonder there is such a twinkle in Alex Salmond‟s eye. Whether or not he holds and wins a referendum, he can‟t lose.
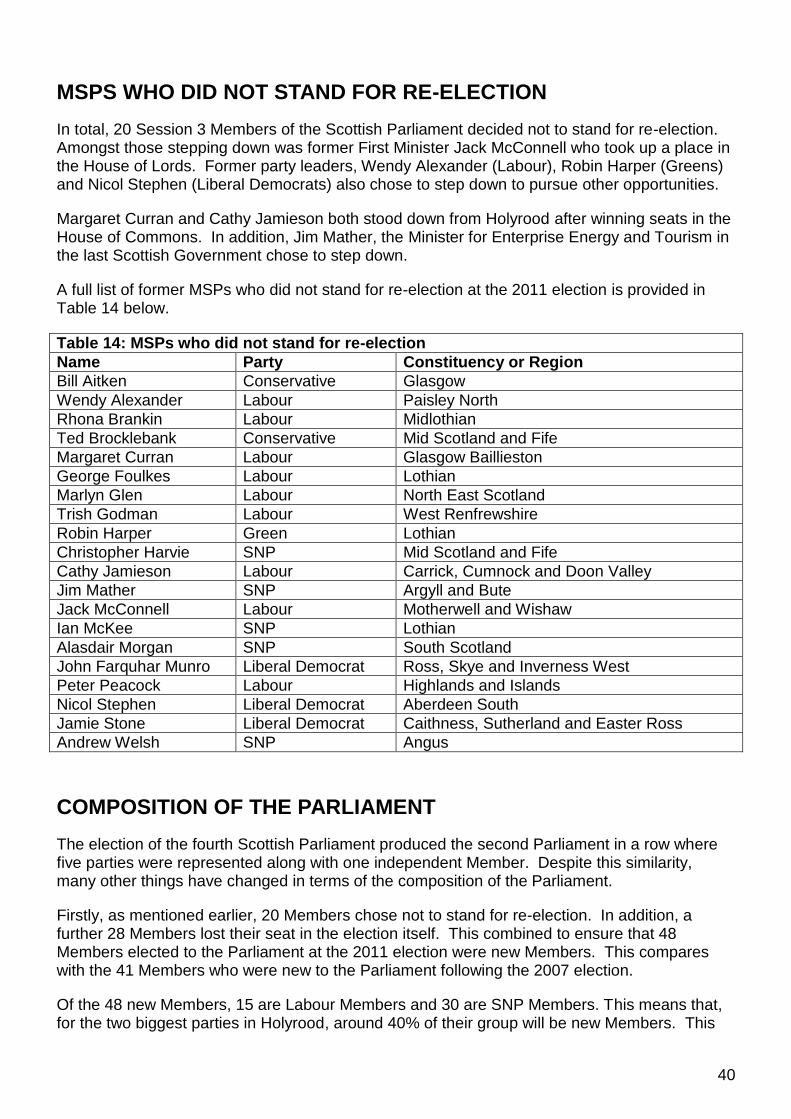
40
MSPS WHO DID NOT STAND FOR RE-ELECTION
In total, 20 Session 3 Members of the Scottish Parliament decided not to stand for re-election. Amongst those stepping down was former First Minister Jack McConnell who took up a place in the House of Lords. Former party leaders, Wendy Alexander (Labour), Robin Harper (Greens) and Nicol Stephen (Liberal Democrats) also chose to step down to pursue other opportunities.
Margaret Curran and Cathy Jamieson both stood down from Holyrood after winning seats in the House of Commons. In addition, Jim Mather, the Minister for Enterprise Energy and Tourism in the last Scottish Government chose to step down.
A full list of former MSPs who did not stand for re-election at the 2011 election is provided in Table 14 below.
Table 14: MSPs who did not stand for re-election
Name Party Constituency or Region
Bill Aitken Conservative Glasgow
Wendy Alexander Labour Paisley North
Rhona Brankin Labour Midlothian
Ted Brocklebank Conservative Mid Scotland and Fife
Margaret Curran Labour Glasgow Baillieston
George Foulkes Labour Lothian
Marlyn Glen Labour North East Scotland
Trish Godman Labour West Renfrewshire
Robin Harper Green Lothian
Christopher Harvie SNP Mid Scotland and Fife
Cathy Jamieson Labour Carrick, Cumnock and Doon Valley
Jim Mather SNP Argyll and Bute
Jack McConnell Labour Motherwell and Wishaw
Ian McKee SNP Lothian
Alasdair Morgan SNP South Scotland
John Farquhar Munro Liberal Democrat Ross, Skye and Inverness West
Peter Peacock Labour Highlands and Islands
Nicol Stephen Liberal Democrat Aberdeen South
Jamie Stone Liberal Democrat Caithness, Sutherland and Easter Ross
Andrew Welsh SNP Angus
COMPOSITION OF THE PARLIAMENT
The election of the fourth Scottish Parliament produced the second Parliament in a row where five parties were represented along with one independent Member. Despite this similarity, many other things have changed in terms of the composition of the Parliament.
Firstly, as mentioned earlier, 20 Members chose not to stand for re-election. In addition, a further 28 Members lost their seat in the election itself. This combined to ensure that 48 Members elected to the Parliament at the 2011 election were new Members. This compares with the 41 Members who were new to the Parliament following the 2007 election.
Of the 48 new Members, 15 are Labour Members and 30 are SNP Members. This means that, for the two biggest parties in Holyrood, around 40% of their group will be new Members. This
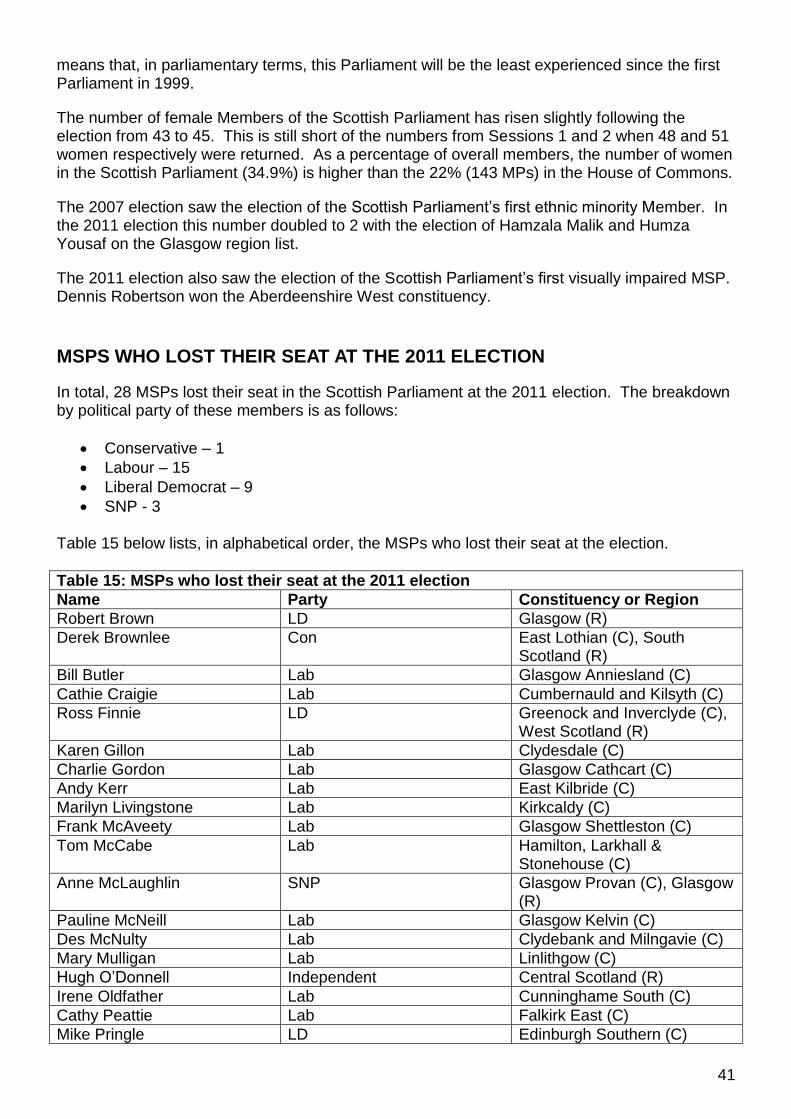
41
means that, in parliamentary terms, this Parliament will be the least experienced since the first Parliament in 1999.
The number of female Members of the Scottish Parliament has risen slightly following the election from 43 to 45. This is still short of the numbers from Sessions 1 and 2 when 48 and 51 women respectively were returned. As a percentage of overall members, the number of women in the Scottish Parliament (34.9%) is higher than the 22% (143 MPs) in the House of Commons.
The 2007 election saw the election of the Scottish Parliament‟s first ethnic minority Member. In the 2011 election this number doubled to 2 with the election of Hamzala Malik and Humza Yousaf on the Glasgow region list.
The 2011 election also saw the election of the Scottish Parliament‟s first visually impaired MSP. Dennis Robertson won the Aberdeenshire West constituency.
MSPS WHO LOST THEIR SEAT AT THE 2011 ELECTION
In total, 28 MSPs lost their seat in the Scottish Parliament at the 2011 election. The breakdown by political party of these members is as follows:
Conservative – 1
Labour – 15
Liberal Democrat – 9
SNP - 3 Table 15 below lists, in alphabetical order, the MSPs who lost their seat at the election.
Table 15: MSPs who lost their seat at the 2011 election
Name Party Constituency or Region
Robert Brown LD Glasgow (R)
Derek Brownlee Con East Lothian (C), South Scotland (R)
Bill Butler Lab Glasgow Anniesland (C)
Cathie Craigie Lab Cumbernauld and Kilsyth (C)
Ross Finnie LD Greenock and Inverclyde (C), West Scotland (R)
Karen Gillon Lab Clydesdale (C)
Charlie Gordon Lab Glasgow Cathcart (C)
Andy Kerr Lab East Kilbride (C)
Marilyn Livingstone Lab Kirkcaldy (C)
Frank McAveety Lab Glasgow Shettleston (C)
Tom McCabe Lab Hamilton, Larkhall & Stonehouse (C)
Anne McLaughlin SNP Glasgow Provan (C), Glasgow (R)
Pauline McNeill Lab Glasgow Kelvin (C)
Des McNulty Lab Clydebank and Milngavie (C)
Mary Mulligan Lab Linlithgow (C)
Hugh O‟Donnell Independent Central Scotland (R)
Irene Oldfather Lab Cunninghame South (C)
Cathy Peattie Lab Falkirk East (C)
Mike Pringle LD Edinburgh Southern (C)
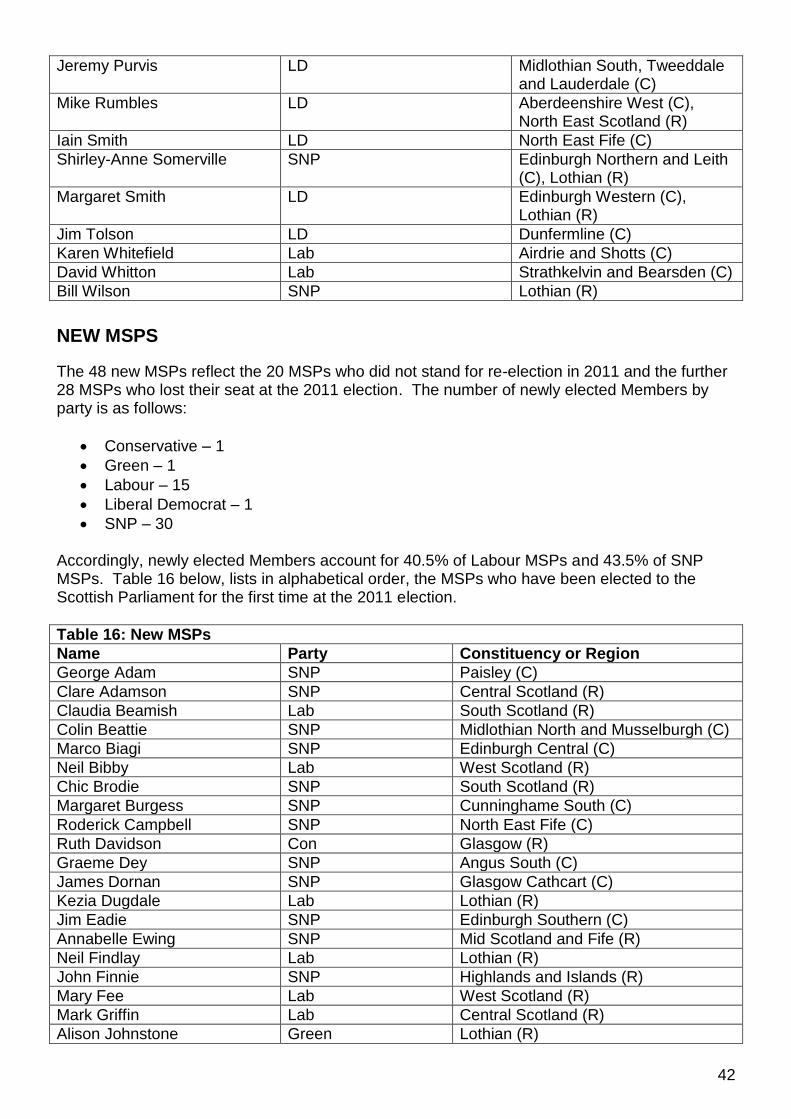
42
Jeremy Purvis LD Midlothian South, Tweeddale and Lauderdale (C)
Mike Rumbles LD Aberdeenshire West (C), North East Scotland (R)
Iain Smith LD North East Fife (C)
Shirley-Anne Somerville SNP Edinburgh Northern and Leith (C), Lothian (R)
Margaret Smith LD Edinburgh Western (C), Lothian (R)
Jim Tolson LD Dunfermline (C)
Karen Whitefield Lab Airdrie and Shotts (C)
David Whitton Lab Strathkelvin and Bearsden (C)
Bill Wilson SNP Lothian (R)
NEW MSPS
The 48 new MSPs reflect the 20 MSPs who did not stand for re-election in 2011 and the further 28 MSPs who lost their seat at the 2011 election. The number of newly elected Members by party is as follows:
Conservative – 1
Green – 1
Labour – 15
Liberal Democrat – 1
SNP – 30 Accordingly, newly elected Members account for 40.5% of Labour MSPs and 43.5% of SNP MSPs. Table 16 below, lists in alphabetical order, the MSPs who have been elected to the Scottish Parliament for the first time at the 2011 election.
Table 16: New MSPs
Name Party Constituency or Region
George Adam SNP Paisley (C)
Clare Adamson SNP Central Scotland (R)
Claudia Beamish Lab South Scotland (R)
Colin Beattie SNP Midlothian North and Musselburgh (C)
Marco Biagi SNP Edinburgh Central (C)
Neil Bibby Lab West Scotland (R)
Chic Brodie SNP South Scotland (R)
Margaret Burgess SNP Cunninghame South (C)
Roderick Campbell SNP North East Fife (C)
Ruth Davidson Con Glasgow (R)
Graeme Dey SNP Angus South (C)
James Dornan SNP Glasgow Cathcart (C)
Kezia Dugdale Lab Lothian (R)
Jim Eadie SNP Edinburgh Southern (C)
Annabelle Ewing SNP Mid Scotland and Fife (R)
Neil Findlay Lab Lothian (R)
John Finnie SNP Highlands and Islands (R)
Mary Fee Lab West Scotland (R)
Mark Griffin Lab Central Scotland (R)
Alison Johnstone Green Lothian (R)
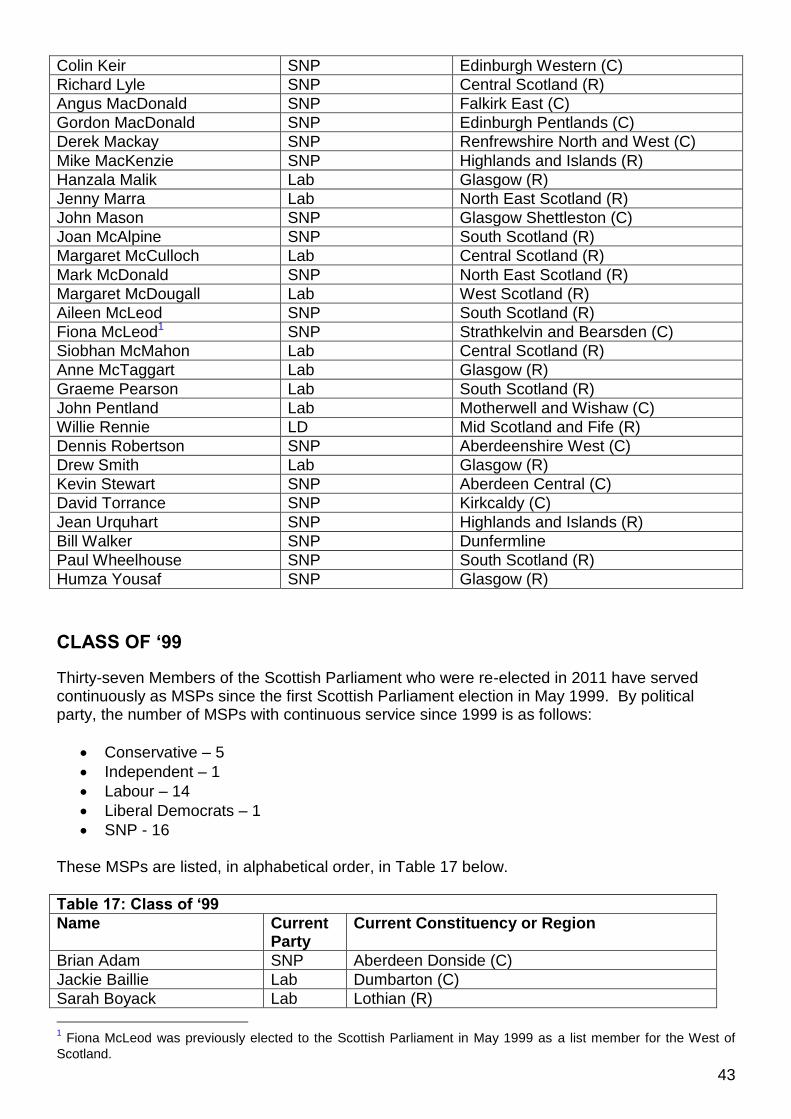
43
Colin Keir SNP Edinburgh Western (C)
Richard Lyle SNP Central Scotland (R)
Angus MacDonald SNP Falkirk East (C)
Gordon MacDonald SNP Edinburgh Pentlands (C)
Derek Mackay SNP Renfrewshire North and West (C)
Mike MacKenzie SNP Highlands and Islands (R)
Hanzala Malik Lab Glasgow (R)
Jenny Marra Lab North East Scotland (R)
John Mason SNP Glasgow Shettleston (C)
Joan McAlpine SNP South Scotland (R)
Margaret McCulloch Lab Central Scotland (R)
Mark McDonald SNP North East Scotland (R)
Margaret McDougall Lab West Scotland (R)
Aileen McLeod SNP South Scotland (R)
Fiona McLeod1 SNP Strathkelvin and Bearsden (C)
Siobhan McMahon Lab Central Scotland (R)
Anne McTaggart Lab Glasgow (R)
Graeme Pearson Lab South Scotland (R)
John Pentland Lab Motherwell and Wishaw (C)
Willie Rennie LD Mid Scotland and Fife (R)
Dennis Robertson SNP Aberdeenshire West (C)
Drew Smith Lab Glasgow (R)
Kevin Stewart SNP Aberdeen Central (C)
David Torrance SNP Kirkcaldy (C)
Jean Urquhart SNP Highlands and Islands (R)
Bill Walker SNP Dunfermline
Paul Wheelhouse SNP South Scotland (R)
Humza Yousaf SNP Glasgow (R)
CLASS OF ‘99
Thirty-seven Members of the Scottish Parliament who were re-elected in 2011 have served continuously as MSPs since the first Scottish Parliament election in May 1999. By political party, the number of MSPs with continuous service since 1999 is as follows:
Conservative – 5
Independent – 1
Labour – 14
Liberal Democrats – 1
SNP - 16 These MSPs are listed, in alphabetical order, in Table 17 below.
Table 17: Class of ‘99
Name Current Party
Current Constituency or Region
Brian Adam SNP Aberdeen Donside (C)
Jackie Baillie Lab Dumbarton (C)
Sarah Boyack Lab Lothian (R)
1 Fiona McLeod was previously elected to the Scottish Parliament in May 1999 as a list member for the West of
Scotland.
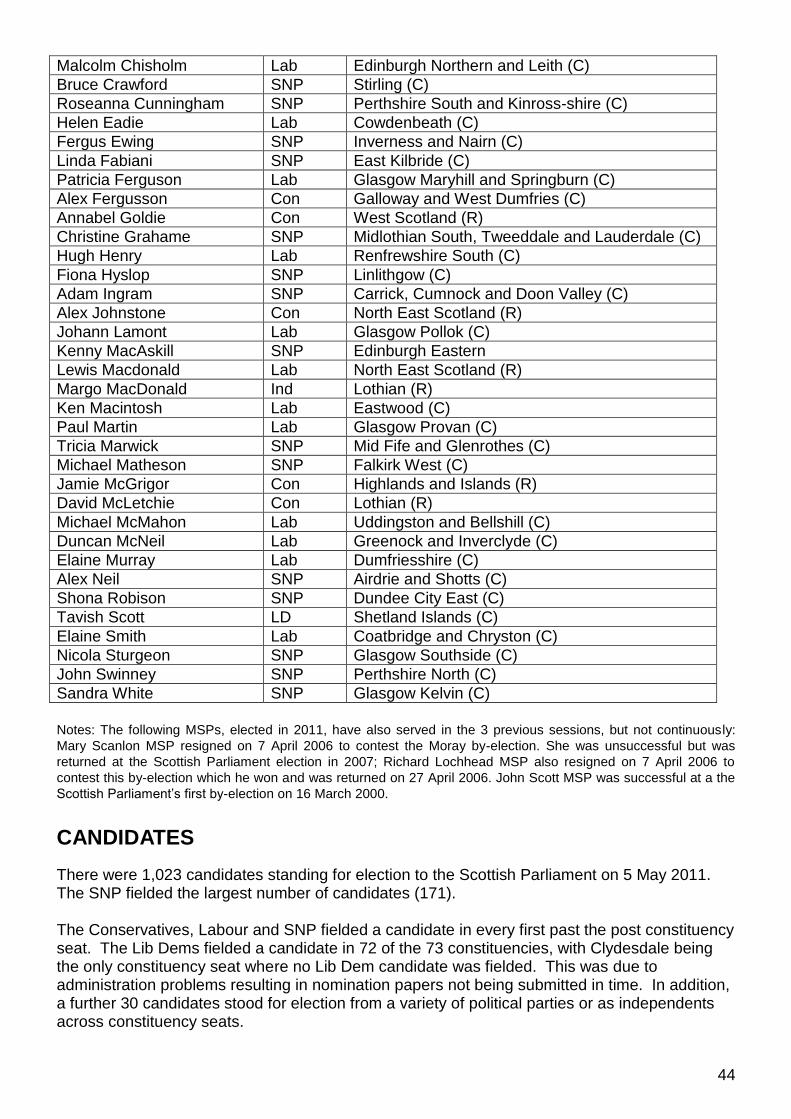
44
Malcolm Chisholm Lab Edinburgh Northern and Leith (C)
Bruce Crawford SNP Stirling (C)
Roseanna Cunningham SNP Perthshire South and Kinross-shire (C)
Helen Eadie Lab Cowdenbeath (C)
Fergus Ewing SNP Inverness and Nairn (C)
Linda Fabiani SNP East Kilbride (C)
Patricia Ferguson Lab Glasgow Maryhill and Springburn (C)
Alex Fergusson Con Galloway and West Dumfries (C)
Annabel Goldie Con West Scotland (R)
Christine Grahame SNP Midlothian South, Tweeddale and Lauderdale (C)
Hugh Henry Lab Renfrewshire South (C)
Fiona Hyslop SNP Linlithgow (C)
Adam Ingram SNP Carrick, Cumnock and Doon Valley (C)
Alex Johnstone Con North East Scotland (R)
Johann Lamont Lab Glasgow Pollok (C)
Kenny MacAskill SNP Edinburgh Eastern
Lewis Macdonald Lab North East Scotland (R)
Margo MacDonald Ind Lothian (R)
Ken Macintosh Lab Eastwood (C)
Paul Martin Lab Glasgow Provan (C)
Tricia Marwick SNP Mid Fife and Glenrothes (C)
Michael Matheson SNP Falkirk West (C)
Jamie McGrigor Con Highlands and Islands (R)
David McLetchie Con Lothian (R)
Michael McMahon Lab Uddingston and Bellshill (C)
Duncan McNeil Lab Greenock and Inverclyde (C)
Elaine Murray Lab Dumfriesshire (C)
Alex Neil SNP Airdrie and Shotts (C)
Shona Robison SNP Dundee City East (C)
Tavish Scott LD Shetland Islands (C)
Elaine Smith Lab Coatbridge and Chryston (C)
Nicola Sturgeon SNP Glasgow Southside (C)
John Swinney SNP Perthshire North (C)
Sandra White SNP Glasgow Kelvin (C)
Notes: The following MSPs, elected in 2011, have also served in the 3 previous sessions, but not continuously:
Mary Scanlon MSP resigned on 7 April 2006 to contest the Moray by-election. She was unsuccessful but was
returned at the Scottish Parliament election in 2007; Richard Lochhead MSP also resigned on 7 April 2006 to
contest this by-election which he won and was returned on 27 April 2006. John Scott MSP was successful at a the
Scottish Parliament‟s first by-election on 16 March 2000.
CANDIDATES
There were 1,023 candidates standing for election to the Scottish Parliament on 5 May 2011. The SNP fielded the largest number of candidates (171). The Conservatives, Labour and SNP fielded a candidate in every first past the post constituency seat. The Lib Dems fielded a candidate in 72 of the 73 constituencies, with Clydesdale being the only constituency seat where no Lib Dem candidate was fielded. This was due to administration problems resulting in nomination papers not being submitted in time. In addition, a further 30 candidates stood for election from a variety of political parties or as independents across constituency seats.
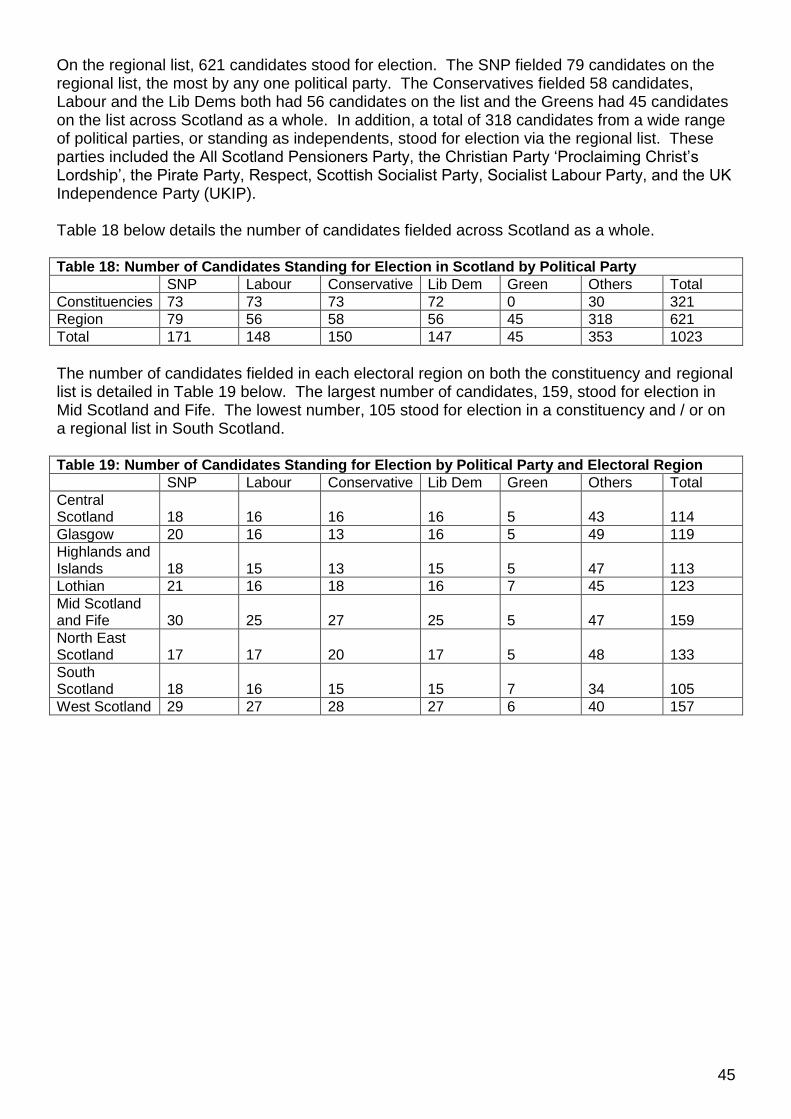
45
On the regional list, 621 candidates stood for election. The SNP fielded 79 candidates on the regional list, the most by any one political party. The Conservatives fielded 58 candidates, Labour and the Lib Dems both had 56 candidates on the list and the Greens had 45 candidates on the list across Scotland as a whole. In addition, a total of 318 candidates from a wide range of political parties, or standing as independents, stood for election via the regional list. These parties included the All Scotland Pensioners Party, the Christian Party „Proclaiming Christ‟s Lordship‟, the Pirate Party, Respect, Scottish Socialist Party, Socialist Labour Party, and the UK Independence Party (UKIP). Table 18 below details the number of candidates fielded across Scotland as a whole. Table 18: Number of Candidates Standing for Election in Scotland by Political Party
SNP Labour Conservative Lib Dem Green Others Total
Constituencies 73 73 73 72 0 30 321
Region 79 56 58 56 45 318 621
Total 171 148 150 147 45 353 1023
The number of candidates fielded in each electoral region on both the constituency and regional list is detailed in Table 19 below. The largest number of candidates, 159, stood for election in Mid Scotland and Fife. The lowest number, 105 stood for election in a constituency and / or on a regional list in South Scotland. Table 19: Number of Candidates Standing for Election by Political Party and Electoral Region
SNP Labour Conservative Lib Dem Green Others Total
Central Scotland 18 16 16 16 5 43 114
Glasgow 20 16 13 16 5 49 119
Highlands and Islands 18 15 13 15 5 47 113
Lothian 21 16 18 16 7 45 123
Mid Scotland and Fife 30 25 27 25 5 47 159
North East Scotland 17 17 20 17 5 48 133
South Scotland 18 16 15 15 7 34 105
West Scotland 29 27 28 27 6 40 157
46
SOURCES
BBC Scotland Election homepage. Available at: http://www.bbc.co.uk/news/scotland/scotland_politics/
BBC Scotland election poll shows Scots‟ top priorities. Available at: http://www.bbc.co.uk/news/uk-scotland-scotland-politics-13029253
Centre for Public Policy for Regions (CPPR). 2011. Manifesto costings: What each party is proposing and how they intend to pay for it. Glasgow: University of Glasgow. Available at: http://www.cppr.ac.uk/media/media_196441_en.pdf
Daily Record, 5 May 2011, Holyrood election 2011: Result on a knife edge with Labour closing in on the SNP. Available at: http://www.dailyrecord.co.uk/news/politics-news/2011/05/05/holyrood-election-2011-result-on-a-knife-edge-with-labour-breathing-down-alex-salmond-s-neck-86908-23108176/
Denver, D (2010) The New Scottish Parliament Constituencies 2011 BBC Scotland: Glasgow. Available at: http://news.bbc.co.uk/1/shared/bsp/hi/pdfs/08_09_10_boundaryreport.pdf Herald, 4 April 2011, SNP takes the lead for the first time in latest election poll. Available at: http://www.heraldscotland.com/news/politics/snp-takes-the-lead-for-first-time-in-latest-election-poll-1.1094342 Herald, 21 April 2011, New poll puts SNP within reach of Holyrood majority. Available at: http://www.heraldscotland.com/news/home-news/2011-new-poll-puts-snp-within-reach-of-holyrood-majority-1.1097321 Herald, 5 May 2011, The great unknowns, Labour claims two million undecided voters hold the key to today’s Holyrood election. Available at: http://www.heraldscotland.com/news/election/the-great-unknowns-1.1099629 Newsnight Scotland. 4 May 2011.
Scottish Government. 2011. Report of the Independent Budget Review. Edinburgh: Scottish Government. Available at: http://www.scotland.gov.uk/About/IndependentBudgetReview
Scotland on Sunday, 17 April 2011, Alex Salmond in poll position as SNP surge. Available at: http://scotlandonsunday.scotsman.com/news/Alex-Salmond-in-poll-position.6753202.jp Scotsman, 30 March 2011, Greens to drive Lib Dems into fifth place. Available at: http://news.scotsman.com/news/Greens-to-drive-Lib-Dems.6742709.jp Scotsman, 28 April 2011, Poll of polls puts Nationalists on way to a decisive victory. Available at: http://thescotsman.scotsman.com/politics/Poll-of-polls-puts-Nationalists.6758981.jp Scotsman, 4 May 2011, Alex Salmond deserves a second term. Available at: http://thescotsman.scotsman.com/news/Alex-Salmond-deserves-a-second.6762116.jp
47
Scotsman, 5 May 2011, Polls: It will be very surprising if Alex Salmond does not win. Available at: http://thescotsman.scotsman.com/scotland/Polls-39It-will-be-very.6762720.jp Scotland on Sunday, 1 May 2011, Scottish Election 2011: Labour slashes SNP election lead. Available at: http://scotlandonsunday.scotsman.com/news/Scottish-Election-2011-Labour-slashes.6760526.jp Scotland on Sunday, 1 May 2011, John Curtice: Crumbs of comfort for Labour but polls show Salmond in driving seat. Available at: http://news.scotsman.com/politics/John-Curtice-Crumbs-of-comfort.6760478.jp
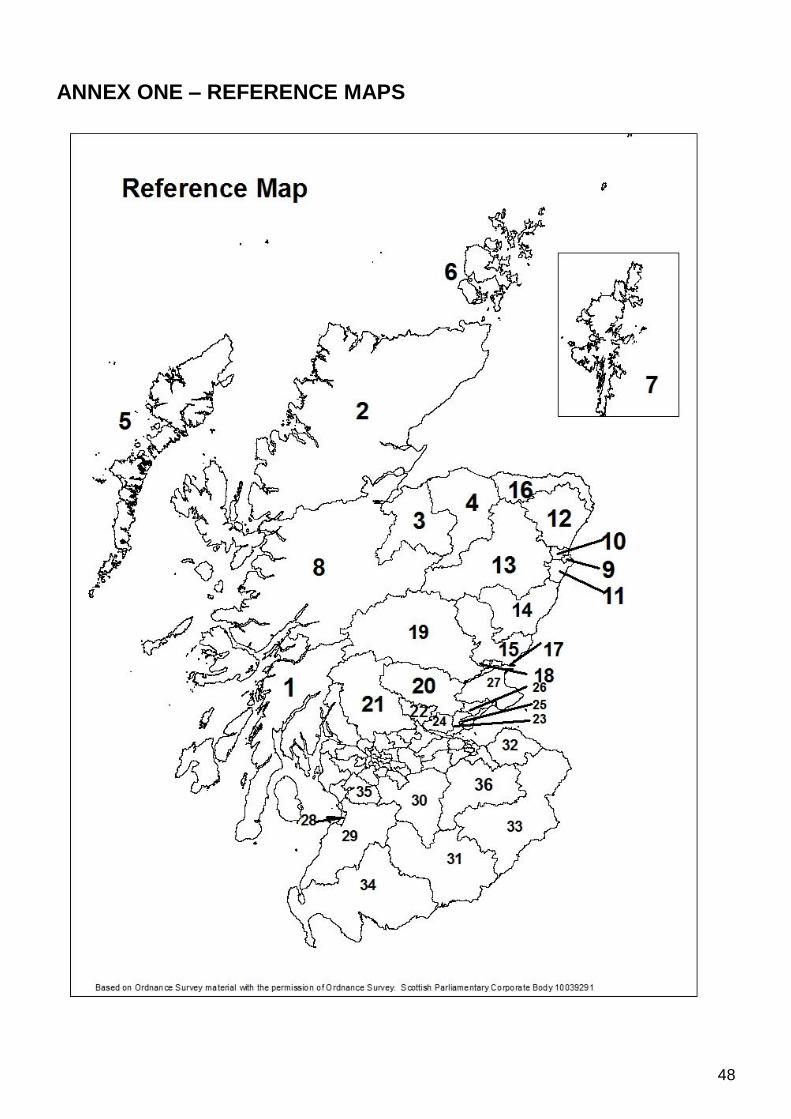
48
ANNEX ONE – REFERENCE MAPS
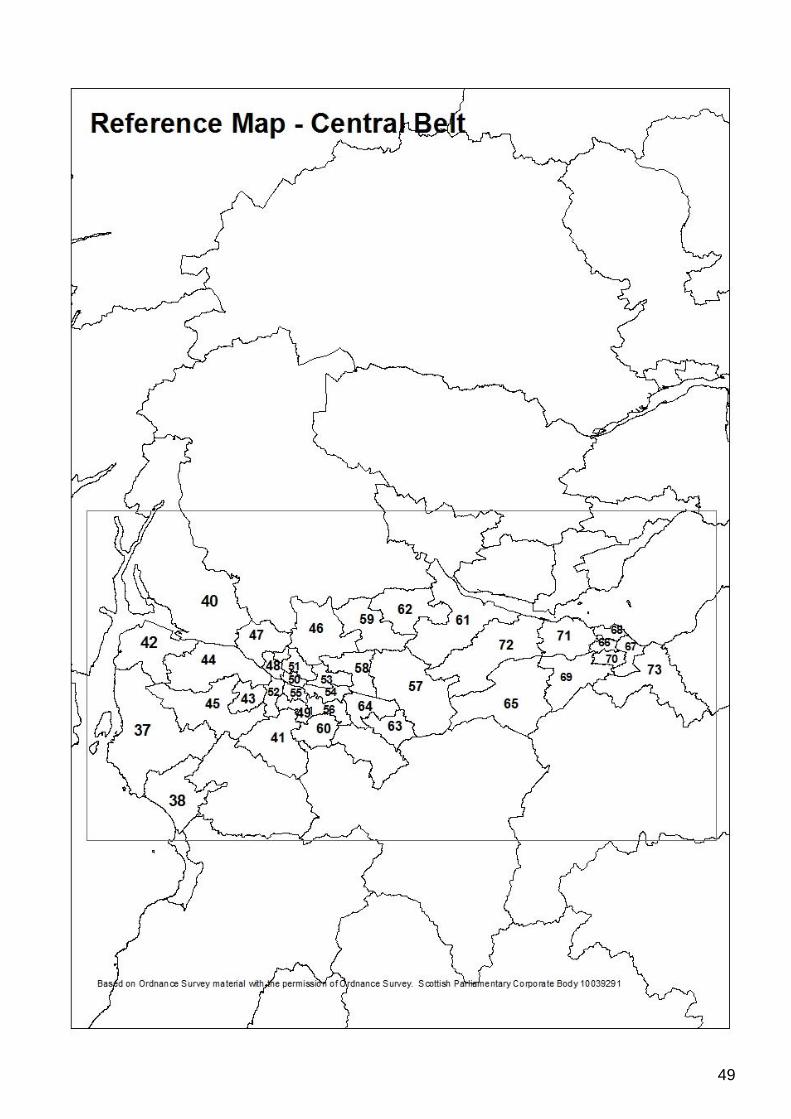
49
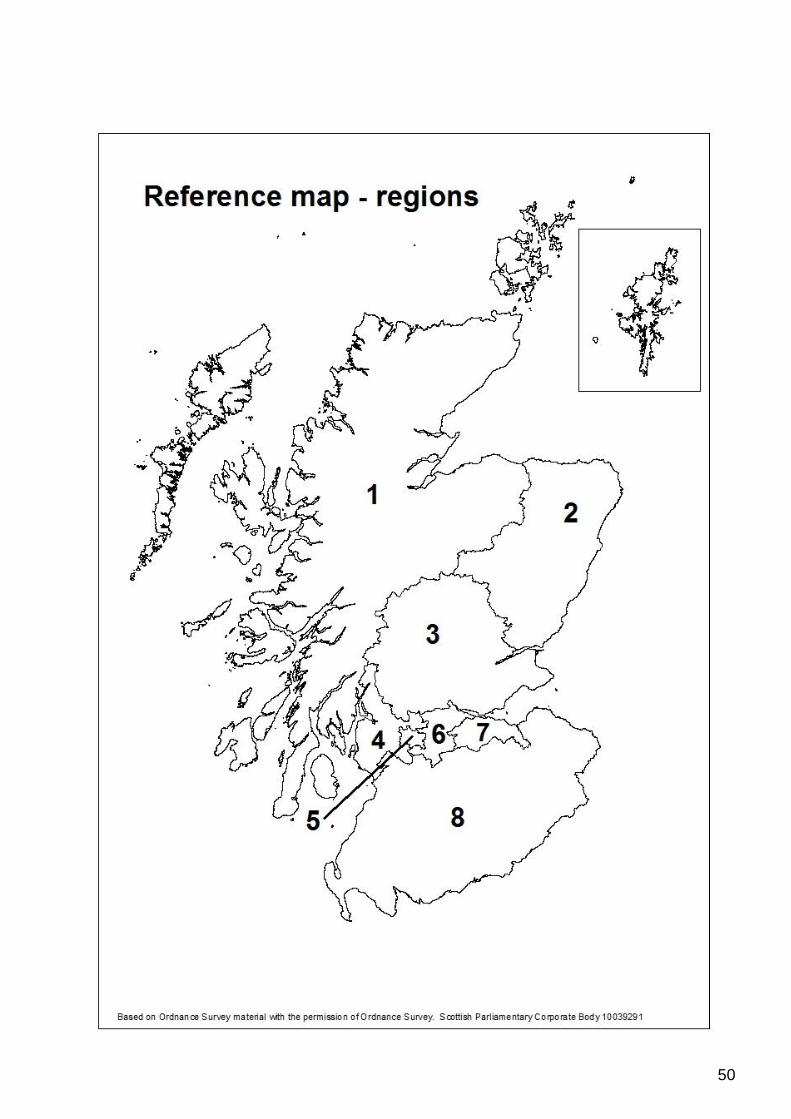
50
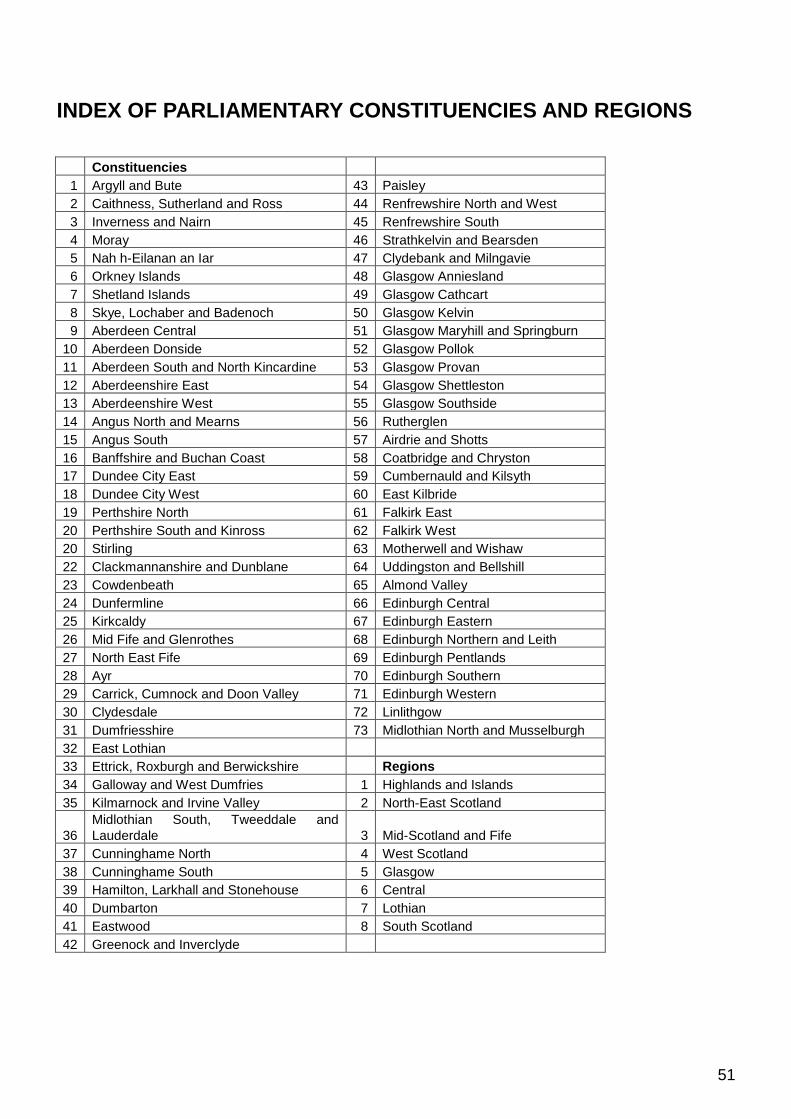
51
INDEX OF PARLIAMENTARY CONSTITUENCIES AND REGIONS
Constituencies
1 Argyll and Bute 43 Paisley
2 Caithness, Sutherland and Ross 44 Renfrewshire North and West
3 Inverness and Nairn 45 Renfrewshire South
4 Moray 46 Strathkelvin and Bearsden
5 Nah h-Eilanan an Iar 47 Clydebank and Milngavie
6 Orkney Islands 48 Glasgow Anniesland
7 Shetland Islands 49 Glasgow Cathcart
8 Skye, Lochaber and Badenoch 50 Glasgow Kelvin
9 Aberdeen Central 51 Glasgow Maryhill and Springburn
10 Aberdeen Donside 52 Glasgow Pollok
11 Aberdeen South and North Kincardine 53 Glasgow Provan
12 Aberdeenshire East 54 Glasgow Shettleston
13 Aberdeenshire West 55 Glasgow Southside
14 Angus North and Mearns 56 Rutherglen
15 Angus South 57 Airdrie and Shotts
16 Banffshire and Buchan Coast 58 Coatbridge and Chryston
17 Dundee City East 59 Cumbernauld and Kilsyth
18 Dundee City West 60 East Kilbride
19 Perthshire North 61 Falkirk East
20 Perthshire South and Kinross 62 Falkirk West
20 Stirling 63 Motherwell and Wishaw
22 Clackmannanshire and Dunblane 64 Uddingston and Bellshill
23 Cowdenbeath 65 Almond Valley
24 Dunfermline 66 Edinburgh Central
25 Kirkcaldy 67 Edinburgh Eastern
26 Mid Fife and Glenrothes 68 Edinburgh Northern and Leith
27 North East Fife 69 Edinburgh Pentlands
28 Ayr 70 Edinburgh Southern
29 Carrick, Cumnock and Doon Valley 71 Edinburgh Western
30 Clydesdale 72 Linlithgow
31 Dumfriesshire 73 Midlothian North and Musselburgh
32 East Lothian
33 Ettrick, Roxburgh and Berwickshire Regions
34 Galloway and West Dumfries 1 Highlands and Islands
35 Kilmarnock and Irvine Valley 2 North-East Scotland
36
Midlothian South, Tweeddale and
Lauderdale 3 Mid-Scotland and Fife
37 Cunninghame North 4 West Scotland
38 Cunninghame South 5 Glasgow
39 Hamilton, Larkhall and Stonehouse 6 Central
40 Dumbarton 7 Lothian
41 Eastwood 8 South Scotland
42 Greenock and Inverclyde
52
Scottish Parliament Information Centre (SPICe) Briefings are compiled for the benefit of the Members of the Parliament and their personal staff. Authors are available to discuss the contents of these papers with MSPs and their staff who should contact Stephen Herbert on extension 85373 or email [email protected]. Members of the public or external organisations may comment on this briefing by emailing us at [email protected]. However, researchers are unable to enter into personal discussion in relation to SPICe Briefing Papers. If you have any general questions about the work of the Parliament you can email the Parliament‟s Public Information Service at [email protected].
Every effort is made to ensure that the information contained in SPICe briefings is correct at the time of publication. Readers should be aware however that briefings are not necessarily updated or otherwise amended to reflect subsequent changes.
www.scottish.parliament.uk