spice briefing : obesity in scotland - scottish · pdf filehe scottish parliament and scottish...
TRANSCRIPT
he Scottish Parliament and Scottish Parliament Infor mation C entre l ogos .
SPICe Briefing
Obesity in Scotland 7 January 2015
15/01
Andrew Castle
This briefing considers the sizeable health and economic burden attributable to obesity in Scotland. It also covers the actions taken by the Scottish Government, and the health care interventions being used to tackle the issue.
2
CONTENTS
EXECUTIVE SUMMARY .............................................................................................................................................. 4
ABBREVIATIONS ........................................................................................................................................................ 6
GLOSSARY .................................................................................................................................................................. 7
INTRODUCTION .......................................................................................................................................................... 8
EXPLANATORY NOTE ON HEALTH CARE GUIDELINES .................................................................................... 8
THE OBESITY PROBLEM ........................................................................................................................................... 8
DIAGNOSIS OF OVERWEIGHT AND OBESITY .................................................................................................... 9 Body Mass Index .................................................................................................................................................. 9 Waist circumference ............................................................................................................................................. 9 Diagnosis in children .......................................................................................................................................... 10
WHY DO PEOPLE PUT ON WEIGHT? ................................................................................................................. 10 EFFECTS OF SOCIOECONOMIC STATUS ......................................................................................................... 11 HEALTH CONSEQUENCES OF OBESITY ........................................................................................................... 13 USE OF NHS RESOURCES .................................................................................................................................. 14
GP consultations ................................................................................................................................................ 14 Hospital bed days ............................................................................................................................................... 14
HEALTH BENEFITS ASSOCIATED WITH WEIGHT LOSS .................................................................................. 15
EPIDEMIOLOGY ........................................................................................................................................................ 15
OVERWEIGHT AND OBESITY TRENDS IN SCOTLAND .................................................................................... 15 Adult population ................................................................................................................................................. 15 Child population ................................................................................................................................................. 17 Regional variation .............................................................................................................................................. 18
SCOTLAND COMPARED WITH THE REST OF THE UK..................................................................................... 18 INTERNATIONAL COMPARISONS....................................................................................................................... 19
ECONOMIC COSTS ................................................................................................................................................... 20
HEALTH CARE COSTS ......................................................................................................................................... 21 RELATIVE HEALTH CARE COSTS ...................................................................................................................... 22 OTHER ECONOMIC COSTS ................................................................................................................................. 22
POLICY ....................................................................................................................................................................... 23
PREVENTION OF OBESITY ROUTE MAP ........................................................................................................... 23 Action Plan ......................................................................................................................................................... 24
ASSESSING PEFORMANCE OF POLICIES ............................................................................................................ 26
NATIONAL PERFORMANCE FRAMEWORK ....................................................................................................... 26 QUALITY MEASUREMENT FRAMEWORK .......................................................................................................... 26
Level 1: High Level Indicators ............................................................................................................................ 26 Level 2: NHS Performance Targets ................................................................................................................... 27 Level 3: Local Performance Measures or Indicators ......................................................................................... 28
PREVENTION OF OBESITY ROUTE MAP: ANALYTIC FRAMEWORK .............................................................. 28 Prevention of Obesity Route Map: Indicators .................................................................................................... 29
MANAGEMENT AND TREATMENT.......................................................................................................................... 29
WEIGHT MANAGEMENT PROGRAMMES ........................................................................................................... 30 Adult Programmes ............................................................................................................................................. 30 Child Programmes ............................................................................................................................................. 30 Clinical Effectiveness ......................................................................................................................................... 31 Cost Effectiveness ............................................................................................................................................. 31 Examples of Weight Management Programmes ............................................................................................... 31
PHARMACOLOGICAL MANAGEMENT ................................................................................................................ 32 Clinical Effectiveness ......................................................................................................................................... 33 Cost Effectiveness ............................................................................................................................................. 33

3
BARIATRIC SURGERY ......................................................................................................................................... 33 Clinical Effectiveness ......................................................................................................................................... 33 Cost Effectiveness ............................................................................................................................................. 34
SOURCES .................................................................................................................................................................. 35
APPENDIX 1: RELEVANT NPF NATIONAL INDICATORS................................................................................... 45 APPENDIX 2: PREVENTION OF OBESITY ROUTE MAP INDICATORS ............................................................ 46
4
EXECUTIVE SUMMARY
The Obesity Problem
Societal changes and technological developments over recent decades have created an environment that makes it hard to maintain a healthy weight.
In developed countries, lower socioeconomic status tends to be associated with higher levels of obesity. In Scotland this appears to be the case for children and adult women, although possibly not for adult men.
Being obese or, to a lesser degree, overweight increases a person’s risk of developing other conditions requiring expensive, long-term management. These include type II diabetes, high blood pressure and cardiovascular diseases.
Epidemiology1
Following significant increases between 1995 and 2008, adult overweight and obesity rates in Scotland have since stabilised, although the prevalence of raised waist circumference among women is still increasing.
Similar proportions of Scottish children were within the healthy weight range in 2013 as were in 1998, although there have been sizeable fluctuations during the intervening years.
International comparisons indicate that Scotland has above average levels of adult overweight and obesity.
Economic Costs
The annual cost to NHS Scotland of overweight and obesity combined may be as much as £600 million.
Average health care costs for people with a body mass index (BMI) of 40 (severe obesity) are estimated to be at least twice those for people with a BMI of 20 (within normal weight range).
Estimates of the total economic costs of obesity to Scotland range from £0.9 billion to £4.6 billion per year.
Key Policy
The Scottish Government’s overarching strategy for tackling obesity is the Prevention of Obesity Route Map, which was published in 2010. Its ultimate goal is to create an environment that supports people to adopt a healthy lifestyle.
1 See the glossary for a definition.
5
The action plan for the Route Map has been organised around four themes: reducing energy intake, increasing energy expenditure, early years, and working lives.
Assessing Performance of Policies
High level assessment of the impact of health policies is carried out via the National Performance Framework and the Quality Measurement Framework for NHS Scotland.
Progress towards the desired outcomes of the Route Map is also measured directly through its analytical framework. The long-term goals are as follows:
1) That the majority of Scotland’s adult population are within the normal weight range throughout life.
2) That fewer children in Scotland are overweight or obese.
3) Reducing mortality from obesity-related disease (specifically focuses on type II diabetes)
Although type II diabetes is still increasing in prevalence, the lack of recent increases in overweight and obesity rates is a positive sign.
There has also been limited progress towards some of the short- and intermediate-term desired outcomes of the Route Map, particularly with regards to physical and sedentary activity levels in both adults and children.
Management and Treatment
First line therapy for most overweight or obese people is a weight management programme, consisting of physical activity, dietary change and behavioural interventions.
If specific criteria are met then drug therapy can be used in combination with a weight management programme. The only drug specifically licenced for this purpose in Scotland is orlistat, which inhibits absorption of dietary fat within the digestive system.
As a last resort, bariatric surgery (gastric bypass, gastric banding etc.) can be considered for obese patients with a BMI greater than or equal to 35 who have other severe health issues.
All the above interventions are probably cost effective, although this is difficult to confirm because studies rarely follow patients for long enough to assess long-term weight loss maintenance.
6
ABBREVIATIONS
BMI Body Mass Index
CHW Child Healthy Weight
FFIT Football Fans in Training
GDP Gross domestic product
HEAT Health improvement, Efficiency and governance, Access and Treatment
HBSC Health behaviours in school-aged children
HDI Human Development Index
HLA HealthyLiving Award
ISD SCOTLAND Information Services Division Scotland
NICE National Institute for Health and Care Excellence NME Non-milk extrinsic NPF National Performance Framework OECD Organisation for Economic Co-operation and Development PN Practice Nurse PTI Practice Team Information QALY Quality-adjusted life year Route Map Prevention of Obesity Route Map SAEs Serious adverse events SES Socioeconomic status SHeS Scottish Health Survey SHTG Scottish Health Technologies Group SIGN Scottish Intercollegiate Guidance Network SIMD Scottish Index of Multiple Deprivation SMC Scottish Medicines Consortium WC Waist circumference WHO World Health Organization
7
GLOSSARY
≥ Greater than or equal to ≤ Less than or equal to Centile (or percentile) If a dataset ordered from lowest to highest values is split
into 100 equally sized groups, then each group is a centile. For example, 25% of the values are higher than the 75th centile.
Comorbidities Additional health disorder(s) occurring concurrently with
a primary disorder. See the section on the health consequences of obesity for more information on obesity-related comorbidities.
Control group See “Randomised control trial”. Epidemiology The study of how often diseases occur in defined
populations and why Human Development Index (HDI) A measure of a country’s achievement in three key areas
of human development: health, education and living standards
Hypertension High blood pressure Lipases Proteins involved in fat digestion Macronutrients Energy-providing food components that are consumed in
large quantities i.e. proteins, carbohydrates, fats Millennium Cohort Study Periodic surveys tracking the lives of around 19000 UK
children born in 2000/2001 Obesogenic environment An environment that encourages people to adopt an
unhealthy lifestyle, ultimately leading to weight gain Overweight (as a noun) In medical literature, overweight is commonly used as
both an adjective and a noun. It is used as such throughout this briefing.
Quintile If a dataset ordered from lowest to highest values is split
into five equally sized groups, then each group is a quintile. For example, quintile 5 is the top 20% of the values.
Randomised control trial A study in which participants are randomly assigned to
two (or more) groups to test a drug or treatment. The experimental group receives the treatment being tested, while a control/comparison group receives either an alternative treatment, a dummy treatment (placebo), or no treatment.
8
INTRODUCTION
The high prevalence of obesity is a major issue facing most developed countries, and Scotland is no exception. Being obese increases a person’s risk of developing conditions requiring expensive, long-term management, such as type II diabetes and cardiovascular diseases. Additionally, there are significant, indirect economic costs arising from increased sickness absence and premature mortality. It is for these reasons that many governments have now made tackling the issue a priority. This briefing begins by outlining the extent of the obesity problem, including the health consequences, epidemiology and economic costs. The second half of the briefing covers the policy and health care interventions that are in place to prevent, manage and treat obesity among the Scottish population. To constrain its length, the briefing has been restricted largely to the areas listed above. Topics not described in detail here include the factors influencing an individual’s risk of becoming obese and policy specifically relating to diet and nutrition. Where necessary, certain specialist terms are used in this briefing. In such cases, hyperlinks from the text to the glossary on page 5 are provided. Hyperlinked words are highlighted in dark green to differentiate them from hyperlinks to online documents or other sections of the briefing (in blue).
EXPLANATORY NOTE ON HEALTH CARE GUIDELINES
In the text of the briefing, references are made to clinical and public health guidelines issued by various organisations, including the National Institute for Health and Care Excellence (NICE), the Scottish Intercollegiate Guidance Network (SIGN) and the Scottish Health Technologies Group (SHTG). The Healthcare Improvement Scotland website explains how guidance issued by these organisations, and others, affects NHS Scotland.
Briefly, SIGN was set up in 1993 to produce clinical guidelines for NHS Scotland, and “to facilitate their implementation into local practice for the benefit of patients” (SIGN, 2012). In addition, the Scottish Medicines Consortium (SMC) and SHTG issue guidance on new medicines and technologies, respectively. All these organisations are part of Healthcare Improvement Scotland.
NICE was created in 1999 and, as of 2013, is now a Non Departmental Public Body. NICE is accountable to the Department of Health of the UK Government but is operationally independent (NICE, 2014). NICE fulfils a similar role to SIGN for England, and the relationship between the organisations is described on the SIGN website. However, NICE also produces other guidance on the topics of public health, social care, medicines, technology appraisals, and more. Although most NICE guidelines have no formal basis in Scotland, Healthcare Improvement Scotland does issue advice on how they may apply.
THE OBESITY PROBLEM
The World Health Organization (WHO) defines overweight and obesity as “abnormal or excessive fat accumulation that presents a risk to health'' (WHO, 2014). In simple terms, fat accumulation occurs when someone consistently consumes more calories than they expend through physical activity. The factors influencing the risk of weight gain are numerous and are summarised in the section on why do people put on weight. The following sections cover how overweight and obesity can be diagnosed using simple body measurements.
9
DIAGNOSIS OF OVERWEIGHT AND OBESITY
Body Mass Index
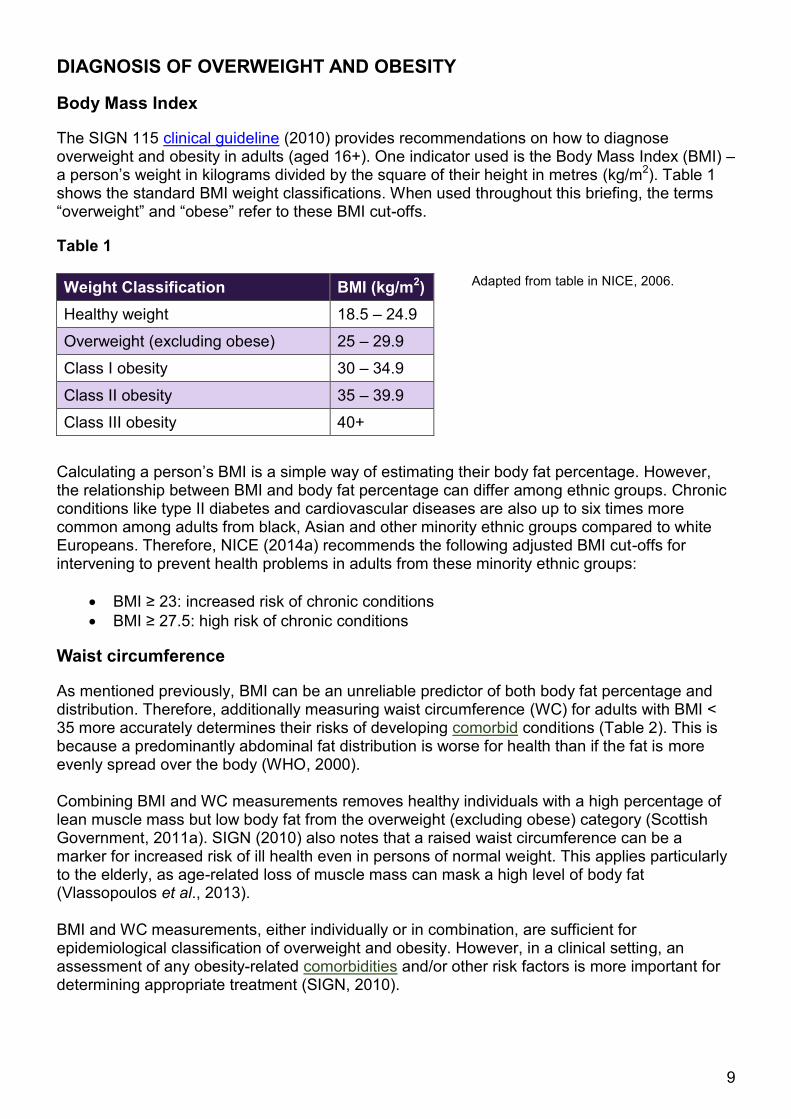
The SIGN 115 clinical guideline (2010) provides recommendations on how to diagnose overweight and obesity in adults (aged 16+). One indicator used is the Body Mass Index (BMI) – a person’s weight in kilograms divided by the square of their height in metres (kg/m2). Table 1 shows the standard BMI weight classifications. When used throughout this briefing, the terms “overweight” and “obese” refer to these BMI cut-offs.
Table 1
Adapted from table in NICE, 2006.
Calculating a person’s BMI is a simple way of estimating their body fat percentage. However, the relationship between BMI and body fat percentage can differ among ethnic groups. Chronic conditions like type II diabetes and cardiovascular diseases are also up to six times more common among adults from black, Asian and other minority ethnic groups compared to white Europeans. Therefore, NICE (2014a) recommends the following adjusted BMI cut-offs for intervening to prevent health problems in adults from these minority ethnic groups:
BMI ≥ 23: increased risk of chronic conditions
BMI ≥ 27.5: high risk of chronic conditions
Waist circumference
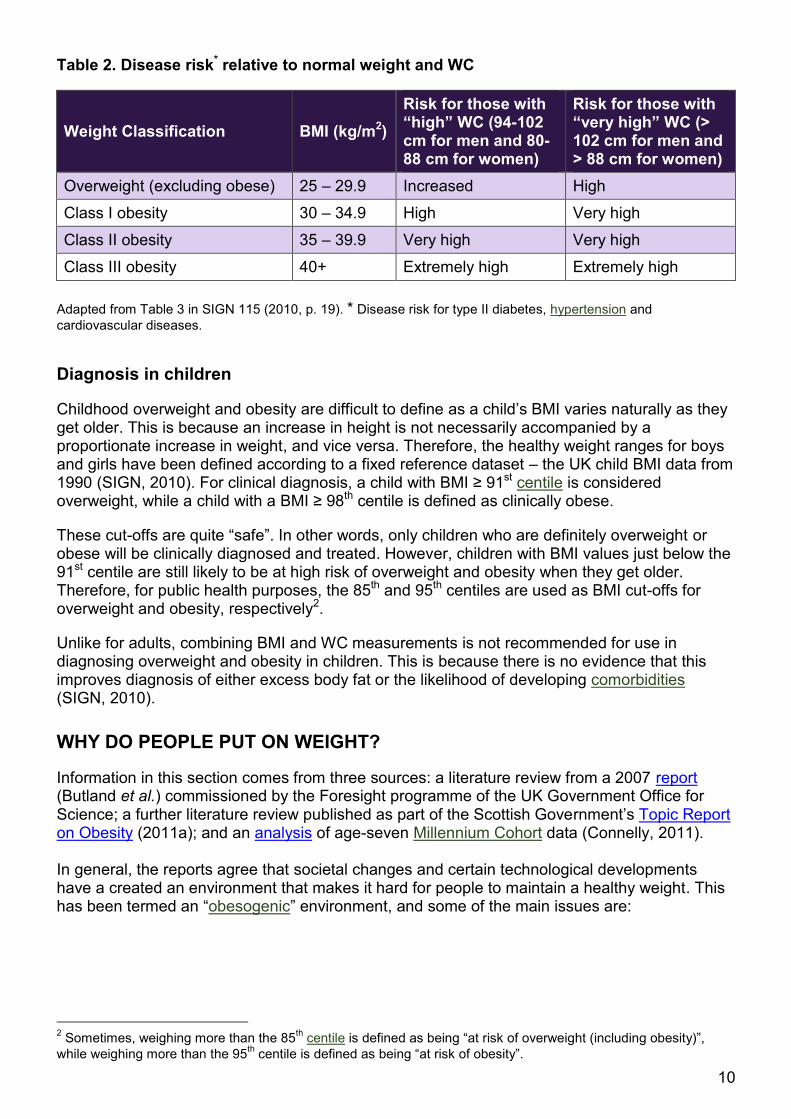
As mentioned previously, BMI can be an unreliable predictor of both body fat percentage and distribution. Therefore, additionally measuring waist circumference (WC) for adults with BMI < 35 more accurately determines their risks of developing comorbid conditions (Table 2). This is because a predominantly abdominal fat distribution is worse for health than if the fat is more evenly spread over the body (WHO, 2000). Combining BMI and WC measurements removes healthy individuals with a high percentage of lean muscle mass but low body fat from the overweight (excluding obese) category (Scottish Government, 2011a). SIGN (2010) also notes that a raised waist circumference can be a marker for increased risk of ill health even in persons of normal weight. This applies particularly to the elderly, as age-related loss of muscle mass can mask a high level of body fat (Vlassopoulos et al., 2013). BMI and WC measurements, either individually or in combination, are sufficient for epidemiological classification of overweight and obesity. However, in a clinical setting, an assessment of any obesity-related comorbidities and/or other risk factors is more important for determining appropriate treatment (SIGN, 2010).
Weight Classification BMI (kg/m2)
Healthy weight 18.5 – 24.9
Overweight (excluding obese) 25 – 29.9
Class I obesity 30 – 34.9
Class II obesity 35 – 39.9
Class III obesity 40+
10
Table 2. Disease risk* relative to normal weight and WC
Weight Classification BMI (kg/m2)
Risk for those with “high” WC (94-102 cm for men and 80-88 cm for women)
Risk for those with “very high” WC (> 102 cm for men and > 88 cm for women)
Overweight (excluding obese) 25 – 29.9 Increased High
Class I obesity 30 – 34.9 High Very high
Class II obesity 35 – 39.9 Very high Very high
Class III obesity 40+ Extremely high Extremely high
Adapted from Table 3 in SIGN 115 (2010, p. 19). * Disease risk for type II diabetes, hypertension and
cardiovascular diseases.
Diagnosis in children
Childhood overweight and obesity are difficult to define as a child’s BMI varies naturally as they get older. This is because an increase in height is not necessarily accompanied by a proportionate increase in weight, and vice versa. Therefore, the healthy weight ranges for boys and girls have been defined according to a fixed reference dataset – the UK child BMI data from 1990 (SIGN, 2010). For clinical diagnosis, a child with BMI ≥ 91st centile is considered overweight, while a child with a BMI ≥ 98th centile is defined as clinically obese.
These cut-offs are quite “safe”. In other words, only children who are definitely overweight or obese will be clinically diagnosed and treated. However, children with BMI values just below the 91st centile are still likely to be at high risk of overweight and obesity when they get older. Therefore, for public health purposes, the 85th and 95th centiles are used as BMI cut-offs for overweight and obesity, respectively2.
Unlike for adults, combining BMI and WC measurements is not recommended for use in diagnosing overweight and obesity in children. This is because there is no evidence that this improves diagnosis of either excess body fat or the likelihood of developing comorbidities (SIGN, 2010).
WHY DO PEOPLE PUT ON WEIGHT?
Information in this section comes from three sources: a literature review from a 2007 report (Butland et al.) commissioned by the Foresight programme of the UK Government Office for Science; a further literature review published as part of the Scottish Government’s Topic Report on Obesity (2011a); and an analysis of age-seven Millennium Cohort data (Connelly, 2011). In general, the reports agree that societal changes and certain technological developments have a created an environment that makes it hard for people to maintain a healthy weight. This has been termed an “obesogenic” environment, and some of the main issues are:
2 Sometimes, weighing more than the 85
th centile is defined as being “at risk of overweight (including obesity)”,
while weighing more than the 95th centile is defined as being “at risk of obesity”.
11
However, these changes do not explain why some people gain weight while others do not. For this, we have to look at the control systems that should regulate a person’s energy balance i.e. energy intake from food and drink versus energy expenditure through physical activity. Butland et al. (2007) proposed four key variables that can affect control of this energy balance:
the level of primary appetite control in the brain
the force of dietary habits keeping individuals or groups from adopting healthier alternatives (or the opposite case i.e. habits that keep people making healthy choices)
the level of physical activity
the level of psychological ambivalence experienced by individuals, groups or organisations in making lifestyle choices
It appears that, while many people’s energy balance is tightly controlled, some people tend to consume more calories than they need. Interestingly, except when affected by diseases like cancer, it is very rare for people to consume fewer calories than they need. This bias makes sense from an evolutionary point of view, as a tendency to overeat can be beneficial when food is scarce. However, in the environment of the modern developed world, this trait can lead to unhealthy weight gain. The follow-on question is how these differences arise in people’s energy balance control systems. One significant factor seems to be the pattern of growth during early life. While this is clearly influenced by genetics, a mother’s diet during pregnancy and that of the child after birth are also important. For example, faster weight gain in early childhood seems to strongly enhance the risk of being obese in adulthood (Butland et al., 2007). This may explain why low birth weight has been tentatively linked to later obesity, as “catch-up growth” may accustom a child to overeating. Additionally, slower weight gain after birth may be why being breastfed has been associated with a reduced chance of being obese later in life. This link is controversial as Connelly (2011) reports that being formula-fed as a baby is not correlated with increased weight gain by age seven. However, breastfeeding is likely to help mothers lose weight after giving birth, as an estimated 330 calories per day are used in milk production (NICE, 2010). Further factors that may be associated with overweight and obesity include a heavy alcohol intake, mental health issues, and ethnicity. The connection with ethnicity is complicated, however, and is likely to be due to genetic, cultural and socioeconomic factors.
EFFECTS OF SOCIOECONOMIC STATUS
In countries with high human development index (HDI) values, like Scotland, lower socioeconomic status (SES) tends to be associated with higher levels of obesity. The reverse is
increased relative cheapness and availability of energy-dense and nutrient-poor foods and drinks
larger portion sizes
culture of skipping breakfast and other meals
more sedentary pastimes like watching TV and playing videogames
more sedentary jobs
longer working hours
more affordable car travel
12
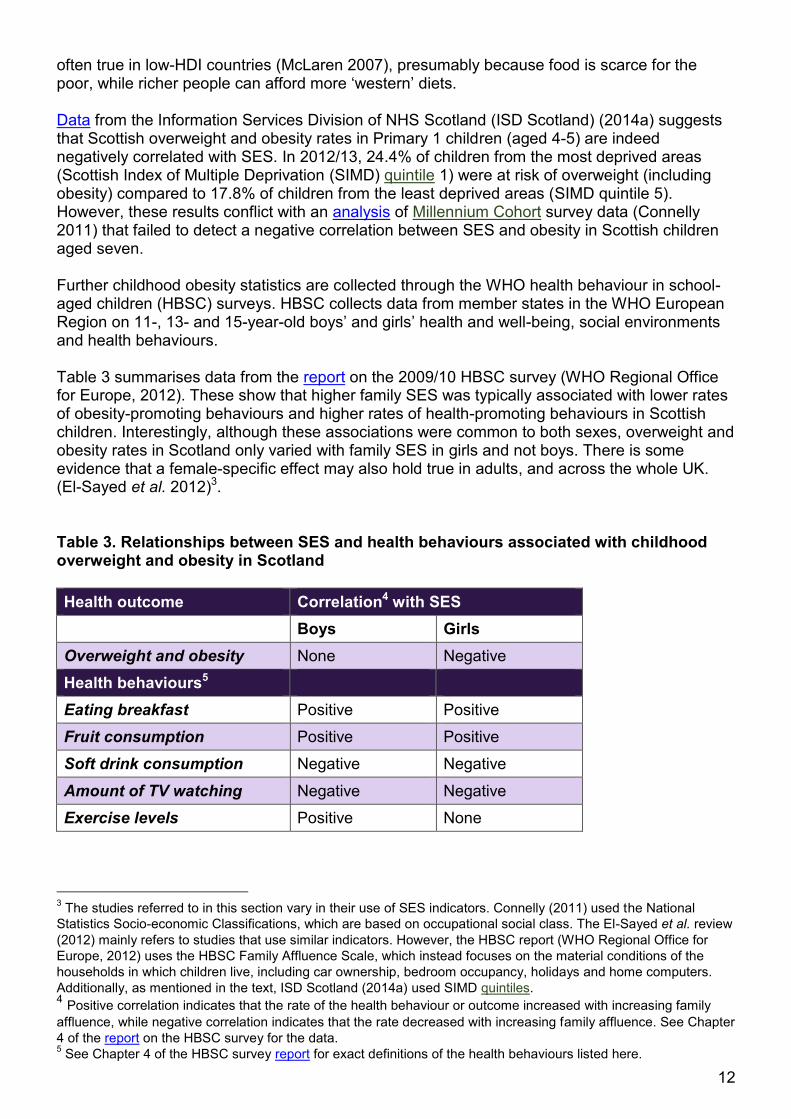
often true in low-HDI countries (McLaren 2007), presumably because food is scarce for the poor, while richer people can afford more ‘western’ diets. Data from the Information Services Division of NHS Scotland (ISD Scotland) (2014a) suggests that Scottish overweight and obesity rates in Primary 1 children (aged 4-5) are indeed negatively correlated with SES. In 2012/13, 24.4% of children from the most deprived areas (Scottish Index of Multiple Deprivation (SIMD) quintile 1) were at risk of overweight (including obesity) compared to 17.8% of children from the least deprived areas (SIMD quintile 5). However, these results conflict with an analysis of Millennium Cohort survey data (Connelly 2011) that failed to detect a negative correlation between SES and obesity in Scottish children aged seven. Further childhood obesity statistics are collected through the WHO health behaviour in school-aged children (HBSC) surveys. HBSC collects data from member states in the WHO European Region on 11-, 13- and 15-year-old boys’ and girls’ health and well-being, social environments and health behaviours. Table 3 summarises data from the report on the 2009/10 HBSC survey (WHO Regional Office for Europe, 2012). These show that higher family SES was typically associated with lower rates of obesity-promoting behaviours and higher rates of health-promoting behaviours in Scottish children. Interestingly, although these associations were common to both sexes, overweight and obesity rates in Scotland only varied with family SES in girls and not boys. There is some evidence that a female-specific effect may also hold true in adults, and across the whole UK. (El-Sayed et al. 2012)3. Table 3. Relationships between SES and health behaviours associated with childhood overweight and obesity in Scotland
Health outcome Correlation4 with SES
Boys Girls
Overweight and obesity None Negative
Health behaviours5
Eating breakfast Positive Positive
Fruit consumption Positive Positive
Soft drink consumption Negative Negative
Amount of TV watching Negative Negative
Exercise levels Positive None
3 The studies referred to in this section vary in their use of SES indicators. Connelly (2011) used the National
Statistics Socio-economic Classifications, which are based on occupational social class. The El-Sayed et al. review
(2012) mainly refers to studies that use similar indicators. However, the HBSC report (WHO Regional Office for
Europe, 2012) uses the HBSC Family Affluence Scale, which instead focuses on the material conditions of the
households in which children live, including car ownership, bedroom occupancy, holidays and home computers.
Additionally, as mentioned in the text, ISD Scotland (2014a) used SIMD quintiles. 4 Positive correlation indicates that the rate of the health behaviour or outcome increased with increasing family
affluence, while negative correlation indicates that the rate decreased with increasing family affluence. See Chapter
4 of the report on the HBSC survey for the data. 5 See Chapter 4 of the HBSC survey report for exact definitions of the health behaviours listed here.
13
It may be that a child’s risk of becoming obese is more dependent on parental education level than SES itself. For example, Connelly (2011) found that if one or both of a child’s parents had a university degree then that child was less likely to be overweight or obese. Additionally, El-Sayed et al. (2012) reported that much of the association between SES and childhood obesity was related to the education levels of the parents. An important question is whether socioeconomic inequalities in obesity rates are widening or narrowing. McLaren (2007) argues that they may be narrowing, because the modern environment probably makes it harder for everyone, regardless of SES, to maintain a healthy weight. Contrastingly, Connelly (2011) reports on a study that used recent Health Survey for England data to show that unhealthy weight was becoming more common in children from low SES families but less common in children from high SES families.
HEALTH CONSEQUENCES OF OBESITY
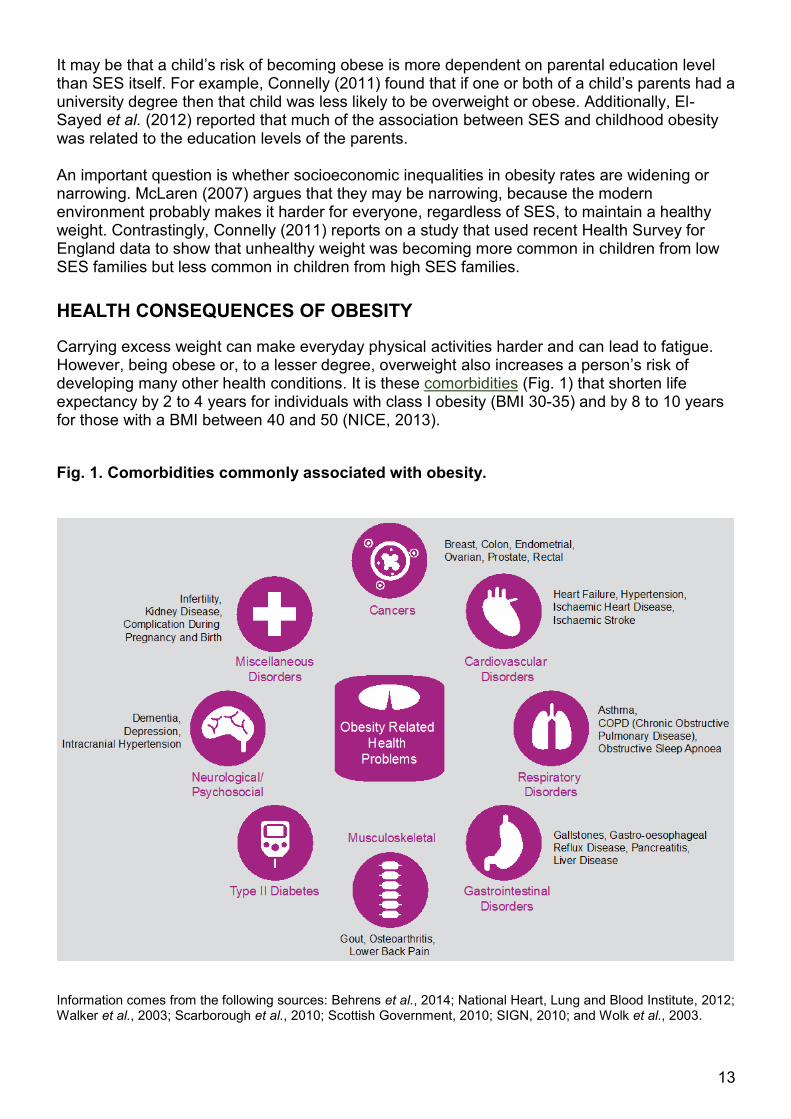
Carrying excess weight can make everyday physical activities harder and can lead to fatigue. However, being obese or, to a lesser degree, overweight also increases a person’s risk of developing many other health conditions. It is these comorbidities (Fig. 1) that shorten life expectancy by 2 to 4 years for individuals with class I obesity (BMI 30-35) and by 8 to 10 years for those with a BMI between 40 and 50 (NICE, 2013).
Fig. 1. Comorbidities commonly associated with obesity.
Information comes from the following sources: Behrens et al., 2014; National Heart, Lung and Blood Institute, 2012; Walker et al., 2003; Scarborough et al., 2010; Scottish Government, 2010; SIGN, 2010; and Wolk et al., 2003.
14
USE OF NHS RESOURCES
The previous section described the vast array of conditions linked to obesity, many of which require long-term treatment. This section highlights the enormous burden that this places on all parts of the health service.
GP consultations
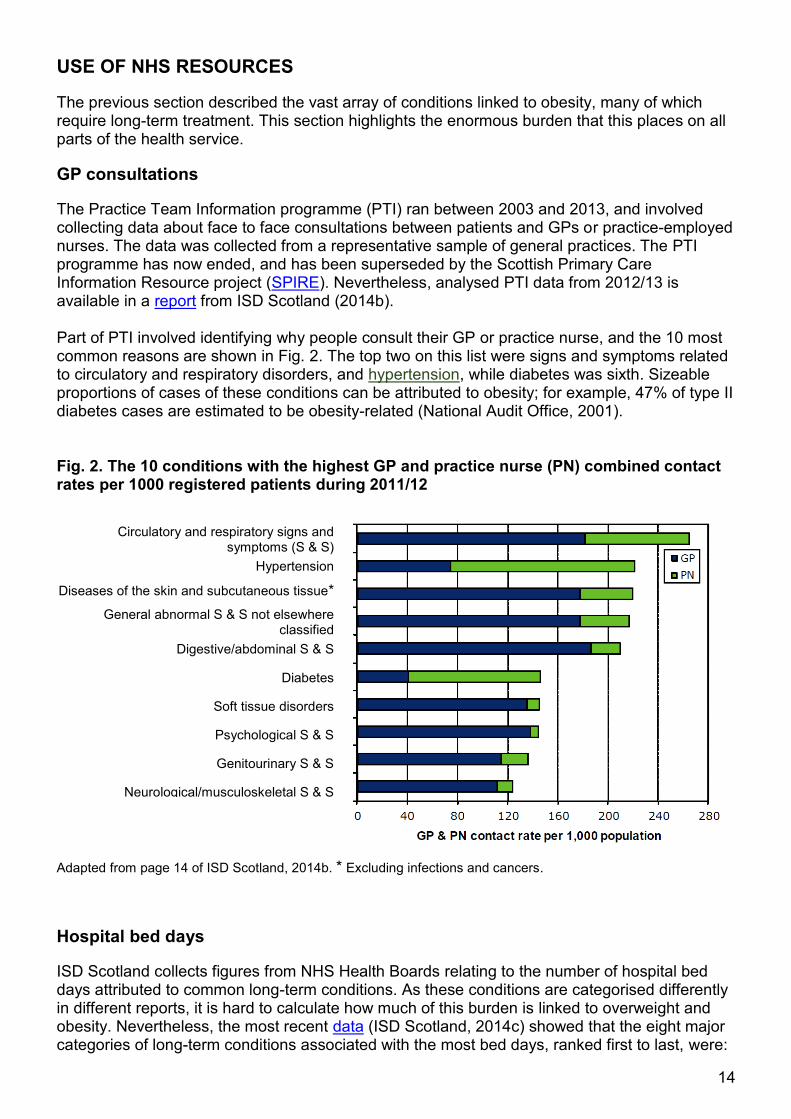
The Practice Team Information programme (PTI) ran between 2003 and 2013, and involved collecting data about face to face consultations between patients and GPs or practice-employed nurses. The data was collected from a representative sample of general practices. The PTI programme has now ended, and has been superseded by the Scottish Primary Care Information Resource project (SPIRE). Nevertheless, analysed PTI data from 2012/13 is available in a report from ISD Scotland (2014b). Part of PTI involved identifying why people consult their GP or practice nurse, and the 10 most common reasons are shown in Fig. 2. The top two on this list were signs and symptoms related to circulatory and respiratory disorders, and hypertension, while diabetes was sixth. Sizeable proportions of cases of these conditions can be attributed to obesity; for example, 47% of type II diabetes cases are estimated to be obesity-related (National Audit Office, 2001). Fig. 2. The 10 conditions with the highest GP and practice nurse (PN) combined contact rates per 1000 registered patients during 2011/12
Adapted from page 14 of ISD Scotland, 2014b. * Excluding infections and cancers.
Hospital bed days
ISD Scotland collects figures from NHS Health Boards relating to the number of hospital bed days attributed to common long-term conditions. As these conditions are categorised differently in different reports, it is hard to calculate how much of this burden is linked to overweight and obesity. Nevertheless, the most recent data (ISD Scotland, 2014c) showed that the eight major categories of long-term conditions associated with the most bed days, ranked first to last, were:
Circulatory and respiratory signs and
symptoms (S & S)
Hypertension
Diseases of the skin and subcutaneous tissue*
General abnormal S & S not elsewhere classified
Digestive/abdominal S & S
Diabetes
Soft tissue disorders
Psychological S & S
Genitourinary S & S
Neurological/musculoskeletal S & S
15
chronic obstructive pulmonary disease (COPD), heart failure, acute myocardial infarction (heart attack), diabetes, other ischaemic heart disease, asthma, angina pectoris and hypertension. All these conditions are known comorbidities of obesity.
HEALTH BENEFITS ASSOCIATED WITH WEIGHT LOSS
The health benefits of moderate, sustained weight loss (defined as 5-10 kg or 5-10% after one year) were recently reviewed in the Management of Obesity clinical guideline issued by SIGN (2010). This degree of weight loss reduced mortality from all causes as well as mortality linked to cancer and type II diabetes. Additional health benefits included:
improved lung function for asthma sufferers
reduced osteoarthritis-related disability
reduced blood pressure
improved blood sugar control as well as a reduced risk of developing diabetes
reduced cholesterol levels
improved mental and social well-being.
Finally, losing weight makes people more able and more inclined to do more exercise, which can then promote additional weight loss and health improvement in a positively reinforcing cycle.
EPIDEMIOLOGY
This section provides information on recent overweight and obesity trends in Scotland, how these compare to the rest of the UK, and how these compare to other countries worldwide.
OVERWEIGHT AND OBESITY TRENDS IN SCOTLAND
Scottish overweight and obesity rates are monitored via the annual Scottish Health Surveys (SHeS). Figures 3 to 6 in this section have all been plotted using data available from Chapter 7 of the report on the 2013 survey (Scottish Government, 2014a).
Adult population
64.6% of all adults (aged 16+) were overweight (including obese) and 27.1% were obese in 2013. Interestingly, obesity was more common among women than men, while the reverse was true for overweight (including obesity). Adult obesity rates were lowest in those aged 16 to 24 and highest in those aged 65 to 74. Between 1995 and 2008, adult (16-64) overweight (including obesity) and obesity rates increased by 10.5% and 8.5%, respectively (Fig. 3). However, no further increases have been observed since. As explained in the section on diagnosis of overweight and obesity, BMI statistics on their own may not accurately reflect the level of obesity-related disease burden in a population. Therefore, the SHeS also includes WC measurements.

16
0
10
20
30
40
50
1995 1998 2003 2008/09 2010/11 2012/13
Rais
ed
WC
pre
vale
nc
e (
%)
Survey Year
Men (16-64) Women (16-64)
0
10
20
30
40
50
60
70
1995 1998 2003 200820092010201120122013
Pre
vale
nce (
%)
Survey Year
Adult (16-64) overweight Adult (16+) overweight
Adult (16-64) obesity Adult (16+) obesity
Fig. 3. Overweight and obesity trends in the Scottish adult population (1995-2013)
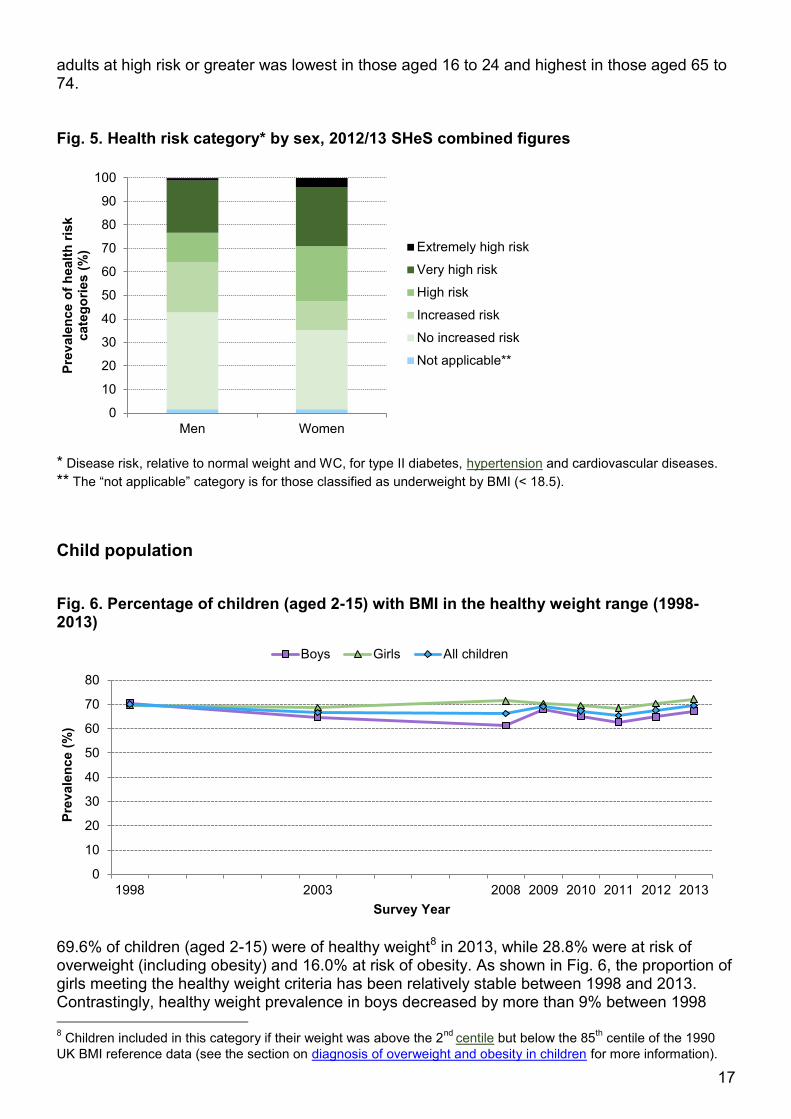
In agreement with BMI trends, male raised WC6 prevalence increased from 14.3% in 1995 to 29.2% in 2008/097 before levelling off; prevalence was 28.9% in 2012/13. However, raised WC in women has continued to become more and more common, rising from 19.1% in 1995 to 47.0% in 2012/13 (Fig. 4). Fig. 4. Trends in prevalence of raised WC in Scottish men and women (1995-2012/13 combined)
As explained in Table 2 of this briefing, BMI and WC measurements can be combined to determine a person’s risk of obesity-related disease. 52.6% of women were at high risk or greater in 2012/13 compared with 35.9% of men (Fig. 5). Additionally, 4% of women and 1% of men were at extremely high risk. As with BMI-based obesity rates, the proportion of Scottish
6 The “raised” WC cut-offs used in the SHeS are 102.75 cm for men and 91.35 cm for women. These are
equivalent to those given for the “very high” WC category in Table 2 of this briefing. The slight differences in
absolute figures are due recent changes in how WC is measured during SHeS interviews (Scottish Government,
2014a, pp. 193-194). 7 WC trends were analysed in the SHeS 2013 report (Scottish Government 2014a) using combined datasets from
the years 2008/09, 2010/11 and 2012/13. This was because smaller sample sizes were used those years. Data
from the 1995, 1998 and 2003 surveys were included individually.
17
0
10
20
30
40
50
60
70
80
1998 2003 2008 2009 2010 2011 2012 2013
Pre
vale
nce (
%)
Survey Year
Boys Girls All children
0
10
20
30
40
50
60
70
80
90
100
Men Women
Pre
vale
nce o
f h
ealt
h r
isk
cate
go
ries (
%) Extremely high risk
Very high risk
High risk
Increased risk
No increased risk
Not applicable**
adults at high risk or greater was lowest in those aged 16 to 24 and highest in those aged 65 to 74. Fig. 5. Health risk category* by sex, 2012/13 SHeS combined figures
* Disease risk, relative to normal weight and WC, for type II diabetes, hypertension and cardiovascular diseases.
** The “not applicable” category is for those classified as underweight by BMI (< 18.5).
Child population
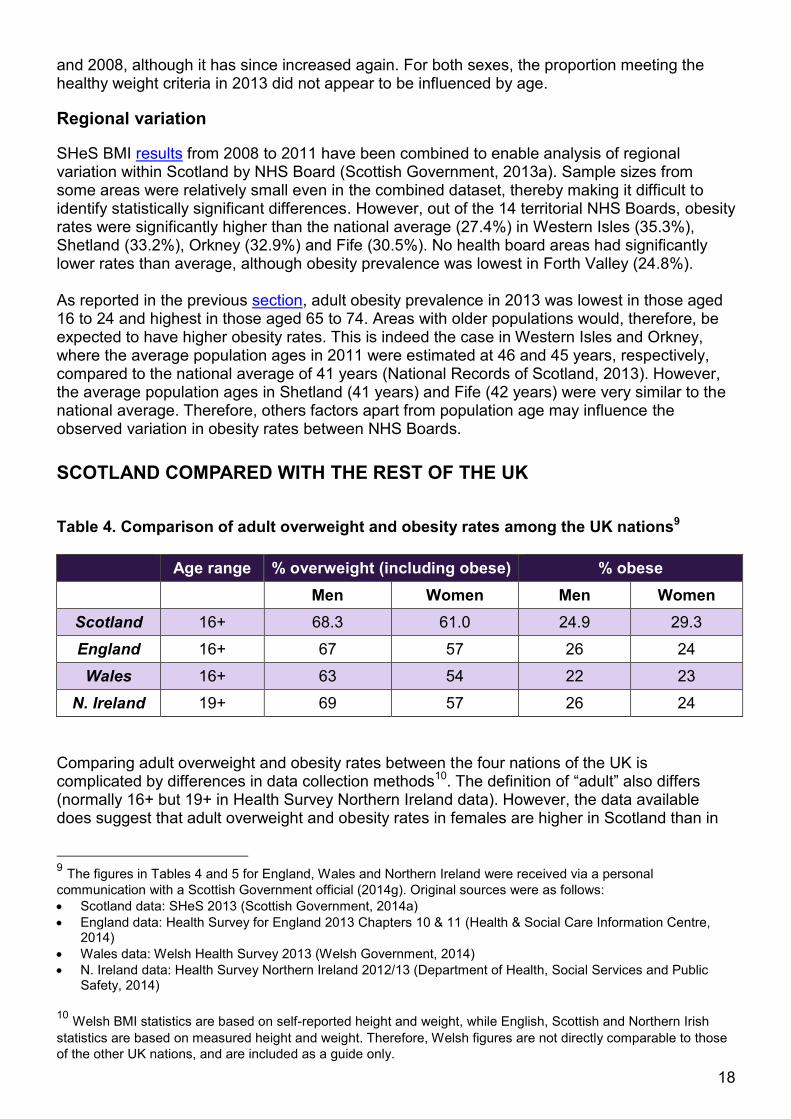
Fig. 6. Percentage of children (aged 2-15) with BMI in the healthy weight range (1998-2013)
69.6% of children (aged 2-15) were of healthy weight8 in 2013, while 28.8% were at risk of overweight (including obesity) and 16.0% at risk of obesity. As shown in Fig. 6, the proportion of girls meeting the healthy weight criteria has been relatively stable between 1998 and 2013. Contrastingly, healthy weight prevalence in boys decreased by more than 9% between 1998 8 Children included in this category if their weight was above the 2
nd centile but below the 85
th centile of the 1990
UK BMI reference data (see the section on diagnosis of overweight and obesity in children for more information).
18
and 2008, although it has since increased again. For both sexes, the proportion meeting the healthy weight criteria in 2013 did not appear to be influenced by age.
Regional variation
SHeS BMI results from 2008 to 2011 have been combined to enable analysis of regional variation within Scotland by NHS Board (Scottish Government, 2013a). Sample sizes from some areas were relatively small even in the combined dataset, thereby making it difficult to identify statistically significant differences. However, out of the 14 territorial NHS Boards, obesity rates were significantly higher than the national average (27.4%) in Western Isles (35.3%), Shetland (33.2%), Orkney (32.9%) and Fife (30.5%). No health board areas had significantly lower rates than average, although obesity prevalence was lowest in Forth Valley (24.8%). As reported in the previous section, adult obesity prevalence in 2013 was lowest in those aged 16 to 24 and highest in those aged 65 to 74. Areas with older populations would, therefore, be expected to have higher obesity rates. This is indeed the case in Western Isles and Orkney, where the average population ages in 2011 were estimated at 46 and 45 years, respectively, compared to the national average of 41 years (National Records of Scotland, 2013). However, the average population ages in Shetland (41 years) and Fife (42 years) were very similar to the national average. Therefore, others factors apart from population age may influence the observed variation in obesity rates between NHS Boards.
SCOTLAND COMPARED WITH THE REST OF THE UK
Table 4. Comparison of adult overweight and obesity rates among the UK nations9
Age range % overweight (including obese) % obese
Men Women Men Women
Scotland 16+ 68.3 61.0 24.9 29.3
England 16+ 67 57 26 24
Wales 16+ 63 54 22 23
N. Ireland 19+ 69 57 26 24
Comparing adult overweight and obesity rates between the four nations of the UK is complicated by differences in data collection methods10. The definition of “adult” also differs (normally 16+ but 19+ in Health Survey Northern Ireland data). However, the data available does suggest that adult overweight and obesity rates in females are higher in Scotland than in
9 The figures in Tables 4 and 5 for England, Wales and Northern Ireland were received via a personal
communication with a Scottish Government official (2014g). Original sources were as follows:
Scotland data: SHeS 2013 (Scottish Government, 2014a)
England data: Health Survey for England 2013 Chapters 10 & 11 (Health & Social Care Information Centre, 2014)
Wales data: Welsh Health Survey 2013 (Welsh Government, 2014)
N. Ireland data: Health Survey Northern Ireland 2012/13 (Department of Health, Social Services and Public Safety, 2014)
10 Welsh BMI statistics are based on self-reported height and weight, while English, Scottish and Northern Irish
statistics are based on measured height and weight. Therefore, Welsh figures are not directly comparable to those
of the other UK nations, and are included as a guide only.
19
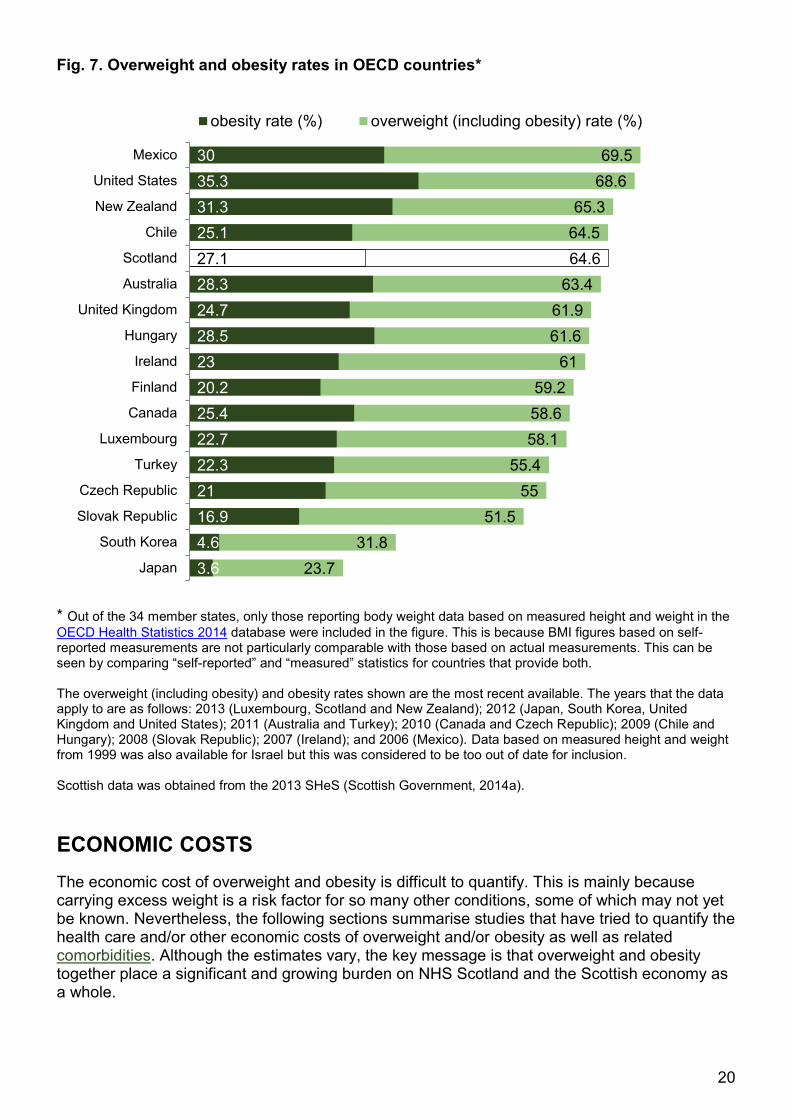
the other UK nations (Table 4). In contrast, Northern Ireland and England have higher rates of adult male obesity than Scotland. Childhood overweight and obesity figures are even harder to interpret as not all the UK nations use the same age group classifications. Nonetheless, Scotland and England both report data for children aged between 2 and 15 years (Table 5). These show that the proportions of children at risk of overweight (including obesity) and at risk of obesity do not vary greatly between Scotland and England. Table 5. Comparison of Scottish and English childhood overweight and obesity rates11
Age range % at risk of overweight (including obesity)
% at risk of obesity
Boys Girls Boys Girls
Scotland 2-15 30.9 26.6 17.2 14.8
England 2-15 30 29 16 15
INTERNATIONAL COMPARISONS
One of the statistics recorded in the HBSC survey12 is the rate of childhood overweight and obesity combined. For this measure, out of the 39 countries included, the report (WHO Regional Office for Europe, 2012) on the most recent survey (2009/10) ranked Scotland as follows (1st = lowest rate):
11-year-olds: 19th
13-year-olds: 12th
15-year-olds: 17th
This highlights that the rates of childhood overweight and obesity in Scotland were no worse than the average of the countries included in the survey. Contrastingly, the WHO regional office for Europe (2013a) reported that in 2008 the UK had the third highest rate of adult overweight (including obesity) out of 51 countries from the WHO European Region13. Individual data for the different UK nations were not available. International comparisons can also be made among the members of the Organisation for Economic Co-operation and Development (OECD), which includes the UK. Fig.7 shows the most up to date overweight (including obesity) and obesity rates for OECD member states that report data based on measured height and weight (Scotland, UK and 15 other nations). Fig. 7 highlights that, out of these countries, obesity prevalence is highest in the United States (35.3%) and New Zealand (31.3%). In contrast, Japan (3.6%) and South Korea (4.6%) have extremely low levels. Scotland ranks 5th highest for overweight (including obesity) and 6th highest for obesity alone.
11 No comparable statistics are available for Wales (aged 4-5 only) or N. Ireland (aged 2-10 only). 12
Data based on self-reported height and weight. 13
Data based on measured height and weight.
20
23.7
31.8
51.5
55
55.4
58.1
58.6
59.2
61
61.6
61.9
63.4
64.6
64.5
65.3
68.6
69.5
3.6
4.6
16.9
21
22.3
22.7
25.4
20.2
23
28.5
24.7
28.3
27.1
25.1
31.3
35.3
30
Japan
South Korea
Slovak Republic
Czech Republic
Turkey
Luxembourg
Canada
Finland
Ireland
Hungary
United Kingdom
Australia
Scotland
Chile
New Zealand
United States
Mexico
obesity rate (%) overweight (including obesity) rate (%)
Fig. 7. Overweight and obesity rates in OECD countries* * Out of the 34 member states, only those reporting body weight data based on measured height and weight in the
OECD Health Statistics 2014 database were included in the figure. This is because BMI figures based on self-reported measurements are not particularly comparable with those based on actual measurements. This can be seen by comparing “self-reported” and “measured” statistics for countries that provide both. The overweight (including obesity) and obesity rates shown are the most recent available. The years that the data apply to are as follows: 2013 (Luxembourg, Scotland and New Zealand); 2012 (Japan, South Korea, United Kingdom and United States); 2011 (Australia and Turkey); 2010 (Canada and Czech Republic); 2009 (Chile and Hungary); 2008 (Slovak Republic); 2007 (Ireland); and 2006 (Mexico). Data based on measured height and weight from 1999 was also available for Israel but this was considered to be too out of date for inclusion. Scottish data was obtained from the 2013 SHeS (Scottish Government, 2014a).
ECONOMIC COSTS
The economic cost of overweight and obesity is difficult to quantify. This is mainly because carrying excess weight is a risk factor for so many other conditions, some of which may not yet be known. Nevertheless, the following sections summarise studies that have tried to quantify the health care and/or other economic costs of overweight and/or obesity as well as related comorbidities. Although the estimates vary, the key message is that overweight and obesity together place a significant and growing burden on NHS Scotland and the Scottish economy as a whole.
21
All figures are reported as annual expenditure. Where appropriate, “older” figures were converted to today’s prices using the inflation tool on the Scottish Parliament website14. Additionally, calculations made using English data were converted pro rata to Scotland’s population size15.
HEALTH CARE COSTS
Chapter 5 of the Health Survey for England 2013 (Health & Social Care Information Centre, 2014) focuses on the self-reported use of prescribed medicines among the general population. The data shows that 53% of men and 63% of women with a BMI ≥ 35 had taken at least one prescribed medicine, in the week prior to the interview, compared with 36% of men and 44% of women of normal weight.
Walker (2003) estimated that 60% of the total cost of obesity to NHS Scotland was due to medicines prescribed, 30% to hospital care and 10% to GP consultations. In total this amounted to £171 million, which, after adjusting for inflation, corresponds to £223 million in today’s prices. Interestingly, managing obesity itself accounted for just 2% of the total. Instead, the vast majority of the expense was attributed to managing obesity-linked incidences of cardiovascular diseases and type II diabetes. The cost to the health service of obesity and its comorbidities may be comparable to that attributable to smoking-related diseases.
Walker (2003) used prevalence rates from 1998 or 1999 for calculating the costs of obesity and its comorbidities. Since that time, the percentage of obese Scottish adults has increased from 20.9% to 27.1% (Scottish Government, 2014a). Therefore, even after adjusting for inflation, the reported figure is likely to underestimate the current health care costs of obesity.
A more recent analysis by the Scottish Government (2010a) estimated that overweight and obesity combined were responsible for health care costs of £312 million in 2007/0816, or £363 million in today’s prices.
Additionally, Scarborough et al. (2010) focused on the situation in England, also calculating the costs of overweight and obesity combined. Using 2006/07 statistics from NHS England, and by following a similar approach to Walker (2003), the authors arrived at a figure of £5.1 billion. Adjusting for inflation and converting pro rata to population size results in an estimated cost to NHS Scotland of around £600 million.
One downside of these studies is that they estimated how expensive obesity, or obesity and overweight, were to the NHS on a yearly basis; they did not compare lifetime health care costs of obese and healthy weight individuals. A study that did do this is described in the following section.
14
Figures were adjusted for inflation since the following years: Walker (2003) – 2003/04; Scottish Government
(2010a) – 2007/08; Scaborough et al. (2010) – 2006/07; and House of Commons Health Committee (2004) –
2002/03. These years were chosen, if possible, according to the period that the studies’ cost estimates applied to.
Current prices were defined as the 2014/15 financial year. 15
Converting pro rata to population size is inaccurate for a number of reasons, including differences in population demographics and the rates of overweight and obesity between England and Scotland. However, multiplying English figures by 0.098 does give a rough approximation of what the costs might be to Scotland (see Office for National Statistics’ most recent population estimates). 16
The initial calculation was carried out for obesity alone. The authors then estimated the costs of overweight and
obesity combined by applying an assumption from Butland et al. (2007) that “the costs per person of being
overweight are half the costs per person of being obese”.

22
RELATIVE HEALTH CARE COSTS
In a 2013 study, Tigbe et al. carried out secondary analyses on data from the Counterweight audit (see this paper and this section of the briefing for more details about the Counterweight programme). As part of the audit, adult patient records were collected from a representative sample of 65 UK GP practices over an 18 month period in 2002/03. The records used in the study were randomly selected from three patient groups split according to their BMI (< 25, 25-30, > 30).
The authors found that, on average, annual health care expenditure increased by £16 with each additional BMI unit17, after adjustment for confounding factors. Moreover, health care costs for people with a BMI of 40 were twice those for people with a BMI of 20. As the authors point out, these estimates may be artificially low. This is because all the patient record data included in the study had associated height and weight measurements. As it is rare for healthy weight individuals to have these measurements taken at their GP practice, the control group (patients with BMI below 25) may, therefore, have had a higher disease burden that would be expected on average.
OTHER ECONOMIC COSTS
Health care expenditure is only part of the issue; there are also indirect economic costs of overweight and obesity. For example, a systematic review (Grieve et al., 2013) reported that the productivity costs of severely obese individuals (BMI ≥ 40) were between 1.7 and 8.0 times greater than those of healthy weight individuals. These estimates mainly included obesity-related absenteeism and workers’ compensation claims in the calculations. However, they were based on data from the United States, where obesity rates and health care spending per capita are both higher than in Scotland.
In the UK, around 15.5 to 16 million days of sickness absence in 2002 were attributable to obesity (McCormick et al., 2007). Lost earnings from overweight- and obesity-related sickness and premature mortality, combined with direct health care costs, were estimated to be between £6.6 billion and £7.4 billion in England in 2002 (House of Commons Health Committee, 2004). This corresponds to an approximate cost to Scotland of between £860 million and £970 million, after adjusting for inflation and population size. These figures are still underestimates, as the calculations did not take into account that obese people may be around 25% less likely to be in employment than those of normal weight (Morris, 2006 cited by McCormick et al., 2007). More recent research by the McKinsey Global Institute (2014) proposes that the total economic impact of obesity is much higher. For example, the authors estimated that the cost to the UK is equivalent to 3.0% of gross domestic product (GDP). Converting their estimate from dollars to pounds, and adjusting pro rata to Scotland’s population size, results in a figure of £4.6 billion18. The authors’ analysis took into account: loss of productivity attributable to loss of life or impaired life quality, direct health care costs, and investment to mitigate the impact of obesity.
17
At first glance, £16 per additional BMI unit seems quite a small amount. However, multiplying this figure by the
mid-2013 estimate for Scotland’s population size (5.3 million) (Office for National Statistics, 2014) gives an
estimated increase in annual health care costs of £85 million for each single unit increase in Scotland’s average
BMI. For reference, average BMI increased by 1.4 units from 25.8 to 27.2 between 1995 and 2013 (Scottish
Government, 2014a). 18
Figure reported in the text of this report as $73 billion. This was converted to pounds using the exchange rate on
04 Dec 2014 (£1 = $1.56640).
23
POLICY
The Scottish Government (2010a) states that policies to combat overweight and obesity can contribute greatly to efforts to increase healthy life expectancy. However, according to Mooney et al. (2012), no government “has yet managed to successfully halt or reverse the rising obesity trend”. The authors of this report identify various potential explanations for these failures. For example, they argue that advice on healthy nutrition generally “conflicts with the fundamental business model of most of the commercial food industry”. Additionally, they contend that the public pressure on governments to act has been limited, because overweight and moderate obesity do not have dramatic, visible impacts on health in the short term. However, strategies targeting all aspects of our obesogenic environment do offer the prospect of success (Butland et al., 2007; McKinsey Global Institute, 2014; Mooney et al., 2012). Such an approach can also prevent the inadvertent widening of health inequalities that can occur from targeting individuals; this is because health-promoting policies focusing on the individual are often more effective for those who are already quite healthy. Another argument for an all-encompassing strategy for combating obesity is that if policies are designed in isolation, well-meaning ideas can lead to unintended consequences. For example, making urban areas easier to walk around, without improving the nutritional value of locally available snacks and drinks, could actually have a negative impact on health (Scottish Government, 2010a). Wide ranging programmes of preventative interventions can be expensive in the short term. However, the costs should be small compared to the long-term cost savings and health benefits arising from reduced levels of type II diabetes, cardiovascular disease and some cancers (NICE, 2013a; McKinsey Global Institute, 2014). In addition, policies to prevent obesity can have positive impacts in other areas. Promoting active travel, for example, can simultaneously improve health and reduce carbon emissions.
Further information can be found from the following recent reports, which offer a variety of perspectives on how to solve the obesity crisis: Active Travel, Active Scotland: Our journey to a sustainable future (Cycling Scotland et al., 2012); The race we don't want to win: Tackling Ireland's obesity epidemic (Royal College of Physicians of Ireland, 2014); and Action on obesity: Comprehensive care for all (Royal College of Physicians, 2013).
PREVENTION OF OBESITY ROUTE MAP
Currently, the overarching strategy for addressing the obesity problem in Scotland is the Prevention of Obesity Route Map (the Route Map), which was published in 2010 by the Scottish Government. This was designed as a successor to the Health Eating, Active Living action plan (Scottish Government, 2008a), which was in place between 2008 and 2011. According to the Scottish Government, earlier investment to combat obesity suffered from the lack of a coherent overall strategy, too little focus on prevention, and viewing tackling obesity as a secondary goal to primary goals like reducing carbon emissions. The Route Map seeks to address this by targeting all aspects of our obesogenic environment simultaneously. The vision is for central and local government, agencies, the third sector, NHS Scotland and business to all work together “to develop and subsequently deliver the long-term solutions to this problem” (Scottish Government, 2010a, p. 1). As the name suggests, the Route Map’s main focus is prevention. However, the Scottish Government recognise that, as most Scottish adults are already overweight, policies will also need to promote sustained weight loss in adults and promote children growing into a healthy weight.
24
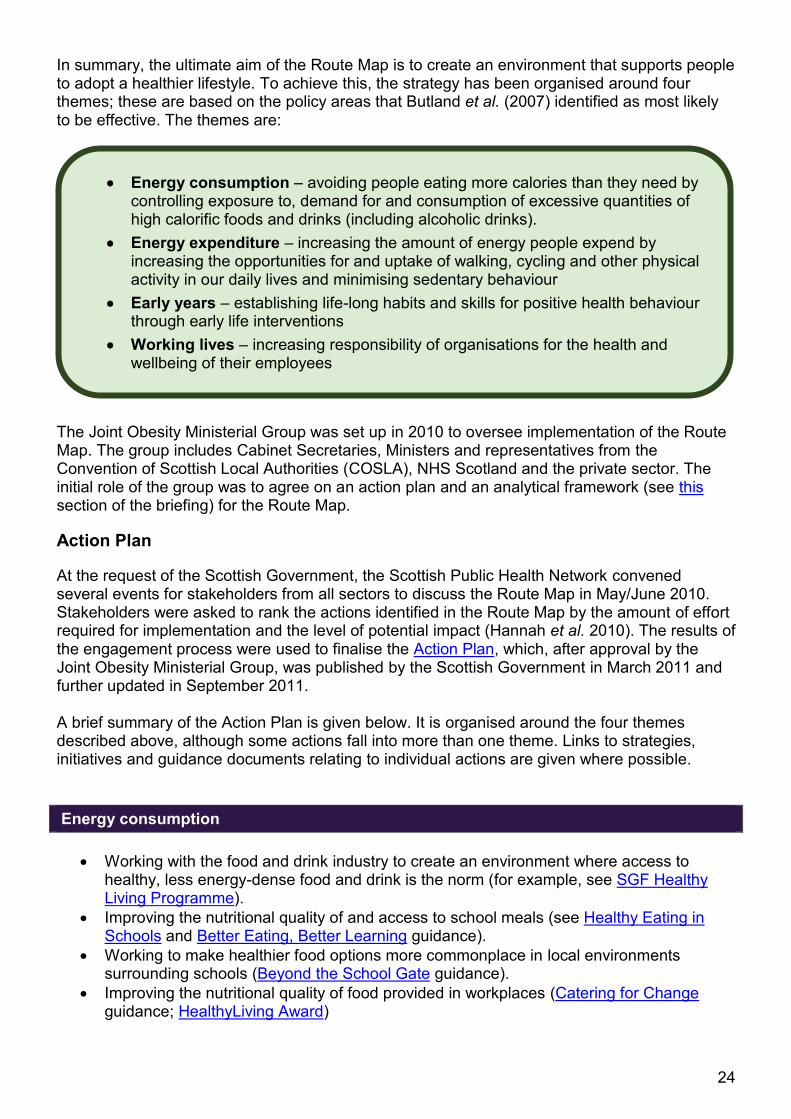
In summary, the ultimate aim of the Route Map is to create an environment that supports people to adopt a healthier lifestyle. To achieve this, the strategy has been organised around four themes; these are based on the policy areas that Butland et al. (2007) identified as most likely to be effective. The themes are: The Joint Obesity Ministerial Group was set up in 2010 to oversee implementation of the Route Map. The group includes Cabinet Secretaries, Ministers and representatives from the Convention of Scottish Local Authorities (COSLA), NHS Scotland and the private sector. The initial role of the group was to agree on an action plan and an analytical framework (see this section of the briefing) for the Route Map.
Action Plan
At the request of the Scottish Government, the Scottish Public Health Network convened several events for stakeholders from all sectors to discuss the Route Map in May/June 2010. Stakeholders were asked to rank the actions identified in the Route Map by the amount of effort required for implementation and the level of potential impact (Hannah et al. 2010). The results of the engagement process were used to finalise the Action Plan, which, after approval by the Joint Obesity Ministerial Group, was published by the Scottish Government in March 2011 and further updated in September 2011. A brief summary of the Action Plan is given below. It is organised around the four themes described above, although some actions fall into more than one theme. Links to strategies, initiatives and guidance documents relating to individual actions are given where possible.
Energy consumption
Working with the food and drink industry to create an environment where access to healthy, less energy-dense food and drink is the norm (for example, see SGF Healthy Living Programme).
Improving the nutritional quality of and access to school meals (see Healthy Eating in Schools and Better Eating, Better Learning guidance).
Working to make healthier food options more commonplace in local environments surrounding schools (Beyond the School Gate guidance).
Improving the nutritional quality of food provided in workplaces (Catering for Change guidance; HealthyLiving Award)
Energy consumption – avoiding people eating more calories than they need by controlling exposure to, demand for and consumption of excessive quantities of high calorific foods and drinks (including alcoholic drinks).
Energy expenditure – increasing the amount of energy people expend by increasing the opportunities for and uptake of walking, cycling and other physical activity in our daily lives and minimising sedentary behaviour
Early years – establishing life-long habits and skills for positive health behaviour through early life interventions
Working lives – increasing responsibility of organisations for the health and wellbeing of their employees

25
Increasing the awareness of healthy eating among children and adults (social marketing, including Take Life On and Greener Scotland; also see Better Eating, Better Learning guidance).
Developing options to restrict advertising of unhealthy food and drink.
Energy expenditure
Ensuring that new development plans and development management decisions have positive impacts on active living and healthy weight (Scottish Planning Policy 2014, Scottish Sustainable Communities Initiative; Good Places Better Health guidance).
Providing more opportunities, both in and out of school, for young people and children to get involved in physical activities and sports (CashBack for Communities scheme; Active Schools programme; Let's Make Scotland More Active strategy).
Reducing car use and increasing active travel by improving the safety of pedestrian and cycle routes, and implementing active travel schemes (Cycling Action Plan; also see Smarter Choices, Smarter Places pilots).
Using the legacy of the Glasgow Commonwealth Games 2014 to inspire people to become more active (see A More Active Scotland: Building a Legacy from the Commonwealth Games and see here for links to various initiatives launched as part of the Active Legacy programme).
Using social marketing to promote active travel (Take Life On; Greener Scotland).
Early years
Supporting pregnant women and new mothers to develop healthy lifestyles for themselves and their babies, including promoting breastfeeding (Maternal and Infant Nutrition Strategy; Healthy Start scheme).
Ensuring children, young people and their families can access appropriate help and support if they need it (the Getting it right for every child approach).
Ensuring that childcare facilities provide healthy, nutritional food (Setting the Table guidance) and provide regular opportunities for active play.
Increasing the capacity of Scotland’s play sector (Go Play and Go2Play programmes).
Working lives
Using the public sector to promote the healthy working lives approach. This includes encouraging organisations to implement programmes promoting healthy weight management and to provide better signposting for walking and cycling routes on their land (also see HealthyLiving Award).
Continuing to invest in the Scottish Centre for Healthy Working Lives, an organisation offering free advice to businesses on how to improve the health, safety and wellbeing of their workforce.
Encouraging all employers to support their employees to adopt more active travel to and from work.
Supporting workplace walking interventions focusing on specific inactive groups (45-64 year-old women, and all adults 65 and over) (see Paths for All).
The Action Plan will be reviewed periodically by the Joint Obesity Ministerial Group. These reviews will consider emerging evidence from the Route Map Analytic Framework (see this section of the briefing) as well as external developments, such as new EU policy (Scottish Government 2010a).
26
ASSESSING PEFORMANCE OF POLICIES
Prior to a description of the specific measures used to assess performance against the Route Map Action Plan, the following sections outline how these fit into the Scottish Government’s overall strategy19.
NATIONAL PERFORMANCE FRAMEWORK
The Scottish Government uses the National Performance Framework (NPF) to monitor its progress towards “creating a more successful country, with opportunities for all of Scotland to flourish, through increasing sustainable economic growth” (Scottish Government, 2011f). In order to achieve its purpose, the Scottish Government’s work has been aligned around the following key Strategic Objectives: wealthier and fairer, safer and stronger, smarter, greener, and healthier. Healthier is most relevant to the topic of this briefing. Healthier is defined as helping “people to sustain and improve their health, especially in disadvantaged communities, ensuring better, local and faster access to health care”. What the Scottish Government wants to achieve over a ten year period is articulated in more detail through 16 National Outcomes. Those considered to be most applicable to health are described here. The route to achieving these outcomes is via the Purpose Targets. Health policies relate most closely to the Population target, which aims “to match average European (EU15)20 population growth over the period from 2007 to 2017, supported by increased healthy life expectancy in Scotland” over the same period”. Progress is tracked on a finer scale using 50 National Indicators that sit below the purpose targets. Policies to combat obesity will, if successful, have impacts on all areas of national wellbeing. However, Appendix 1 of this briefing covers the most directly relevant indicators and provides information on current progress.
QUALITY MEASUREMENT FRAMEWORK
The Quality Measurement Framework is the structure for monitoring the progress of the NHS in Scotland towards the Quality Ambitions. These ambitions are described in more detail in the Healthcare Quality Strategy for NHS Scotland (Scottish Government, 2010b). Within this framework there are several levels of measurements, as described in the following sections.
Level 1: High Level Indicators
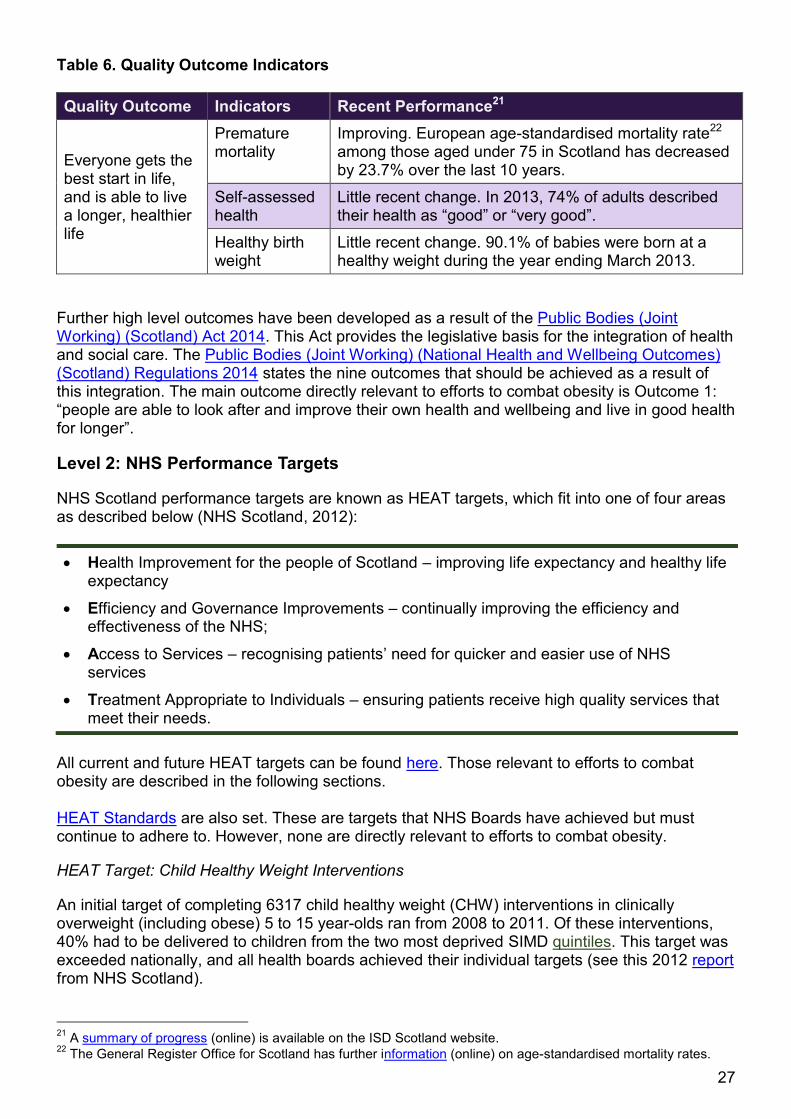
These consist of twelve Quality Outcome Indicators that can be mapped to six Quality Outcomes. Those directly relevant to policies to combat obesity are shown in Table 6.
Closely related to the Quality Strategy is the Scottish Government’s 2020 Vision, which “provides the strategic narrative and context for taking forward the implementation of the Quality Strategy, and the required actions to improve efficiency and achieve financial sustainability”.
19
For a more detailed explanation of assessment of health policy performance, see Payne and Hudson (2014). 20
The EU15 are the countries that became EU members prior to 1 May 2004 (OECD, online)
27
Table 6. Quality Outcome Indicators
Quality Outcome Indicators Recent Performance21
Everyone gets the best start in life, and is able to live a longer, healthier life
Premature mortality
Improving. European age-standardised mortality rate22 among those aged under 75 in Scotland has decreased by 23.7% over the last 10 years.
Self-assessed health
Little recent change. In 2013, 74% of adults described their health as “good” or “very good”.
Healthy birth weight
Little recent change. 90.1% of babies were born at a healthy weight during the year ending March 2013.
Further high level outcomes have been developed as a result of the Public Bodies (Joint Working) (Scotland) Act 2014. This Act provides the legislative basis for the integration of health and social care. The Public Bodies (Joint Working) (National Health and Wellbeing Outcomes) (Scotland) Regulations 2014 states the nine outcomes that should be achieved as a result of this integration. The main outcome directly relevant to efforts to combat obesity is Outcome 1: “people are able to look after and improve their own health and wellbeing and live in good health for longer”.
Level 2: NHS Performance Targets
NHS Scotland performance targets are known as HEAT targets, which fit into one of four areas as described below (NHS Scotland, 2012):
Health Improvement for the people of Scotland – improving life expectancy and healthy life expectancy
Efficiency and Governance Improvements – continually improving the efficiency and effectiveness of the NHS;
Access to Services – recognising patients’ need for quicker and easier use of NHS services
Treatment Appropriate to Individuals – ensuring patients receive high quality services that meet their needs.
All current and future HEAT targets can be found here. Those relevant to efforts to combat obesity are described in the following sections. HEAT Standards are also set. These are targets that NHS Boards have achieved but must continue to adhere to. However, none are directly relevant to efforts to combat obesity.
HEAT Target: Child Healthy Weight Interventions
An initial target of completing 6317 child healthy weight (CHW) interventions in clinically overweight (including obese) 5 to 15 year-olds ran from 2008 to 2011. Of these interventions, 40% had to be delivered to children from the two most deprived SIMD quintiles. This target was exceeded nationally, and all health boards achieved their individual targets (see this 2012 report from NHS Scotland).
21
A summary of progress (online) is available on the ISD Scotland website. 22
The General Register Office for Scotland has further information (online) on age-standardised mortality rates.
28
In 2011 an updated target was introduced. This required 14,910 CHW interventions to be completed over the 3 years to 2014. The eligible age range was also adjusted to 2 to 15 years. Again, national and local targets were exceeded (ISD Scotland, 2014d).
CHW interventions consist of weight management schemes developed according to the clinical guidelines on the management of overweight and obesity (NICE, 2006; SIGN, 2010; also see this section of this briefing). In an evaluation of the CHW programme, McConville et al. (2013) reported that the children involved seemed to have enjoyed the experience. On average, the participants were more aware of healthy lifestyle choices, and some had made lasting changes to their diet and physical activity levels. Some of the parents had also adopted healthier lifestyles.
Group interventions were most successful, followed by one-to-one programmes, and those carried out at school were the least successful. Therefore, McConville et al. (2013) advised that future CHW interventions should be either group-based or one-to-one.
HEAT Target: Exclusively Breastfed
As explained in the section on why people put on weight, being breastfed may protect a child from becoming obese later in life. In addition, breastfeeding may help mothers to lose weight more easily after giving birth.
This HEAT target (Scottish Government, online) was to “increase the proportion of new-born children exclusively breastfed at six to eight weeks from 26.6% in 2006/07 to 33.3 per cent in 2010/2011”. This target was not met as no clear change in this figure was observed over the four years.
Level 3: Local Performance Measures or Indicators
These are indicators for specific national and local programmes. The framework used for monitoring the Route Map is described in the following section.
PREVENTION OF OBESITY ROUTE MAP: ANALYTIC FRAMEWORK
In addition to the Action Plan, an analytic framework was set up to “support the Route Map to advance policy understanding of the cause and effect of obesity and the effectiveness of policy responses” (Scottish Government, 2011g). This framework is being overseen mainly by the Health Analytical Services Division but various other parts of the Scottish Government are also involved.
The first part of the framework is “monitoring changes in patterns of obesity and contributory factors at national level”. This involves:
Annual updates of progress towards the Route Map indicators; more detail on these is given on the following page.
Carrying out or facilitating analysis of survey data to explore the links between obesity and potential risk factors. A couple of reports have already been published, which are the Scottish Health Survey Topic Report on Obesity (Scottish Government, 2011a) and Drivers of Unhealthy Weight in Childhood: Analysis of the Millennium Cohort Study (Connelly, 2011), both of which have been previously referred to in this briefing.
Additionally, research priorities were identified following consultations with relevant stakeholders. The overall aims of the research strategy are:
29
to promote research which builds evidence to inform Scottish Government action on the fundamental drivers of obesity
to carry out and promote research on Route Map actions where there is a gap in the evidence
Dedicated funds have not been set aside for this research. Therefore, the focus has been on using existing survey resources, influencing research partners funded by the Scottish Government, and influencing other research partners who produce policy-relevant research.
Prevention of Obesity Route Map: Indicators
A set of 16 indicators is being used to monitor progress towards the goals described in the Route Map Action Plan. The indicators were introduced in a Scottish Government paper (2011h), which stated that the framework had been “informed by NHS Health Scotland’s healthy weight outcomes logic model and by the Scottish Public Health Network’s Route Map engagement process”. The indicators are categorised according to whether the desired outcome is long-, intermediate- or short-term. Most of the indicators are assessed nationally but six can also be assessed at Health Board or local authority level. The Scottish Government paper also proposes that “there will need to be further local development of indicators suitable for local healthy weight strategies to use”. Exact dates are not given for achieving the desired outcomes, because the Route Map is considered a long-term project; in fact, even if it is successful there may be a 20 to 30 year time lag before seeing significant decreases in overweight and obesity (Scottish Government, 2010a). However, data updates for most of the indicators are available annually, and a progress report (Scottish Government, 2014f) was published in December 2014. The report identified slight progress towards several of the desired outcomes for the intermediate and short-term indicators, although most of these changes were not statistically significant. Data for the long-term indicators were slightly less promising; for example, diabetes rates continue to increase, and adult and child overweight and obesity rates have remained approximately stable in recent years. However, considering the previously upwards trends in overweight and obesity rates, that they may have stabilised can be considered a partial success. Appendix 2 gives more information on each indicator and on progress towards the desired outcomes.
MANAGEMENT AND TREATMENT
Preventing people becoming overweight or obese is extremely important. However, in the short to medium term, it is vital to effectively treat individuals for whom this has already happened. This section covers the three main types of treatment: lifestyle weight management programmes, pharmacological management, and bariatric surgery. For each, information is also included on clinical benefits and cost effectiveness. SIGN and NICE guidelines are frequently referred to here. For an explanation of how these guidelines apply to Scotland, see this explanatory note.
30
Dietary change. The daily calorie deficit should be around 600 calorie per day for effective weight loss. As the types of macronutrients emphasised in diets do not seem to influence their effectiveness, programmes should, therefore, be “tailored to the dietary preferences of the individual patient”.
Physical activity. The recommendation is around 225-300 minutes per week of moderate intensity physical activity, or lesser amounts of more vigorous activity. Ideally supervised exercise sessions should make up at least part of the total time.
Psychological/behavioural therapy. Interventions can include goal-setting, slowing the rate of eating, and stimulus control to help patients avoid triggers that prompt unplanned eating.
It is important to note that the information in this section should not be used as clinical guidance. For such purposes, please refer to the original guidance documents issued by the appropriate organisation (SIGN, NICE etc.).
WEIGHT MANAGEMENT PROGRAMMES
Adult Programmes
Adult weight management programmes aim to reduce weight and associated adverse health complications in those currently overweight or obese. The difficulty is ensuring that people make sustainable lifestyle changes to prevent subsequent weight regain. In general, for patients with a BMI of 25 to 35, these programmes target a sustained weight loss of between 5% and 10% (5-10 kg) to reduce the risks of developing comorbidities. For patients with a higher BMI, a greater weight loss of 15% to 20% is normally required. However, “weight loss targets should be based on the individual’s comorbidities and risks, rather than their weight alone” (SIGN, 2010, p. 17).
The SIGN Management of Obesity clinical guideline (2010) advises that, to have the best chance of success, weight management programmes should include the following components:
NICE has published additional guidelines that focus on maternal and child nutrition (2008a) and weight management before, during and after pregnancy (2010). These recommend that obese women who are either pregnant or planning to have a child are made aware of the risks that their obesity can pose to both themselves and their unborn child. Structured programmes for losing weight before or after pregnancy should also be provided. Weight loss during pregnancy is not recommended as this can harm the health of the unborn child.
Further relevant information from NICE can be found on their webpage devoted to diet, nutrition and obesity.
Child Programmes
The SIGN (2010) recommendations for managing childhood obesity are similar to those for adults. However, the main differences are as follows:
31
For most obese children, weight maintenance should be the aim as their BMI will naturally decrease as they get taller. For older children as well as those that are younger but extremely obese, a small monthly weight loss is an acceptable target.
Interventions should involve at least one parent or carer, and the aim should be to change the whole family’s lifestyle.
Around 60 minutes of moderate/vigorous physical activity is recommended per day.
Clinical Effectiveness
An SHTG evidence note23 (2010a) confirms that a combination of diet, physical and behavioural therapy is more effective at inducing weight loss that dieting alone. Aside from weight loss, weight management interventions are also associated with reducing blood pressure and lowering the risk of developing diabetes. These beneficial effects may be sustained for up to two years or longer.
Cost Effectiveness
Determining the resource effectiveness of weight management programmes is difficult. This is mainly because studies rarely follow patients for long enough to assess long-term weight loss maintenance (NICE, 2014b). However, NICE (2013b, 2014b) suggest that most lifestyle weight interventions, especially if they are group-based, are likely to be cost effective. NICE and SHTG both propose further research to address the lack evidence in this area.
Examples of Weight Management Programmes
Weight management interventions offered by most territorial NHS Boards in Scotland are based on the Counterweight model (see below). However, NHS Boards can also offer other programmes or develop their own (Scottish Government, 2014g). For example, NHS Greater Glasgow and Clyde are running a pilot scheme that involves paying for people to access a commercial weight management service (Weight Watchers).24
Counterweight
The original Counterweight Programme is described as the “first evidence based programme for successful cost effective weight management in primary care within the UK”. It is available to adults (aged 18+) and aims to achieve and maintain a clinically beneficial weight loss of 5% to 10% or 5 to 10 kg. The content is designed according to current NICE and SIGN guidelines. Counterweight Ltd has also developed the following programmes: Counterweight Plus, which is a “non-surgical weight management solution suitable for individuals with greater weight loss needs”; and Counterweight Families, which aims to involve the whole family unit in efforts to influence health behaviour change in family members who are overweight or obese.
NHS Tayside’s maternal obesity service: “optiMum”
In 2008, the Scottish Government awarded three years of funding to NHS Tayside for improving the “nutrition of women of childbearing age, pregnant women and children under five in disadvantaged areas”. This action was part of the Scottish Government’s efforts to reduce
23
See this explanatory note for more information on the different types of health care guidelines. 24
NHS Greater Glasgow and Clyde’s hospital based weight management service will still continue as normal
during this pilot scheme.
32
inequalities in health. NHS Tayside used the funding to deliver various interventions, including the Antenatal Maternal Obesity Service (optiMum). OptiMum was developed by a multi-disciplinary group, and was piloted at two sites. Over a 13 month period, the scheme provided 149 obese pregnant women with “advice on healthy eating and physical activity lifestyle choices during pregnancy” and in the period after birth.
An NHS Tayside report (2012) concluded that the pilot study showed it was feasible to deliver an effective weight management programme to obese pregnant women. The optiMum service is now running permanently, and pregnant women are referred to it if, at the time of their first visit with the midwife, they have a BMI > 40 (Dundee) or BMI > 30 (Montrose).
Football fans in training (FFIT)
Unlike the NHS weight management services described above, FFIT is run in the community, and is available for men only. It has been running since 2010 and has been funded by several organisations, including the Scottish Government.
FFIT involves participants being trained by community coaches for 12 weeks at the home stadium of the professional football team they support. Those taking part also receive dietary and physical activity advice as well as a pedometer to monitor the number of steps they walk in a day.
Men are typically underrepresented in both commercial and NHS weight management programmes (Hunt et al., 2014). Therefore, FFIT was designed to encourage men from all socioeconomic background to be more engaged with healthy living.
Since it began, over 2000 men have attended the programme. A randomised control trial (Hunt et al., 2014) reported that, one year after starting the scheme, participants had lost almost 5 kg more, on average, than the control group. The FFIT programme also improved WC, body fat percentage and blood pressure measurements.
The study authors estimated that FFIT cost £862 per additional man achieving and maintaining a 5% weight loss after one year. The FFIT scheme was also calculated to be under the NICE cost effectiveness threshold.
PHARMACOLOGICAL MANAGEMENT
Currently, “orlistat is the only drug specifically licensed in Scotland for use in the treatment of obesity” (SIGN, 2010, p. 28). Orlistat works by inhibiting the breakdown of dietary fat by lipases. This results in around 30% of ingested fat remaining undigested, thereby preventing its absorption in the small intestine. Typically, this leads to a calorie deficit that has a positive effect on weight reduction and control (Genentech, online). Detailed SIGN guidelines (2010) for using orlistat are available here. Briefly, orlistat (marketed as Xenical®) can only be prescribed in combination with lifestyle weight interventions. Obese adults, or adults with BMI ≥ 28 who have comorbidities, can be considered for such therapy. For children, orlistat is only recommended in cases of extreme obesity. Orlistat (marketed as Alli®) can also be purchased from pharmacies on a non-prescription basis by adults with BMI ≥ 28.
33
Clinical Effectiveness
When orlistat is used in combination with dietary change, weight loss is maintained more effectively compared with a placebo and diet combination. Orlistat treatment, along with lifestyle changes, has also been shown to slightly reduce total cholesterol and blood pressure, and to greatly reduce the risk of developing diabetes (SIGN, 2010). The most common side effects are gastrointestinal events, which are typically mild and transient. Additionally, patients often require multivitamin supplements to compensate for vitamin deficiencies that can result from the drug treatment (SIGN, 2010).
Cost Effectiveness
A systematic review by Ara et al. (2012) assessed the cost effectiveness of orlistat by analysing the combined results of 54 studies. The authors found that the average estimated cost of the drug was £1665 per quality-adjusted life year (QALY), which is well below the SMC’s standard threshold of £20,000 per QALY. See here for an explanation from the Scottish Medicines Consortium of how QALYs are calculated.
BARIATRIC SURGERY
The two most common types of bariatric surgery are gastric banding and gastric bypass. Fitting a gastric band involves placing a band around the stomach, leaving a small pouch at the top. This reduction in stomach size means that the patient requires less food to feel full. A gastric bypass is similar, except that the pouch is connected directly to a section of the small intestine. Ingested food, therefore, bypasses the rest of the stomach and bowel, which also reduces calorie absorption. Other, rarer types of bariatric surgery are described here (NHS, online).
Surgical treatment for obesity is recommended only under limited circumstances. For example, just 157 bariatric surgery procedures were carried out by NHS Scotland in 2008-2009 (SHTG, 2010b). SIGN guidance (2010) is that surgery can only be considered if lifestyle weight management programmes and drug interventions have failed. Additionally only adults with BMI ≥ 35 who have severe obesity-related comorbidities can be eligible.
For children, bariatric surgery is not recommended, except for those with the severest obesity who also have severe comorbidities.
Clinical Effectiveness
A Cochrane review of 22 randomised control trials (Colquitt et al., 2014) concluded that all types of bariatric surgery were effective at inducing weight loss. Additionally, two studies reviewed in an SHTG evidence note (2010b) estimated that surgery reduced overall mortality by between 29% and 40% in the subsequent 7 to 10 years compared with people of the same BMI who did not undergo surgery. These benefits were mainly due to improvements in comorbidities. Compared with gastric banding, gastric bypass generally induces more weight loss but carries a greater risk of complications. Colquitt et al. (2014) found that serious adverse event (SAE) rates varied considerably between the studies reviewed. SAEs directly related to the surgery itself included wound infection, eating difficulties and, occasionally, issues that required reoperation. However, SAE rates in control patients who had not had surgery were often similar, probably because bariatric surgery is only carried out in people who are already in ill health due to their obesity.
34
Cost Effectiveness
Limited long-term follow-up data is available for patients who have undergone bariatric surgery. This makes it hard to assess cost effectiveness as, ideally, lifetime costs need to be modelled. However, the evidence suggests that bariatric surgery typically costs less than $10 000 per QALY, which is well below the standard threshold (Wang and Furnback, 2013). For those with moderate obesity (BMI 30-35), surgery may not be cost effective, even when considering long time intervals after surgery (SHTG, 2010b). This is partly why bariatric surgery is not currently recommended for this patient group.
35
SOURCES
Ara, R., Blake, L., Gray, L., Hernandez, M., Crowther, M., Dunkley, A., Warren, F., Jackson, R., Rees, A., Stevenson, M., Abrams, K., Cooper, N., Davies, M., Khunti, F. and Sutton, A. (2012) What is the clinical effectiveness and cost-effectiveness of using drugs in treating obese patients in primary care? Health Technology Assessment, 16(5) Butland, B., Jebb, S., Kopelman, P., McPherson, K., Thomas, S., Mardell, J. and Parry, V. (2007). Tackling Obesities: Future Choices Project report, 2nd ed. London: UK Government. Available at: https://www.gov.uk/government/uploads/system/uploads/attachment_data/file/287937/07-1184x-tackling-obesities-future-choices-report.pdf CashBack for Communities [Online]. Available at: http://www.cashbackforcommunities.org/ [Accessed 10 November 2014] Colquitt, J.L., Pickett, K., Loveman, E. and Frampton, G.K. 2014. Surgery for weight loss in adults (review). Cochrane Database of Systematic Reviews, 8. Available at: http://onlinelibrary.wiley.com/doi/10.1002/14651858.CD003641.pub4/pdf Connelly, R. (2011). Drivers of Unhealthy Weight in Childhood: Analysis of the Millennium Cohort Study [Online]. Scottish Government. Available at: http://www.scotland.gov.uk/resource/doc/356897/0120590.pdf Counterweight. Counterweight Programme [Online]. Available at: http://www.counterweight.org/Programmes/Counterweight-Programme-113 [Accessed 25 November 2014] Counterweight. Counterweight Plus [Online]. Available at: http://www.counterweight.org/Programmes/Counterweight-Plus-115 [Accessed 25 November 2014] Counterweight. Counterweight Families [Online]. Available at: http://www.counterweight.org/Programmes/Counterweight-Families-116 [Accessed 25 November 2014] Counterweight Project Team (2004). A new evidence-based model for weight management in primary care: the Counterweight Programme. J Hum Nutr Dietet, 17, 191-208 Cycling Scotland, Living Streets Scotland, Paths for All, Sustrans Scotland and Transform Scotland (2012). Active Travel, Active Scotland: Our journey to a sustainable future [Online]. Available at: http://www.transformscotland.org.uk/GetFile.aspx?ItemId=563 Department of Health, Social Services and Public Safety (2014). Health Survey Northern Ireland – 2012/13. Belfast: The Northern Ireland Statistics and Research Agency. Available at: www.dhsspsni.gov.uk/health_survey_northern_ireland_2012-13.docx El-Sayed, A.M., Scarborough, P. and Galea, S. (2012). Unevenly distributed: a systematic review of the health literature about socioeconomic inequalities in adult obesity in the United Kingdom. BMC Public Health, 12, 18-30 EU Action Plan on Childhood Obesity 2014-2020 (2014). Available at: http://ec.europa.eu/health/nutrition_physical_activity/docs/childhoodobesity_actionplan_2014_2020_en.pdf [Accessed 16 October 2014]
36
European Food Information Council. Frequently Asked Questions: I have read about extrinsic and intrinsic sugars. What is the difference between them and how do they affect my dental health? [Online]. Available at: http://www.eufic.org/page/en/page/FAQ/faqid/extrinsic-intrinsic-sugars/ [Accessed 03 October 2014] Football Fans in Training. About FFIT [Online]. Available at: http://www.ffit.org.uk/page11/index.html [Accessed 25 November 2014] Genentech. About Xenical: mechanism of action [Online]. Available at: http://www.xenical.com/xenical/hcp-3_moa.do [Accessed 03 October 2014] Government Statistical Service (2014). Comparing Official Statistics Across the UK [Online]. Office for National Statistics. Available at: https://gss.civilservice.gov.uk/wp-content/uploads/2014/02/Comparability-Report-Final.pdf [Accessed 08 December 2014] Greener Scotland [Online]. Available at: http://www.greenerscotland.org/ [Accessed 10 October 2014] Grieve, E., Fenwick, E., Yang, H-C. and Lean, M. (2013). The disproportionate economic burden associated with severe and complicated obesity: a systematic review. Obesity Reviews, 14, 883-894 Hannah, M., Conacher, A. and Tyrrell, L. (2010). Obesity – A Route Map towards a Healthy Weight Scotland Report of Engagement Process [Online]. Scottish Public Health Network. Available at: http://www.scotphn.net/pdf/Route_Map_Report_Final_150320111.pdf Health & Social Care Information Centre (2014). Health Survey for England 2013: Health, social care and lifestyles. Health & Social Care Information Centre. Available at: http://www.hscic.gov.uk/catalogue/PUB16076/HSE2013-Ch5-pres-meds.pdf (Chapter 5) http://www.hscic.gov.uk/catalogue/PUB16076/HSE2013-Ch10-Adult-anth-meas.pdf (Chapter 10) http://www.hscic.gov.uk/catalogue/PUB16076/HSE2013-Ch11-Child-BMI.pdf (Chapter 11) Healthcare Improvement Scotland. Technologies and medicines [Online]. Available at: http://www.healthcareimprovementscotland.org/our_work/technologies_and_medicines.aspx [Accessed 30 October 2014] HealthyLiving Award. Welcome to the healthyliving award [Online]. Available at: http://www.healthylivingaward.co.uk/ [Accessed 20 November 2014] Healthy Start [Online]. Available at: http://www.healthystart.nhs.uk/ [Online] Hex, N., Bartlett, C., Wright, D., Taylor, M. and Varley, D. (2012). Estimating the current and future costs of Type 1 and Type 2 diabetes in the UK, including direct health costs and indirect societal and productivity costs. Diabetic Medicine, 29(7), 855-862 House of Commons Health Committee (2004). Obesity: Third Report of Session 2003-04. London: The Stationery Office. Available at: http://www.publications.parliament.uk/pa/cm200304/cmselect/cmhealth/23/23.pdf Hunt, K., Wyke, S., Gray, C.M., Anderson, A.S., Brady, A., Bunn, C., Donnan, P.T., Fenwick, E., Grieve, E., Leishman, J., Miller, E., Mutrie, N., Rauchhaus, P., White, A. and Treweek, S. (2014). A gender-sensitised weight loss and healthy living programme for overweight and obese
37
men delivered by Scottish Premier League football clubs (FFIT): a pragmatic randomised controlled trial. Lancet, 383, 1211-1221 Information Services Division (ISD) Scotland. Quality Measurement Framework: Summary of Progress [Online]. Available at: http://www.isdscotland.org/Health-Topics/Quality-Measurement-Framework/Summary-of-Progress/ [Accessed 09 December 2014] ISD Scotland (2014a). Primary 1 Body Mass Index (BMI) Statistics: School Year 2012/13 [Online]. Available at: http://www.isdscotland.org/Health-Topics/Child-Health/Publications/2014-02-25/2014-02-25-P1-BMI-Statistics-Publication-2012-13-Report.pdf ISD Scotland (2014a). Practice Team Information (PTI) Annual Update (2012/13) [Online]. Available at: http://www.isdscotland.org/Health-Topics/General-Practice/Publications/2013-10-29/2013-10-29-PTI-Report.pdf ISD Scotland (2014b). Long Term Condition diagnoses – NHS Board of Residence [Online]. Available at: https://isdscotland.scot.nhs.uk/Health-Topics/Hospital-Care/Publications/2014-09-30/HEAT_Long_Term_Conditions_HB_Sep14.xls [Accessed 05 Dec 2014] ISD Scotland (2014c). Child Healthy Weight Interventions 2013/2014 [Online]. Available at: https://isdscotland.scot.nhs.uk/Health-Topics/Child-Health/Publications/2014-07-29/2014-07-29-ChildHealthyWeight-Report.pdf?47298830748 Inspiring Scotland. Go Play [Online]. Available at: http://www.inspiringscotland.org.uk/our-funds/previous-funds/go-play [Accessed 10 November 2014] Inspiring Scotland. Go2Play [Online]. Available at: http://www.inspiringscotland.org.uk/our-funds/go-2-play [Accessed 10 November 2014] McLaren, L. (2007). Socioeconomic Status and Obesity. Epidemiologic Reviews, 29, 29-48 McConville, S., Marcinkiewicz, A., Bradshaw, P., Calcutt, E., Hussey, D., Ormston, R. and Wills, W. (2013). Evaluation of the Child Healthy Weight Programme: Final Report [Online]. NHS Health Scotland. Available at: http://www.healthscotland.com/uploads/documents/22544-RE006%20Evaluation%20of%20Child%20Healthy%20Weight%20Programme%20Research%20Report%205122013.pdf McCormick, B., Stone, I. and Corporate Analytical Team (2007). Economic costs of obesity and the case for government intervention. Obesity Reviews, 8(Suppl. 1), 161-164 McKinsey Global Institute (2014). Overcoming obesity: An initial economic analysis [Online]. Available at: http://www.mckinsey.com/insights/economic_studies/how_the_world_could_better_fight_obesity Mooney, J., Haw, S. and Frank, J. (2012). Policy Interventions to Tackle the Obesogenic Environment [Online]. Scottish Collaboration for Public Health Research and Policy. Available at: http://www.scphrp.ac.uk/wp-content/uploads/2014/03/policy_interventions_to_tackle_the_obesogenic_environment.pdf National Audit Office Report by the Comptroller and Auditor General (2001). Tackling Obesity in England. London: The Stationery Office. Available at: http://www.nao.org.uk/wp-content/uploads/2001/02/0001220.pdf
38
National Institute for Health and Care Excellence (NICE). Who we are [Online]. Available at: http://www.nice.org.uk/about/who-we-are [Accessed 30 October 2014] NICE. Diet, nutrition and obesity [Online]. Available at: https://www.nice.org.uk/guidance/lifestyle-and-wellbeing/diet--nutrition-and-obesity [Accessed 05 November 2014] NICE (2006). Obesity: Guidance on the prevention, identification, assessment and management of overweight and obesity in adults and children (CG43). Last modified May 2014. London: NICE. Available at: https://www.nice.org.uk/guidance/cg43/resources/guidance-obesity-pdf NICE (2008a). Maternal and child nutrition (PH11). Last modified Nov 2014. London: NICE. Available at: http://www.nice.org.uk/guidance/ph11/resources/guidance-maternal-and-child-nutrition-pdf NICE (2010). Weight management before, during and after pregnancy (PH27). London: NICE. Available at: http://www.nice.org.uk/guidance/ph27/resources/guidance-weight-management-before-during-and-after-pregnancy-pdf NICE (2013a). Preventing obesity and helping people to manage their weight (LGB9). London: NICE. Available at: http://www.nice.org.uk/advice/lgb9/resources/non-guidance-preventing-obesity-and-helping-people-to-manage-their-weight-pdf NICE (2013b). Managing overweight and obesity among children and young people: lifestyle weight management services (PH47). London: NICE. Available at: http://www.nice.org.uk/guidance/ph47/resources/guidance-managing-overweight-and-obesity-among-children-and-young-people-lifestyle-weight-management-services-pdf NICE (2014a). Body mass index thresholds for intervening to prevent ill health among black, Asian and other minority ethnic groups (LGB13). London: NICE. Available at: http://www.nice.org.uk/advice/lgb13/resources/non-guidance-body-mass-index-thresholds-for-intervening-to-prevent-ill-health-among-black-asian-and-other-minority-ethnic-groups-pdf NICE (2014b). Managing overweight and obesity in adults – lifestyle weight management services (PH53). London: NICE. Available at: http://www.nice.org.uk/guidance/ph53/resources/guidance-managing-overweight-and-obesity-in-adults-lifestyle-weight-management-services-pdf National Records of Scotland. Age-standardised death rates using the European Standard Population [Online]. Available at: http://www.gro-scotland.gov.uk/files2/stats/age-standardised-death-rates-esp/age-standardised-death-ratesesp-background.pdf National Records of Scotland (2013). Mid-2011 and Mid-2012 Population Estimates Scotland: Population estimates by sex, age and administrative area [Online]. Available at: http://www.gro-scotland.gov.uk/files2/stats/population-estimates/mid2012/mid-2011-2012-pop-est.pdf NHS. Weight loss surgery – How is it performed [Online]. Available at: http://www.nhs.uk/Conditions/weight-loss-surgery/Pages/how-it-is-performed.aspx [Accessed 08 October 2014] NHS Greater Glasgow and Clyde. Glasgow and Clyde Weight Management Service [Online]. Available at: http://www.nhsggc.org.uk/content/default.asp?page=s1804 [Accessed 26 November 2014]

39
NHS Health Scotland (2014). Setting the Table: Nutritional guidance and good standards for early years childcare providers in Scotland. Edinburgh: NHS Health Scotland. Available at: http://www.healthscotland.com/uploads/documents/21130-SettingtheTable_1.pdf NHS Scotland (2012). HEAT Targets due for delivery in 2010/11: Summary of Performance [Online]. Available at: http://www.scotland.gov.uk/Resource/0039/00396886.pdf NHS Tayside (2012). Improving the nutrition of women of childbearing age, pregnant women and children under five in disadvantaged areas of Tayside. Available at: http://www.nhstayside.scot.nhs.uk/about_nhstay/publications/health_ineq/CEL%2036%20report.pdf [Accessed 16 October 2014] Office for National Statistics (2014). Statistical Bulletin: Annual Mid-year Population Estimates, 2013. Newport: Office for National Statistics. Available at: http://www.ons.gov.uk/ons/dcp171778_367167.pdf Organisation for Economic Co-operation and Development (OECD). Glossary of Statistical Terms: EU15 [Online]. Available at: http://stats.oecd.org/glossary/detail.asp?ID=6805 [Accessed 08 December 2014] OECD. OECD Health Statistics 2014: Non-Medical Determinants of Health: Body weight [Online]. Available at: http://stats.oecd.org/index.aspx?DataSetCode=HEALTH_STAT [Accessed 10 December 2014] Owen, C.G., Martin, R.M., Whincup, P.H., Davey-Smith, G., Gillman, M.W. and Cook, D.G. (2005). The effect of breastfeeding on mean body mass index throughout life: a quantitative review of published and unpublished observational evidence. American Journal of Clinical Nutrition, 82, 1298-1307 Paths for All [Online]. Available at: http://www.pathsforall.org.uk/pfa-home [Accessed 12 November 2014] Payne, J. and Hudson, N. (2013). Draft Budget 2015-16: Health and Sport. SB 14-72. Edinburgh: Scottish Parliament. Available at: http://www.scottish.parliament.uk/ResearchBriefingsAndFactsheets/S4/SB_14-72.pdf Public Bodies (Joint Working) (Scotland) Act 2014 asp 9. Available at: http://www.legislation.gov.uk/asp/2014/9/pdfs/asp_20140009_en.pdf [Accessed 10 November 2014] Public Health England (2013). International Comparisons: Adult obesity prevalence [Online]. Available at: http://www.noo.org.uk/NOO_about_obesity/adult_obesity/international [Accessed 07 October 2014] Royal College of Physicians (2013). Action on obesity: comprehensive care for all. Report of a working party. London: Royal College of Physicians. Available at: https://www.rcplondon.ac.uk/sites/default/files/action-on-obesity.pdf Royal College of Physicians of Ireland (2014). The race we don’t want to win: Tackling Ireland’s obesity epidemic. Report of the Policy Group on Obesity. Dublin: Royal College of Physicians of Ireland. Available at: http://www.rcpi.ie/content/docs/000001/2051_5_media.pdf?1409562906
40
Scarborough, P., Bhatnagar, P., Wickramasinghe, K.K., Allender, S., Foster, C. and Rayner, M. (2011). The economic burden of ill health due to diet, physical inactivity, smoking, alcohol and obesity in the UK: an update to 2006–07 NHS costs. Journal of Public Health, 33(4): 527-535. Scottish Centre for Healthy Working Lives [Online]. Available at: http://www.healthyworkinglives.com/ [Accessed 11 November 2014] Scottish Executive (2002). Hungry for Success: A Whole School Approach to School Meals in Scotland. Edinburgh: Scottish Executive. Available at: http://www.scotland.gov.uk/Resource/Doc/47032/0023961.pdf Scottish Executive (2003). Let’s make Scotland more active: A strategy for physical activity. Report of the Physical Activity Task Force. Edinburgh: Scottish Executive. Available at: http://www.scotland.gov.uk/Resource/Doc/47032/0017726.pdf Scottish Government. 2020 Vision [Online]. Available at: http://www.scotland.gov.uk/Topics/Health/Policy/2020-Vision [Accessed 20 October 2014] Scottish Government. Active: Overview [Online]. Available at: http://www.scotland.gov.uk/Topics/ArtsCultureSport/Sport/MajorEvents/Glasgow-2014/Commonwealth-games/Indicators/Active [Accessed 11 November 2014] Scottish Government. Getting it right for every child (GIRFEC) [Online]. Available at: http://www.scotland.gov.uk/Topics/People/Young-People/gettingitright [Accessed 10 November 2014] Scottish Government. HEAT Standards [Online]. Available at: http://www.scotland.gov.uk/About/Performance/scotPerforms/partnerstories/NHSScotlandperformance/HEATstandards [Accessed 25 November 2014] Scottish Government. HEAT Target 7: Exclusively breastfed [Online]. Available at: http://www.scotland.gov.uk/About/scotPerforms/partnerstories/NHSScotlandperformance/breastfeeding [Accessed 16 October 2014] Scottish Government. Joint Obesity Group [Online]. Available at: http://www.scotland.gov.uk/Topics/Health/Healthy-Living/Healthy-Eating/Joint-Obesity-Group [Accessed 24 November 2014] Scottish Government. National Indicators [Online]. Available at: http://www.scotland.gov.uk/About/Performance/scotPerforms/indicator [Accessed 22 October 2014] Scottish Government. National Outcomes [Online]. Available at: http://www.scotland.gov.uk/About/Performance/scotPerforms/outcome [Accessed 22 October 2014] Scottish Government. Our Purpose: Population [Online]. Available at: http://www.scotland.gov.uk/About/Performance/scotPerforms/purpose/population [Accessed 21 October 2014] Scottish Government. Scotland Performs: NHSScotland [Online]. Available at: http://www.scotland.gov.uk/About/Performance/scotPerforms/partnerstories/NHSScotlandperformance [Accessed 03 November 2014]
41
Scottish Government. Scottish Sustainable Communities Initiative [Online]. Available at: http://www.scotland.gov.uk/topics/built-environment/aandp/projects/ssci [Accessed 10 November 2014] Scottish Government. Strategic Objectives: Healthier [Online]. Available at: http://www.scotland.gov.uk/About/Performance/scotPerforms/objectives/healthier [Accessed 22 October 2014] Scottish Government. The Quality Measurement Framework [Online]. Available at: http://www.scotland.gov.uk/Topics/Health/Policy/Quality-Strategy/Quality-Measurement-Framework [Accessed 21 October 2014] Scottish Government (2008a). Healthy Eating, Active Living: An action plan to improve diet, increase physical activity and tackle obesity (2008-2011). Edinburgh: Scottish Government. Available at: http://www.scotland.gov.uk/Resource/Doc/228860/0061963.pdf Scottish Government (2008b). Healthy Eating in Schools: A guide to implementing the nutritional requirements for food and drinks in schools (Scotland) regulation 2008. Edinburgh: Scottish Government. Available at: http://www.scotland.gov.uk/Resource/Doc/238187/0065394.pdf Scottish Government (2010a). Preventing Overweight and Obesity in Scotland: A Route Map Towards Healthy Weight. Edinburgh: Scottish Government. Available at: http://www.scotland.gov.uk/Resource/Doc/302783/0094795.pdf Scottish Government (2010b). The Healthcare Quality Strategy for NHSScotland. Edinburgh: Scottish Government. Available at: http://www.scotland.gov.uk/publications/2010/05/10102307/0 Scottish Government (2011a). The Scottish Health Survey: Topic Reports; Obesity. Edinburgh: Scottish Government. Available at: http://scotland.gov.uk/Resource/0038/00389668.pdf Scottish Government (2011b). Prevention of Obesity Route Map – Action Plan. Edinburgh: Scottish Government. Available at: http://www.scotland.gov.uk/Resource/0038/00386315.pdf Scottish Government (2011c). Catering for Change. Buying food sustainably in the public sector. Edinburgh: Scottish Government. Available at: http://www.scotland.gov.uk/resource/doc/337607/0110844.pdf Scottish Government (2011d). Good Places Better Health for Scotland’s Children. Report by the Evaluation Group of Good Places Better Health. Edinburgh: Scottish Government. Available at: http://www.scotland.gov.uk/Resource/0039/00398236.pdf Scottish Government (2011e). Improving Maternal and Infant Nutrition: A Framework for Action. Edinburgh: Scottish Government. Available at: http://www.scotland.gov.uk/Resource/Doc/337658/0110855.pdf Scottish Government (2011f). National Performance Framework. Edinburgh: Scottish Government. Available at: http://www.scotland.gov.uk/Resource/Doc/933/0124202.pdf Scottish Government (2011g). Prevention of Obesity Route Map – Analytic Framework. Edinburgh: Scottish Government. Available at: http://www.scotland.gov.uk/resource/0038/00387828.pdf
42
Scottish Government (2011h). Indicators to Monitor Progress of the Prevention of Obesity Route Map. Edinburgh: Scottish Government. Available at: http://www.scotland.gov.uk/Resource/0038/00386316.pdf Scottish Government (2013a). Health Board Tables 2011 [Online]. Available at: http://www.scotland.gov.uk/Topics/Statistics/Browse/Health/scottish-health-survey/Publications/healthboard2011xls [Accessed 10 December 2014] Scottish Government (2013b). Revised Dietary Goals for Scotland. Edinburgh: Scottish Government. Available at: http://www.scotland.gov.uk/Resource/0042/00421385.pdf Scottish Government (2014a). The Scottish Health Survey 2013. Edinburgh: Scottish Government. Available at: http://www.scotland.gov.uk/Resource/0046/00464858.pdf Scottish Government (2014b). Better Eating, Better Learning: A New Context for School Food. Edinburgh: Scottish Government. Available at: http://www.scotland.gov.uk/Resource/0044/00445740.pdf Scottish Government (2014c). Beyond the School Gate: Improving food choices in the school community. Edinburgh: Scottish Government. Available at: http://www.scotland.gov.uk/Resource/0044/00449317.pdf Scottish Government (2014d). Scottish Planning Policy. Edinburgh: Scottish Government. Available at: http://www.scotland.gov.uk/Resource/0045/00453827.pdf [Accessed 10 November 2014] Scottish Government (2014e). A More Active Scotland: Building a Legacy from the Commonwealth Games. Edinburgh: Scottish Government. Available at: http://www.scotland.gov.uk/Resource/0044/00444577.pdf Scottish Government (2014f). Obesity Indicators 2014: Monitoring Progress for the Prevention of Obesity Route Map. Edinburgh: Scottish Government. Available at: http://www.scotland.gov.uk/Resource/0046/00464835.pdf Scottish Government (2014g). Personal communication. [Unpublished]. Scottish Grocers Federation. SGF Healthy Living Programme [Online]. Available at: http://www.scottishshop.org.uk/sgfhlp [Accessed 10 November 2014] Scottish Health Technologies Group (SHTG) (2010a). Weight management programmes for adults [Online]. Available at: http://www.healthcareimprovementscotland.org/our_work/technologies_and_medicines/earlier_evidence_notes/evidence_note_29.aspx SHTG (2010b). Bariatric surgery in adults [Online]. Available at: http://www.healthcareimprovementscotland.org/our_work/technologies_and_medicines/earlier_evidence_notes/evidence_note_28.aspx Scottish Intercollegiate Guidance Network (SIGN) (2010). Management of obesity: A national clinical guideline. Edinburgh: SIGN. Available at: http://www.sign.ac.uk/pdf/sign115.pdf SIGN (2012). 2012 Updated Memorandum of Understanding Between the Scottish Intercollegiate Guidelines Network and the National Institute for Health and Care Excellence [Online]. Available at: http://www.sign.ac.uk/about/niceandsign.html
43
Scottish Medicines Consortium. A Guide to Quality-Adjusted Life Years [Online]. Available at: http://www.scottishmedicines.org.uk/About_SMC/Policy_Statements/A_Guide_to_Quality_Adjusted_Life_Years [06 November 2014] Scottish Parliament. Inflation Tool [Online]. Available at: http://www.scottish.parliament.uk/parliamentarybusiness/63552.aspx [Accessed 20 November 2014] SportScotland. Active Schools [Online]. Available at: http://www.sportscotland.org.uk/about_us/what_we_do/school_sport/active_schools_programmes/ [Accessed 10 November 2014] Take Life On [Online]. Available at: http://www.takelifeon.co.uk/ [Accessed 10 November 2014] The Public Bodies (Joint Working) (National Health and Wellbeing Outcomes) (Scotland) Regulations 2014. SSI 2014/343. Available at: http://www.legislation.gov.uk/ssi/2014/343/introduction/made [Accessed 10 November 2014] The Knowledge Network. Tayside Nutrition: Optimum [Online]. NHS Education for Scotland Knowledge Services Group. Available at: http://www.knowledge.scot.nhs.uk/taysidenutrition/family-nutrition/community-news/optimum.aspx [Accessed 26 November 2014] Tigbe, W.W., Briggs, A.H. and Lean, M.E.J. (2013). A patient-centred approach to estimate total annual healthcare cost by body mass index in the UK Counterweight programme. International Journal of Obesity, 37(8), 1135-1139 Transport Scotland. Smarter Choices, Smarter Places [Online]. Available at: http://www.transportscotland.gov.uk/environment/smarter-choices-smarter-places [Accessed 10 November 2014] Transport Scotland (2013). Cycling Action Plan for Scotland 2013. Glasgow: Transport Scotland. Available at: http://www.transportscotland.gov.uk/sites/default/files/documents/rrd_reports/uploaded_reports/j0002/CAPS_2013_-_final_draft_-_19_June_2013.pdf Vlassopoulos, A., Combet, E. and Lean, M.E.J. (2013). Changing distributions of body size and adiposity with age. International Journal of Obesity, 38(6), 857-864 Walker, A. (2003). The Cost of Doing Nothing – the economics of obesity in Scotland. National Obesity Forum. Wang, B.C.M. and Furnback, W. (2013). Modelling the long-term outcomes of bariatric surgery: A review of cost-effectiveness studies. Best Practice & Research Clinical Gasteroenterology, 27, 987-995. Welsh Government (2014). Welsh Health Survey 2013: initial headline results. Cardiff: Welsh Government. Available at: http://wales.gov.uk/docs/statistics/2014/140521-welsh-health-survey-2013-initial-headline-results-en.pdf WHO (2000). Obesity: preventing and managing the global epidemic. Geneva: WHO. Available at: http://whqlibdoc.who.int/trs/WHO_TRS_894.pdf?ua=1
44
WHO (2014). Obesity and Overweight: Fact Sheet No. 311 [Online]. Available at: http://www.who.int/mediacentre/factsheets/fs311/en/ [Accessed 07 October 2014] WHO Regional Office for Europe (2012). Social determinants of health and well-being among young people: Health Behaviour in School-Aged Children (HBSC) Study: An International Report From the 2009/2010 Survey. Copenhagen: WHO Regional Office for Europe. Available at: http://www.euro.who.int/__data/assets/pdf_file/0003/163857/Social-determinants-of-health-and-well-being-among-young-people.pdf WHO Regional Office for Europe (2013a). Country profiles on nutrition, physical activity and obesity in the 53 WHO European Region Member States: Methodology and summary. Copenhagen: WHO Regional Office for Europe. Available at: http://www.euro.who.int/__data/assets/pdf_file/0004/243337/Summary-document-53-MS-country-profile.pdf?ua=1 WHO Regional Office for Europe (2013b). Vienna Declaration on Nutrition and Noncommunicable Diseases in the Context of Health 2020. Copenhagen: WHO Regional Office for Europe. Available at: http://www.euro.who.int/__data/assets/pdf_file/0003/234381/Vienna-Declaration-on-Nutrition-and-Noncommunicable-Diseases-in-the-Context-of-Health-2020-Eng.pdf?ua=1 Wolk, R., Shamsuzzaman, A.S.M., Somers, V.K. (2003). Obesity, Sleep Apnea, and Hypertension. Hypertension, 42, 1067-1074

45
APPENDIX 1: RELEVANT NPF NATIONAL INDICATORS
Data on current performance was obtained from Scotland Performs.
National Indicator Recent Performance
Increase the proportion of healthy weight children
Increase the proportion of babies with a healthy birth weight
Improve self-assessed general health
Reduce premature mortality
Reduce emergency admissions to hospital
Increase physical activity
Increase people’s use of Scotland’s outdoors
Increase the proportion of journeys to work made by public or active transport
Performance improving Performance maintaining Performance worsening
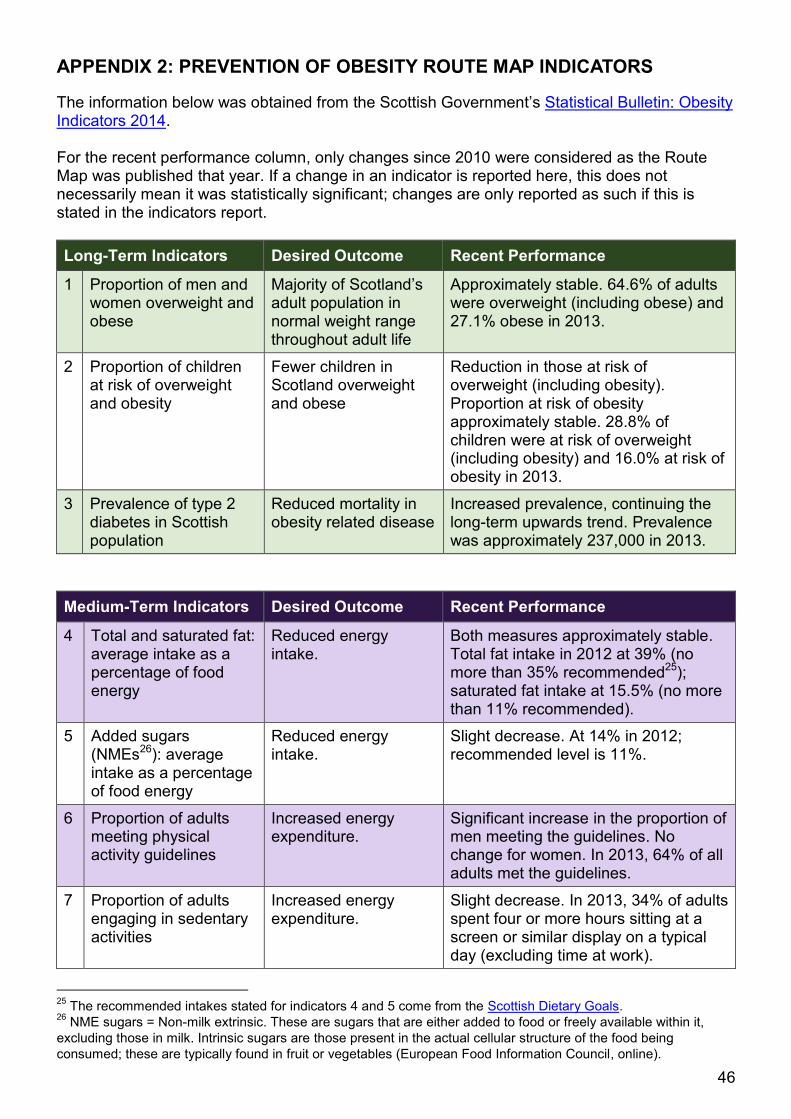
46
APPENDIX 2: PREVENTION OF OBESITY ROUTE MAP INDICATORS
The information below was obtained from the Scottish Government’s Statistical Bulletin: Obesity Indicators 2014. For the recent performance column, only changes since 2010 were considered as the Route Map was published that year. If a change in an indicator is reported here, this does not necessarily mean it was statistically significant; changes are only reported as such if this is stated in the indicators report.
Long-Term Indicators Desired Outcome Recent Performance
1 Proportion of men and women overweight and obese
Majority of Scotland’s adult population in normal weight range throughout adult life
Approximately stable. 64.6% of adults were overweight (including obese) and 27.1% obese in 2013.
2 Proportion of children at risk of overweight and obesity
Fewer children in Scotland overweight and obese
Reduction in those at risk of overweight (including obesity). Proportion at risk of obesity approximately stable. 28.8% of children were at risk of overweight (including obesity) and 16.0% at risk of obesity in 2013.
3 Prevalence of type 2 diabetes in Scottish population
Reduced mortality in obesity related disease
Increased prevalence, continuing the long-term upwards trend. Prevalence was approximately 237,000 in 2013.
Medium-Term Indicators Desired Outcome Recent Performance
4 Total and saturated fat: average intake as a percentage of food energy
Reduced energy intake.
Both measures approximately stable. Total fat intake in 2012 at 39% (no more than 35% recommended25); saturated fat intake at 15.5% (no more than 11% recommended).
5 Added sugars (NMEs26): average intake as a percentage of food energy
Reduced energy intake.
Slight decrease. At 14% in 2012; recommended level is 11%.
6 Proportion of adults meeting physical activity guidelines
Increased energy expenditure.
Significant increase in the proportion of men meeting the guidelines. No change for women. In 2013, 64% of all adults met the guidelines.
7 Proportion of adults engaging in sedentary activities
Increased energy expenditure.
Slight decrease. In 2013, 34% of adults spent four or more hours sitting at a screen or similar display on a typical day (excluding time at work).
25
The recommended intakes stated for indicators 4 and 5 come from the Scottish Dietary Goals. 26
NME sugars = Non-milk extrinsic. These are sugars that are either added to food or freely available within it,
excluding those in milk. Intrinsic sugars are those present in the actual cellular structure of the food being
consumed; these are typically found in fruit or vegetables (European Food Information Council, online).

47
8 Proportion of children meeting physical activity guidelines
Increased energy expenditure.
Slight increase. In 2013, 75% of children met the physical activity recommendations.
9 Proportion of children engaging in sedentary activities
Increased energy expenditure.
Slight decrease between 2010 and 2013, although slight increase between 2012 and 2013. In 2013, 11.2% of children spent four or more hours sitting at a screen or similar display on a typical day (excluding time at school).
Short-Term Indicators Desired Outcome Recent Performance
10 Number of businesses securing healthy living award (and HLA Plus)
Reduced consumption of high energy food and drink in workplaces.
The number of sites holding the HLA has remained approximately stable, while increasing numbers now hold the HLA Plus.
11 Volume of sales of soft drinks with added sugar
Reduced consumption of high energy food and drink.
Moderate reduction. Volume of “regular soft drinks27” consumed was 190 million litres in 2013.
12 Volume of sales of confectionery, biscuits, cakes and pastries
Reduced consumption of high energy food and drink.
Sales of biscuits and confectionery have been stable, while sales of cakes and pastries dropped slightly between 2010 and 2013.
13 Proportion of population who have tried making positive behaviour change in relation to healthy eating and physical activity.
Increased awareness, knowledge, skills and empowerment.
No clear recent changes. In 2011, approximately 50% of adults had either tried to improve their diet or already had a healthy diet, while 56% had either tried to become more active or already met the physical activity recommendations.
14 Proportion of adults engaging in active travel to work
Promotion of active travel.
No clear recent changes. In 2013, 15% of adults walked or cycled to work.
15 Proportion of children engaging in active travel to school
Promotion of active travel.
No clear recent changes. In 2013, 53% of children walked or cycled to work.
16 Number of workplaces securing Healthy Working Lives Award
Promotion of active workplaces.
As of October 2014, 1129 organisations were registered for the programme. 569 of these attained at least a Bronze award.
27
See the indicators report (Scottish Government, 2014f) for a definition of “regular soft drinks”.
48
Scottish Parliament Information Centre (SPICe) Briefings are compiled for the benefit of the Members of the Parliament and their personal staff. Authors are available to discuss the contents of these papers with MSPs and their staff who should contact Jude Payne on extension 85364 or email [email protected]. Members of the public or external organisations may comment on this briefing by emailing us at [email protected]. However, researchers are unable to enter into personal discussion in relation to SPICe Briefing Papers. If you have any general questions about the work of the Parliament you can email the Parliament’s Public Information Service at [email protected].
Every effort is made to ensure that the information contained in SPICe briefings is correct at the time of publication. Readers should be aware however that briefings are not necessarily updated or otherwise amended to reflect subsequent changes.
Published by the Scottish Parliament Information Centre (SPICe), The Scottish Parliament, Edinburgh, EH 99 1SP
www.scottish.parliament.uk