spider and leafhopper (erythroneura spp.) response to
TRANSCRIPT

COMMUNITY AND ECOSYSTEM ECOLOGY
Spider and Leafhopper (Erythroneura spp.) Response to Vineyard Ground Cover
MICHAEL J. COSTELLO1 AND KENT M. DAANE
Center for Biological Control, Division of Insect Biology, Department of Environmental Science, Policy and Management, University of California, Berkeley, CA 94720
Environ. Entomol. 32(5): 1085Ð1098 (2003)
ABSTRACT Ground cover is used in some vineyards to improve soil structure and help manage insect pests; previous studies have shown lower leafhopper (Erythroneura spp.) densities on vines grown with ground cover. We undertook a 2-yr study to determine why ground cover is associated with reduced leafhopper densities. Ground cover consisted of a fall-planted cover crop of purple vetch (Vicia benghalensis) and barley (Hordeum vulgare), which senesced in May and was replaced by a complex of resident vegetation comprised primarily of the grasses Echinochloa spp., Digitaria sanguinalis, and Setaria spp., as well as common knotweed (Polygonum aviculare). We compared three treatments during the growing season: Cover, No Cover, and Cover/Exclusion. Cover/Exclusion was similar to Cover treatment but with barriers to impede arthropod movement between ground cover and vines. We measured leafhopper density and egg parasitism, spider density and diversity, and grapevine vigor, and found that mid- and late-season leafhopper densities were signiÞcantly lower in Cover versus No Cover. Neither leafhopper egg parasitism nor spider density on the vines or ground cover could explain these differences; however, grapevine vigor was signiÞcantly lower in Cover than No Cover, and provides the best correlation to leafhopper density. Late-season leafhopper density was highest in the Exclusion treatment but cannot be explained by changes in grapevine vigor. Individual spider species composition and density on the grapevine canopy varied signiÞcantly among treatments: Trachelas pacificus (Chamberlin and Ivie) was higher in the Cover treatment, Hololena nedra Chamberlin and Ivie, Cheiracanthium inclusum (Hentz), and Neoscona oaxacensis (Keyserling) were lower in the Exclusion treatment, and Oxyopes spp. was higher in the Exclusion treatment. We suggest the lower densities of leafhoppers in the Cover treatment resulted from poorer host plant quality because of the competition between ground cover and grapevines. The higher late-season leafhopper densities in the Exclusion treatment may be due to changes in spider species composition, and subsequently, differences in rates of predation on leafhopper nymphs.
KEY WORDS grapes, Anagrus, cover crops, vineyard
INCREASING PLANT DIVERSITY in agroecosystems has become an integral part of integrated pest management (IPM) theory and practice (Andow 1991, Bugg and Waddington 1994, Landis et al. 2000). Studies have focused on the densities of herbivorous and entomophagous arthropods in systems using practices such as intercropping (Ampong-Nyarko 1994, Williams et al. 1995), ground covers (Rieux et al. 1999, Brown et al. 1997), mulching (Halaj et al. 2000), and hedgerows (Rieux et al. 1999). Proposed hypotheses to explain increased natural enemy density in more diverse agroecosystems include an increase in the availability and breadth of alternative food sources, such as prey or plant pollen and nectar (Bugg et al. 1987, Andow 1991, Grafton-Cardwell and Ouyang 1996) and an improvement to the physical environment for natural enemies,
1 Current address: Horticulture and Crop Science Department, California Polytechnic State University, San Luis Obispo, CA 93407.
such as improved habitat (van Emden 1990, Riechert and Bishop 1990) or a more favorable microclimate (Riechert and Gillespie 1986, Tonhasca 1993, Orr et al. 1997). Still, increased plant diversity does not produce consistent results. Andow (1985) reviewed 228 studies of arthropod response to increased plant diversity and found predator density increased (in 48% of the studies), decreased (14%), or had a variable response (25%). Most of these studies focused on the total abundance of entomophagous arthropods in the agroecosystem, although few categorized the response of individual predator species or separated the predator abundance and species composition on the cash crop from the alternate crop or vegetation (Nentwig 1988, Frank and Nentwig 1995, Topping and Lovei 1997). Still fewer studies have investigated the movement of natural enemies or prey between the cash crop and the alternate crop or vegetation, even though a signiÞcant migration of natural enemies or prey between these
0046-225X/03/1085Ð1098$04.00/0 � 2003 Entomological Society of America

1086 ENVIRONMENTAL ENTOMOLOGY Vol. 32, no. 5
vegetational components is implied (but see Perfecto et al. 1986, Landis et al. 2000). In California vineyards, cover crops have long been
used for improved soil quality and, more recently, pest management (Ingels and Klonsky 1998). Many anecdotal observations have been made by growers and other practitioners suggesting that vineyards with cover crops suppress two leafhopper pests of grapes (Erythroneura variabilis Beamer and Erythroneura elegantula Osborn) (Wilson et al. 1992). Indeed, our survey work found a signiÞcant reduction in leafhopper densities on vines grown with a permanent ground cover compared with clean cultivation (Daane and Costello 1998). In these vineyards, spiders were the dominant leafhopper predator (Costello and Daane 1999), such as they are in many agroecosystems (Nyfeller and Benz 1987, Nyfeller et al. 1994). Furthermore, spiders have been assumed to play a role in leafhopper suppression in California vineyards (Wilson et al. 1992, Roltsch et al. 1998). Spider density in other agroecosystems has been increased through strip-mowing (Nentwig 1988), straw mulches (Riechert and Bishop 1990, Halaj et al. 2000), strips of weedy vegetation (Jmhasly and Nentwig 1995, Wyss et al. 1995), and intercropping (Letourneau 1990), although in contrast, Ali and Reagan (1986) did not Þnd consistent differences in spider diversity in weedy versus weed-free sugarcane. It is unclear how ground covers might inßuence
speciÞc vineyard spider species densities or how changes in spider density, species richness, or diversity might inßuence leafhopper densities. One of our studies showed no consistent differences in total spider density on grapevines (where leafhopper nymphs are found) grown with ground cover or not (Costello and Daane 1998a). An alternative hypothesis is the possible inßuence of ground covers on grapevine vigor. Competition for water and nutrients between ground covers and grapevines has been shown experimentally (Wolpert et al. 1993) and lower grapevine vigor (manipulated through changes in applied irrigation amounts) has been correlated with lower leafhopper densities (Daane et al. 1995). This study was undertaken to test the hypothesis
that maintaining a permanent ground cover (i.e., a planted cover crop plus the resident vegetation) during the grape growing season had the effect of reducing leafhopper nymphal density on the grapevines. Erythroneura leafhoppers overwinter as adults, feeding on weeds, citrus, and other vegetation, and have three generations on grapevines during the growing season (Wilson et al. 1992). Here, results are presented from a 2-yr study on the inßuence of vineyard ground cover on spider density and diversity, leafhopper density, and grapevine vigor. The cover crop mixture and ßoor management practices we used were typical of many grape growers in eastern Fresno and Tulare counties. The results are used to discuss whether change in leafhopper density is from two separate but potentially interactive factors: 1) enhanced biological control (in this case, from spiders) and 2) reduced host plant quality that results from a
competition between ground cover and grapevines for water and nutrients.
Materials and Methods
Plot Establishment. The study was conducted at the Kearney Agricultural Center near the city of Parlier, in CaliforniaÕs San Joaquin Valley. The region is characterized by hot dry summers (an average high July temperature of 37�C) and mild winters (an average annual precipitation of 269 mm, which falls primarily between October and April). The study site was a 40-yr-old, 0.5-ha block of Vitis vinifera L. (cultivar ÔThompson SeedlessÕ) planted in a Hanford sandy loam soil. Grapevine spacing was 3.6 m between rows and 2.4 m between vines within in each row. The ground cover consisted of a seeded annual
cover crop followed by a complex of resident vegetation. In October 1992, the entire block was seeded with a 3:1 mixture of purple vetch (Vicia benghalensis L.) and barley (Hordeum vulgare L.) at 50 kg ha�1. This cover crop mixture matured over the winter, set seed in April, and senesced by the end of May. During spring and summer it was gradually replaced by a complex of resident vegetation, which was primarily composed of grasses (including Echinochloa spp., Digitaria sanguinalis [L.] Scopoli, and Setaria spp.) and common knotweed (primarily Polygonum aviculare L.). Resident vegetation within the grapevine row included the above named grasses, as well as horseweed (Conyza canadensis [L.]) and prickly lettuce (Lactuca serriola L). We tested three treatments: 1) CoverÑhere we left
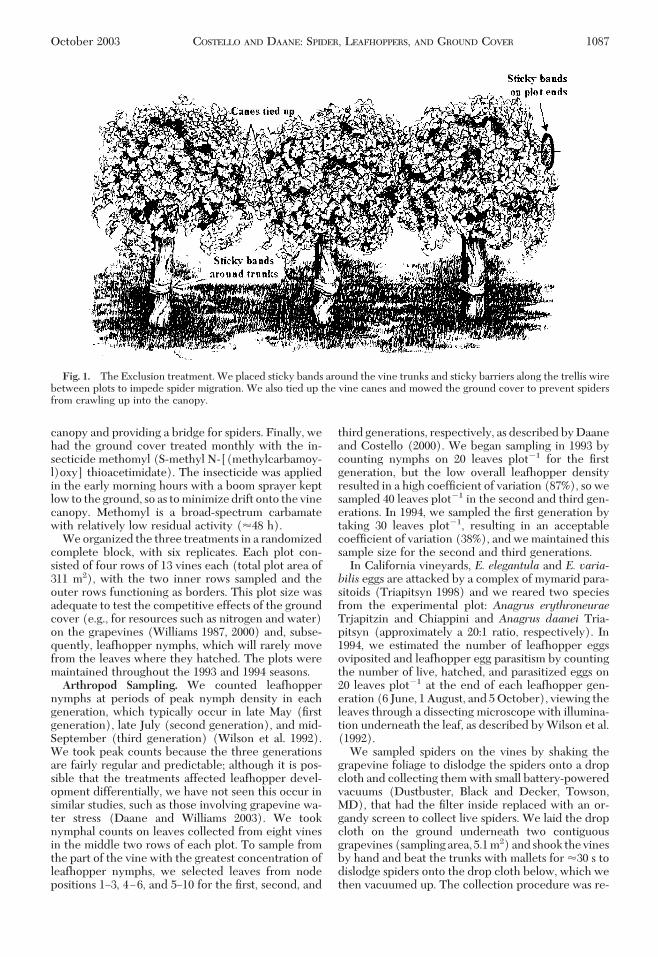
the ground cover within the row (under the vines) unmowed, to provide an undisturbed refuge for spiders, but mowed the ground cover between the rows (the ÔmiddlesÕ) monthly, beginning in March. 2) No CoverÑhere we cultivated the ground cover every month (mechanically between rows or by hand within the row), beginning in March. 3) Exclusion (Fig. 1)Ñ this was similar to the Cover treatment, except that we blocked spider migration between the ground cover and the grapevines and to decrease the suitability of the ground cover as a spider habitat. The purpose of this treatment was to remove the biotic inßuence of the ground cover on spiders, without altering other possible biotic or abiotic inßuences (i.e., competition with the grapevines for water and nutrients, or changes in microclimate) or abiotic inßuences (i.e., changes in microclimate). First, we placed a 15-cmwide barrier of duct tape covered with adhesive (Stickem, Seabright, Emeryville, CA) around each grapevine trunk (Fig. 1). The adhesive was renewed every month. Second, we cut back grapevine canes and placed a cardboard sticky barrier on the trellis wire to prevent spider migration between plots; the sticky barriers were replaced as they became weathered. Third, we lifted and tied the grapevine shoots to prevent them from touching the ground cover and providing a bridge for migrating spiders. Fourth, the ground cover within the vine row was mowed monthly to prevent it from growing up into the grapevine
1087 October 2003 COSTELLO AND DAANE: SPIDER, LEAFHOPPERS, AND GROUND COVER
Fig. 1. The Exclusion treatment. We placed sticky bands around the vine trunks and sticky barriers along the trellis wire between plots to impede spider migration. We also tied up the vine canes and mowed the ground cover to prevent spiders from crawling up into the canopy.
canopy and providing a bridge for spiders. Finally, we had the ground cover treated monthly with the insecticide methomyl (S-methyl N-[(methylcarbamoyl)oxy] thioacetimidate). The insecticide was applied in the early morning hours with a boom sprayer kept low to the ground, so as to minimize drift onto the vine canopy. Methomyl is a broad-spectrum carbamate with relatively low residual activity (�48 h). We organized the three treatments in a randomized
complete block, with six replicates. Each plot consisted of four rows of 13 vines each (total plot area of 311 m2), with the two inner rows sampled and the outer rows functioning as borders. This plot size was adequate to test the competitive effects of the ground cover (e.g., for resources such as nitrogen and water) on the grapevines (Williams 1987, 2000) and, subsequently, leafhopper nymphs, which will rarely move from the leaves where they hatched. The plots were maintained throughout the 1993 and 1994 seasons.
Arthropod Sampling. We counted leafhopper nymphs at periods of peak nymph density in each generation, which typically occur in late May (Þrst generation), late July (second generation), and mid-September (third generation) (Wilson et al. 1992). We took peak counts because the three generations are fairly regular and predictable; although it is possible that the treatments affected leafhopper development differentially, we have not seen this occur in similar studies, such as those involving grapevine water stress (Daane and Williams 2003). We took nymphal counts on leaves collected from eight vines in the middle two rows of each plot. To sample from the part of the vine with the greatest concentration of leafhopper nymphs, we selected leaves from node positions 1Ð3, 4Ð6, and 5Ð10 for the Þrst, second, and
third generations, respectively, as described by Daane and Costello (2000). We began sampling in 1993 by counting nymphs on 20 leaves plot�1 for the Þrst generation, but the low overall leafhopper density resulted in a high coefÞcient of variation (87%), so we sampled 40 leaves plot�1 in the second and third generations. In 1994, we sampled the Þrst generation by taking 30 leaves plot�1, resulting in an acceptable coefÞcient of variation (38%), and we maintained this sample size for the second and third generations. In California vineyards, E. elegantula and E. varia
bilis eggs are attacked by a complex of mymarid parasitoids (Triapitsyn 1998) and we reared two species from the experimental plot: Anagrus erythroneurae Trjapitzin and Chiappini and Anagrus daanei Triapitsyn (approximately a 20:1 ratio, respectively). In 1994, we estimated the number of leafhopper eggs oviposited and leafhopper egg parasitism by counting the number of live, hatched, and parasitized eggs on 20 leaves plot�1 at the end of each leafhopper generation (6 June, 1 August, and 5 October), viewing the leaves through a dissecting microscope with illumination underneath the leaf, as described by Wilson et al. (1992). We sampled spiders on the vines by shaking the
grapevine foliage to dislodge the spiders onto a drop cloth and collecting themwith small battery-powered vacuums (Dustbuster, Black and Decker, Towson, MD), that had the Þlter inside replaced with an organdy screen to collect live spiders. We laid the drop cloth on the ground underneath two contiguous grapevines (sampling area, 5.1 m2) and shook the vines by hand and beat the trunks with mallets for �30 s to dislodge spiders onto the drop cloth below, which we then vacuumed up. The collection procedure was re

1088 ENVIRONMENTAL ENTOMOLOGY Vol. 32, no. 5
peated, and the total number of spiders collected from the two shakings constituted the sample. We sampled two randomly selected vines in each plot on each sample date. We sampled spiders on the ground cover using a D-vac, which is a gasoline-powered blower-vacuum (Echo Inc., Lake Zurich, IL) that had an intake rate of 15.3 m3 min�1 when Þtted with a 10-cm diameter oriÞce. We took samples from two randomly selected 1 � 1.5-m sections of ground cover, deÞned by a wooden frame. For both grapevine and ground cover, we took monthly samples from May to September, between 0700 and 1200 h (PaciÞc daylight time) on each sample date. We stored collected spiders in 70% EtOH and later identiÞed them to genus or species. A more detailed description of the sampling methodology is found in Costello and Daane (1995). We did not sample the bare soil in the No Cover treatment.
Grapevine Measurements. We used two standard measurements of grapevine vigor: leaf nitrogen (N) status and pruning weight (Williams et al. 1994). In May, we estimated leaf N status by randomly collecting 30 leaf petioles, each located opposite a grape cluster. We dried the petioles at 40�C for 2 d, ground them to a powder, and then analyzed them for total N (reported as percentage dry weight, analysis performed by the University of California Analytical Laboratory, Davis, CA). In December, we pruned two vines in each plot and weighed the cuttings, which provided an estimate of shoot growth.
Statistical Analyses. From data collected on the grapevines, we present arthropod mean densities as leafhopper nymphs leaf�1, eggs leaf�1, hatched eggs leaf�1, percentage Anagrus spp. parasitism leaf�1, and total spiders vine�1. We present total number of spiders collected from the ground cover. In addition, we analyzed density of the seven most abundant spider taxa from grapevine samples. We conducted analyses of leafhopper and egg densities, and percentage Anagrus parasitism for each year of the study, and for spiders on the ground cover combining both yearÕs data, using analysis of variance (ANOVA) and separating treatment means using TukeyÕs honestly significant difference (HSD) test. Spider densities on the vines were analyzed for each year by repeated-measures ANOVA, separating mean treatments by orthogonal contrasts, contrasting Cover versus No Cover, and Exclusion versus Cover � No Cover treatments. On the grapevines and ground cover, we estimated
spider diversity using the Inverse Simpson Index (Krebs 1989), given by:
D � 1/� p 2 i [1]
where p � proportion of species i in the community. Differences among treatments were separated using ANOVA. We estimated spider species similarity among grapevine and ground cover samples by the Bray-Curtis measure of dissimilarity (Bray and Curtis 1957), given by:
� � Xij � Xik � B � [2]
� �Xij � Xik)
where Xij, Xik �percentage of species i in each sample. We present this index as a measure of similarity by using the complement of B, (1 Ð B), as suggested by Wolda (1981), with values ranging from 0 (dissimilar) to 1 (similar). We also regressed cumulative spider density plot�1 (all species combined and individual species) against cumulative leafhopper nymphal density plot�1, combining data from both years. To analyze the interaction between species, we chose to regress cumulative seasonal spider density plot�1 of the numerically dominant spider species, Cheiracanthium inclusum (Hentz), against the six other spider taxa using simple linear regression (SAS Institute 1999). This analysis provided a more visual representation of the interactions than a chi-square test of similarity. We also used stepwise multiple regressions in an attempt to Þnd a model that would explain interaction among spider species, using cumulative seasonal density plot�1 of C. inclusum as the dependent variable and cumulative seasonal density plot�1
of the other six spider taxa as independent variables. No independent variable was included in the model if it did not meet a signiÞcance level of P � 0.15.
Results
Leafhopper Density. There was a signiÞcant year � year effect on nymphal density in each generation (Þrst generation: F � 132.4; df � 1, 34; P � 0.001; second generation: F � 20.85; df � 1, 34; P � 0.001; third generation: F � 6.665; df � 1, 34; P � 0.014), with overall nymphal density approximately three times lower in 1993 than in 1994 (Fig. 2). However, there was no treatment � year interaction, and although leafhopper density was signiÞcantly different among treatments in each generation (Fig. 2), the density rankings among treatments changed from one generation to the next with a similar pattern in each year. In the Þrst generation, there were signiÞcant treatment differences (1993: F � 4.68; df � 2, 15; P � 0.026; 1994: F � 3.900; df � 2, 15; P � 0.043), with leafhopper densities in the Exclusion treatment signiÞcantly lower than densities in the Cover or No Cover treatments (Fig. 2). There was a signiÞcant treatment effect in the second generation (1993: F � 8.179; df � 2, 15; P � 0.004; 1994: F � 13.51; df � 2, 15; P � 0.001), but with leafhopper densities in the No Cover treatment signiÞcantly higher (� 65%) than the No Cover and Exclusion treatments. By the third generation, leafhopper densities were signiÞcantly different among all treatments (1993: F � 11.20; df � 2, 15; P � 0.001; 1994: F�17.15; df �2, 15; P�0.001) and ranked, from lowest to highest, as Cover, No Cover, and Exclusion (Fig. 2).
Leafhopper Egg Deposition and Parasitism by Anagrus spp. Leafhopper egg deposition was not signiÞcantly different among treatments in the Þrst generation (1994 data only, leaves across all blocks were pooled for each treatment) (Table 1). Compared with No Cover, egg deposition was lower in the Cover treatment in the second generation (F � 4.00; df � 2, 162; P � 0.020) and the Exclusion treatment in the

1089 October 2003 COSTELLO AND DAANE: SPIDER, LEAFHOPPERS, AND GROUND COVER
Fig. 2. Mean leafhopper nymphal density in Cover, No Cover, and Exclusion treatments in (A) 1993 and (B) 1994. Sequence of bar clusters in each year corresponds to the Þrst, second, and third generation of leafhoppers. Mean leafhopper densities in each generation and year separated by different letters are signiÞcantly different (TukeyÕs HSD test, P � 0.05).
third generation (F � 4.26; df � 2, 1621; P � 0.016) (Table 1). Numbers of hatched eggs did not differ among treatments in Þrst or second generations, but were signiÞcantly lower in Exclusion treatment in the third generation (F � 5.01; df � 2, 162; P � 0.008) (Table 1). Percentage parasitism was signiÞcantly higher in No Cover than in Cover and Exclusion treatments in both second and third generations (F� 12.66; df � 2, 162; P � 0.001 and F � 8.47; df � 2, 162; P � 0.001, respectively) (Table 1).
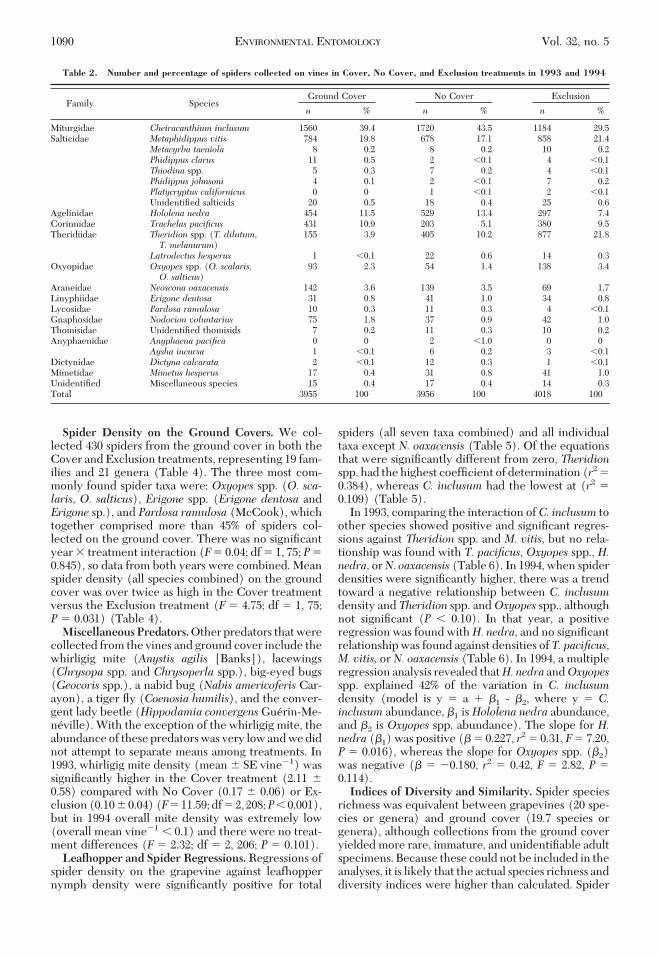
Spider Density on the Grapevines. A total of 11,929 spiders were collected from the grapevines during the 2-yr study, representing 15 families and 22 genera. Over the 2-yr period, the number of total spiders collected was remarkably similar among treatments, differing by just a single specimen between Cover and No Cover treatments and by 63 specimens between Cover and Exclusion treatments (Table 2). The nine most common spider species (grouped into seven taxa) were C. inclusum, Metaphidippus vitis (Cockerell), Hololena nedra Chamberlin and Ivie, Trachelas pacificus (Chamberlin and Ivie), Theridion spp. (Theridion dilutum Levi and Theridion melanurum Hahn), Neoscona oaxacensis (Keyserling), and Oxyopes spp. (Oxyopes scalaris Hentz and Oxyopes salticus Hentz). These nine species represented 91% of all spiders collected. With data from both years pooled, C. inclusum was proportionately the most
Table 1. Egg deposition in grape leaves by Erythroneura variabilis and E. elegantula, hatched Erythroneura eggs, and percentage parasitized Erythroneura eggs (by Anagrus spp.) for Cover, No Cover, and Exclusion treatments in 1994
Treatment Leafhopper generation
First Second Third
Leafhopper eggs leaf 1
Cover 35.2 � 3.2 a 165.6 � 18.1 a 317.9 � 27.2 ab No Cover 44.8 � 3.9 a 222.1 � 17.4 b 373.2 � 33.0 a Exclusion 33.3 � 4.4 a 182.6 � 17.2 ab 254.4 � 26.4 b
First Second Third
Hatched leafhopper eggs leaf 1
Cover 23.80 � 2.5 a 105.5 � 12.1 a 187.6 � 19.3 a No Cover 30.33 � 3.1 a 127.5 � 10.7 a 191.4 � 20.7 a Exclusion 23.03 � 3.2 a 126.5 � 12.8 a 131.6 � 17.7 b
First Second Third
Percentage parasitism
Ground Cover 16.4 � 1.0 a 16.0 � 1.0 a 25.2 � 1.0 a No Cover 14.1 � 1.0 a 22.0 � 1.0 b 34.0 � 1.0 b Exclusion 14.8 � 1.0 a 13.0 � 1.0 a 26.3 � 1.0 a
Means followed by different letters in the same column and unit measured are signiÞcantly different (TukeyÕs honestly signiÞcant difference test, P � 0.05).
abundant spider collected on the vines in this experiment, comprising 40.7% of all spiders sampled, followed by M. vitis (18.8%), H. nedra (11.2%), T. pacificus (7.1%), Theridion spp. (5.3%), and Oxyopes spp. (2.3%) (Table 2). Cheiracanthium inclusum had an overall average density of 5.35 � 0.31 spiders vine�1, almost twice as high as the next most abundant species, M. vitis at 2.78 � 0.20 spiders vine�1. Combining data from all treatments, total spider
density was a signiÞcant 53% lower in 1993 (9.1 � 0.7 spiders vine�1) than in 1994 (19.6 � 1.1 spiders vine�1) (F � 64.69; df � 1, 34; P � 0.001). There were strong seasonal differences in spider density, with most of the seven most common spider taxa listed above beginning the season at very low densities, usually �1 spider vine�1, and increasing as the season progressed, to as much as 5Ð15 spiders vine�1 by seasonÕs end (Figs. 3 and 4). The exceptions were H. nedra, which increased until early to mid season and then held static or declined (Figs. 3C and 4C), and N. oaxacensis, which had a relatively low but stable density throughout the season (Figs. 3E and 4E). In 1993, there was little treatment effect on indi
vidual spider species, the exception being N. oaxacensis, which was 60% lower in the Exclusion treatment compared with the other treatments (Table 3, Fig. 3E). In 1994, C. inclusum, H. nedra, and N. oaxacensis were signiÞcantly lower in the Exclusion treatment (Table 3; Fig. 4) compared with Cover or No Cover, and, conversely, Oxyopes spp. were more abundant in the Exclusion treatment than the other treatments (Table 3; Fig. 4 F). The only spider species that showed a density response to ground cover was T. pacificus, which in 1994 was 2.4 times as dense in the Cover versus No Cover treatment (Table 3, Fig. 4H).
1090 ENVIRONMENTAL ENTOMOLOGY Vol. 32, no. 5
Table 2. Number and percentage of spiders collected on vines in Cover, No Cover, and Exclusion treatments in 1993 and 1994
Ground Cover No Cover Exclusion Family Species
n % n % n %
Miturgidae Cheiracanthium inclusum 1560 39.4 1720 43.5 1184 29.5 Salticidae Metaphidippus vitis 784 19.8 678 17.1 858 21.4
Metacyrba taeniola 8 0.2 8 0.2 10 0.2 Phidippus clarus 11 0.5 2 �0.1 4 �0.1 Thiodina spp. 5 0.3 7 0.2 4 �0.1 Phidippus johnsoni 4 0.1 2 �0.1 7 0.2 Platycryptus californicus 0 0 1 �0.1 2 �0.1 UnidentiÞed salticids 20 0.5 18 0.4 25 0.6
Agelinidae Hololena nedra 454 11.5 529 13.4 297 7.4 Corinnidae Trachelas pacificus 431 10.9 203 5.1 380 9.5 Theridiidae Theridion spp. (T. dilutum, 155 3.9 405 10.2 877 21.8
T. melanurum) Latrodectus hesperus 1 �0.1 22 0.6 14 0.3
Oxyopidae Oxyopes spp. (O. scalaris, 93 2.3 54 1.4 138 3.4 O. salticus)
Araneidae Neoscona oaxacensis 142 3.6 139 3.5 69 1.7 Linyphiidae Erigone dentosa 31 0.8 41 1.0 34 0.8 Lycosidae Pardosa ramulosa 10 0.3 11 0.3 4 �0.1 Gnaphosidae Nodocion voluntarius 75 1.8 37 0.9 42 1.0 Thomisidae UnidentiÞed thomisids 7 0.2 11 0.3 10 0.2 Anyphaenidae Anyphaena pacifica 0 0 2 �1.0 0 0
Aysha incursa 1 �0.1 6 0.2 3 �0.1 Dictynidae Dictyna calcarata 2 �0.1 12 0.3 1 �0.1 Mimetidae Mimetus hesperus 17 0.4 31 0.8 41 1.0 UnidentiÞed Miscellaneous species 15 0.4 17 0.4 14 0.3 Total 3955 100 3956 100 4018 100
Spider Density on the Ground Covers. We collected 430 spiders from the ground cover in both the Cover and Exclusion treatments, representing 19 families and 21 genera (Table 4). The three most commonly found spider taxa were: Oxyopes spp. (O. scalaris, O. salticus), Erigone spp. (Erigone dentosa and Erigone sp.), and Pardosa ramulosa (McCook), which together comprised more than 45% of spiders collected on the ground cover. There was no signiÞcant year � treatment interaction (F � 0.04; df � 1, 75; P � 0.845), so data from both years were combined. Mean spider density (all species combined) on the ground cover was over twice as high in the Cover treatment versus the Exclusion treatment (F � 4.75; df � 1, 75; P � 0.031) (Table 4).
Miscellaneous Predators. Other predators that were collected from the vines and ground cover include the whirligig mite (Anystis agilis [Banks]), lacewings (Chrysopa spp. and Chrysoperla spp.), big-eyed bugs (Geocoris spp.), a nabid bug (Nabis americoferis Carayon), a tiger ßy (Coenosia humilis), and the convergent lady beetle (Hippodamia convergens Guerin-Mene ville). With the exception of the whirligig mite, the abundance of these predators was very low and we did not attempt to separate means among treatments. In 1993, whirligig mite density (mean � SE vine�1) was signiÞcantly higher in the Cover treatment (2.11 � 0.58) compared with No Cover (0.17 � 0.06) or Exclusion (0.10 �0.04) (F�11.59; df �2, 208; P�0.001), but in 1994 overall mite density was extremely low (overall mean vine�1 � 0.1) and there were no treatment differences (F � 2.32; df � 2, 206; P � 0.101).
Leafhopper and Spider Regressions. Regressions of spider density on the grapevine against leafhopper nymph density were signiÞcantly positive for total
spiders (all seven taxa combined) and all individual taxa except N. oaxacensis (Table 5). Of the equations that were signiÞcantly different from zero, Theridion spp. had the highest coefÞcient of determination (r 2 �
2 �0.384), whereas C. inclusum had the lowest at (r 0.109) (Table 5). In 1993, comparing the interaction of C. inclusum to
other species showed positive and signiÞcant regressions against Theridion spp. and M. vitis, but no relationship was found with T. pacificus, Oxyopes spp., H. nedra, or N. oaxacensis (Table 6). In 1994, when spider densities were signiÞcantly higher, there was a trend toward a negative relationship between C. inclusum density and Theridion spp. and Oxyopes spp., although not signiÞcant (P � 0.10). In that year, a positive regression was found with H. nedra, and no signiÞcant relationship was found against densities of T. pacificus, M. vitis, or N. oaxacensis (Table 6). In 1994, a multiple regression analysis revealed that H. nedra and Oxyopes spp. explained 42% of the variation in C. inclusum density (model is y � a � �1 - �2, where y � C. inclusum abundance, �1 is Hololena nedra abundance, and �2 is Oxyopes spp. abundance). The slope for H. nedra (�1) was positive (� � 0.227, r 2 � 0.31, F � 7.20, P � 0.016), whereas the slope for Oxyopes spp. (�2) was negative (� � �0.180, r 2 � 0.42, F � 2.82, P � 0.114).
Indices of Diversity and Similarity. Spider species richness was equivalent between grapevines (20 species or genera) and ground cover (19.7 species or genera), although collections from the ground cover yielded more rare, immature, and unidentiÞable adult specimens. Because these could not be included in the analyses, it is likely that the actual species richness and diversity indices were higher than calculated. Spider

1091 October 2003 COSTELLO AND DAANE: SPIDER, LEAFHOPPERS, AND GROUND COVER
Fig. 3. 1993 mean (�SEM) spider densities for total spiders and the seven most common spider species (or grouped species) in the Cover (E), No Cover (F), and Exclusion (‚) treatments. Repeated-measures ANOVA analyses showed signiÞcantly lower seasonal density of N. oaxacensis in Exclusion compared with Cover or No Cover treatments (F � 12.32; df � 1, 193; P � 0.001) but no signiÞcant difference among treatments for any other spider taxon or total spiders.
species diversity analyses, using the Inverse Simpson Index, were conducted separately for each year because there was signiÞcant year � treatment interaction (F � 4.26; df � 3, 394; P � 0.005). On the grapevines, there were no signiÞcant treatment differences in spider diversity: 1993 indexes were 3.1 � 0.2, 2.9 � 0.1, and 3.1 � 0.1 for Cover, No Cover, and Exclusion, respectively (F � 0.08; df � 1, 192; P � 0.32) and 1994 indexes were 3.5 � 0.1, 3.2 � 0.1, and 3.5 � 0.1 for Cover, No Cover, and Exclusion, respectively (F � 0.57; df � 1, 187; P � 0.572). Similarly, on the ground cover, there were no signiÞcant differences in spider diversity between treatments in 1993 (Cover: 3.3 � 0.8; Exclusion: 2.6 � 0.5; F � 0.13; df � 1, 31; P � 0.718)
or 1994 (Cover 3.9 � 0.8; Exclusion: 3.7 � 0.8; F � 2.15; df � 1, 29; P � 0.154). Spider species similarity on the grapevine differed
little among treatments, as measured by the Bray-Curtis index (BCI). Similarity was highest (a value of 1 is 100% similar) between Cover and No Cover treatments (BCI � 0.88), followed closely by the Cover and Exclusion (BCI � 0.85) and the No Cover and Exclusion (BCI � 0.81). Spider species similarity on the ground cover between the Cover and Exclusion treatments was lower (BCI � 0.56), which would be expected given the insecticide applications the ground cover received in the Exclusion treatment. There were six treatment pairings of similarity between spider

1092 ENVIRONMENTAL ENTOMOLOGY Vol. 32, no. 5
Fig. 4. 1994 mean (�SEM) spider densities for total spiders and the seven most common spider species (or grouped species) in the Cover (E), No Cover (F), and Exclusion (‚) treatments. Repeated-measures ANOVA analysis showed signiÞcantly lower densities of Cheiracanthium inclusum (F � 9.66; df � 1, 188; P � 0.002), Hololena nedra (F � 13.76; df � 1, 188; P � 0.001), and Neoscona oaxacensis F � 9.16; df � 1, 188; P � 0.003) in Exclusion compared with Cover or No Cover treatments, but a signiÞcantly higher density for Oxyopes spp. in Exclusion compared with the other treatments (F � 4.79; df � 1, 188; P � 0.030). Trachelas pacificus density was signiÞcantly higher in Cover versus No Cover (F � 5.00; df � 1, 188; P � 0.027).
communities on the grapevine and ground cover. 0.22, 0.19, and 0.25 for the Cover, No Cover, and These six BCI measurements were relatively low com- Exclusion treatments, respectively). pared with those from like habitats but different treat- Grapevine Growth Parameters. Leaf N differed sigments. Spider communities on the grapevine and niÞcantly among treatments, with total N 76 and 26% ground cover were widely dissimilar (BCI values from higher in the No Cover than the Cover treatment in 0.19 to 0.34), the spider community on the ground 1993 and 1994, respectively, and 36 and 22% higher in cover in the Cover treatment was more similar to the the No Cover than the Exclusion treatment in 1993 spider community on the grapevine (BCI � 0.34, 0.29, and 1994, respectively (1993: F � 6.49; df � 5, 10; P � and 0.34 for the Cover, No Cover, and Exclusion treat- 0.005; 1994: 3.64; df � 5, 10; P � 0.032) (Table 7). ments, respectively) than the spider community on Pruning weights were not signiÞcantly different the ground cover in the Exclusion treatment (BCI � among treatments in 1993 (F � 1.77; df � 2, 33; P �

1093 October 2003 COSTELLO AND DAANE: SPIDER, LEAFHOPPERS, AND GROUND COVER
Table 3. Mean spiders vine�1 for the seven most common spider taxa by treatment in 1993 and 1994, with corresponding orthogonal contrasts
Orthogonal Contrastsa
Exclusion Cover No Cover Exclusion vs. others Cover vs. No Cover
1993 C. inclusum 4.05 � 0.60 4.43 � 0.73 4.66 � 0.82 F � 0.65, P � 0.416 F � 0.56, P � 0.455 M. vitis 2.04 � 0.28 2.35 � 0.44 1.66 � 0.23 F � 0.23, P � 0.632 F � 0.01, P � 0.901 H. nedra 0.73 � 0.13 0.78 � 0.13 1.25 � 0.21 F � 1.07, P � 0.302 F � 3.77, P � 0.054 T. pacificus 0.43 � 0.07 0.72 � 0.13 0.47 � 0.07 F � 1.66, P � 0.200 F � 0.96, P � 0.327 Theridion spp. 0.30 � 0.07 0.32 � 0.07 0.20 � 0.05 F � 0.41, P � 0.524 F � 1.47, P � 0.227 N. oaxacensis 0.18 � 0.04 0.47 � 0.08 0.45 � 0.08 F � 12.32, P � 0.001 F � 0.01, P � 0.916 Oxyopes spp. 0.28 � 0.09 0.21 � 0.07 0.10 � 0.04 F � 2.26, P � 0.134 F � 1.83, P � 0.177
1994 C. inclusum 4.47 � 0.62 6.80 � 0.86 7.73 � 0.78 F � 9.66, P � 0.002 F � 1.76, P � 0.187 M. vitis 4.17 � 0.68 3.28 � 0.50 3.22 � 0.64 F � 1.33, P � 0.250 F � 0.00, P � 0.965 H. nedra 1.41 � 0.25 2.49 � 0.32 2.55 � 0.32 F � 13.76, P � 0.001 F � 0.03, P � 0.864 T. pacificus 2.33 � 0.39 2.39 � 0.41 0.98 � 0.13 F � 2.41, P � 0.122 F � 5.00, P � 0.027 Theridion spp. 6.12 � 2.52 1.73 � 0.53 2.72 � 0.89 F � 2.45, P � 0.119 F � 0.64, P � 0.425 N. oaxacensis 0.31 � 0.06 0.55 � 0.08 0.55 � 0.08 F � 9.16, P � 0.003 F � 0.01, P � 0.941 Oxyopes spp. 0.71 � 0.16 0.45 � 0.10 0.28 � 0.05 F � 4.79, P � 0.030 F � 0.81, P � 0.369
a df � 1, 193 (1993); df � 1, 188 (1994).
0.186) but were a signiÞcant 96% higher in the No Cover compared with the Cover treatment in 1994 (F � 4.74; df � 2, 32; P � 0.016) (Table 7).
Discussion
Our results support the hypothesis that vineyards with ground covers have lower leafhopper (E. variabilis and E. elegantula) densities than vineyards without ground covers. Although there were no early season differences between No Cover and Cover treatments, there were signiÞcantly lower second- and third-generation nymph densities on grapevines with a permanent ground cover (Fig. 2), corroborating results from other studies (Costello and Daane
Table 4. Number and percentage of spiders collected from the ground cover in Cover and Exclusion treatments for 1993 and 1994 data (combined)
Cover Exclusion Family Spider species or taxa
n % n %
Oxyopidae Oxyopes scalaris and O. 68 23.4 27 19.2 salticus
Linyphiidae Erigone dentosa and Erigone 41 14.1 47 33.5 sp.
Lycosidae Pardosa ramulosa 24 8.2 4 2.8 Clubionidae UnidentiÞed Clubionidae 23 7.9 3 2.1 Salticidae Metaphidippus vitis 16 5.5 13 9.2
Phidippus clarus 0 0 2 1.4 Habronattus spp. 1 0.3 0 0 UnidentiÞed Salticidae 11 3.8 6 4.3
Araneidae Neoscona oaxacensis 17 5.8 2 1.4 Miturgidae Cheiracanthium inclusum 9 3.1 2 1.4 Agelinidae Hololena nedra 9 3.1 2 1.4 Corinnidae Trachelas pacificus 7 2.4 3 2.1 Anyphaenidae Anyphaena pacifica 5 1.7 1 0.7 Thomisidae UnidentiÞed Thomisidae 5 1.7 3 2.1 Theridiidae Theridion dilutum and T. 2 0.7 0 0
melanurum Philodromidae UnidentiÞed Philodromidae 1 0.3 0 0 Phalangidae UnidentiÞed Phalangidae 0 0 1 0.7
UnidentiÞed spiders 51 17.5 24 17.2 Total 290 100 140 100
1998b). We also sought to determine whether changes in leafhopper densities resulted from two separate but potentially interactive factors: 1) enhanced biological control (in this case, from spiders) in a “top down” fashion and 2) competition between ground cover and grapevines for water and nutrients that resulted in reduced grapevine vigor and poorer host plant quality in a “bottom up” fashion.
Ground Cover and Biological Controls. There were no treatment differences in egg parasitism (1994 data) that would explain the lower leafhopper density in the Cover treatment. In fact, second- and third-generation parasitism was highest in the No Cover treatment, which may have been because of the functional response of Anagrus spp. to higher leafhopper egg densities in that treatment (Table 1). Although there was a trend toward higher egg deposition in No Cover versus Cover, there was also a higher rate of parasitism in No Cover, so that the number of hatched eggs and eventual Þrst-instar nymphs did not differ between Cover and No Cover treatments. Therefore, differences in nymphal densities between Cover and No Cover were because of higher nymphal mortality in the Cover treatment, and not egg deposition or parasitism. However, although there was also a trend of lower egg deposition in Exclusion compared with No Cover, there was also lower parasitism and therefore a lower number of hatched eggs in the third genera-
Table 5. Regression equations and tests of significance for cumulative spider density (log 10) plot�1 against cumulative leafhopper nymphal density (log 10) plot�1
Spider Regression equation F P r2
Theridion spp. y � 2.07 � 0.37x 21.27 0.001 0.384 Hololena nedra y � 1.72 � 0.56x 13.90 0.001 0.290 Trachelas pacificus y � 1.91 � 0.47x 10.85 0.002 0.242 Metaphidippus vitis y � 1.17 � 0.77x 9.61 0.004 0.220 Oxyopes spp. y � 2.23 � 0.37x 4.65 0.038 0.120 Cheiracanthium inclusum y � 1.23 � 0.64x 4.18 0.040 0.109 Neoscona oaxacensis y � 2.68 � 0.14x 0.51 0.479 0.014

1094 ENVIRONMENTAL ENTOMOLOGY Vol. 32, no. 5
Table 6. Regression equations and significance are for cumulative C. inclusum density (log 10) against cumulative density (log 10) of other spider species in 1993 and 1994
Regression equationa F P r 2
1993 Theridion spp. y � 1.50 � 0.58x 18.99 0.001 0.54 Trachelas pacificus y � 2.05 � 0.06x 0.14 0.712 0.00 Oxyopes spp. y � 1.86 � 0.17x 1.39 0.255 0.08 Metaphidippus vitis y � 1.08 � 0.54x 6.66 0.020 0.29 Hololena nedra y � 1.69 � 0.22x 2.09 0.167 0.11 Neoscona oaxacensis y � 1.96 � 0.01x 0.02 0.890 0.00
1994 Theridion spp. y � 2.40 � 0.12x 3.35 0.086 0.17 Trachelas pacificus y � 2.32 � 0.11x 0.68 0.423 0.04 Oxyopes spp. y � 2.39 � 0.24x 4.45 0.051 0.21 Metaphidippus vitis y � 2.33 � 0.09x 0.23 0.641 0.01 Hololena nedra y � 1.70 � 0.27x 7.20 0.016 0.31 Neoscona oaxacensis y � 1.99 � 0.15 1.62 0.221 0.09
a Degrees of freedom for all regression equations are 1, 16.
tion. The higher third-generation leafhopper density in Exclusion compared with the other two treatments was therefore because of lower nymphal mortality in the Exclusion treatment. It is possible that this was because of lower predation by spiders. Spiders are the most common predators of leafhop
per nymphs in San Joaquin Valley vineyards (Costello and Daane 1999) and some researchers have suggested that changes in the spider community may explain the lower leafhopper densities observed in vineyards with ground covers (Roltsch et al. 1998). In this study, overall spider density was similar on the vines between the Cover and No Cover treatments (Table 2). However, overall spider density does not provide a clear picture of spiders as biological control agents, because the impact on grape insect pests is not equal among different spider species. For example, M. vitis will not feed on E. variabilis nymphs (M.J.C. and K.M.D., unpublished data), and no leafhopper adults have ever been found in N. oaxacensis webs (M.J.C., unpublished data). When we looked for a response from each spider species to changes in leafhopper density that would provide evidence of that speciesÕ regulatory role of leafhopper populations, we found that all but one showed a positive relationship to leafhopper density (Table 5). However, this may be an artifact of the seasonal increase in both leafhopper and
Table 7. Measurements of grapevine vigor: leaf blade nitrogen at bloom-time and grapevine pruning weights in winter
Cover No Cover Exclusion
Leaf blade nitrogen (%)a
1993 1.88 � 0.08a 2.59 � 0.06b 2.23 � 0.05ab 1994 2.73 � 0.07a 2.99 � 0.04b 2.77 � 0.04a
Pruning weight (kg vine�1)a
1993 1.51 � 0.29a 2.41 � 0.35a 2.01 � 0.36a 1994 1.22 � 0.19a 2.39 � 0.32b 2.02 � 0.30ab
Means followed by different letters in the same row are signiÞcantly different (TukeyÕs honestly signiÞcant difference test, P � 0.05).
a Degrees of freedom for all regression equations are 2, 10.
spider densities. Theridion spp. densities had the strongest association with leafhopper density (in 1994, see Table 5) and have been associated with high leafhopper densities in other studies (Costello and Daane 1995). However, T. dilutum and T. melanurum showed only a weak functional response to leafhoppers (M.J.C. and K.M.D., unpublished data), and an increase in their abundance was not associated with a reduction in leafhopper numbers; in fact, in 1994 their densities were highest in those treatments with the most leafhoppers. Hololena nedra also had a strong association with leafhopper densities, but this species showed no difference between Cover and No Cover treatment and is therefore an unlikely candidate to explain treatment differences. Only T. pacificus showed a positive response to both
leafhoppers and ground covers, although the relationship among leafhoppers, T. pacificus, and ground covers is not clear. Whereas leafhopper density was lower in the Cover treatment in both years (Fig. 2), T. pacificus density was only signiÞcantly higher in 1994 (Table 3) and in that year had only a moderate increase compared with the No Cover treatment (an increase of 1.35 T. pacificus vine�1 over the season). The lack of consistency between years may simply be that overall spider density was too low in the Þrst year of study (1993) to be able to statistically separate differences among treatments. In a separate study, T. pacificus density was consistently higher on grapevines with ground covers (Costello and Daane 1998a), but in that study it comprised �40% of the spider community, compared with �7% in the current study. And because T. pacificus density was not signiÞcantly different between Cover and Exclusion treatments, it is unlikely that the importance of the ground cover for T.pacificus was in providing additional habitat. We think it more likely that prey items migrated between ground cover and the grapevine canopy, and were preyed upon by T. pacificus in the canopy, where it remained. These migrating prey were most likely Diptera (muscids, chironomids and culicids), which were common in the vineyard. Similar conclusions have been reached by others. Wyss et al. (1995) found that apple trees grown with ground vegetation had higher densities of Araniella spp., and concluded that the ground cover did not provide habitat for Araniella spp. but rather increased the availability of alternate prey. Rieux et al. (1999) had mixed conclusions, suggesting that pear orchards with neighboring hedgerows dominated by ash trees provide more alternate prey for predators in the orchard, but hedgerows dominated by ivy sheltered pear pests. It is also possible that ground covers result in a microclimatic change that increased survivorship of T. pacificus, as Orr et al. (1997) found with the survivorship of Trichogramma. Further evidence that the ground cover is not a
major habitat for vine-dwelling spiders is the wide difference in spider species similarity indexes between grapevines and ground cover; this suggests that intervegetational migration does not signiÞcantly inßuence the spider community on the grapevines. For example, C. inclusum, M. vitis,H. nedra, and T. pacificus

1095 October 2003 COSTELLO AND DAANE: SPIDER, LEAFHOPPERS, AND GROUND COVER
comprised 37.5, 19.4, 10.8, and 8.5% of spiders on the grapevine canopy overall, but accounted for only 2.3, 7.4, 2.3, and 2.3%, respectively, of species on the ground cover (Cover and Exclusion treatments combined). In contrast, Oxyopes spp., Erigone spp., and P. ramulosa accounted for 21.3, 23.8, and 6.5% of spider species on the ground cover, but only 2.4, 0.9, and 0.2% of the species on the grapevine canopy, respectively. Numerically, only the Oxyopes spp. were common on both grapevines and ground cover, and even with these species there was a separation, with O. scalaris more common on the vines and O. salticus more common on the ground covers (M.J.C. and K.M.D., unpublished data). The differences in the similarity index were also clear and show that the spider communities on the grapevine versus ground cover are widely dissimilar. There are several probable reasons for these differences. First, cultural practices (e.g., cultivation, mowing, herbicides) create dramatic environmental and habitat differences between the vineyard canopy and vineyard ßoor. Second, we found the ground cover harbors an arthropod community that is numerically dominated by Collembola, Diptera, and Thysanoptera, whereas grapevines are dominated by Homoptera and Lepidoptera, with fewer orders common on both ground cover and grapevines (e.g., Acarina). This presents a different combination of prey species available to predators resident in the ground covers compared with the grapevines and, although spiders are considered generalists, a different prey community will support a different spider community. Third, many spider species have either arboreal or ground-dwelling behaviors or habitat preferences. For example, Mansour and Whitcomb (1986) found that clubionid and theridiid spiders accounted for 86% of the spider community on citrus trees, whereas lycosid and gnaphosid spiders accounted for 78% of the spiders found on ground cover. Similarly, Ferguson et al. (1984) found that the oxyopids, thomisids, and salticids dominated soybean foliage spider community, whereas the lycosids and linyphiids were the predominant ground-dwelling spiders.
Exclusion Treatment. We used the Exclusion treatment to separate the inßuence of ground cover on natural enemies from the competitive effect with the vines, as well as abiotic effects such as microclimate. One spider, N. oaxacensis, appears to have been quite sensitive to our exclusion methods, because it was signiÞcantly lower in the Exclusion treatment in both study years (Table 3). This could be explained by the web-building habits of N. oaxacensis, which strings its web between adjacent rows of vines, migrating daily from its web between vine rows to the more protected areas on the grapevine. Because the webs were constantly disturbed during sampling and plot maintenance activities, many spiders may have fallen onto the vineyard ßoor, and the exclusion barriers may have prevented it from migrating back to the grapevines. Another predator that was signiÞcantly inßuenced was the whirligig mite, although overall density was only high enough 1993 to detect treatment differ
ences. This mite will lay eggs on ground or grapevine foliage, and the ground cover appeared to serve as an additional habitat in spring and midsummer. Therefore it is not surprising that there were lower whirligig mite densities in the No Cover and Exclusion treatments that accompanied a reduction in habitat. In 1994, densities of C. inclusum and H. nedra were also lower in the Exclusion treatment, whereas Oxyopes spp. actually increased (Table 3). Several interactions between C. inclusum and other
spider species changed over the two study seasons, with results indicating that the treatments had a greater effect on spider-spider interactions in the second year of the study. For example, in 1993 there was no relationship between C. inclusum and either H. nedra or Oxyopes spp., and Theridion spp. density was so low as to be insigniÞcant. However, in 1994 there was a positive relationship with H. nedra and a negative relationship with Oxyopes spp. and Theridion spp. (at P � 0.1) (Table 6). That some treatment effects were not seen until 1994 may be because of the lag time involved in the predator response to the experimental conditions imposed by treatments. Positive or negative relationships between spider species can indicate changes in competition for limited resources, disparate impact of environmental conditions, direct competition, or even spider-on-spider predation. There are Þve spider groups that we consider prime candidates for spider-spider competition or predation on the grapevines, each of which had different densities in the Exclusion versus Cover treatments in 1994. Hololena nedra builds a funnel-shaped web and, once established, moves infrequently from its web; therefore, H. nedra dispersal and competition for preferred habitats likely takes place in the springtime when spiderlings establish their webs. Neoscona oaxacensis, described above, is another web-builder that will use grape leaves for web structure in the springtime. Theridion spp. are small, sit-and-wait predators that build cobwebs on the leaves. Oxyopes spp. and C. inclusum are wandering hunters and, therefore, their dispersal is likely continuous throughout the season. That Oxyopes spp. and Theridion spp. densities increased in the 1994 Exclusion versus the Cover treatment, whereas N. oaxacensis, C. inclusum, and H. nedra densities decreased, suggests to us an initial shift in the community structure early in the season, perhaps through increased survivorship throughout the season of Oxyopes spp. and Theridion spp. because of reduced predation by C. inclusum, or through less competition for limited habitat resources in the spring and early summer. Resource competition would be concentrated in the early part of the season because there is little food on the grapevines and few leaves for web or territory establishment in the springtime when spiders become active. The early season competition is further intensiÞed because common vineyard spider taxa are year-round residents, overwintering under bark on the grapevine trunks (M.J.C. and K.M.D., unpublished data); in contrast, in annual cropping systems most spider species annually recolonize by ballooning into the agroecosystem (Bishop and Riechert 1990). We

1096 ENVIRONMENTAL ENTOMOLOGY Vol. 32, no. 5
also assume that most changes in spider density during the spring and summer months were from reproduction and not immigration and emigration, as the exclusion barriers would not have directly affected reproduction. Thus, the only signiÞcant source of immigration in the Exclusion plots was direct landings of ballooning spiders on the grapevine canopy; Theridion spp., which are the primary ballooning species in the vineyard agroecosystem, were 3.5 times higher in 1994 (season-long) in the Exclusion than the Cover treatment.
Vine Condition and Leafhopper Density. We measured two major indices of grapevine vigor as a measurement of the competitive effect of the ground cover and found a fairly consistent reduction in leaf petiole N and pruning weight in the Cover treatment versus No Cover (Table 7). Decreased grapevine vigor with Berber orchardgrass (Dactylis glomerata), a perennial ground cover, has been shown by other researchers (Wolpert et al. 1993). Higher leafhopper nymph mortality and lower adult egg deposition has been linked to lower vine water status (Daane et al. 1995, Daane and Williams 2003). Furthermore, once a grapevine and individual leaves are selected for egg deposition, there is little movement of the nymphs to new feeding sites. Therefore, their survival depends on the condition of the leaf, as well as abiotic conditions, at or near the oviposition site (Leather 1994). We conclude that the most likely explanation for the effect of the ground cover on leafhoppers in the Cover treatment is that competition for water and nutrients resulted in reduced grapevine vigor, resulting in poorer host quality for leafhoppers. That measurements of leaf N and pruning weight in the Exclusion treatment fell between the Cover and No Cover treatments, and the fact that late-season leafhopper densities were the highest in this treatment, suggests that the close mowing of the ground cover within the vine row reduced ground cover vigor and lowered competition between the ground cover and grapevines for water and nutrients.
Practical Considerations. Results from our study do not support the mechanistic hypothesis that alternative vegetation within a cropping systemprovides habitat for natural enemies which will move between vegetational components of the system (van Emden 1990). Rather, these results corroborate our other work which showed no differences in overall spider species density on vines with and without ground covers (Daane and Costello 1998). In the current study, there is strong evidence that the “bottom-up” inßuence of ground cover is affecting leafhopper density, but is qualiÞed by results from the Exclusion treatment, in which third-generation leafhopper nymphal density was highest. Neither leafhopper egg deposition nor egg parasitism explain the increased nymph density in this treatment and, for that reason, the difference must be related to decreased nymphal mortality. Grapevine vigor in the Exclusion treatment was lower compared with No Cover treatments, but not signiÞcantly different, and was clearly not a primary factor in leafhopper density. Therefore, the rea
son for higher late-season leafhopper densities in the Exclusion treatment must be because of natural enemy inßuences. However, there are no clear patterns in parasitism by Anagrus or density of spiders that can explain this. Although we found some differences among treatments in spider species composition, these were inconsistent between study years, perhaps in part because of the difference between years in overall spider and leafhopper densities. The relatively low spider densities in 1993 have made it difÞcult to distinguish differences among treatments. However, the differences in spider species composition that were detected in 1994 may provide a clue to the changes in leafhopper densities seen in both years, and may have affected overall spider predation on leafhoppers. For example, in the 1994 Exclusion treatment, the dominant spider, C. inclusum, was lower in abundance, but two other taxa, Theridion spp. and Oxyopes spp., had higher densities. We know from laboratory studies that these latter two species have lower leafhopper feeding rates than C. inclusum (M.J.C. and K.M.D., unpublished data) and the resulting substitution may have led to lower leafhopper mortality and ultimately higher nymphal densities. Another possibility is that, rather than a difference in leafhopper feeding rate among spider species in the Exclusion treatment, the explanation lies in the amount of spider on spider predation. Because the exclusion barriers impeded migration and the availability of alternative prey, there may have been more interaction among spider individuals in the Exclusion treatment (interspeciÞc and intraspeciÞc interaction), which may have led to a greater rate of interspeciÞc predation and cannibalism. That an overall spider population density is main
tained in the face of changes in individual spider speciesÕ densities suggests that each vineyard ecosystem has a spider equilibrium and, if the density of one or more species declines, the densities of others increase to compensate. Although the current Þeld study provides support for the abiotic “bottom up” inßuence of some ground covers on grapevine vigor and leafhopper densities, it also highlights the need for a better understanding of the biologies and intraguild interactions of spider species in the vineyard agroecosystem to better determine the extent of “top down” inßuences of spider on spider and spider on herbivore interactions.
Acknowledgments
Field and laboratory assistance for this study was provided by Amanda Bird, Eric Davidian, Ross Jones, and Glenn Yokota. Art work was provided by Deborah Klose. We are grateful for the support of the California Table Grape Commission, UC Sustainable Agriculture Research and Education Program, UC Statewide IPM Project, and USDA National Research Initiative Competitive Grants Program. Voucher specimens are stored in 70% EtOH at the Kearney Agricultural Center, Parlier, CA.

1097 October 2003 COSTELLO AND DAANE: SPIDER, LEAFHOPPERS, AND GROUND COVER
References Cited
Ali, A. D., and T. E. Reagan. 1986. Inßuence of selected weed control practices on araneid faunal composition and abundance in sugarcane. Environ. Entomol. 15: 527Ð 531.
Ampong-Nyarko, K., K. V. Seshu Reddy, R. A. Nyang’or, and K. N. Saxena. 1994. Reduction of insect pest attack on sorghum and cowpea by intercropping. Entomol. Exp. App. 70: 179Ð184.
Andow, D. A. 1985. Plant diversiÞcation and insect populations in agroecosystems, pp. 277Ð348. In D. Pimentel [ed.], Some aspects of pest management. Cornell University Press, Ithaca, NY.
Andow, D. A. 1991. Vegetational diversity and arthropod population response. Annu. Rev. Entomol. 36: 561Ð586.
Bishop, L., and S. E. Riechert. 1990. Spider colonization of agroecosystems: mode and source. Environ. Entomol. 19: 1738Ð1745.
Bray, J. R., and J. T. Curtis. 1957. An ordination of the upland forest communities of southern Wisconsin. Ecol. Monogr. 27: 325Ð349.
Brown, M. W., T. van der Zwet, and D. M. Glenn. 1997. Impact of ground cover plants on pest management in West Virginia, USA, apple orchards. Hortic. Sci. (Prague) 24: 39Ð44.
Bugg, R. L., and C. Waddington. 1994. Using cover crops to manage arthropod pests of orchards: a review. Agric. Ecosyst. Environ. 50: 11Ð28.
Bugg, R. L., L. E. Ehler, and L. T. Wilson. 1987. Effect of common knotweed (Polygonum viculare) on abundance and efÞciency of insect predators of crop pests. Hilgardia 55: 1Ð53.
Costello, M. J., and K. M. Daane. 1995. Spider (Araneae) species composition and seasonal abundance in San Joaquin Valley grape vineyards. Environ. Entomol. 24: 823Ð 831.
Costello, M. J., and K. M. Daane. 1998a. Inßuence of ground cover on spider populations in a table grape vineyard. Ecol. Entomol. 23: 33Ð40.
Costello, M. J., and K. M. Daane. 1998b. Effects of cover cropping on pest management: Arthropods, pp. 93Ð106. In C. A. Ingels, R. L. Bugg, G. T. McGourty, and L. P. Christensen [eds.], Cover cropping in vineyards: a growerÕs handbook. University of California, Division of Agriculture and Natural Resources, Publication 3338, Oakland, CA.
Costello,M. J., andK.M.Daane. 1999. Abundance of spiders and insect predators on grapes in central California. J. Arachnol. 27: 531Ð538.
Daane, K. M., and M. J. Costello. 1998. Can cover cropping reduce leafhoppers on grapes? Calif. Agric 52: 27Ð33.
Daane, K. M., and M. J. Costello. 2000. Variegated and western grape leafhoppers, pp. 173Ð181. In L. P. Christensen [ed.], Raisin production manual. University of California, Division of Agriculture and Natural Resources Publication 3393, Oakland, CA.
Daane, K. M., L. E. Williams, S. A Steffan, and G. Y. Yokota. 1995. Leafhopper prefers vines with greater amounts of irrigation. Calif. Agric. 49: 28Ð32.
Daane, K. M., and L. E. Williams. 2003. Manipulating vineyard irrigation amounts to reduce insect pest damage. Ecol. Appl. (in press).
Ferguson, H. J., R. M. McPherson, and W. A. Allen. 1984. Ground and foliage-dwelling spiders in four soybean cropping systems. Environ. Entomol. 13: 975Ð980.
Frank, T., and W. Nentwig. 1995. Ground dwelling spiders (Araneae) in sown weed strips and adjacent Þelds. Acta Oecol. 16: 179Ð193.
Grafton-Cardwell, E. E., and Y. Ouyang. 1996. Inßuence of citrus leaf nutrition on survivorship, sex ratio, and reproduction of Euseius tularensis (Acari: Phytoseiidae). Environ. Entomol. 25: 1020Ð1025.
Halaj, J., A. B. Cady, and G. W. Uetz. 2000. Modular habitat refugia enhance generalist predators and lower plant damage in soybeans. Environ. Entomol. 29: 383Ð393.
Ingels, C., and K. Klonsky. 1998. Vineyard cover crops and their uses: Historical and current uses, pp. 3Ð7. In C. Ingels, R. Bugg, G. McGourty, and L. P. Christensen [eds.], Cover cropping in vineyards: a growerÕs handbook. University of California, Division of Agriculture and Natural Resources Publication 3338, Oakland, CA.
Jmhasly, P., and W. Nentwig. 1995. Habitat management in winter wheat and evaluation of subsequent spider predation on insect pests. Acta Oecol. 16: 389Ð403.
Krebs, C. J. 1989. Ecological methodology. Harper Collins Publishers, NY.
Landis, D. A., S. D. Wratten, and G. M. Gurr. 2000. Habitat management to conserve natural enemies of arthropod pests in agriculture. Annu. Rev. Entomol. 45: 175Ð201.
Leather, S. R. 1994. Life history traits of insect herbivores in relation to host quality, pp. 176Ð207. In E. A. Bernays [ed.], Insect-Plant Interactions, vol. 5. CRC, Ann Arbor, MI.
Letourneau, D. 1990. Abundance patterns of leafhopper enemies in pure and mixed stands. Environ. Entomol. 19: 505Ð509.
Mansour, F., and W. H. Whitcomb. 1986. The spiders of a citrus grove in Israel and their role as biocontrol agents of Ceroplastes floridensis (Homoptera: Coccidae). Entomophaga 31: 269Ð276.
Nentwig, W. 1988. Augmentation of beneÞcial arthropods by strip management. 1. Succession of predacious arthropods and long-term change in the ratio of phytophagous and predacious arthropods in a meadow. Oecologia (Berl.). 76: 597Ð606.
Nyfeller, M., and G. Benz. 1987. Spiders in natural pest control: a review. J. Appl. Entomol. 103: 321Ð339.
Nyfeller, M., W. L. Sterling, and D. A. Dean. 1994. Insectivorous activities of spiders in United States Þeld crops. J. Appl. Entomol. 118: 113Ð128.
Orr, D. B., D. A. Landis, D. R. Mutch, G. V. Manley, S. A. Stuby, and R. L. King. 1997. Ground cover inßuence on microclimate and Trichogramma (Hymenoptera: Trichogrammatidae) augmentation in seed corn production. Environ. Entomol. 26: 433Ð438.
Perfecto, I., B. Horwith, J. van der Meer, B. Schultz, H. McGuinness, and A. D. Santos. 1986. Effects of plant diversity and density on the emigration rate of two ground beetles, Harpalus pennsylvanicus and Evarthrus sodalis (Coleoptera: Carabidae), in a system of tomatoes and beans. Environ. Entomol. 15: 1028Ð1031.
Riechert, S. E., and L. Bishop. 1990. Prey control by an assemblage of generalist predators: Spiders in garden test systems. Ecology 71: 1441Ð1450.
Riechert, S. E., and R. Gillespie. 1986. Habitat choice and utilization in web building spiders, pp. 23Ð49. In B. Shear [ed.], Spiders, webs, behavior and evolution. Stanford University Press, Stanford, CA.
Rieux, R., S. Simon, and H. Defrance. 1999. Role of hedgerows and ground cover management on arthropod populations in pear orchards. Agric. Ecosyst. Environ. 73: 119Ð127.
Roltsch, W. R., R. Hanna, H. Shorey, M. Mayse, and F. Zalom. 1998. Spiders and vineyard habitat relationships in central California, pp. 311Ð338. In C. Pickett and R. L. Bugg [eds.], Enhancing biological control: habitat manage
1098 ENVIRONMENTAL ENTOMOLOGY Vol. 32, no. 5
ment to promote natural enemies of agricultural pests. University of California Press, Berkeley, CA.
SAS Institute. 1999. SAS/STAT userÕs guide: statistics, version 8.0. SAS Institute, Cary, NC.
Tonhasca, A. 1993. Effects of agroecosystem diversiÞcation on natural enemies of soybean herbivores. Entomol. Exp. Appl. 69: 83Ð90.
Topping, C. J., and G. Lovei. 1997. Spider density and diversity in relation to disturbance in agroecosystems in New Zealand, with a comparison to England. N.Z.J. Ecol. 21: 121Ð128.
Triapitsyn, S.V. 1998. Anagrus (Hymenoptera: Mymaridae) egg parasitoids of Erythroneura spp. and other leafhoppers (Homoptera: Cicadellidae) in North American vineyards and orchards: a taxonomic review. Trans. Am. Entomol. Soc. 124: 77Ð112.
van Emden, H. F. 1990. Plant diversity and natural enemy efÞciency in agroecosystems, pp. 63Ð80. In M. Mackauer, L. E. Ehler and J. Roland [eds.], Critical issues in biological control. Intercept Ltd., Andover, United Kingdom.
Williams, C. E., D. M. Pavuk, D. H. Taylor, and T. H. Martin. 1995. Parasitism and disease incidence in the green cloverworm (Leipdoptera: Noctuidae) in strip-intercropped soybean agroecosystems. Environ. Entomol. 24: 253Ð260.
Williams,L.E. 1987. Growth of ÔThompson SeedlessÕ grapevines. II. Nitrogen distribution. J. Am. Soc. Hortic. Sci. 112: 330Ð330.
Williams, L. E. 2000. Grapevine water relations, pp. 121Ð 126. In L. P. Christensen [ed.], Raisin production manual. University of California, Division of Agriculture and Natural Resources, Publication 3393. Oakland, CA.
Williams, L. E., N. K. Dokoozlian, and R. Wample. 1994. Grape, pp. 85Ð133. In B. Schaffer and P. C. Anderson [eds.], Handbook of environmental physiology of fruit crops, vol. I. Temperate crops. CRC, Boca Raton, FL.
Wilson, L. T., M. M. Barnes, D. L. Flaherty, H. L. Andris, and G. M. Leavitt. 1992. Variegated grape leafhopper, pp. 202Ð213. In D. L. Flaherty, L. P. Christensen, W. T. Lanini, J. J. Marois, P. A. Phillips, and L. T. Wilson [eds.], Grape pest management. University of California, Division of Agriculture and Natural Resources, Publication 3343, Oakland, CA.
Wolda, H. 1981. Similarity indices, sample size and diversity. Oecologia (Berl.) 50: 296Ð302.
Wolpert, J. A., P. A. Phillips, R. K. Striegler, M. V. McKenry, J. H. Foott. 1993. Berber orchardgrass tested as cover crop in a commercial vineyard. Calif. Agric. 47: 23Ð25.
Wyss, E., U. Niggli, and W. Nentwig. 1995. The impact of spiders on aphid populations in a strip-managed apple orchard. J. Appl. Entomol. 119: 473Ð478.
Received for publication 7 November 2002; accepted 5 July 2003.