spikes and dips: cmr imaging manifestations of the...
TRANSCRIPT

Spikes and Dips: CMR Imaging Manifestations of the ECG
The authors have no financial relationships with the manufacturers of any commercial product and/or providers of commercial services in relation to this exhibit.

Learning Objectives
1. Review basic ECG interpretation 2. Discuss the MR imaging correlates of arrhythmias and conduction
abnormalities a. Atrial fibrillationb. Bundle branch blockc. Ectopy
3. Compare the electrocardiographic and MR findings of ischemic disease (anterior, lateral, and inferior wall infarctions)
4. Correlate the electrocardiographic and MR features of various cardiomyopathies
a. Hypertrophicb. Dilatedc. Takotsubod. ARVDe. Amyloidosisf. Sarcoidosisg. Fabry Disease
5. Explore how to optimize image acquisition in the setting of abnormal ECG

1: Basic ECG InterpretationThe Rhythm Strip: Horizontal boxes = Time
• Each small box = 0.04 seconds
• Each large box (5 small boxes) = 0.2 seconds
Time
Volta
ge
.04 s
.20 s

1: Basic ECG InterpretationThe Rhythm Strip: Vertical boxes = Voltage
• Each small box = 0.1 mV
• Each large box (5 small boxes) = 0.5 mV
Time
Volta
ge
.1 mV
.5 mV

1: Basic ECG InterpretationEach Lead Corresponds to a Myocardial Territory
Inferior
Septal
Lateral
Inferior
LateralSeptal
Anterior
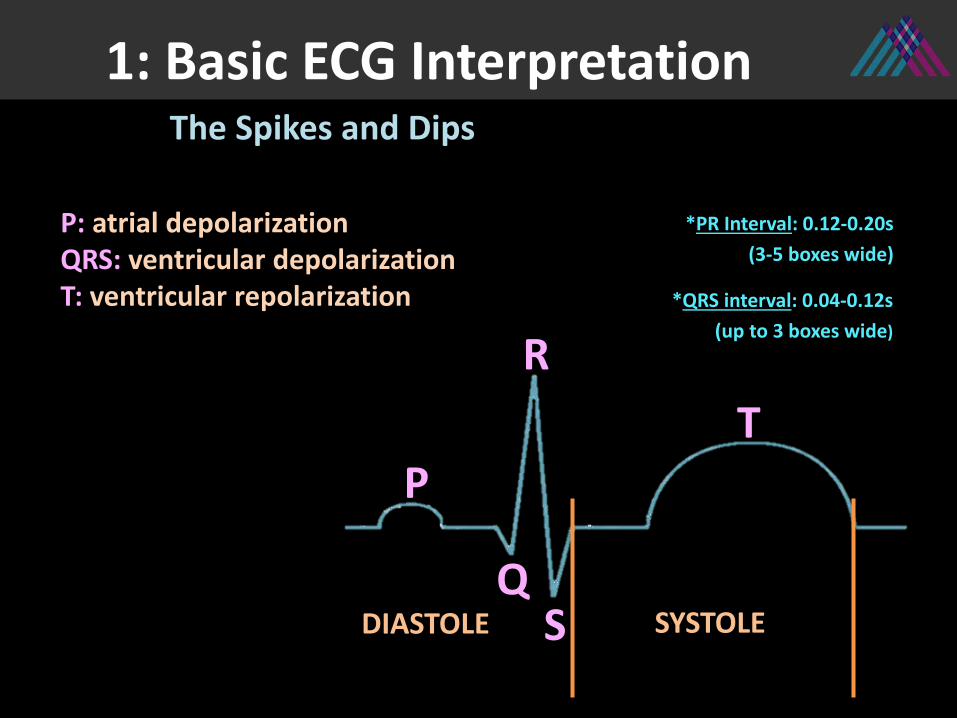
1: Basic ECG InterpretationThe Spikes and Dips
P: atrial depolarizationQRS: ventricular depolarizationT: ventricular repolarization
SYSTOLE
P
Q
R
S
T
DIASTOLE
*PR Interval: 0.12-0.20s(3-5 boxes wide)
*QRS interval: 0.04-0.12s (up to 3 boxes wide)

1: Basic ECG Interpretation
P
No P Wave• Atrial fibrillation Peaked P Wave• Atrial enlargementShort PR Interval (normally 0.12-0.20s)• Wolf Parkinson-White
Pathologic Q Wave• Prior MIWide QRS (normally < 0.12s)• Bundle branch blockHigh Voltage QRS• Ventricular hypertrophy
Q
R
S
Inverted T Wave:• Ischemia (symmetric)• Ventricular Hypertrophy
(asymmetric)• Electrolyte abnormalitiesT
The Spikes and Dips

a. Atrial fibrillationb. Bundle branch blockc. Ectopy
2: Arrhythmias and Conduction Abnormalities

2: Conduction AbnormalitiesAtrial Fibrillation (AF)
• Two-chamber cine demonstrates left atrial (LA) enlargement and poor atrial contraction
• Other findings in AF may include LA thrombus, as well as mitral valve disease
• On ECG, there are no discrete p waves (circled), with irregularly irregular QRS complexes

2: Conduction AbnormalitiesBundle Branch Block (BBB)
• Short axis cine shows paradoxical motion of the interventricular septum, compatible with left BBB
• ECG demonstrates wide QRS complexes, with duration >120 ms (3 horizontal boxes)

2: Conduction AbnormalitiesEctopy (PVCs, Bigeminy, Trigeminy)
Frequent and consecutive PVCs (circled)
Ectopic beats (arrows) are seen after each sinus beat, compatible with bigeminy
• Short axis cine shows extensive motion artifact due to ectopic beats, compatible with PVCs and bigeminy in this 36 year old patient

a. Left Main (LM) b. Left Anterior Descending (LAD)c. Left Circumflex (LCx)d. Right Coronary Artery (RCA)
3: Myocardial Infarction

3: Ischemic DiseaseSE
TPU
M
LATERAL
INFERIOR
ANTERIOR
12
3 54
6Basal
78
910
11
12Mid
13
14
15
16Apical
Inferior
LateralSeptal
Anterior

3: Ischemic Disease
LGE images demonstrate transmural enhancement in the septum, and near transmural enhancement in the anterolateral walls.
Widespread ST depression (arrows), with ST elevation in aVR (circle), is suggestive of left main coronary occlusion. The patient was found to have multivessel disease with subtotal left main stenosis.
Left Main—Anterolateral Wall MI

3: Ischemic DiseaseLAD—Anterior Wall MI
LGE images demonstrate subendocardial enhancement in the anteroseptum (arrows). Short axis cine (top right) shows corresponding absence of myocardial thickening in these segments.
Q waves in V1 and V2 (arrows) are consistent with infarction in this territory.

3: Ischemic DiseaseLCx—Lateral Wall MI
LGE image (left) shows subendocardial enhancement in the anterolateral wall (arrow).
T2 Cine images show edema in the basal to mid anterolateral segments.
ECG reveals Q waves (arrows) in the lateral leads, leads I and aVL. Lateral wall infarcts may be occult on ECG.

3: Ischemic DiseaseRCA—Inferior Wall MI
Cine LGE images show subendocardial enhancement in the basal to mid inferoseptum, and transmuralenhancement in the mid to apical inferior walls. Short axis cine confirms corresponding wall motion abnormality.
Q waves (arrows) are seen in the inferior leads (II, III, avF), compatible with prior MI.

a. Hypertrophic b. Dilatedc. Takotsubod. ARVDe. Amyloidf. Sarcoidg. Fabry Disease
4: Cardiomyopathies

4: Cardiomyopathies: HCMHypertrophic Cardiomyopathy
The tall R waves in aVL (boxed) meet Cornell criteria for LVH. Negative asymmetric T waves (circled) are seen in the low lateral leads. “Dagger like” Q waves in the lateral leads may also be seen as a result of apical hypertrophy.
Four chamber cine shows asymmetric hypertrophy, with the mid septum measuring 2.7 cm, compatible with severe HCM. LGE images show enhancement in the mid septal and inferior segments, as well as the apical segments.

4: Cardiomyopathies: DCM
While many abnormal ECG findings may be seen in the setting of DCM, high voltage V6 (circled) has been described as a characteristic finding. LVH is also commonly seen, as in this patient, with the S (V1) + R (V5) > 35, via the Sokolow-Lyon Criteria.
Dilated Cardiomyopathy
29 year old woman with postpartum DCM. 3-chamber LGE image shows linear intramyocardialenhancement in the basal ateroseptum. Four-chamber cine shows moderate to severe LV dilatation, and accompanying severe LV dysfunction (LVEF 24%).

4: Cardiomyopathies:
• A middle aged woman presented with chest pain after a home explosion, and was found to have non-obstructive CAD.
• There is left ventricular apical dyskinesis on the 2 chamber and 4 chamber cine views.
Takotsubo Cardiomyopathy
At presentation, diffuse negative T waves (arrows) were identified, deepest in leads V4-V5.
4 months later (right), the T wave abnormality had resolved.
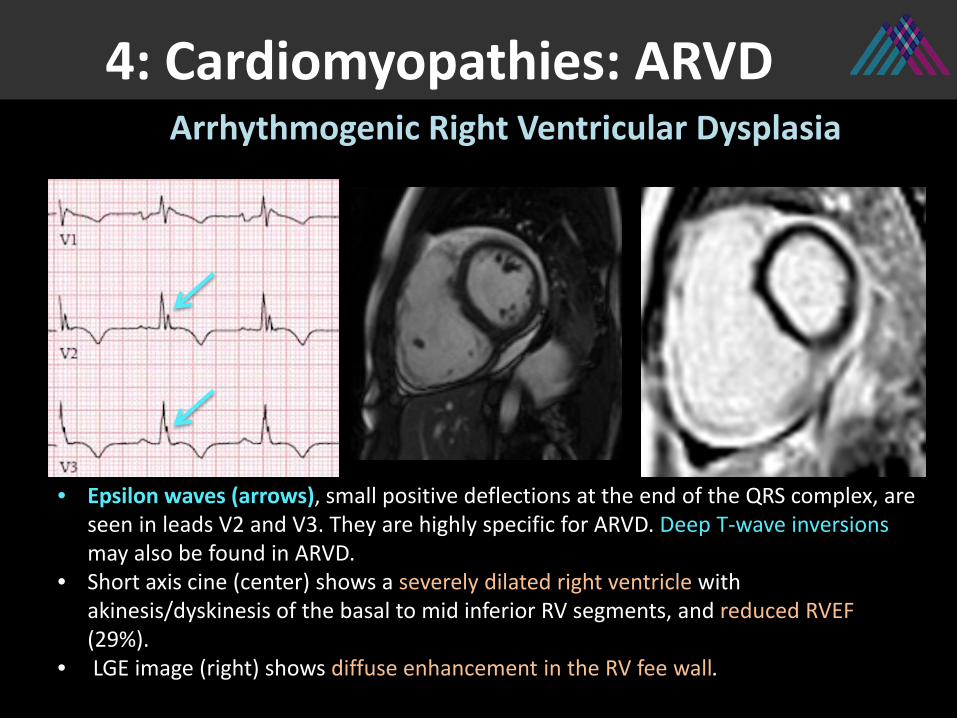
4: Cardiomyopathies: ARVDArrhythmogenic Right Ventricular Dysplasia
• Epsilon waves (arrows), small positive deflections at the end of the QRS complex, are seen in leads V2 and V3. They are highly specific for ARVD. Deep T-wave inversionsmay also be found in ARVD.
• Short axis cine (center) shows a severely dilated right ventricle with akinesis/dyskinesis of the basal to mid inferior RV segments, and reduced RVEF (29%).
• LGE image (right) shows diffuse enhancement in the RV fee wall.

4: Cardiomyopathies: AmyloidCardiac Amyloidosis
LGE PSIR image (left) shows diffuse ventricular and left atrial enhancement. Short axis cine (right) shows severe concentric LV wall thickening with normal ejection fraction.
Low voltage EKG, when the QRS complex is < 5 mm in height in limb leads and < 10 mm in precordial leads, is commonly seen in amyloidosis. (rectangle height 10 mm)

4: Cardiomyopathies: SarcoidCardiac Sarcoidosis
55 year old man with pulmonary sarcoid, found to have myocardial enhancement at the RV aspect of the basal anteroseptum, as well as in the basal inferoseptal and inferolateral segments.
The patient has 1st degree AV block, demonstrated by the prolonged PR interval (286ms, circled),
which corresponds to the finding of scar at the RV aspect of the septum.

4: Cardiomyopathies: FabryFabry Disease
In two separate patients, on short axis and 3-chamber LGE images, hypertrophy and enhancement are seen in the basal inferolateral segment, compatible with Fabry disease.
ECG from Patient B shows evidence of LVH, with the S (V1) + R (V6) > 35, via the Sokolow-Lyon Criteria. A short PR interval may also be seen in Fabrydisease.
31 boxes
15 boxes
A
B

5: Optimizing Image Acquisitionin the setting of an abnormal ECG
a. Setting up the ECGb. Gating
• Prospective Triggering• Retrospective Gating• Pulse Gating
c. Acquisition Technique• Segmented (Cine, LGE)• Non-Segmented (“Real Time” Cine, Single Shot LGE)

5: Optimizing ImagesSetting up the ECG
• Synchronizing the MRI pulse to the R-wave allows us to acquire images without motion
NEED A STRONG WAVEFORM• Potential problems:
• Inaccurate QRS detection• Low voltage ECG
• Tips:• Prepare anterior chest for lead placement:
– Shave if necessary– Clean skin with commercially available gel, not alcohol
• May need to deviate from standard lead placement• Keep lead cables parallel to the bore of the magnet and on the same side as
the aorta• Ensure lead cables not looped may twist/braid cables to avoid this• Try a different lead selection if necessary (i.e. lead I, II or III) use the lead
with the sharpest R/S waves

5: Optimizing ImagesECG Gating: Prospective v. Retrospective
SYSTOLEDIASTOLESYSTOLEDIASTOLE SYSTOLEDIASTOLE
Prospective
Retrospective
• Acquisition is triggered by the R wave, after which there is a pre-set trigger delay • Acquisition window excludes 10-15% of the cardiac cycle (gray) at end diastole underestimates EF• Exclusion of end-diastole often functions as an arrhythmia rejection window, unless a premature
contraction occurs even earlier to fall within the acquisition window/trigger acquisition
• Continuous acquisition of untriggered data and the ECG through the entire cardiac cycle• Information is subsequently post-processed, with images reconstructed/sorted into the correct
cardiac “phase” (also termed “segment “or “frame”)• Arrhythmia rejection capability, which will discard the errant heartbeat and reacquire another, thus
creating a longer acquisition. Not as good for large beat-to-beat variations in the R-R interval.
Acquisition window
Acquisition window

5: Optimizing ImagesPulse Gating
• Low ECG voltage/weak waveform may preclude triggering, which can occur in multiple scenarios, including:
• Large pericardial effusion• Emphysema/COPD• Amyloidosis• Myocardial Edema
• Solution: Pulse gating• Drawback: unclear delay time between
ventricular contraction and the peripheral pulse

5: Optimizing ImagesSegmented Acquisition
Segmented Acquisition• Multiple k-space lines (echoes) are measured/combined for each cardiac
phase over multiple heartbeats• Typically requires both triggering and multiple patient breath-holds• More k-space lines = less heartbeats necessary to acquire the image
– ↑ k-space lines per segment = ↓ ACQUISITION TIME (TA) = ↓ TEMPORAL RESOLUTION
• May adjust parameters to make the breath-hold shorter/longer • Bradycardia (long R-R would necessitate long breath hold): Increase number of
k-space lines to decrease TA/breath hold• Tachycardia: Can decrease number of k-space lines
Bradycardia TachycardiaHeart Rate
> 15 k-space lines
60-99 bpm
< 9 k-space lines9-15 k-space lines

5: Optimizing ImagesK-Space Schematic—Segmented
SEGMENTED – Cine
SEGMENTED – LGE
1 2 3 • K-space lines (echoes) are gathered for multiple phases* (numbered) in each heartbeat
• Data from multiple heartbeats is combined by phase to create the images
• K-space lines (echoes) are gathered during a diastolic phase
• Data over multiple heartbeats is combined for this phase to create the image
Acquisition over multiple heartbeats (R-R intervals)
1 2 3 1 2 3
1 2 3 1 2 3 1 2 3
*Phase is synonymous with “segments” or “frames”

5: Optimizing ImagesNon-Segmented Acquisition
“Real Time” Cine and Single Shot LGE– All k-space lines are gathered in one R-R interval– May be useful when:
• Weak ECG signal precludes gating/triggering• Irregular ECG signal precludes gating/triggering• Patient cannot maintain breath-holds
– Drawbacks:• Lower spatial resolution• Lower temporal resolution

5: Optimizing ImagesK-Space Schematic—Non segmented
NON-SEGMENTED – “Real Time Cine”
NON-SEGMENTED – Single Shot LGE
1 2 3 • K-space lines (echoes) are gathered for multiple phases* (numbered) over the course of one heartbeat
• K-space lines (echoes) are gathered during one phase over one heartbeat
Acquisition over one heartbeat
1 2 3
1 2 3 1 2 3
*Phase is synonymous with “segments” or “frames”

• Knowledge of the ECG may foreshadow a potentially suboptimal imaging exam: Early trouble-shooting of rhythm
abnormalities• The ECG may broaden differential
considerations: Addition of sequences specific to suspected
pathology (i.e. T2 for edema, T1 for fat, TI Scout for amyloid)
• The ECG may aid in distinguishing among conditions that present with similar imaging features
Conclusions
References
Lea Azour, MD [email protected]
1. Axel L, Lim R. Clinical Cardiac MRI Techniques. Cardiovasc Magn Reson Imaging. Totowa, NJ: Humana Press; 2008. p. 33–77.2. Aletras AH. Basic MRI Physics. Cardiovasc Magn Reson Imaging. Totowa, NJ: Humana Press; 2008. p. 1–31.3. Momiyama Y, Mitamura H, Kimura M. ECG characteristics of dilated cardiomyopathy. J Electrocardiol. 1994;27:323–328.4. Barnwell JD, Klein JL, Stallings C, et al. Image-guided optimization of the ECG trace in cardiac MRI. Int J Cardiovasc Imaging. Springer Netherlands; 2012;28:587–593.5. Shankaranarayanan A, Simonetti OP, Laub G, Lewin JS, Duerk JL. Segmented k-Space and Real-Time Cardiac Cine MR Imaging with Radial Trajectories. Radiology. Radiological Society of North America ; 2001;221:827–836.6. Namdar M, Steffel J, Vidovic M, et al. Electrocardiographic changes in early recognition of Fabry disease. Heart. 2011;97:485–490.7. Sonnex E, Coulden R. The EKG in cardiac MRI: what the technologist needs to know. J Cardiovasc Magn Reson. BioMed Central; 2014;16:T4.8. Saremi F, Grizzard JD, Kim RJ. Optimizing Cardiac MR Imaging: Practical Remedies for Artifacts. RadioGraphics. Radiological Society of North America ; 2008;28:1161–1187.9. Frangieh AH, Obeid S, Ghadri J, et al. ECG Criteria to Differentiate Between Takotsubo (Stress) Cardiomyopathy and Myocardial Infarction. J Am Heart Assoc. 2016;5:e003418.10. TANAWUTTIWAT T, TE RIELE ASJM, PHILIPS B, et al. Electroanatomic Correlates of Depolarization Abnormalities in Arrhythmogenic Right Ventricular Dysplasia/Cardiomyopathy. J Cardiovasc Electrophysiol. 2016;27:443–452.11. PROTONOTARIOS A, ANASTASAKIS A, TSATSOPOULOU A, et al. Clinical Significance of Epsilon Waves in Arrhythmogenic Cardiomyopathy. J CardiovascElectrophysiol. 2015;26:1204–1210.12. Sperry BW, Vranian MN, Hachamovitch R, et al. Are classic predictors of voltage valid in cardiac amyloidosis? A contemporary analysis of electrocardiographic findings. Int J Cardiol. 2016;214:477–481.13. Birnie DH, Nery PB, Ha AC, Beanlands RSB. Cardiac Sarcoidosis. J Am Coll Cardiol. 2016;68:411–421.14. Nacif MS, Zavodni A, Kawel N, Choi E-Y, Lima JAC, Bluemke DA. Cardiac magnetic resonance imaging and its electrocardiographs (ECG): tips and tricks. Int J Cardiovasc Imaging. NIH Public Access; 2012;28:1465–1475.15. Ridgway JP. Cardiovascular magnetic resonance physics for clinicians: part I. J Cardiovasc Magn Reson. BioMed Central; 2010;12:71.