spillovers from public intangibles · spillovers from public intangibles...
TRANSCRIPT

Spillovers from public intangibles
C. Corrado, (The Conference Board), New YorkJ. Haskel, (Imperial College, CEPR and IZA), London
C. Jona-Lasinio, (LUISS Lab and ISTAT), Rome
SPINTAN Final Conference - LUISS University12-13 September 2016, Rome, Italy
This project has received funding from the European Union’s Seventh Framework Programme forresearch, technological development and demonstration under grant agreement No. 612774
Corrado, Haskel, Jona-Lasinio SPINTAN 1 / 26

Background
• The global productivity slowdown has generated renewed interestin policies that might boost economic growth with a special focuson spillovers from public sector investments.
• The public sector is a major investor in intangible assets,especially human and scientific knowledge capital via its publicinvestments in education and R&D.
• Investments in these assets, both tangible and intangible, arebelieved to exert positive macroeconomic effects in the long run.
Corrado, Haskel, Jona-Lasinio SPINTAN 2 / 26

Background
Regarding intangibles, the analysis of public sector spillovers in OECDcountries typically looks (in isolation) at R&D and education:
• Spillovers from publicly performed R&D to market sectorproductivity were studied by, e.g., Guellec and van Pottelsberghe(2002, and 2004), who found strongly positive effects in theircross-country work.
• The literature on the positive effects of R&D is extensive butlargely pertains to R&D that is privately performed (yet possiblypublicly funded) (see Hall, Mairesse, and Mohnen (2009) andEberhardt, Helmers, and Strauss (2013) for reviews).
• ......but there are very few studies of possible spillovers from awider set of public intangibles to productivity growth.
Corrado, Haskel, Jona-Lasinio SPINTAN 3 / 26

Background
• Spillovers from public sector R&D are but one dimension ofpossible spillovers from investments in knowledge/intangibleassets. For example, O’Mahony and Riley (2012) examinewhether employer-provided training may facilitate the generationof spillovers from education.
• Further, besides the well documented spillovers from the conductof corporate R&D, there might be pure spillovers from businessinvestments in nonR&D intangibles.
• These forms of investments grew dramatically in relative importance in theUnited States from the late 1970s to the mid-2000s (Corrado and Hulten,2010).
• After 2007, the divergent paths of tangible and intangible investment in boththe US and EU are especially striking.
• The empirical analysis of spillovers from nonR&D intangibles is arelatively new and largely unexplored territory.
Corrado, Haskel, Jona-Lasinio SPINTAN 4 / 26
Our paper
To examine the possible spillovers between public sector intangibles and businesssector productivity performance, we:• Explore the correlation between TFP growth and different measures of public
sector knowledge creation using a new cross-country industry-level databasethat includes data on both market and nonmarket intangible investment atthe industry level.
• we find evidence of spillovers from public sector R&D to productivity in themarket sector.
• our earlier finding of spillovers to private nonR&D intangible capital holds inthe extended dataset, i.e., the finding is robust to the inclusion of additionalcountries (United States), additional years of data (2008 to 2013), andadditional controls (public R&D, financial conditions)
Corrado, Haskel, Jona-Lasinio SPINTAN 5 / 26

Data
• Database with multiple dimensions: country, industry,institutional sector, time
• Tangible and intangible assets (NA, INTAN Invest and SPINTAN)• 20 industries (A-U Nace Rev 2), 1995-2013, so far 12 countries:
• US• Big Northern Europe: DE, FR, UK• Scandinavian: DK FI, SE• Small Europe: AT, CZ, NL• Mediterranean: ES, IT
Corrado, Haskel, Jona-Lasinio SPINTAN 6 / 26

Model
Suppose that industry value added in country c , industry i and time t, Qc,i,t canbe written as:
Qc,i,t = Ac,i,tFc,i (Lc,i,t ,Kc,i,t ,Rc,i,t) (1)
Log differentiating equation (1) per (Solow, 1957) gives:
∆lnQc,i,t = εLc,i,t∆lnLc,i,t + εKc,i,t∆lnKc,i,t + εRc,i,t∆lnRc,i,t + ∆lnAc,i,t (2)
where εX denotes the output elasticity of an input X , which in principle varies byinput, country, industry and time.
Corrado, Haskel, Jona-Lasinio SPINTAN 7 / 26
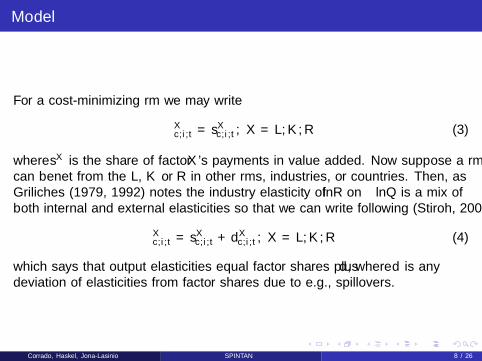
Model
For a cost-minimizing firm we may write
εXc,i,t = sXc,i,t , X = L,K ,R (3)
where sX is the share of factor X ’s payments in value added. Now suppose a firmcan benefit from the L, K or R in other firms, industries, or countries. Then, asGriliches (1979, 1992) notes the industry elasticity of ∆lnR on ∆lnQ is a mix ofboth internal and external elasticities so that we can write following (Stiroh, 2002)
εXc,i,t = sXc,i,t + dXc,i,t , X = L,K ,R (4)
which says that output elasticities equal factor shares plus d , where d is anydeviation of elasticities from factor shares due to e.g., spillovers.
Corrado, Haskel, Jona-Lasinio SPINTAN 8 / 26

Model
To examine spillovers, that is d > 0, we note that following (Caves, Christen andDwiert, 1982) a Divisia ∆lnTFP index can be constructed that is robust to anunderlying translog production function such that we can write (2) as
∆lnTFPQc,i,t = dL
c,i,t∆lnLc,i,t + dKc,i,t∆lnKc,i,t + dR
c,i,t∆lnRc,i,t + ∆lnAc,i,t (5)
where ∆lnTFPQc,i,t is calculated as
∆lnTFPQc,i,t = ∆lnQc,i,t − sLc,i,t∆lnLc,i,t − sKc,i,t∆lnKc,i,t − sRc,i,t∆lnRc,i,t (6)
From equation (5) therefore, a regression of ∆lnTFPQ on the inputs recovers thespillover terms.
Corrado, Haskel, Jona-Lasinio SPINTAN 9 / 26

Total economy productivity growth and capital input growth by majortype
-.1-.0
50
.05
Dln
TFP
-.02 0 .02 .04 .06DlnK_NonICT_Tot
“FR” “DE” “SE” “DK” “FI” “UK” “IT” “ES” “NL” “AT” “US” “CZ” Fitted values
-.1-.0
50
.05
-.02 0 .02 .04 .06 .08DlnK_intan_Tot
“FR” “DE” “SE” “DK” “FI” “UK” “IT” “ES” “NL” “AT” “US” “CZ” Fitted values
-.1-.0
50
.05
Dln
TFP
-.05 0 .05 .1DlnK_rd_Tot
“FR” “DE” “SE” “DK” “FI” “UK” “IT” “ES” “NL” “AT” “US” “CZ” Fitted values
-.1-.0
50
.05
0 .05 .1 .15 .2 .25DlnK_ICT_isf_Tot
“FR” “DE” “SE” “DK” “FI” “UK” “IT” “ES” “NL” “AT” “US” “CZ” Fitted values
DlnTFP
Corrado, Haskel, Jona-Lasinio SPINTAN 10 / 26

Market sector productivity growth, capital input growth, andnonmarket R&D
-.1-.0
50
.05
Dln
TFP_
mk
-.02 0 .02 .04 .06 .08DlnK_NonICT_mk
“FR” “DE” “SE” “DK” “FI” “UK” “IT” “ES” “NL” “AT” “CZ” Fitted values
-.1-.0
50
.05
-.05 0 .05 .1DlnK_intan_xrdsf_mk
“FR” “DE” “SE” “DK” “FI” “UK” “IT” “ES” “NL” “AT” “US” “CZ” Fitted values
-.1-.0
50
.05
Dln
TFP_
mk
-.05 0 .05 .1DlnK_rd_mk
“FR” “DE” “SE” “DK” “FI” “UK” “IT” “ES” “NL” “AT” “US” “CZ” Fitted values
-.1-.0
50
.05
-.001 0 .001 .002L.DRDnm_Qmk
“FR” “DE” “SE” “DK” “FI” “UK” “IT” “ES” “NL” “AT” “US” “CZ” Fitted values
DlnTFP_mk
Corrado, Haskel, Jona-Lasinio SPINTAN 11 / 26
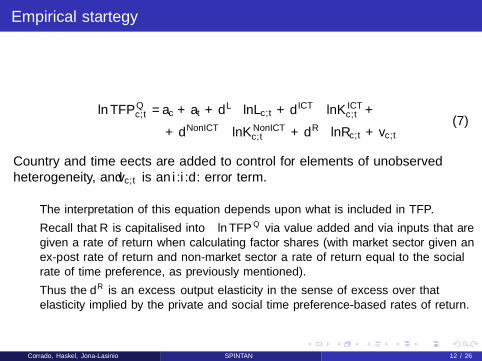
Empirical startegy
∆ lnTFPQc,t =ac + at + dL∆lnLc,t + d ICT∆lnK ICT
c,t +
+ dNonICT∆lnKNonICTc,t + dR∆lnRc,t + vc,t
(7)
Country and time effects are added to control for elements of unobservedheterogeneity, and vc,t is an i .i .d . error term.
• The interpretation of this equation depends upon what is included in TFP.
• Recall that R is capitalised into ∆ lnTFPQ via value added and via inputs that aregiven a rate of return when calculating factor shares (with market sector given anex-post rate of return and non-market sector a rate of return equal to the socialrate of time preference, as previously mentioned).
• Thus the dR is an “excess” output elasticity in the sense of excess over thatelasticity implied by the private and social time preference-based rates of return.
Corrado, Haskel, Jona-Lasinio SPINTAN 12 / 26

Empirical startegy 2
To explore knowledge spillovers from non-market knowledge we test two models:
∆lnTFPQ,MKTc,t = ac + at + dL∆lnLMKT
c,t + dK∆lnKMKTc,t +
dRNonR&D ∆lnRNonR&DMKTc,t + dRR&D ∆lnRR&DNonMKT
c,t + vc,t
and
∆lnTFPQ,MKTc,t = ac + at + dL∆lnLMKT
c,t + dK∆lnKMKTc,t + dR∆lnRMKT
c,t
+ ρ(NNonMKT/QMKT )c,t + vc,t
Here we have written the elasticity times the log change in the non-market stockof R in terms of its flow i.e. γc∆lnRNonMKT
c,t = ρ(NNonMKT/QMKT )c,t whereNNonMKT is the flow of investment by the non-market sector in R.
Corrado, Haskel, Jona-Lasinio SPINTAN 13 / 26

Econometric results: 1
(1) (2) (3) (4) (5)
VARIABLES 1998-2007
D.DlnK_NonICT -0.232 -0.117 -0.244 -0.257* -0.215(0.165) (0.162) (0.155) (0.155) (0.176)
D.DlnK_ICT 0.036 0.012 0.012 0.007 0.040(0.051) (0.051) (0.053) (0.052) (0.046)
D.DlnR 0.307*** 0.271***(0.076) (0.072)
D.DlnRR&D 0.302** 0.316** 0.144(0.132) (0.129) (0.103)
D.DlnRnonR&D 0.203*** 0.199*** 0.307***(0.059) (0.058) (0.066)
D.DlnLCH(t-1) 0.301** 0.358***(0.121) (0.103)
D.DlnH(t-1) 0.008 0.005(0.022) (0.012)
D.DlnL(t-1) 0.026(0.037)
D.DlnL(t-2)
lnLRINTR 0.009*** 0.010*** 0.010*** 0.003(0.002) (0.003) (0.002) (0.003)
lnLRINTR(t-1) -0.009*** -0.007** -0.006** 0.007*(0.003) (0.003) (0.003) (0.004)
lnLRINTR(t-2) -0.000 -0.004 -0.005 -0.010***(0.003) (0.003) (0.003) (0.003)
Observations 160 150 150 150 97Standarderrorsinparentheses***p<0.01,**p<0.05,*p<0.1
D.DlnTFP
1998-2013
Corrado, Haskel, Jona-Lasinio SPINTAN 14 / 26

Econometric results: 2
(1) (2) (3) (4) (5)
VARIABLES 1998-2007
D.DlnK_NonICTmkt -0.212 -0.097 -0.116 -0.102 -0.11(0.175) (0.170) (0.169) (0.188) (0.169)
D.DlnK_ICTmkt -0.008 -0.036 -0.036 -0.041 -0.001(0.058) (0.057) (0.057) (0.070) (0.058)
D.DlnRR&D_mkt 0.142 0.223 0.218 0.254* 0.245**(0.135) (0.137) (0.138) (0.146) (0.123)
D.DlnRR&D_nmkt(t-3) 0.200* 0.089
(0.112) (0.085)D.DlnRnonR&D 0.268*** 0.229*** 0.227*** 0.205*** 0.216***
(0.068) (0.063) (0.064) (0.066) (0.078)
D.DlnLCHmkt(t-3) 0.183 0.080
(0.145) (0.184)
D.DlnHmk(t-3) 0.011 -0.084
(0.026) (0.106)lnLRINTR 0.011*** 0.011*** 0.011*** 0.006*
(0.003) (0.003) (0.003) (0.003)lnLRINTR(t-1) -0.011*** -0.011*** -0.007* 0.002
(0.004) (0.004) (0.004) (0.005)lnLRINTR(t-2) -0.001 -0.001 -0.006* -0.009**
(0.004) (0.004) (0.004) (0.004)D.RDnm_Qmk -1.326
(3.758)
Observations 160 150 150 130 77
D.DlnTFPmkt
1998-2013
Corrado, Haskel, Jona-Lasinio SPINTAN 15 / 26

DlnTFP, market sector and Nonmarket R&D
AT
DE
ES
FI
FR
IT
NL
SE
UK
US
ATDE
ES
FI
FRIT
NL
SE
UK
US
AT
DE
ES
FI
FR
IT
NL
SE
UK
US
AT
DE
ES
FIFR
IT
NL
SE
UK
US
-.01
0.0
1.0
2
-.01
0.0
1.0
2.0
3
-.06
-.04
-.02
0
-.005
0.0
05.0
1.0
15
0 .005 .01 .015 0 .005 .01 .015
1998-03 2004-07
2008-09 2010-13
Dln
TFP,
mar
ket s
ecto
r
(Non-market R&D spend)/(market sector value added)Graphs by period
Corrado, Haskel, Jona-Lasinio SPINTAN 16 / 26
BERD and National Accounts/SPINTAN Market Sector R&D data
23
45
67
1995 2000 2005 2010 2015
NA BERD_ISIC4BERD_ISIC31
AT
1020
3040
1995 2000 2005 2010 2015
NA BERD_ISIC4BERD_ISIC31
CZ
3040
5060
1995 2000 2005 2010 2015
NA BERD_ISIC4BERD_ISIC31
DE
1020
3040
50
1995 2000 2005 2010 2015
NA BERD_ISIC4BERD_ISIC31
DK
24
68
1012
1995 2000 2005 2010 2015
NA BERD_ISIC4BERD_ISIC31
ES
12
34
56
1995 2000 2005 2010 2015
NA BERD_ISIC4BERD_ISIC31
FI
1020
3040
50
1995 2000 2005 2010 2015
NA BERD_ISIC4BERD_ISIC31
FR
46
810
1214
1995 2000 2005 2010 2015
NA BERD_ISIC4BERD_ISIC31
IT
24
68
10
1995 2000 2005 2010 2015
NA BERD_ISIC4BERD_ISIC31
NL
4060
80100
120
1995 2000 2005 2010 2015
NA BERD_ISIC4BERD_ISIC31
SE
05
1015
2025
1995 2000 2005 2010 2015
NA BERD_ISIC4BERD_ISIC31
UK
100
150
200
250
300
350
1995 2000 2005 2010 2015
NA BERD_ISIC4BERD_ISIC31
US
Corrado, Haskel, Jona-Lasinio SPINTAN 17 / 26

Econometric results: 3
(1) (2) (3) (4) (5) (6)
VARIABLES no time dummies All lagged Fixed effects
D.RDnm_Qmk(t-1) 0.802*** 0.726*** 0.736** 0.713** 5.483(0.234) (0.250) (0.295) (0.355) (4.414)
DlnK_intan_xrdsf_mk -0.054 -0.055(0.094) (0.094)
DlnK_rd_mk 0.010 0.007(0.089) (0.090)
DlnLCH_mk -0.143(0.662)
L.LRDnm_Qmk 0.633**(0.320)
L.DlnK_intan_xrdsf_mk 0.119*(0.070)
L.DlnK_rd_mk 0.095(0.078)
L.DlnLCH_mk 0.876(1.180)
periodcode1 0.002 0.003 0.003 0.008(0.003) (0.003) (0.004) (0.007)
periodcode2 0.008** 0.009*** 0.008*** 0.006* 0.012*(0.003) (0.003) (0.003) (0.003) (0.005)
periodcode3 -0.035*** -0.035*** -0.035*** -0.036*** -0.031***(0.007) (0.008) (0.008) (0.009) (0.008)
Constant -0.007*** -0.001 -0.000 0.001 -0.007 -0.034(0.002) (0.003) (0.003) (0.005) (0.009) (0.031)
Observations 40 40 40 40 30 40R-squared 0.0231 0.707 0.708 0.708 0.747 0.392
Robust standard errors in parentheses*** p<0.01, ** p<0.05, * p<0.1
DlnTFPmk
Corrado, Haskel, Jona-Lasinio SPINTAN 18 / 26

DlnTFP, market sector and Nonmarket R&D
AT
DE
ES
FI
FR
IT
NL
SE
UK
US
ATDE
ES
FI
FRIT
NL
SE
UK
US
AT
DE
ES
FI
FR
IT
NL
SE
UK
US
AT
DE
ES
FIFR
IT
NL
SE
UK
US
-.01
0.0
1.0
2
-.01
0.0
1.0
2.0
3
-.06
-.04
-.02
0
-.005
0.0
05.0
1.0
15
0 .005 .01 .015 0 .005 .01 .015
1998-03 2004-07
2008-09 2010-13
Dln
TFP,
mar
ket s
ecto
r
(Non-market R&D spend)/(market sector value added)Graphs by period
Corrado, Haskel, Jona-Lasinio SPINTAN 19 / 26

Summing up
• Using R&D investment time series newly developed for nationalaccounts, we find support for earlier findings in the literature (e.g.Guellec and van Pottelsberghe (2002, and 2004)),) that there arespillovers from public sector R&D to market sector productivity.
• Our findings suggest a rate of return of around 50% to publicsector R&D spend.
• We also find that market sector investments in nonR&Dintangible capital generate spillovers to productivity.
• Finally, we do not find evidence that non-market non-R&Dintangible investment has spillover benefits to the market sector.
Corrado, Haskel, Jona-Lasinio SPINTAN 20 / 26

Conclusions Policy challenges
• A primary characteristic of intangible capital, widely supported bygrowth accounting exercises and macroeconomic studies, is to begrowth-promoting.
• This is because intangible investments likely generate spillovers tothe economic system being non-rival and possibly non-excludable.Such spillovers, if they exist, might be within the private sectorand/or between the public and private sector.
• In the light of the prolonged productivity slowdown experienced bymany advanced countries after the financial crisis, it would bevital to know which, if any, public sector intangibles had positivespillovers to the rest of the economy.
Corrado, Haskel, Jona-Lasinio SPINTAN 21 / 26

Backup slides
Corrado, Haskel, Jona-Lasinio SPINTAN 22 / 26

Changes in total economy productivity growth and capital inputgrowth by major type
-.1-.0
50
.05
.1D
Dln
TFP
-.03 -.02 -.01 0 .01DDlnK_NonICT_Tot
“FR” “DE” “SE” “DK” “FI” “UK” “IT” “ES” “NL” “AT” “US” “CZ” Fitted values
-.1-.0
50
.05
.1
-.06 -.04 -.02 0 .02 .04DDlnK_intan_Tot
“FR” “DE” “SE” “DK” “FI” “UK” “IT” “ES” “NL” “AT” “US” “CZ” Fitted values
-.1-.0
50
.05
.1D
Dln
TFP
-.04 -.02 0 .02 .04DDlnK_rd_Tot
“FR” “DE” “SE” “DK” “FI” “UK” “IT” “ES” “NL” “AT” “US” “CZ” Fitted values
-.1-.0
50
.05
.1
-.1 -.05 0 .05 .1DDlnK_ICT_isf_Tot
“FR” “DE” “SE” “DK” “FI” “UK” “IT” “ES” “NL” “AT” “US” “CZ” Fitted values
DDlnTFP
Corrado, Haskel, Jona-Lasinio SPINTAN 23 / 26

Changes in total economy productivity growth and capital inputgrowth by major type
-.1-.0
50
.05
.1D
Dln
TFP
-.03 -.02 -.01 0 .01DDlnK_NonICT_Tot
“FR” “DE” “SE” “DK” “FI” “UK” “IT” “ES” “NL” “AT” “US” “CZ” Fitted values
-.1-.0
50
.05
.1
-.06 -.04 -.02 0 .02 .04DDlnK_intan_Tot
“FR” “DE” “SE” “DK” “FI” “UK” “IT” “ES” “NL” “AT” “US” “CZ” Fitted values
-.1-.0
50
.05
.1D
Dln
TFP
-.04 -.02 0 .02 .04DDlnK_rd_Tot
“FR” “DE” “SE” “DK” “FI” “UK” “IT” “ES” “NL” “AT” “US” “CZ” Fitted values
-.1-.0
50
.05
.1
-.1 -.05 0 .05 .1DDlnK_ICT_isf_Tot
“FR” “DE” “SE” “DK” “FI” “UK” “IT” “ES” “NL” “AT” “US” “CZ” Fitted values
DDlnTFP
Corrado, Haskel, Jona-Lasinio SPINTAN 24 / 26

Changes in market sector productivity growth, capital input growth,and nonmarket R&D
-.1-.0
50
.05
.1.1
5D
Dln
TFP_
mk
-.04 -.02 0 .02DDlnK_NonICT_mk
“FR” “DE” “SE” “DK” “FI” “UK” “IT” “ES” “NL” “AT” “CZ” Fitted values
-.1-.0
50
.05
.1.1
5
-.06 -.04 -.02 0 .02 .04DDlnK_intan_xrdsf_mk
“FR” “DE” “SE” “DK” “FI” “UK” “IT” “ES” “NL” “AT” “US” “CZ” Fitted values
-.1-.0
50
.05
.1.1
5D
Dln
TFP_
mk
-.04 -.02 0 .02 .04DDlnK_rd_mk
“FR” “DE” “SE” “DK” “FI” “UK” “IT” “ES” “NL” “AT” “US” “CZ” Fitted values
-.1-.0
50
.05
.1.1
5
-.001 0 .001 .002L.DRDnm_Qmk
“FR” “DE” “SE” “DK” “FI” “UK” “IT” “ES” “NL” “AT” “US” “CZ” Fitted values
DDlnTFP_mk
Corrado, Haskel, Jona-Lasinio SPINTAN 25 / 26

• Assume that public R&D does not depreciate (to the extent it is“basic” then is likely to at least become less obsolete than privateR&D; the ONS report using a depreciation rate of 5% forgovernment R&D for example.)
• From the perpetual inventory model,∆lnRNonMKT
t = NNonMKT/RNonMKTt−1 when δNonMKT = 0.
• Thus the elasticity of market output(∂Q/∂RNonMKT )(RNonMKT/Q) times this term can bewritten=(ρit)(RPUB/Q) where ρit = (∂Q/∂RNonMKT )
Corrado, Haskel, Jona-Lasinio SPINTAN 26 / 26