spirent: datum user experience analytics system
TRANSCRIPT
www.spirent.com
DatumUser Experience Analytics Systemfor Data Services
Making 4G Faster: Getting to the Root of Issues
Speed Bumps on the 4G Highway. Most users summarize the benefits of 4G LTE and LTE-A services in two words: “It’s faster!” Users expect blazing fast speeds that blow away 3G – but, the fact is, they don’t always get what they expect. With unprecedented network and device complexity, a variety of device, network and application layer issues are reducing the speed of 4G services for many users.
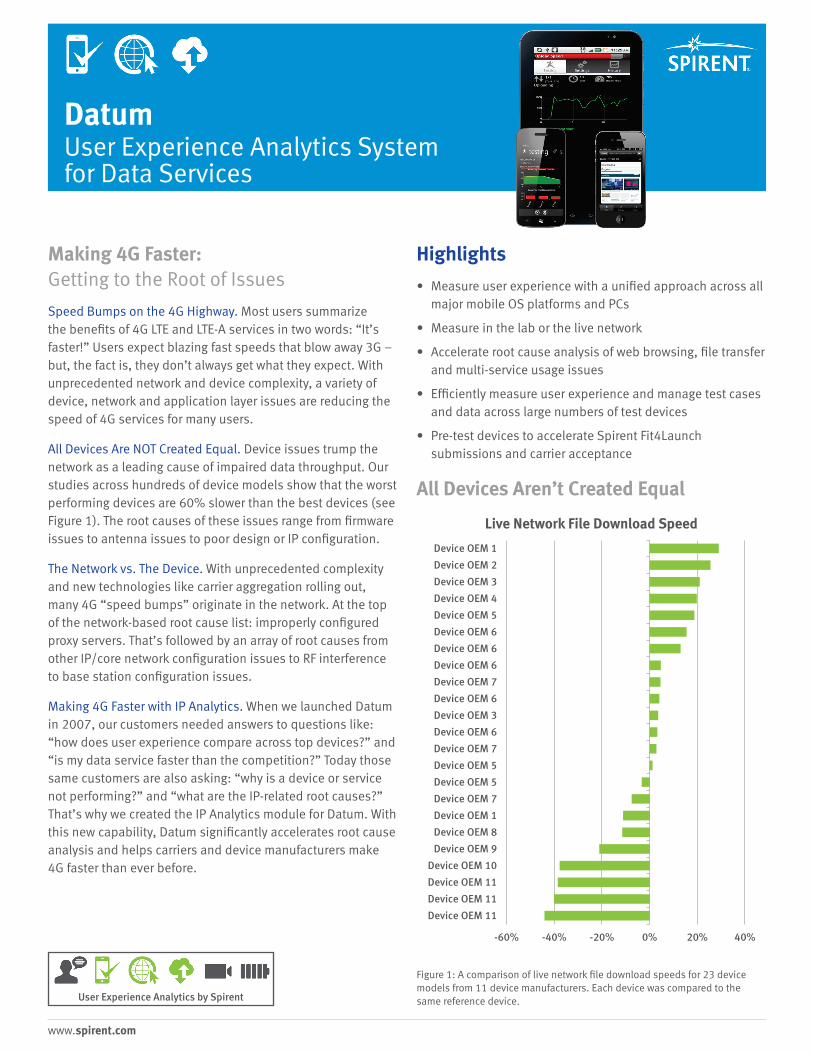
All Devices Are NOT Created Equal. Device issues trump the network as a leading cause of impaired data throughput. Our studies across hundreds of device models show that the worst performing devices are 60% slower than the best devices (see Figure 1). The root causes of these issues range from firmware issues to antenna issues to poor design or IP configuration.
The Network vs. The Device. With unprecedented complexity and new technologies like carrier aggregation rolling out, many 4G “speed bumps” originate in the network. At the top of the network-based root cause list: improperly configured proxy servers. That’s followed by an array of root causes from other IP/core network configuration issues to RF interference to base station configuration issues.
Making 4G Faster with IP Analytics. When we launched Datum in 2007, our customers needed answers to questions like: “how does user experience compare across top devices?” and “is my data service faster than the competition?” Today those same customers are also asking: “why is a device or service not performing?” and “what are the IP-related root causes?” That’s why we created the IP Analytics module for Datum. With this new capability, Datum significantly accelerates root cause analysis and helps carriers and device manufacturers make 4G faster than ever before.
Highlights
• Measure user experience with a unified approach across all major mobile OS platforms and PCs
• Measure in the lab or the live network
• Accelerate root cause analysis of web browsing, file transfer and multi-service usage issues
• Efficiently measure user experience and manage test cases and data across large numbers of test devices
• Pre-test devices to accelerate Spirent Fit4Launch submissions and carrier acceptance
All Devices Aren’t Created Equal
User Experience Analytics by Spirent
Figure 1: A comparison of live network file download speeds for 23 device models from 11 device manufacturers. Each device was compared to the same reference device.
-60% -40% -20% 0% 20% 40%
Device OEM 11
Device OEM 11
Device OEM 11
Device OEM 10
Device OEM 9
Device OEM 8
Device OEM 1
Device OEM 7
Device OEM 5
Device OEM 5
Device OEM 7
Device OEM 6
Device OEM 3
Device OEM 6
Device OEM 7
Device OEM 6
Device OEM 6
Device OEM 6
Device OEM 5
Device OEM 4
Device OEM 3
Device OEM 2
Device OEM 1
Live Network File Download SpeedLive Network File Download Speed
SPIRENT Datum | User Experience Analytics System for Data Services
2 | www.spirent.com
Datum: Experience Analytics for Data Service and Multi-Service Usage
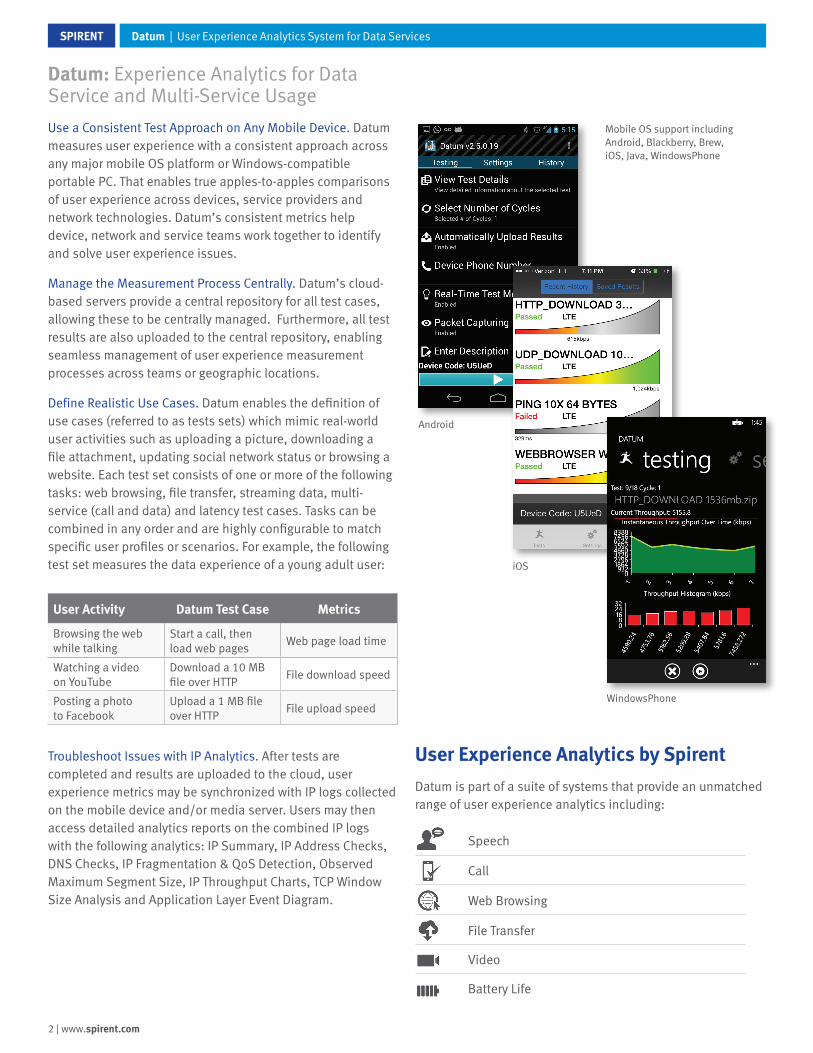
Use a Consistent Test Approach on Any Mobile Device. Datum measures user experience with a consistent approach across any major mobile OS platform or Windows-compatible portable PC. That enables true apples-to-apples comparisons of user experience across devices, service providers and network technologies. Datum’s consistent metrics help device, network and service teams work together to identify and solve user experience issues.
Manage the Measurement Process Centrally. Datum’s cloud-based servers provide a central repository for all test cases, allowing these to be centrally managed. Furthermore, all test results are also uploaded to the central repository, enabling seamless management of user experience measurement processes across teams or geographic locations.
Define Realistic Use Cases. Datum enables the definition of use cases (referred to as tests sets) which mimic real-world user activities such as uploading a picture, downloading a file attachment, updating social network status or browsing a website. Each test set consists of one or more of the following tasks: web browsing, file transfer, streaming data, multi-service (call and data) and latency test cases. Tasks can be combined in any order and are highly configurable to match specific user profiles or scenarios. For example, the following test set measures the data experience of a young adult user:
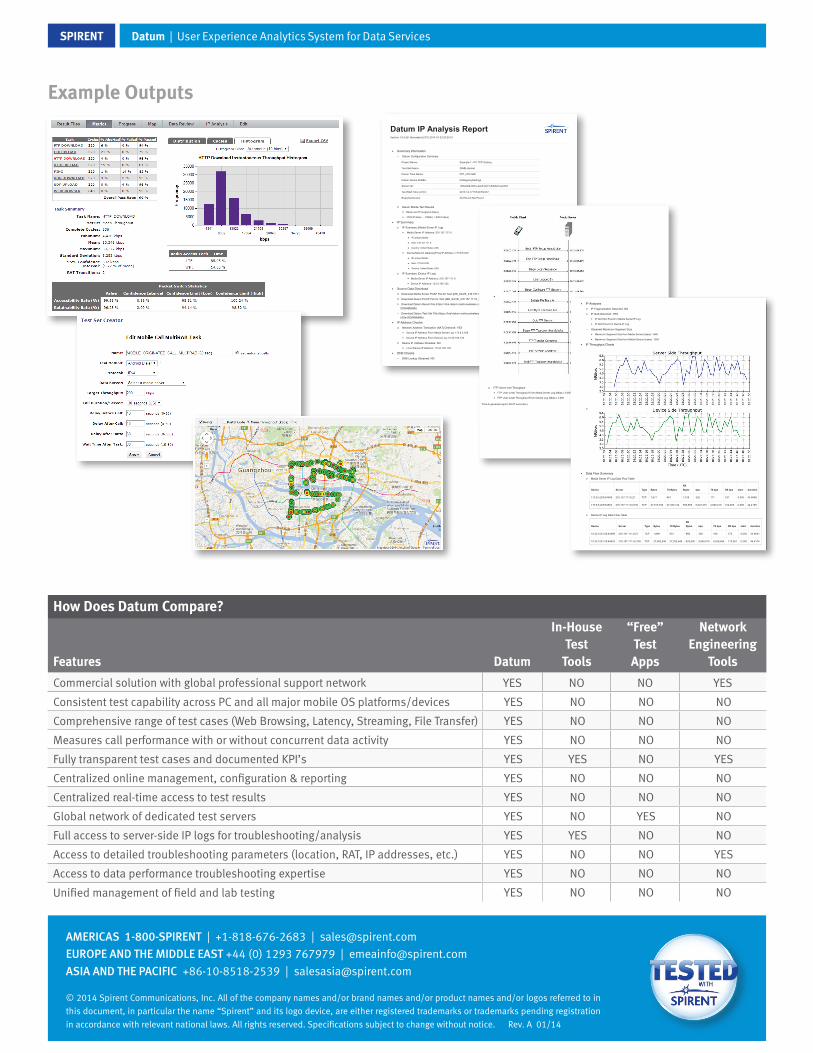
Troubleshoot Issues with IP Analytics. After tests are completed and results are uploaded to the cloud, user experience metrics may be synchronized with IP logs collected on the mobile device and/or media server. Users may then access detailed analytics reports on the combined IP logs with the following analytics: IP Summary, IP Address Checks, DNS Checks, IP Fragmentation & QoS Detection, Observed Maximum Segment Size, IP Throughput Charts, TCP Window Size Analysis and Application Layer Event Diagram.
User Experience Analytics by Spirent
Datum is part of a suite of systems that provide an unmatched range of user experience analytics including:
Speech
Call
Web Browsing
File Transfer
Video
Battery Life
Android
Mobile OS support including Android, Blackberry, Brew, iOS, Java, WindowsPhone
iOS
WindowsPhone
User Activity Datum Test Case Metrics
Browsing the web while talking
Start a call, then load web pages
Web page load time
Watching a video on YouTube
Download a 10 MB file over HTTP
File download speed
Posting a photo to Facebook
Upload a 1 MB file over HTTP
File upload speed

SPIRENT
www.spirent.com | 3
Datum | User Experience Analytics System for Data Services
Datum System Architecture
Datum Mobile: Data-Only Option. Datum Mobile is an on-device agent which connects to cloud-based media servers to initiate data experience tests including HTTP and FTP file transfers, web page downloads, ping tests and more. The Datum Mobile app may be downloaded and installed directly from the relevant app store (iOS, Android or WindowsPhone).
Datum Mobile: Multi-Service Option. For Android devices, Datum Mobile performs multi-service measurements for simultaneous voice and data sessions. Metrics include throughput before, after and during a call and multi-RAB call performance. Datum Mobile also integrates with Spirent’s voice experience analytics system, Nomad, to perform multi-service measurements for all leading mobile OS platforms.
Datum PC. Datum PC is a Windows-compatible software agent which initiates data experience tests including HTTP and FTP file transfers, web page downloads, ping tests and more. Datum PC may be used to test USB data dongles or integrated wireless or Ethernet capabilities for Windows-compatible PCs.
Datum Cloud. Datum Cloud includes the DatumBase web portal and repository and Call and Media Servers. DatumBase is a web-based application, hosted by Spirent, which acts as a repository for test set definitions and test results and also as a reporting and analytics web-interface (see IP Analytics). Call and media servers connect to the Datum Mobile or Datum PC agent to perform end-to-end data tasks and make calls for multi-service measurements. For lab-based testing, Datum Cloud servers are available in a Datum Lab Appliance which may be deployed within a lab IT network.
IP Analytics Module. The IP Analytics module is accessed via the DatumBase web-interface. The module uses a “watermarking” technique to synchronize and combine IP logs from the device and/or media server with user experience metrics. An analytics engine produces key troubleshooting metrics and performs a rule-based analysis of the data to automatically detect problems. Metrics and problem results are available via a web-based IP Analytics report.
SPIRENT Datum | User Experience Analytics System for Data Services
AMERICAS 1-800-SPIRENT | +1-818-676-2683 | [email protected]
EUROPE AND THE MIDDLE EAST +44 (0) 1293 767979 | [email protected]
ASIA AND THE PACIFIC +86-10-8518-2539 | [email protected]
© 2014 Spirent Communications, Inc. All of the company names and/or brand names and/or product names and/or logos referred to in
this document, in particular the name “Spirent” and its logo device, are either registered trademarks or trademarks pending registration
in accordance with relevant national laws. All rights reserved. Specifications subject to change without notice. Rev. A 01/14
How Does Datum Compare?
Features Datum
In-House Test
Tools
“Free” Test Apps
Network Engineering
Tools
Commercial solution with global professional support network YES NO NO YES
Consistent test capability across PC and all major mobile OS platforms/devices YES NO NO NO
Comprehensive range of test cases (Web Browsing, Latency, Streaming, File Transfer) YES NO NO NO
Measures call performance with or without concurrent data activity YES NO NO NO
Fully transparent test cases and documented KPI’s YES YES NO YES
Centralized online management, configuration & reporting YES NO NO NO
Centralized real-time access to test results YES NO NO NO
Global network of dedicated test servers YES NO YES NO
Full access to server-side IP logs for troubleshooting/analysis YES YES NO NO
Access to detailed troubleshooting parameters (location, RAT, IP addresses, etc.) YES NO NO YES
Access to data performance troubleshooting expertise YES NO NO NO
Unified management of field and lab testing YES NO NO NO
Datum IP Analysis ReportVersion 1.0.0.58 Generated (UTC) 2014-01-23 20:20:57
Summary Information
Datum Configuration Summary
Project Name: Example 1 - PC TCP Scaling
Test-Set Name: 25MB-Upload
Datum Task Name: FTP_UPLOAD
Datum Device ID/IMEI: NoRegistrySettings
Stream ID: 1bfbdd69-067a-4eb5-9e77-6db821ae43b3
Test Start Time (UTC): 2013-12-17T18:20:59.057
Reported Device: Not Found Not Found
Datum Mobile Test Results
Measured Throughput (kbps)
4723.53 kbps — PASS ( > 200.0 kbps)
IP Summary
IP Summary (Media Server IP Log)
Media Server IP Address: 216.157.111.6
IP Lookup Details:
Host: 216.157.111.6
Country: United States (US)
Device/Network Gateway/Proxy IP Address: 173.8.5.209
IP Lookup Details:
Host: 173.8.5.209
Country: United States (US)
IP Summary (Device IP Log)
Media Server IP Address: 216.157.111.6
Device IP Address: 10.33.100.125
Source Data Download
Download Media Server PCAP File for Test (MS_SAVE_216.157.111.6_1bfbdd69-067a-4eb5-9e77-6db821ae43b3.pcap)
Download Device PCAP File for Test (MD_SAVE_216.157.111.6_1bfbdd69-067a-4eb5-9e77-6db821ae43b3.pcap)
Download Datum Result File (https://trial-datum.metricowireless.com/AlphaDemo/Download.aspx?type=result&id=4e331f20-4867-e311-b53a-
003048fb86fb)
Download Datum Test-Set File (https://trial-datum.metricowireless.com/AlphaDemo/Download.aspx?type=testset&id=f8d85c63-4e63-e311-
b53a-003048fb86fb)
IP Address Checks
Network Address Translation (NAT) Detected: YES
Source IP Address From Media Server Log: 173.8.5.209
Source IP Address From Device Log: 10.33.100.125
Device IP Address Routable: NO
Local Device IP Address: 10.33.100.125
DNS Checks
DNS Lookup Observed: NO
FTP User-Level Throughput
FTP User-Level Throughput From Media Server Log (Mbps): 4.696
FTP User-Level Throughput From Device Log (Mbps): 4.695
Time to generate report: 56.97 second(s).
IP Analyses
IP Fragmentation Detected: NO
IP QoS Detected: YES
IP QoS Not Found in Media Server IP Log
IP QoS Found in Device IP Log
Observed Maximum Segment Size
Maximum Segment Size from Media Server (bytes): 1460
Maximum Segment Size from Mobile Device (bytes): 1380
IP Throughput Charts
Data Flow Summary
Media Server IP Log Data Flow Table
Device Server Type Bytes TX Bytes
RX
Bytes bps TX bps RX bps start duration
173.8.5.209:64599 216.157.111.6:21 TCP 1,977 961 1,016 352 171 181 0.000 44.8998
173.8.5.209:64603 216.157.111.6:2150 TCP 27,913,792 27,347,134 566,658 5,027,270 4,925,215 102,055 0.256 44.4198
Device IP Log Data Flow Table
Device Server Type Bytes TX Bytes
RX
Bytes bps TX bps RX bps start duration
10.33.100.125:64599 216.157.111.6:21 TCP 1,899 931 968 338 166 172 0.000 44.9031
10.33.100.125:64603 216.157.111.6:2150 TCP 27,983,046 27,353,646 629,400 5,040,015 4,926,654 113,361 0.259 44.4174
Example Outputs