spitzer observations of dust destruction in the …
TRANSCRIPT
The Astrophysical Journal, 725:585–597, 2010 December 10 doi:10.1088/0004-637X/725/1/585C© 2010. The American Astronomical Society. All rights reserved. Printed in the U.S.A.
SPITZER OBSERVATIONS OF DUST DESTRUCTION IN THE PUPPIS A SUPERNOVA REMNANT
Richard G. Arendt1,2
, Eli Dwek2, William P. Blair
3, Parviz Ghavamian
4, Una Hwang
3,5,
Knox S. Long4, Robert Petre
5, Jeonghee Rho
6,7, and P. Frank Winkler
81 CRESST, University of Maryland–Baltimore County, Baltimore, MD 21250, USA; [email protected]
2 NASA Goddard Space Flight Center, Code 665, Greenbelt, MD 20771, USA3 The Henry A. Rowland Department of Physics and Astronomy, Johns Hopkins University, 3400 North Charles Street, Baltimore, MD 21218, USA
4 Space Telescope Science Institute, 3700 San Martin Drive, Baltimore, MD 21218, USA5 NASA Goddard Space Flight Center, Code 662, Greenbelt, MD 20771, USA
6 Spitzer Science Center, MS 220-6, California Institute of Technology, Pasadena, CA 91125, USA7 Universities Space Research Association, NASA Ames Research Center, MS 211-3, Moffett Field, CA 94035, USA
8 Department of Physics, Middlebury College, Middlebury, VT 05753, USAReceived 2010 August 5; accepted 2010 September 30; published 2010 November 19
ABSTRACT
The interaction of the Puppis A supernova remnant (SNR) with a neighboring molecular cloud provides a uniqueopportunity to measure the amount of grain destruction in an SNR shock. Spitzer Space Telescope MIPS imagingof the entire SNR at 24, 70, and 160 μm shows an extremely good correlation with X-ray emission, indicatingthat the SNR’s IR radiation is dominated by the thermal emission of swept-up interstellar dust, collisionallyheated by the hot shocked gas. Spitzer IRS spectral observations targeted both the Bright Eastern Knot (BEK)of the SNR where a small cloud has been engulfed by the supernova blast wave and outlying portions of theassociated molecular cloud that are yet to be hit by the shock front. Modeling the spectra from both regionsreveals the composition and the grain size distribution of the interstellar dust, both in front of and behind theSNR shock front. The comparison shows that the ubiquitous polycyclic aromatic hydrocarbons of the interstellarmedium are destroyed within the BEK, along with nearly 25% of the mass of graphite and silicate dust grains.
Key words: dust, extinction – infrared: ISM – ISM: individual objects (Puppis A) – ISM: supernova remnants
Online-only material: color figures
1. INTRODUCTION
The supernova remnant (SNR) shock processing of inter-stellar dust plays an extremely important role in determiningdust composition, abundance, and size distribution, which inturn have a great effect on redistributing starlight, regulating thetemperature of most of the diffuse gas in the interstellar medium(ISM), and determining the rates and efficiencies of chemicalreactions in molecular clouds. Compensating for these destruc-tion processes in the diffuse ISM are various gas–grain andgrain–grain interactions that grow icy and refractory organicmantles on the surviving dust grains in the denser phases of theISM.
Determining the efficiency of the various grain destructionprocesses is of great astrophysical importance since they playa major role in our understanding of the sources and origin ofinterstellar dust. Knowledge of the grain destruction efficiencyis crucial for determining the origin of the large amount of dustobserved in the early universe (Dwek et al. 2007), whether itcould all be formed by supernovae (SNe; Morgan & Edmunds2003; Maiolino et al. 2004), or in AGB stars (Valiante et al.2009; Cherchneff & Dwek 2010). It also plays an importantrole in understanding the dust abundance and the origin of theelemental depletion pattern in the local universe (Jones et al.1996; Jones 2004; Tielens 1998; Dwek 1998).
Only in the youngest SNRs (ages �1000 yr) is the emissionstill dominated by the ejecta of the SN. Emission of most SNRs isinstead dominated by the swept-up ISM. The ideal measurementof dust processing in shocks is to examine a population of ISMdust before and after passage through an SNR shock front.While many SNRs exhibit post-shock IR emission (Arendt1989; Saken et al. 1992; Reach et al. 2006), only a fraction
of those have clear indication of interaction with specificallyidentifiable clouds in the surrounding ISM. Of these, the PuppisA SNR is probably the clearest case in which the cloud beingencountered exhibits identifiable IR emission.
Puppis A is a relatively young SNR with an age of ∼3700 yr(Winkler et al. 1988) and lying at a distance of ∼2.2 kpc (Dubner& Arnal 1988; Reynoso et al. 1995). It is a strong X-ray sourcedominated by the shocked ISM, but there are isolated features inthe SNR that can be identified as SN ejecta (Hwang et al. 2008;Katsuda et al. 2008, 2010). The synchrotron radio emission issimilar in structure to the X-ray emission, showing a partial shellsignificantly brighter on the northeast side, but the two are notwell correlated in detail (Castelletti et al. 2006). Optical emis-sion has an entirely different morphology. The brightest featuresare a ridge of filaments along the shock front on the NW sideof the SNR (Baade & Minkowski 1954; Goudis & Meaburn1978). On a large scale, these coincide with the radio andX-ray emission, though small-scale details differ. These fila-ments have very strong [N ii] emission, indicating that circum-stellar material is being shocked. Optical emission elsewherein the SNR consists of more randomly scattered knots and fil-aments. Some of the optical knots exhibit O-rich spectra thatcharacterize them as SN ejecta (Winkler & Kirshner 1985;Sutherland & Dopita 1995). The kinematics of these ejecta knotsprovide age and distance estimates of the SNR. Distance esti-mates are also provided by the Galactic rotation distances ofobserved H i and CO clouds that are associated with the SNR(Dubner & Arnal 1988; Reynoso et al. 1995; Paron et al. 2008).
At IR wavelengths Puppis A was first observed as part of theIRAS full-sky survey (Neugebauer et al. 1984). Puppis A wasbright and well resolved from the confusion of the backgroundISM at 25 and 60 μm, while emission from the SNR was much
585

586 ARENDT ET AL. Vol. 725
more difficult to distinguish at 12 and 100 μm. At arcminuteresolution, the IR emission was observed to be well correlatedwith the X-ray emission (Arendt et al. 1990). This is perhaps thebest such correlation of any Galactic SNR. The brightest featureat IR (and X-ray) wavelengths is a compact feature known asthe Bright Eastern Knot (BEK). The BEK is at an indentationin the perimeter of the SNR where the SNR is in contact witha neighboring molecular cloud (Dubner & Arnal 1988), knownas the “East Cloud.” The East Cloud is distinguishable in thebroadband IR imaging, which is a rarity for clouds adjacent toSNRs. In most other cases of SNR–cloud interaction, the cloudis confused with all the other clouds along the same line ofsight. Using the IRAS data, Arendt et al. (1991) had comparedthe broadband spectral energy distribution (SED) of the BEKwith that of the East Cloud to estimate that as much ∼30% ofthe mass of swept-up dust was being destroyed. However, withonly the limited broadband SED provided by the IRAS data,there were no direct confirmations of the composition of thepre- or post-shock dust, or that the IR emission was unaffectedby any significant line emission components.
Thus, observations of Puppis A were undertaken with theSpitzer Space Telescope (Werner et al. 2004; Gehrz et al. 2007)to provide a complete high spatial resolution map of the SNRand the clouds with which it is interacting at 24, 70, and 160 μm,and to obtain 5–40 μm spectra of the interstellar dust before andafter it is swept up by the SNR. Section 2 of this paper describesthese observations and the data reduction. The resulting imagesand spectra are presented in Section 3, along with models whichcan be used to characterize the changes in the dust grain sizedistribution induced by the passage though the shock and intoa hot dense environment. In Section 4, we discuss the impliedamount of grain destruction and the relations between the gastemperature and density (or ionization timescale) as derivedindependently from the IR and X-ray modeling. We summarizeour results in Section 5.
2. SPITZER OBSERVATIONS AND DATA REDUCTION
The Spitzer observations were carried out under programPID 50270. The observations employed all three instruments onSpitzer: the Multiband Imaging Photometer for Spitzer (MIPS;Rieke et al. 2004), the InfraRed Array Camera (IRAC; Fazioet al. 2004), and the InfraRed Spectrograph (IRS; Houck et al.2004).
2.1. MIPS
The entire SNR and the East Cloud were observed us-ing MIPS. Two Astronomical Observation Requests (AORs:27514624, 27515136) with fast 1◦ scan legs and 148′′ offsetsprovided complete coverage at 24 and 70 μm. The total inte-gration time per pixel on the sky was 31.4 s and 15.7 s at 24and 70 μm, respectively. Due to the fast scan rate and bad pixelsin the 160 μm detector array, there were periodic gaps in the160 μm coverage.
The individual frames generated from each AOR were pro-cessed by the Spitzer Science Center (SSC) to produce the BasicCalibrated Data (BCD). The SSC also ran a post-BCD pipelinethat mosaicked the individual frames of the BCD into a singlemosaic for each AOR. The post-BCD mosaics for the 24 μmdata were very good. Therefore our processing of these datamerely consisted of reprojecting the two AORs to a commongrid (2.′′45 pixels in the scan orientation) and constructing aweighted average of the AORs using the given weights. Addi-
tional variants of this image were then created with pixel scalesand resolution to match the 70 and 160 μm data, and in celestialcoordinates.
The post-BCD mosaics for the 70 μm data were not suitablefor use. The 70 μm BCD frames data were reprocessed usingthe least-squares self-calibration procedure of Fixsen et al.(2000). As applied here, the procedure represents the data ateach pixel i of each frame, Di, as Di = Sα + Fp + Fq , whereSα is the intensity of the sky at location α, Fp is a detectoroffset for detector pixel p (constant for all frames), and Fq isanother offset which is constant for all detector pixels but variesfrom frame to frame q. The self-calibration procedure is thenapplied to derive the detector calibration parameters, Fp and Fq.As we began with the individual BCD frames, these detectoroffsets represent delta-corrections that account for transientor temporary effects that were not properly removed by thestandard BCD pipeline. These offsets were subtracted from thedata Di, and then these corrected BCD frames were remappedto obtain the self-calibrated sky map Sα . This procedure workedwell to remove residual responses after the periodic stim flashesand to tie together the different scan legs in a consistent manner.However, there was still a periodic striping apparent in theimages. This striping could be mitigated by median filtering thedata in the time domain, before the self-calibration is performed.The effect of the width of the median filter was investigated.Narrower filters produced cleaner results but at the expenseof removing some of the large-scale emission; wider filterswere not as effective in removing the striping. Intermediatevalues were not a satisfactory balance. Thus, the 70 μm mosaicpresented here was created by Fourier transforming a narrow-filtered mosaic and a wide-filtered mosaic and combining thesmall-scale structure (<4.′7) from the former with the large-scale structure (>4.′7) of the latter, before performing the inverseFourier transform. The result is far cleaner than the post-BCDmosaics. However, there are some linear structures in the SNRthat happen to be aligned with the scan direction and appear tobe filtered out by this procedure. Some of these are real, as theyhave clear 24 μm counterparts, but in other cases the featuresare artifacts that are better removed. Thus, some care is neededin the quantitative analysis of the 70 μm emission.
Significant gaps and striping in the 160 μm data presentedan even greater challenge. The standard post-BCD mosaicsprovided by the SSC were strongly striped. The standard filteredversions, which are also provided by the SSC, were free ofstriping, but also clearly lacked large-scale structure in theemission as compared to the unfiltered versions. Both mosaicscontained gaps. Thus, the first step in our processing was tointerpolate across the gaps in the filtered post-BCD mosaics byusing a distance-weighted average of all good pixels within a5 pixel radius of each missing pixel (weight = 1/distance2).To restore the large-scale structure, a fifth-order polynomialbackground was fit to the unfiltered post-BCD mosaic and thenadded to the “filled” version of the filtered post-BCD mosaic.This was performed on the two AORs independently. The AORswere reprojected to a common grid and combined using aweighted average, as was done for the 24 μm data. The generalresult appears good, with the caveat that the large-scale structuremay be inaccurate.
2.2. IRAC
IRAC observations were much more limited than the MIPSobservations, and only targeted a single 5′ × 5′ field of viewat the location of the BEK where the spectroscopy was to

No. 1, 2010 SPITZER OBSERVATIONS OF DUST DESTRUCTION IN THE PUPPIS A SNR 587
be obtained. Two pointings were required to obtain coverageat all four IRAC wavelengths, so adjacent 5′ × 5′ files wereserendipitously imaged to the north of the BEK at 4.5 and 8 μmand to the south at 3.6 and 5.8 μm. Each set of pointings used12 s frame times and a large 12-point Reuleaux dither pattern toreach a nominal integration time of 124.8 s pixel−1 and nominalsensitivities of 0.02, 0.02, 0.07, and 0.09 MJy sr−1 at 3.6, 4.5,5.8, and 8 μm, respectively. Being the brightest portion of theSNR at 24 μm, this would be the most likely location to detectany thermal emission at 3.6–8 μm. Also the BEK is one of therelatively few places in the SNR where there are optical line-emitting filaments, which may have IR counterparts at thesewavelengths. The data from the single AOR (27514112) wereprocessed using the least-squares self-calibration (Fixsen et al.2000).
2.3. IRS
The primary IRS data were collected as two spectral mapsusing both orders of the long low module (LL1 and LL2;AOR 27515136) and both orders of the short low module(SL1 and SL2; AOR 27514368). The area covered jointly byboth modules in all four spectral orders is ∼3.′5 × 3.′5, withadditional outlying coverage in different directions for differentorders. The LL spectral map completely covered the region.However, we chose to undersample the SL spectral map inthe cross scan direction to avoid the excessive amount ofobserving time that would be required to fully cover the desiredfield. A third AOR (27514880) used staring mode to target acluster of seven positions (three locations in the East Cloudand four background fields) with the same integration timesthat were used in the spectral maps. The data from each AORwere reduced and spectra for selected regions were extractedusing CUBISM (Smith et al. 2007). However, the reporteduncertainties were clearly smaller than the dispersion in thespectra as a function of wavelength. Therefore, the CUBISMuncertainties were renormalized (by factors of ∼3) such thatthey matched the empirical dispersion of the spectra. CUBISMwas also used to produce spectral line maps for emission lines of[Ne ii] 12.8 μm, [Fe ii] 17.9 μm, [Fe ii]+[O iv] 26 μm, [Ne iii]15.6 μm, [S iii] 18.7 μm, and [S iii] 33.5 μm. For the LL spectra,the background was selected from the nearest of the backgroundpointings outside the SNR at (α, δ) = (8h24m53.s7,−42◦58′16′′)(J2000). At the SL wavelengths, this location was clearly toobright to use as a background at the location of the BEK.Thus for the SL spectra, the average of two more distant, butdarker, locations was used (α, δ) = (8h25m32.s9,−43◦07′32′′),(8h25m23.s7,−42◦48′24′′).
No extinction corrections were applied to the data. Theintegrated H i column density toward the BEK in the velocityrange 0–16 km s−1 is ∼0.15 × 1022 cm−2 (Dubner & Arnal1988), while X-ray modeling of the BEK indicates columndensities from this value up to ∼0.4 × 1022 cm−2. These arefairly typical values for a 2.2 kpc line of sight in the Galacticplane. Using the extinction curve of Mathis (1990) to convertthe column densities, we find that the most extreme extinctionis Aλ < 0.13 at the 9.7 μm silicate absorption feature, with Aλ
being several times lower at other wavelengths from 5 to 40 μm.
3. RESULTS
3.1. Images
A color image of the Puppis A SNR at 24 and 70 μm andX-rays is shown in Figure 1. The separate MIPS images of the
SNR and surrounding ISM are shown in Figure 2. Puppis A isa large, bright, and highly structured source at 25 and 70 μm,with an extent of ∼50′. There is a general gradient in brightness,decreasing from the northeast to the southwest, which coincideswith increasing distance from the Galactic plane. The bulk ofthe emission consists of filamentary structures that often appearto be composed of shorter (∼1′) arced segments, which give theSNR a scalloped appearance. Many of the filaments appear tobe unresolved (<6′′) in width. There are only a few locationswhere the emission is better characterized as unresolved knots orclusters of knots. The BEK is resolved into several intersectingarced filaments and diffuse emission. This detail is shown inFigure 3 and identified with the nomenclature used by Hwanget al. (2005). These structures do not appear very different fromthe rest of the SNR except for being several times brighterand marking a distinct indentation in the periphery of theSNR.
At 160 μm emission is not evident from the SNR, includingthe BEK. Extrapolations of IRS spectral fits (Section 3.2.2)predict 160 μm brightnesses of ∼6–12 MJy sr−1 for the BEK.The mean intensity of the 160 μm cirrus is ∼130 MJy sr−1 withan rms variation of ∼15–20 MJy sr−1. Thus, as most of PuppisA is many times fainter than the BEK, it is no surprise that theSNR is not visible at 160 μm.
Comparison with X-ray images in Figures 2 and 3 showsa strong correlation between IR and X-ray emission on allspatial scales down to the ∼6′′ resolution of the 24 μm MIPSdata. In comparison, the correlation with the radio emission(Castelletti et al. 2006) is relatively poor, especially on smallspatial scales. The distribution of optical filaments and knots inPuppis A is very different from that of the IR, X-ray, or radioemission. Indeed, only some of the brightest optical featureshave detectable 24 μm counterparts. The most notable of theseis the O-rich ejecta of the “Omega Filament,” which is the onlyoptical filament to have a bright easily distinguished 24 μmcounterpart (α, δ) = (8h22.m8,−42◦46.′6). The adjacent X-rayemitting ejecta observed by Katsuda et al. (2008) also has highlycorrelated 24 μm emission, but it is three times fainter than thatof the Omega Filament.
The IRAC imaging only covered the region of the BEK.Emission associated with the BEK is very faint and confused.Therefore the IRAC images shown in Figure 3 have had stellarsources removed by subtraction of scaled versions of the 4.5 μmimage for the 8 μm data and scaled versions of the 3.6 μm imagefor the 5.8 and 4.5 μm data. This subtracts stellar emissionwhich is relatively blue in color, with minimal alteration of therelatively red emission of the BEK and the ISM. At 3.6 μmsuch a template subtraction is not possible, so the versionshown is generated from the point source fitting and subtractionwhen processing the BCD data with MOPEX/APEX (Makovoz& Marleau 2005). The BEK is most clearly seen at 8 μmwhere emission lies along the leading (eastward) edges of thebrightest 24 μm features (the “Compact Knot” and the “Bar”).The peak intensity is I (8 μm) < 0.3 MJy sr−1. The ratioI (8 μm)/I (5.8 μm) = 2.7. The ratios I (8 μm)/I (4.5 μm)and I (8 μm)/I (3.6 μm) appear to be ∼10. These IRAC colorsare consistent with polycyclic aromatic hydrocarbon (PAH)emission as seen at other locations in the ISM, e.g., in thedirection of the Galactic center (Arendt et al. 2008).
3.1.1. Global Properties
The MIPS observations cover all of Puppis A and hence weused them to measure the total flux density of the SNR at 24

588 ARENDT ET AL. Vol. 725
Figure 1. Composite image of Puppis A as seen at 70 μm (red), 24 μm (green), and X-rays (blue). Most SNR features are seen in all three bands. There is someintrinsic variation in the relative colors, but structure in the 70 μm background also leads to some apparent color features.
and 70 μm, the main uncertainty being confusion from ISMalong the line of sight. To minimize this problem, we used the160 μm image, where we do not see the SNR, as a templatefor the ISM emission. This was scaled and subtracted from the24 and 70 μm images. The resulting maps had a smoother flat-ter background with a mean value near 0. The SNR intensitywas integrated within an irregularly shaped aperture that wasdefined jointly by surface brightness thresholds of the 24 and70 μm images. An expanded annular aperture around this re-gion was used to fine-tune the local background level at theSNR. The integrated flux changed by ∼5% depending on thewidth of the annular aperture used to set the local background.This was used as the quoted uncertainty of the integrated fluxdensities. Two upper limits for the 160 μm flux density weremeasured. The first simply integrated all the emission withinthe area of the SNR after subtraction of a flat background atthe local minimum intensity (90 MJy sr−1). This limit includes
much of the ISM along the line of sight. A more restrictive limitwas obtained by assuming that the 160 μm emission is spatiallycorrelated with the 24 and 70 μm emission. The slopes of thelinear correlations between the 160 μm intensity and the 24 and70 μm intensities were used to scale the shorter wavelength fluxdensities to a 160 μm flux density. The resulting flux densitiesare listed in Table 1. The results are very similar to the IRASmeasurement of Arendt et al. (1991), but with smaller uncer-tainties resulting from the better spatial resolution and the useof the 160 μm data to reduce uncertainties associated with theline-of-sight ISM.
3.2. Spectra and Models
3.2.1. The East Cloud
The Spitzer IRS spectra of the East Cloud are important to thisstudy in that they allow us to characterize the composition and

No. 1, 2010 SPITZER OBSERVATIONS OF DUST DESTRUCTION IN THE PUPPIS A SNR 589
Figure 2. Spitzer MIPS images of the Puppis A SNR and the surrounding ISM at 24, 70, and 160 μm. The ROSAT HRI image is shown in the lower right panel.On the 24 μm image, contours of CO emission (12–17 km s−1) of the East Cloud (Dubner & Arnal 1988) are superimposed, and a circle marks the BEK where theSNR interacts with outlying clumps of this cloud. At 24 and 70 μm, IR emission of the SNR is well correlated with the X-ray emission, but at 160 μm it is lost in theconfusion of the ISM.
(A color version of this figure is available in the online journal.)
Table 1Integrated Flux Density of Puppis A
Wavelength Flux Densitya Satellite(μm) (Jy)
12 < 100 IRAS24 230 ± 11 Spitzer25 245 ± 120 IRAS60 1195 ± 350 IRAS70 1025 ± 51 Spitzer100 1265 ± 990 IRAS160 < 330b Spitzer160 < 6000c Spitzer
Notes.a IRAS results are from Arendt et al. (1991) and Spitzer results are from thepresent work.b Limit for emission that is spatially correlated with 24 and 70 μm emission.c Limit for all emission across the extent of the SNR.
grain size distribution of the interstellar dust within a cloud thatis physically associated with the SNR. This provides a directmeasure of the state of the dust prior to its processing by theSNR shock. For most other SNRs, the nature of the interstellardust must be assumed or simply measured only as a line-of-sightintegral.
The primary location for the East Cloud spectrum wasselected near the brightest portion of the cloud, near (α, δ) =(8h26m50.s50,−42◦55′26.′′0), as indicated by the IRAS 25 μm
images. (The slit locations are indicated in Figure 4.) The SLand LL spectral extractions are necessarily over different regionsdue to the slit sizes and orientations. To maximize the signal-to-noise ratio, we extracted the average spectrum over the entiresubslit for each spectral order. The LL and SL spectral ordersare normalized such that the regions of spectral overlap coincidein intensity. The resulting spectrum is shown in Figure 5(a). Atthese wavelengths, the East Cloud spectrum is dominated by thetypical PAH emission bands. The H2 0–0 S(0) and S(1) rotationallines are detected at 28.2 and 17.0 μm. Thermal emission fromlarger dust grains is of increasing significance at λ � 20 μm.
We fit these spectra using a Zubko et al. (2004; hereafterZDA) BARE-GR-FG model, radiatively heated by an ambientinterstellar radiation field (ISRF). The ZDA models are a setof models for the dust grain size (or mass) distributions thatare derived to simultaneously fit average interstellar extinction,emission, and abundances. Different models are distinguishedby different choices of grain compositions and different setsof abundance constraints. The BARE-GR-FG model comprisesPAHs, silicate, and graphite grains without any mantles andis fit to elemental abundances determined from F and G stars(Sofia & Meyer 2001). The BARE-GR-FG model is the bestof the ZDA bare gain models. The primary free parameterof our fit to the East Cloud spectrum is the strength of theISRF, χ = IEast Cloud/Ilocal, which was varied over the rangelog (χ ) = [−2, +3] in steps of 0.5, with Ilocal defined by thelocal ISRF as characterized by Mathis et al. (1983). The overall

590 ARENDT ET AL. Vol. 725
Figure 3. Top panels show the full resolution 24 μm image and the Chandra ACIS image at the location of the BEK. The other panels show the corresponding SpitzerIRAC images. The stellar sources are subtracted to emphasize the faint diffuse emission. (See the text for details.) The Compact Knot and Bar are both detected, butare faint and confused at 3.6–8 μm.
normalization of the spectrum (proportional to the columndensity of the emitting material) is the second free parameterallowed in the fitting. The nominal best fit is found for amoderately enhanced ISRF, log (χ ) = 1, and is shown inFigure 5(a). The enhancement could be related to emissionfrom the SNR itself, similar to the precursor observed outsideof SNR N132D (Morse et al. 1996). However, the spectrum isat a location that is ∼20 pc (in projection) from the nearest edgeof the SNR and there is no indication of a gradient in the ISRFwith respect to distance from the SNR.
The errors in the fit shown in Figure 5(a) appear to besystematic within the different spectral orders in which the
data are obtained. This suggests that the data in the differentspectral orders may not be accurately normalized. Therefore,we applied an alternate strategy of normalizing each spectralorder of the data independently to optimally match the model(s).The switch from 1 to 4 normalization parameters does notprovide any additional physical significance, but it does permitcompensation for systematic errors between the data in differentspectral orders. This strategy again finds a best fit for log (χ ) = 1as shown in Figure 5(b). In this case, the normalizations usedfor the spectral orders [SL1, SL1, LL2, LL1] are [0.63, 0.72,1.35, 0.82] times those used to normalize the orders by theiroverlap. As a check on this procedure, we similarly fit the

No. 1, 2010 SPITZER OBSERVATIONS OF DUST DESTRUCTION IN THE PUPPIS A SNR 591
Figure 4. Top: wide view of the IRS coverage showing the BEK and thetwo pointings at the brightest part of the East Cloud and a northern extensionof the cloud. A single contour at 20.5 MJy sr−1 helps delineate the extentof the East Cloud. Middle: IRS coverage of the BEK superimposed on the24 μm MIPS image. The solid red and yellow lines indicate the regionsof the fully sampled LL1 (19.5–38.0 μm) and LL2 (14.0–21.3 μm) spectralmaps, respectively. The dashed red and yellow lines indicate the regions ofthe undersampled SL1 (7.4–14.5 μm) and SL2 (5.2–7.7 μm) spectral maps,respectively. The white boxes indicate the regions where we have extractedmean spectra for a detailed analysis. From northeast to southwest these aredesignated: “Compact Knot,” “Bar-N,” and “Bar-S.” Bottom: the same coverageand analysis regions are superimposed on an optical emission line image—Hα:red; [S ii]: green; [O iii]: blue. Only the Compact Knot region contains strong lineemission.
spectrum at a second location, in a northern extension of theEast Cloud at (α, δ) = (8h26m04.s60,−42◦44′01.′′6). These data,while slightly fainter, are a slightly better match to the ZDAmodel (Figure 5(c)), again with log (χ ) = 1.0.
These results show that the ZDA BARE-GR-FG modelprovides a good representation of the dust giving rise to theemission of the East Cloud. The results indicate a moderate(∼10×) enhancement in the strength of the ISRF in the region.This is largely a result of the rising intensity at wavelengths>20 μm. As the ISRF strength increases, large dust grains aredriven to higher temperatures and the slope of this rise increases.The most significant discrepancy between the data and the modelis in the region of the LL2 spectral order, 14–21 μm. In thisspectral region, it appears that the ZDA model’s absorptioncoefficients (most likely for the PAHs) are roughly a factor oftwo too large (as implied by Figure 5(a)). An alternate possibilityis that the model is a very good match, and there are systematicerrors in the data that cause apparent discontinuities at theends of the SL1, LL2, and/or LL1 spectral orders (as shownin Figures 5(b) and (c)).
3.2.2. The Bright Eastern Knot
Having demonstrated that the ZDA dust model provides areasonable fit to the East Cloud, we now apply the same modelto the spectra of the three brightest portions of the BEK. Theselected regions are indicated in Figure 4. The easternmostregion corresponds to the “Compact Knot” feature of Hwanget al. (2005), while the other two cover the “Bar” region. Wedesignate these latter two regions as “Bar-N” and “Bar-S.” Thespectra are shown in Figure 6. These spectra are very differentfrom those of the East Cloud: the strong PAH features are absent,and the peak of the thermal emission of the large grains is shiftedfrom ∼100 μm to ∼50 μm.
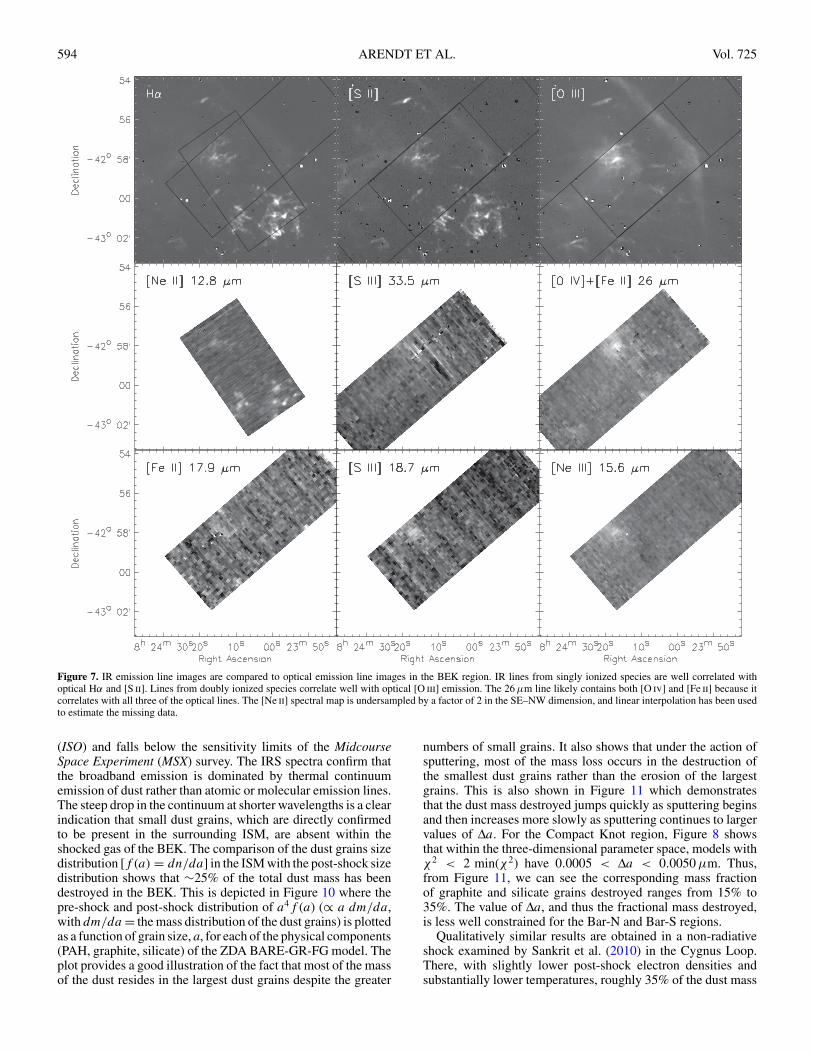
For the spectra shown in Figure 6, atomic line emission isonly evident in the compact knot region. Examination of thespectral data cubes and emission line maps (Figure 7) revealsthat the line emission is not correlated with the dust. Instead thelines are correlated with optical knots and filaments scatteredin the vicinity of the BEK. Lines of singly ionized species([Ne ii] 12.8 μm and [Fe ii] 17.9 and 26.0 μm) are correlatedwith optical Hα and [S ii] emission, while more highly ionizedspecies ([O iv] 26.0 μm, [Ne iii] 15.6 μm, and [S iii] 18.7 and33.5 μm) are correlated with optical [O iii] emission. (We notethat part of the optical line emission, especially the long linear[O iii] structures in Figure 7, is part of the Vela SNR which liesin the foreground of Puppis A. Despite the superposition of thetwo SNRs, we see no evidence for any IR line or continuumemission from the Vela SNR that would affect the analysis ofPuppis A.) No molecular H2 emission lines are observed inthese background-subtracted spectra, although line-of-sight H2emission is fairly uniform over the entire spectral map prior tothe background subtraction. This lack of H2 is consistent withresults from Paron et al. (2008) who find no 12CO emissiondirectly associated with the BEK, despite its presence in moredistant portions of the East Cloud and even in small clumpsthat appear unshocked and in the foreground to the BEK. Theyconclude that either the gas currently being swept up is not partof a molecular clump or the molecular gas is being dissociatedby a radiative precursor.
The interstellar dust that has been swept up into the SNRresides in a vastly different environment than the general ISM.
592 ARENDT ET AL. Vol. 725
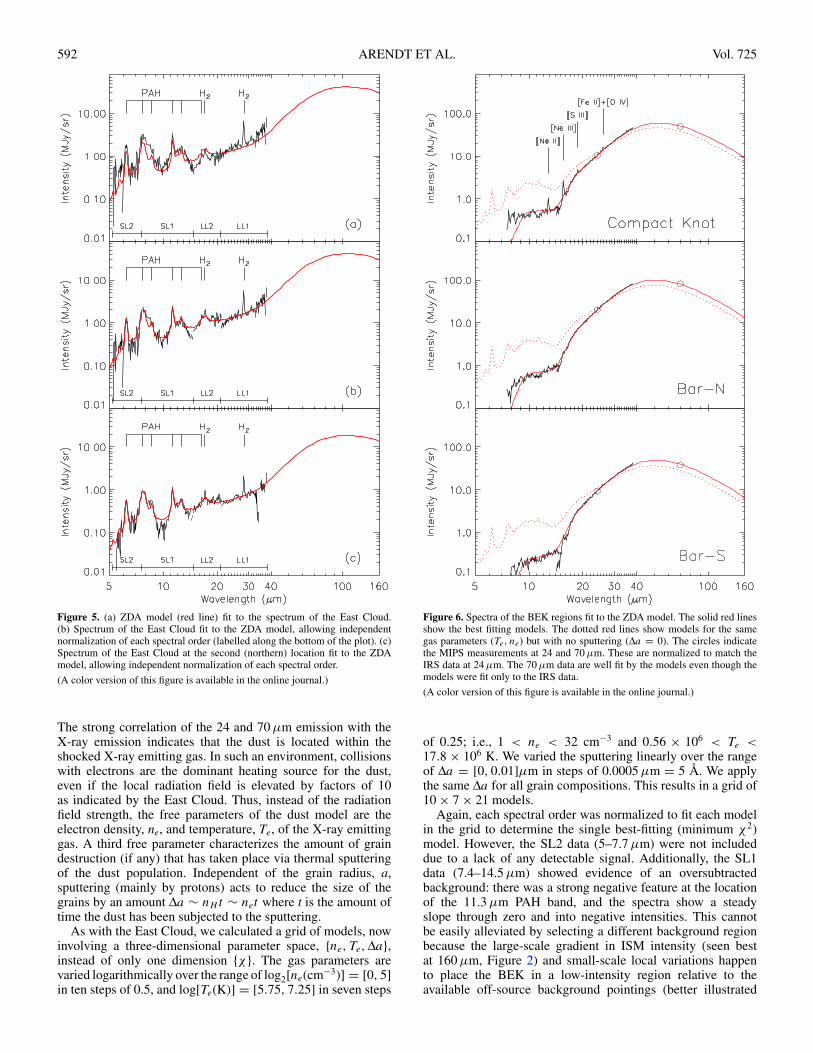
Figure 5. (a) ZDA model (red line) fit to the spectrum of the East Cloud.(b) Spectrum of the East Cloud fit to the ZDA model, allowing independentnormalization of each spectral order (labelled along the bottom of the plot). (c)Spectrum of the East Cloud at the second (northern) location fit to the ZDAmodel, allowing independent normalization of each spectral order.
(A color version of this figure is available in the online journal.)
The strong correlation of the 24 and 70 μm emission with theX-ray emission indicates that the dust is located within theshocked X-ray emitting gas. In such an environment, collisionswith electrons are the dominant heating source for the dust,even if the local radiation field is elevated by factors of 10as indicated by the East Cloud. Thus, instead of the radiationfield strength, the free parameters of the dust model are theelectron density, ne, and temperature, Te, of the X-ray emittinggas. A third free parameter characterizes the amount of graindestruction (if any) that has taken place via thermal sputteringof the dust population. Independent of the grain radius, a,sputtering (mainly by protons) acts to reduce the size of thegrains by an amount Δa ∼ nH t ∼ net where t is the amount oftime the dust has been subjected to the sputtering.
As with the East Cloud, we calculated a grid of models, nowinvolving a three-dimensional parameter space, {ne, Te, Δa},instead of only one dimension {χ}. The gas parameters arevaried logarithmically over the range of log2[ne(cm−3)] = [0, 5]in ten steps of 0.5, and log[Te(K)] = [5.75, 7.25] in seven steps
Figure 6. Spectra of the BEK regions fit to the ZDA model. The solid red linesshow the best fitting models. The dotted red lines show models for the samegas parameters (Te, ne) but with no sputtering (Δa = 0). The circles indicatethe MIPS measurements at 24 and 70 μm. These are normalized to match theIRS data at 24 μm. The 70 μm data are well fit by the models even though themodels were fit only to the IRS data.
(A color version of this figure is available in the online journal.)
of 0.25; i.e., 1 < ne < 32 cm−3 and 0.56 × 10⁶ < Te <17.8 × 10⁶ K. We varied the sputtering linearly over the rangeof Δa = [0, 0.01]μm in steps of 0.0005 μm = 5 Å. We applythe same Δa for all grain compositions. This results in a grid of10 × 7 × 21 models.
Again, each spectral order was normalized to fit each modelin the grid to determine the single best-fitting (minimum χ2)model. However, the SL2 data (5–7.7 μm) were not includeddue to a lack of any detectable signal. Additionally, the SL1data (7.4–14.5 μm) showed evidence of an oversubtractedbackground: there was a strong negative feature at the locationof the 11.3 μm PAH band, and the spectra show a steadyslope through zero and into negative intensities. This cannotbe easily alleviated by selecting a different background regionbecause the large-scale gradient in ISM intensity (seen bestat 160 μm, Figure 2) and small-scale local variations happento place the BEK in a low-intensity region relative to theavailable off-source background pointings (better illustrated
No. 1, 2010 SPITZER OBSERVATIONS OF DUST DESTRUCTION IN THE PUPPIS A SNR 593
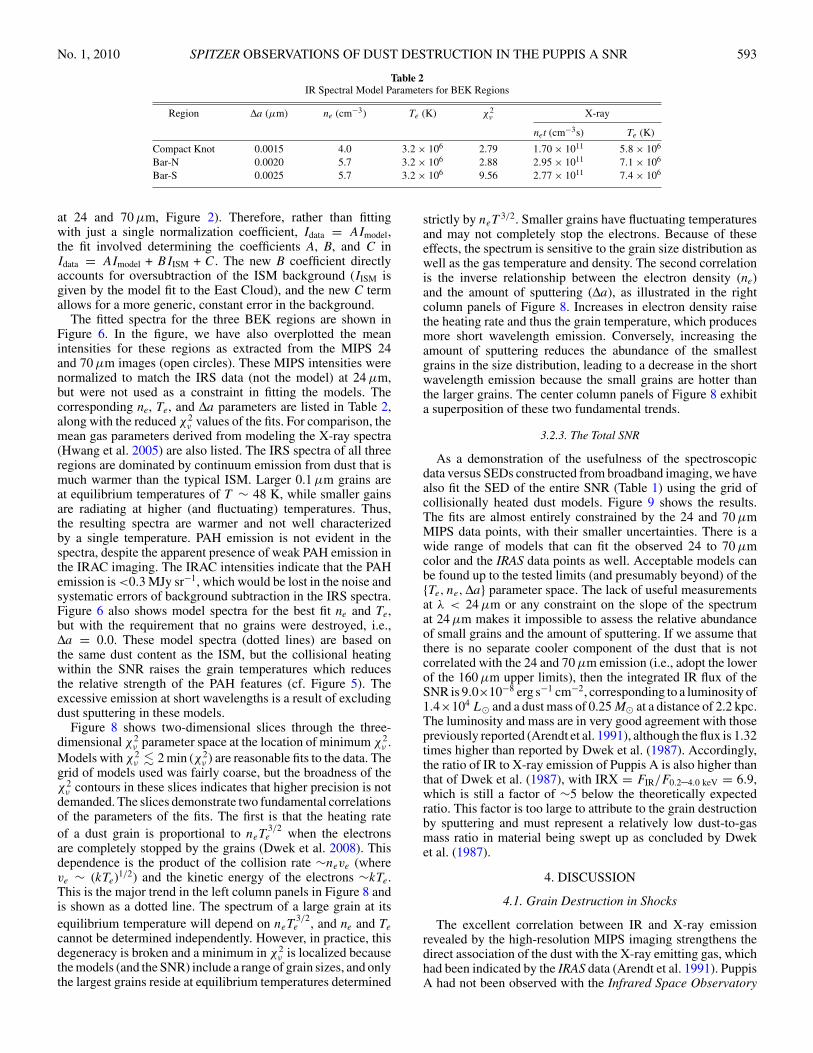
Table 2IR Spectral Model Parameters for BEK Regions
Region Δa (μm) ne (cm−3) Te (K) χ2ν X-ray
net (cm−3s) Te (K)
Compact Knot 0.0015 4.0 3.2 × 10⁶ 2.79 1.70 × 10¹¹ 5.8 × 10⁶
Bar-N 0.0020 5.7 3.2 × 10⁶ 2.88 2.95 × 10¹¹ 7.1 × 10⁶
Bar-S 0.0025 5.7 3.2 × 10⁶ 9.56 2.77 × 10¹¹ 7.4 × 10⁶
at 24 and 70 μm, Figure 2). Therefore, rather than fittingwith just a single normalization coefficient, Idata = AImodel,the fit involved determining the coefficients A, B, and C inIdata = AImodel + BIISM + C. The new B coefficient directlyaccounts for oversubtraction of the ISM background (IISM isgiven by the model fit to the East Cloud), and the new C termallows for a more generic, constant error in the background.
The fitted spectra for the three BEK regions are shown inFigure 6. In the figure, we have also overplotted the meanintensities for these regions as extracted from the MIPS 24and 70 μm images (open circles). These MIPS intensities werenormalized to match the IRS data (not the model) at 24 μm,but were not used as a constraint in fitting the models. Thecorresponding ne, Te, and Δa parameters are listed in Table 2,along with the reduced χ2
ν values of the fits. For comparison, themean gas parameters derived from modeling the X-ray spectra(Hwang et al. 2005) are also listed. The IRS spectra of all threeregions are dominated by continuum emission from dust that ismuch warmer than the typical ISM. Larger 0.1 μm grains areat equilibrium temperatures of T ∼ 48 K, while smaller gainsare radiating at higher (and fluctuating) temperatures. Thus,the resulting spectra are warmer and not well characterizedby a single temperature. PAH emission is not evident in thespectra, despite the apparent presence of weak PAH emission inthe IRAC imaging. The IRAC intensities indicate that the PAHemission is <0.3 MJy sr−1, which would be lost in the noise andsystematic errors of background subtraction in the IRS spectra.Figure 6 also shows model spectra for the best fit ne and Te,but with the requirement that no grains were destroyed, i.e.,Δa = 0.0. These model spectra (dotted lines) are based onthe same dust content as the ISM, but the collisional heatingwithin the SNR raises the grain temperatures which reducesthe relative strength of the PAH features (cf. Figure 5). Theexcessive emission at short wavelengths is a result of excludingdust sputtering in these models.
Figure 8 shows two-dimensional slices through the three-dimensional χ2
ν parameter space at the location of minimum χ2ν .
Models with χ2ν � 2 min (χ2
ν ) are reasonable fits to the data. Thegrid of models used was fairly coarse, but the broadness of theχ2
ν contours in these slices indicates that higher precision is notdemanded. The slices demonstrate two fundamental correlationsof the parameters of the fits. The first is that the heating rateof a dust grain is proportional to neT
3/2e when the electrons
are completely stopped by the grains (Dwek et al. 2008). Thisdependence is the product of the collision rate ∼neve (whereve ∼ (kTe)1/2) and the kinetic energy of the electrons ∼kTe.This is the major trend in the left column panels in Figure 8 andis shown as a dotted line. The spectrum of a large grain at itsequilibrium temperature will depend on neT
3/2e , and ne and Te
cannot be determined independently. However, in practice, thisdegeneracy is broken and a minimum in χ2
ν is localized becausethe models (and the SNR) include a range of grain sizes, and onlythe largest grains reside at equilibrium temperatures determined
strictly by neT3/2. Smaller grains have fluctuating temperatures
and may not completely stop the electrons. Because of theseeffects, the spectrum is sensitive to the grain size distribution aswell as the gas temperature and density. The second correlationis the inverse relationship between the electron density (ne)and the amount of sputtering (Δa), as illustrated in the rightcolumn panels of Figure 8. Increases in electron density raisethe heating rate and thus the grain temperature, which producesmore short wavelength emission. Conversely, increasing theamount of sputtering reduces the abundance of the smallestgrains in the size distribution, leading to a decrease in the shortwavelength emission because the small grains are hotter thanthe larger grains. The center column panels of Figure 8 exhibita superposition of these two fundamental trends.
3.2.3. The Total SNR
As a demonstration of the usefulness of the spectroscopicdata versus SEDs constructed from broadband imaging, we havealso fit the SED of the entire SNR (Table 1) using the grid ofcollisionally heated dust models. Figure 9 shows the results.The fits are almost entirely constrained by the 24 and 70 μmMIPS data points, with their smaller uncertainties. There is awide range of models that can fit the observed 24 to 70 μmcolor and the IRAS data points as well. Acceptable models canbe found up to the tested limits (and presumably beyond) of the{Te, ne, Δa} parameter space. The lack of useful measurementsat λ < 24 μm or any constraint on the slope of the spectrumat 24 μm makes it impossible to assess the relative abundanceof small grains and the amount of sputtering. If we assume thatthere is no separate cooler component of the dust that is notcorrelated with the 24 and 70 μm emission (i.e., adopt the lowerof the 160 μm upper limits), then the integrated IR flux of theSNR is 9.0×10⁻⁸ erg s−1 cm−2, corresponding to a luminosity of1.4×104 L� and a dust mass of 0.25 M� at a distance of 2.2 kpc.The luminosity and mass are in very good agreement with thosepreviously reported (Arendt et al. 1991), although the flux is 1.32times higher than reported by Dwek et al. (1987). Accordingly,the ratio of IR to X-ray emission of Puppis A is also higher thanthat of Dwek et al. (1987), with IRX = FIR/F0.2–4.0 keV = 6.9,which is still a factor of ∼5 below the theoretically expectedratio. This factor is too large to attribute to the grain destructionby sputtering and must represent a relatively low dust-to-gasmass ratio in material being swept up as concluded by Dweket al. (1987).
4. DISCUSSION
4.1. Grain Destruction in Shocks
The excellent correlation between IR and X-ray emissionrevealed by the high-resolution MIPS imaging strengthens thedirect association of the dust with the X-ray emitting gas, whichhad been indicated by the IRAS data (Arendt et al. 1991). PuppisA had not been observed with the Infrared Space Observatory
594 ARENDT ET AL. Vol. 725
Figure 7. IR emission line images are compared to optical emission line images in the BEK region. IR lines from singly ionized species are well correlated withoptical Hα and [S ii]. Lines from doubly ionized species correlate well with optical [O iii] emission. The 26 μm line likely contains both [O iv] and [Fe ii] because itcorrelates with all three of the optical lines. The [Ne ii] spectral map is undersampled by a factor of 2 in the SE–NW dimension, and linear interpolation has been usedto estimate the missing data.
(ISO) and falls below the sensitivity limits of the MidcourseSpace Experiment (MSX) survey. The IRS spectra confirm thatthe broadband emission is dominated by thermal continuumemission of dust rather than atomic or molecular emission lines.The steep drop in the continuum at shorter wavelengths is a clearindication that small dust grains, which are directly confirmedto be present in the surrounding ISM, are absent within theshocked gas of the BEK. The comparison of the dust grains sizedistribution [f (a) = dn/da] in the ISM with the post-shock sizedistribution shows that ∼25% of the total dust mass has beendestroyed in the BEK. This is depicted in Figure 10 where thepre-shock and post-shock distribution of a4f (a) (∝ a dm/da,with dm/da = the mass distribution of the dust grains) is plottedas a function of grain size, a, for each of the physical components(PAH, graphite, silicate) of the ZDA BARE-GR-FG model. Theplot provides a good illustration of the fact that most of the massof the dust resides in the largest dust grains despite the greater
numbers of small grains. It also shows that under the action ofsputtering, most of the mass loss occurs in the destruction ofthe smallest dust grains rather than the erosion of the largestgrains. This is also shown in Figure 11 which demonstratesthat the dust mass destroyed jumps quickly as sputtering beginsand then increases more slowly as sputtering continues to largervalues of Δa. For the Compact Knot region, Figure 8 showsthat within the three-dimensional parameter space, models withχ2 < 2 min(χ2) have 0.0005 < Δa < 0.0050 μm. Thus,from Figure 11, we can see the corresponding mass fractionof graphite and silicate grains destroyed ranges from 15% to35%. The value of Δa, and thus the fractional mass destroyed,is less well constrained for the Bar-N and Bar-S regions.
Qualitatively similar results are obtained in a non-radiativeshock examined by Sankrit et al. (2010) in the Cygnus Loop.There, with slightly lower post-shock electron densities andsubstantially lower temperatures, roughly 35% of the dust mass

No. 1, 2010 SPITZER OBSERVATIONS OF DUST DESTRUCTION IN THE PUPPIS A SNR 595
Figure 8. Slices of χ2 for fitting the Compact Knot, Bar-N, and Bar-S spectra(top to bottom) using the ZDA dust model. Each two-dimensional slice passesthrough the minimum value of χ2 in the three-dimensional (Te, ne, Δa)parameter space. Contour levels = [1.2, 2, 4, 8, 16, 32] * min(χ2). For theCompact Knot and Bar-N regions, the black circles identify the projection ofthe minimum χ2 onto these slices, when Te and Δa are constrained by the resultsof the X-ray modeling of Hwang et al. (2005).
Figure 9. Integrated flux densities of the entire Puppis A SNR. Solid data pointsare Spitzer MIPS observations. Open data points are IRAS data from Arendtet al. (1991). The higher upper limit at 160 includes all emission across theSNR, most of it likely to be ISM. The fainter 160 μm upper limit applies onlyto emission that is correlated with the 24 (and 70) μm emission. The red lineindicates the best fitting ZDA dust model, while the blue lines indicate all theother models from the grid in {Te, ne, Δa} which have a reduced χ2 < 1.
(A color version of this figure is available in the online journal.)
is destroyed over a spatial scale of ∼0.14 pc. This spatial scale isnot well resolved in Puppis A, which is four times more distantthan the Cygnus Loop.
Figure 10. Mass distribution of ZDA dust grains before (black lines) and aftersputtering by Δa = 0.002 μm (red lines). The unsputtered mass distribution isthat used to model the East Cloud. The sputtered mass distribution is appropriatefor the Bar-N region. This amount of sputtering destroys 100% of the PAHsand removes 24% and 23% of the total mass in graphite and silicate grains,respectively.
(A color version of this figure is available in the online journal.)
In principle, the destruction of the dust may lead to an increasein the strength of emission lines associated with atoms that arehighly depleted in the gas phase of the general ISM, e.g., Si andFe. Emission of [Fe ii] is detected at 17.9 and 26.0 μm; however,this emission is spatially correlated with optical filaments andknots visible in Hα and [S ii] rather than the dust and X-rayemission. There are such structures near the Compact Knot, butnone are present near the bright parts of the Bar. No emissionfrom the [Si ii] 34.8 μm line is observed. This line is ubiquitousin the raw spectra, but then disappears completely when thebackground subtraction is applied to the data. The lack ofIR emission lines from the sputtered atoms is likely due tothe fact that the atoms are quickly ionized beyond the singlyionized stages which have strong lines in the range of the IRSspectral coverage. Itoh (1989) has modeled the time-dependentionization of atoms sputtered from dust. His model 65D matchesthe Te = 3 × 10⁶ K environment of the BEK. This modelindicates that most of the sputtered Si atoms proceed beyondsingle ionization after net > 1 cm−3 yr. Thus, at the density ofthe BEK, freshly sputtered Si atoms can only produce the [Si ii]34.8 μm line for <0.25 yr.
The spectra of the Compact Knot and the Bar reveal noPAH emission, even after we implemented a fitting procedurethat can recover oversubtraction of the background. Yet theIRAC imaging suggests weak 3.6–8 μm emission at the eastern(leading) edges of the bright 24 μm and X-ray emission. Thebroadband colors of this emission are similar to those producedby PAHs, and the low surface brightness is consistent with thenon-detection of PAHs in the spectra. The morphology andrelative faintness compared to the 24 μm emission suggest thatthe IRAC data are tracing the zone behind the shock front (orthe precursor in front of the shock) in which the PAHs are beingdestroyed. This is consistent with the fact that PAHs should becompletely destroyed in v > 120 km s−1 shocks (Micelottaet al. 2010).
As described in Section 2.1, the IRS observations of Puppis Aonly cover the region of the BEK, a swept-up interstellar cloud,and not any of the locations where knots or filaments of ejectaare found. Therefore, we cannot make any useful assessmentof the amount of grain processing of dust formed in the SNejecta. However, the detection of the Omega Filament in the24 μm MIPS data means that future spectroscopic observations

596 ARENDT ET AL. Vol. 725
Figure 11. Fractional mass of ZDA dust grains (BARE-GR-FG model) erodedas a function of the total amount of sputtering Δa.
should be able to sort out the relative contributions of lineand continuum emission, and provide characterization of thesurviving SN ejecta dust.
4.2. Characterization of the X-ray Emitting Gas
In modeling the IR emission of collisionally heated dust,we have chosen to treat the gas properties as free parameters,rather than constraining them with results from modeling theX-ray spectra (e.g., Hwang et al. 2005). Thus, we obtain anindependent characterization of the hot post-shock gas. Themodels of the X-ray spectra are characterized by the gastemperature (Te), an “ionization timescale” (net) which indicatesthe length of time since the gas was shocked via its approachto ionization equilibrium, and a line-of-sight column density(NH , not an intrinsic property of the SNR). The gas temperatureis a direct parameter of the IR modeling, and the ionizationtimescale is proportional to Δa via
net ≈ nH t ≈ 6 × 10¹²Δa, (1)
where the proton and electron densities nH , ne, are in cm−3,t is in s, and Δa is in μm, for dust that is thermally andkinetically sputtered in hot gas (Te > 106 K) behind fast shocks(vs > 500 km s−1) (e.g., Dwek et al. 2008). In detail, thecoefficient of this relation is dependent on the grain composition(i.e., sputtering yield), and whether or not kinetic sputtering isacting in addition to thermal sputtering.
The 3.2 × 10⁶ K gas temperature that we derive in all threeportions of the BEK is somewhat lower than the correspondingX-ray-derived values of Te ≈ 5–7.4×10⁶ K across the CompactKnot and Bar regions (see Table 2). The inferred values of Δaare significantly lower than the values that are indicated by theionization timescale, net, of the X-ray modeling. Using Equation(1) with the IR-derived sputtering and gas density allows us toestimate the time since the dust was swept up as t ≈ 70–90 yr.This age is far shorter than the ∼2000 yr age derived by Hwanget al. (2005) based on comparison of the X-ray spectrum andmorphology to shocked clouds models calculated by Klein et al.(2003). The IR sputtering timescale is also shorter than the∼600–1200 yr timescale derived by dividing the X-ray-derivedionization timescale by the IR-derived gas density. Here, weassume that the mean net is half of the maximum net derivedfrom the X-ray spectral models, which are for plane-parallelsingle-temperature shocks and hence integrate the emission overa range of net.
The remaining discrepancy suggests that the dust sputteringrate of Equation (1) is overestimated, either because kineticsputtering plays a smaller than expected role or because thesputtering yields are smaller. Additionally, the ages derived fromdust sputtering may differ from the X-ray-derived ages becausethe interaction with the East Cloud is an ongoing process, notan instantaneous event that occurred at a specific date. In detail,the models should be integrated over time, weighted by the rateat which mass was swept up (dM/dt). Over time, the dust issputtered and the gas cools. The sputtering of the dust occurs onshorter timescales, and thus the integral of the IR emission overtime will be more heavily weighted toward the most recentlyswept-up ISM where the small grains are still present.
Consistency between the IR and X-ray analyses can bestrengthened by adopting the X-ray-derived Te and net (andthus Δa) as fixed parameters of the dust models. The workby Hwang et al. (2005) includes a detailed examination of aslice across the BEK passing through the Compact Knot andthe Bar-N regions. Their analysis reveals that Te rises by afactor of 2 from the east to west side of the Compact Knot andthen remains relatively constant across the Bar. The ionizationtimescale net is low (∼0.5×10¹¹ s cm−3) across the east side andcenter of the Compact Knot, with a sharp jump to higher values(∼2.5 × 10¹¹ s cm−3) occurring on the western edge of theCompact Knot. This jump occurs within the region averagedfor the IR spectrum of the Compact Knot. The ionizationtimescale remains high across the Bar. We have examined thesemodels to determine the mean Te and net over the three regionscorresponding to our IR spectra (Table 2). Based on these results,if we restrict our grid of IR models to Te = 5.6 × 10⁶ Kand Δa = 0.0040–0.0100 μm (the range allows for the jumpin net) for the Compact Knot and Te = 5.6 × 10⁶ K andΔa = 0.0100 μm for the Bar regions, then the remaining freeparameter of the models, ne, is found to increase relative to thebest-fitting models to values of ne = 5.7 and 8 for the CompactKnot and Bar regions, respectively. However, the quality of thefits suffers. The increased amount of sputtering further reducesthe contribution of small dust grains, which are responsible forthe short wavelength emission. To compensate for the weakershort wavelength emission, the derived gas density is higher,which raises the temperature of the remaining larger grains. Yetthe resulting spectra still fall too steeply at short wavelengths(λ < 20 μm), and the spectra fall too steeply at the longerwavelengths (25 < λ < 70 μm) as well. When thus constrained,the model spectra become too sharply peaked because of the lackof the smaller grains with their widely fluctuating temperatures.
4.3. Other Sources
X-ray observations have revealed a neutron star, RXJ0822−4300, associated with the Puppis A SNR (e.g., Petre et al. 1996;Winkler & Petre 2007; Gotthelf & Halpern 2009). However,this object has not been detected at optical wavelengths orin deep 4.5 and 8 μm observations with IRAC (Wang et al.2007; Mignani et al. 2009). Likewise, in our shallow MIPSobservations, there is no detection of any associated emissionat 24, 70, or 160 μm. At 24 μm, the 1σ variation of the localbackground is ∼0.25 MJy sr−1, which implies a 1σ point sourcesensitivity of ∼0.24 mJy.
The IRAC and MIPS images incidentally reveal severalvery distinctive objects which are unassociated with Pup-pis A, e.g., (1) a symmetric 16′′ radius edge-on galaxy at(α, δ) = (8h24m13s,−42◦56′18′′) is clearly seen at all fourIRAC wavelengths. This galaxy is faintly visible in Two Micron

No. 1, 2010 SPITZER OBSERVATIONS OF DUST DESTRUCTION IN THE PUPPIS A SNR 597
All Sky Survey images at K, H, and (barely) J bands. At 24 μm,any emission from the galaxy is lost behind the brighter emis-sion of Puppis A. (2) The MIPS 24 μm image contains severalcompact clusters of point sources in the northern half of thefield. The brightest objects in the clusters are usually detectedat 70 μm as well. The most prominent of these clusters con-tains more than ten 24 μm sources within a 2′ radius, includingIRAS 08222−4214 and IRAS 08222−4212. Another cluster(identified by Dutra et al. 2003) and its associated reflectionnebula produce the extended and extremely bright source at(α, δ) = (8h26m26s,−42◦32′40′′). (3) The bright linear 160 μmcloud, about 15′ long at (α, δ) = (8h22.m2,−43◦21′′), is a darkcloud at visible wavelengths. The facts that it is a visible darkcloud (Feitzinger & Stuwe 1984) and that the measured velocityof its CO emission is +6 km s−1 (Ramesh 1994), compared to∼+16 km s−1 for clouds associated with the SNR, both indicatethat this cloud lies well in the foreground of Puppis A.
5. SUMMARY
Spitzer MIPS images at 24 and 70 μm show that the IRto X-ray correlation within the Puppis A SNR is very strongon all spatial scales. The total IR luminosity of the SNR is∼1.4 × 10⁴ L� produced by 0.25 M� of dust. The ratio of IRto X-ray emission is 6.9, indicating that the IR emission is thedominant radiative energy loss of the SNR. At 160 μm the SNRbecomes lost in the confusion of the Galactic plane indicatingthat there is not a large column density of colder dust associatedwith the SNR. At the BEK, IRAC images show weak emissionthat has colors similar to the PAH emission of the general ISM.This may indicate the zone where PAHs are destroyed in theshock front. Some 5.8 and 8 μm emission associated with opticalemission of singly ionized species is also noted in a region southof the BEK. Across the SNR, there are only a small number oflocations where optical filaments have IR counterparts in thebroadband MIPS images. The most prominent of these is theoxygen rich Omega filament.
The IRS, SL, and LL spectra of the East Cloud outsidethe SNR reveal a typical ISM spectrum, dominated by PAHemission features. The longer wavelength thermal emission ofthe larger graphite and silicate grains suggests an ISRF that is∼10 times stronger than the local ISRF in the solar vicinity. Thespectral map of the BEK region does not show PAH features,but does show the characteristic silicate band at 20 μm. Theexternal grain size distribution must be subjected to sputteringto reduce grain sizes by Δa ≈ 0.002 μm in order to fit theobserved BEK spectrum. This implies an exposure timescale of∼80 yr, which is shorter than timescales estimated from prioranalysis of the X-ray spectra and morphology, indicating a biastoward emission from the more recently swept-up dust in aprocess of extended duration. In the region of the BEK, the500 km s−1 shocks have destroyed ∼25% of the mass of theswept-up interstellar dust. This fraction may be as low as 15%or as high as 35%, as it is derived from the fitted value of Δawhich is strongly correlated with the temperature and density ofthe gas that collisionally heats and sputters the dust grains. Theamount of dust destroyed will increase until the post-shock gascools and sputtering becomes ineffective.
This work is based on observations made with the SpitzerSpace Telescope, which is operated by the Jet PropulsionLaboratory, California Institute of Technology under a con-tract with NASA. Support for this work was provided by
NASA. We acknowledge the use of NASA’s SkyView facility(http://skyview.gsfc.nasa.gov) located at NASA Goddard SpaceFlight Center. This research has made use of NASA’s Astro-physics Data System Bibliographic Services. P.F.W. acknowl-edges additional funding from the NSF through grant AST-0908566.
REFERENCES
Arendt, R. G. 1989, ApJS, 70, 181Arendt, R. G., Dwek, E., & Petre, R. 1991, ApJ, 368, 474Arendt, R. G., Dwek, E., Petre, R., Dickel, J. R., Roger, R. S., Milne, D. K., &
Kesteven, M. J. 1990, ApJ, 350, 266Arendt, R. G., et al. 2008, ApJ, 682, 384Baade, W., & Minkowski, R. 1954, ApJ, 119, 206Castelletti, G., Dubner, G., Golap, K., & Goss, W. M. 2006, A&A, 459, 535Cherchneff, I., & Dwek, E. 2010, ApJ, 713, 1Dubner, G. M., & Arnal, E. M. 1988, A&AS, 75, 363Dutra, C. M., Bica, E., Soares, J., & Barbuy, B. 2003, A&A, 400, 533Dwek, E. 1998, ApJ, 501, 643Dwek, E., Galliano, F., & Jones, A. P. 2007, ApJ, 662, 927Dwek, E., Petre, R., Szymkowiak, A., & Rice, W. L. 1987, ApJ, 320, L27Dwek, E., et al. 2008, ApJ, 676, 1029Fazio, G. G., et al. 2004, ApJS, 154, 10Feitzinger, J. V., & Stuwe, J. A. 1984, A&AS, 8, 365Fixsen, D. J., Moseley, S. H., & Arendt, R. G. 2000, ApJS, 128, 651Gehrz, R. D., et al. 2007, Rev. Sci. Instrum., 78, 011302Gotthelf, E. V., & Halpern, J. P. 2009, ApJ, 695, L35Goudis, G., & Meaburn, J. 1978, A&A, 62, 283Houck, J. R., et al. 2004, ApJS, 154, 18Hwang, U., Flanagan, K. A., & Petre, R. 2005, ApJ, 635, 355Hwang, U., Petre, R., & Flanagan, K. A. 2008, ApJ, 676, 378Itoh, H. 1989, PASJ, 41, 853Jones, A. P. 2004, in ASP Conf. Ser. 309, Astrophysics of Dust, ed. A. N. Witt,
G. C. Clayton, & B. T. Draine (San Francisco, CA: ASP), 347Jones, A. P., Tielens, A. G. G. M., & Hollenbach, D. J. 1996, ApJ, 469, 740Katsuda, S., Hwang, U., Petre, R., Park, S., Mori, K., & Tsunemi, H. 2010, ApJ,
714, 1725Katsuda, S., Mori, K., Tsunemi, H., Park, S., Hwang, U., Burrows, D. N.,
Hughes, J. P., & Slane, P. O. 2008, ApJ, 678, 297Klein, R. I., Budil, K. S., Perry, T. S., & Bach, D. R. 2003, ApJ, 583, 245Maiolino, R., Schneider, R., Oliva, E., Bianchi, S., Ferrara, A., Mannucci, F.,
Pedani, M., & Roca Sogorb, M. 2004, Nature, 431, 533Makovoz, D., & Marleau, F. R. 2005, PASP, 117, 1113Mathis, J. S. 1990, ARA&A, 28, 37Mathis, J. S., Mezger, P. G., & Panagia, N. 1983, A&A, 128, 212Micelotta, E. R., Jones, A. P., & Tielens, A. G. G. M. 2010, A&A, 510, A36Mignani, R. P., de Luca, A., Mereghetti, S., & Caraveo, P. A. 2009, A&A, 500,
1211Morgan, H. L., & Edmunds, M. G. 2003, MNRAS, 343, 427Morse, J. A., et al. 1996, AJ, 112, 509Neugebauer, G., et al. 1984, ApJ, 278, L1Paron, S., Dubner, G., Reynoso, E., & Rubio, M. 2008, A&A, 480, 439Petre, R., Becker, C. M., & Winkler, P. F. 1996, ApJ, 465, L43Ramesh, B. 1994, JA&A, 15, 415Reach, W. T., et al. 2006, AJ, 131, 1479Reynoso, E. M., Dubner, G. M., Goss, W. M., & Arnal, E. M. 1995, AJ, 110,
318Rieke, G. H., et al. 2004, ApJS, 154, 25Saken, J. M., Fesen, R. A., & Shull, J. M. 1992, ApJS, 81, 715Sankrit, R., et al. 2010, ApJ, 712, 1092Smith, J. D. T., et al. 2007, PASP, 119, 1133Sofia, U. J., & Meyer, D. M. 2001, ApJ, 554, L221Sutherland, R. S., & Dopita, M. A. 1995, ApJ, 439, 365Tielens, A. G. G. M. 1998, ApJ, 499, 267Valiante, R., Schneider, R., Bianchi, S., & Andersen, A. C. 2009, MNRAS, 397,
1661Wang, Z., Kaplan, D. L., & Chakrabarty, D. 2007, ApJ, 655, 261Werner, M. W., et al. 2004, ApJS, 154, 1Winkler, P. F., & Kirshner, R. P. 1985, ApJ, 299, 981Winkler, P. F., & Petre, R. 2007, ApJ, 670, 635Winkler, P. F., Tuttle, J. H., Kirshner, R. P., & Irwin, M. J. 1988, in IAU Colloq.
101, Supernova Remnants and the Interstellar Medium, ed. R. S. Roger &T. L. Landecker (Cambridge: Cambridge Univ. Press), 65
Zubko, V., Dwek, E., & Arendt, R. G. 2004, ApJS, 152, 211 (ZDA)