spitzer/irs view of agn oulows - ipac view of agn oulows barbara medvar, jack gabel creighton...
TRANSCRIPT
Spitzer/IRS View of AGN Ou5lows Barbara Medvar, Jack Gabel
Creighton University Introduction • - We investigate how broad absorption line quasars (BALQSOs) compare to the normal quasar population using a sample of archival spectra obtained with the infrared spectrograph (IRS) aboard the Spitzer Space Telescope. - BALs are detected in roughly 20% of the quasar population, yet it is unknown if this is due to: - Orientation: where BALs are present in all quasars, but detected in only a fraction due to a varied line-of-sight with respect to the anisotropic quasar geometry (e.g Gallagher et al. 2007, Hamann et al. 1993, Weymann et al. 1991) or Evolution: where BALs represent a special evolutionary phase in the lifetime of the dynamic AGN quasar system (e.g Becker et al. 2000, and Canalizo & Stockton 2001; Voigt 1993).
- Here, we present results of a study comparing the mid-IR spectra of a sample of BALs and non-BALs and relating them to models from CLUMPY (Nenkova et al. 2002).
Sample Selection and Data
The key MIR diagnostics for our analysis are the broad Silicate dust band centered around 10µ and the MIR continuum slope. Thus, we selected BAL targets from the Spitzer/IRS database with z < 1 and full IRS wavelength coverage (~5-37µ, SL+LL) to sample the entire 10µ profile and best constrain the continuum shape. We identified 17 suitable BALs that meet our criteria from a search of the literature and Spitzer archival abstracts. We eliminated one outlier target from our sample, the ULIRG/BAL Mrk 231, due to it’s extreme rise in continuum flux from optical – MIR. To compare the BAL emission characteristics to the general quasar population, we also selected a control sample of PG quasars, chosen to have similar redshift and optical luminosities (Table 1).
Table. 1. Col. (1): Object name. Col. (2): Redshift. Col. (3): Optical luminosity λL(5100 Å) rest wavelength. Col.(4): Infrared continuum luminosity λL at 6.7µ. Col(5): Luminosity ratio at 6.7 and .51µ. Col (6): MIR continuum slope as measured by flux ratio at 17 and 6.7µ. Including the standard deviation for the averages. Col.(6): Equivalent widths of the 10µ Silicate feature including each spectrum’s calculated error.
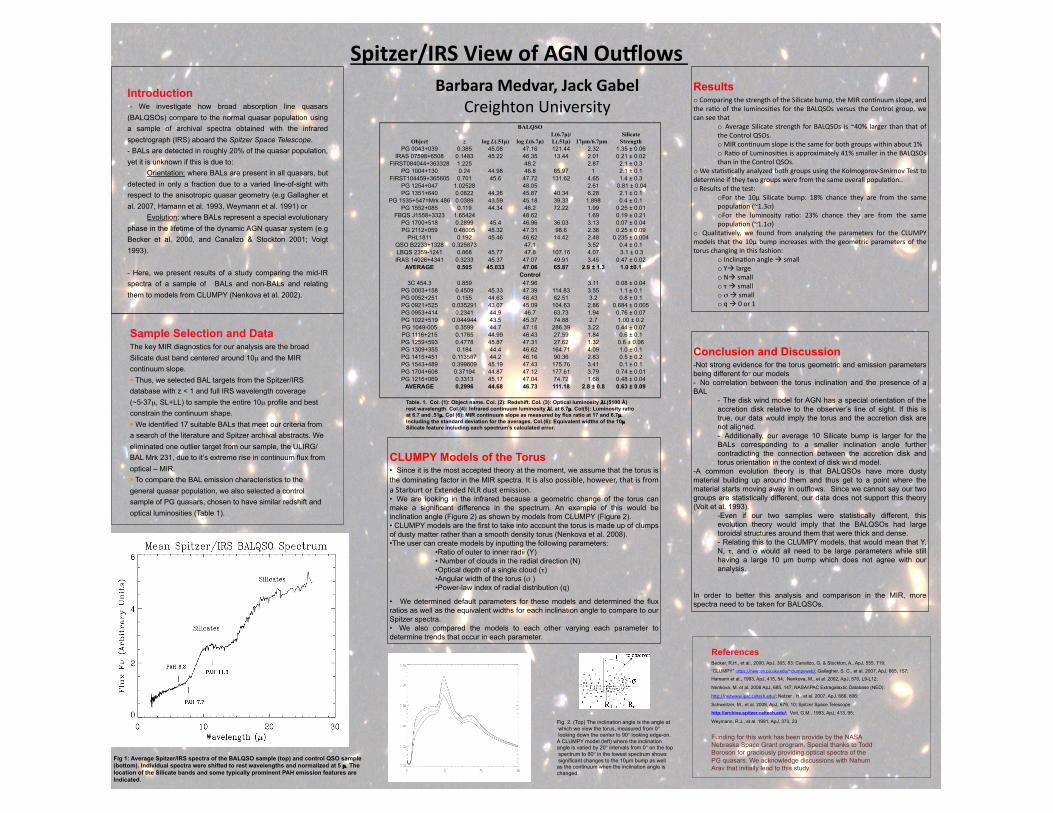
Fig 1: Average Spitzer/IRS spectra of the BALQSO sample (top) and control QSO sample (bottom). Individual spectra were shifted to rest wavelengths and normalized at 5 µ. The location of the Silicate bands and some typically prominent PAH emission features are Indicated.
CLUMPY Models of the Torus • Since it is the most accepted theory at the moment, we assume that the torus is the dominating factor in the MIR spectra. It is also possible, however, that is from a Starburt or Extended NLR dust emission. • We are looking in the infrared because a geometric change of the torus can make a significant difference in the spectrum. An example of this would be inclination angle (Figure 2) as shown by models from CLUMPY (Figure 2). • CLUMPY models are the first to take into account the torus is made up of clumps of dusty matter rather than a smooth density torus (Nenkova et al. 2008). • The user can create models by inputting the following parameters:
• Ratio of outer to inner radii (Y) • Number of clouds in the radial direction (N) • Optical depth of a single cloud (τ) • Angular width of the torus (σ ) • Power-law index of radial distribution (q)
• We determined default parameters for these models and determined the flux ratios as well as the equivalent widths for each inclination angle to compare to our Spitzer spectra. • We also compared the models to each other varying each parameter to determine trends that occur in each parameter.
Fig. 2. (Top) The inclination angle is the angle at which we view the torus, measured from 0° looking down the center to 90° looking edge-on. A CLUMPY model (left) where the inclination angle is varied by 20° intervals from 0° on the top spectrum to 80° in the lowest spectrum shows significant changes to the 10µm bump as well as the continuum when the inclination angle is changed.
BALQSO
Object z log L(.51µ) log L(6.7µ) L(6.7µ)/ L(.51µ) 17µm/6.7µm
Silicate Strength
PG 0043+039 0.385 45.08 47.16 121.44 2.32 1.35 ± 0.06 IRAS 07598+6508 0.1483 45.22 46.35 13.44 2.01 0.21 ± 0.02
FIRST084044+363328 1.225 48.2 2.87 2.1 ± 0.3 PG 1004+130 0.24 44.98 46.8 65.97 1 2.1 ± 0.1
FIRST104459+365605 0.701 45.6 47.72 131.62 4.65 1.4 ± 0.3 PG 1254+047 1.02528 48.05 2.61 0.81 ± 0.04 PG 1351+640 0.0822 44.26 45.87 40.34 6.28 2.1 ± 0.1
PG 1535+547=Mrk 486 0.0389 43.59 45.18 39.33 1.898 0.4 ± 0.1 PG 1552+085 0.119 44.34 46.2 72.22 1.99 0.25 ± 0.01
FBQS J1558+3323 1.65424 48.62 1.69 0.19 ± 0.21 PG 1700+518 0.2899 45.4 46.96 36.03 3.13 0.07 ± 0.04 PG 2112+059 0.46005 45.32 47.31 98.6 2.36 0.25 ± 0.09
PHL1811 0.192 45.46 46.62 14.42 2.48 0.235 ± 0.004 QSO B2233+1328 0.325873 47.1 3.52 0.4 ± 0.1 LBQS 2359-1241 0.868 45.77 47.8 107.16 4.07 3.1 ± 0.3 IRAS 14026+4341 0.3233 45.37 47.07 49.91 3.45 0.47 ± 0.02
AVERAGE 0.505 45.033 47.06 65.87 2.9 ± 1.3 1.0 ±0.1 Control
3C 454.3 0.859 47.96 3.11 0.08 ± 0.04 PG 0003+158 0.4509 45.33 47.39 114.83 3.55 1.1 ± 0.1 PG 0052+251 0.155 44.63 46.43 62.51 3.2 0.8 ± 0.1 PG 0921+525 0.035291 43.07 45.09 104.63 2.86 0.684 ± 0.005 PG 0953+414 0.2341 44.9 46.7 63.73 1.94 0.76 ± 0.07 PG 1022+519 0.044944 43.5 45.37 74.88 2.7 1.00 ± 0.2 PG 1049-005 0.3599 44.7 47.16 286.39 3.22 0.44 ± 0.07 PG 1116+215 0.1765 44.99 46.43 27.59 1.84 0.6 ± 0.1 PG 1259+593 0.4778 45.87 47.31 27.62 1.32 0.6 ± 0.06 PG 1309+355 0.184 44.4 46.62 164.71 4.09 1.0 ± 0.1 PG 1415+451 0.113587 44.2 46.16 90.36 2.83 0.5 ± 0.2 PG 1543+489 0.399609 45.19 47.43 175.76 3.41 0.1 ± 0.1 PG 1704+608 0.37194 44.87 47.12 177.61 3.79 0.74 ± 0.01 PG 1216+069 0.3313 45.17 47.04 74.72 1.68 0.48 ± 0.04
AVERAGE 0.2996 44.68 46.73 111.18 2.8 ± 0.8 0.63 ± 0.09
Results o Comparing the strength of the Silicate bump, the MIR conCnuum slope, and the raCo of the luminosiCes for the BALQSOs versus the Control group, we can see that
o Average Silicate strength for BALQSOs is ~40% larger than that of the Control QSOs. o MIR conCnuum slope is the same for both groups within about 1% o RaCo of LuminosiCes is approximately 41% smaller in the BALQSOs than in the Control QSOs.
o We staCsCcally analyzed both groups using the Kolmogorov‐Smirnov Test to determine if they two groups were from the same overall populaCon.. o Results of the test:
o For the 10µ Silicate bump: 18% chance they are from the same populaCon (~1.3σ) o For the luminosity raCo: 23% chance they are from the same populaCon (~1.1σ)
o QualitaCvely, we found from analyzing the parameters for the CLUMPY models that the 10µ bump increases with the geometric parameters of the torus changing in this fashion:
o InclinaCon angle small o Y large o N small o τ small o σ small o q 0 or 1
Conclusion and Discussion - Not strong evidence for the torus geometric and emission parameters being different for our models - No correlation between the torus inclination and the presence of a BAL
- The disk wind model for AGN has a special orientation of the accretion disk relative to the observer’s line of sight. If this is true, our data would imply the torus and the accretion disk are not aligned. - Additionally, our average 10 Silicate bump is larger for the BALs corresponding to a smaller inclination angle further contradicting the connection between the accretion disk and torus orientation in the context of disk wind model.
- A common evolution theory is that BALQSOs have more dusty material building up around them and thus get to a point where the material starts moving away in outflows. Since we cannot say our two groups are statistically different, our data does not support this theory (Voit et al. 1993).
- Even if our two samples were statistically different, this evolution theory would imply that the BALQSOs had large toroidal structures around them that were thick and dense. - Relating this to the CLUMPY models, that would mean that Y, N, τ, and σ would all need to be large parameters while still having a large 10 µm bump which does not agree with our analysis.
In order to better this analysis and comparison in the MIR, more spectra need to be taken for BALQSOs.
References Becker, R.H., et al., 2000, ApJ, 305, 83: Canalizo, G. & Stockton, A., ApJ, 555, 719;
“CLUMPY” h]ps://newton.pa.uky.edu/~clumpyweb/; Gallagher, S. C., et al. 2007, ApJ, 665, 157; Hamann et al., 1993, ApJ, 415, 54; Nenkova, M., et al. 2002, ApJ, 570, L9-L12;
Nenkova, M. et al. 2008 ApJ, 685, 147; NASA/IPAC Extragalaxtic Database (NED):
h]p://nedwww.ipac.caltech.edu/; Netzer , H., et al. 2007, ApJ, 666, 806;
Schweitzer, M., et al. 2008, ApJ, 679, 10; Spitzer Space Telescope
http://archive.spitzer.caltech.edu/; Voit, G.M., 1993, ApJ, 413, 95;
Weymann, R.J., et al. 1991, ApJ, 373, 23
Funding for this work has been provide by the NASA Nebraska Space Grant program. Special thanks to Todd Boroson for graciously providing optical spectra of the PG quasars. We acknowledge discussions with Nahum Arav that initially lead to this study.