splash screen chapter 2: representing motion chapter 2: representing motion click the mouse or press...
TRANSCRIPT

Chapter 2:
Representing Motion
Chapter 2:
Representing Motion
Click the mouse or press the spacebar to continue.
Chapter
2Chapter
2 Representing MotionRepresenting Motion
● Represent motion through the use of words, motion diagrams, and graphs.
● Use the terms position, distance, displacement, and time interval in a scientific manner to describe motion.
In this chapter you will:

Section
2.1Section
2.1 Picturing MotionPicturing Motion
Perceiving motion is instinctive—your eyes pay more attention to moving objects than to stationary ones. Movement is all around you.
Movement travels in many directions, such as the straight-line path of a bowling ball in a lane’s gutter, the curved path of a tether ball, the spiral of a falling kite, and the swirls of water circling a drain.
All Kinds of Motion

Section
2.1Section
2.1 Picturing MotionPicturing Motion
When an object is in motion, its position changes. Its position can change along the path of a straight line, a circle, an arc, or a back-and-forth vibration.
All Kinds of Motion

Section
2.1Section
2.1 Picturing MotionPicturing Motion
A description of motion relates to place and time. You must be able to answer the questions of where and when an object is positioned to describe its motion.
Movement Along a Straight Line

Section
2.1Section
2.1 Picturing MotionPicturing Motion
In the figure below, the car has moved from point A to point B in a specific time period.
Movement Along a Straight Line

Section
2.1Section
2.1 Picturing MotionPicturing Motion
Motion Diagrams
Click image to view movie.

Section
2.1Section
2.1 Section CheckSection Check
Which statement describes best the motion diagram of an object in motion?
Question 1
A. a graph of the time data on a horizontal axis and the position on a vertical axis
B. a series of images showing the positions of a moving object at equal time intervals
C. a diagram in which the object in motion is replaced by a series of single points
D. a diagram that tells us the location of the zero point of the object in motion and the direction in which the object is moving

Section
2.1Section
2.1 Section CheckSection Check
Reason: A series of images showing the positions of a moving object at equal time intervals is called a motion diagram.
Answer 1

Section
2.2Section
2.2 Where and When?Where and When?
A coordinate system tells you the location of the zero point of the variable you are studying and the direction in which the values of the variable increase.
The origin is the point at which both variables have the value zero.
Coordinate Systems

Section
2.2Section
2.2 Where and When?Where and When?
In the example of the runner, the origin, represented by the zero end of the measuring tape, could be placed 5 m to the left of the tree.
Coordinate Systems

Section
2.2Section
2.2 Where and When?Where and When?
The motion is in a straight line, thus, your measuring tape should lie along that straight line. The straight line is an axis of the coordinate system.
Coordinate Systems

Section
2.2Section
2.2 Where and When?Where and When?
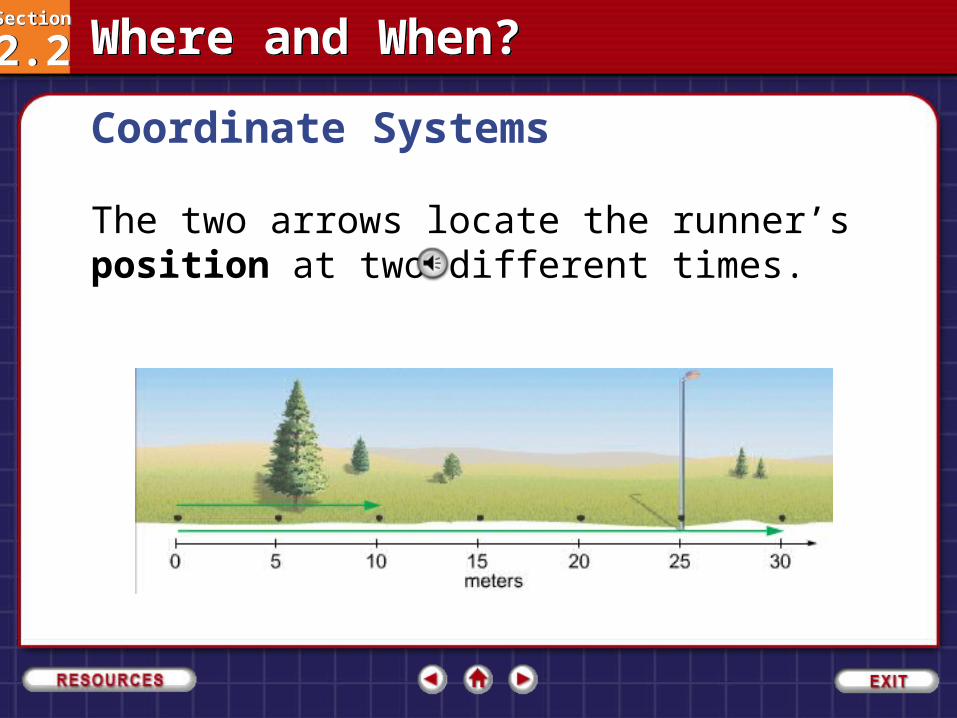
You can indicate how far away an object is from the origin at a particular time on the simplified motion diagram by drawing an arrow from the origin to the point representing the object, as shown in the figure.
Coordinate Systems
Section
2.2Section
2.2 Where and When?Where and When?
The two arrows locate the runner’s position at two different times.
Coordinate Systems

Section
2.2Section
2.2 Where and When?Where and When?
The length of how far an object is from the origin indicates its distance from the origin.
Coordinate Systems

Section
2.2Section
2.2 Where and When?Where and When?
Coordinate Systems
The arrow points from the origin to the location of the moving object at a particular time.

Section
2.2Section
2.2 Where and When?Where and When?
A position 9 m to the left of the tree, 5 m left of the origin, would be a negative position, as shown in the figure below.
Coordinate Systems

Section
2.2Section
2.2 Where and When?Where and When?
Quantities that have both size, also called magnitude, and direction, are called vectors, and can be represented by arrows.
Quantities that are just numbers without any direction, such as distance, time, or temperature, are called scalars.
Vectors and Scalars

Section
2.2Section
2.2 Where and When?Where and When?
To add vectors graphically, the length of a vector should be proportional to the magnitude of the quantity being represented. So it is important to decide on the scale of your drawings.
The important thing is to choose a scale that produces a diagram of reasonable size with a vector that is about 5–10 cm long.
Vectors and Scalars

Section
2.2Section
2.2 Where and When?Where and When?
The vector that represents the sum of the other two vectors is called the resultant.
The resultant always points from the tail of the first vector to the tip of the last vector.
Vectors and Scalars

Section
2.2Section
2.2 Where and When?Where and When?
The difference between the initial and the final times is called the time interval.
Time Intervals and Displacement

Section
2.2Section
2.2 Where and When?Where and When?
The common symbol for a time interval is ∆t, where the Greek letter delta, ∆, is used to represent a change in a quantity.
Time Intervals and Displacement

Section
2.2Section
2.2 Where and When?Where and When?
The time interval is defined mathematically as follows:
Time Intervals and Displacement
Although i and f are used to represent the initial and final times, they can be initial and final times of any time interval you choose.

Section
2.2Section
2.2 Where and When?Where and When?
Time Intervals and Displacement
Also of importance is how the position changes. The symbol d may be used to represent position.
In physics, a position is a vector with its tail at the origin of a coordinate system and its tip at the place where the object is located at that time.

Section
2.2Section
2.2 Where and When?Where and When?
The figure below shows ∆d, an arrow drawn from the runner’s position at the tree to his position at the lamppost.
Time Intervals and Displacement

Section
2.2Section
2.2 Where and When?Where and When?
The change in position during the time interval between ti and tf is called displacement.
Time Intervals and Displacement

Section
2.2Section
2.2 Where and When?Where and When?
The length of the arrow represents the distance the runner moved, while the direction the arrow points indicates the direction of the displacement.
Displacement is mathematically defined as follows:
Time Intervals and Displacement
Displacement is equal to the final position minus the initial position.

Section
2.2Section
2.2 Where and When?Where and When?
To subtract vectors, reverse the subtracted vector and then add the two vectors. This is because A – B = A + (–B).
The figure a below shows two vectors, A, 4 cm long pointing east, and B, 1 cm long also pointing east. Figure b shows –B, which is 1 cm long pointing west. The resultant of A and –B is 3 cm long pointing east.
Time Intervals and Displacement

Section
2.2Section
2.2 Where and When?Where and When?
To determine the length and direction of the displacement vector, ∆d = df − di, draw −di, which is di reversed. Then draw df and copy −di with its tail at df’s tip. Add df and −di.
Time Intervals and Displacement

Section
2.2Section
2.2 Where and When?Where and When?
To completely describe an object’s displacement, you must indicate the distance it traveled and the direction it moved. Thus, displacement, a vector, is not identical to distance, a scalar; it is distance and direction.
While the vectors drawn to represent each position change, the length and direction of the displacement vector does not.
The displacement vector is always drawn with its flat end, or tail, at the earlier position, and its point, or tip, at the later position.
Time Intervals and Displacement

Section
2.2Section
2.2 Section CheckSection Check
Differentiate between scalar and vector quantities.
Question 1

Section
2.2Section
2.2 Section CheckSection Check
Answer 1
Answer: Quantities that have both magnitude and direction are called vectors, and can be represented by arrows. Quantities that are just numbers without any direction, such as time, are called scalars.

Section
2.2Section
2.2 Section CheckSection Check
What is displacement?
Question 2
A. the vector drawn from the initial position to the final position of the motion in a coordinate system
B. the distance between the initial position and the final position of the motion in a coordinate system
C. the amount by which the object is displaced from the initial position
D. the amount by which the object moved from the initial position

Section
2.2Section
2.2 Section CheckSection Check
Reason: Options B, C, and D are all defining the distance of the motion and not the displacement. Displacement is a vector drawn from the starting position to the final position.
Answer 2

Section
2.2Section
2.2 Section CheckSection Check
Refer to the adjoining figure and calculate the time taken by the car to travel from one signal to another signal?
Question 3
A. 20 min
B. 45 min
C. 25 min
D. 5 min

Section
2.2Section
2.2 Section CheckSection Check
Reason: Time interval t = tf – ti
Here tf = 01:45 and ti = 01:20
Therefore, t = 25 min
Answer 3
Section
2.3Section
2.3 Position-Time GraphsPosition-Time Graphs
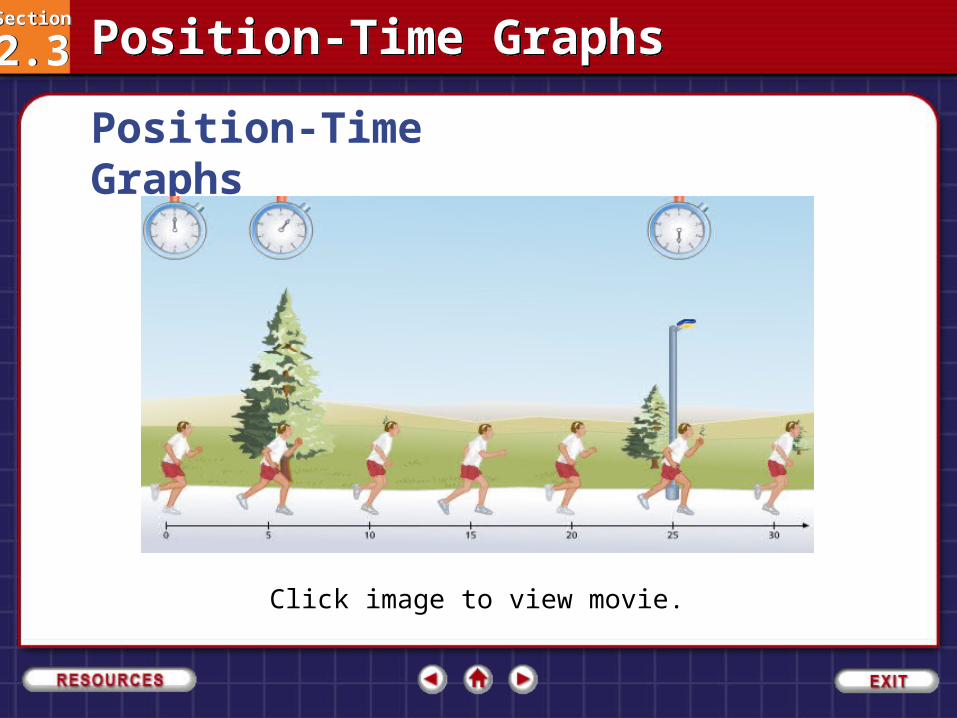
Position-Time Graphs
Click image to view movie.

Section
2.3Section
2.3 Position-Time GraphsPosition-Time Graphs
Graphs of an object’s position and time contain useful information about an object’s position at various times. It can be helpful in determining the displacement of an object during various time intervals.
Using a Graph to Find Out Where and When

Section
2.3Section
2.3 Position-Time GraphsPosition-Time Graphs
Using a Graph to Find Out Where and When
The data in the table can be presented by plotting the time data on a horizontal axis and the position data on a vertical axis, which is called a position-time graph.

Section
2.3Section
2.3 Position-Time GraphsPosition-Time Graphs
To draw the graph, plot the object’s recorded positions. Then, draw a line that best fits the recorded points. This line represents the most likely positions of the runner at the times between the recorded data points.
Using a Graph to Find Out Where and When
The symbol d represents the instantaneous position of the object—the position at a particular instant.

Section
2.3Section
2.3 Position-Time GraphsPosition-Time Graphs
Considering the Motion of Multiple Objects
In the graph, when and where does runner B pass runner A?

Section
2.3Section
2.3 Position-Time GraphsPosition-Time Graphs
In the figure, examine the graph to find the intersection of the line representing the motion of A with the line representing the motion of B.
Considering the Motion of Multiple Objects

Section
2.3Section
2.3 Position-Time GraphsPosition-Time Graphs
These lines intersect at 45.0 s and at about 190 m.
Considering the Motion of Multiple Objects

Section
2.3Section
2.3 Position-Time GraphsPosition-Time Graphs
B passes A about 190 m beyond the origin, 45.0 s after A has passed the origin.
Considering the Motion of Multiple Objects

Section
2.3Section
2.3 Section CheckSection Check
A position-time graph of an athlete winning the 100-m run is shown. Estimate the time taken by the athlete to reach 65 m.
Question 1
A. 6.0 s
B. 6.5 s
C. 5.5 s
D. 7.0 s

Section
2.3Section
2.3 Section CheckSection Check
Reason: Draw a horizontal line from the position of 65 m to the line of best fit. Draw a vertical line to touch the time axis from the point of intersection of the horizontal line and line of best fit. Note the time where the vertical line crosses the time axis. This is the estimated time taken by the athlete to reach 65 m.
Answer 1

Section
2.3Section
2.3 Section CheckSection Check
A position-time graph of an athlete winning the 100-m run is shown. What was the instantaneous position of the athlete at 2.5 s?
Question 2
A. 15 m
B. 20 m
C. 25 m
D. 30 m

Section
2.3Section
2.3 Section CheckSection Check
Reason: Draw a vertical line from the position of 2.5 m to the line of best fit. Draw a horizontal line to touch the position axis from the point of intersection of the vertical line and line of best fit. Note the position where the horizontal line crosses the position axis. This is the instantaneous position of the athlete at 2.5 s.
Answer 2

Section
2.3Section
2.3 Section CheckSection Check
From the following position-time graph of two brothers running a 100-m dash, at what time do both brothers have the same position? The smaller brother started the race from the 20-m mark.
Question 3

Section
2.3Section
2.3 Section CheckSection Check
Answer 3
Answer: The two brothers meet at 6 s. In the figure, we find the intersection of lines representing the motion of one brother with the line representing the motion of other brother. These lines intersect at 6 s and at 60 m.

Section
2.4Section
2.4 How Fast?How Fast?
Suppose you recorded two joggers in one motion diagram, as shown in the figure below. From one frame to the next, you can see that the position of the jogger in red shorts changes more than that of the one wearing blue.
Velocity

Section
2.4Section
2.4 How Fast?How Fast?
In other words, for a fixed time interval, the displacement, ∆d, is greater for the jogger in red because she is moving faster.
She covers a larger distance than the jogger in blue does in the same amount of time.
Velocity

Section
2.4Section
2.4 How Fast?How Fast?
Now, suppose that each jogger travels 100 m. The time interval, ∆t, would be smaller for the jogger in red than for the one in blue.
Velocity

Section
2.4Section
2.4 How Fast?How Fast?
Recall from Chapter 1 that to find the slope, you first choose two points on the line.
Next, you subtract the vertical coordinate (d in this case) of the first point from the vertical coordinate of the second point to obtain the rise of the line.
After that, you subtract the horizontal coordinate (t in this case) of the first point from the horizontal coordinate of the second point to obtain the run.
Finally, you divide the rise by the run to obtain the slope.
Average Velocity

Section
2.4Section
2.4 How Fast?How Fast?
The slopes of the two lines are found as follows:
Average Velocity

Section
2.4Section
2.4 How Fast?How Fast?
The slopes of the two lines are found as follows:
Average Velocity
Section
2.4Section
2.4 How Fast?How Fast?
The unit of the slope is meters per second. In other words, the slope tells how many meters the runner moved in 1 s.
The slope is the change in position, divided by the time interval during which that change took place, or (df - di) / (tf - ti), or Δd/Δt.
When Δd gets larger, the slope gets larger; when Δt gets larger, the slope gets smaller.
Average Velocity

Section
2.4Section
2.4 How Fast?How Fast?
The slope of a position-time graph for an object is the object’s average velocity and is represented by the ratio of the change of position to the time interval during which the change occurred.
Average Velocity

Section
2.4Section
2.4 How Fast?How Fast?
Average Velocity
Average velocity is defined as the change in position, divided by the time during which the change occurred.
The symbol ≡ means that the left-hand side of the equation is defined by the right-hand side.

Section
2.4Section
2.4 How Fast?How Fast?
It is a common misconception to say that the slope of a position-time graph gives the speed of the object.
The slope of the position-time graph on the right is –5.0 m/s. It indicates the average velocity of the object and not its speed.
Average Velocity

Section
2.4Section
2.4 How Fast?How Fast?
The object moves in the negative direction at a rate of 5.0 m/s.
Average Velocity

Section
2.4Section
2.4 How Fast?How Fast?
The absolute value of the slope on a position-time graph tells you the average speed of the object, that is, how fast the object is moving.
Average Speed

Section
2.4Section
2.4 How Fast?How Fast?
Average Speed
If an object moves in the negative direction, then its displacement is negative. The object’s velocity will always have the same sign as the object’s displacement.

Section
2.4Section
2.4 How Fast?How Fast?
Average Speed
The graph describes the motion of a student riding his skateboard along a smooth, pedestrian-free sidewalk. What is his average velocity? What is his average speed?

Section
2.4Section
2.4 How Fast?How Fast?
Average Speed
Find the average velocity using two points on the line.
Use magnitudes with signs indicating directions.

Section
2.4Section
2.4 How Fast?How Fast?
Average Speed
Substitute d2 = 12.0 m, d1 = 6.0 m, t2 = 8.0 s, t1 = 4.0 s:

Section
2.4Section
2.4 How Fast?How Fast?
Are the units correct?
m/s are the units for both velocity and speed.
Do the signs make sense?
The positive sign for the velocity agrees with the coordinate system. No direction is associated with speed.
Average Speed

Section
2.4Section
2.4 How Fast?How Fast?
A motion diagram shows the position of a moving object at the beginning and end of a time interval. During that time interval, the speed of the object could have remained the same, increased, or decreased. All that can be determined from the motion diagram is the average velocity.
The speed and direction of an object at a particular instant is called the instantaneous velocity.
The term velocity refers to instantaneous velocity and is represented by the symbol v.
Instantaneous Velocity

Section
2.4Section
2.4 How Fast?How Fast?
Although the average velocity is in the same direction as displacement, the two quantities are not measured in the same units.
Nevertheless, they are proportional—when displacement is greater during a given time interval, so is the average velocity.
A motion diagram is not a precise graph of average velocity, but you can indicate the direction and magnitude of the average velocity on it.
Average Velocity on Motion Diagrams

Section
2.4Section
2.4 How Fast?How Fast?
• The average velocity is the rate at which the displacement occurs
• generally use a time interval, so let ti = 0
fi
averagefi
x xxv
t t t
Average Velocity

Section
2.4Section
2.4 How Fast?How Fast?
Direction will be the same as the direction of the displacement (time interval is always positive) + or - is sufficientUnits of velocity are m/s (SI), cm/s (cgs) or ft/s (US Cust.)
Other units may be given in a problem, but generally will need to be converted to these
Average Velocity

Section
2.4Section
2.4 How Fast?How Fast?
Speed vs. Velocity
Cars on both paths have the same average velocity since they had the same displacement in the same time intervalThe car on the blue path will have a greater average speed since the distance it traveled is larger

Section
2.4Section
2.4 How Fast?How Fast?
• Velocity can be determined from a position-time graph
• Average velocity equals the slope of the line joining the initial and final positions
• An object moving with a constant velocity will have a graph that is a straight line

Section
2.4Section
2.4 How Fast?How Fast?Average Velocity, Constant
• The straight line indicates constant velocity
• The slope of the line is the value of the average velocity

Section
2.4Section
2.4 How Fast?How Fast?Average Velocity, Non Constant
• The motion is non-constant velocity
• The average velocity is the slope of the blue line joining two points

Chapter
2Chapter
2 Representing MotionRepresenting MotionInstantaneous Velocity
• The limit of the average velocity as the time interval becomes infinitesimally short, or as the time interval approaches zero
• The instantaneous velocity indicates what is happening at every point of time
lim0t
xv
t
Tangent at B is an instantaneous velocity

Section
2.4Section
2.4 How Fast?How Fast?
• The slope of the line tangent to the position-vs.-time graph is defined to be the instantaneous velocity at that time– The instantaneous speed is defined as the
magnitude of the instantaneous velocity

Section
2.4Section
2.4 How Fast?How Fast?
Position – Time Graphs• The (+) slope
indicates an object is moving away from its point of origin. The horizontal line indicates no movement of the object. The (–) slope indicates an object moving toward its point of origin.
Section
2.4Section
2.4 How Fast?How Fast?
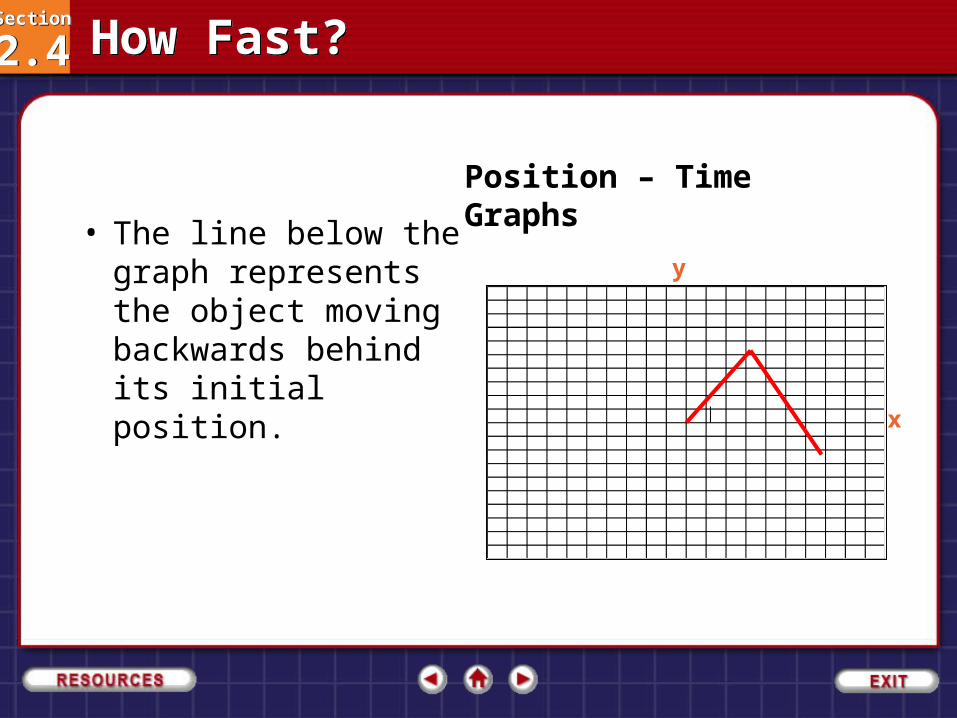
• The line below the graph represents the object moving backwards behind its initial position.
y
x
Position – Time Graphs
Section
2.4Section
2.4 How Fast?How Fast?
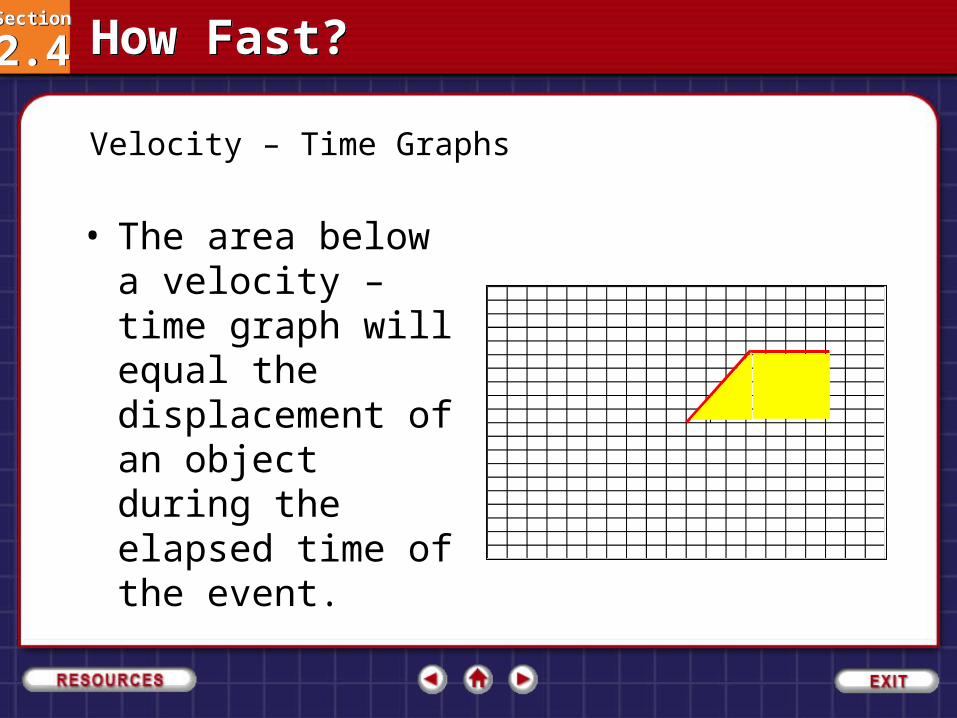
Velocity – Time Graphs
• The area below a velocity – time graph will equal the displacement of an object during the elapsed time of the event.

Section
2.4Section
2.4 How Fast?How Fast?
• The graph shows a motion where velocity is increasing (+ slope) and then reaches a constant rate (hortizontal line). A declining line would represent slowing down.
Velocity – Time Graphs
v
t

Chapter
2Chapter
2 Representing MotionRepresenting Motion