splash screen. lesson menu five-minute check (over lesson 7–4) ccss then/now new vocabulary key...
TRANSCRIPT

Five-Minute Check (over Lesson 7–4)
CCSS
Then/Now
New Vocabulary
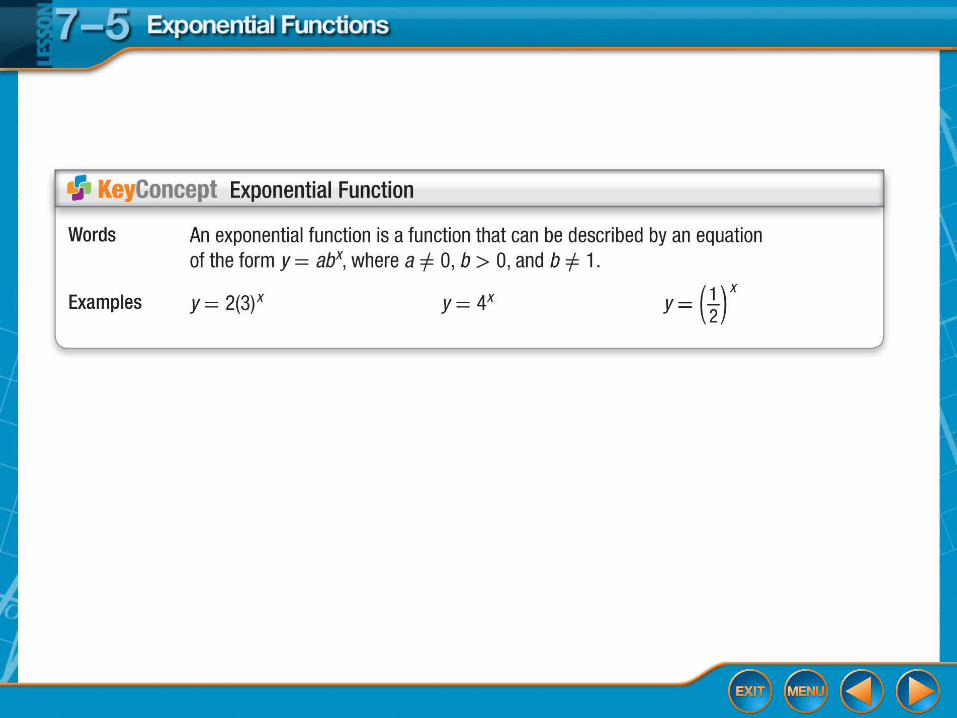
Key Concept: Exponential Function
Example 1: Graph with a > 0 and b > 1
Example 2: Graph with a > 0 and 0 < b < 1
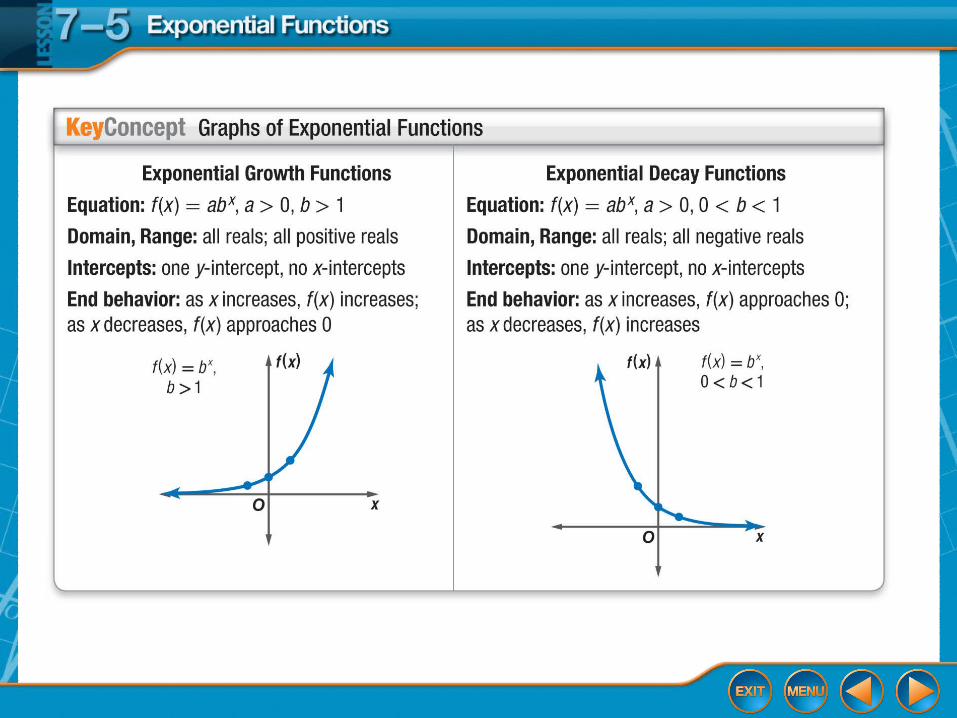
Key Concept: Graphs of Exponential Functions
Example 3: Real-World Example: Use Exponential Functions to Solve Problems
Example 4: Identify Exponential Behavior

Over Lesson 7–4
A. 3.3 × 10⁴
B. 33.52 × 10⁴
C. 3.352 × 10⁶
D. 0.3352 × 10⁷
What is 3,352,000 in scientific notation?
Over Lesson 7–4
A. 2.81 × 10⁻⁶
B. 2.81 × 10⁻⁷
C. 0.281 × 10⁻⁷
D. 28.1 × 10⁻⁵
What is 0.00000281 in scientific notation?
Over Lesson 7–4
A. 3.0000
B. 300.00
C. 3000
D. 30,000
What is 3 × 10⁴ in standard form?
Over Lesson 7–4
A. 0.00000612
B. 0.0000612
C. 0.00612
D. 0.612
What is 6.12 × 10⁻⁵ in standard form?
Over Lesson 7–4
A. 3 × 10⁶
B. 3 × 10⁷
C. 3 × 10⁸
D. 30 × 108
Over Lesson 7–4
A. 2
B. 3
C. 4
D. 5
What value of m makes (5.3 × 10m)2 = 2.809 × 10⁷ true?
Content Standards
F.IF.7e Graph exponential and logarithmic functions, showing intercepts and end behavior, and trigonometric functions, showing period, midline, and amplitude.
F.LE.2 Construct linear and exponential functions, including arithmetic and geometric sequences, given a graph, a description of a relationship, or two input- output pairs (include reading these from a table).
Mathematical Practices
1 Make sense of problems and persevere in solving them.
Common Core State Standards © Copyright 2010. National Governors Association Center for Best Practices and Council of Chief State School Officers. All rights reserved.

You evaluated numerical expressions involving exponents.
• Graph exponential functions.
• Identify data that display exponential behavior.
• exponential function
• exponential growth function
• exponential decay function
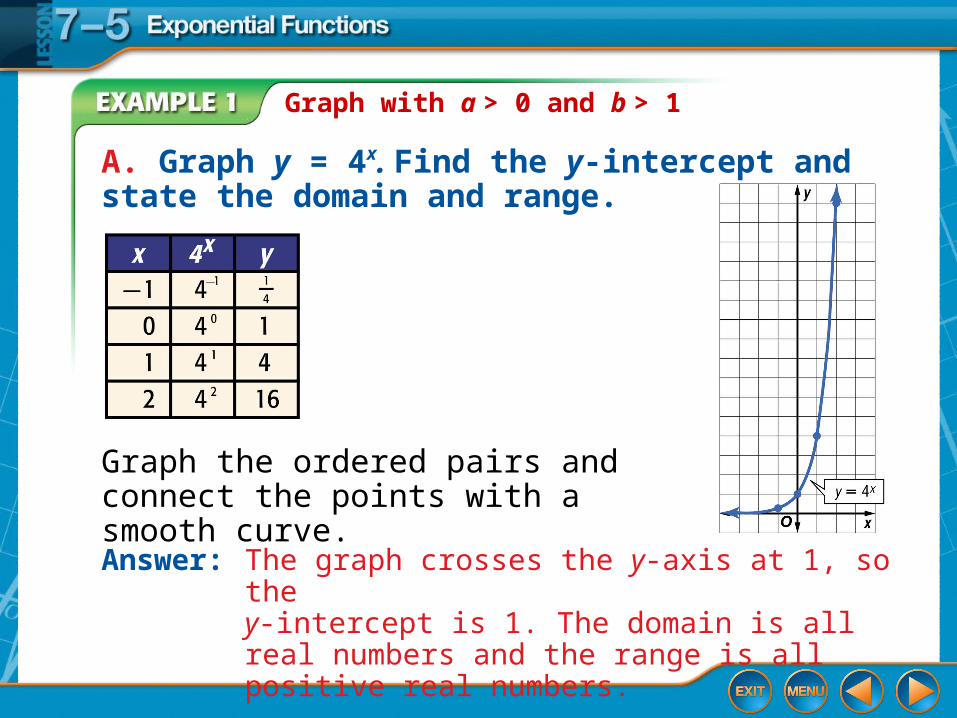
Graph with a > 0 and b > 1
A. Graph y = 4x. Find the y-intercept and state the domain and range.
Graph the ordered pairs and connect the points with a smooth curve.
Answer: The graph crosses the y-axis at 1, so the y-intercept is 1. The domain is all real numbers and the range is all positive real numbers.
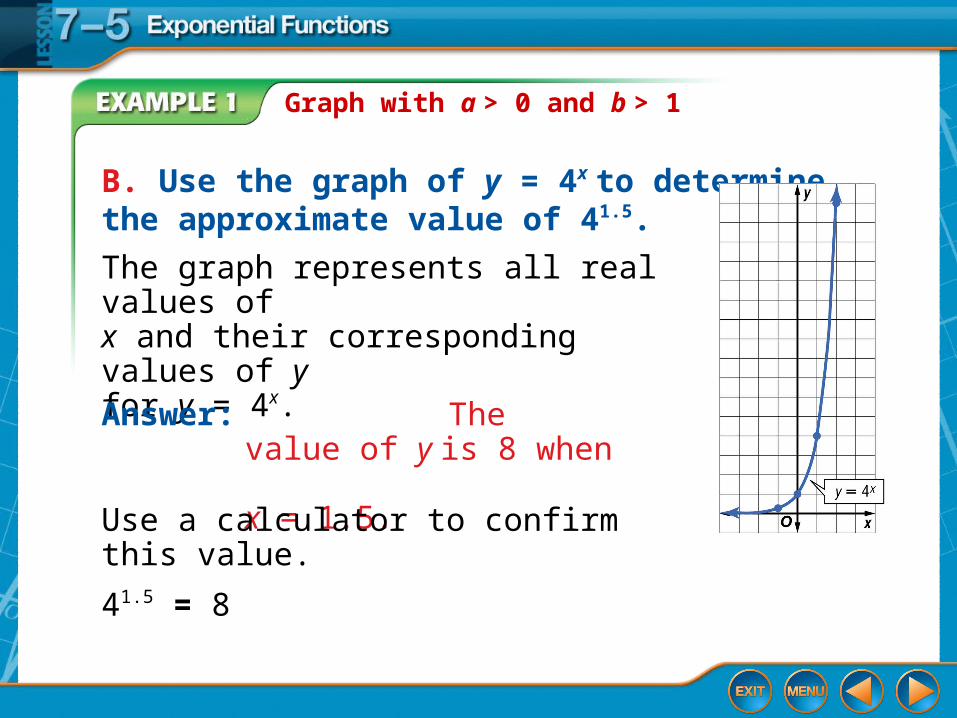
Graph with a > 0 and b > 1
B. Use the graph of y = 4x to determine the approximate value of 41.5.
The graph represents all real values ofx and their corresponding values of y for y = 4x.
Answer: The value of y is 8 when x = 1.5.
Use a calculator to confirm this value.
41.5 = 8
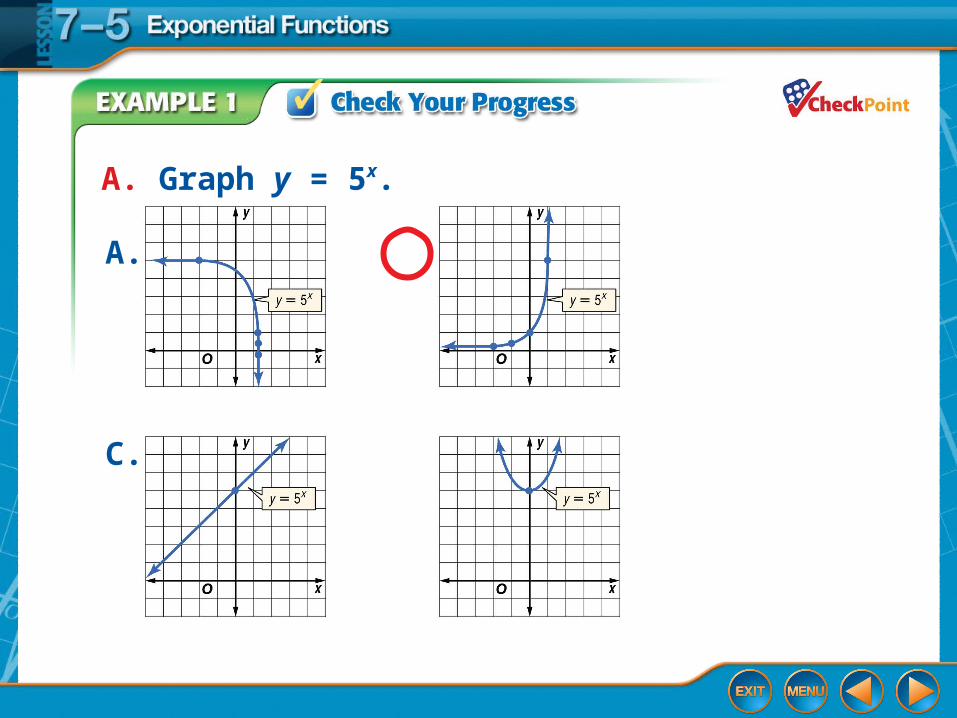
A. Graph y = 5x.
A. B.
C. D.

B. Use the graph of y = 5x to determine the approximate value of 50.25.
A. about 2.5
B. about 5
C. about 2
D. about 1.5

Graph with a > 0 and 0 < b < 1
Graph the ordered pairs and connect the points with a smooth curve.
Answer: The y-intercept is 1. The domain is all real numbers and the range is all positive real numbers.
A. Find the y-intercept and state
the domain and range.
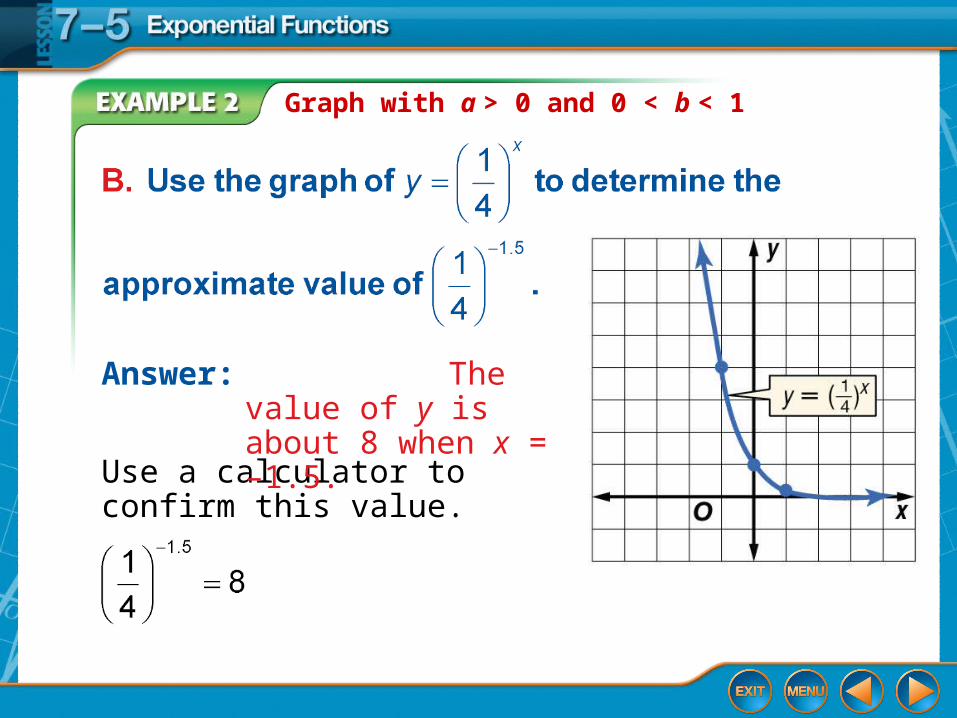
Graph with a > 0 and 0 < b < 1
Use a calculator to confirm this value.
Answer: The value of y is about 8 when x = –1.5.

A. Graph
A. B.
C. D.
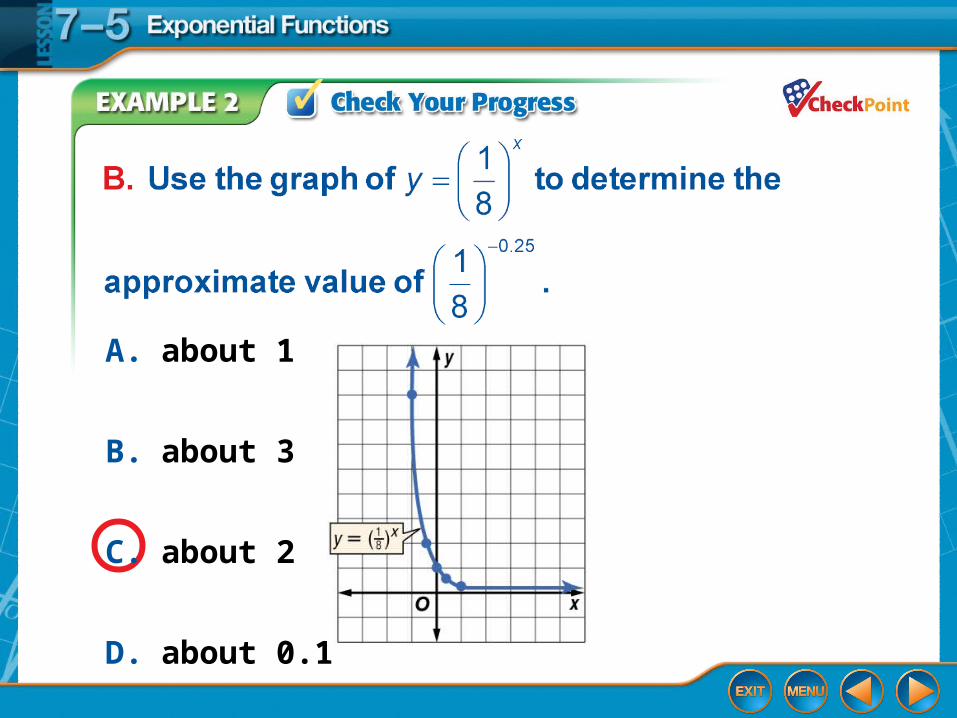
A. about 1
B. about 3
C. about 2
D. about 0.1
Use Exponential Functions to Solve Problems
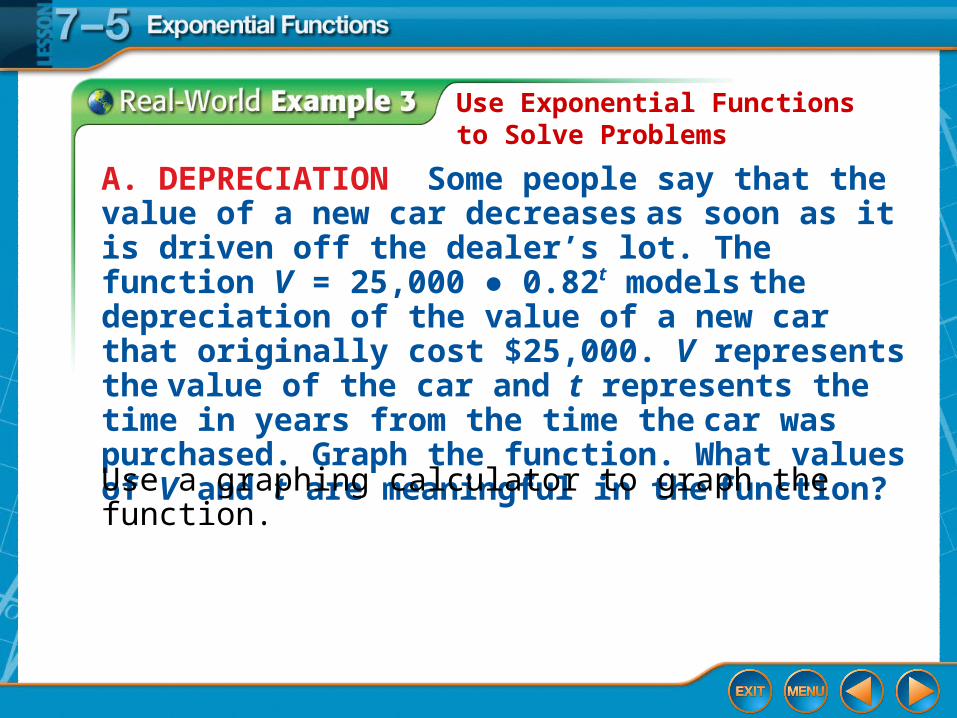
A. DEPRECIATION Some people say that the value of a new car decreases as soon as it is driven off the dealer’s lot. The function V = 25,000 ● 0.82t models the depreciation of the value of a new car that originally cost $25,000. V represents the value of the car and t represents the time in years from the time the car was purchased. Graph the function. What values of V and t are meaningful in the function?
Use a graphing calculator to graph the function.
Use Exponential Functions to Solve Problems
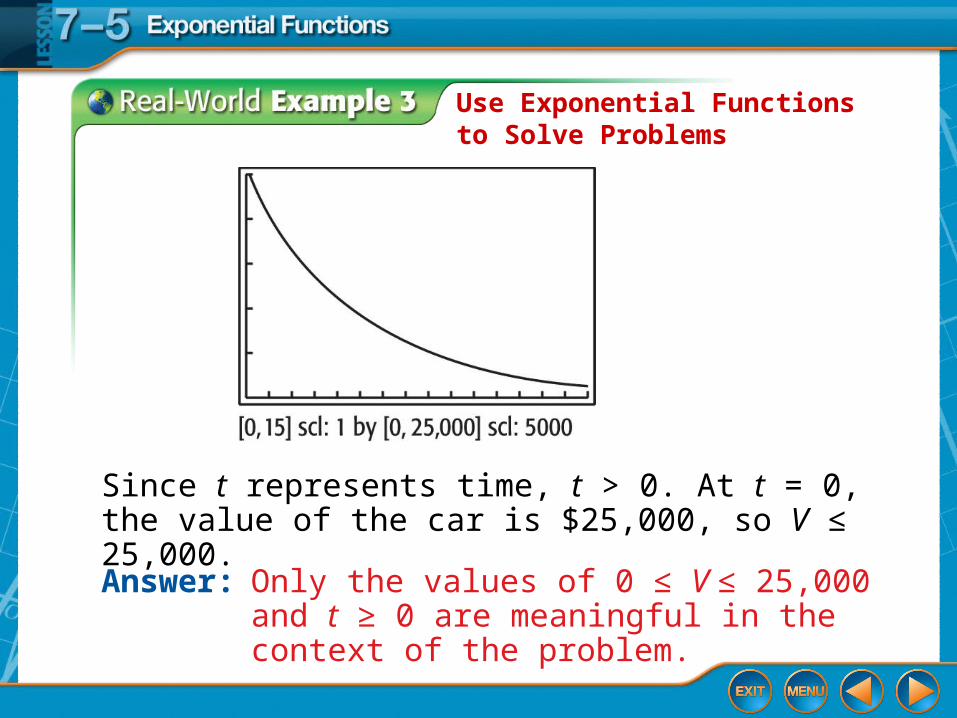
Answer: Only the values of 0 ≤ V ≤ 25,000 and t ≥ 0 are meaningful in the context of the problem.
Since t represents time, t > 0. At t = 0, the value of the car is $25,000, so V ≤ 25,000.
Use Exponential Functions to Solve Problems
B. What is the value of the car after five years?
V = 25,000 ● 0.82t Original equation
V = 25,000 ● 0.825 t = 5
V 9268 Use a calculator.
Answer: After five years, the car's value is about $9268.
A. B.
C. D.
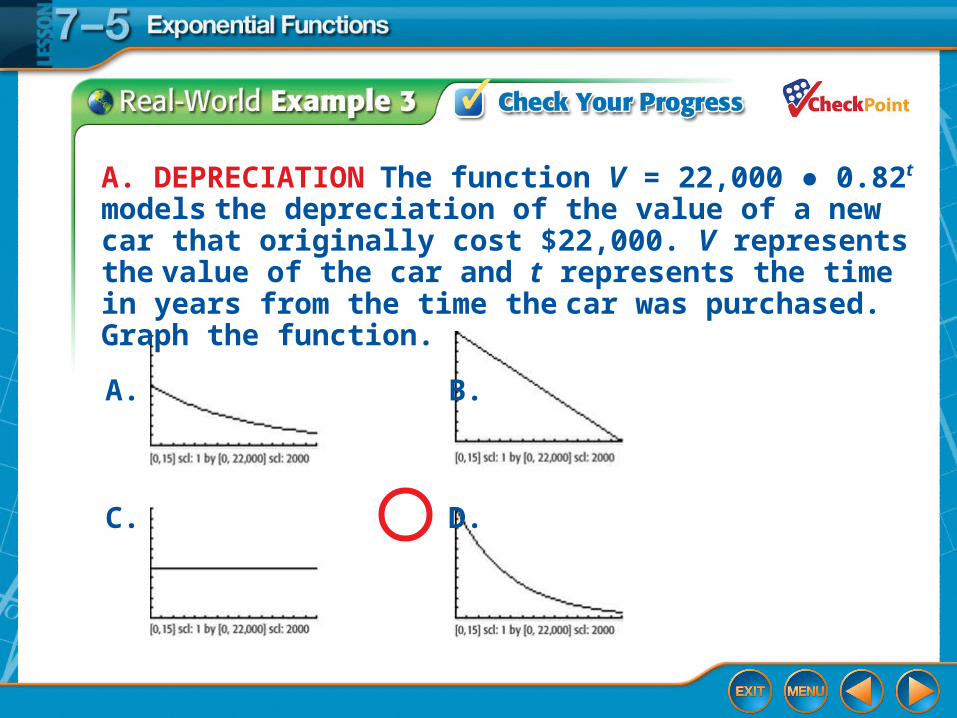
A. DEPRECIATION The function V = 22,000 ● 0.82t models the depreciation of the value of a new car that originally cost $22,000. V represents the value of the car and t represents the time in years from the time the car was purchased. Graph the function.
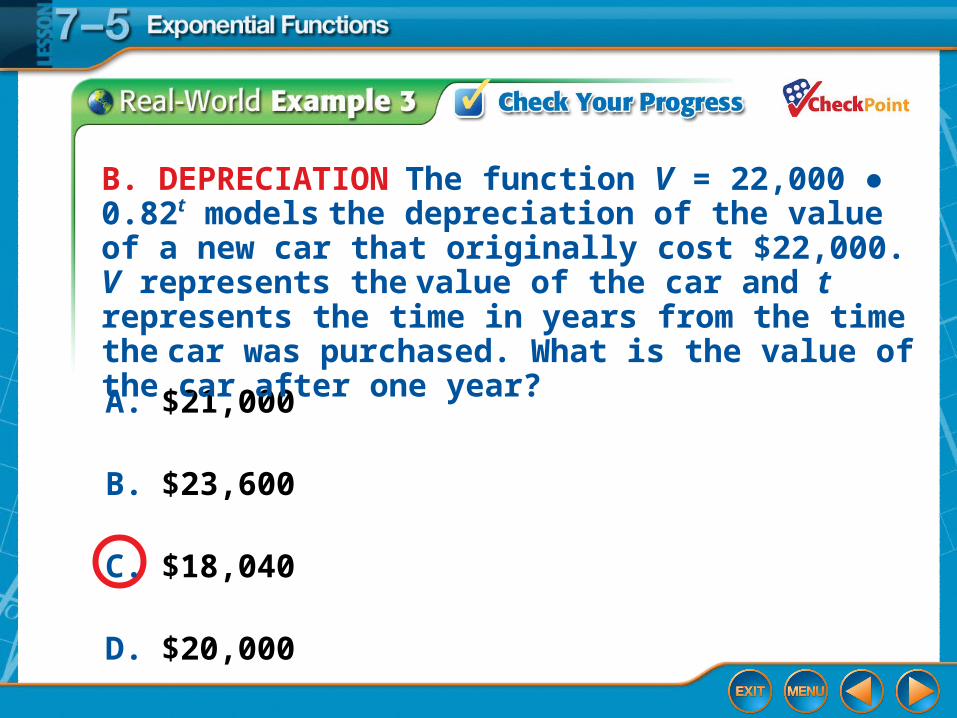
A. $21,000
B. $23,600
C. $18,040
D. $20,000
B. DEPRECIATION The function V = 22,000 ● 0.82t models the depreciation of the value of a new car that originally cost $22,000. V represents the value of the car and t represents the time in years from the time the car was purchased. What is the value of the car after one year?
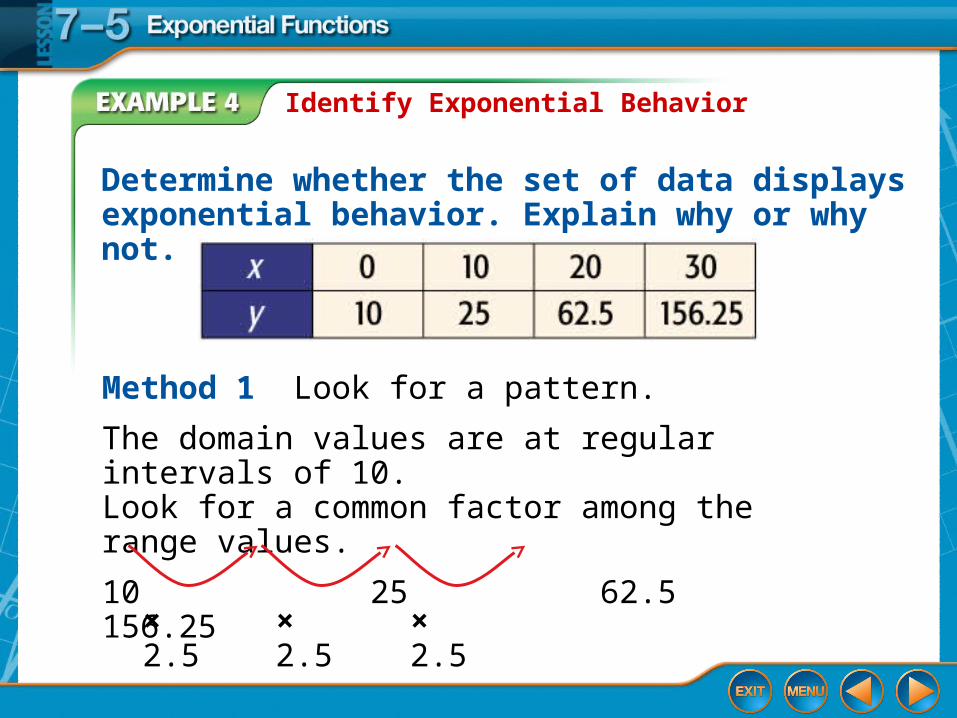
Identify Exponential Behavior
Determine whether the set of data displays exponential behavior. Explain why or why not.
Method 1 Look for a pattern.
The domain values are at regular intervals of 10. Look for a common factor among the range values.
10 25 62.5 156.25
× 2.5 × 2.5 × 2.5

Identify Exponential Behavior
Method 2 Graph the data.
Answer: The graph shows rapidly increasing values of y as x increases. This is a characteristic of exponential behavior.
Answer: Since the domain values are at regular intervals and the range values differ by a positive common factor, the data are probably exponential. The equation for the data may involve (2.5)x.
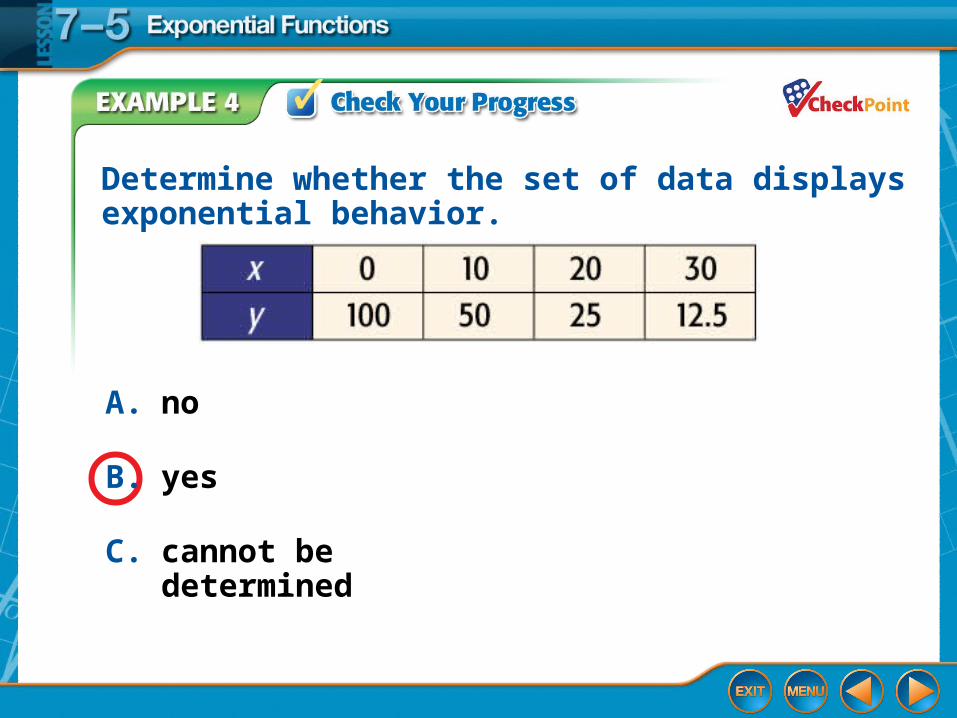
A. no
B. yes
C. cannot be determined
Determine whether the set of data displays exponential behavior.