spoken spanish language development at the high school
TRANSCRIPT

University of Nebraska - LincolnDigitalCommons@University of Nebraska - LincolnFaculty Publications: Department of Teaching,Learning and Teacher Education
Department of Teaching, Learning and TeacherEducation
2014
Spoken Spanish Language Development at theHigh School Level: A Mixed-Methods StudyAleidine Kramer MoellerUniversity of Nebraska–Lincoln, [email protected]
Janine TheilerLincoln (Nebraska) Public Schools
Follow this and additional works at: http://digitalcommons.unl.edu/teachlearnfacpub
Part of the Bilingual, Multilingual, and Multicultural Education Commons, Curriculum andInstruction Commons, Junior High, Intermediate, Middle School Education and TeachingCommons, and the Secondary Education and Teaching Commons
This Article is brought to you for free and open access by the Department of Teaching, Learning and Teacher Education atDigitalCommons@University of Nebraska - Lincoln. It has been accepted for inclusion in Faculty Publications: Department of Teaching, Learning andTeacher Education by an authorized administrator of DigitalCommons@University of Nebraska - Lincoln.
Moeller, Aleidine Kramer and Theiler, Janine, "Spoken Spanish Language Development at the High School Level: A Mixed-MethodsStudy" (2014). Faculty Publications: Department of Teaching, Learning and Teacher Education. 157.http://digitalcommons.unl.edu/teachlearnfacpub/157

Published in Foreign Language Annals 47:2 (2014), pp. 210-240; doi: 10.1111/flan.12085Copyright © 2014 by American Council on the Teaching of Foreign Languages published by John Wiley & Sons, Inc. Used by permission.Submitted February 23, 2014; accepted March 14, 2014.
Spoken Spanish Language Development at the High School Level: A Mixed-Methods Study
Aleidine J. Moeller1 and Janine Theiler2
1. Edith S. Greer Professor of Foreign Language Education, University of Nebraska–Lincoln
2. Spanish teacher, Lincoln Public Schools
AbstractCommunicative approaches to teaching language have emphasized the centrality of oral pro-ficiency in the language acquisition process, but research investigating oral proficiency has been surprisingly limited, yielding an incomplete understanding of spoken language devel-opment. This study investigated the development of spoken language at the high school level over five consecutive years, involving more than 1,500 students representing 23 school dis-tricts. Quantitative Standards-Based Measure of Proficiency speaking scores and student-pro-duced qualitative spoken samples (n > 6,000 samples) contributed to an understanding of the development of spoken language. Hierarchical linear modeling (HLM) revealed a consistent growth trajectory of spoken language development, and results indicated that 18–30% of the variance in student outcomes may be attributed to the teacher variable.
Keywords: classroom-based research, longitudinal study, mixed methods, oral language development
The rise of communicative language learning has led to widespread acceptance of com-municative competence as a primary goal of language education and, as such, cen-
tral to good classroom practice (Savignon, 1997). This approach to language instruction emphasizes the ability to communicate in a second language in real-life situations both inside and beyond the classroom. Instead of measuring language learning in terms of seat time, test scores, or number of credit hours, communicative skills are demonstrated through task-based communicative activities. As a result of this emphasis on oral com-munication, proficiency has emerged as central to communicative language learning and teaching. However, there is a lack of research at the classroom level that reveals what stu-dents are able to do with oral language after one, two, three, and four years of language
210
digitalcommons.unl.edu

S p o k e n S p a n i S h L a n g u a g e D e v e L o p m e n t a t t h e h i g h S c h o o L L e v e L 211
study. There is a paucity of research relating specifically to the development of spoken lan-guage at the secondary level (Tschirner & Hei-lenman, 1998). Although several studies have offered a glimpse of classroom-based profi-ciency ratings for the high school language learner (for examples, see Glisan & Foltz, 1998; Huebner & Jensen, 1992; Moeller & Reschke, 1993; Steinmeyer, 1984), the data have been strictly quantitative and have been conducted within educational systems with no consider-ation of related and potentially confounding factors, such as the teacher, during the explora-tion of oral language production.
Due to such limitations, as well as substan-tial differences in results, particularly at the be-ginning levels of language learning in second-ary classrooms, this study explored students’ progress toward proficiency over a period of 5 years using a combination of qualitative meth-ods, including thematic coding and organiza-tion, to reveal overarching trends in oral spoken language, and quantitative methods, includ-ing the Standards-Based Measurement of Pro-ficiency (STAMP) test, a teacher-independent, computer-mediated measure of oral language proficiency.1 Purposefully integrating mixed methods offers “a very powerful mix” (Miles & Huberman, 1994, p. 42) that develops “a com-plex” picture of oral language development (Greene & Caracelli, 1997, p. 7). In choosing this integrative data design, the researchers’ pur-pose was one of complementarity, a design ele-ment used to measure overlapping, but distinct, facets of a phenomenon under investigation (Caracelli & Greene, 1993). Results from one method—in this case, qualitative data—were used to enhance, illustrate, or clarify results from the other method—in this case, quantita-tive data (Greene & McClintock, 1985).
Quantitative research questions for this study investigated the growth trajectory of spoken Spanish over four consecutive years of high school Spanish learning. Quantitative questions also delved into the variance in spo-ken production scores that was attributable to
teacher differences or individual student dif-ferences. In addition, a qualitative analysis of students’ speech samples was also carried out using a rubric that was developed to quan-tify particular aspects of the raw speech sam-ples and thus create more detailed learner profiles and illustrate a range of language pro-duction. These data helped clarify and build upon the quantitative findings in order to es-tablish a depth of understanding of spoken lan-guage production at specific intervals during language learning—specifically, at the end of years one, two, three, and four.
Literature Review
This overview of previous research addresses stated performance expectations, as well as con-tributions and limitations of existing studies in-vestigating oral language production and profi-ciency. A brief overview of the value added of mixed methodology is also addressed.
Oral Language Production and Proficiency
What can students truly achieve with con-secutive years of language study? According to the performance guidelines issued by ACTFL (1998), after four consecutive years of second language study, teachers should expect stu-dents to perform at the Intermediate Low level of language proficiency. While ACTFL pro-vides this fairly clear-cut expectation for oral proficiency, the research literature at both the secondary and postsecondary levels presents a broader range of expectations for oral profi-ciency development.
Much of the research literature concerning oral proficiency has used ACTFL’s Oral Profi-ciency Interview (OPI) to determine what stu-dents can achieve with consecutive years of language study. At the college level, the most recognized studies explored the first through fourth year of language study in German, French, and Russian. Magnan (1986), Dugan

212 m o e L L e r a n D t h e i L e r i n F o r e i g n L a n g u a g e a n n a L s 47 (2014)
(1988), Kaplan (1984), and Freed (1987) ex-plored the development of French oral profi-ciency, indicating levels ranging from Novice High to Intermediate Mid after 1 year of study and Intermediate Mid to Advanced levels af-ter 4 years of study. Thompson (1996) reported that one year of postsecondary Russian learn-ing yielded a Novice Mid level of proficiency, and four consecutive years of study produced Intermediate High to Advanced levels of pro-ficiency. Tschirner (1992, 1993) worked with German language learners and determined that 2 years of college-level German language study typically yielded Intermediate Mid lev-els of oral proficiency. More recently, Tschirner and Heilenman (1998) conducted a study of postsecondary learners after four semesters of German instruction, with 25% of the students scoring Novice High, 45% Intermediate Low, and 30% Intermediate Mid (p. 153). In addi-tion, Tschirner and Heilenman detected no cor-relation between students’ OPI outcome and the length of instruction, nor was there a cor-relation between the OPI score and student background variables. The range of proficiency outcomes among these studies and the lack of correlation between proficiency outcome and seat time may be surprising in light of the com-monly held expectation that four consecutive semesters of college instruction, presumed to approximate 4 years of instruction at the high school level, should yield Intermediate Low levels of proficiency (ACTFL, 1998). Tschirner and Heilenman concurred: “Reaching the In-termediate Low level is a greater achievement than previously thought” (p. 154).
At the high school level, the most recog-nized studies explored primarily the second through fifth years of language study. Stein-meyer (1984) examined German OPIs (n = 25) administered after 2, 3, 4, and 5 years of in-struction and discovered OPI ratings ranging from Novice Mid (second year) to Advanced (fifth year). Huebner and Jensen (1992) admin-istered OPIs to French, German, and Spanish language learners after 2, 3, 4, and 5 years in
a secondary school. They found that beginners (second year) averaged Novice Mid to Novice High proficiency, and more advanced learn-ers (fifth year in French and Spanish) aver-aged Advanced level of language proficiency. Moeller and Reschke (1993) presented one of the few studies addressing the first year of lan-guage learning, reporting the results of OPIs after 1 and 2 years of junior high German in-struction. They found that first- and second-year German learners who averaged 240 min-utes of instruction per week both achieved a mean proficiency level of Novice High.
Glisan and Foltz (1998) conducted a statis-tical analysis of language competency of sec-ond- and fourth-year high school learners of Spanish. Fifty students from two schools par-ticipated, and OPI ratings for second-year students ranged from Novice Mid to Nov-ice High. The mean oral proficiency rating for fourth-year students approached Intermedi-ate Low, but 30% of the participants in fourth-year Spanish did not attain Intermediate Low levels, again emphasizing that attaining Inter-mediate Low after four consecutive years of study may be more difficult than previously thought (Glisan & Foltz, 1998, p. 9). Norris and Pfeiffer (2003) examined results of 100 SOPI (Simulated Oral Proficiency Interview) tests administered to all levels of instruction in a university German department and con-cluded that the “recommended proficiency standards may underestimate the potential and actual achievement of German language learners” (p. 572).
When analyzing this range of proficiency outcomes for students with similar temporal sequences of instructional experiences, it is im-portant to recognize what Magnan (1986) re-ferred to as bands of proficiency that overlap from one year/level to the next. These ranges of proficiency within levels of language learn-ing and the year-spanning bands of proficiency remind educators of the individualized nature according to which students proceed along the continuum of language proficiency.

S p o k e n S p a n i S h L a n g u a g e D e v e L o p m e n t a t t h e h i g h S c h o o L L e v e L 213
The Need for More Than Solely Oral Proficiency Scores
The aforementioned studies offered only proficiency scores as a means of exploring oral language production, and these overarching proficiency scores are indeed valuable in un-derstanding the general growth of the learner; however, such scores are not sufficient in and of themselves to improve instruction and student learning. Kunnan and Jang (2011) and Long (2011) argued for a forward-looking approach in testing that incorporates diagnostic feedback into achievement and proficiency testing. Alder-son, Clapham, and Wall (1995) pointed out that such diagnostic feedback should “identify those areas in which a student needs further help … whether a student needs particular help with one of the four major language skills” (p. 12). Thus while proficiency scores are helpful, what one may learn from and subsequently accom-plish with a proficiency score is quite limited. A holistic proficiency assessment as well as a diag-nostic skills-based assessment are both needed in order to better understand the development of language production. Both a trajectory of lan-guage growth as well as a more detailed review of skills acquired over time can provide valu-able feedback for the teacher and student to im-prove learning and instruction. Unlike previ-ous studies, this longitudinal study allowed for tracking of language skills as well as develop-ment of oral language production.
The Need for Mixed-Methods Research Design
Mixed-methods studies involve the inte-gration and mixing of two strands of quantita-tive and qualitative data “for the purposes of breadth and depth of understanding and cor-roboration” (Johnson, Dnwuegbuzie, & Turner, 2007, p. 123) the sum of which is greater than ei-ther approach alone. Creswell and Plano Clark (2011) defined a mixed-methods convergent de-sign as a specific mixed-methods model that en-ables the researcher to “compare and contrast
quantitative statistical results with qualitative findings or to validate or expand quantitative results with qualitative data” (p. 62).
In this convergent data transformation mixed-methods design, researchers converted qualitative data into quantitative data, engaged in statistical data analyses, and returned to the original data set in order to facilitate increased understanding (see Bachman, Lynch, & Ma-son, 1995, for examples from the language as-sessment field; also see Caracelli & Greene, 1993; Creswell & Plano Clark, 2011; Sande-lowski, Voils, & Knafl, 2009). A convergent mixed-methods design with data transforma-tion (Creswell & Plano-Clark, 2011) allowed the researchers to quantitatively show the trajectory of language learning over time, while the qual-itative data—that is, student-produced oral lan-guage—provided language samples over time.
Thus, based on the review of prior related re-search, it is clear that (1) existent oral language development studies have been largely limited to short-term quantitative studies conducted primarily at the postsecondary level with small samples, (2) there is a need for more detailed descriptions of language development beyond numerical proficiency scores, and (3) a mixed-methods approach provides a deeper and more comprehensive understanding of the develop-ment of spoken language for the beginning high school language learner.
The specific research questions were:
1. What is the four-year growth trajectory of students’ spoken Spanish skills?
2. What percentage of the variance in student speaking scores can be attributed to the re-spective Spanish teachers and to differences among the individual students?
3. What kinds of language can students pro-duce at different stages and levels of lan-guage study?
4. How do the qualitative data from spoken samples enhance or provide a more com-plete picture of the quantitative results of spoken language development?

214 m o e L L e r a n D t h e i L e r i n F o r e i g n L a n g u a g e a n n a L s 47 (2014)
Methods
Study Design
Researchers adopted a convergent data trans-formation mixed-methods design for this study. The raw data consisted of (1) quantitative holis-tic oral production scores assigned by an exter-nal independent rater, and (2) qualitative speak-ing samples produced by students during the administration of an online teacher-indepen-dent test (STAMP). Hierarchical linear mod-eling (HLM) of quantitative data produced an overarching holistic depiction of spoken lan-guage development. Concurrently, analysis of student speech samples led to the development of a qualitative rubric, which then allowed for further quantification of samples (see Appendix A). HLM analysis of the resulting quantified de-tail-specific data addressed the underlying na-ture of oral language development. Finally, in an effort to concretely represent statistical find-ings in this study, researchers capitalized on the clarity afforded through authentic exemplars and descriptions situated in the original qualita-tive data set and rubric. This final step resulted in the production of learner profiles, consisting of qualitative raw speech samples and qualita-tive rubric descriptors interwoven with quanti-tative holistic results from the STAMP test and quantitative detail-specific results (from the ru-bric). The overarching procedures might be de-picted as: {[QUAN + (QUAL → QUAN)] + qual}. Figure 1 is a visual representation of the analy-sis process and also depicts the progression uti-lized to concretely and comprehensively pres-ent the findi
Participants
A purposive sample of teachers was recruited for the study, allowing researchers to follow the same students and teachers for several years in an attempt to reduce the impact of external vari-ables often associated with conventional cohort studies. Between 2005 and 2010, researchers re-cruited 21 teacher-participants and their 1,544
individual students. These 21 teachers repre-sented 23 urban and rural school districts in the state of Nebraska, including 19 public and four parochial schools of varying sizes.
In each year of the study, the sample grew in diversity and size as new language teachers were recruited and new students were added to the original first-year cohort. In addition, a number of participants were lost to attrition as teachers or students left the program or moved out of their school district. As a result of longi-tudinal tiered recruitment and attrition, the fi-nal dataset included all students at all levels of Spanish, some of whom were followed for mul-tiple consecutive years and some of whom par-ticipated for only a portion of their Spanish learning experience. Data on the total set of par-ticipants are presented in Table 1.
Measures
Data were gathered using STAMP. This on-line adaptive assessment tool served as the source of both quantitative and qualitative data for this study. STAMP, a statistically validated, realia-based, and textbook-independent as-sessment, produces a comprehensive score for proficiency in reading, writing, and speaking (Avant Assessment, 2008). A factor integral in choosing the STAMP test for this study was its online archival capability that allowed research-ers to access the approximately 6,000 speak-ing samples produced by student-participants during the assessment (see Profiles in Appen-dices B and C for examples of qualitative sam-ples). Appendix B reveals the language pro-gression of the same student over 3 years of language study. The speaking prompts as they appeared in the STAMP test are provided as well as a qualitative analysis of the student sam-ples based on the rubric in Appendix A. Appen-dix C provides a snapshot of student variation in speech production among students enrolled in second-, third-, and fourth-year Spanish. This table makes transparent the wide deviations among student speech products enrolled in the same level of language study.

S p o k e n S p a n i S h L a n g u a g e D e v e L o p m e n t a t t h e h i g h S c h o o L L e v e L 215
There were five dependent variables in the study: holistic speaking score, pronunciation, grammar, vocabulary, and fluency. The holistic score for speaking production was assigned at the end of each academic year as students en-gaged in the STAMP test and received a score from external, trained raters (Avant Assess-ment, 2008). The remaining indexes (pronun-ciation, grammar, vocabulary, fluency) were
assigned during the transformation of the qual-itative data.
Qualitative Data Analysis and Transformation (QUAL→QUAN)
In this study, a research team consisting of 10 members—six Spanish language experts and four language researchers—developed the
Figure 1. Research Procedures for Convergent Transformation Mixed-Methods Study. (Based upon design and mapping principles as addressed in Creswell and Plano Clark, 2011).
Table 1. Overview of Study Sample
2005 2006 2007 2008 2009 2010
Total number of student-participants 106 394 527 484 331 2951st-year students 80 270 186 49 173 1662nd-year students 13 123 307 261 71 863rd-year students 13 1 34 158 37 174th-year students NA NA NA 16 51 26

216 m o e L L e r a n D t h e i L e r i n F o r e i g n L a n g u a g e a n n a L s 47 (2014)
rubric that was based solely on student oral pro-duced samples and that guided the transforma-tion of STAMP speaking samples into a series of detail-specific quantitative proficiency-related scores. This speaking rubric was an integral tool for this study, as it allowed for an in-depth anal-ysis of specific attributes of student speaking (pronunciation, grammar, vocabulary, and flu-ency). Development of the speaking rubric in-volved three steps of qualitative analysis of the student speaking samples as outlined below.
Step 1: Identify Emergent ThemesThe six Spanish language experts conducted
a qualitative analysis of 30 speech samples that were representative of all four levels of Span-ish instruction. Each reviewer independently sorted all 30 samples into overarching catego-ries (exceeds expectations, meets expectations, or in progress) of speaking quality. This pro-cess was conducted without knowledge of the STAMP proficiency score to avoid a bias in sort-ing. The research team met to discuss the factors that each individual considered when sorting the samples, and a pattern of shared attributes began to emerge. Researchers thus determined a need for a common coding system to repre-sent the thematic attributes specific to student-produced speaking samples.
Step 2: Refine Emergent ThemesThe members of the research team subse-
quently independently analyzed 30 additional student samples, with each team member pro-ducing codes to describe specific attributes of student speaking. The team again assembled, discussed the independently produced descrip-tors, combined similar descriptors, and elim-inated redundancies. Members refined the emergent themes into four specific thematic categories that were common across speaking quality levels but that differed in degree and complexity: pronunciation, grammar, vocabu-lary, and fluency.
Step 3: Define Refined ThemesFinally, the members of the research team
worked to establish agreed-upon descriptive terminology within each of the four categories (pronunciation, grammar, vocabulary, fluency) for each level of quality (exceeds expectations, meets expectations, and in progress). This was done in the same manner as the previous two phases of rubric development, each of the six language experts working independently fol-lowed by sharing and discussion.
The final version of the rubric can be found in Appendix A. This rubric was subsequently applied to each of the 6,000 qualitative sam-ples that were archived during the STAMP test-ing process. Students receiving a score of 3 in each category were described as exceeding ex-pectations, a score of 2 indicated that students met the expectations, and a score of 1 indicated that students were progressing toward meeting the expectations. For example, a student scor-ing 3 in all categories (pronunciation, grammar, vocabulary, fluency) might be described as one who could create speaking samples that demon-strated logically developed ideas; correct word order; and speaking style appropriate to the task, text type, and speaking venue. Such a stu-dent could maintain control of sentence struc-ture and show appropriate use of definite and indefinite articles, pronouns, verbs, number and gender agreement, possessive adjectives, and prepositions. Minimal errors might occur in the student’s speaking samples, but these errors would not interfere with comprehensibility. The student would demonstrate creative use of vo-cabulary, which is beyond basic requirements, and appropriately use idiomatic expressions. The overall response of a student who exceeded expectations in foreign language speaking was creative and comprehensible, revealed mini-mal evidence of interference from the first lan-guage, made use of appropriate rejoinders, and provided information beyond the basic require-ments. A narrative depicting a student meet-ing expectations or in progress might be devel-oped through similar application of descriptors found in the speaking rubric.
Before scoring any samples, the six Span-ish language experts worked cooperatively to

S p o k e n S p a n i S h L a n g u a g e D e v e L o p m e n t a t t h e h i g h S c h o o L L e v e L 217
identify exemplars that might help guide the rating process. They next independently rated 30 additional samples to test for interrater reli-ability, which was established at 0.83. The lan-guage experts subsequently scored all 6,000 student samples according to the speaking ru-bric. This rubric-based scoring procedure trans-formed the qualitative speaking samples into quantitative data specific to the four skill areas addressed in the rubric.
Quantitative Data Analysis
The type of design underlying this study generally involved the concurrent but separate analysis of data related to the same phenome-non, with the results being merged during the interpretation phase of research (Creswell & Plano Clark, 2011). With the qualitative data transformed into quantitative scores (QUAL → QUAN), the next step for researchers consisted of an in-depth statistical analysis of all available quantitative data (QUAN + QUAL = [QUAL → QUAN]). HLM and descriptive analyses were conducted with all quantitative data.
In this study, researchers desired to make repeated measures representing Spanish learner growth while accounting for the nested learning structure; thus HLM was adopted, as it captures measurement occasions within a nested structure. In this study, these measure-ment occasions (lower-level or level 1) were nested within students (higher-level or level 2). These students (level 2) were then nested within teachers (the highest level, or level 3). Proc Glimmix in Statistical Analysis Soft-ware (SAS 9.2) facilitated the HLM analyses. For each dependent variable, researchers es-tablished the best-fit model through a series of unconditional and conditional models. For all models, restricted maximum likelihood was used for any missing data under the assump-tion of missing at random and with Satterth-waite approximation for degrees of freedom.
Researchers employed HLM to (1) deter-mine growth in speaking production across 4 years of Spanish language learning at the high
school level, (2) predict change for each of the speaking variables, and (3) account for variance in student scores as a function of the classroom teachers and individual students. This longitu-dinal collection of data from students gave rise to a three-level HLM to describe the change in speaking for those enrolled in Spanish. This model can be depicted as:
(STAMP Speaking)ijk = (α000 + U0ij + V0i) +
(β000) * (Level Spanish) + eijk
In this equation, α000 represents the fixed in-tercept, U0ij represents the intercept difference or deviation for a specific teacher, V0i represents the intercept difference or deviation for a spe-cific student, β000 represents the slope, and eijk represents the error. In this model, “Level Span-ish” represents time, spanning from 1 (repre-senting the first year of Spanish study) to 4 (rep-resenting the fourth year of Spanish study). The slope describes the change in speaking score performance over time (levels of Spanish).
To build a model in HLM, researchers began with a basic, or empty, model, which aimed to reveal variance in the absence of specific pre-dictors. In this case, the empty model focused on spoken language development independent of time as a predictive variable. A three-level empty model (random intercept only) was fit-ted for each dependent variable (STAMP speak-ing, pronunciation, grammar, vocabulary, and fluency). The three levels in this model repre-sented the teacher (level 3), the student (level 2), and measurement occasion (level 1).
Results
The descriptive statistical results, one based on the STAMP ratings and the second based on the rubric, are depicted in Tables 2 and 3. The difference in sample size between Tables 2 and 3 is due to a small sample of students whose STAMP data were deemed not ratable by the STAMP raters; however, in spite of the poor recording quality, raters on the research team were still able to analyze these data.

218 m o e L L e r a n D t h e i L e r i n F o r e i g n L a n g u a g e a n n a L s 47 (2014)
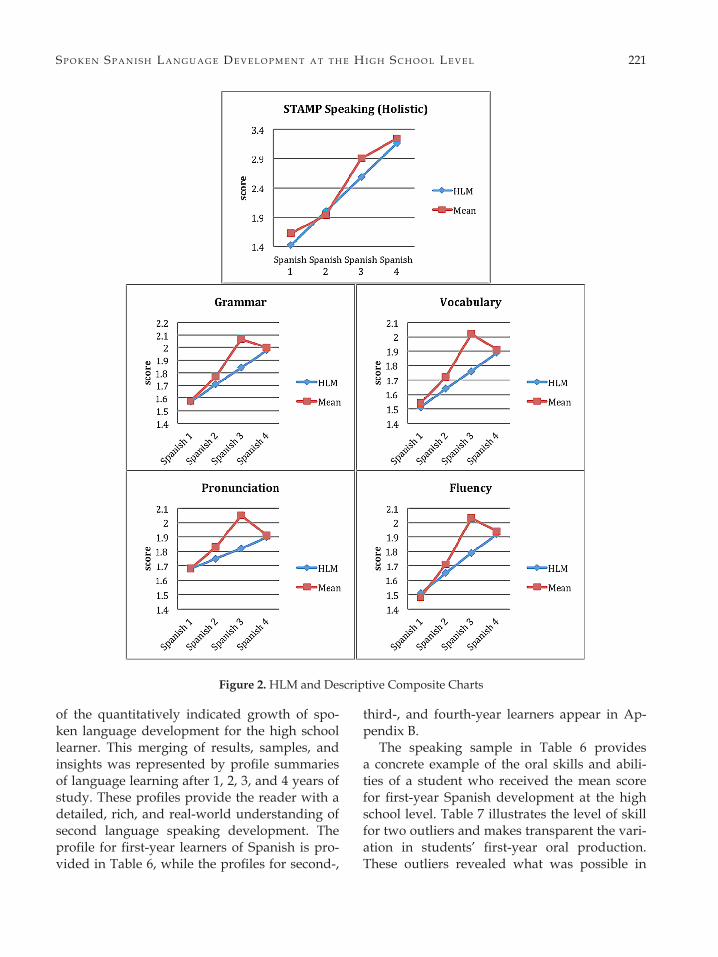
As shown in Table 2, the STAMP holistic speaking score mean increased with each year of instruction, with the third year of study rep-resenting the largest gain in speaking profi-ciency. These consistent growth trends were not completely consistent when looking at the underlying details of student speaking repre-sented in the speaking rubric variables of pro-nunciation, grammar, vocabulary, and fluency, reported in Table 3. While there remained a consistent increase in mean scores from the first through third year of study for all variables (0.37–0.55 increase), there was a decrease in all of the detail-specific variables in the fourth year of study (0.07–0.14 decrease).
Longitudinal collection of data from students gave rise to a three-level HLM to describe the change in speaking for those enrolled in Span-ish. Table 4 reveals the variance in student speaking outcomes that was attributable to stu-dents and to teachers. Residual within-teacher
variance in Table 4 points to classroom teach-ers being accountable for 17.9% of the variance for STAMP holistic speaking, 22.5% of the vari-ance for pronunciation scores, 24.1% of the vari-ance for grammar scores, 29.4% of the variance for vocabulary scores, and 26.7% of the vari-ance for fluency scores. Residual within-student variance also indicated that individual students were accountable for variance in scores, and the variance attributable to students was similar to the variance attributable to teachers. Residual in-student variance was calculated by referring to Table 4 and subtracting residual in-teacher from residual in-student in-teacher. Per this cal-culation, differences among individual students accounted for 16.4% of the STAMP speaking score variance, 21.6% of the variance in pronun-ciation scores, 24.2% of the variance for gram-mar scores, 18.8% of the variance in vocabu-lary scores, and 26.5% of the variance in fluency scores.
Table 2. Mean and Standard Deviation of STAMP Holistic Speaking Scores
n x̄ sd
1st-year Spanish 827 1.63 0.762nd-year Spanish 756 1.94 0.803rd-year Spanish 250 2.91 0.724th-year Spanish 93 3.25 0.56
Table 3. Mean and Standard Deviation of Speaking Attribute Scores
n Pronunciation Grammar Vocabulary Fluency
x̄ sd x̄ sd x̄ sd x̄ sd
1st-year Spanish 830 1.68 0.48 1.58 0.52 1.54 0.50 1.48 0.512nd-year Spanish 756 1.82 0.45 1.77 0.52 1.72 0.52 1.71 0.523rd-year Spanish 253 2.05 0.44 2.07 0.50 2.02 0.50 2.03 0.484th-year Spanish 93 1.91 0.39 2.00 0.44 1.91 0.42 1.94 0.49

S p o k e n S p a n i S h L a n g u a g e D e v e L o p m e n t a t t h e h i g h S c h o o L L e v e L 219
Interestingly, including the random slope at the student level did not improve the model fit for STAMP speaking variables. Thus, the baseline model for student speaking variables did not include random slope. Table 5 repre-sents the baseline model for the four speaking variables of interest in this study. The condi-tional model revealed the trajectory for student growth in speaking production over four years of language study. According to the condi-tional model, students were predicted to pro-duce a STAMP holistic speaking proficiency score of 1.43 after the first year of study, and this score would increase by 0.58 with each ad-ditional year of study. When considering pro-nunciation, students would score 1.68 after one year of study. The conditional model suggested that students would score 1.57 (meets expecta-tions) on the grammatical accuracy measure and would continue to improve by 0.13 1
points with each subsequent year of study. The vocabulary score would be 1.51 following
one year of study, and this score would increase by 0.13 with each additional year of study. For fluency, one year of study was predicted to yield a score of 1.51, and additional years would increase this by 0.13.
It is noteworthy to merge the descriptive and HLM results and consider the similarities and differences. Figure 2 presents composite graphs to indicate how the HLM model fit the data. These graphs indicate that both the ag-gregate mean results and the HLM results ex-hibited a similar pattern. Of note, however, is the deviation in this pattern of growth during the fourth year of study according to descrip-tive statistics.
While the quantitative analysis and findings alone produced an in-depth look into the de-velopment of student speaking proficiency, re-searchers elected to return to the qualitative data to provide an enhanced representation of the quantitative results. This step represented an effort to provide a concrete representation
Table 4. Random Effects for Empty Models and Intraclass Correlation
STAMP Pronunciation Grammar Vocabulary Fluency speaking
Random intercept 0.145 0.053 0.076 0.057 0.083 variance at student level (level 2)
Random intercept 0.158 0.055 0.076 0.089 0.083 variance at teacher level (level 3)
Residual variance 0.580 0.137 0.163 0.157 0.146 (level 1)
ICC Residual 0.343 0.441 0.483 0.482 0.532 in-student in-teacher Residual 0.179 0.225 0.241 0.294 0.267 in-teacher Student 0.522 0.509 0.50 0.610 0.500 in-teacher

220 m o e L L e r a n D t h e i L e r i n F o r e i g n L a n g u a g e a n n a L s 47 (2014)
Tabl
e 5.
Par
amet
er E
stim
ates
and
Mod
el F
it St
atis
tics
for F
inal
Con
ditio
nal M
odel
s
Para
met
ers
STA
MP
Spea
king
Pr
onun
ciat
ion
G
ram
mar
Voc
abul
ary
F
luen
cy
E
stim
ate
SE
p va
lue
Es
timat
e SE
p
valu
e
Estim
ate
SE
p va
lue
Es
timat
e SE
p
valu
e
Estim
ate
SE
p va
lue
Fixe
d ef
fect
s
Inte
rcep
t 1.
43
0.08
<
0.00
01
1.68
0.
07
< 0.
0001
1.
57
0.06
<
0.00
01
1.51
0.
06
< 0.
0001
1.
51
0.06
<
0.00
01
Leve
l of S
pani
sh
0.58
0.
02
< 0.
0001
0.
07
0.01
<
0.00
01
0.13
0.
01
< 0.
0001
0.
13
0.01
<
0.00
01
0.14
0.
01
< 0.
0001
Rand
om e
ffect
s
Resi
dual
var
ianc
e 0.
32
0.02
0.14
0.
01
0.
16
0.01
0.15
0.
01
0.
15
0.01
Inte
rcep
t var
ianc
e BW
T 0.
12
0.04
0.05
0.
02
0.
06
0.02
0.07
0.
03
0.
07
0.02
Inte
rcep
t var
ianc
e BW
S 0.
20
0.02
0.05
0.
01
0.
07
0.01
0.05
0.
01
0.
07
0.01
Mod
el fi
t
AIC
4203
.85
2272
.55
2637
.00
2451
.93
2518
.88
BIC
4206
.98
2275
.68
2640
.14
2455
.06
2522
.02
Num
ber o
f par
amet
ers
7
7
7
7
7
SE =
stan
dard
err
orBW
T =
betw
een
teac
hers
BWS =
bet
wee
n st
uden
tsA
IC =
Aka
ike
info
rmat
ion
crite
rion
BIC
= B
ayes
ian
info
rmat
ion
crite
rion
S p o k e n S p a n i S h L a n g u a g e D e v e L o p m e n t a t t h e h i g h S c h o o L L e v e L 221
of the quantitatively indicated growth of spo-ken language development for the high school learner. This merging of results, samples, and insights was represented by profile summaries of language learning after 1, 2, 3, and 4 years of study. These profiles provide the reader with a detailed, rich, and real-world understanding of second language speaking development. The profile for first-year learners of Spanish is pro-vided in Table 6, while the profiles for second-,
third-, and fourth-year learners appear in Ap-pendix B.
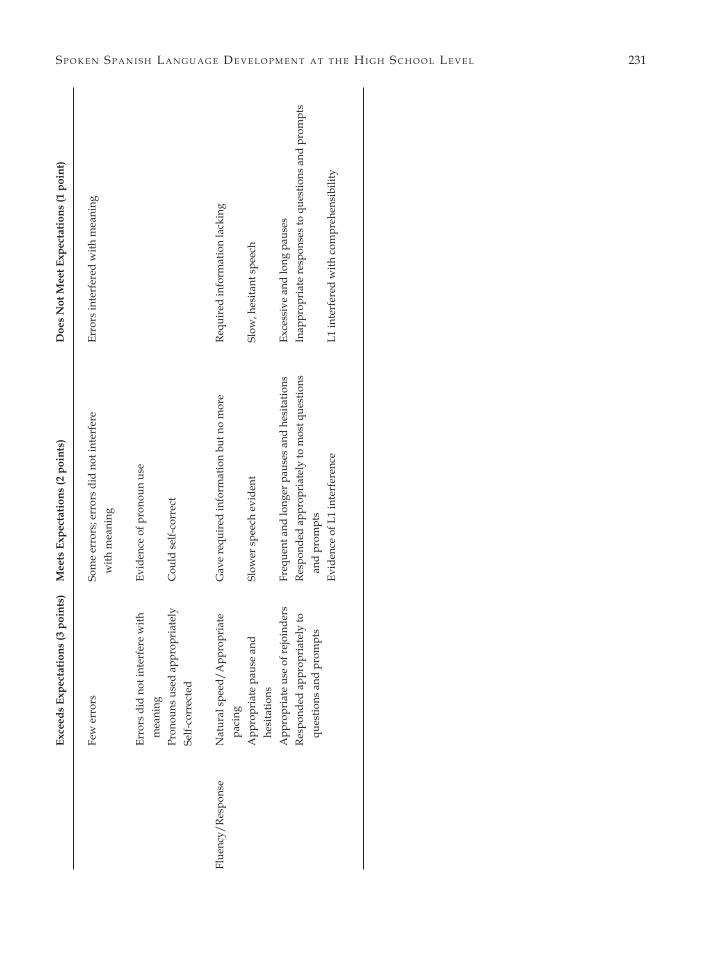
The speaking sample in Table 6 provides a concrete example of the oral skills and abili-ties of a student who received the mean score for first-year Spanish development at the high school level. Table 7 illustrates the level of skill for two outliers and makes transparent the vari-ation in students’ first-year oral production. These outliers revealed what was possible in
Figure 2. HLM and Descriptive Composite Charts

222 m o e L L e r a n D t h e i L e r i n F o r e i g n L a n g u a g e a n n a L s 47 (2014)
Example Prompt
Authentic Student Product
Pronunciationx̄ = 1.68
Qualitative Rubric DescriptorsLargely incomprehensibleAnglicized accent, intonation,
and word stress.Began to sound accurate.Could use appropriate word
stress.Could imitate target language
sounds.English sounds were
occasionally used.
Grammar x̄ = 1.58
Qualitative Rubric DescriptorsMisuse of verbs Number and gender
agreement misappliedDefinite and indefinite
articles absent or confusedLack of subject/verb
agreementWord order was anglicized
and message was obscured
Errors interfered with meaning
Select one of the pictured rooms and describe at least three common or typical activities that occur in this room on a daily basis. Be as detailed as possible and speak using complete sentences.
Mi madre y yo comemos … con mi hermano, mi hermana, mi tía, mi tío y … mi padre. Mi madre cocina en la cocina con naranjas, pollo, bistec y cereales… . La canter es blanco con negro canters. La glase es blanco.
Exemplar score = 2
Analysis of Student SampleAn L1 interference accent was evident but still comprehensible. The
pronunciation was beginning to sound accurate, and some target language Anglicized accent, intonation, sounds were imitated. The intonation, word stress, and accent were anglicized and demonstrated L1 interference.
Exemplar score = 1
Qualitative Analysis of Student SampleThe grammar structure demonstrated mostly appropriate use of
verbs. There was no evidence of gender or number agreement or correct definite or indefinite article usage. The evidence of incorrect definite article usage and gender agreement occurred with the L1 interference of vocabulary. For example, “La canter es blanco…” and “La glase es blanco.” Based on the context of the response, the word canter refers to the English word “counter,” and the word glase refers to the English word “glass.” Regardless of these vocabulary errors, the definite articles were incorrect as well as the gender agreement with the word blanco based on the articles given. Evidence of number disagreement and adjective placement was present in negro canters. The L1 interference can explain both the vocabulary error as well as the adjective placement error. Basic subject/verb agreement and appropriate pronoun use was evidenced. The word order at times was anglicized, but the message was communicated. The errors made did not interfere with overall meaning in the response.
Table 6. First-Year Spanish Speaking Profile

S p o k e n S p a n i S h L a n g u a g e D e v e L o p m e n t a t t h e h i g h S c h o o L L e v e L 223
Vocabulary x̄ = 1.54
Qualitative Rubric DescriptorsLimited/common/basic
vocabulary Predominant single-word
utterances Less than minimum word.
requirementsMuch repetition of select
words
Fluency x̄ = 1.48
Qualitative Rubric DescriptorsRequired information lacking Slow, hesitant speech Excessive and long pausesInappropriate responses to
questions and promptsL1 interfered with
comprehensibility Gave required information but no more
Exemplar score = 1
Qualitative Analysis of Student sampleThe vocabulary was limited, and there was repetition of select words.
The minimum word requirements were not met as only two common daily activities that occur in the room were mentioned. The limited scope of vocabulary and L1 interference caused the sample to be disconnected and needed to be decoded.
Exemplar score = 1
Qualitative Analysis of Student sampleOnly the required information was given. The speech was slow,
hesitant at times, indicating the internal thought process. There were frequent and longer pauses and hesitations. The sample responded appropriately to the prompt with the exception of the missing daily activity. There was some L1 interference in word order and anglicized grammar, but this did not interfere with the overall meaning.
224 m o e L L e r a n D t h e i L e r i n F o r e i g n L a n g u a g e a n n a L s 47 (2014)
comparison to the mean student profile. Sec-ond-, third-, and fourth-year examples are found in Appendix C.
Discussion and Implications
This study explored the development of oral Spanish language production based on 6,000 archived speech samples over 4 years of high school language instruction. The findings pro-vided a holistic profile of student growth, de-scriptive details underlying that growth, the identification of factors related to that growth, student profiles representing annual mean growth outcome, and student profiles repre-senting growth variation within years of Span-ish language learning.
HLM revealed growth expectations across four consecutive years of language learn-ing. According to the most recently published ACTFL Performance Descriptors for Language Learners (2012), teachers can expect students to produce language at the Intermediate Low
level after four consecutive years of high school language learning. While STAMP test results are related to, rather than equivalent to, the ACTFL Proficiency Guidelines (Avant Assess-ment, 2008), it is nevertheless interesting to note findings in light of ACTFL expectations for pro-ficiency outcomes. According to the HLM anal-ysis for this study, 4 years of language learn-ing resulted in a STAMP score of 3.17, a score that relates to the ACTFL proficiency level of Novice High (3 = Novice High). This contrasts with ACTFL’s stated expectation that learners reach Intermediate Low after 4 years of study. HLM analysis indicated an outcome of 2.01 af-ter two consecutive years of study, which re-lates to the ACTFL’s Novice Mid level of pro-ficiency (2 = Novice Mid). Again, this is slightly lower than what is stated by ACTFL’s (1998) expressed Novice High expectation for the stu-dent with two consecutive years of language learning. Based on these findings, it is recom-mended that additional research be directed at exploration into proficiency outcomes at the high school level.
Table 7. First-Year Spanish Student Sample Variation
Category x̄ Sample Score Me gusta es shrimp porque es deliciosoooo. Me gusta … mmm … me Pronunciation 1.68 1 gusta fidero fijitas as es delicioso … me gusta tacos delicioso. Grammar 1.58 2 Vocabulary 1.54 1 Fluency 1.48 1
Category x̄ Sample Score Mi hermano tiene diecinueve años. Mi hermano es eh, mas o menos alto. Pronunciation 1.68 2 Um … nosotros um … amamos nadamos … nadar. Nosotros amamos Grammar 1.58 3 nadar. Mi hermano es muy inteligente y tímido. Mi madre es amable. Vocabulary 1.54 3 Mi madre es baja … muy baja. Um …um. … Fluency 1.48 2

S p o k e n S p a n i S h L a n g u a g e D e v e L o p m e n t a t t h e h i g h S c h o o L L e v e L 225
The data further revealed a large increase in mean spoken language production scores be-tween the second and third year of language study. Given the frequency with which 2 years of high school study of a second language are required for college entrance, this statistically indicated growth may be attributed to a gen-eralized change in the language learner pop-ulation. That is, the jump in mean scores may indicate that students who chose to discon-tinue their study after 2 years are the same stu-dents who struggled most with learning a lan-guage. If this is the case, early identification of struggling students, analysis of specific areas of difficulty, and the provision of extra sup-port via defensible methodological principles as outlined by Long (2011, p. 387) may encour-age these students to continue their language studies.
The oral language development profiles in this study depict a mean expectation for stu-dent oral production throughout the high school language learning experience. Al-though these outcome profiles provide valu-able information about students’ general pat-terns of progress toward proficiency and also offer exemplars to increase awareness of vari-ability among language learners, there is a po-tential danger in overstressing mean levels of student oral language production when setting expectations for student outcomes. This is sup-ported in the literature on interlanguage that confirms the nonlinear and unevenly paced in-creases and decreases in student language de-velopment as each learner constructs his or her own language system (Selinker, 1972). When the most widely recognized assertions regard-ing oral production expectations are based on mean findings, it is easy to overlook the wide-spread potential for much greater growth with oral language production as seen in Ta-ble 7, depicting the variation among individ-ual students in the sample. This is further un-derscored by the individual student variability depicted by HLM analysis in Table 4. The vari-ability may serve as motivation to strive for
more than the “mean expectation”; clearly, there is potential for students to attain the up-per levels of each range for spoken language production. To maximize spoken language de-velopment, teacher-practitioners, teacher-edu-cators, and researchers must establish a better understanding of both what is possible as well as how to attain such possibilities.
The analysis of the quantitative holistic STAMP scores afforded a more general over-view of students’ spoken language production, while the more detailed analysis of the archived speech samples using the qualitative rubric yielded a profile of specific component skills and abilities. Taken together, the combination of both holistic and detail-specific data yielded a more comprehensive depiction of oral language production than would have been revealed with either source of data in isolation. Kunnan and Jang (2011) and Long (2011) stressed the impor-tance of incorporating diagnostic feedback into achievement and proficiency testing. This study may serve as an example of how results from an oral language production assessment (STAMP) may be analyzed in multiple manners in order to yield both a holistic understanding of stu-dents’ speech and information that can be used to diagnose strengths and weaknesses so as to provide additional support for students who do not yet meet expectations and challenge stu-dents who exceed them in an effort to maximize opportunities for growth in oral language pro-duction for all learners.
ACTFL’s recent research priority initiative addressing high-leverage teaching practices at-tested to the critical role of the teacher in the language learning process (Glisan & Donato, 2012). According to the HLM results of the cur-rent study, teachers accounted for 18 to 30% of the variance in students’ spoken language pro-duction scores. Although data on teachers’ use of high-leverage teaching practices were not collected as part of the current large-scale study, Cohen, Weaver, and Li (1996) noted that di-rect teaching of strategies before, during, and after each speaking task resulted in improved

226 m o e L L e r a n D t h e i L e r i n F o r e i g n L a n g u a g e a n n a L s 47 (2014)
performance. They concluded, “If instructors systematically introduce and reinforce strate-gies that can help students speak the target lan-guage more effectively, their students may well improve their performance on language tasks” (p. 29).
Similarly, Rossiter, Derwing, Manimtim, and Thomson (2010) emphasized that teach-ers need to be aware of the types of activities in which students participate and the ways in which such activities support the development of oral proficiency. Their analysis of the stu-dent and teacher editions of a number of text-books indicated that very few included a full range of activities that were designed to en-hance oral fluency. Furthermore, they noted that the most frequent activity, free produc-tion, would have alone been insufficient to help students develop the skills they need to produce unscripted speech addressing a range of topics in real-life settings. Other activities that may support students’ progress toward higher levels of proficiency, such as rehearsal and repetition, consciousness-raising, and use of discourse markers, were underrepresented in the set of textbooks that were analyzed. The authors stressed that the teacher must know which activities are most beneficial in help-ing students to develop oral fluency and how to use those activities in order to enhance stu-dents’ progress toward more native-like use of language.
In addition, the integration of technology into instruction can play a critical role in stu-dents’ development of oral communication skills. Payne and Whitney (2002) conducted a quasi-experimental study in which they tested whether synchronous chatting in the second language might indirectly improve students’ oral proficiency because it promotes the devel-opment of the same mechanism that underlies spontaneous conversational speech. Fifty-eight students from a third-semester Spanish course were split into groups who either participated in the computer-mediated intervention or re-ceived more conventional instruction. Students in the experimental group showed greater
gains in skills in both writing and speaking than those in the control group. Similarly, Lee (2014), also in this issue, addressed the role of technology in providing students with person-alized and meaningful opportunities to im-prove their oral skills.
Thus while prior research has investigated a wide range of factors (e.g., instructional ap-proaches, learner motivation, high-leverage learning strategies) that contribute to the devel-opment of student proficiency in the language classroom (e.g., Cohen et al., 1996; Long, 2011; Payne & Whitney, 2002), the impact of these fac-tors on instructional effectiveness is not clear and does not necessarily demonstrate whether these factors are key to producing the optimal result. Instead of focusing on one single factor and relating it to student success in isolation of other possible factors, it may behoove research-ers to consider approaching the situation from a different angle. There is scant research available that identifies the most successful students and teachers and then reveals the factors that are re-sponsible for these most salient, positive results. In the quest for optimal spoken language devel-opment for all learners, it would be advisable to study those teachers who seem to have identi-fied a set of teaching strategies that seem to be most beneficial.
The mixed-methods approach to research de-sign for this study allowed the researchers to capitalize on the strengths of both quantitative and qualitative data sources and analyses in un-derstanding a single phenomenon (Creswell & Plano Clark, 2011). Data convergence gener-ated a breadth and depth of understanding that would not have been possible had research-ers been limited to only quantitative or qualita-tive data. Qualitative data yielded an enhanced understanding of the development of oral lan-guage production throughout the high school learning experience, whereas the quantitative data presented a clear and concrete trajectory of oral language development. Findings based on both qualitative and quantitative data compre-hensively depicted the trajectory of growth in oral language production as well as the nature

S p o k e n S p a n i S h L a n g u a g e D e v e L o p m e n t a t t h e h i g h S c h o o L L e v e L 227
of that growth, and student speech samples pro-vided concrete representations of quantitative findings.
Although the strengths of the approach ad-opted in this study were many, there were also limitations. In a study that uses true convergent mixed-methods design with data transforma-tion, one would ideally work with two separate sets of data; this study derived both qualita-tive and quantitative data from the same data set. The HLM statistical approach may also be considered a limitation in this study. HLM took full advantage of available data, as it did not force the omission of data for those who chose not to continue with the study of Spanish. Miss-ing data, however, were still an issue. HLM es-timated coefficients for students for whom there were missing data, but there was concern about estimates based on only one or two data points (Raudenbush & Bryk, 2002). In addition, as noted in this article, these data represented a nested structure. While this is a strength of HLM, it should also be noted that one might further nest the data both conceptually and sta-tistically. As such, it is possible that some of the teacher-attributable variance, as indicated in this study, may rather be school-attributable variance. Further studies are needed that delve into differences at expanded levels of nesting.
Conclusions
If language educators are to strive for com-municative competence for all language learn-ers, it is critical that we continue to develop a clear, deep, and accurate understanding of their oral language development and then link that development to student, teacher, language, school, community, and other variables. This study revealed consistent growth in oral lan-guage development over four years of class-room language learning, highlighted the vari-ability in growth attributable to individual students and teachers, and provided profiles of mean language production as well as variants at the end of each academic year. These profiles
served as exemplars of what students could do with oral language.
This study illustrated the added value of mixed-methods research designs for the explo-ration of language development and, in gen-eral, for the field of second language acquisi-tion. A melding of qualitative and quantitative data as illustrated in this study can enrich an understanding of the language learning pro-cess and be of value in identifying the variables that contribute to language development in the classroom. Amassing the cumulative results of studies such as these will bring educators ever closer to realizing the expressed goal of wide-spread communicative competence for second language learners.
Notes
1. The STAMP literature states that STAMP levels are “related to” (http://www.avantassessment.com/stamp) and “defined by” (http://www.bellarm-ine.edu/docs/default-source/foreign_languages_docs/STAMP_StudentGuide_Apr08.aspx) the proficiency levels and sublevels that are described in the ACTFL Proficiency Guidelines (e.g., Novice High, Intermediate Mid). Some STAMP results are reported using those designations; however, they are not equivalent to official ACTFL ratings.
References
ACTFL. (1998). ACTFL guidelines for K-12 learners. ERIC Document Access Number ED 426593.
ACTFL. (2012). ACTFL guidelines for K-12 learners: 2012 Edition. Retrieved March 12, 2014, from http://www.actfl.org
Alderson, J. C., Clapham, C., & Wall, D. (1995). Language testing construction and evaluation. Cambridge, UK: Cambridge University Press.
Bachman, L. F., Lynch, B. K., & Mason, M. (1995). Investigating variability in tasks and rater judgments in a performance test of Foreign Language Annals _ VOL. 47, NO. 2 227 for-eign language speaking. Language Testing, 12, 238–257.
228 m o e L L e r a n D t h e i L e r i n F o r e i g n L a n g u a g e a n n a L s 47 (2014)
Avant Assessment. (2008). STAMP reporting guide. Retrieved March 12, 2014, from http:// avan-tassessment.com
Caracelli, V. J., & Greene, J. C. (1993). Data analy-sis strategies for mixed-method evaluation de-signs. Educational Evaluation and Policy Analysis, 15, 195–207.
Cohen, A. D., Weaver, S. J., & Li, T.-Y. (1996). The impact of strategies-based instruction on speaking a foreign language. In A. D. Cohen (Ed.), Strategies in learning and using a second language (pp. 107–156). London: Longman.
Creswell, J. W., & Plano Clark, V. L. (2011). Design-ing and conducting mixed-methods research. Thou-sand Oaks, CA: Sage.
Dugan, J. S. (1988). Standardized tests as an alter-native to the oral interview. Paper presented at the Seventh Annual Eastern Michigan Univer-sity Conference on Languages for Business and the Professions. ERIC Document Reproduction Service No. ED 304 923.
Freed, B. (1987). Preliminary impressions of the ef-fects of a proficiency-based language require-ment. Foreign Language Annals, 20, 139–146.
Glisan, E. W., & Donato, R. (2012). Guest editors’ message. Foreign Language Annals, 45, 3–7.
Glisan, E. W., & Foltz, D. A. (1998). Assessing stu-dents’ oral proficiency in an outcome-based curriculum: Student performance and teacher intuitions. Modern Language Journal, 82, 1–18.
Greene, J. C., & Caracelli, V. J. (1997). Defining and describing the paradigm issue in mixed-method evaluation. New Directions for Evalua-tion, 74, 5–17.
Greene, J. C., & McClintock, C. (1985). Triangula-tion in evaluation: Design and analysis issues. Evaluation Review, 9, 523–545.
Huebner, T., & Jensen, A. (1992). A study of for-eign language proficiency-based testing in sec-ondary schools. Foreign Language Annals, 25, 105–115.
Johnson, R. B., Dnwuegbuzie, A. J., & Turner, L. A. (2007). Toward a definition of mixed methods research. Journal of Mixed-Methods Research, 1, 112–133.
Kaplan, I. (1984). Oral proficiency testing and the language curriculum: Two experiments in cur-ricular design for conversation courses. Foreign Language Annals, 15, 491–498.
Kunnan, A. J., & Jang, E. E. (2011). Diagnostic feed-back in language assessment. In M. H. Long & C. J. Doughty (Eds.), The handbook of lan-guage teaching (pp. 610–627). West Sussex, UK: Wiley-Blackwell.
Lee, L. (2014). Digital news stories: Building lan-guage learners’ content knowledge and speak-ing skills. Foreign Language Annals, 47, doi: 10.1111/flan.12084.
Long, M. H. (2011). Methodological princi-ples for language teaching. In M. H. Long & C. J. Doughty (Eds.), The handbook of lan-guage teaching (pp. 373–394). West Sussex, UK: Wiley-Blackwell.
Magnan, S. S. (1986). Assessing speaking profi-ciency in the undergraduate curriculum: Data from French. Foreign Language Annals, 19, 429–438.
Miles, M. B., & Huberman, A. M. (1994). Qualita-tive data analysis: An expanded sourcebook. Thou-sand Oaks, CA: Sage.
Moeller, A., & Reschke, C. (1993). A second look at grading and classroom performance: Report of a research study. Modern Language Journal, 77, 163–169.
Norris, J. M., & Pfeiffer, P. C. (2003). Exploring the uses and usefulness of ACTFL oral proficiency ratings and standards in college foreign lan-guage departments. Foreign Language Annals, 36, 572–581.
Payne, P. J., & Whitney, P. J. (2002). Developing L2 oral proficiency through synchronous CMC: Output, working memory, and interlanguage development. CALICO Journal, 20, 7–32.
Raudenbush, S. W., & Bryk, A. S. (2002). Hierarchi-cal linear models (2nd ed.). Thousand Oaks, CA: Sage.
Rossiter, M. J., Derwing, T. M., Manimtim, L. G., & Thomson, R. I. (2010). Oral fluency: The ne-glected component in the communicative lan-guage classroom. Canadian Modern Language Review, 66, 583– 606.

S p o k e n S p a n i S h L a n g u a g e D e v e L o p m e n t a t t h e h i g h S c h o o L L e v e L 229
Sandelowski, M., Voils, C. J., & Knafl, G. (2009). On quantitizing. Journal of Mixed- Methods Re-search, 3, 208–222.
Savignon, S. J. (1997). Communicative competence: Theory and classroom practice (2nd ed.). New York: McGraw-Hill.
Selinker, L. (1972). Interlanguage. International Re-view of Applied Linguistics, 10, 219– 231. 228 SUMMER 2014
Steinmeyer, G. (1984). Oral proficiency interviews at Amherst Regional High School: Report of a pilot project. Unterrichtspraxis, 17, 330–334.
Thompson, I. (1996). Assessing foreign skills: Data from Russian. Modern Language Journal, 80, 47–65.
Tschirner, E. (1992). Oral proficiency baselines for first- and second-year college German. Unter-richtspraxis, 25, 10–14.
Tschirner, E. (1993). Developing grammars: Ac-quired grammatical systems of beginning and intermediate students. Paper presented at the annual meeting of the American Association of Teachers of German, San Antonio, TX.
Tschirner, E., & Heilenman, L. K. (1998). Reason-able expectations: Oral proficiency goals for in-termediate-level students of German. Modern Language Journal, 82, 147–158.

230 m o e L L e r a n D t h e i L e r i n F o r e i g n L a n g u a g e a n n a L s 47 (2014)
App
endi
x A
Rub
ric
Use
d to
Eva
luat
e Sp
eech
Sam
ples
Ex
ceed
s Ex
pect
atio
ns (3
poi
nts)
M
eets
Exp
ecta
tions
(2 p
oint
s)
Doe
s N
ot M
eet E
xpec
tatio
ns (1
poi
nt)
Pron
unci
atio
n A
ppro
pria
te in
tona
tion
Com
preh
ensi
ble;
som
e ac
cent
evi
dent
Larg
ely
inco
mpr
ehen
sibl
e
App
ropr
iate
wor
d st
ress
Be
ginn
ing
to s
ound
acc
urat
e
A
nglic
ized
acc
ent,
into
natio
n, a
nd w
ord
stre
ss
Im
itate
d ta
rget
lang
uage
C
ould
use
app
ropr
iate
wor
d st
ress
soun
ds w
ith e
ase
En
glis
h so
unds
wer
e ra
rely
C
ould
imita
te ta
rget
lang
uage
sou
nds
us
ed
Engl
ish
soun
ds w
ere
occa
sion
ally
use
d
Voc
abul
ary
Beyo
nd c
omm
on/b
asic
C
omm
on/b
asic
voc
abul
ary
Lim
ited
voca
bula
ry
voc
abul
ary
C
reat
ive
use
of v
ocab
ular
y A
ttem
pted
to u
se v
ocab
ular
y cr
eativ
ely
Pr
edom
inan
t sin
gle-
wor
d ut
tera
nces
Id
iom
atic
exp
ress
ions
A
ttem
pted
to u
se id
iom
atic
exp
ress
ions
Le
ss th
an m
inim
um w
ord
requ
irem
ents
Sp
eake
r exc
eede
d m
inim
um
Spea
ker m
et m
inim
um w
ord
requ
irem
ents
M
uch
repe
titio
n of
sel
ect w
ords
w
ord
requ
irem
ents
So
me
repe
titio
n of
sel
ect w
ords
Gra
mm
ar S
truc
ture
A
ppro
pria
te u
se o
f ver
bs
Mos
tly a
ppro
pria
te u
se o
f ver
bs
Mis
use
of v
erbs
N
umbe
r and
gen
der
Som
e nu
mbe
r and
gen
der a
gree
men
t
Num
ber a
nd g
ende
r agr
eem
ent m
isap
plie
d
ag
reem
ent
A
ppro
pria
te u
se o
f defi
nite
C
ould
use
app
ropr
iate
defi
nite
and
Defi
nite
and
inde
finite
art
icle
s ab
sent
or c
onfu
sed
and
inde
finite
art
icle
s
in
defin
ite a
rtic
les
A
ppro
pria
te s
ubje
ct/v
erb
Basi
c su
bjec
t/ve
rb a
gree
men
t
La
ck o
f sub
ject
/ver
b ag
reem
ent
agre
emen
t
Cor
rect
wor
d or
der
Wor
d or
der w
as a
nglic
ized
but
mes
sage
W
ord
orde
r was
ang
liciz
ed a
nd m
essa
ge w
as
was
com
mun
icat
ed
o
bscu
red
S p o k e n S p a n i S h L a n g u a g e D e v e L o p m e n t a t t h e h i g h S c h o o L L e v e L 231
Exce
eds
Expe
ctat
ions
(3 p
oint
s)
Mee
ts E
xpec
tatio
ns (2
poi
nts)
D
oes
Not
Mee
t Exp
ecta
tions
(1 p
oint
)
Fe
w e
rror
s So
me
erro
rs; e
rror
s di
d no
t int
erfe
re
Er
rors
inte
rfer
ed w
ith m
eani
ng
with
mea
ning
Er
rors
did
not
inte
rfer
e w
ith
Evid
ence
of p
rono
un u
se
m
eani
ng
Pron
ouns
use
d ap
prop
riat
ely
Cou
ld s
elf-c
orre
ct
Self-
corr
ecte
d
Flue
ncy/
Resp
onse
N
atur
al s
peed
/App
ropr
iate
G
ave
requ
ired
info
rmat
ion
but n
o m
ore
Re
quir
ed in
form
atio
n la
ckin
g
pa
cing
A
ppro
pria
te p
ause
and
Sl
ower
spe
ech
evid
ent
Slow
, hes
itant
spe
ech
hesi
tatio
ns
App
ropr
iate
use
of r
ejoi
nder
s Fr
eque
nt a
nd lo
nger
pau
ses
and
hesi
tatio
ns
Exce
ssiv
e an
d lo
ng p
ause
s
Resp
onde
d ap
prop
riat
ely
to
Resp
onde
d ap
prop
riat
ely
to m
ost q
uest
ions
In
appr
opri
ate
resp
onse
s to
que
stio
ns a
nd p
rom
pts
ques
tions
and
pro
mpt
s
an
d pr
ompt
s
Ev
iden
ce o
f L1
inte
rfer
ence
L1
inte
rfer
ed w
ith c
ompr
ehen
sibi
lity

232 m o e L L e r a n D t h e i L e r i n F o r e i g n L a n g u a g e a n n a L s 47 (2014)
Appendix BSpeaking Profiles
Second-Year Spanish Speaking Profile
Example Prompt
Authentic Student Product
Pronunciationx̄ = 1.82
Qualitative Rubric DescriptionComprehensible; some accent
evidentBegan to sound accurateCould use appropriate word
stressCould imitate target language
soundsEnglish sounds were
occasionally used
Grammarx̄ = 1.77
Qualitative Rubric DescriptionMostly appropriate use of verbsSome number and gender
agreementCould use appropriate definite
and indefinite articles
Basic subject/verb agreementWord order was anglicized but
message was communicated
Your pen pal from Veracruz, Mexico, is coming to visit you for a few months. She called to ask what kind of clothing to pack. Do your best to help her decide by describing: • the weather • what kind of clothes are popular • what she might need for different occasions (school, sports, parties) Tell her you are happy she’s coming.
Hace sol y hace frio. Necesita las camisetas, las pandrillas, las zapatillas de tenis. Tambien necesita las pandrillas de cuarto para jugar los deportes. Estoy muy contenta.
Exemplar Score = 2
Qualitative Analysis of Student SampleIn sample 2, an accent was evident but still comprehensible. The
pronunciation was beginning to sound accurate, and some target language sounds were imitated. However, the word pandrillas was mispronounced several times in the response. This indicated the interference by L1 and required meaning to be decoded. The appropriate word stress was applied to most words. English sounds were occasionally used.
Exemplar Score = 2
Qualitative Analysis of Student SampleThe grammar structure demonstrated appropriate use of verbs.
There was some evidence of gender and number agreement. There was correct definite article usage. There was evidence of basic subject/verb agreement. There were no grammar errors that required the meaning to be decoded. The word order was anglicized, but the overall message was comprehensible.

S p o k e n S p a n i S h L a n g u a g e D e v e L o p m e n t a t t h e h i g h S c h o o L L e v e L 233
Some errors; errors did not interfere with meaning
Evidence of pronoun useCould self-correct
Vocabularyx̄ = 1.72
Qualitative Rubric DescriptionCommon/basic vocabularyAttempted to use vocabulary
creativelyAttempted to use idiomatic
expressionsSpeaker met minimum word
requirementsSome repetition of select words
Fluencyx̄ = 1.71
Qualitative Rubric DescriptionGave required information but
no moreSlower speech evidentFrequent and longer pauses and
hesitationsResponded appropriately to
most questions and promptsEvidence of L1 interference
Exemplar Score = 1
Qualitative Analysis of Student SampleThe vocabulary was common, but the sample did demonstrate
the creative use of verb forms. The minimum word requirements were met in the response. The limited scope of vocabulary and repetitive use of vocabulary, especially mispronounced vocabulary, caused the sample to be disconnected and required the meaning to be decoded.
Exemplar Score = 2
Qualitative Analysis of Student SampleOnly the required information was given. The speech was slow,
hesitant at times, indicating some L1 interference. There were frequent and longer pauses and hesitations. The sample responded appropriately to questions and the prompt with some L1 interference in word order.

234 m o e L L e r a n D t h e i L e r i n F o r e i g n L a n g u a g e a n n a L s 47 (2014)
Third-Year Spanish Speaking Profile
Example Prompt
Authentic Student Product
Pronunciationx̄ = 2.05
Qualitative Rubric DescriptionComprehensible; some accent
evidentBegan to sound accurateCould use appropriate word
stressCould imitate target language
soundsEnglish sounds were
occasionally usedAppropriate intonationAppropriate word stressImitated target language sounds
with easeEnglish sounds were rarely
used
You are living with a host family in Spain. You’ve called to let your host family know that you won’t be home for dinner tonight because you are going out with some friends. No one is home, so leave a message on the answering machine. Make sure you include the following in your message: Greet your host family and let them know that you will not be able to be home for dinner tonight; apologize for missing dinner; explain in detail why you are missing dinner tonight (where you are going, who you are with, and what you will be doing there); conclude the message by letting them know what time you plan to return and any other details that might be important for them to know.
Hola todos. Lo siento pero no voy a comer la cena con ustedes. Voy a comer con juanes y mi amiga Sofia y voy a comer el restaurante nuevo en la ciudad la comida de pañal. Voy a [pause] vamos a comer y luego vamos a ir al parque y luego voy a regresar a casa. Pienso que regresar a las cinco y um…es todo lo siento que no voy a comer con ustedes. Es muy triste. Adios.
Exemplar Score = 2
Qualitative Analysis of Student SampleIn sample 3, some accent was evident but the response was still
comprehensible. The pronunciation began to sound accurate and could imitate target language sounds. Appropriate word stress was used. English sounds were rarely used.

S p o k e n S p a n i S h L a n g u a g e D e v e L o p m e n t a t t h e h i g h S c h o o L L e v e L 235
Grammarx̄ = 2.07
Qualitative Rubric DescriptionMostly appropriate use of verbsSome number and gender
agreementCould use appropriate definite
and indefinite articlesBasic subject/verb agreementWord order was anglicized but
message was communicatedSome errors; errors did not
interfere with meaningEvidence of pronoun useCould self-correct
Vocabularyx̄ = 2.02
Qualitative Rubric DescriptionCommon/basic vocabularyAttempted to use vocabulary
creativelyAttempted to use idiomatic
expressionsSpeaker met minimum word
requirementsSome repetition of select words
Exemplar Score = 3
Qualitative Analysis of Student SampleThe grammar structure demonstrated appropriate use of verbs.
There was evidence of gender and number agreement. There was correct definite article usage. There was evidence of self-correction as the speaker paused to change “voy a” to “vamos a” to represent the first-person plural, indicating that he and his friends would be eating together. There was the absence of the preposition en in the phrase “comer el restaurante nuevo.” The word order was sometimes anglicized, but the overall message was communicated. The grammar errors made did not interfere with meaning.
Exemplar Score = 3
Qualitative Analysis of Student SampleThe vocabulary was common but the sample did demonstrate
some attempt at the creative use of vocabulary. There was one example, “la comida de pañal,” which did not fit the context, and the word pañal was incorrectly used. The context referred to a new restaurant, and the phrase “la comida de pañal” means “baby food.” The minimum word requirements were met and exceeded. There was some repetitive use of select words.

236 m o e L L e r a n D t h e i L e r i n F o r e i g n L a n g u a g e a n n a L s 47 (2014)
Fluencyx̄ = 2.03
Qualitative Rubric DescriptionGave required informationSlower speech evidentFrequent and longer pauses and
hesitations Responded appropriately to
most questions and promptsEvidence of L1 interference
Fourth-Year Spanish Speaking Profile
Example Prompt
Authentic Student Product
Pronunciationx̄ = 1.91
Qualitative Rubric DescriptionComprehensible; some accent
evidentBegan to sound accurateCould use appropriate word
stressCould imitate target language
soundsEnglish sounds were
occasionally used
Exemplar Score = 3
Qualitative Analysis of Student SampleAll of the required information was given with some additional
details. Slower speech was evident at times,indicating translation of thoughts and ideas. There were frequent and longer pauses and hesitations with English rejoinders such as “um.” The sample responded appropriately to questions and the prompt with some L1 interference in word selection and anglicized grammar.
Your host family in Nicaragua has asked you about pets in the United States. Describe a pet that you have or would like to have. Explain how you care for the pet (what you feed them and how often you feed them, etc.) and describe some activities that you do with your pet. Talk about some common pets that families may have and include unusual or exotic pets that you know of. Conclude by asking them what pets they have or might like to have.
Hola familia. No tengo una mascota pero…el perro es el es la mascota muy común en los estados unidos. Necesitas jugar con los perros y los das comida. Si podrías tener uno mascota cual tienes.
Exemplar Score = 2
Qualitative Analysis of Student SampleSome accent was evident, but the pronunciation was still
comprehensible. The pronunciation used appropriate intonation and word stress. The target language sounds were imitated, and English sounds were rarely used.

S p o k e n S p a n i S h L a n g u a g e D e v e L o p m e n t a t t h e h i g h S c h o o L L e v e L 237
Grammarx̄ = 2.00
Qualitative Rubric DescriptionMostly appropriate use of verbsSome number and gender
agreementCould use appropriate definite
and indefinite articlesBasic subject/verb agreementWord order was anglicized but
message was communicatedSome errors; errors did not
interfere with meaningEvidence of pronoun useCould self-correct
Vocabularyx̄ = 2.01
Qualitative Rubric DescriptionCommon/basic vocabularyAttempted to use vocabulary
creativelyAttempted to use idiomatic
expressionsSpeaker met minimum word
requirementsSome repetition of select words
Exemplar Score = 1
Qualitative Analysis of Student SampleThe grammar structure demonstrated appropriate use of verbs.
The conditional verb tense was used. There was correct definite and indefinite article usage with the exception of uno mascota. As mascota is singular and feminine, the article should have been una. This is an example of L1 interference. There was evidence of basic subject/verb agreement. The word order was correct with few errors in grammar. These errors did not interfere with meaning. There was evidence of incorrect direct object pronoun usage with “los das comida.” The speaker identified los perros as what needed to be replaced but did not use the indirect object pronoun les because los perros is the indirect object of that sentence. The sample did show evidence of self correction with a recast with “el perro es el es la mascota.” The speaker began with the singular masculine definite article el, then corrected as mascota requires the singular with feminine article. This demonstrated a higher level of language ability.
Exemplar Score = 2
Qualitative Analysis of Student SampleThe vocabulary was beyond common, and the sample did
demonstrate some attempt at the creative use of vocabulary and verb forms. There was one vocabulary word that was in error in “la mascota muy común en los estados unidos.” This was muy, as it is in a superlative phrase and must be más. This could be caused again by L1 interference. The minimum word requirements were met in this sample.

238 m o e L L e r a n D t h e i L e r i n F o r e i g n L a n g u a g e a n n a L s 47 (2014)
Fluencyx̄ = 1.94
Qualitative Rubric DescriptionGave required information but
no moreSlower speech evidentFrequent and longer pauses and
hesitationsResponded appropriately to
most questions and promptsEvidence of L1 interference
Exemplar Score = 2
Qualitative Analysis of Student SampleAll of the required information was given. Slower speech
was evident at times. The sample responded appropriately to questions and the prompt with little evidence of L1 interference.

S p o k e n S p a n i S h L a n g u a g e D e v e L o p m e n t a t t h e h i g h S c h o o L L e v e L 239
Appendix CVariation With Language Development
Second-Year Spanish Student Sample Variation
Category x̄ Sample ScorePronunciation 1.82 1Grammar 1.77 1Vocabulary 1.72 1Fluency 1.71 1
Category x̄ Sample ScorePronunciation 1.82 2Grammar 1.77 3Vocabulary 1.72 3Fluency 1.71 3
Third-Year Spanish Student Sample Variation
Category x̄ Sample ScorePronunciation 2.05 1Grammar 2.07 2Vocabulary 2.02 1Fluency 2.03 1
Mi clase de espanol es muy grande y rojo. Yo estudiar mucho y libros es azul. Yo profesora y inteligente.
Tengo cuatros personas en mi familia. Pero me gustan dos personas mucho. Los personas esta mi madre y mi hermano. Mi madre se llama Deb. Deb tiene treinta y nueve anos. Mi madre esta mi amiga mejor. Pero yo puedo hablar por muchas cosas. Mi madre le gustan esquiar acuatico y cocinar pasteles con mi. Mi hermano se llama Christopher. Christopher tiene diez y seis anos. Christopher le gustan practicar los deportes futobol norteamericano y baloncesto y muchas cosas afuera. Christopher le gustan los chicas muchos y hablar con las chicas para el noche.
Para desayuno me gustaria jueves. Para almuerzo te me gustaria jamburguesa y papas fritas y para cena me gustaria carne.

240 m o e L L e r a n D t h e i L e r i n F o r e i g n L a n g u a g e a n n a L s 47 (2014)
Category x̄ Sample ScorePronunciation 2.05 3Grammar 2.07 3Vocabulary 2.02 3Fluency 2.03 3
Fourth-Year Spanish Student Sample Variation
Category x̄ Sample ScorePronunciation 1.91 1Grammar 2.00 1Vocabulary 1.91 1Fluency 1.94 2
Category x̄ Sample ScorePronunciation 1.91 3Grammar 2.00 3Vocabulary 1.91 3Fluency 1.94 3
Me levanto a las seis y media. Me ducho y me maquillo antes de ir al colegio. Me cepillo el pelo y me cepillo los dientes. Yo tomo el carro al colegio. Me encanta la clase de matematicas porque es muy interesante. No me gusta la clase de historia porque es muy difícil. Me gusta la clase de ingles porque es muy fácil. Me gusta la clase de biologia porque es muy divertido. Despues de clases yo practico deportes.
Hoy en ese cuarto el un amigo mire el tele, dureme en la sofa y come comida y bebe un refresco. Muchos actividades son en el cuarto.
Aquí hay dos chicas en la niebla. Las dos chicas hicieron ángeles de la nieva. Ellas viven cerca de un bosque. También hay un pueblo aquí. Hace frío y bastante nublado.