spokesman - sunny bank
TRANSCRIPT


Spokesman Chief Secretary Lin, Chin-Hsiung 7F, No. 90, Sec. 1, Shihpai Rd., Beitou District, Taipei City 112, Taiwan (R.O.C.) TEL: (02) 2820-8166 Ext. 607 Website: [email protected]
The Deputy Spokesman President Chou, San-Ho 6F, No. 90, Sec. 1, Shihpai Rd., Beitou District, Taipei City 112, Taiwan (R.O.C.) TEL : (02) 2820-8166 Ext. 737 Website: [email protected]
Head Office and Branch Office No. 90, Sec. 1, Shihpai Rd., Beitou District, Taipei City 112, Taiwan (R.O.C.) TEL: (02) 2820-8166 Website:http://www.sunnybank.com.tw See P.197~P.199 for details on local branch office addresses and telephone numbers.
Stock Registration Office Sunny Bank General Administration (Shareholders Section) 4F, No. 88, Sec. 1, Shihpai Rd., Beitou District, Taipei City 112, Taiwan (R.O.C.) TEL: (02) 2820-8166 Ext. 501 Website:http://www.sunnybank.com.tw
Credit Rating Agency Taiwan Rating Corporation 49F, No. 7, Sec. 5, Sinyi Rd., Taipei City 110, Taiwan (R.O.C.)(Taipei 101 Tower) TEL:(02) 8722-5800 Website:http://www.taiwanratings.com/
Certified Public Accountants for Financial Statements CPA: Shao, Chih-Ming, Kuo, Cheng-Hung Deloitte & Touche 12F, No. 156, Sec. 3, Minsheng E. Rd., Taipei City 105, Taiwan (R.O.C.) TEL: (02) 2545-9988 Website:http://www.deloitte.com.tw
Names of stock exchanges where foreign securities are listed and enquiry on the information of foreign securities: None The Bank’s url: http://www.sunnybank.com.tw
I. MESSAGE TO SHAREHOLDERS _________________________________________ 1 II. BACKGROUND ________________________________________________________ 5
1. Date of Registration___________________________________________________________________ 5 2. History of the Bank ___________________________________________________________________ 5
III. COMPANY REPORT ____________________________________________________ 6 1. Organization of the Bank ______________________________________________________________ 6 2. Information of Director/Supervisor, President, Vice President, Deputy Executive Vice President,
Dept. and Branch Office Chiefs _________________________________________________________ 9 3. Company Operation 24 _______________________________________________________________ 17 4. Information of Fees to CPA ___________________________________________________________ 22 5. Information of Changing CPA _________________________________________________________ 22 6. Chairman, President, Financial or Accounting Managers, and those that have served in CPA or
Affiliated Associated Business in Most Recent One Year ____________________________________ 22 7. Equity Transfer _____________________________________________________________________ 23
IV. FUNDING____________________________________________________________ 26 1. Share and Dividend __________________________________________________________________ 26 2. Financial Debentures_________________________________________________________________ 29 3. Special Shares_______________________________________________________________________ 33 4. Global Depositary Receipt ____________________________________________________________ 33 5. Employee Right Shares Certification____________________________________________________ 33 6. Merger & Acquisition or Transfer to Other Financial Institution_____________________________ 33 7. Capitalization Program Execution ______________________________________________________ 33
V. REVIEW OF BUSINESS OPERATION ____________________________________ 33 1. Services ____________________________________________________________________________ 33 2. Employees Information _______________________________________________________________ 43 3. Corporate Responsibilities and Ethical Risk______________________________________________ 44 4. Information Infrastructure____________________________________________________________ 44 5. Relationships of Labors and Employer __________________________________________________ 45 6. Important Contracts/Agreements ______________________________________________________ 46 7. Transactions of Securitized Commodity _________________________________________________ 46
VI. FINANCIAL INFORMATION ___________________________________________ 47 1. Condensed Balance Sheet and Condensed Income Statement ________________________________ 47 2. Financial Analysis ___________________________________________________________________ 49 3. Supervisor’s Report__________________________________________________________________ 52 4. Financial Statement __________________________________________________________________ 53 5. Consolidated Financial Statements of Parent-subsidiary Audited by CPAs____________________ 113 6. Effect of Financial Difficulties Experienced by the Bank and Related Enterprises on the Bank's
Financial Status in Most Recent Year and to the Annual Report Publication Date ______________ 164 VII. REVIEW OF FINANCIAL POSITION AND OPERATION RESULTS/ANALYSIS AND
ASSESSMENT _______________________________________________________ 164 1. Financial Position Analysis ___________________________________________________________ 164 2. Operation Results Analysis ___________________________________________________________ 165 3. Cash Flow Analysis _________________________________________________________________ 165 4. Influence Imposed by Major Capital Expenditures _______________________________________ 165 5. Reinvestment Policies _______________________________________________________________ 166 6. Analysis and Assessment of Risk Management___________________________________________ 166 7. Crisis Management Mechanism _______________________________________________________ 176 8. Other Important Events _____________________________________________________________ 177
VIII. SPECIAL NOTES ____________________________________________ 178
I. MESSAGE TO SHAREHOLDERS The international financial environment faced vital changes. The subprime crisis turned into
the globe-striking financial tsunami. As Freddie Mac and Fannie Mae suffered from a gigantic deficit and Federal Deposit Insurance Corporation (FDIC) took over IndyMac, a house mortgage institute, the subprime crisis deteriorated further. In September 2008, the U.S. subprime crisis worsened drastically- Lehman Brothers Inc announced its bankruptcy; Merrill Lynch was acquired; Freddie Mac, Fannie Mae and American International Group are under takeover; Washington Mutual filed bankruptcy; Wachovia faced a crisis; problems occurred to financial institutions in Europe one by one; and even some countries, such as Iceland, suffered from national systematic risks. U.S. subprime crisis severely harmed global economic environment and the financial industry. The diffusion effect exceeded expectation and generated extremely negative strike against physical economy. All governments are aggressively implementing various monetary polices and bailout plans and, further, invested huge capital in order to stabilize the financial system and economy. Nevertheless, while the credit squeeze isn’t seen any improvement and the international economy remains sluggish, consumption intention turns conservative, which deepens economic recession and social turbulence and elongates the time needed for global economic recovery.
Under the strike by the financial tsunami, the global economy freezes and trading abruptly shrinks. Taiwan is not excluded. Its export slumped and caused the negative growth of product and service output and unclear economic prospect. Therefore, companies demonstrated conservative responses to this economic wave, which triggered drastic shrinkage of private investment. Directorate General of Budget, Accounting and Statistics announced its economic growth of this year to be -2.97%, which is not merely the 2nd negative yearly economic growth of all time, but also the biggest decline in the history. Meanwhile, the ascending unemployment rate weakens private consumption with unexpected influence. The timing of economic recovery will surely be postponed, which places domestic banks in an even harsher environment.
The operation in 2008 and the business plans for 2009 are as follows:
1. The Outcome of the Operation Plans and The Budget Implementation: The 2008 operation demonstrated fruitful achievement with the balance of outstanding deposit at the end of 2008 as NT$208.865 billion, which was NT$ 1.503 billion less then NT$207.362 billion, the deposit balance at the end of 2007, or annual growth as 0.72%. The balance of outstanding loan was NT$168.777 billion at the end of 2008, which was NT$ 6.789 billion less than NT$ 175.566 billion, the balance at the end of 2008. For asset quality, the non-performing loan ratio is 2.60% and the coverage ratio is 56.43.
2. Status and Profitability Analysis:
The after-tax loss settlement of year 2008 was a loss of NT 2,311,900 thousand dollars and loss per share was 1.89 dollars.
3. Research Development:
(1) On September 25th 2008, Taiwan Rating Corporation rated us as “twBBB+“ for long-term credit rating and ”twA-2” for short-term credit, with outlook rated as Stable.
(2) Expanding corporate finance: Persistently promote Deep Rooting Savings and Easy Business Loan, aggressively boost OBU Export-Import service and provide diverse options according to clients’ needs. Meanwhile, broaden the scope for loans to quality franchisers. Evaluate the franchise brands pertaining to their industries, head offices, and the number of franchisees to shield each franchisee against capital concerns.
(3) Furnishing quality home loan products: Products include “Double Plus”, “Go and Transfer”, “Easy Paid”, “Residence”, “Non-Residence”, the financial and the government home loans, all of which can accompanied by mortgage life insurance to satisfy clients with different needs.
1 1
(4) Consistently launching new financial products and supply diverse finance products: Customize credit loans and wealth management trust for different client segment; plan to introduce new financial products such as privately placement fund, collective management accounts or personal insurance in order to furnish the Bank’s clients more options in financial products and meet more needs of clients.
(5) Advance expertise of financial advisors and provide clients professional financial services: Target the goal of at least one professional financial advisor per branch. Through the elementary and advance classified training for financial advisors, advance financial advisors’ expertise and images and provide more professional financial services to the Bank’s clients.
(6) Furnish customized financial diagnosis ( Bull Up Your Portfolio): Provide clients suggestions on over 1,000 financial products of domestic competitors to meet the all-round needs for clients with different asset value or risk tolerance. In order to shorten the break-even period for clients at loss caused by the financial tsunami, the bank launched customized financial diagonis. The Bank not only inspects clients’current investment, but also assists them with asset allocation for this short-selling period.
(7) Collective investment trust accounts: To satisfy conservative, stable and aggressive investors through different types of investment objectives, the trustees can collectively manage the fund of similar fields and risk preference and set up individual accounts. The investors can invest through collective investment trust accounts and optimize the asset allocation to minimize investment costs , utilize marketing synergy through person trust and raise the efficiency of exercising trust assets.
(8) Personal trust- pension-trust: With the aging population and low fertility rates, exercise and allocation of fund during retirement is receiving more and more attention. Through trust contracts with trust enterprises for the exercise of trusted property, trust property accounts can be managed independently and excluded from the effect of the worsening finance or bankruptcy of granters or trusted banks. Inappropriate usage by children can be avoided, which supplies a significant shield for property of the senior. Meanwhile, the reduction of the estate and gift taxes does not signify that asset transferring plans are no longer needed. This reduction only symbolizes that these taxes are not the critical concerns for those with high asset value. In the future, six key aspects should be noted for asset transfer- 1. Transfer timing; 2. Sustainable operation; 3. Asset security; 4. The inheritance plan; 5. Property; and 6. Tax management.
(9) Money claim trust and its secured interest trust: Creditors with money claim, who pay money as the subject, trusts its money claim rights (those with secured interests will be trusted with secured interests) in the Bank (the trustee). The Bank thus becomes the nominal creditor, conducts the collection, security, management and disposal on their behave and pay the proceeds to trust of beneficiaries.
(10)Strengthening credit card services: to provide collection of public utility fees, progressive payment of cash advance for quality cardholders, boost the exposure of charity and increase the added value.
2
4. Guidelines of 2009 Operation Plans, Objectives, Targets and Policies: (1) Raise interest spread and fee income:
In Year 2008, under the impact of the financial tsunami, Central Bank lowered the interest rates for several times and thus the interest spread between deposits and savings narrows gradually. The overall operating environment turned harsher. Thus, widening the interest spread is the top mission of the Bank. Meanwhile, in order to raise profit, the Bank will fully implement the collection of service fees to elevate the proportion of the service fees.
(2) Minimize capital cost and the interest rate risks: Currently, the Bank’s fixed interest rates of the term deposit accounts for 75% and those of loans accounts for 25%. While the market interest rates slides down, the loan interest rates will slide more than deposit interest rates, which narrows interest spread and further affects the Bank’s revenue. In order to minimize the capital cost and the interest rate risks, the Bank, in addition to raise the proportion of the demand deposit, should tune the proportions of fixed interest rates of the Bank’s term deposits and loans to avoid risks arising from the shifts of the interest rates.
(3) Minimize the operating cost: Uplift the Bank’s productivity, effectively minimize operating cost and further achieve profit elevation through the adjustment in the optimal operation scale and the staff size and the comprehensive inspect and review on the various operating cost.
(4) Solidify risk control: The loss in Year 2008 primarily business loans and bad debt provision for OBU credit link loan increases significantly. Therefore, the Bank will list risk control strengthening as the key task of the year in business expansion and operation. Hence, General Administration of Risk is established for such purpose. Through centralization of risk management units, comprehensive consideration can be conducted on risk management, risk diversification, risk planning and risk retention and risk aversion, all of crediting monitoring mechanism and processes can be advanced. Meanwhile, model and system planning can be introduced to expedite risk management to achieve balance between business expansion and risk control.
(5) Fortify BIS control: To conform to the stipulation of Banking Act that the capital adequacy ratio can not be lower than 8%, the Bank will strengthen the management on the proportion for the value of risky asset and raise the Bank’s BIS to conform the authority’s stipulation.
(6) Centralize management and appraisal and strengthen monthly and quarterly appraisal: Make the Bank’s appraisal system more reasonable, specific and clear through the centralization of management and appraisal. In addition, the Bank will accord with key business strategies, dynamically adjust sales and staff appraisal, fully implement interim management and fortify monthly and quarterly appraisal so the notions and strategies of the Head Office can be fully executed and thus completely elevate productivity and stimulate the morale.
(7) Strengthen the collection and management of overdue loans: Strengthen collection of bad debt; actively contact debtors and successfully collect or negotiate about the debt to minimize the damage, lower allowance and improve asset quality.
(8) Reinforce functions of electronic and automated channels to raise the overall operation efficiency, utilize the channels of branches, integrate marketing competency and improve the marketing capability of branches to demonstrate the effect of organization’s operation and maximize the profit.
(9) Branch relocation: Through service locations, the Bank is able to geographically exercise the mutually benefit in sales support and promotion and grasp the share of the regional market and utilize the operation scale in a short period of time.
3

Looking into the future, Sunny Bank will stand firmly on its diligent and dedicative tradition, stick up for its quality policies of “Stability, Prospects, Profession and Enthusiasm”, focus on business development and exploration, further solidly the niche market, strengthen the loan quality and quantity, persistently clear non-performing assets, adjust the deposit structure and raise the proportion of demand deposits to broaden the interest spread. The Bank is planning to achieve cost minimization through effective and reasonable evaluation on expenditure. Meanwhile, the Bank is going to endeavor to raise the capital adequacy ratio, better the financial structure, and fortify operating structure to provide the clients a one-time diverse flexible service and, further, elevate the Bank’s profit through the escalation of all-round service, fortification of organization’s functions, proactive and effective management and the establishment of performance-oriented culture.
Chen, Chairman
4

II. Background 1. Date of Registration Registration Date: September 1, 1997 Business Commencement Date: September 1, 1997 2. History of the bank Previously known as “Yang Ming Shan Credit Cooperative”, the Bank was established on October 2nd, 1957. After 40 years of operation, it was approved and restructured to be a bank by the Ministry of Finance on April 28, 1997. Therefore, “Sunny Bank Corporation Ltd.” formally started its operations on September 1, 1997. Sunny Bank is among the first group of credit cooperatives being restructured to banks in accordance with the “Standards and Regulations for Reforming Credit Cooperatives to Commercial Banks” with an Order issued by the Ministry of Finance dated December 6, 1995 with File No. Tai-tsai-jung No. 84784492. On April 16, 1998, our bank was accredited of the ISO-9002 information and quality system. We were the first accredited bank. On June 4, 1998, we held a press conference to announce this accreditation and address our quality policies for sustainable operation of “Stability, Prospects, Profession and Enthusiasm”. We have been endeavoring to advance ourselves, expand our services, increase branches to provide services to the public since the commencement of our business. In conformance with the governmental policies to dispose poorly managed financial institutions, Sunny Bank Ltd. undertook the business of Yuan Lin Credit Cooperative, Chang Hua and Ping Tung 2nd Credit Cooperative respectively on September 15, 2001. On August 24, 2002, Sunny Bank Ltd. took over the business of Tainan 5th Credit Cooperative. We successfully increased our branches by 21. On July 20, 2004, Sunny Bank Ltd. was approved to expand its operational region and became a national bank. On November 26, 2005, Sunny Bank Ltd. merged with Kao Shin Commercial Bank so as to integrate business and strengthen our competitiveness in the market by obtaining better competitive advantages, expanding business scale and range. The number of our branches increased from 62 to 96. Our capital is expanded to NT$12.4 billion. The Bank bases its development in Taipei and Kaohsiung and cautiously plans its service locations. We established Lotong branch in September 2007 and broadened our service territory into Eastern Taiwan. Through regional complementary, and channel integration, the Bank will advance its market competitiveness and scale. The Bank plans to, through its service locations, geographically exercise the mutually benefit in sales support and promotion and grasp the share of the regional market and utilize the operation scale in a short period of time. For adapting to the rapid changes in the financial market, the Bank established Risk Administration Department to hasten operation rationalization and enhance service quality and efficiency. AS the finance turns financial liberalization and internationalization, the banking service should not be confined in banking but should broadened into diversified operation. The Bank bettered the operating capital, actively integrated itself into other financial areas and reinvest in Sunny Securities Co., Ltd., Sunny Life Insurance Brokerage Co., Ltd., Sunny Property & Insurance Brokerage Co., Ltd , Sunny Assets Management Co., Ltd and Ontario Securities Investment Trust etc. to act as an agent for various insurance commodities and engage in brokerage, transaction and delivery of listed and over-the-counter stocks and the purchase, valuation or auction of financial claims. It is expected that we can expand our services, develop diverse business and provide comprehensive financial services on a basis of existing connections and locations. As the financial industry turns more and more fiercely competitive, the Bank is going to persist in its notions sustainable management, proactively develop diverse services and fortify the Bank’s capital structure. In order to provide clients better service quality and continuing the service improvement, the Bank will persist in its diligent and devoting tradition and work together for proactively boosting business and broaden our service scale. With more diverse products, a wider service locations, safer and more convenient automated service channels and consistently enthusiastic services, the Bank also plans to furnish clients a variety of financial services and, as a great partner, satisfy all of our clients for their financial demands in all phases.
5 5

III. Company Report 1. Organization of the Bank
Date: April 30, 2009
Shareholders Meeting
Board of Directors Chief Secretary of the Board of Directors
Supervisor Chairman
Committee
Executive President
Committee (Including Operating Strategic
Decision Committee)
General A
dministration of
Personal Finance
General A
dministration of R
isk
General A
dministration of
Instutional Finance
General A
dministration of
Finance
General A
dministration and
Business and Service
General A
dministration of
Auditing
Secretariat
Hum
an Resources D
epartment
Employee Training C
enter
Information D
epartment
Business D
epartment.
Finance Departm
ent
Corporate Financial B
usiness Departm
ent International B
anking Departm
ent O
ffshoreB
usinesssUnit
Trust Departm
ent
Credit C
ards Departm
ent
Consum
ing Financial Business D
epartment
Wealth M
anagement D
epartment
General A
dministration of B
ranches.
Risk A
dministration D
epartment
Credit M
anagement D
epartment
Debt M
anagement D
epartment.s.
6
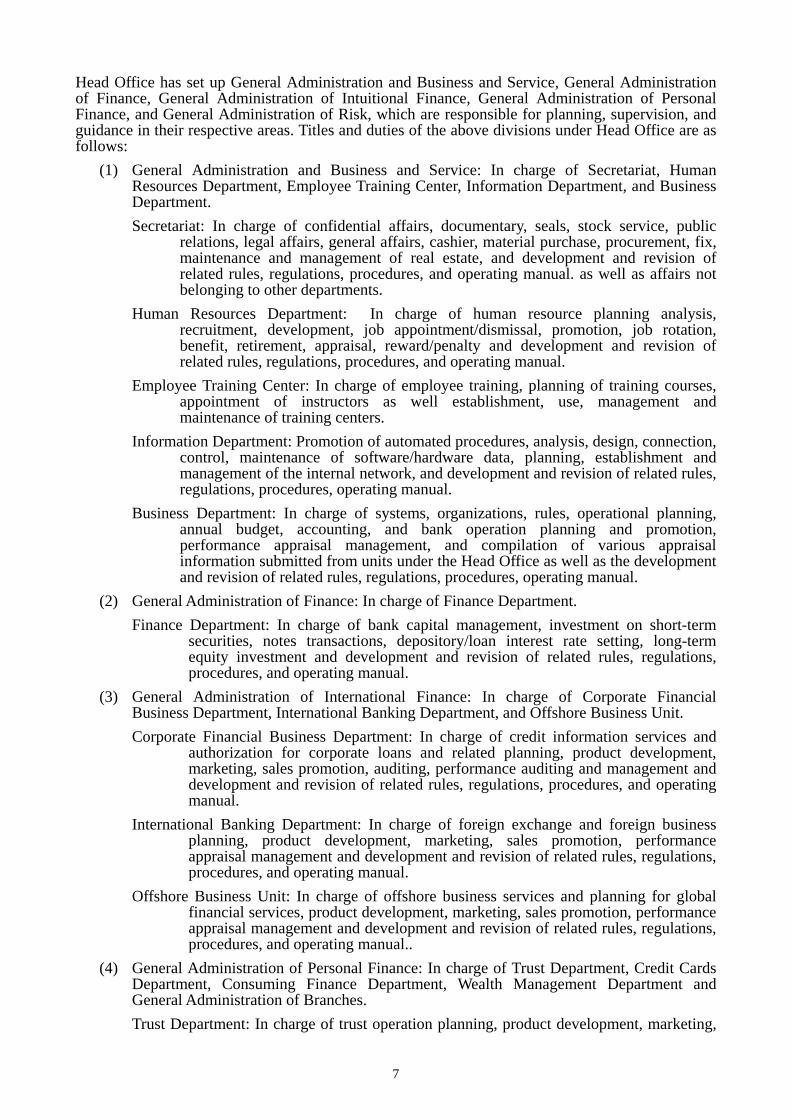
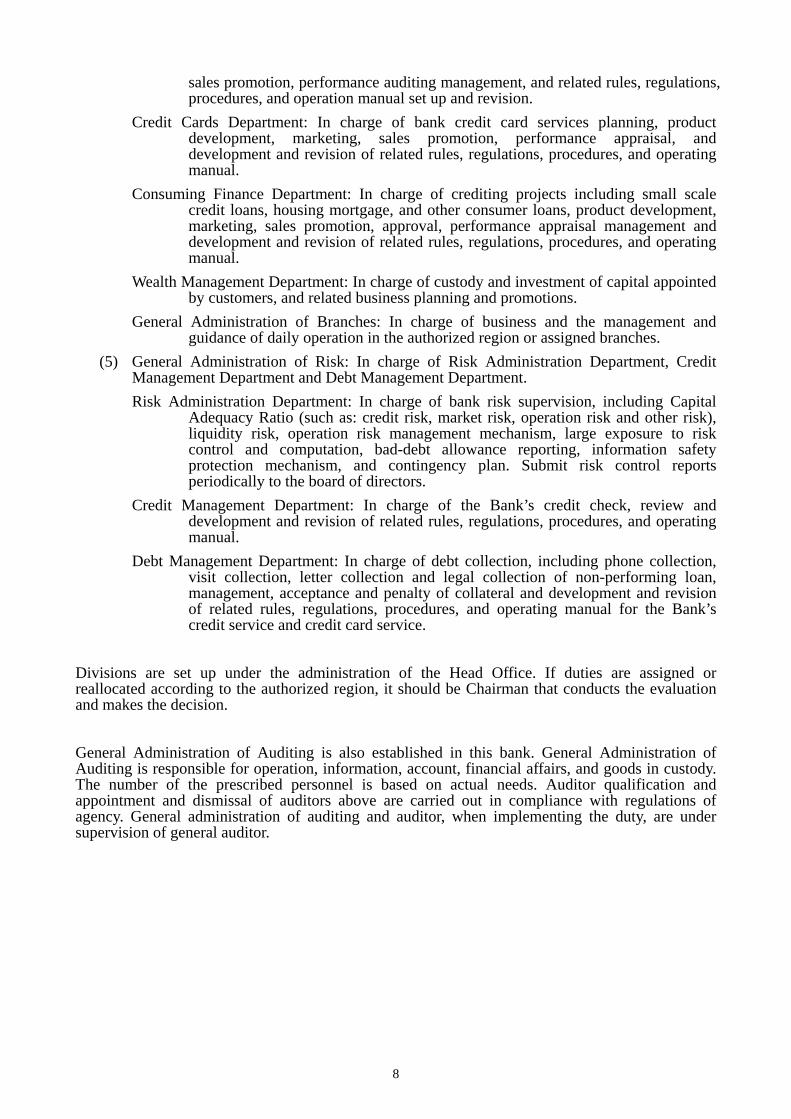
Head Office has set up General Administration and Business and Service, General Administration of Finance, General Administration of Intuitional Finance, General Administration of Personal Finance, and General Administration of Risk, which are responsible for planning, supervision, and guidance in their respective areas. Titles and duties of the above divisions under Head Office are as follows:
(1) General Administration and Business and Service: In charge of Secretariat, Human Resources Department, Employee Training Center, Information Department, and Business Department. Secretariat: In charge of confidential affairs, documentary, seals, stock service, public
relations, legal affairs, general affairs, cashier, material purchase, procurement, fix, maintenance and management of real estate, and development and revision of related rules, regulations, procedures, and operating manual. as well as affairs not belonging to other departments.
Human Resources Department: In charge of human resource planning analysis, recruitment, development, job appointment/dismissal, promotion, job rotation, benefit, retirement, appraisal, reward/penalty and development and revision of related rules, regulations, procedures, and operating manual.
Employee Training Center: In charge of employee training, planning of training courses, appointment of instructors as well establishment, use, management and maintenance of training centers.
Information Department: Promotion of automated procedures, analysis, design, connection, control, maintenance of software/hardware data, planning, establishment and management of the internal network, and development and revision of related rules, regulations, procedures, operating manual.
Business Department: In charge of systems, organizations, rules, operational planning, annual budget, accounting, and bank operation planning and promotion, performance appraisal management, and compilation of various appraisal information submitted from units under the Head Office as well as the development and revision of related rules, regulations, procedures, operating manual.
(2) General Administration of Finance: In charge of Finance Department. Finance Department: In charge of bank capital management, investment on short-term
securities, notes transactions, depository/loan interest rate setting, long-term equity investment and development and revision of related rules, regulations, procedures, and operating manual.
(3) General Administration of International Finance: In charge of Corporate Financial Business Department, International Banking Department, and Offshore Business Unit. Corporate Financial Business Department: In charge of credit information services and
authorization for corporate loans and related planning, product development, marketing, sales promotion, auditing, performance auditing and management and development and revision of related rules, regulations, procedures, and operating manual.
International Banking Department: In charge of foreign exchange and foreign business planning, product development, marketing, sales promotion, performance appraisal management and development and revision of related rules, regulations, procedures, and operating manual.
Offshore Business Unit: In charge of offshore business services and planning for global financial services, product development, marketing, sales promotion, performance appraisal management and development and revision of related rules, regulations, procedures, and operating manual..
(4) General Administration of Personal Finance: In charge of Trust Department, Credit Cards Department, Consuming Finance Department, Wealth Management Department and General Administration of Branches. Trust Department: In charge of trust operation planning, product development, marketing,
7
8
sales promotion, performance auditing management, and related rules, regulations, procedures, and operation manual set up and revision.
Credit Cards Department: In charge of bank credit card services planning, product development, marketing, sales promotion, performance appraisal, and development and revision of related rules, regulations, procedures, and operating manual.
Consuming Finance Department: In charge of crediting projects including small scale credit loans, housing mortgage, and other consumer loans, product development, marketing, sales promotion, approval, performance appraisal management and development and revision of related rules, regulations, procedures, and operating manual.
Wealth Management Department: In charge of custody and investment of capital appointed by customers, and related business planning and promotions.
General Administration of Branches: In charge of business and the management and guidance of daily operation in the authorized region or assigned branches.
(5) General Administration of Risk: In charge of Risk Administration Department, Credit Management Department and Debt Management Department. Risk Administration Department: In charge of bank risk supervision, including Capital
Adequacy Ratio (such as: credit risk, market risk, operation risk and other risk), liquidity risk, operation risk management mechanism, large exposure to risk control and computation, bad-debt allowance reporting, information safety protection mechanism, and contingency plan. Submit risk control reports periodically to the board of directors.
Credit Management Department: In charge of the Bank’s credit check, review and development and revision of related rules, regulations, procedures, and operating manual.
Debt Management Department: In charge of debt collection, including phone collection, visit collection, letter collection and legal collection of non-performing loan, management, acceptance and penalty of collateral and development and revision of related rules, regulations, procedures, and operating manual for the Bank’s credit service and credit card service.
Divisions are set up under the administration of the Head Office. If duties are assigned or reallocated according to the authorized region, it should be Chairman that conducts the evaluation and makes the decision. General Administration of Auditing is also established in this bank. General Administration of Auditing is responsible for operation, information, account, financial affairs, and goods in custody. The number of the prescribed personnel is based on actual needs. Auditor qualification and appointment and dismissal of auditors above are carried out in compliance with regulations of agency. General administration of auditing and auditor, when implementing the duty, are under supervision of general auditor.

9
2. Information of Director/Supervisor, President, Vice President, Deputy Executive Vice President, Department and Branch Office Chiefs (1) Board of Directors/Supervisors
a. Profiles of Board of Directors/Supervisors Other Chief, Director or Supervisor as Spouse, Minors or
any other Relatives within the second level relationships Holding at Selection Present Holding Current Shares of Spouse and Minors Holding Shares in Other Names
Position Name Date of Employment Service Tenure Initial Elected Date
Shares Ratio % Shares Ratio
% Shares Ratio % Shares Ratio
%
Education & Experience Concurrent Positions at our Bank and Other Companies Position Name Relationship
Chairman Chen, Sheng-Hung 2006-05-02 3 years 1997-09-01 6,905,806 0.56% 7,179,892 0.58% 1,832,655 0.15% - -
The 3rd to 7th Taipei City Councilor Chairman of Board of Directors of Yang Ming Shan Credit Union The 1st - 4th Chairman of Sunny Bank The 4th & 5th legislator Graduated from university
Director of Chuan Yam Construction Co., Ltd. Standing Director Chen, Chin-Chia Brother
Standing Director Wu, Hsi-Hui 2006-05-02 3 years 1997-09-01 2,345,282 0.19% 2,367,364 0.19% - - - -
Chairman of Yang Ming Shan Gas Co., Ltd. Chairman of Board of Directors of Yang Ming Shan Credit Union The 1st - 4th Standing Director of Sunny Bank Chairman of Cheng Fa Films Co., Ltd. Graduated from primary school
Chairman of Yang Ming Shan Gas Co., Ltd. None None None
Standing Director Liu, Chen-Sheng 2006-05-02 3 years 1997-09-01 4,774,766 0.38% 4,964,272 0.40% 942,582 0.08% - -
Chairman of Jih Chien Enterprise Co., Ltd. Director & Supervisor of Yang Ming Shan Credit Union The 1st Director and The 2nd - 4th Standing Director of Sunny Bank Chairman of Shihpai Tzuchiang General Market Co., Ltd. Graduated from senior commercial high school
Chairman of Shihpai Tzuchiang General Market Co., Ltd. Assistant Manager Manager
Liu, Ming-Chieh Chen, Yao-Wen
Father & Son Relatives
Standing Director Chen, Chin-Chia 2006-05-02 3 years 2000-06-12 3,711,097 0.30% 4,177,407 0.34% 6,894,974 0.55% - - Director of Po Yun Wu Enterprise Co., Ltd. Director of Formosa On-line Co., Ltd. The 2nd - 3rd Director and The 4th Standing Director of Sunny Bank Graduated from university
Director of Po Yun Wu Enterprise Co., Ltd. Chairman Chen, Sheng-Hung Brother
Independent Standing Director Sun, Ping-Yen 2006-05-02 3 years 2006-05-02 - - - - - - - -
Standing Director of Taiwan Cooperative Bank Commissioner of Basic Financial Innovation Section, Ministry of Finance, Executive Yuan Commissioner and Director of Higher Examinations, Examination Yuan Adjunct Professor of National Taipei University The 4th Independent Standing Director of Sunny Bank Graduated from doctor
None None None None
Director Representative of Fu Li Yang Investment Co., Ltd.: Chen,
Chien-Yang 2006-05-02 3 years 2003-05-19
2006-05-02 2,134,140 1,298,704
0.17%0.10%
82,952,7663,717,876
6.67%0.30%
- 907,439
- 0.07%
- - Lecturer of Ching Kuo Institute of Technology President of Yi Lien Co., Ltd. The 4th Director of Sunny Bank Graduated from master
Director of Fu Hao Garden Hotel Director of Yi Lien Co., Ltd. Director of Pang Ji Development Co., Ltd.
None None None
Director Representative of Fu Li Yang
Investment Co., Ltd.: Lin, Chin-Lung
2006-05-02 3 years 2003-05-19 2003-05-19
2,134,140 494,126
0.17%0.04%
82,952,766900,049
6.67%0.07%
- 1,297,931
- 0.10%
- - Manager of Trust and Business Department, Taipei Business Bank Vice President and President of Sunny Bank The 2nd Standing Director and The 3rd & 4th Director of Sunny Bank Graduated from university
None None None None
Director Ho, Shun-Cheng 2006-05-02 3 years 1997-09-01 4,280,833 0.34% 4,450,735 0.36% 5,448,570 0.44% - - Person-in-Charge of Yuan Shun Jewelry Co., Ltd. Director of Yang Ming Shan Credit Union The 1st - 4th Director of Sunny Bank Graduated from senior high school
None None None None
Director Chang, Wu-Ping 2006-05-02 3 years 1997-09-01 5,946,478 0.48% 6,182,489 0.50% 1,186,638 0.10% - - Director of Yang Ming Shan Credit Union The 1st - 4th Director of Sunny Bank Graduated from senior commercial high school
Shareholder of Caby Sound Co. Chairman of Ping An Construction Co., Ltd. None None None
Director Lin, Cheng-Yu 2006-05-02 3 years 2006-05-02 4,604,609 0.37% 5,387,362 0.43% 420,818 0.03% - - Chairman of Kuo Chih Construction Co., Ltd. The 4th Director of Sunny Bank Graduated from university
Supervisor of Sheng Tai Construction Co., Ltd. Director of State Glory Enterprises Co., Ltd. Chairman of Kuo Chih Construction Co., Ltd. Director of Ji Lai Development Shareholder of Lin Sheng Construction Co., Ltd.
None None None
Director Chen, Chin-Yi 2006-05-02 3 years 1997-09-01 8,485,015 0.68% 8,821,778 0.71% - - - - Director of Yang Ming Shan Credit Union The 1st - 4th Director of Sunny Bank Chairman of Sunny Life Insurance Brokerage Co., Ltd. Graduated from university
Supervisor of Chin Chia Technology Co., Ltd. Chairman of Sunny Property & Insurance Brokerage Co., Ltd. Chairman of Sunny Life Insurance Brokerage Co., Ltd.
None None None
Director Chao, Fu-Tien 2006-05-02 3 years 2006-05-02 2,823,166 0.23% 2,935,215 0.24% 76,133 0.01% - - Chairman of Kao Shin Bank Supervisor of Yung Chi Paper Manufacturing Co., Ltd. The 4th Director of Sunny Bank Graduated from high vocational school
Director of Sunny Life Insurance Brokerage Co., Ltd. Director of Sunny Property & Insurance Brokerage Co., Ltd. Manager Chao, Yu-Chin Father & Son
Director Huang, Cheng-Nan 2006-05-02 3 years 2006-05-02 3,736,717 0.30% 3,898,907 0.31% 643,589 0.05% - - Honorary Board Chairman of Kao Shin Bank Chairman of Long Da Hotel Co., Ltd. The 4th Director of Sunny Bank Graduated from university
Director of Sunny Property & Insurance Brokerage Co., Ltd. Director of I Cheng Hotel Co., Ltd. Chairman of Long Da Hotel Co., Ltd. Director of Sunny Property & Insurance Brokerage Co., Ltd.
None None None
Independent Director Liu, Hsiang-Tun 2006-05-02 3 years 2006-05-02 - - - - - - - -
Judge of District Court and Chief of Court Person-in-Charge of Hsiang Chih Law Office The 4th Independent Director of Sunny Bank Graduated from university
Chairman, Dian Sheng Construction Co., Ltd. None None None
Standing Supervisor Hsu, Po-Hsiung 2006-05-02 3 years 1997-09-01 3,743,869 0.30% 3,832,460 0.31% 2,306,716 0.19% - - Chairman of Tung Cheng Ceramics Co., Ltd. Supervisor & Chairman of Yang Ming Shan Credit Union The 1st - 4th Standing Supervisor of Sunny Bank Graduated from senior high school
Chairman of Tung Cheng Ceramics Co., Ltd. Supervisor of Sunny Property & Insurance Brokerage Co., Ltd. Supervisor of Sunny Property & Insurance Brokerage Co., Ltd.
None None None
Supervisor Tsai, Wen-Hsiung 2006-05-02 3 years 1997-09-01 5,762,633 0.46% 7,405,159 0.60% 5,104,014 0.41% - -
C.P.A. of Chang Chi Union Accounting Office Supervisor of Yang Ming Shan Credit Union Director of Jui Hsiang Development Co., Ltd. The 1st - 4th Supervisor of Sunny Bank Graduated from graduate school
Director of Jui Hsiang Development Co., Ltd. None None None
Supervisor Kao, Ming-Chih 2006-05-02 3 years 2000-06-12 733,550 0.06% 762,664 0.06% 1,557,391 0.13% - - Member Representative of Yang Ming Shan Credit Union The 2nd - 4th Supervisor of Sunny Bank Director of Ancient Chinese Pottery Co., Ltd. Graduated from university
Director of Ancient Chinese Pottery Co., Ltd. Director of Tung Ying Construction Co., Ltd. None None None
Supervisor Chen, Sen-Jung 2006-05-02 3 years 1997-09-01 736,915 0.06% 749,510 0.05% 646,331 0.05% - - Manager of Yang Ming Shan Credit Union The 1st - 4th Supervisor of Sunny Bank Graduated from middle school
None None None None
Independent Supervisor Chiang, Chun-Huai 2006-05-02 3 years 2006-05-02 - - - - - - - -
Director of Saving Service Station of Saving Dept., Branch Manager, Director of Overdue Loan Processing Center of Land Bank of Taiwan The 4th Independent Supervisor of Sunny Bank Graduated from university
None None None None
Date: December 31, 2008

10
b. Information of Director and Supervisor Base Date: December 31, 2008
Over 5 years of work experience and the professional qualifications below
Independence (Note) Qualification
Name
Commerce, law, finance, accounting, orcompany operation related public/private school lecturer
Judge, prosecutor, lawyer, accountant, or other professional and technician certified with company required-national examinations
Commerce, law, finance, accounting, or company operation related work experience
1 2 3 4 5 6 7 8 9 10
The number of other public-listed
companies where independent
direct is served as concurrently
Chen, Sheng-Hung None Wu, Hsi-Hui None
Liu, Chen-Sheng None Representative of Fu Li
Yang Investment Co., Ltd.: Chen, Chien-Yang
None
Representative of Fu Li Yang Investment Co., Ltd.:
Lin, Chin-Lung
None
Chang, Wu-Ping None Ho, Shun-Cheng None Chen, Chin-Chia None Chen, Chin-Yi None Lin, Cheng-Yu None Chao, Fu-Tien None
Huang, Cheng-Nan None Liu, Hsiang-Tun None Sun, Ping-Yen None
Hsu, Po-Hsiung None Chen, Sen-Jung None Kao, Ming-Chih None Tsai, Wen-Hsiung None
Chiang, Chun-Huai None Note: Please tick “ ” in the box below for directors and supervisors that meet the following requirements during 2 years prior to job
appointment or during term in office. (1) Is not hired by the Bank or its affiliates. (2) Is not a director or supervisor in the Bank or its affiliates (this, however, is excepted for independent directors of the Bank, its parent
company, or the subsidiary company where the Bank directly or indirectly holds more than 50% share of voting rights) (3) Is not a natural-person shareholder holding more than 1% of the Bank’s total issued stock under the name of one’s own, spouse or minor
children, nor is one of the Bank’s top ten natural-person shareholders. (4) Is not the spouse, the relatives within the relation rank 2 or the lineal dependent within the relation rank 5 of other directors. (5) Is not a director, supervisor, manager who directly or indirectly hold more than 5% of the Bank’s total issued stock or a director,
supervisor or employee of one of the Bank’s five largest shareholders? (6) Is not a director, supervisor, manager or holder of more than 5% of stock shares in a company or institution that has financial or business
dealings with the Bank. (7) Is not the head of, a partner, a director, supervisor, or manager or their respective spouse of a consulting firm, sole investor, partner,
company or organization that has provided commercial, legal, financial and accounting services or consultancy to the Bank or its affiliates.
(8) Is not the spouse or the relatives within the relation rank 2 of other directors. (9) Has not violated any regulation in Article 30 of Company Act (10) Is not elected as the government, a corporate person or its representative in accordance with Article 27 of Company Act.
c. Major Shareholders of Corporate Shareholders
(a) Major Shareholders of Corporate Shareholders December 31, 2008
Corporate Shareholder Major Shareholder of Corporate Shareholder Holding Proportion Fu Li Yang Investment Co., Ltd. Hsueh, Ling 99.73%
(b) Major Shareholders of Company Comprised of Corporate Shareholders
December 31, 2008 Corporate Shareholder Major Shareholder of Corporate Shareholder Holding Proportion
None None None

11
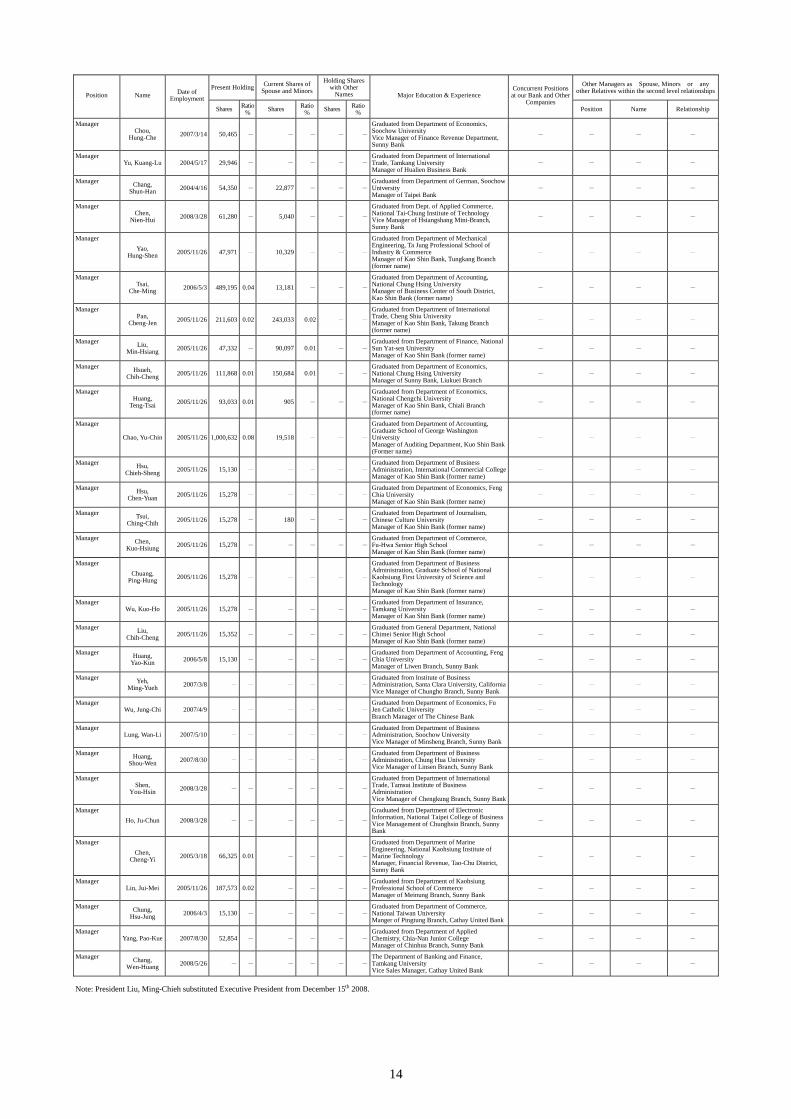
(2) Information of President, Vice President, Deputy Executive Vice President, Departments and Branch Office Chiefs
December 31, 2008
Present Holding Current Shares of Spouse and Minors
Holding Shares with Other
Names Other Managers as Spouse, Minors or any
other Relatives within the second level relationshipsPosition Name Date of Employment
Shares Ratio % Shares Ratio
% Shares Ratio %
Major Education & Experience Concurrent Positions at our Bank and Other
Companies Position Name Relationship
President (Note) Chou, San-Ho 2003/5/19 228,553 0.02 - - - -
Graduated from Department of Economics, National Chengchi University Manager of Administration Department
- - - -
President Chang,
Chi-Ming 2003/5/19 326,213 0.03 88,166 0.01 - -
Graduated from Department of Public Finance, National Chengchi University Deputy Executive Vice President of Chunghsing Branch
- - - -
President Kuo, Chih-Hung 2007/3/14 198,889 0.02 1,419 - - -
Graduated from Department of Business Administration, Tamsui Oxford College Vice President of Administration Department
- - - -
President Yeh, Ching-Tsung 2005/12/1 16,458 - - - - -
Graduated from Department of Economics, Chinese Culture University Manager of Chang Hwa Bank
- - - -
President Lin, Chih-Liang 2007/1/5 425,307 0.03 - - - -
Graduated from Department of Accounting, Feng Chia University Vice President of Administration Department
- - - -
President Wang, Ya-Hsun 2007/3/14 467,132 0.04 1,479 - - -
Graduated from Department of Accounting & Statistics, Tamsui Oxford College Deputy Executive Vice President of Consuming Finance Department, Sunny Bank
- - - -
General Auditor Tseng, Yak-Te 2003/1/2 369,883 0.03 44,120 - - -
Graduated from Department of Accounting & Statistics, Chung Yu Junior College of Business Manager of Administration Department, Sunny Bank
- - - -
Deputy Executive Vice President Liu,
Ming-Chieh 2007/3/14 354,222 0.03 231,450 0.02 - -
Graduated from Department of Applied Business, Open College, National Taipei College of Business Deputy Executive Vice President of Financial Revenue, North 1st District, Sunny Bank
- Manager Chen, Yao-Wen In-Laws
Deputy Executive Vice President
Chen, Jung-Kuei 2007/3/14 157,132 0.01 5,569 - - -
Graduated from Department of Commerce, Kai Nan High Commerce & Technology Professional School Manager of Chien Tan Branch, Sunny Bank,
- - - -
Deputy Executive Vice President Yu, Shih-Jung 2007/3/14 69,996 0.01 586 - - -
Graduated from Department of Commerce, Shih Hsin Professional School of Industry & Commerce Manager of Mucha Branch, Sunny Bank
- - - -
Deputy Executive Vice President Hu, Tsung-Yi 2007/3/14 328,751 0.03 26,743 - - -
Graduated from Department of Business Administration, Open College of Commerce Manager of Financial Revenue, North 2nd District, Sunny Bank
- - - -
Deputy Executive Vice President Kuo,
Ching-Feng 2007/3/14 104,674 0.01 24,034 - - -
Graduated from Department of Comprehensive Commerce, Shih Hsin Professional School of Industry & Commerce Deputy Executive Vice President of Financial Revenue Center, Central District and Taichung Branch, Sunny Bank
- - - -
Deputy Executive Vice President
Hsieh, Yi-Tung 2005/11/26 76,583 0.01 1,178,307 0.09 - -Graduated from Department of Accounting, Open College of Commerce Manager of Business Department, Kao Shin Bank
- - - -
Deputy Executive Vice President Lu, Pie-Lin 2007/3/14 85,939 0.01 - - - -
Graduated from Department of Plant Sciences, Chinese Culture University Manager of Consuming Finance Department:, Sunny Bank
- - - -
Deputy Executive Vice President
Huang, Yen-Chun 2007/3/14 336,100 0.03 21,280 - - -
Graduated from Department of Banking, Tamkang University Manager of Information Department, Sunny Bank
- - - -
Deputy Executive Vice President
Chang, Chih-Hung 2000/9/1 119,876 0.01 76,866 0.01 - -
Graduated from Department of Economics, Fu Jen Catholic University Deputy Executive Vice President, Fuhsing Branch, Sunny Bank
- - - -
Deputy Executive Vice President
Wang, Chien-Yi 2008/4/1 - - - - - -
Graduated from Department of International Trade, Soochow University Deputy Manager of Wealth Management Department
- - - -
Manager Tsao,
Chun-Jung 1995/6/23 337,409 0.03 244,205 0.02 - -
Graduated from Department of Comprehensive Commerce, Shih Hsin Professional School of Industry & Commerce Manager of Operation Department, Sunny Bank
- - - -
Manager Wang, Sheng-Jung 2001/12/10 171,474 0.01 1,328 - - -
Graduated from Department of International Trade, Open College of Commerce Manager of Huacheng Branch, Sunny Bank
- - - -
Manager Kuo,
Ching-Hsien 1996/12/1 392,445 0.03 216,596 0.02 - -
Graduated from Department of Accounting & Statistics, Tai Pei Senior High Commerce Professional School Manager of Tatun Branch ,Sunny Bank
- - - -
Manager Lin, Chi-Kang 2003/4/14 370,259 0.03 28,739 - - -
Graduated from Department of Commerce, Kai Nan High Commerce & Technology Professional School Assistant Manager of Hsinho Mini-Branch
- - - -
Manager Hsu, Wen-Jung 2001/4/13 176,154 0.01 47,163 - - -
Graduated from Department of Commerce, Kai Nan High Commerce & Technology Professional School Manager of Yungho Branch, Sunny Bank
- - - -
Manager Lin, Cheng-Ping 2002/5/1 332,599 0.03 168,278 0.01 - -
MBA of University of South Australia Vice Manager of Lanya Branch, Sunny Bank, - - - -
Manager Chen,
Ming-Wen 2003/5/2 233,046 0.02 3,524 - - -
Graduated from Department of Commerce, Chu-Hai High Commercial School Vice Manager of Sunny Bank, Peitou Branch Assistant Manager of Taan Mini-Branch, Sunny Bank.
- - - -
Manager Kao, Chin-Mu 1998/9/11 259,629 0.02 154,577 0.01 - -
Graduated from Department of Electronic Engineering, Kuang Wu Junior College of Technology Manager of Hsinchuang Branch, Sunny Bank,
- - - -
Manager Kuo,
Huang-Lung 2001/9/11 155,096 0.01 - - - -
Graduated from Department of Business Administration, Open Business College Affiliated with National Taipei College of Business Vice Manager of Tatun Branch, Sunny Bank
- - - -
Manager Chang, Jung-Pin 2006/5/3 58,067 - 516,025 0.04 - -
Graduated from Department of Machinery, Lienho Junior College of Technology Manager of , Chaochou Branch, Sunny Bank
- - - -
Manager Chen,
Kuo-Hung 2001/9/15 96,511 0.01 2,585 - - -
Graduated from Department of Comprehensive Commerce, Yu Da High School of Commerce and Home Economics Manager of Pingtung Branch,Sunny Bank,
- - - -

12
Present Holding Current Shares of Spouse and Minors
Holding Shares with Other
Names Other Managers as Spouse, Minors or any
other Relatives within the second level relationshipsPosition Name Date of Employment
Shares Ratio % Shares Ratio
% Shares Ratio %
Major Education & Experience Concurrent Positions at our Bank and Other
Companies Position Name Relationship
Manager Yang,
Chen-Sheng 2006/11/9 273,460 0.02 168,565 0.01 - -
Graduated from Department of Comprehensive Commerce, Sung Shan High School of CommerceVice Manager of Business Department and Lanya Branch, Sunny Bank
- - - -
Manager Chen, Pao-Yuan 2006/2/23 110,321 0.01 145,444 0.01 - -
Graduated from Department of Public Finance, National Chung Hsing University Vice Manager of Hsinhsing Branch, Sunny Bank
- - - -
Manager
Yang, Lien-Tse 1999/12/9 340,788 0.03 399,942 0.03 - -
Graduated from Department of Accounting, Graduate School of Soochow University(On-job Training Courses) Manager of Accounting Section, Business Department, Sunny Bank
- - - -
Manager Cheng, Pei-Nan 2001/4/9 40,453 - 348,328 0.03 - -
Graduated from Department of Business Administration, Tamkang University Vice Manager of Lungchiang Branch , Sunny Bank,
- - - -
Manager Chen,
Cheng-Feng 2000/9/1 214,406 0.02 - - - -
Graduated from International Trade Department, Chie Lee College Manager, General Administration of Branches, Sunny Bank
- - - -
Manager Kao, Chih-Li 2003/3/1 278,433 0.02 7,059 - - -
Studied in Department of Computer, Tamkang University Manager of Sanchung Branch, Sunny Bank
- - - -
Manager Wu, Chia-Cheng 2002/8/8 267,935 0.02 4,159 - - -
Graduated from General Department of Tamkang High School Manager of Chienkang Branch, Sunny Bank,
- - - -
Manager Tsai, Kun-Ti 2001/9/15 167,142 0.01 86,022 0.01 - -
Graduated from Executive Master of Business Administration, National PingTung University of Science & Technology Manager of Tsuoying Branch, Sunny Bank,
- - - -
Manager Chen, Yi-Huan 1999/4/23 433,357 0.03 53,768 - - -
Graduated from Department of Comprehensive Commerce, Chu-Hai High Commercial School Manager of Human Resources Department and Secretariat
- - - -
Manager Yueh,
Wen-Chang 1999/5/6 81,794 0.01 5,330 - - -
Graduated from Department of Business Administration, National Taipei College of Business Manager of Panchiao Branch, Sunny Bank,
- - - -
Manager Chiu, Chuan-Mao 2002/7/1 152,729 0.01 - - - -
Graduated from Department of Public Finance, National Taipei College of Business Vice Manager of Hsichou Branch , Sunny Bank,
- - - -
Manager Chen, Chi-Chuan 2003/10/16 432,587 0.03 73,600 0.01 - -
Graduated from Department of Finance, Ming Chuan College Manager of Yungho Branch, Sunny Bank,
- - - -
Manager Chen, Chih-Hao 2006/5/3 65,511 0.01 66,289 0.01 - -
Graduated from Department of Bank Insurance, National Taipei College of Business Vice Manager of Tzuyu Branch, Sunny Bank
- - - -
Manager Chiang, Tung-Sheng 2002/7/1 159,697 0.01 - - - -
Graduated from Department of Business Administration, Takming College Sub-manager of Tayeh Branch, Sunny Bank.
- - - -
Manager Chen,
Hui-Ling 2006/8/11 342,883 0.03 - - - -
Graduated from Department of Finance, National Taiwan University Vice Manager of Finance Department, Sunny Bank
- - - -
Manager Chen, Kuo-Chuan 2001/8/15 241,512 0.02 - - - -
Graduated from Department of Accounting, National Chung Hsing University Vice Manager of Luchou Branch, Sunny Bank
- - - -
Manager Chien,
Chih-Hsin 2002/7/1 113,909 0.01 26,474 - - -
Graduated from Department of Economics, Tamkang University Manager of Financial Revenue, North 3rd District, Sunny Bank
- - - -
Manager Hung,
Jung-Tsung 2006/8/11 69,105 0.01 - - - -
Graduated from Department of Accounting, National Chung Hsing University Vice Manager of Corporate Financial Business Department, Sunny Bank
- - - -
Manager Su, Chien-Tsung 2002/8/8 141,501 0.01 - - - -
Graduated from Department of International Trade Feng Chia University Manager of Yungho Branch, Sunny Bank,
- - - -
Manager Lee,
Ching-Cheng 2001/8/15 59,413 - - - - -
Graduated from Department of Business Administration, Fu Jen Catholic University Manager, Wealth Management Department, Sunny Bank
- - - -
Manager Lin, Kuo-Hung 2003/7/7 133,767 0.01 7,135 - - -
Graduated from Department of Business Administration, Feng Chia University Vice Manager of Hsinyi Branch, Sunny Bank,
- - - -
Manager Wu, Cheng-Hao 2005/3/14 29,422 - 24,547 - - -
Graduated from Department of Business Administration, Fu Jen Catholic University Manager of Tainan Branch, Sunny Bank,
- - - -
Manager Luo,
Ching-Yang 2007/8/30 496 - 496 - - -
Graduated from Department of Industrial Management, National Taiwan University of Science and Technology Vice Manager of Chingmei Branch, Sunny Bank
- - - -
Manager Chu, Shu-Chun 2006/8/11 68,546 0.01 37,905 - - -
Graduated from Department of Statistics, National Chengchi University Vice Manager of Chunghsing Branch, Sunny Bank
- - - -
Manager Chuang, Yung-Fu 2002/7/1 79,247 0.01 - - - -
Graduated from Department of Accounting, Feng Chia University Manager of Financial Revenue Center, North 1st District, Sunny Bank.
- - - -
Manager Lee, Wen-Hui 2001/9/20 153,447 0.01 - - - -
Graduated from Department of Cooperative Economics, Tamkang University Manager of Taipei Branch, Sunny Bank
- - - -
Manager
Chen, Yao-Wen 2002/7/1 24,345 - 221,184 0.02 - -
Graduated from Graduate School of Computer Science and Information Engineering, National Chung Cheng University Graduated from Department of Information, Graduate School of National Chung Cheng University Vice Manager of Lanya Branch, Sunny Bank
- Manager Liu, Ming-Chieh In-Laws
Manager Chou,
Chih-Wei 2006/8/11 90,383 0.01 231,176 0.02 - -
Graduated from Department of Industrial Management, National Taiwan Institute of Technology Vice Manager of Chingnien Branch, Sunny Bank
- - - -
Manager Huang, Chi-Wei 2005/10/11 74,672 0.01 42,468 - - -
Graduated from Department of Public Finance, Tak Ming Junior College of Commerce Manager of Chungcheng Branch , Sunny Bank,
- - - -
Manager Su, Hsin-Yi 2006/2/23 98,060 0.01 26,895 - - -
Graduated from Department of Management, Lung Hwa Junior College of Technology Vice Manager of Chienchen Branch, Sunny Bank
- - - -
Manager Lu, Ching-Yu 2005/3/14 93,119 0.01 - - - -
Graduated from Department of Accounting, Feng Chia University Vice Manager of Business Department, Sunny Bank
- - - -

13
Present Holding Current Shares of Spouse and Minors
Holding Shares with Other
Names Other Managers as Spouse, Minors or any
other Relatives within the second level relationshipsPosition Name Date of Employment
Shares Ratio % Shares Ratio
% Shares Ratio %
Major Education & Experience Concurrent Positions at our Bank and Other
Companies Position Name Relationship
Manager
Lu, Han-Kun 2002/10/1 285,416 0.02 152,583 0.01 - -
Graduated from Graduate School of Finance, National Kaohsiung First University of Science and Technology. Manager, Financial Revenue, South 1st District, Sunny Bank
- - - -
Manager Tseng,
Chien-Chia 2002/8/8 131,904 0.01 19,374 - - -
Graduated from Department of Economics, Chinese Culture University Manager of Sunny Bank, Hsihua Branch Financial Revenue, South 2nd District, Sunny Bank
- - - -
Manager Tsai, Chien-Li 2005/7/18 90,950 0.01 - - - -
Graduated from Department of Engineering, Tung Hai University Manager of Lingya Branch, Sunny Bank,
- - - -
Manager Chen,
Hsien-Chun 2006/2/23 71,416 0.01 - - - -
Graduated from Department of Business Administration, Takming Junior College of Commerce Manager of Taoyuan Branch, Sunny Bank
- - - -
Manager Chang,
Wen-Sung 2001/12/10 108,868 0.01 48,302 - - -
Graduated from Department of Business Administration, Tamkang University Senior Specialist of General Administration of Branches, Sunny Bank
- - - -
Manager Yang, Ying-Chung 2006/2/23 31,698 - 89,326 0.01 - -
Graduated from Department of Accounting, National Chengchi University Manger of Kuanting Mini Branch, Sunny Bank
- - - -
Manager Lee, Yu-Sheng 2002/7/25 130,871 0.01 - - - -
Graduated from Department of Economics, Chinese Culture University Manager of Chingmei Branch, Sunny Bank.
- - - -
Manager Chen, Chu-Wen 2006/5/3 69,299 0.01 - - - -
Graduated from Department of Business Administration, Feng Chia University Manger of Sunny Bank, Chihua Branch
- - - -
Manager Tang, Ying-Kuei 2003/4/28 114,920 0.01 24,736 - - -
Graduated from Graduate School of Finance, National Central University Manager of Nanking Branch, Sunny Bank,
- - - -
Manager Pan, Kuang-Chu 2004/9/23 42,789 - 25,459 - - -
Graduated from Department of Banking, Tamkang University Manager of Chungli Branch, Sunny Bank
- - - -
Manager
Liu, Yen-Hsing 2003/12/24 42,395 - 65,331 0.01 - -
Graduated from Department of Accounting & Statistics, Chung Yu Junior College of Business Administration Manager of Financial Revenue Center, North 2nd District, Sunny Bank
- - - -
Manager Kuo, Li-Chung 2006/2/23 105,855 0.01 - - - -
Graduated from Department of Commerce, National Taiwan University, Manger of Chienkuo Branch, Sunny Bank
- - - -
Manager Huang, Shou-Chih 2006/2/23 87,679 0.01 24,841 - - -
Graduated from Department of Business Administration, Fu Jen Catholic University Vice Manger of Chingwu Branch, Sunny Bank,
- - - -
Manager Huang,
Che-Ming 2007/8/30 72,507 0.01 57,982 - - -
Graduated from Department of Accounting, Yu Da College of Business Vice Manager of Hsintien Mini Branch, Sunny Bank
- - - -
Manager Tseng,
Chieh-Chang 2005/7/18 60,470 - - - - -
Graduated from Department of Bank Insurance, Open Business College Affiliated with National Taipei College of Business Manager of Chiayi Branch, Sunny Bank
- - - -
Manager Chu, Chia-Lung 2006/8/11 79,762 0.01 - - - -
Graduated from Department of Cooperative Economics, National Chung Hsing University Vice Manger of Panchiao Branch, Sunny Bank
- - - -
Manager
Chen, Chi-Wen 2007/3/14 128,410 0.01 - - - -
Graduated from Department of Naval Architecture Engineering, National Taiwan University Vice Manager of Information Department, Sunny Bank
- - - -
Manager Hu, Chun-Wei 2006/5/3 87,691 0.01 - - - -
Graduated from Department of German, Chinese Culture University Vice Manger of Sanfeng Branch, Sunny Bank
- - - -
Manager Chiang,
Hsien-Chang 1999/12/9 109,968 0.01 - - - -
Graduated from Department of Cooperative Economics, National Chung Hsing University Manager of Financial Revenue, North 1st District, Sunny Bank
- - - -
Manager Chang,
Ching-Pin 2003/5/8 88,669 0.01 27,247 - - -
Graduated from Department of Commerce, National Open University Senior Specialist of Huacheng Branch, Sunny Bank
- - - -
Manager Kuo,
Chiang-Hai 2003/3/1 88,669 0.01 27,247 - - -
Graduated from The Air Video College of Continuing Education Affiliated National Taichung Institute of Technology Manager of Sanmin Branch, Sunny Bank
- - - -
Manager Lee, Hsu-Chang 2007/7/9 62,088 - 4,618 - - -
Graduated from Yung Ta Institute of Technology Vice Manager of Chungcheng Branch, Sunny Bank.
- - - -
Manager Kan,
Wu-Cheng 2006/12/1 43,936 - - - - -
Graduated from Department of International Trade, Soochow University Manager of Financial Revenue Center, North 1st District and Chunghsing Branch, Sunny Bank
- - - -
Manager Hsieh, Chin-Chiang 2006/5/5 19,234 - - - - -
Graduated from Executive Master of Business Administration, Southern Taiwan University Manger of Chunghua Branch, Sunny Bank
Manager Kuo, Chung-Chieh 2008/3/28 52,720 - - - - -
Graduated from Dept. of Cooperative Economics, Feng Chia University Manger of Chunghua Branch, Sunny Bank
- - - -
Manager Tsai, Wei-Yung 2007/7/9 32,663 - - - - -
Graduated from Department of Accounting, Aletheia University Vice Manager of Kuanghua Branch, Sunny Bank
- - - -
Manager Liu, Wen-Ho 2006/5/3 69,712 0.01 - - - -
Graduated from Department of Accounting, Chinese Culture University Manger of Yungkang Branch, Sunny Bank
- - - -
Manager Chen, Ting-Yi 2005/7/1 69,326 0.01 - - - -
Graduated from Department of International Trade, Feng Chia University Vice Manager of Sunny Bank, Hsinchu Branch
- - - -
Manager Hsu, Chen-Huang 2006/8/11 69,536 0.01 - - - -
Graduated from Department of Business Administration, Tamkang University Vice Manger of Pingteng Branch, Sunny Bank
- - - -
Manager Sung,
Ping-Ping 2007/3/14 15,436 - - - - -
Graduated from Department of Business Administration, National Taipei College of Business Vice Manager of Consuming Finance Department, Sunny Bank
- - - -
Manager Lan, Yu-Lin 2002/8/8 91,202 0.01 - - - -
Graduated from Department of Bank Insurance, National Taipei College of Business Manager of Business Department, Sunny Bank
- - - -
14
Present Holding Current Shares of Spouse and Minors
Holding Shares with Other
Names Other Managers as Spouse, Minors or any
other Relatives within the second level relationshipsPosition Name Date of Employment
Shares Ratio % Shares Ratio
% Shares Ratio %
Major Education & Experience Concurrent Positions at our Bank and Other
Companies Position Name Relationship
Manager Chou,
Hung-Che 2007/3/14 50,465 - - - - -
Graduated from Department of Economics, Soochow University Vice Manager of Finance Revenue Department, Sunny Bank
- - - -
Manager Yu, Kuang-Lu 2004/5/17 29,946 - - - - -
Graduated from Department of International Trade, Tamkang University Manager of Hualien Business Bank
- - - -
Manager Chang, Shun-Han 2004/4/16 54,350 - 22,877 - - -
Graduated from Department of German, Soochow University Manager of Taipei Bank
- - - -
Manager Chen,
Nien-Hui 2008/3/28 61,280 - 5,040 - - -
Graduated from Dept. of Applied Commerce, National Tai-Chung Institute of Technology Vice Manager of Hsiangshang Mini-Branch, Sunny Bank
- - - -
Manager Yao,
Hung-Shen 2005/11/26 47,971 - 10,329 - - -
Graduated from Department of Mechanical Engineering, Ta Jung Professional School of Industry & Commerce Manager of Kao Shin Bank, Tungkang Branch (former name)
- - - -
Manager Tsai,
Che-Ming 2006/5/3 489,195 0.04 13,181 - - -
Graduated from Department of Accounting, National Chung Hsing University Manager of Business Center of South District, Kao Shin Bank (former name)
- - - -
Manager Pan,
Cheng-Jen 2005/11/26 211,603 0.02 243,033 0.02 - -
Graduated from Department of International Trade, Cheng Shiu University Manager of Kao Shin Bank, Takung Branch (former name)
- - - -
Manager Liu, Min-Hsiang 2005/11/26 47,332 - 90,097 0.01 - -
Graduated from Department of Finance, National Sun Yat-sen University Manager of Kao Shin Bank (former name)
- - - -
Manager Hsueh, Chih-Cheng 2005/11/26 111,868 0.01 150,684 0.01 - -
Graduated from Department of Economics, National Chung Hsing University Manager of Sunny Bank, Liukuei Branch
- - - -
Manager Huang,
Teng-Tsai 2005/11/26 93,033 0.01 905 - - -
Graduated from Department of Economics, National Chengchi University Manager of Kao Shin Bank, Chiali Branch (former name)
- - - -
Manager
Chao, Yu-Chin 2005/11/26 1,000,632 0.08 19,518 - - -
Graduated from Department of Accounting, Graduate School of George Washington University Manager of Auditing Department, Kuo Shin Bank (Former name)
- - - -
Manager Hsu, Chieh-Sheng 2005/11/26 15,130 - - - - -
Graduated from Department of Business Administration, International Commercial CollegeManager of Kao Shin Bank (former name)
- - - -
Manager Hsu, Chen-Yuan 2005/11/26 15,278 - - - - -
Graduated from Department of Economics, Feng Chia University Manager of Kao Shin Bank (former name)
- - - -
Manager Tsui, Ching-Chih 2005/11/26 15,278 - 180 - - -
Graduated from Department of Journalism, Chinese Culture University Manager of Kao Shin Bank (former name)
- - - -
Manager Chen, Kuo-Hsiung 2005/11/26 15,278 - - - - -
Graduated from Department of Commerce, Fu-Hwa Senior High School Manager of Kao Shin Bank (former name)
- - - -
Manager Chuang,
Ping-Hung 2005/11/26 15,278 - - - - -
Graduated from Department of Business Administration, Graduate School of National Kaohsiung First University of Science and Technology Manager of Kao Shin Bank (former name)
- - - -
Manager Wu, Kuo-Ho 2005/11/26 15,278 - - - - -
Graduated from Department of Insurance, Tamkang University Manager of Kao Shin Bank (former name)
- - - -
Manager Liu, Chih-Cheng 2005/11/26 15,352 - - - - -
Graduated from General Department, National Chimei Senior High School Manager of Kao Shin Bank (former name)
- - - -
Manager Huang, Yao-Kun 2006/5/8 15,130 - - - - -
Graduated from Department of Accounting, Feng Chia University Manager of Liwen Branch, Sunny Bank
- - - -
Manager Yeh, Ming-Yueh 2007/3/8 - - - - - -
Graduated from Institute of Business Administration, Santa Clara University, California Vice Manager of Chungho Branch, Sunny Bank
- - - -
Manager Wu, Jung-Chi 2007/4/9 - - - - - -
Graduated from Department of Economics, Fu Jen Catholic University Branch Manager of The Chinese Bank
- - - -
Manager Lung, Wan-Li 2007/5/10 - - - - - -
Graduated from Department of Business Administration, Soochow University Vice Manager of Minsheng Branch, Sunny Bank
- - - -
Manager Huang, Shou-Wen 2007/8/30 - - - - - -
Graduated from Department of Business Administration, Chung Hua University Vice Manager of Linsen Branch, Sunny Bank
- - - -
Manager Shen,
You-Hsin 2008/3/28 - - - - - -
Graduated from Department of International Trade, Tamsui Institute of Business Administration Vice Manager of Chengkung Branch, Sunny Bank
- - - -
Manager Ho, Ju-Chun 2008/3/28 - - - - - -
Graduated from Department of Electronic Information, National Taipei College of BusinessVice Management of Chunghsin Branch, Sunny Bank
- - - -
Manager Chen,
Cheng-Yi 2005/3/18 66,325 0.01 - - - -
Graduated from Department of Marine Engineering, National Kaohsiung Institute of Marine Technology Manager, Financial Revenue, Tao-Chu District, Sunny Bank
- - - -
Manager Lin, Jui-Mei 2005/11/26 187,573 0.02 - - - -
Graduated from Department of Kaohsiung Professional School of Commerce Manager of Meinung Branch, Sunny Bank
- - - -
Manager Chung, Hsu-Jung 2006/4/3 15,130 - - - - -
Graduated from Department of Commerce, National Taiwan University Manger of Pingtung Branch, Cathay United Bank
- - - -
Manager Yang, Pao-Kue 2007/8/30 52,854 - - - - -
Graduated from Department of Applied Chemistry, Chia-Nan Junior College Manager of Chinhua Branch, Sunny Bank
- - - -
Manager Chang, Wen-Huang 2008/5/26 - - - - - -
The Department of Banking and Finance, Tamkang University Vice Sales Manager, Cathay United Bank
- - - -
Note: President Liu, Ming-Chieh substituted Executive President from December 15th 2008.
15
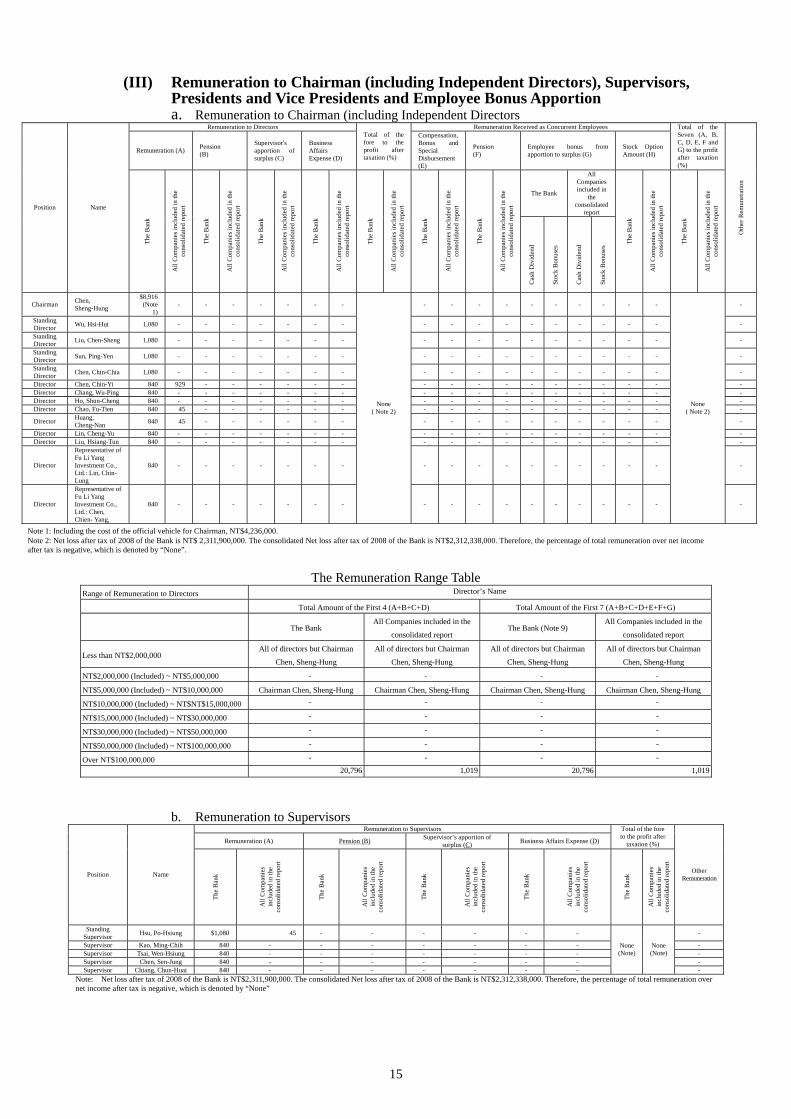
(III) Remuneration to Chairman (including Independent Directors), Supervisors, Presidents and Vice Presidents and Employee Bonus Apportion a. Remuneration to Chairman (including Independent Directors
Remuneration to Directors Remuneration Received as Concurrent Employees
Remuneration (A) Pension (B)
Supervisor's apportion of surplus (C)
Business Affairs Expense (D)
Total of the fore to the profit after taxation (%)
Compensation, Bonus and Special Disbursement (E)
Pension (F)
Employee bonus from apportion to surplus (G)
Stock Option Amount (H)
Total of the Seven (A, B, C, D, E, F and G) to the profit after taxation (%)
The Bank
All Companies included in
the consolidated
report Position Name
The
Ban
k
All
Com
pani
es in
clud
ed in
the
cons
olid
ated
repo
rt
The
Ban
k
All
Com
pani
es in
clud
ed in
the
cons
olid
ated
repo
rt
The
Ban
k
All
Com
pani
es in
clud
ed in
the
cons
olid
ated
repo
rt
The
Ban
k
All
Com
pani
es in
clud
ed in
the
cons
olid
ated
repo
rt
The
Ban
k
All
Com
pani
es in
clud
ed in
the
cons
olid
ated
repo
rt
The
Ban
k
All
Com
pani
es in
clud
ed in
the
cons
olid
ated
repo
rt
The
Ban
k
All
Com
pani
es in
clud
ed in
the
cons
olid
ated
repo
rt
Cas
h D
ivid
end
Stoc
k B
onus
es
Cas
h D
ivid
end
Stoc
k B
onus
es Th
e B
ank
All
Com
pani
es in
clud
ed in
the
cons
olid
ated
repo
rt
The
Ban
k
All
Com
pani
es in
clud
ed in
the
cons
olid
ated
repo
rt
Oth
er R
emun
erat
ion
Chairman Chen, Sheng-Hung
$8,916 (Note
1) - - - - - - - - - - - - - - - - - -
Standing Director Wu, Hsi-Hui 1,080 - - - - - - - - - - - - - - - - - -
Standing Director Liu, Chen-Sheng 1,080 - - - - - - - - - - - - - - - - - -
Standing Director Sun, Ping-Yen 1,080 - - - - - - - - - - - - - - - - - -
Standing Director Chen, Chin-Chia 1,080 - - - - - - - - - - - - - - - - - -
Director Chen, Chin-Yi 840 929 - - - - - - - - - - - - - - - - - Director Chang, Wu-Ping 840 - - - - - - - - - - - - - - - - - - Director Ho, Shun-Cheng 840 - - - - - - - - - - - - - - - - - - Director Chao, Fu-Tien 840 45 - - - - - - - - - - - - - - - - -
Director Huang, Cheng-Nan 840 45 - - - - - - - - - - - - - - - - -
Director Lin, Cheng-Yu 840 - - - - - - - - - - - - - - - - - - Director Liu, Hsiang-Tun 840 - - - - - - - - - - - - - - - - - -
Director
Representative of Fu Li Yang Investment Co., Ltd.: Lin, Chin- Lung
840 - - - - - - - - - - - - - - - - - -
Director
Representative of Fu Li Yang Investment Co., Ltd.: Chen, Chien- Yang,
840 - - - - - - -
None ( Note 2)
- - - - - - - - - -
None ( Note 2)
-
Note 1: Including the cost of the official vehicle for Chairman, NT$4,236,000. Note 2: Net loss after tax of 2008 of the Bank is NT$ 2,311,900,000. The consolidated Net loss after tax of 2008 of the Bank is NT$2,312,338,000. Therefore, the percentage of total remuneration over net income after tax is negative, which is denoted by “None”.
The Remuneration Range Table
Range of Remuneration to Directors Director’s Name
Total Amount of the First 4 (A+B+C+D) Total Amount of the First 7 (A+B+C+D+E+F+G)
The Bank All Companies included in the
consolidated report The Bank (Note 9)
All Companies included in the
consolidated report
Less than NT$2,000,000 All of directors but Chairman
Chen, Sheng-Hung
All of directors but Chairman
Chen, Sheng-Hung
All of directors but Chairman
Chen, Sheng-Hung
All of directors but Chairman
Chen, Sheng-Hung
NT$2,000,000 (Included) ~ NT$5,000,000 - - - -
NT$5,000,000 (Included) ~ NT$10,000,000 Chairman Chen, Sheng-Hung Chairman Chen, Sheng-Hung Chairman Chen, Sheng-Hung Chairman Chen, Sheng-Hung
NT$10,000,000 (Included) ~ NT$NT$15,000,000 - - - -
NT$15,000,000 (Included) ~ NT$30,000,000 - - - -
NT$30,000,000 (Included) ~ NT$50,000,000 - - - -
NT$50,000,000 (Included) ~ NT$100,000,000 - - - -
Over NT$100,000,000 - - - - 20,796 1,019 20,796 1,019
b. Remuneration to Supervisors
Remuneration to Supervisors
Remuneration (A) Pension (B)
Supervisor’s apportion of surplus (C) Business Affairs Expense (D)
Total of the fore to the profit after
taxation (%)
Position Name
The
Ban
k
All
Com
pani
es
incl
uded
in th
e co
nsol
idat
ed re
port
The
Ban
k
All
Com
pani
es
incl
uded
in th
e co
nsol
idat
ed re
port
The
Ban
k
All
Com
pani
es
incl
uded
in th
e co
nsol
idat
ed re
port
The
Ban
k
All
Com
pani
es
incl
uded
in th
e co
nsol
idat
ed re
port
The
Ban
k
All
Com
pani
es
incl
uded
in th
e co
nsol
idat
ed re
port
Other Remuneration
Standing Supervisor Hsu, Po-Hsiung $1,080 45 - - - - - - -
Supervisor Kao, Ming-Chih 840 - - - - - - - - Supervisor Tsai, Wen-Hsiung 840 - - - - - - - - Supervisor Chen, Sen-Jung 840 - - - - - - - - Supervisor Chiang, Chun-Huai 840 - - - - - - -
None (Note)
None (Note)
- Note: Net loss after tax of 2008 of the Bank is NT$2,311,900,000. The consolidated Net loss after tax of 2008 of the Bank is NT$2,312,338,000. Therefore, the percentage of total remuneration over net income after tax is negative, which is denoted by “None”

The Remuneration Range Table Director’s Name
Total Amount of the First 4 (A+B+C+D) Range of Remuneration to Directors The Bank The Bank
Less than NT$2,000,000 All of supervisors listed above All of supervisors listed above NT$2,000,000 (Included) ~ NT$5,000,000 - - NT$5,000,000 (Included) ~ NT$10,000,000 - - NT$10,000,000(Included) ~ NT$15,000,000 - - NT$15,000,000 (Included) ~ NT$30,000,000 - - NT$30,000,000 (Included) ~ NT$50,000,000 - - NT$50,000,000 (Included) ~ NT$100,000,000 - - Over NT$100,000,000 - - Total 4,440 45
c. Remuneration to President and Vice President
Bonus and Special
Disbursement (
Stock Option Amount Total to profit
after taxation(%)
Remuneration (A) Pension(B) Employee bonus from apportion of surplus (D )
C) All Companies included in the
consolidated report The Bank
Oth
er re
mun
erat
ion
All
Com
pani
es in
clud
ed in
th
e co
nsol
idat
ed re
port
All
Com
pani
es in
clud
ed in
th
e co
nsol
idat
ed re
port
All
Com
pani
es in
clud
ed in
th
e co
nsol
idat
ed re
port
All
Com
pani
es in
clud
ed in
th
e co
nsol
idat
ed re
port
All
Com
pani
es in
clud
ed in
th
e co
nsol
idat
ed re
port
Position Name
The
Ban
k
The
Ban
k
The
Ban
k
The
Ban
k
The
Ban
k
Cash Dividend
Stock Dividend
Cash Dividend
Stock Dividend
Chief Secretary
Lin, Chin-Hsiung $2,400 - - - $510 - - - - - - - -
Lin, Chih-Liang President 1,788 - - - 665 - - - - - - - -
Yeh, Ching-Tsung President 2,245 - - - 480 - - - - - - - -
Chou, San-Ho President 2,280 - - - 480 - - - - - - - -
President Chang, Chi-Ming 2,280 45 - - 552 - - - - - - - -
None None (Note) (Note)
Kuo, Chih-Hung President 1,850 4 - - 396 - - - - - - - -
Vice President
Wang, Ya-Hsun 2,081 - - - 440 - - - - - - - -
General Auditor
Tseng, Yao-Te 1,630 - - - 486 - - - - - - - -
Note: Net loss after tax of 2008 of the Bank is NT$2,311,900,000. The consolidated Net loss after tax of 2008 of the Bank is NT$2,312,338,000. Therefore, the percentage of total remuneration over net income after tax is negative, which is denoted by “None”.
The Remuneration Range Table Name of President and Vice President Range of Remunerations to Presidents and
Vice Presidents The Bank All Companies included in the consolidated report D Less than NT$2,000,000 - - NT$2,000,000 (Included) ~ NT$5,000,000 All of presidents and vice presidents listed above. All of presidents and vice presidents listed above. NT$5,000,000 (Included) ~ NT$10,000,000 - - NT$10,000,000 (Included) ~ NT$15,000,000 - - NT$15,000,000 (Included) ~ NT$30,000,000 - - NT$30,000,000 (Included) ~ NT$50,000,000 - - NT$50,000,000 (Included) ~ NT$100,000,000 - - Over NT$100,000,000 - - Total 20,563 49
(4) Analysis of Remuneration to Directors, Supervisors, President and Vice Presidents
Remuneration to directors, supervisors, president and vice presidents in 2008 shows little difference from that in 2007. Net loss after tax of the Bank is NT$2,311,900,000 in 2008 while it is NT$1,138,152,000 for 2007. Therefore, the percentage of total remuneration over net income after tax is negative. Thus this analysis is not applicable.
16

3. Corporate Governance Operation (1) The Operation of Board of Directors:
The Operation of Board of Directors: During 2008, the Board of Directors held 7 meetings. The attendance of directors and supervisors are as follows:
Title Name Frequency of Attendance ( Presence)
Frequency of Appointed Attendance
Actual Attendance (Presence) Rate (%) Remarks
Chairman Chen, Sheng-Hung 7 0 100% Standing Director Wu, Hsi-Hui 0 0 0% Standing Director Liu, Chen-Sheng 7 0 100% Standing Director Chen, Chin-Chia 6 0 85% Independent Standing Director
Sun, Ping-Yen 5 1 71%
Director Chang, Wu-Ping 5 0 71% Director Ho, Shun-Cheng 7 0 100% Director Chen, Chin-Yi 7 0 100% Director Lin, Cheng-Yu 7 0 100% Director Representative of Fu Li
Yang Investment Co., Ltd.: Chen, Chien-Yang
7 0 100%
Director Representative of Fu Li Yang Investment Co., Ltd.: Lin, Chin-Lung
7 0 100%
Fu Li Yang Investment Co., Ltd. Still holds another seat in Board of Directors. After removing the original representation, Fu Li Yang Investment Co., Ltd. has not assigned any new representative.
Director Huang, Cheng-Nan 6 0 85% Director Chao, Fu-Tien 7 0 100% Independent Director Liu, Hsiang-Tun 7 0 100%
Standing Supervisor
Hsu, Po-Hsiung 7 0 100%
Supervisor Chen, Sen-Jung 7 0 100% Supervisor Kao, Ming-Chih 0 0 0% Supervisor Tsai, Wen-Hsiung 6 0 85% Independent Supervisor
Chiang, Chun-Huai 7 0 100%
Other Noticeable Particulars: 1. Dates of Board of Directors meetings, the term, content of the resolution, opinions of all independent directors and the responses of the
company to opinions should be specified for particulars regulated in Article 14-3 of Securities and Exchange Act and resolutions, in Board of Directors meetings, with opposition or qualified opinions from independent directors: None
2. For the implementation of the directors’ avoidance from any involving resolution, directors’ names, the content of the resolution, reasons for interest avoidance and the voting participation should be included:
Term/ Order
Name of Director Date Content of the Resolution Reasons for Avoidance The voting participation
The 11th
Meeting, the 4th
term
Chen, Sheng
Credit granting cases submitted by Credit Granting and Investment Commission of the Bank.
Credit granting to interest parties regulated in Article 33-1 of The Banking Act.
Avoid discussion and voting 2008.3.27
The 12th Meeting, the 4th
term
Chen, Sheng
Credit granting cases submitted by Credit Granting and Investment Commission of the Bank.
Credit granting to interest parties regulated in Article 33-1 of The Banking Act.
Avoid discussion and voting 2008.5.8.
The 14th Meeting, the 4th
term
Chen, Sheng-Hung
Credit granting cases submitted by Credit Granting and Investment Commission of the Bank.
Credit granting to interest parties regulated in Article 33-1 of The Banking Act.
2008.8.28.
Avoid discussion and voting Chen,
Chin-Chia The 15th Meeting, the 4th
term
Credit granting cases submitted by Credit Granting and Investment Commission of the Bank.
Credit granting to interest parties regulated in Article 33-1 of The Banking Act.
Chen, Chien-Yan
g
2008.12.4.
Avoid discussion and voting
3. Goals (such as establishing the auditing commissions or raising the information transparency) and execution to strengthen the Board of Directors during the year and the latest year: None.
17
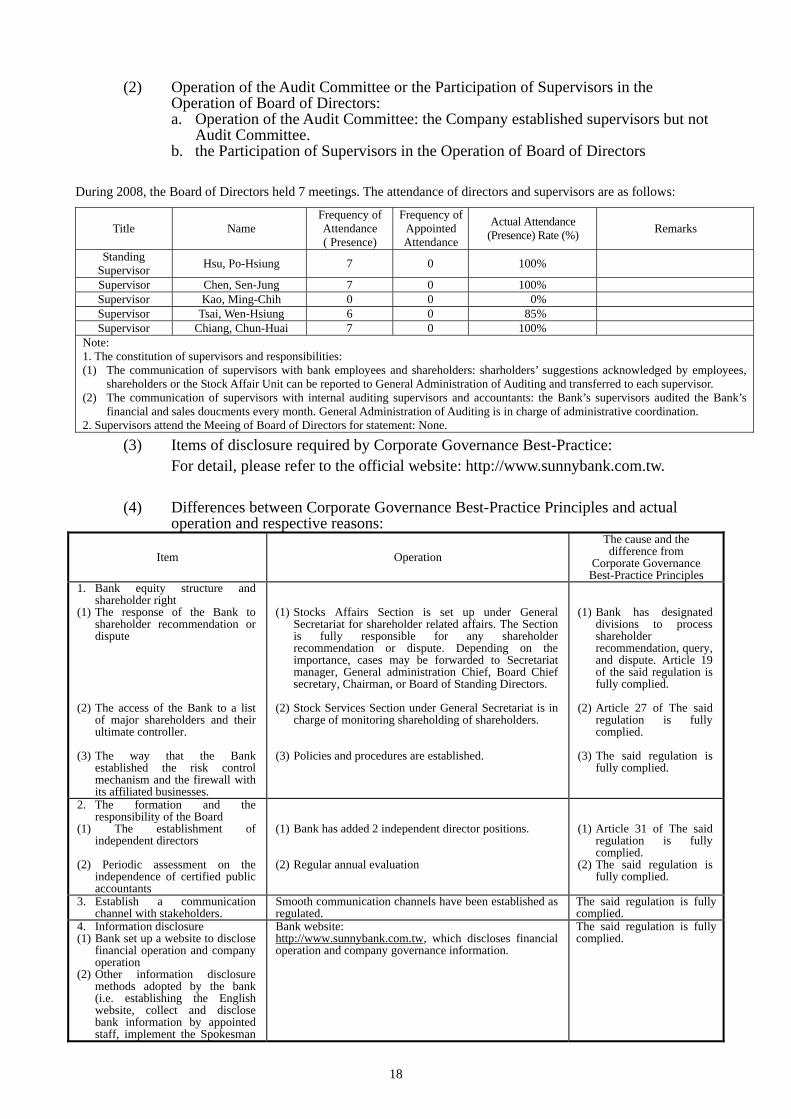
(2) Operation of the Audit Committee or the Participation of Supervisors in the Operation of Board of Directors: a. Operation of the Audit Committee: the Company established supervisors but not
Audit Committee. b. the Participation of Supervisors in the Operation of Board of Directors
During 2008, the Board of Directors held 7 meetings. The attendance of directors and supervisors are as follows:
Title Name Frequency of Attendance ( Presence)
Frequency of Appointed Attendance
Actual Attendance (Presence) Rate (%) Remarks
Standing Supervisor Hsu, Po-Hsiung 7 0 100%
Supervisor Chen, Sen-Jung 7 0 100% Supervisor Kao, Ming-Chih 0 0 0% Supervisor Tsai, Wen-Hsiung 6 0 85% Supervisor Chiang, Chun-Huai 7 0 100%
Note: 1. The constitution of supervisors and responsibilities: (1) The communication of supervisors with bank employees and shareholders: sharholders’ suggestions acknowledged by employees,
shareholders or the Stock Affair Unit can be reported to General Administration of Auditing and transferred to each supervisor. (2) The communication of supervisors with internal auditing supervisors and accountants: the Bank’s supervisors audited the Bank’s
financial and sales doucments every month. General Administration of Auditing is in charge of administrative coordination. 2. Supervisors attend the Meeing of Board of Directors for statement: None.
(3) Items of disclosure required by Corporate Governance Best-Practice: For detail, please refer to the official website: http://www.sunnybank.com.tw. (4) Differences between Corporate Governance Best-Practice Principles and actual
operation and respective reasons:
Item Operation The cause and the difference from
Corporate Governance Best-Practice Principles
1. Bank equity structure and shareholder right
(1) The response of the Bank to shareholder recommendation or dispute
(1) Stocks Affairs Section is set up under General Secretariat for shareholder related affairs. The Section is fully responsible for any shareholder recommendation or dispute. Depending on the importance, cases may be forwarded to Secretariat manager, General administration Chief, Board Chief secretary, Chairman, or Board of Standing Directors.
(1) Bank has designated divisions to process shareholder recommendation, query, and dispute. Article 19 of the said regulation is fully complied.
(2) The access of the Bank to a list
of major shareholders and their ultimate controller.
(2) Stock Services Section under General Secretariat is in charge of monitoring shareholding of shareholders.
(2) Article 27 of The said regulation is fully complied.
(3) The way that the Bank
established the risk control mechanism and the firewall with its affiliated businesses.
(3) Policies and procedures are established. (3) The said regulation is fully complied.
2. The formation and the responsibility of the Board
(1) The establishment of independent directors
(1) Bank has added 2 independent director positions. (1) Article 31 of The said
regulation is fully complied.
(2) Periodic assessment on the
independence of certified public accountants
(2) Regular annual evaluation (2) The said regulation is fully complied.
3. Establish a communication channel with stakeholders.
Smooth communication channels have been established as regulated.
The said regulation is fully complied.
4. Information disclosure Bank website: The said regulation is fully complied. (1) Bank set up a website to disclose
financial operation and company operation
http://www.sunnybank.com.tw, which discloses financial operation and company governance information.
(2) Other information disclosure methods adopted by the bank (i.e. establishing the English website, collect and disclose bank information by appointed staff, implement the Spokesman
18

Item Operation The cause and the difference from
Corporate Governance Best-Practice Principles
system and posing the corporation seminar process on the bank website)
5. The establishment of committees, such as Nomination Committee or Remuneration Committee
Nomination Committee or Remuneration Committee has not yet set up.
In the future, the Bank will follow the regulation for corporate governance and establish various committees.
6. Please state the cause and the difference of the corporate governance from Corporate Governance Best-Practice Principles: Complied with Corporate Governance Best-Practice Principles 7. Please state the system and practices that the Bank adopts for social responsibilities of bank (i.e. worker right, employee care,
stakeholder’s rights, director and supervisor effort in further studies, risk management policy, risk measurement standard execution and the purchase of liability insurance in behalf on directors and supervisors):
(1) Worker right: the Bank is an public listed company and fully realizes that, for sustainable management, the Bank shoulders significant social responsibilities, including employee care and protecting worker’s human rights. The Head Office also established Labour-management Conciliation Commission and Employees' Welfare Committee to protect employees’ welfare. Also, the Bank conforms to the government’s policies and executes welfare practices such as the New Labor Pension System so all of employees’ rights receive complete protection.
(2) Employee care: To echo’s government’s policy, “Banks support businesses and businesses support employees”. The Bank has not conducted any practices such as layoff, salary cut or unpaid leave. Instead, the Bank usually holds training for employees and encourages any advanced studies.
(3) Investor’s Relations: The Bank has set up a toll-free hotline and an email box on the corporate website. A smooth channel for client communication helps the protection of investors and clients.
(4) Stakeholder’s rights:The Bank has set up a toll-free hotline and an email box on the corporate website. Appropriate response to stakeholder’s rights help the protection of investors’ rights.
(5) Director and supervisor effort in further studies: the Bank updates the regulations on corporate governance to directors and supervisors. Directors’ and supervisors arrange their own further courses.
(6) Risk management policy and risk measurement standard execution: the Bank develops stipulations for according risk management policy and risk measurement standards and has established Risk Administration Department to effectively control the risk level and created the management system for BASEL II.
(7) Client policy execution: the Bank established units responsible for clients’ complaints. The Bank totally respects Fair Trade Act and Consumer Protection Laws and review standard contracts and propaganda to protect consumer rights.
(8) The purchase of liability insurance in behalf on directors and supervisors: the Bank has not purchased liability insurance for directors and supervisors.
8. In case of the company self-assessment report or report from any other professional institution appointed to assess company operation, self-assessment/appointed evaluation results, deficiencies/recommendations should be stated: None
(5) Performing social responsibilities:
We have been upholding the business ideal of” feedback to the society.” While promoting business performance, we also actively play the role of the “corporate citizen” through holding big fetes and actual donations to Blind's Welfare Association R.O.C. to express the corporate responsibilities that the Bank should take and contribute to academics and cultures. The Bank also introduce the correct concepts of saving, investment and financial management and promotes the proper recreational activities and sponsors sporting, cultural, and education activities such as Shihlin College of Commerce Anniversary, Shihpai Elementary School Sports Event, and Eden Social Welfare Foundation. Also, Sunny Cultural and Education Foundation held Chinese chess, drawing, seminars, parent-child summer camps, and scholarship etc. We believe in:” What is taken from society should be used for the society” in order to contribute our effort to academic and cultural activities.
(6) The inquiry for corporate governance regulations and policies:
Not Applicable. (7) Other important information to deepen the understanding the corporate governance
of the Bank: None.
19

(8) Internal control execution discloses the following: a. Statement of Internal Control
Statement of Internal Control System
Sunny Bank Ltd. The internal control system of Sunny Bank Ltd. from January 1, 2008 to December 31 2008 was established in compliance with the Implementation Rules for Bank Internal Audit and Internal Control System to implement risk management and audited by an independent auditing department which reports to the board of the directors and supervisors regularly (for a bank that operates concurrently securities business, add the following: For bank’s securities business, the Bank determines if the design and implementation of the internal control system are effective based on the criteria provided in the Regulations Governing the Establishment of Internal Control Systems by Service Enterprises in Securities and Futures Markets). After careful evaluation, the Bank believes that except for items enumerated on the attached sheet, the Bank’s internal control system and compliance with applicable law and regulations have been effective for the year stated. (For a bank that also operates concurrently securities business or is a publicly issued company, add the following: This Statement shall become a major part of the annual report and prospectus of the Bank and be made public. Any false representation or concealment in this Statement shall be subjected to legal consequences as stipulated in Articles 20, 32, 171 and 174 of the Securities & Exchange Act.)
Sincerely yours, Financial Supervisory Commission
Declarer
Chairman: (with seal & signature)
President: (with seal & signature)
President: (with seal & signature)
President: (with seal & signature)
President: (with seal & signature)
President: (with seal & signature)
General Auditor: (with seal & signature)
Officer of the Head Office: (with seal & signature)
Date: March 19, 2009
20

Practices to be strengthened and corrective procedures in the Internal Control System
Sunny Bank Base Date: December 31, 2008
Items for Improvement Measures Deadline (I) Crediting Management:
(1) After random examining the loan procedure of Offshore Business Unit, it was found that, in some loans, the contracted methods of principal payment were linked to the credit risks in some specific companies. Such transactions differ from other loans and should be divided into host contracts and embedded derivatives. Transactions of derivatives were found failure to follow Statement No.34, Accounting for the Financial Instruments: Recognition and Measurement and properly disclosed on the financial statements.
(1) The derivatives transaction should be properly valued periodically according to Statement No.34, Accounting for the Financial Instruments: Recognition and Measurement and properly disclosed on the financial statements.
(1) Credit Link Loans, according to its transaction features, should be mixed product stipulated in Statement No.34, Accounting for the Financial Instruments: Recognition and Measurement and properly disclosed on the financial statements. Also, they meet the requirements of individual recognition by host contracts or embedded derivatives. Thus, embedded derivatives should be separated from mixed products. The host contract should be processed, with conformity to stipulations of Statement of Financial Accounting Standard, according to whether it is for financial products or non-financial products. The host contract of such transaction belongs to loans. Recognizing it as “Loan” should be unquestionable. Furthermore, such transaction is usually processed as either “Loan” or “Investment”. The Bank conducted valuation in the “Loan” procedure, instead of a “derivatives” transaction.
However, credit link loan should be recognized with host
contract recognized the loan while the linked derivatives should be evaluated. If any loss occurs, such loss should be recognized.
At the end of 2008, the Bank, as suggested, evaluated the credit
link loans. A total of USD 3,977,500 is recognized as loan loss provision.
(2) After the inspection of the Credit Line of Affiliated Enterprises with business loan authorization number “9400132” 97/09/0, it was found that “Unsecured Credit Line” and “Total Credit Line” exceeded the net credit limit. After inquiry on the matter, it was found that the information of the business loan client was not updated, which caused the excess on the reports.
(2) The handling staff should follow the operating procedures and properly advise information of the crediting applicants. Meanwhile, such staff should periodically confirm whether any over crediting happens.
(2) This case is caused by failure to correct the information of the credited accounts. Currently information is updated. Attention will be placed on such matter in the future. The related loans did not exceed the limit.
(II) Deposit Service Management:
(1) For the application for seal replacement and loss with the operating account number “7341-8829”, “7341-1260” and “7341-799”, the new seal card is not seen the reason for seal replacement.
(1) After the client apply for seal suspension and it’s the replacement, the relevant staff should note the reason for replacement on the seal card to avoid any possible future dispute.
(1) The voidance date has been noted on the seal card.
(2) For the applications for seal replacement and loss with
the operating account numbers “7301-124039|”, “7301-127243”, “7341-8829”, “7341-1260” and “7341-799”, the cancellation date is not noted on the old seal card.
(2) After the client apply for seal suspension and it’s the replacement, the relevant staff should note the reason for replacement on the seal card to avoid any possible future dispute.
(2) The voidance date has been noted on the seal card.
(3) For the application for seal replacement and loss with the
operating account number “301-76305”, the new seal card is not seen the stamp “New Seal Starts Using”.
(3) After the client applies for the seal loss and replaces it with the new seal, the handling staff should stamp “New Seal Starts Using” on the original seal card to avoid the future dispute.
(3) The reason for replacement has been noted on the seal card.
(4) The client applying for seal replacement and loss with
Account “7341-1260” closed the account but the cancelling date is not noted on the new seal card.
(4) When the client applies for the closing, the handling staff should note the cancellation date on the original seal card to avoid the future dispute.
(4) The voidance date has been noted on the seal card.
b. Items to be disclosed in the CPA’s audit report in relation to the system of
internal controls that has been entrusted to the CPA: None (9) Illegality and punishment during the past two years, major drawbacks and the
correction: a. Prosecution taken by prosecutors due to professional crimes committed by
the Bank’s responsible person or its employees: The Bank’s Taishan Branch, Minsheng Branch, and Yungho Branch processed the Crediting to Hsiu- Lan Tu, Yu-Lan Wang, Hsiu-Li Tu and Lu-Ying Lin and were suspected violating Banking Act. Shihlin District Prosecutors Office viewed public prosecution should be filed against these branches.
b. Fines imposed by the Executive Yuan’s Financial Supervisory Committee for violating laws and regulations: The Bank’s Chunghua Branch failed to follow the stipulation, confirm clients’ identity and record their profiles while processing large payment and delivery transactions. The audit indicated that Paragraph 1 of Article 7 in Money Laundering Control Act and Stipulation 1 of Regulations Regarding Article 8 of
21

The Money Laundering Control Act. c. Major corrections to shortcomings demanded by the Executive Yuan’s
Financial Supervisory Committee: None d. Punishments by the Executive Yuan’s Financial Supervisory Committee in
relation to Article 61-1 of the Banking Law: None Consuming Finance Regional Center did not establish mature custody records on the information of clients’ loan applications. The design and execution of the internal control system is clearly seen on the custody of clients’ information and such flaw may damage the bank’s soundness. According to Paragraph 1 of Article 61 in the Banking Act, the Bank should be rectified.
e. Necessary disclosure of nature and amount of loss as a result of fraud, major random incidents (major incidents including fraud, theft, appropriation and theft of assets, falsified transactions, document and security forgery, taking kickbacks, natural disaster loss, loss caused by external forces, hacker attacks, theft of information, and disclosure of business secrets and client information), or failure to comply with the instructions for the Maintenance of Safety by Financial Institutions, as a result of which individual or accumulated losses for the year amounted to NT$50 million or more: None
f. Other items to be disclosed under the instructions of the Financial Supervisory Commission, Executive Yuan: None
(10) Important Resolutions of the Shareholders, Meeting and the Board of Directors during the last year and the period up to the annual report publication date: 【The 16th Meeting of the 4th term Board of Directors on January 8th 2009】 Important Resolution Subject: Please kindly discuss the proposal hereby on the appointment of Wei-Hao Ting as the Bank’s Executive President. Description: (1) According to Article 10 of the Bank’s “Organization Charter”, “The Bank’s
employment and discharge of the staff under Vice Manager should be proposed by General Administration and Business and Service to Board of Standing Directors for approval while that of the staff over Manager should follow the Organization Charter and approved by the Board of Directors.”
(2) The 15th Meeting of the 4th term Board of Directors on December 4th 2008 resolved to revise the Organization Charter and add the position “Executive President”. Now President of General Administration and Business and Service, San-Ho Chou, is temporarily sitting in as the deputy until the inauguration of Executive President.
(3) Today, it is proposed to appoint Wei-hao Ting as the Bank’s Executive President. The term lasts from the date of the inauguration to expiration of the 4th term of the Board of Directors.
Resolution: All of attending directors approved. (11) The major content of record of written statements for any dissenting opinions from
directors or supervisors regarding important resolutions of the Board in 2007 and the period up to the annual report publication date: None
(12) Compilation of Resignation and Discharging of People Related to the Financial Report (including Chairman, President, Accounting Supervisors and Auditing Supervisors) during the Last Year and the Current Year up to Publication Date of Annual Reports: None.
4. Information of Fees to CPA: Not applicable. 5. Information of Changing CPAs: None 6. Bank’s Chairman, President and those Managers responsible for financial and
accounting matters who have within the last year held office in the Bank’s CPA firm or any of its related enterprises None
22

23
7. Status of shareholding change (1) Status of changes in shareholdings of directors, supervisors, managers and other
individuals mandated for shareholding declaration as per stipulations set forth under the Paragraph 3, Article 25 of the Act
2008 As of April 30, the same year Title Name Increasing/ Decreasing
Holding Shares Increasing/ Decreasing
Pledged Shares Increasing/ Decreasing
Holding Shares Increasing/ Decreasing
Pledged Shares Chairman Chen, Sheng-Hung 0 0 0 0 Standing Director Wu, Hsi-Hui 0 0 0 0 Standing Director Liu, Chen-Sheng 0 0 0 0 Standing Director Chen, Chin-Chia 0 0 0 0 Director (Major Shareholder) Fu Li Yang Investment
Co., Ltd. 0 0 0 0
Director (Major Shareholder) Representative of Fu Li Yang Investment Co., Ltd.: Chen, Chien-Yang
0 0 0 0
Director (Major Shareholder) Representative of Fu Li Yang Investment Co., Ltd.: Lin, Chin-Lung
0 0 0 0
Director Ho, Shun-Cheng 0 0 0 0 Director Chang, Wu-Ping 0 0 0 0 Director Lin, Cheng-Yu 0 0 0 0 Director Chen, Chin-Yi 0 0 0 0 Director Chao, Fu-Tien 0 0 0 0 Director Huang, Cheng-Nan 0 0 0 0 Independent Director Liu, Hsiang-Tun 0 0 0 0 Independent Director Sun, Ping-Yen 0 0 0 0 Standing Supervisor Hsu, Po-Hsiung 0 0 -400,000 0 Supervisor (Major Shareholder) Tsai, Wen-Hsiung 0 0 0 0 Supervisor Kao, Ming-Chih 0 0 0 0 Supervisor Chen, Sen-Jung -91,000 0 0 0 Independ nt Supervisor e Chiang, Chun-Huai 0 0 0 0 President Chou, San-Ho 0 0 0 0 President Kuo, Chih-Hung 0 0 0 0 President Lin, Chih-Liang 0 0 0 0 President Chang, Chi-Ming 0 0 0 0 President Yeh, Ching-Tsung 0 0 0 0 Vice President Wang, Ya-Hsun 0 0 0 0General Auditor Tseng, Yao-Te 0 0 0 0 Deputy Executive Vice President Liu, Ming-Chieh 0 0 0 0 Deputy Executive Vice President Chen, Jung-Kuei -100,000 0 0 0Deputy Executive Vice President Yu, Shih-Jung 0 0 0 0 Deputy Executive Vice President Hu, Tsung-Yi 0 0 0 0 Deputy Executive Vice President Kuo, Ching-Feng 0 0 0 0 Deputy Executive Vice President Hsieh, Yi-Tung 0 0 0 0 Deputy Executive Vice President Lu, Pei-Lin 0 0 0 0 Deputy Executive Vice President Huang, Yen-Chun 0 0 0 0 Deputy Executive Vice President Chang, Chih-Hung 0 0 0 0 Deputy Executive Vice President Wang, Chien-Yi 0 0 0 0 Manager Pan, Cheng-Jen 0 0 0 0 Manager Liu, Min-Hsiang 0 0 0 0 Manager Hsu, Wen-Jung 0 0 0 0 Manager Lin, Cheng-Ping 0 0 0 0 Manager Chen, Ming-Wen 0 0 0 0 Manager Kao, Chin-Mu 0 0 0 0 Manager Hsueh, Chih-Cheng 0 0 0 0 Manager Kuo, Huang-Lung 0 0 0 0Manager Lu, Ching-Yu 0 0 0 0 Manager Lu, Han-Kun 0 0 0 0 Manager Tseng, Chien-Chia 0 0 0 0 Manager Tsai, Chien-Li 0 0 0 0 Manager Chen, Hsien-Chun 0 0 0 0 Manager Chang, Wen-Sung 0 0 0 0 Manager Yang, Ying-Chung 0 0 0 0 Manager Lee, Yu-Sheng 0 0 0 0 Manager Chen, Chu-Wen 0 0 0 0 Manager Tang, Ying-Kuei 0 0 0 0 Manager Pan, Kuang-Chu 0 0 0 0 Manager Liu, Yen-Hsing 0 0 0 0 Manager Kuo, Li-Chung 0 0 0 0 Manager Huang, Shou-Chih 0 0 0 0 Manager Huang, Che-Ming 0 0 0 0 Manager Chung, Hsu-Jung 0 0 0 0 Manager Tseng, Chieh-Chang 0 0 0 0 Manager Chu, Chia-Lung 0 0 0 0 Manager Chen, Chi-Wen 0 0 0 0 Manager Hu, Chun-Wei 0 0 0 0 Manager Huang, Yao-Kun 0 0 0 0 Manager Chiang, Hsien-Chang 0 0 0 0 Manager Chang, Ching-Pin 0 0 0 0 Manager Kuo, Chiang-Hai 0 0 0 0

24
2008 As of April 30, the same year Title Name Increasing/ Decreasing
Holding Shares Increasing/ Decreasing
Pledged Shares Increasing/ Decreasing
Holding Shares Increasing/ Decreasing
Pledged Shares Manager Lee, Hsu-Chang 0 0 0 0 Manager Liu, Chih-Cheng 0 0 0 0 Manager Kan, Wu-Cheng 0 0 0 0 Manager Yang, Pao-Kuei 0 0 0 0 Manager Hsieh, Chin-Chiang 0 0 0 0 Manager Tsai, Wei-Yung 0 0 0 0 Manager Liu, Wen-Ho 0 0 0 0 Manager Chen, Ting-Yi 0 0 0 0 Manager Hsu, Chen-Huang 0 0 2,000 0 Manager Wu, Kuo-Ho 0 0 0 0 Manager Chen, Cheng-Yi 0 0 0 0 Manager Sung, Ping-Ping 0 0 0 0 Manager Lan, Yu-Lin 4,000 0 0 0 Manager Chou, Hung-Che 0 0 0 0 Manager Yu, Kuang-Lu 0 0 0 0 Manager Chang, Shun-Han 0 0 0 0 Manager Chuang, Ping-Hung 0 0 0 0 Manager Chang, Jung-Pin 0 0 0 0 Manager Lin, Chi-Kang 0 0 0 0 Manager Chen, Kuo-Hung 0 0 0 0 Manager Huang, Teng-Tsai 0 0 0 0 Manager Chao, Yu-Chin 62,000 0 0 0 Manager Yang, Chen-Sheng 0 0 0 0 Manager Chen, Pao-Yuan 0 0 0 0 Manager Yang, Lien-Tse 0 0 0 0 Manager Cheng, Pei-Nan 0 0 0 0 Manager Chen, Cheng-Feng 0 0 0 0 Manager Hsu, Chen-Yuan 0 0 0 0 Manager Kao, Chih-Li 0 0 0 0 Manager Hsu, Chieh-Sheng 0 0 0 0 Manager Kuo, Ching-Hsien 527 0 0 0 Manager Wu, Chia-Cheng 0 0 0 0 Manager Tsai, Kun-Ti 0 0 0 0 Manager Chen, Yi-Huan 0 0 0 0 Manager Yueh, Wen-Chang 0 0 0 0 Manager Wang, Sheng-Jung 0 0 0 0 Manager Chiu, Chuan-Mao 0 0 0 0 Manager Chen, Chi-Chuan 0 0 0 0 Manager Chen, Chih-Hao 0 0 0 0Manager Chiang, Tung-Sheng 0 0 0 0 Manager Chen, Hui-Ling 0 0 0 0 Manager Chen, Kuo-Chuan 0 0 0 0 Manager Chien, Chih-Hsin 0 0 0 0 Manager Hung, Jung-Tsung 0 0 0 0 Manager Su, Chien-Tsung 0 0 0 0 Manager Lee, Ching-Cheng 0 0 0 0 Manager Lin, Kuo-Hung 0 0 0 0 Manager Wu, Cheng-Hao 0 0 0 0 Manager Luo, Ching-Yang 0 0 0 0 Manager Chu, Shu-Chun 0 0 0 0 Manager Chuang, Yung-Fu 0 0 0 0 Manager Lee, Wen-Hui 0 0 0 0 Manager Chen, Yao-Wen 0 0 0 0Manager Chou, Chih-Wei 0 0 0 0 Manager Huang, Chi-Wei 0 0 0 0 Manager Tsao, Chun-Jung 0 0 0 0 Manager Su, Hsin-Yi 0 0 0 0 Manager Yeh, Ming-Yueh -15,000 0 0 0 Manager Chen, Kuo-Hsiung 0 0 0 0 Manager Yao, Hung-Shen 0 0 0 0 Manager Lin, Jui-Mei 1,306 0 0 0 Manager Tsui, Ching-Chih 0 0 0 0 Manager Tsai, Che-Ming 0 0 0 0 Manager Kuo, Chung-Chieh 0 0 0 0 Manager Chen, Nien-Hui 0 0 0 0 Manager Shen, You-Hsin 0 0 0 0 Manager Ho, Ju-Chun 0 0 0 0 Manager Chang, Wen-Huang 0 0 0 0 Manager Wu, Jung-Chi 0 0 0 0 Manager Lung, Wan-Li 0 0 0 0 Manager Huang, Shou-Wen 0 0 0 0 Note: Manager Yu-Lin Lan left his office on February 14 2009. Manager Chin-Chiang Hsieh left office on February 24 2009. Manager Wen-Jung, Hsu,
Ching-Hsien Kuo, Chi-Kang Lin, Huang-Lung Kuo, Sheng-Jung Wang, Pao-Yuen Chen and Hung-Shen Yao left office on April 1 2009 and Executive Vice President Lu-Pei Lin left office on April 25 2009.
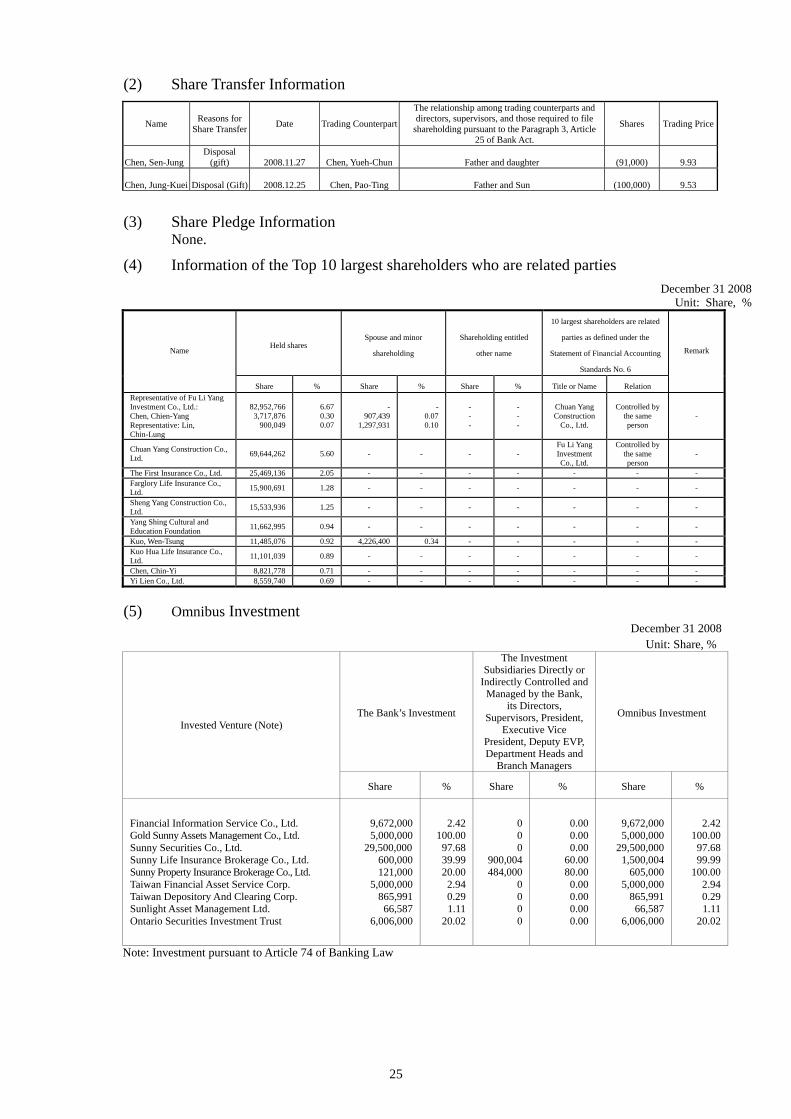
(2) Share Transfer Information The relationship among trading counterparts and directors, supervisors, and those required to file
shareholding pursuant to the Paragraph 3, Article 25 of Bank Act.
Reasons for Share Transfer Name Date Trading Counterpart Shares Trading Price
Disposal Chen, Sen-Jung (gift) 2008.11.27 Chen, Yueh-Chun Father and daughter (91,000) 9.93
Chen, Jung-Kuei Disposal (Gift) 2008.12.25 Chen, Pao-Ting Father and Sun (100,000) 9.53
(3) Share Pledge Information
None.
(4) Information of the Top 10 largest shareholders who are related parties December 31 2008
Unit: Share, % 10 largest shareholders are related
parties as defined under the
Statement of Financial Accounting
Standards No. 6
Spouse and minor
shareholding
Shareholding entitled
other name Held shares
Name Remark
Share % Share % Share % Title or Name Relation Representative of Fu Li Yang Investment Co., Ltd.: 82,952,766 6.67 - - - - Chuan Yang
Construction Co., Ltd.
Controlled by the same person
3,717,876 0.30 907,439 0.07 - - - Chen, Chien-Yang 900,049 0.07 1,297,931 0.10 - - Representative: Lin,
Chin-Lung Fu Li Yang Investment Co., Ltd.
Controlled by the same person
Chuan Yang Construction Co., Ltd. 69,644,262 5.60 - - - - -
The First Insurance Co., Ltd. 25,469,136 2.05 - - - - - - - Farglory Life Insurance Co., Ltd. 15,900,691 1.28 - - - - - - -
Sheng Yang Construction Co., Ltd. 15,533,936 1.25 - - - - - - -
Yang Shing Cultural and Education Foundation 11,662,995 0.94 - - - - - - -
Kuo, Wen-Tsung 11,485,076 0.92 4,226,400 0.34 - - - - - Kuo Hua Life Insurance Co., Ltd. 11,101,039 0.89 - - - - - - -
Chen, Chin-Yi 8,821,778 0.71 - - - - - - - Yi Lien Co., Ltd. 8,559,740 0.69 - - - - - - -
(5) Omnibus Investment
December 31 2008 Unit: Share, %
The Investment Subsidiaries Directly or
Indirectly Controlled and Managed by the Bank,
its Directors, Supervisors, President,
Executive Vice President, Deputy EVP, Department Heads and
Branch Managers
Omnibus Investment The Bank’s Investment Invested Venture (Note)
Share % Share % Share %
Financial Information Service Co., Ltd. 9,672,000 2.42 0 0.00 9,672,000 2.42Gold Sunny Assets Management Co., Ltd. 5,000,000 100.00 0 0.00 5,000,000 100.00Sunny Securities Co., Ltd. 29,500,000 97.68 0 0.00 29,500,000 97.68Sunny Life Insurance Brokerage Co., Ltd. 600,000 39.99 900,004 60.00 1,500,004 99.99Sunny Property Insurance Brokerage Co., Ltd. 121,000 20.00 484,000 80.00 605,000 100.00Taiwan Financial Asset Service Corp. 5,000,000 2.94 0 0.00 5,000,000 2.94Taiwan Depository And Clearing Corp. 865,991 0.29 0 0.00 865,991 0.29Sunlight Asset Management Ltd. 66,587 1.11 0 0.00 66,587 1.11Ontario Securities Investment Trust 6,006,000 20.02 0 0.00 6,006,000 20.02
Note: Investment pursuant to Article 74 of Banking Law
25

IV. Funding 1. Share and dividend
(1) Share sources Unit: Thousand Shares: Unit: NT$ Thousands
Authorized Capital Stock Paid-up Capital Remark Year/ Par Value Month Shares Amount Shares Amount Sources of Capital Stock Other Yuan Shin Co-operative money
paid for shares Note 1 September 1997 $10 270,000 2,700,000 270,000 2,700,000
November 1998 $13 30,000 300,000 30,000 300,000 Description 1 Note 2 November 1999 $13 80,000 800,000 80,000 800,000 Description 2 Note 3
March 2001 $13 90,000 900,000 90,000 900,000 Description 3 Note 4 October 2001 $10 65,800 658,000 65,800 658,000 Description 4 Note 5 October 2002 $10 80,370 803,700 80,370 803,700 Description 5 Note 6 October 2003 $10 203,830 2,038,300 89,988 899,879 Description 6 Note 7
December 2004 $10 - - 113,842 1,138,421 Description 7 Note 8 September 2005 $10 380,000 3,800,000 71,078 710,783 Description 8 Note 9 November 2005 $10 - - 200,448 2,004,482 Description 9 Note 10
July 2006 $10 800,000 8,000,000 152,401 1,524,016 Description 10 Note 11Description 1 : Cash increment 192,060,160 dollars; surplus and employee’s reward recapitalization 107,939,840 dollars. Description 2 : Cash increment 290,000,000 dollars; surplus recapitalization 210,000,000 dollars; capital surplus transferred to common stock
300,000,000 dollars. Description 3 : Cash increment 216,000,000 dollars; surplus recapitalization 304,000,000 dollars; capital surplus transferred to common stock
380,000,000 dollars. Description 4 : Surplus recapitalization 188,000,000 dollars; capital surplus transferred to common stock 470,000,000 dollars. Description 5 : Surplus recapitalization 267,900,000 dollars; capital surplus transferred to common stock 535,800,000 dollars. Description 6 : Cash increment 300,000,000 dollars; surplus recapitalization(inclusive of employee’s reward recapitalization)476,644,590
dollars; Capital surplus transferred to common stock 123,234,000 dollars. Description 7 : Cash increment 519,331,710 dollars; surplus recapitalization(inclusive of employee’s reward recapitalization)619,089,700
dollars. Description 8 : Surplus recapitalization (inclusive employee’s reward recapitalization) 710,782,970 dollars. Description 9 : Kao Shin Bank new stock issuance 2,004,482,070 dollars. Description 10 : Cash increment 1,084,734,960 dollars; surplus recapitalization(inclusive of employee’s reward recapitalization)439,281,340
dollars. Note 1 : Approved to change system in accordance with the Letter issued by the Ministry of Finance with File No. (86)-tai-tsai-jung No. 86620211 dated April 28, 1997. Note 2 : Approved in accordance with the Letter issued by the Ministry of Finance with File No. (87)-tai-tsai-jung No. 87178088 dated June 17,
1998 and the Letter issued by the Securities & Futures Institute with File No. (87)-tai-tsai-cheng-(I) No. 57355 dated July 18, 1998. Note 3 : Approved in accordance with the Letter issued by the Ministry of Finance with File No. (88)-tai-tsai-jung No. 88202536 dated June 14,
1999 and the Letter issued by the Securities & Futures Institute with File No. (88)-tai-tsai-cheng-(I) No. 62206 dated July 7, 1999. Note 4 : Approved in accordance with the Letter issued by the Ministry of Finance with File No. Tai-tsai-jung-(III) No. 89748888 dated September
29, 2000 and the Letter issued by the Securities & Futures Institute with File No. (89)-tai-tsai-cheng-(I) No. 83770 dated October 11, 2000.
Note 5 : Approved in accordance with the Letter issued by the Ministry of Finance with File No. Tai-tsai-jung-(III) No. 90222235 dated June 6, 2001 and the Letter issued by the Securities & Futures Institute with File No. (90)-tai-tsai-cheng-(I) No. 142157 dated July 2, 2001.
Note 6 : Approved in accordance with the Letter issued by the Ministry of Finance with File No. Tai-tsai-jung-(III) No. 918011284 dated July 16, 2002 and the Letter issued by the Securities & Futures Institute with File No. Tai-tsai-cheng-(I) No. 910143731 dated August 7, 2002.
Note 7 : Approved in accordance with the Letter issued by the Ministry of Finance with File No. Tai-tsai-jung-(III) No. 928011126 dated July 18, 2003 and the Letter issued by the Securities & Futures Institute with File No. Tai-tsai-cheng-(I) No. 920138589 dated August 24, 2003.
Note 8 : Approved in accordance with the Letter issued by the Financial Supervisory Commission, Executive Yuan with File No. Chin-kuan-yin-(III) No. 0938011367 dated August 2, 2004 and the Letter with File No. Chin-kuan-cheng-(I) No. 0930138039 dated August 30, 2004.
Note 9 : Approved in accordance with the Letter issued by the Financial Supervisory Commission, Executive Yuan with File No. Chin-kuan-cheng-(I) No. 0940134178 dated August 26, 2005.
Note 10 : Approved in accordance with the Letter issued by the Financial Supervisory Commission, Executive Yuan with File No. Chin-kuan-yin-(III) No. 0943001624 dated November 4, 2005 and the Letter with File No. Chin-kuan-cheng-(I) No. 0940152434 dated November 21, 2005.
Note 11 : Approved in accordance with the Letter issued by the Financial Supervisory Commission, Executive Yuan with File No. Chin-kuan-cheng-(I) No. 0950131432 dated July 26, 2006.
Authorized Capital Stock Note Stock type Outstanding stock (Note) Outstanding stock (Note) Un-issued share Total
Common 1,243,928,134 756,071,866 2,000,000,000 Non-Listed & OTC Bank StockShare Note: including 18,955,153 shares of the treasure stocks purchased, due to the merger, from Kaoshin Bank and 420,059 shares of stocks of the parent companies that were held by the subsidiary. These shares are considered as treasure stocks.
Information about the Shelf Registration System Expected issuance Actual issuance Current security
type Purpose and expected
benefit of issued shares Expected
issuance date Note Total No. of shares Approved amount No. of shares Price
Supplement operation fund Common share 2,000,000,000 20,000,000,000 1,243,928,134 $10 - -
26
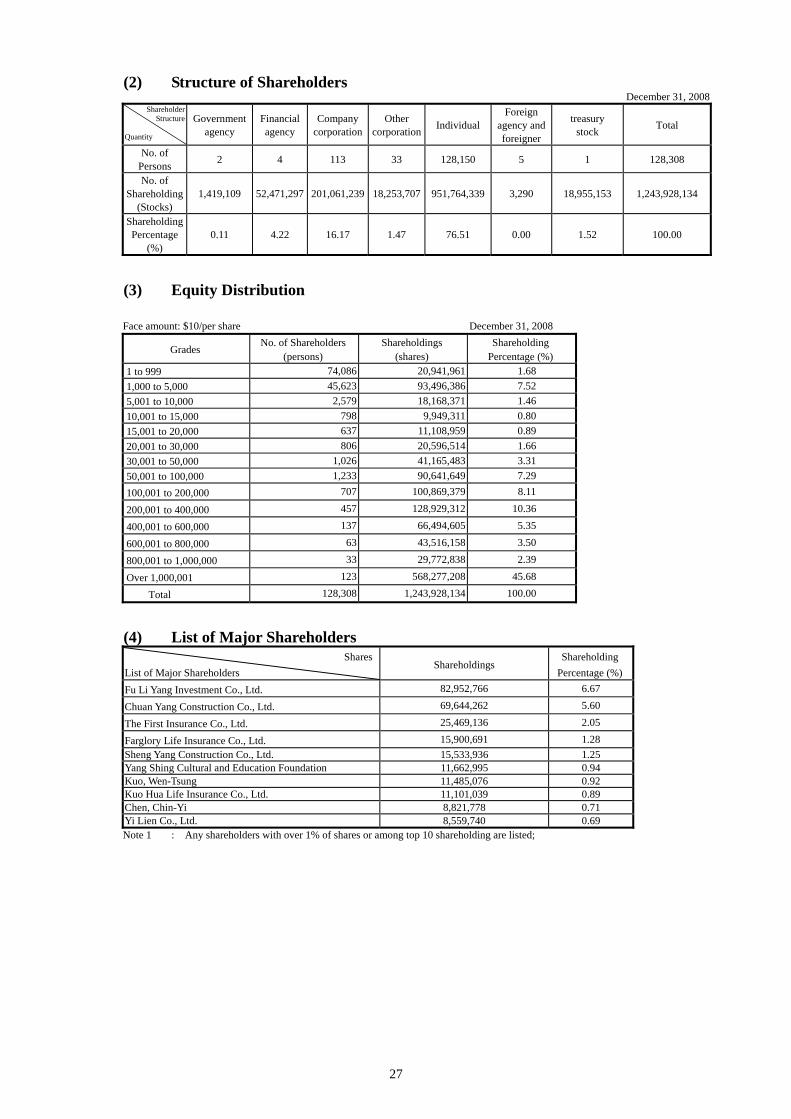
(2) Structure of Shareholders December 31, 2008
Shareholder Foreign agency and foreigner
treasury Government agency
Financial agency
Company corporation
Other corporation
Structure Total Individual stock Quantity
No. of Persons 2 4 113 33 128,150 5 1 128,308
No. of Shareholding
(Stocks) 1,419,109 52,471,297 201,061,239 18,253,707 951,764,339 3,290 18,955,153 1,243,928,134
Shareholding Percentage
(%) 0.11 4.22 16.17 1.47 76.51 0.00 1.52 100.00
(3) Equity Distribution
Face amount: $10/per share December 31, 2008
No. of Shareholders (persons)
Shareholdings Shareholding Percentage (%)
Grades (shares)
74,086 20,941,961 1.68 1 to 999 45,623 93,496,386 7.52 1,000 to 5,000
2,579 18,168,371 1.46 5,001 to 10,000 798 9,949,311 0.80 10,001 to 15,000 637 11,108,959 0.89 15,001 to 20,000 806 20,596,514 1.66 20,001 to 30,000
1,026 41,165,483 3.31 30,001 to 50,000 1,233 90,641,649 7.29 50,001 to 100,000
707 100,869,379 8.11 100,001 to 200,000 457 128,929,312 10.36 200,001 to 400,000 137 66,494,605 5.35 400,001 to 600,000
63 43,516,158 3.50 600,001 to 800,000 33 29,772,838 2.39 800,001 to 1,000,000
123 568,277,208 45.68 Over 1,000,001 128,308 1,243,928,134 100.00 Total
(4) List of Major Shareholders
Shares Shareholding Percentage (%)
Shareholdings List of Major Shareholders
82,952,766 6.67 Fu Li Yang Investment Co., Ltd. 69,644,262 5.60 Chuan Yang Construction Co., Ltd. 25,469,136 2.05 The First Insurance Co., Ltd. 15,900,691 1.28 Farglory Life Insurance Co., Ltd.
Sheng Yang Construction Co., Ltd. 15,533,936 1.25 Yang Shing Cultural and Education Foundation 11,662,995 0.94 Kuo, Wen-Tsung 11,485,076 0.92 Kuo Hua Life Insurance Co., Ltd. 11,101,039 0.89 Chen, Chin-Yi 8,821,778 0.71 Yi Lien Co., Ltd. 8,559,740 0.69 Note 1 : Any shareholders with over 1% of shares or among top 10 shareholding are listed;
27
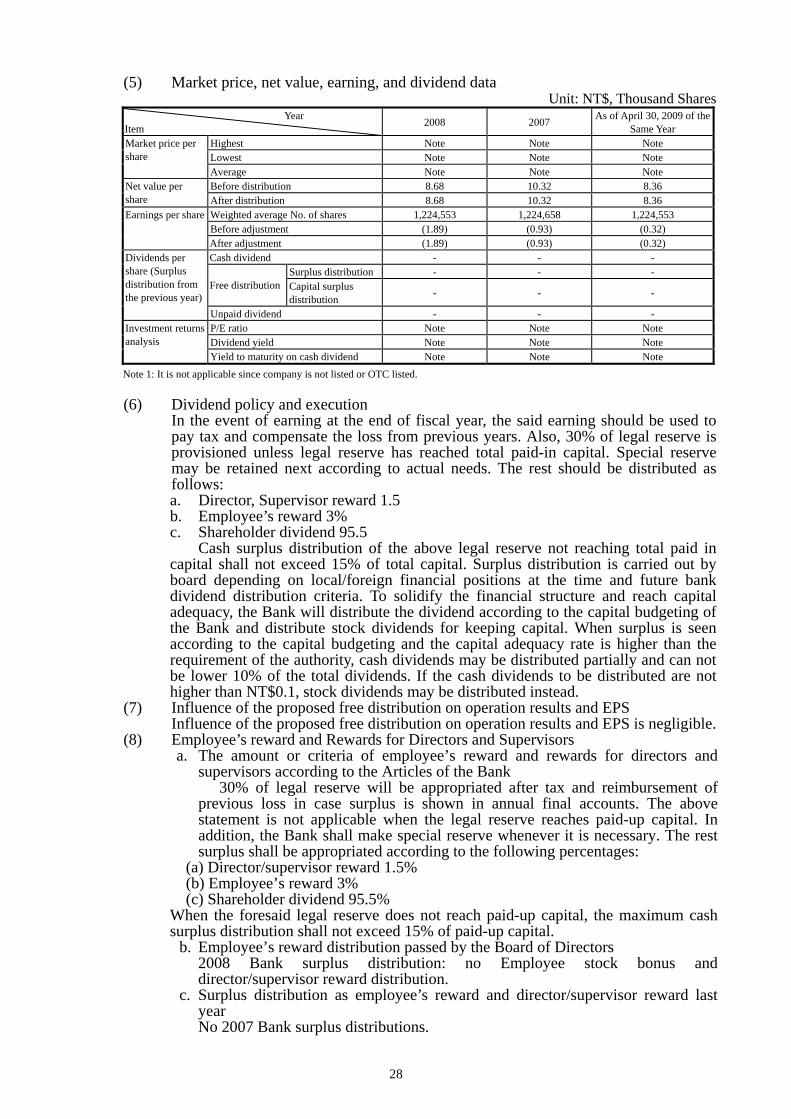
(5) Market price, net value, earning, and dividend data Unit: NT$, Thousand Shares
Year Item 2008 2007 As of April 30, 2009 of the
Same Year Highest Note Note Note Lowest Note Note Note
Market price per share
Average Note Note Note Before distribution 8.68 10.32 8.36 Net value per
share After distribution 8.68 10.32 8.36 Weighted average No. of shares 1,224,553 1,224,658 1,224,553 Before adjustment (1.89) (0.93) (0.32)
Earnings per share
After adjustment (1.89) (0.93) (0.32) Cash dividend - - -
Surplus distribution - - - Free distribution Capital surplus
distribution - - -
Dividends per share (Surplus distribution from the previous year)
Unpaid dividend - - - P/E ratio Note Note Note Dividend yield Note Note Note
Investment returns analysis
Yield to maturity on cash dividend Note Note Note Note 1: It is not applicable since company is not listed or OTC listed.
(6) Dividend policy and execution
In the event of earning at the end of fiscal year, the said earning should be used to pay tax and compensate the loss from previous years. Also, 30% of legal reserve is provisioned unless legal reserve has reached total paid-in capital. Special reserve may be retained next according to actual needs. The rest should be distributed as follows: a. Director, Supervisor reward 1.5 b. Employee’s reward 3% c. Shareholder dividend 95.5
Cash surplus distribution of the above legal reserve not reaching total paid in capital shall not exceed 15% of total capital. Surplus distribution is carried out by board depending on local/foreign financial positions at the time and future bank dividend distribution criteria. To solidify the financial structure and reach capital adequacy, the Bank will distribute the dividend according to the capital budgeting of the Bank and distribute stock dividends for keeping capital. When surplus is seen according to the capital budgeting and the capital adequacy rate is higher than the requirement of the authority, cash dividends may be distributed partially and can not be lower 10% of the total dividends. If the cash dividends to be distributed are not higher than NT$0.1, stock dividends may be distributed instead.
(7) Influence of the proposed free distribution on operation results and EPS Influence of the proposed free distribution on operation results and EPS is negligible.
(8) Employee’s reward and Rewards for Directors and Supervisors a. The amount or criteria of employee’s reward and rewards for directors and
supervisors according to the Articles of the Bank 30% of legal reserve will be appropriated after tax and reimbursement of previous loss in case surplus is shown in annual final accounts. The above statement is not applicable when the legal reserve reaches paid-up capital. In addition, the Bank shall make special reserve whenever it is necessary. The rest surplus shall be appropriated according to the following percentages:
(a) Director/supervisor reward 1.5% (b) Employee’s reward 3% (c) Shareholder dividend 95.5%
When the foresaid legal reserve does not reach paid-up capital, the maximum cash surplus distribution shall not exceed 15% of paid-up capital.
b. Employee’s reward distribution passed by the Board of Directors 2008 Bank surplus distribution: no Employee stock bonus and director/supervisor reward distribution.
c. Surplus distribution as employee’s reward and director/supervisor reward last year No 2007 Bank surplus distributions.
28

(9) Shares bought back by the Bank No shares are bought by the Bank last year.
2. Financial Debentures
The issuance of Financial Debentures
The First Type A Bond Subordinated Financial Debentures in 2007
The First Subordinated Financial Debentures in 2006 ( Private Placement)
Types of Subordinated Financial Debentures
( Private Placement) Central authority approval date andnumber
Letter with File No. Chin-kuan-yin- (III)-tzu No. 0950012639
Letter with File No. Chin-kuan-yin- (III)-tzu No. 09500549820
Date of issue May 16, 2006 April 9, 2007 Par Value NT$10,000,000 NT$10,000,000 Site of issue and operations R.O.C R.O.C Currency New Taiwan Dollars New Taiwan Dollars Offering Price Issued at the bond par value Issued at the bond par value Total amount NT$2,000,000,000 NT$1,800,000,000
At single interest rate of APR 2.55% with annual payment
At single interest rate of APR 3% with annual payment Interest Rate
5 years and 6 months, From May 16, 2006 to
November 16, 2011
7 years Maturity From April 9, 2007 to
April 9, 2014 The bond claims (including principal and interest)’s Repayment priority is
only better than the bank’s shareholder’s surplus property
distribution, and less than the bank’s general creditors.
Repayment priority of the bond claims (including principal and interest) is
only better than the right of the Bank to distribute residual property and second
to the bank’s general claims.
Repayment Priority
Guarantee agency None None Trustee None None Underwriting agencies None (Sell by our bank ) None (Sell by our bank ) Certifying lawyers Hsueh, Sung-Yu Hsueh, Sung-Yu
Deloitte & Touche Taiwan Deloitte & Touche Taiwan CPA C.P.A. Shao, Chih-Ming C.P.A. Shao, Chih-Ming Certifying Financial Institution Hua Nan Bills Finance Corporation Hua Nan Bills Finance CorporationRepayment method Total payback upon deadline Total payback upon deadline Unpaid balance NT$2,000,000,000 NT$1,800,000,000 Paid-In Capital of Previous Year NT$10,915,265,040 NT$12,439,281,340 Net Worth of Previous Year NT$12,892,912,768 NT13,811,120,055 Compliance cases None None Redemption or prepayment terms None None Conversion and exchange conditions None None Restrictive clauses Subordinated Financial Debentures Subordinated Financial Debentures
Access to a stable middle and long-term source of operating funds to improve
the bank’s capital structure.
Access to a stable middle and long-term source of operating funds to improve the bank’s capital structure.
Fund operation plan
Ratio of Applied Shares and PriorShares Outstanding to Prior Year’sFinal Net Worth (%)
15.51% 27.51%
Considered as Qualified Capital and ItsTiers
Tier 2 Tier 2
Taiwan Rating Co., Ltd. Taiwan Rating Co., Ltd. Credit rating agency names, assessment date and its grade rating (Note 1)
Assessment Date: September 25, 2008 Assessment Date: September 25, 2008Grade rating: twBBB+ Grade rating: twBBB+
29

The First Type B Bond
Subordinated Financial Debentures in 2007
The Second Type A Bond Subordinated Financial Debentures
in 2007
Types of Subordinated FinancialDebentures
( Private Placement) Central authority approval date andnumber
Letter with File No. Chin-kuan-yin-(III)-tzu No. 09500549820
Letter with File No. Chin-kuan-yin-(III)-tzu No. 09500549820
Date of issue April 9, 2007 November 16, 2007 Par Value NT$10,000,000 NT$100,000 Site of issue and operations R.O.C R.O.C Currency New Taiwan Dollars New Taiwan Dollars Offering Price Issued at the bond par value Issued at the bond par value Total amount NT$1,100,000,000 NT$203,500,000
Floating interest rates according to the listed floating interest rates of general deposit for one-year CD in Bank of Taiwan plus 0.60% single tactical interest, with a quarterly
resetting and annual interest payment.
At fixed single interest rate of APR 3.6 % with annual payment Interest Rate
5 years and 6 months, From November 16, 2007 to
May 16, 2013
7 years, Maturity From April 9, 2007 to April 9, 2014
Repayment priority of the bond claims (including principal and
interest) is only better than the right of the Bank to distribute residual property and second to the bank’s
general claims.
Repayment priority of the bond claims (including principal and
interest) is only better than the right of the Bank to distribute residual property and second to the bank’s
general claims.
Repayment Priority
Guarantee agency None None Trustee None None Underwriting agencies None (Sell by our bank ) None (Sell by our bank ) Certifying lawyers Hsueh, Sung-Yu Hsueh, Sung-Yu
Deloitte & Touche Taiwan Deloitte & Touche Taiwan CPA C.P.A. Shao, Chih-Ming C.P.A. Shao, Chih-Ming Certifying Financial Institution None None Repayment method Total payback upon deadline Total payback upon deadline Unpaid balance NT$1,100,000,000 NT$203,500,000 Paid-In Capital of Previous Year NT$12,439,281,340 NT$12,439,281,340 Net Worth of Previous Year NT$13,811,120,055 NT$13,811,120,055 Compliance cases None None Redemption or prepayment terms None None Conversion and exchange conditions None None Restrictive clauses Subordinated Financial Debentures Subordinated Financial Debentures
Access to a stable middle and long-term source of operating funds
to improve the bank’s capital structure.
Access to a stable middle and long-term source of operating funds
to improve the bank’s capital structure.
Fund operation plan
Ratio of Applied Shares and Prior SharesOutstanding to Prior Year’s Final NetWorth (%)
35.48% 36.95%
Considered as Qualified Capital and Its Tiers Tier 2 Tier 2
Taiwan Rating Co., Ltd. Taiwan Rating Co., Ltd. Credit rating agency names, assessment date and its grade rating (Note 1)
Assessment Date: September 25, 2008
Assessment Date: September 25, 2008
Grade rating: twBBB+ Grade rating: twBBB+
30

The Second Type B Bond The Third Type A Bond Subordinated Financial Debentures in 2007 Types of Subordinated Financial Debentures Subordinated Financial Debentures in
2007 Letter with File No. Chin-kuan-yin-
(III)-tzu No. 09500549820 Letter with File No. Chin-kuan-yin-
(III)-tzu No. 09500549820 Central authority approval date and number
Date of issue November 16, 2007 December 26, 2007 Par Value NT$100,000 NT$100,000 Site of issue and operations (Note 2) R.O.C R.O.C Currency New Taiwan Dollars New Taiwan Dollars Offering Price Issued at the bond par value Issued at the bond par value Total amount NT$101,000,000 NT$261,000,000
Floating interest rates according to the listed floating interest rates of general deposit for one-year CD in Bank of Taiwan plus 0.75% single tactical
interest, with a quarterly reseting and annual interest payment.
At fixed single interest rate of APR 3.8 % with annual payment Interest Rate
5 years and 6 months, From November 16, 2007 to
May 16, 2013
6 years and 2 months, Maturity From December 26, 2007 to
February 26, 2014 Repayment priority of the bond claims
(including principal and interest) is only better than the right of the Bank to distribute residual property and second
to the bank’s general claims.
Repayment priority of the bond claims (including principal and interest) is
only better than the right of the Bank to distribute residual property and second
to the bank’s general claims.
Repayment Priority
Guarantee agency None None Trustee None None Underwriting agencies None (Sell by our bank ) None (Sell by our bank ) Certifying lawyers Hsueh, Sung-Yu Hsueh, Sung-Yu
Deloitte & Touche Taiwan Deloitte & Touche Taiwan CPA (Note 3) C.P.A. Shao, Chih-Ming C.P.A. Shao, Chih-Ming Certifying Financial Institution None None Repayment method Total payback upon deadline Total payback upon deadline Unpaid balance NT$101,000,000 NT$261,000,000 Paid-In Capital of Previous Year NT$12,439,281,340 NT$12,439,281,340 Net Worth of Previous Year NT$13,811,120,055 NT$13,811,120,055 Compliance cases None None Redemption or prepayment terms None None Conversion and exchange conditions None None Restrictive clauses (Note 4) Subordinated Financial Debentures Subordinated Financial Debentures
Access to a stable middle and long-term source of operating funds to improve the bank’s capital structure.
Access to a stable middle and long-term source of operating funds to improve the bank’s capital structure.
Fund operation plan
Ratio of Applied Shares and Prior Shares Outstanding to Prior Year’s Final Net Worth (%)
37.68% 39.57%
Considered as Qualified Capital and Its Tiers Tier 2 Tier 2 Taiwan Rating Co., Ltd. Taiwan Rating Co., Ltd. Credit rating agency names, assessment date
and its grade rating (Note 1) Assessment Date: September 25, 2008 Assessment Date: September 25, 2008Grade rating: twBBB+ Grade rating: twBBB+
31
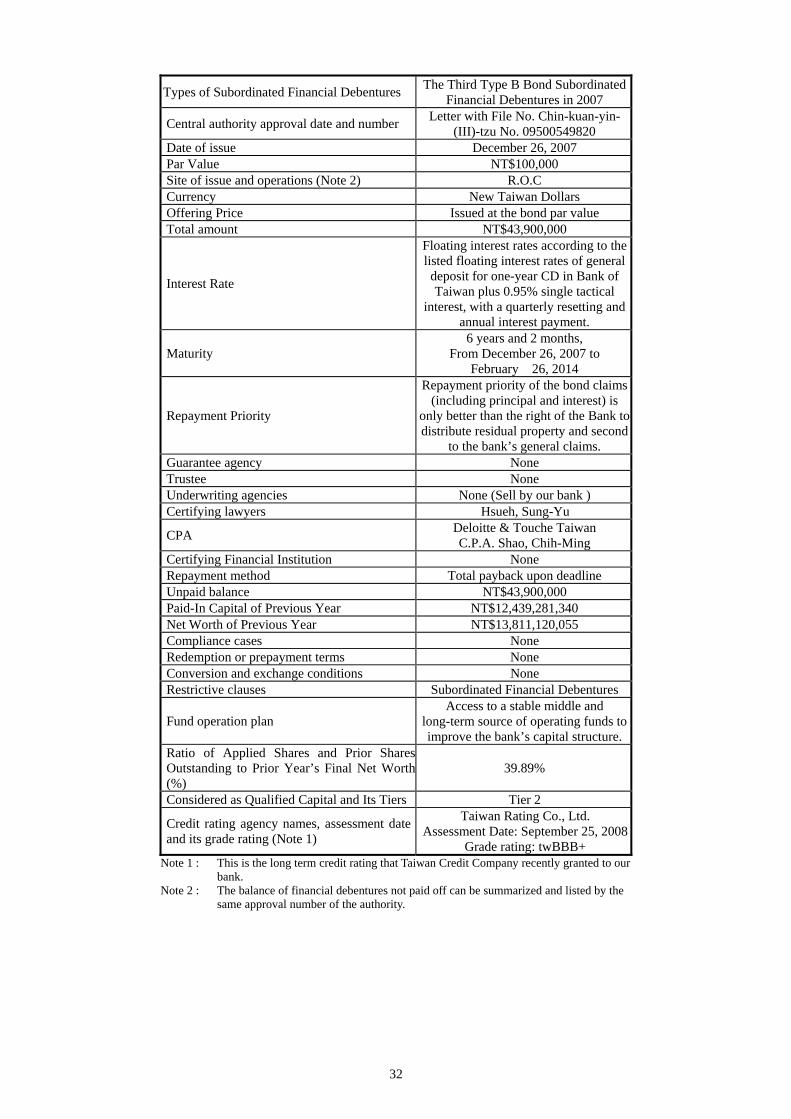
The Third Type B Bond Subordinated Financial Debentures in 2007 Types of Subordinated Financial Debentures
Letter with File No. Chin-kuan-yin- (III)-tzu No. 09500549820 Central authority approval date and number
Date of issue December 26, 2007 Par Value NT$100,000 Site of issue and operations (Note 2) R.O.C Currency New Taiwan Dollars Offering Price Issued at the bond par value Total amount NT$43,900,000
Floating interest rates according to the listed floating interest rates of general deposit for one-year CD in Bank of Taiwan plus 0.95% single tactical
interest, with a quarterly resetting and annual interest payment.
Interest Rate
6 years and 2 months, Maturity From December 26, 2007 to
February 26, 2014 Repayment priority of the bond claims
(including principal and interest) is only better than the right of the Bank to distribute residual property and second
to the bank’s general claims.
Repayment Priority
Guarantee agency None Trustee None Underwriting agencies None (Sell by our bank ) Certifying lawyers Hsueh, Sung-Yu
Deloitte & Touche Taiwan CPA C.P.A. Shao, Chih-Ming Certifying Financial Institution None Repayment method Total payback upon deadline Unpaid balance NT$43,900,000 Paid-In Capital of Previous Year NT$12,439,281,340 Net Worth of Previous Year NT$13,811,120,055 Compliance cases None Redemption or prepayment terms None Conversion and exchange conditions None Restrictive clauses Subordinated Financial Debentures
Access to a stable middle and long-term source of operating funds to improve the bank’s capital structure.
Fund operation plan
Ratio of Applied Shares and Prior Shares Outstanding to Prior Year’s Final Net Worth (%)
39.89%
Considered as Qualified Capital and Its Tiers Tier 2 Taiwan Rating Co., Ltd. Credit rating agency names, assessment date
and its grade rating (Note 1) Assessment Date: September 25, 2008 Grade rating: twBBB+
Note 1 : This is the long term credit rating that Taiwan Credit Company recently granted to our bank.
Note 2 : The balance of financial debentures not paid off can be summarized and listed by the same approval number of the authority.
32

3. Preferred Shares None
4. Depositary Receipts None
5. Employee Stock Option None
6. Merges & transfers to other financial institutions None
7. Fund operation plan implementation case: None
V. Operations Overview 1. Businesses content
(1) Business operations of other major businesses, and the business assets (or) the total income and assets (or) the proportion of the total income and growth and the changes a. Wealth management business
In 2008, the Bank tuned its product strategies to be conservative. The
structure notes were asked to be 100% principal guaranteed. The issuers and the
guarantors are also asked to stand above a significant level of credit rating and
cautiously evaluate and select products. Meanwhile, the Bank basically
recommended bond funds with stable dividends. Also, to make financial transactions
convenient for customers, the Bank established “Subscribe Funds Online” during the
4th Quarter of 2008. The Bank’s moderate asset allocation and diverse financial
services significantly boosted client’s confidence and dependence on the Bank. Unit: Million Dollars
2008 2007 Increment ( Note 2)
Sales increase
(decrease)
Revenue increase
(decrease)
Type Sales Revenue Sales Revenue
Domestic Mutual Funds (Note 1) 1,411 10 6,574 37 (5,163) (27)
Oversea Mutual Funds 4,452 70 13,781 250 (9,329) (180)
Structured Notes 2,475 34 447 12 2,028 22Insurance 6,027 84 998 31 5,029 53Subtotal 14,365 198 21,800 330 (7,435) (132)
Note 1: “Domestic Mutual Funds” refers to domestic fund sales and domestic fund service fee, excluding bond funds. Note 2: “Increment” refers to the increment of Year 2008, comparing to 2007 (Formula = Yr 2008-Yr2007) b. Consuming Finance (a) Mortgage: At the end of 2008, the balance of the mortgage, NT$108.4 billion,
was 64.22% of total balance of loan balance of the Bank. With NT$110.7 billion at the end of 2007, a net decrease of NT$2.3 billion, or the decrease by -2.08%, was seen.
(b) Loan: At the end of 2008, the total balance of loan, NT$5.4 billion, was 3.20% of total loan balance of the Bank. With NT$6.2 billion at the end of 2007, a net decrease of NT$800 million, or the decrease by -12.90%, was seen.
33
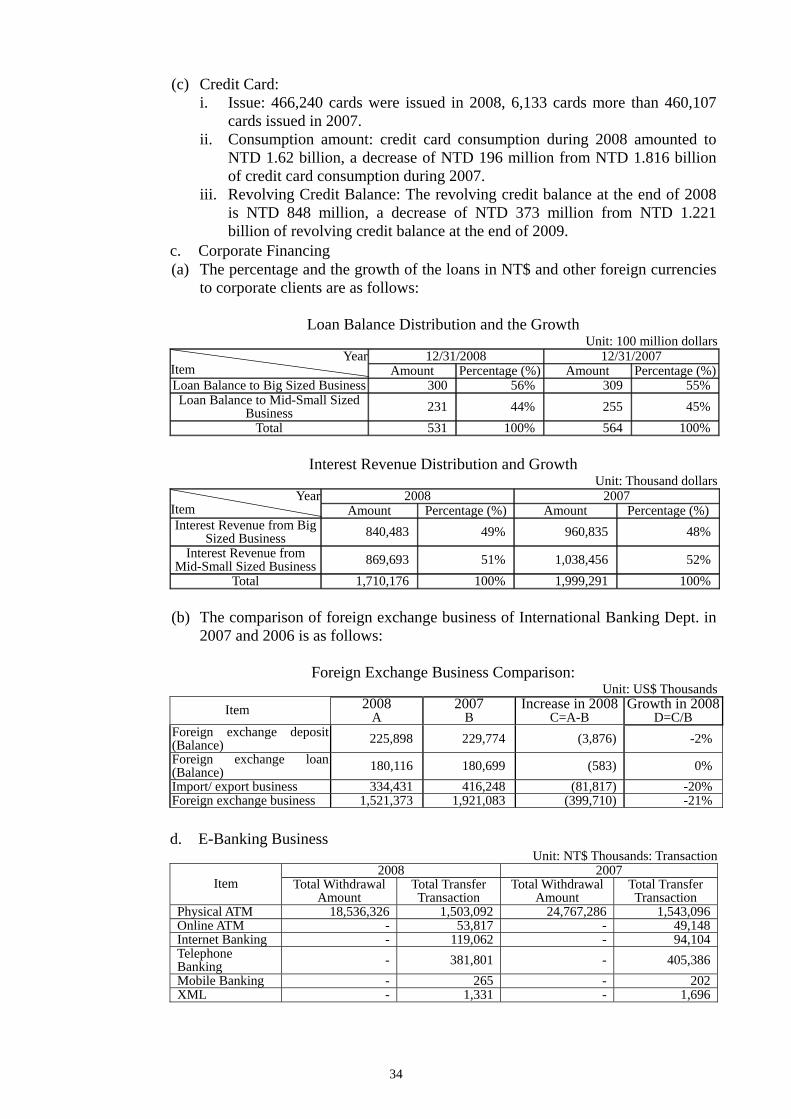
(c) Credit Card: i. Issue: 466,240 cards were issued in 2008, 6,133 cards more than 460,107
cards issued in 2007. ii. Consumption amount: credit card consumption during 2008 amounted to
NTD 1.62 billion, a decrease of NTD 196 million from NTD 1.816 billion of credit card consumption during 2007.
iii. Revolving Credit Balance: The revolving credit balance at the end of 2008 is NTD 848 million, a decrease of NTD 373 million from NTD 1.221 billion of revolving credit balance at the end of 2009.
c. Corporate Financing (a) The percentage and the growth of the loans in NT$ and other foreign currencies
to corporate clients are as follows:
Loan Balance Distribution and the Growth Unit: 100 million dollars
12/31/2008 12/31/2007 YearItem Amount Percentage (%) Amount Percentage (%)Loan Balance to Big Sized Business 300 56% 309 55%Loan Balance to Mid-Small Sized
Business 231 44% 255 45%Total 531 100% 564 100%
Interest Revenue Distribution and Growth
Unit: Thousand dollars 2008 2007 Year
Item Amount Percentage (%) Amount Percentage (%)Interest Revenue from Big
Sized Business 840,483 49% 960,835 48%Interest Revenue from
Mid-Small Sized Business 869,693 51% 1,038,456 52%Total 1,710,176 100% 1,999,291 100%
(b) The comparison of foreign exchange business of International Banking Dept. in
2007 and 2006 is as follows:
Foreign Exchange Business Comparison: Unit: US$ Thousands
2008 2007 Increase in 2008 Growth in 2008 Item A B C=A-B D=C/B Foreign exchange deposit (Balance) 225,898 229,774 (3,876) -2%Foreign exchange loan (Balance) 180,116 180,699 (583) 0%Import/ export business 334,431 416,248 (81,817) -20%Foreign exchange business 1,521,373 1,921,083 (399,710) -21% d. E-Banking Business
Unit: NT$ Thousands: Transaction 2008 2007
Item Total Withdrawal Amount
Total Transfer Transaction
Total Withdrawal Amount
Total Transfer Transaction
Physical ATM 18,536,326 1,503,092 24,767,286 1,543,096Online ATM - 53,817 - 49,148Internet Banking - 119,062 - 94,104Telephone Banking - 381,801 - 405,386Mobile Banking - 265 - 202XML - 1,331 - 1,696
34

e. Trust Total Balance for Trusted Asset at the end of 2008 was NT$38.525 billion or an increase of NT$14.1 billion from NT$ 24.425 billion at the end of 2007. The growth reached as high as 57.73%. Meanwhile, according to Chung-To-Cha-Tzu Letter No. 0960000810, “The securities investment trust contracts of money trust services, upon the Authority’s approval, takes force at January 1st 2008.” Therefore, securities investment trust fund with trust asset under custody amounted to NT$ 16.38 billion.
Unit: NT$100 Millions Item Increment Annual
Growth 12/31/2008 12/31/2007
Trust Business 385.25 244.25 141.00 57.73% Money Trust 357.06 209.10 147.96 70.76%
Specific Money Trusted in Domestic and Foreign Securities Investments 191.58 205.12 -13.54 -6.60%
Other Money Trusts 1.68 3.98 -2.30 -57.79%(Note) Securities Investment Trust
Fund Custody Business - 163.80 163.80 -
Real Estate Trust 15.80 22.48 -6.68 -29.72% Securities Trust 12.39 12.67 -0.28 -2.21%Subsidiary Trust Business 46.38 720.44 -674.06 -93.56% Custody Business 0.10 247.08 -246.98 -99.96% (Note) Securities Investment Trust Fund Custody Business 241.62 -241.62 - -
Discretionary Custody Business 0.00 5.36 -5.36 -100.00% Operation Bond Custody Business 0.10 0.10 0.00 0.00% Certifying Business (Operated Amount) 46.28 473.36 -427.08 -90.22%
Total 431.63 964.69 -533.06 -55.26%(Note) Chung-To-Cha-Tzu Letter No. 0960000810: The securities investment trust contracts of money trust services, upon the
Authority’s approval, takes force at January 1st 2008. Source: Quarterly Report of Trust Association of R.O.C
f. Investment Business Growth and changes of Transaction revenue are as follows:
Security Transaction Classification in 2007 and 2008 (Notes and bills trading) Unit: NT$ Thousands
Items 2007 2008 Increment Bonds interests 3,748 8,586 (4,838)Stock interests (loss) (240,664) 2,202 (242,866)Beneficiary certificates interests (34,100) 28,043 (62,143)Short-term bill interests (loss) 12,113 32,310 (20,197)Evaluation interests (loss ) (149,527) 89,542 (239,069)Dividend 60,158 43,593 16,565Total (348,272) 204,276 (552,548)The table above indicated that the bank profited from security transaction revenue of NT$204,276,000 in 2007 and suffered from loss of NT$348,272,000 in 2008. The details are as follows: (a) Bonds interests:
Capital gains on trading government bonds. Profit of NT$8,586,000 was gained in 2007 and NT$ 3,748,000 in 2008. During the last 2 years, bond rates have been in consolidation. The holding position was not seen significant changes and most was available for sale position.
(b) Stock interests (loss): Profit gained on trading listed and OTC stocks. Profit of NT$ 2,202,000 was earned in 2007 while loss of NT$ 240,664,000 was seen in 2008. The loss in Year 2008 arose from the impact of the slump of global stock market.
35

(c) Beneficiary certificates interests: Profit on fund trading. Profit of NT$ 28,043,000 was earned in 2007 while loss of NT$ 34,100,000 was seen in 2008. The loss in Year 2008 arose from the impact of the slump of global stock market.
(d) Short-term bill interests: Profit gain on trading short-term bill (including CP2, NCD, BA, TB and ABCP etc.) In 2007 and 2008, gain on short-term bills included interest revenue of NT$449,117,000 and NT$458,539,000. Interest on Disposal is profit of NT$32,310,000 and NT$12,113,000.
(e) Evaluation interests (loss): Evaluation interest or loss on evaluation according to the market prices. In 2007, evaluation interest was recognized as NT$89,542,000 while, due to the slump of the global stock market, evaluation loss was recognized as NT$ 149,527, 000.
(f) Dividend: Cash dividends distributed by listed and OTC companies. Cash dividend for 2007and 2008 was NT$43,593, 000 and NT$60,158,000 respectively. During recent years, listed and OTC companies usually chose to distribute cash dividend to avoid capital growth. As the Bank has been increasing the investment position, cash dividend received has been increasing, too. In summary: For security transaction revenue, stock and fund profit rose in 2006 because the global stock market had been booming. In 2007, NT$89,542,000 was recognized as evaluation interest. Net interest was totaled as NT$204,276,000. In 2008, NT$ 149,527,000 was recognized as evaluation. Net loss was totaled as NT$ 348,272,000.
(2) The Operation Plan of the Year a. Wealth Management (a) Furnish customized financial diagnosis ( Bull Up Your Portfolio): Provide
clients suggestions on over 1,000 financial products of domestic competitors to meet the all-round needs for clients with different asset value or risk tolerance. In order to shorten the break-even period for clients at loss caused by the financial tsunami, the bank launched customized financial diagnosis. The Bank not only inspects clients’ current investment, but also assists them with asset allocation for this short-selling period.
(b) Provide diverse financial products: Plan to introduce new financial products such as privately placement fund or collective management accounts in order to furnish the Bank’s clients more options in financial products
(c) Elevate client’s service efficiency: Target at customer need and segment clients by the age and regional features to provide differentiated marketing event planning.
(d) Provide premium service to the Bank’s VIPs: to strengthen VIPs’ loyalty to the Bank’s wealth management.
(e) Introduce the “Family Group” concept: Plan finance seminars and expand the scope of customers into their relatives and friends to raise the scale of the Bank’s customers and raise the Bank’s awareness.
(f) Advance expertise of financial advisors and provide clients professional financial services: target the goal of at least one professional financial advisor per branch. Through the elementary and advance classified training for financial advisors, advance financial advisors’ expertise and images and provide more professional financial services to the Bank’s clients.
b. Consuming Finance (a) Mortgage: With a competitive mortgage market and transparent interest rates,
36

interest rates for new house loans keep low. On the premises of self-owned capital adequacy for financial liberalization and internationalization and risk management in response to changes in the real estate market, the Bank rationally allocate risky assets and fully execute differential pricing strategies to shield rational interest gap. Currently the Bank has launched various house loans. Those loans include “Double Plus”, “Go and Transfer”, “Easy Paid”, “Residence”, “Non-Residence”, the financial and the government home loans, all of which can accompanied by mortgage life insurance and satisfy clients with different needs to raise fee income.
(b) Credit Loan: under the strike of domestic and international economy, the unemployment rate keeps ascending. Also, the government conducted credit control on credit loans and sales of double cards shrank. Therefore, the credit loan market is in recession. Before the market settles and the regulations turn clear and complete, credit loans will be conservatively managed on the premise of protecting asset quality.
(c) Credit Cards: i. Sell insurance and financing products across departments of the whole bank. ii. Provide deduction and payment for public utilities to maximize added value. iii. Provide credit card holders of the Bank more benefits for card usage.
c. Corporate Financing (a) Business Goals:
As an era with the sluggish economy and low interest rates is about to come, the Bank is facing a harsh market and relatively high cost. Next year, the business will focus on minimize capital cost, continuously advancing the weight of demand deposits and staff productivity and efficiency and raise the interest gap of mid and small sized business ( with an credit amount under NT$ 30 million) to boost loan and cross-sales fee income. The Bank will also cautiously select its target customers, stay aware of their sources of payment and well perform prior investigation ( site assessment) and post management (re-examination)
(b) Growth Strategies According to the spirit of Basel Accords, the balance of weighted risky assets can be operated to as much as 12.5 times of self-owned capital. With the Bank’s capital of NTD 12.4 billion, the Bank’s balance of weighted risky assets can be operated up to NTD 155 billion.
Item Risk Weighted Coefficient Amount Limit Credit Guarantee Fund(Note) 20% --
Time Deposit of Other Banks 20% -- Residential Mortgage 45% --
Small Credit Loan 75% -- Mid/Small Sized (Credit) 75% Under $ 3 million
Guarantee (Spot and Forward L/C, loan 20% -- replace, foreign currencies) Major Enterprises (Credit) 100% --
Note: Risk coefficient is 20% for 100% credit guarantee and 47.5% for 50% of guarantee funds. With limited capital, the Bank should operate business with low risk coefficient in order to utilize the risks that self-owned capital can shoulder. Therefore, the previously great-enterprise based ideology should be totally changed. In the future, the growth strategies for crediting should focus on house loans, small loans and mid and small sized enterprises with an amount under NTD 30 million and credit guaranty. Thus, the growth strategies are explicated as follows:
i. Sale Volume: (i) Expand the scale of short term credit and reduce mid and long term credit. (ii) Increase secured or self-liquidating credit and decrease credit-related products. (iii) Lower the significant credit and raise the small-amount credit.
37
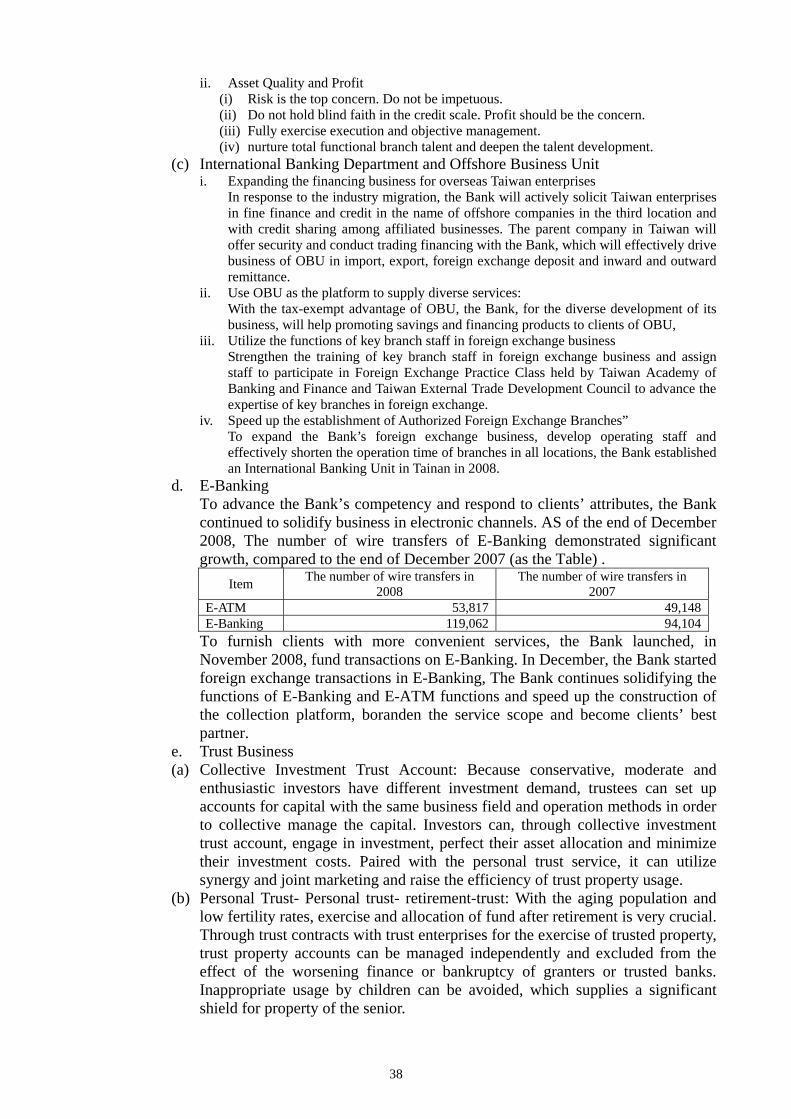
ii. Asset Quality and Profit (i) Risk is the top concern. Do not be impetuous. (ii) Do not hold blind faith in the credit scale. Profit should be the concern. (iii) Fully exercise execution and objective management. (iv) nurture total functional branch talent and deepen the talent development.
(c) International Banking Department and Offshore Business Unit i. Expanding the financing business for overseas Taiwan enterprises
In response to the industry migration, the Bank will actively solicit Taiwan enterprises in fine finance and credit in the name of offshore companies in the third location and with credit sharing among affiliated businesses. The parent company in Taiwan will offer security and conduct trading financing with the Bank, which will effectively drive business of OBU in import, export, foreign exchange deposit and inward and outward remittance.
ii. Use OBU as the platform to supply diverse services: With the tax-exempt advantage of OBU, the Bank, for the diverse development of its business, will help promoting savings and financing products to clients of OBU,
iii. Utilize the functions of key branch staff in foreign exchange business Strengthen the training of key branch staff in foreign exchange business and assign staff to participate in Foreign Exchange Practice Class held by Taiwan Academy of Banking and Finance and Taiwan External Trade Development Council to advance the expertise of key branches in foreign exchange.
iv. Speed up the establishment of Authorized Foreign Exchange Branches” To expand the Bank’s foreign exchange business, develop operating staff and effectively shorten the operation time of branches in all locations, the Bank established an International Banking Unit in Tainan in 2008.
d. E-Banking To advance the Bank’s competency and respond to clients’ attributes, the Bank continued to solidify business in electronic channels. AS of the end of December 2008, The number of wire transfers of E-Banking demonstrated significant growth, compared to the end of December 2007 (as the Table) .
The number of wire transfers in 2008
The number of wire transfers in 2007 Item
E-ATM 53,817 49,148E-Banking 119,062 94,104
To furnish clients with more convenient services, the Bank launched, in November 2008, fund transactions on E-Banking. In December, the Bank started foreign exchange transactions in E-Banking, The Bank continues solidifying the functions of E-Banking and E-ATM functions and speed up the construction of the collection platform, boranden the service scope and become clients’ best partner.
e. Trust Business (a) Collective Investment Trust Account: Because conservative, moderate and
enthusiastic investors have different investment demand, trustees can set up accounts for capital with the same business field and operation methods in order to collective manage the capital. Investors can, through collective investment trust account, engage in investment, perfect their asset allocation and minimize their investment costs. Paired with the personal trust service, it can utilize synergy and joint marketing and raise the efficiency of trust property usage.
(b) Personal Trust- Personal trust- retirement-trust: With the aging population and low fertility rates, exercise and allocation of fund after retirement is very crucial. Through trust contracts with trust enterprises for the exercise of trusted property, trust property accounts can be managed independently and excluded from the effect of the worsening finance or bankruptcy of granters or trusted banks. Inappropriate usage by children can be avoided, which supplies a significant shield for property of the senior.
38
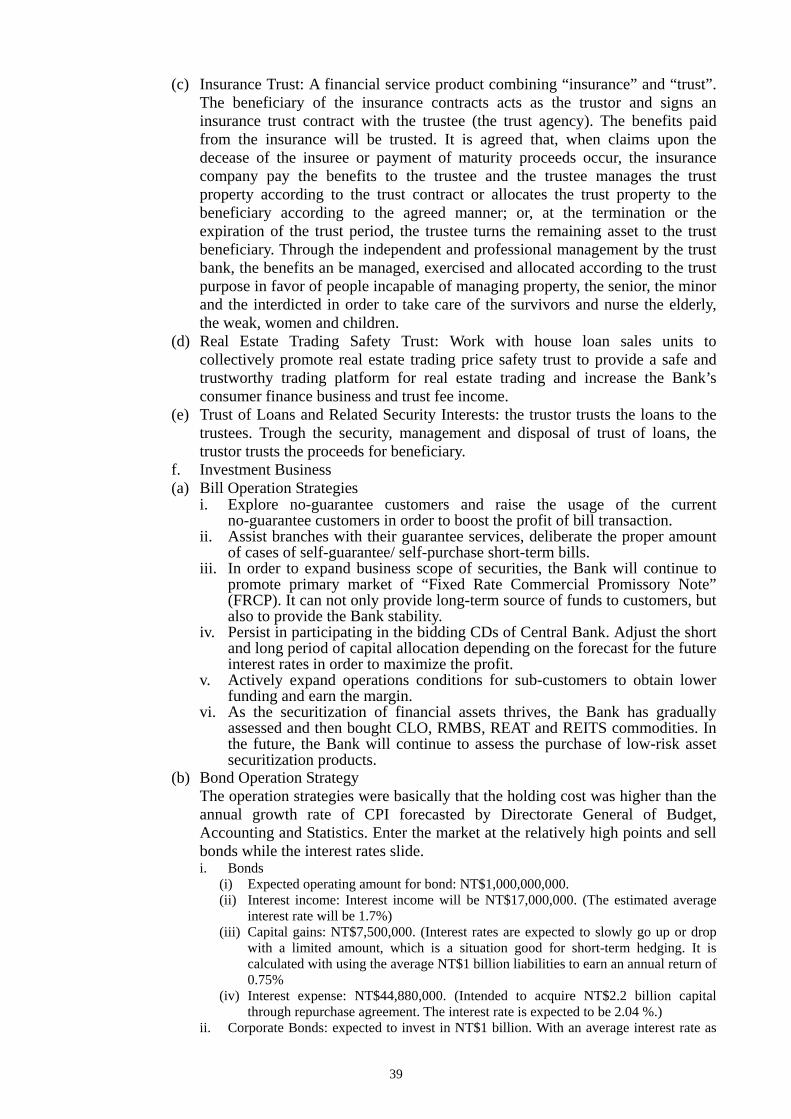
(c) Insurance Trust: A financial service product combining “insurance” and “trust”. The beneficiary of the insurance contracts acts as the trustor and signs an insurance trust contract with the trustee (the trust agency). The benefits paid from the insurance will be trusted. It is agreed that, when claims upon the decease of the insuree or payment of maturity proceeds occur, the insurance company pay the benefits to the trustee and the trustee manages the trust property according to the trust contract or allocates the trust property to the beneficiary according to the agreed manner; or, at the termination or the expiration of the trust period, the trustee turns the remaining asset to the trust beneficiary. Through the independent and professional management by the trust bank, the benefits an be managed, exercised and allocated according to the trust purpose in favor of people incapable of managing property, the senior, the minor and the interdicted in order to take care of the survivors and nurse the elderly, the weak, women and children.
(d) Real Estate Trading Safety Trust: Work with house loan sales units to collectively promote real estate trading price safety trust to provide a safe and trustworthy trading platform for real estate trading and increase the Bank’s consumer finance business and trust fee income.
(e) Trust of Loans and Related Security Interests: the trustor trusts the loans to the trustees. Trough the security, management and disposal of trust of loans, the trustor trusts the proceeds for beneficiary.
f. Investment Business (a) Bill Operation Strategies
i. Explore no-guarantee customers and raise the usage of the current no-guarantee customers in order to boost the profit of bill transaction.
ii. Assist branches with their guarantee services, deliberate the proper amount of cases of self-guarantee/ self-purchase short-term bills.
iii. In order to expand business scope of securities, the Bank will continue to promote primary market of “Fixed Rate Commercial Promissory Note” (FRCP). It can not only provide long-term source of funds to customers, but also to provide the Bank stability.
iv. Persist in participating in the bidding CDs of Central Bank. Adjust the short and long period of capital allocation depending on the forecast for the future interest rates in order to maximize the profit.
v. Actively expand operations conditions for sub-customers to obtain lower funding and earn the margin.
vi. As the securitization of financial assets thrives, the Bank has gradually assessed and then bought CLO, RMBS, REAT and REITS commodities. In the future, the Bank will continue to assess the purchase of low-risk asset securitization products.
(b) Bond Operation Strategy The operation strategies were basically that the holding cost was higher than the annual growth rate of CPI forecasted by Directorate General of Budget, Accounting and Statistics. Enter the market at the relatively high points and sell bonds while the interest rates slide. i. Bonds
(i) Expected operating amount for bond: NT$1,000,000,000. (ii) Interest income: Interest income will be NT$17,000,000. (The estimated average
interest rate will be 1.7%) (iii) Capital gains: NT$7,500,000. (Interest rates are expected to slowly go up or drop
with a limited amount, which is a situation good for short-term hedging. It is calculated with using the average NT$1 billion liabilities to earn an annual return of 0.75%
(iv) Interest expense: NT$44,880,000. (Intended to acquire NT$2.2 billion capital through repurchase agreement. The interest rate is expected to be 2.04 %.)
ii. Corporate Bonds: expected to invest in NT$1 billion. With an average interest rate as
39
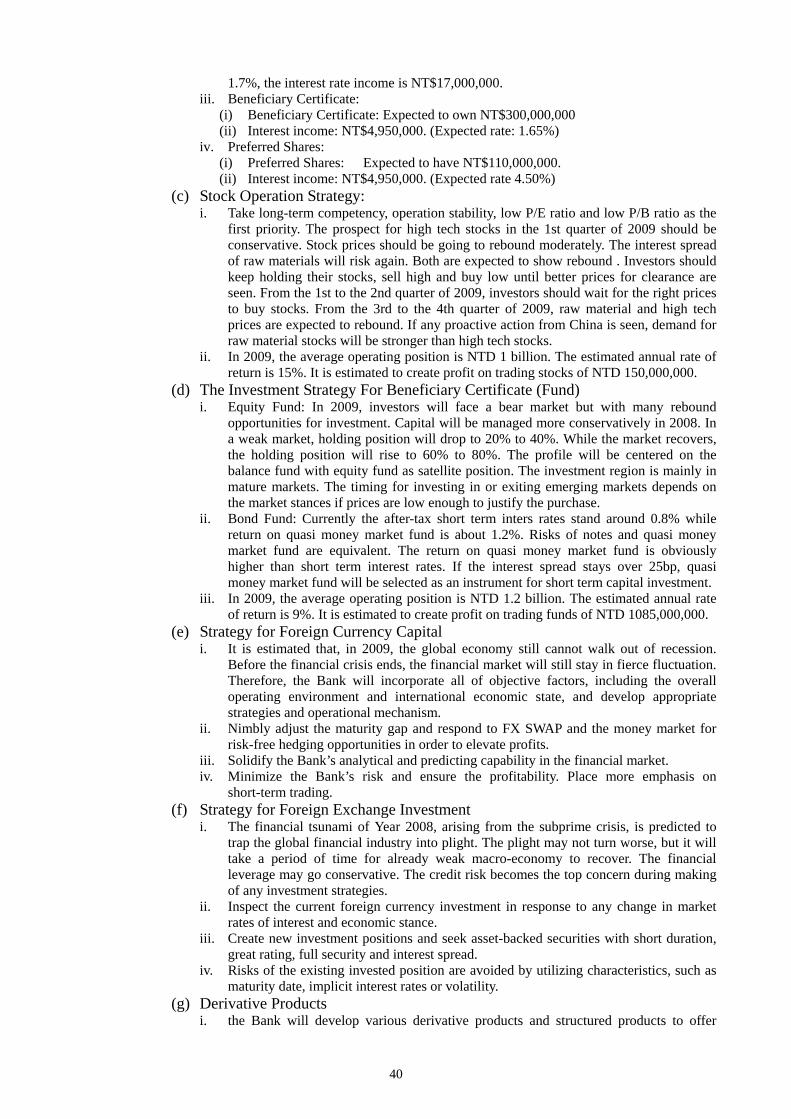
1.7%, the interest rate income is NT$17,000,000. iii. Beneficiary Certificate:
(i) Beneficiary Certificate: Expected to own NT$300,000,000 (ii) Interest income: NT$4,950,000. (Expected rate: 1.65%)
iv. Preferred Shares: (i) Preferred Shares: Expected to have NT$110,000,000. (ii) Interest income: NT$4,950,000. (Expected rate 4.50%)
(c) Stock Operation Strategy: i. Take long-term competency, operation stability, low P/E ratio and low P/B ratio as the
first priority. The prospect for high tech stocks in the 1st quarter of 2009 should be conservative. Stock prices should be going to rebound moderately. The interest spread of raw materials will risk again. Both are expected to show rebound . Investors should keep holding their stocks, sell high and buy low until better prices for clearance are seen. From the 1st to the 2nd quarter of 2009, investors should wait for the right prices to buy stocks. From the 3rd to the 4th quarter of 2009, raw material and high tech prices are expected to rebound. If any proactive action from China is seen, demand for raw material stocks will be stronger than high tech stocks.
ii. In 2009, the average operating position is NTD 1 billion. The estimated annual rate of return is 15%. It is estimated to create profit on trading stocks of NTD 150,000,000.
(d) The Investment Strategy For Beneficiary Certificate (Fund) i. Equity Fund: In 2009, investors will face a bear market but with many rebound
opportunities for investment. Capital will be managed more conservatively in 2008. In a weak market, holding position will drop to 20% to 40%. While the market recovers, the holding position will rise to 60% to 80%. The profile will be centered on the balance fund with equity fund as satellite position. The investment region is mainly in mature markets. The timing for investing in or exiting emerging markets depends on the market stances if prices are low enough to justify the purchase.
ii. Bond Fund: Currently the after-tax short term inters rates stand around 0.8% while return on quasi money market fund is about 1.2%. Risks of notes and quasi money market fund are equivalent. The return on quasi money market fund is obviously higher than short term interest rates. If the interest spread stays over 25bp, quasi money market fund will be selected as an instrument for short term capital investment.
iii. In 2009, the average operating position is NTD 1.2 billion. The estimated annual rate of return is 9%. It is estimated to create profit on trading funds of NTD 1085,000,000.
(e) Strategy for Foreign Currency Capital i. It is estimated that, in 2009, the global economy still cannot walk out of recession.
Before the financial crisis ends, the financial market will still stay in fierce fluctuation. Therefore, the Bank will incorporate all of objective factors, including the overall operating environment and international economic state, and develop appropriate strategies and operational mechanism.
ii. Nimbly adjust the maturity gap and respond to FX SWAP and the money market for risk-free hedging opportunities in order to elevate profits.
iii. Solidify the Bank’s analytical and predicting capability in the financial market. iv. Minimize the Bank’s risk and ensure the profitability. Place more emphasis on
short-term trading. (f) Strategy for Foreign Exchange Investment
i. The financial tsunami of Year 2008, arising from the subprime crisis, is predicted to trap the global financial industry into plight. The plight may not turn worse, but it will take a period of time for already weak macro-economy to recover. The financial leverage may go conservative. The credit risk becomes the top concern during making of any investment strategies.
ii. Inspect the current foreign currency investment in response to any change in market rates of interest and economic stance.
iii. Create new investment positions and seek asset-backed securities with short duration, great rating, full security and interest spread.
iv. Risks of the existing invested position are avoided by utilizing characteristics, such as maturity date, implicit interest rates or volatility.
(g) Derivative Products i. the Bank will develop various derivative products and structured products to offer
40

more investment and risk-averse options for clients of wealth management. ii. Develop models and types for new financial products, including applying for
permission of new products from the authority, product design, production of product manual, production of sales confirmation, and transaction operation procedures, to completely meet demand of the Bank and wealth management clients in risk aversion.
iii. Research the development feasibility of new types of derivatives to supply all-round financial services.
iv. Improve operational and risk controlling functions of the Bank’s front, middle and back end system in order to effectively and timely monitor all risks.
(3) Market Analysis a. The Bank Operation
The international financial environment faced vital changes. The subprime crisis turned into the globe-striking financial tsunami. The significance of its impact on the global economy and financial industry has far exceeded the market expectation and struck Taiwan financial system. Under such circumstance, domestic banks are facing harsher pressure in competition.
b. The Future Supply/ Demand and Potential for the Market (a) The Supply Sector
According to statistics from Financial Supervisory Commission, as of December 31 2008, there are 396 financial institutions, including ( domestic banks, medium business banks, the local branches of foreign banks, credit co-operative associations, credit departments of farmers’ association, investment and trust companies, bills finance companies and Department of Savings & Remittances, Chunghwa Post Co.) and 5,885 branch institutions. Meanwhile, products on the domestic financial channels share highly similar homogeneity. In order to grasp business from clients, price wars are commonly seen, which further lower profitability.
(b) The Demand Sector As the advancement of Taiwanese living quality and the increase in its wealth, their demand for financial services andf products thus rises, too. Financial institutes must strive to boost the quality of financial services, furnish more diverse products and further client contacts in order to satisfy clients. Struck by financial tsunami, the government proactively executes invesment-encouraging and domestic enterprise- supporting policies. Through banks as financial medium, the government requires banks to maintain regular crediting services and help mid and small sized enterprises with fragile credit foundation acquire operating funds in order to sustain drive for economic recovery. However, banks, in consideration of risk, still remain their caution and conservatism on crediting, which continues the recession of credit business in the banking industry.
(c) The Potential In preview of 2009, domestic financial institutes still have to face significant challenges against business expansion. Amid the impact of financial tsunami, companies in every industry face much higher operation risks. Banks must execute more proactive operation strategies in responses to changes in domestic economy and markets. Facing a much harsher operating environment, the financial market takes more rapid steps to liberation. Financial institutes show stronger demand on solidifying revenue from traditional services, creating their niche services and strengthening management of their operation risks. In the current phase, with more and more liberal cross-strait policies of the government, more space for operation and growth is seen on offshore banking and corporate finance.
41

c. The Competitive Niches, Advantages and Disadvantages for Development and Solutions.
(a) The Competitive Niches i. Embrace a network totaled as 96 domestic branches, mainly located in Taipei and
Kaohsiung metropolis. ii. Good locations, friendly and efficient services and smooth interaction with customers. iii. Rational management and operation which expedite maximizing service quality and
efficiency and advancing performance of business expansion and crediting quality. iv. Strong capability of responding to environmental and market contingency and
adjusting market strategies. Astonishing flexibility. (b) Advantages and Disadvantages for Development
i. Advantages (i) The overall financial environment has become more and more sound. The
authorities are open to and encouraging research and development of new types of financial products.
(ii) The concept of investment has rooted in people’s mind and the concept of trust has also formed gradually.
(iii) The economies are still growing slowly and businesses still have strong demand for capital, which benefits banks to promote their services.
(iv) Government continues loosening up limitations on business and regulations, which completes financial products and help the elevation of profits.
ii. Disadvantages (i) The financial market opens more and more quickly. Domestic banks therefore face
strong competition brought by large international financial groups, which have their preferential advantages in trans-industrial and transnational management experience and integration of financial innovation and technology.
(ii) The percentage of direct finance keeps rising, which shall suppress the growth and profitability of traditional banking services.
(iii) The market stays at low interest rates. The business rivalry among banks is still the same. The interest spread between deposit and loans cannot be effectively raised and profitability has been continuously reduced.
(iv) The financial institutions continue the consolidation. With financial holdings tend to go larger and larger, their future developments face limitation.
(c) Solutions i. Keep on investing resources, strengthen research and development of new financial
products, provide customer with differentiated quality services, and avoid malicious price competition.
ii. Re-plan the locations of branches and develop new marketing channels so as to utilize the network advantages of 96 branches national wide.
iii. Keep promoting capital increase plans so as to solidify operating capital of Sunny Bank Ltd.
(4) Research of Financial Products and Business Development: None (5) Long and Short Term Business Development Plans
For the short-term plan, to reach financial ratio targets required by the authority is the top priority. During the current and the next two years, the top goal is to improve the operating structure and the financial structure and sustain the fine loan-to-deposit ratio so deposit and loan can thrive in balance. Through branch relocation and expansion of operation area, the Bank plans to urge branches to “Drive Sales By Service” in order to maximize the client base and their contribution. The Bank is planning to issue subordinated bonds to solidify its operating capital and raise the Bank’s self-owned capital adequacy. The Bank plans, through introducing external fund, to upgrade BIS, lower overdue loan ratios to be below 2.5%, and raise the coverage rate for bad debt allowance to exceed 40%. Starting the next second year, the Bank will, through the acquisition of high quality cooperatives and setting up overseas branches, strive to satisfy Taiwan enterprises and expand its operating territory. It is expected that, starting from 2013, the Bank will expand related financial business and become a virtual financial holdings
42

through acquisition and merger. The medium and long-term business development plans are as follows:
2009~2010 2010~2012 Year After 2013 To improve the operating
structure and the financial structure
To acquire of high quality cooperatives
To acquire insurance companies Business
Development Plan To introduce external
fund To and set up overseas
branches -
2. The Employee Profile
Year 2007 2008 The Period until April 30, 2009Executives 588 547 515
Senior Clerks 1853 1629 1532 Clerks 18 13 9
Number of Employees
Total 2459 2189 2056 Male 45.79% 44.77% 44.07% Sex Ratio Female 54.21% 55.23% 55.93%
Average Age 34.25 35.25 35.31 Average Seniority 6.89 7.86 7.86
PhD 0% 0% 0% Master 4.55% 4.52% 4.91% College 78.04% 78.94% 79.86%
Senior High School 16.96% 16.22% 15.03% Education Distribution
Under Senior High School 0.45% 0.32% 0.20%
The Period until April 30, 2009 Employees with Professional License and Number 2007 2008
Basic Proficiency Test for Bank Internal Control 1411 1291 1235 Proficiency Test for Trust Operations Personnel 1533 1479 1435 Trust Operations Personnel 456 431 401 Trust Operations Supervisor 6 6 5 Proficiency Test for Life Insurance Specialist 1873 1769 1693 Proficiency Test for Investment-oriented Insurance Personnel 936 928 898 Proficiency Test for Property Insurance Personnel 1641 1611 1591 Proficiency Test for Financial Planning Personnel 460 416 400 Basic Proficiency Test for International Banking Personnel 435 420 404 Basic Proficiency Test for Bank Lending Personnel 842 784 756 Advanced Proficiency Test for Bank Lending Personnel 22 23 22 Proficiency Test for Futures Specialist 341 343 335 Proficiency Test for Securities Specialist 228 202 197 Proficiency Test for Senior Securities Specialist 166 163 161 Proficiency Test for Securities Investment Trust and Consulting Professionals 136 123 122
Proficiency Test for Bill Finance Specialist 45 47 47 Proficiency Test for Financial Risk Management Personnel 4 4 4 Proficiency Test for Bank Collateral Appraisal Personnel 22 23 21 Qualification of Financial Market Knowledge & Professional Ethics Test 1502 1536 1474
Qualification of Investment Trust and Consulting Regulations Test 836 923 887
Consultant of Financial Planning (CFP) 3 4 4 Proficiency Test for Bond Specialist 15 14 13 Proficiency Test for Securities Investment Analyst 3 6 6 Proficiency Test for Life Insurance Representative to Sell Foreign Currency Receiving and Paying in Non-Investment Oriented Insurance Products
102 420 413
Certificate of Completion of Risk Management for Foreign 0 0 0
43
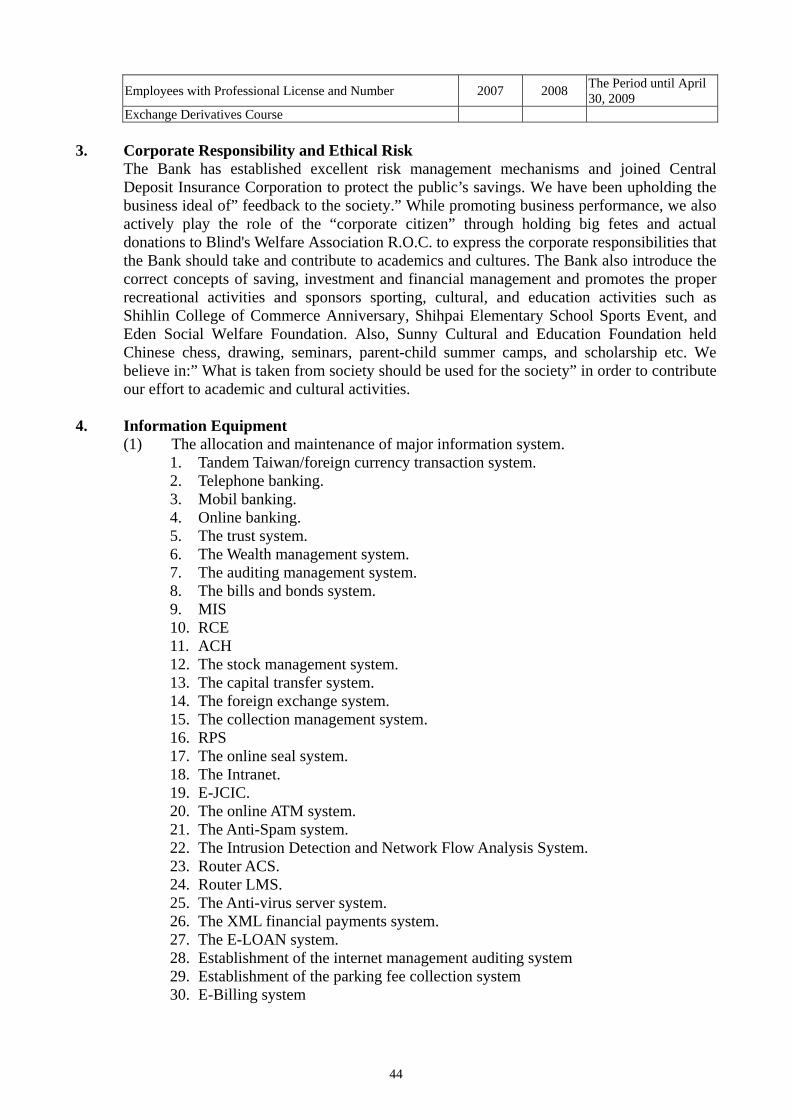
The Period until April 30, 2009 Employees with Professional License and Number 2007 2008
Exchange Derivatives Course
3. Corporate Responsibility and Ethical Risk The Bank has established excellent risk management mechanisms and joined Central Deposit Insurance Corporation to protect the public’s savings. We have been upholding the business ideal of” feedback to the society.” While promoting business performance, we also actively play the role of the “corporate citizen” through holding big fetes and actual donations to Blind's Welfare Association R.O.C. to express the corporate responsibilities that the Bank should take and contribute to academics and cultures. The Bank also introduce the correct concepts of saving, investment and financial management and promotes the proper recreational activities and sponsors sporting, cultural, and education activities such as Shihlin College of Commerce Anniversary, Shihpai Elementary School Sports Event, and Eden Social Welfare Foundation. Also, Sunny Cultural and Education Foundation held Chinese chess, drawing, seminars, parent-child summer camps, and scholarship etc. We believe in:” What is taken from society should be used for the society” in order to contribute our effort to academic and cultural activities.
4. Information Equipment
(1) The allocation and maintenance of major information system. 1. Tandem Taiwan/foreign currency transaction system. 2. Telephone banking. 3. Mobil banking. 4. Online banking. 5. The trust system. 6. The Wealth management system. 7. The auditing management system. 8. The bills and bonds system. 9. MIS 10. RCE 11. ACH 12. The stock management system. 13. The capital transfer system. 14. The foreign exchange system. 15. The collection management system. 16. RPS 17. The online seal system. 18. The Intranet. 19. E-JCIC. 20. The online ATM system. 21. The Anti-Spam system. 22. The Intrusion Detection and Network Flow Analysis System. 23. Router ACS. 24. Router LMS. 25. The Anti-virus server system. 26. The XML financial payments system. 27. The E-LOAN system. 28. Establishment of the internet management auditing system 29. Establishment of the parking fee collection system 30. E-Billing system
44

(2) The future development or purchase plan a. Total inspection on software for the hundredth R.O.C Year. b. Data Back-Up for the Enabling System c. The Restoration of Taipei Data Center d. Customer Telephony Integration (CTI) e. Corporate financing Crediting computerized system. f. Business Collection Services.
(3) Hot back-up and security measure: a. Purpose: Based on the recovery system, maintain the bank operation in order to
minimize the impact brought by information loss and interruption of operations through regular backup and test maneuver.
b. The Disaster Plan Scope: (a) The system backup center and the project team. (b) Evaluation on the organization and the environment of the current information
office. (c) Reorganize the structure of systems and operating flows. (d) Make disaster backup plans. (e) Execute necessary training. (f) Compile related documents. (g) Propose revising plans upon encountering problems.
5. Labor-capital Relationship (1) Current agreements between labor and employer and implementation:
a. Employee Welfare: (a) Labor insurance, health insurance and group insurance. (b) Free health checkup (c) Benefit from “Employee Welfare Committee”: reimbursement for weddings,
funerals, disasters and emergencies. Bonus for Chinese New Year, Dragon Boat Festival and Moon Festival. Reimbursement for employee’s birthday and club events.
(d) Payment for employee not taking full special leaves due to work b. The retirement system and implementation (a) Establish Employee Pension Supervisory Committee. (b) The pension is appropriated monthly, in accordance with related regulations, to a
special pension account of each employee starting work for Sunny Bank Ltd. from July 1, 2005 or choosing the new applicable pension system. As to the employees who choose the previous pension system, the pension reserve is appropriated monthly in accordance with related regulations.
(c) Offer retirement pension when an employee retires according to the regulations. c. Agreements between labor and employer, and other rights (a) Work Code: it is revised according to laws and agreements between labor and
employer or management systems. Such revision will be submitted to the Department of Labor for approval, announced at offices and distributed to each employee.
(b) Re-assignment of Work: for effective use of human resources, a special program has been developed for employees to choose their working place and positions.
(c) Periodically hold labor-employer meetings. (2) Loss arising from labor-employer disputes in recent years and the period until the
publication date: Until the publication date, two disputes are under legal process at the court. Description is as follows: a. The litigant was a dismissed employee of the Bank and applied for confirming
the existence of employment. If the Bank loses the case, it must pay for the lawsuits from the administration fee.
45

b. The litigant was a dismissed employee of the Bank and applied for confirming the existence of employment. If the Bank loses the case, it must pay, from the administration fee, for the lawsuits and salary, NTD 57,526, which should be paid at the 4th of every month from September 25th 2008 to the reactive date and from the next day after the payable date to the payment date, with the annual interest rate of 5%.
c. The litigant was a dismissed employee of the Bank and applied for redundancy payment. If the Bank loses the case, it must pay, from the administration fee, for the lawsuits and redundancy, NTD 1,617,200, starting from the next day upon the arrival of the copy of the complaints to the payment date with the annual interest rate of 5%.
d. The litigant was a dismissed employee of the Bank and applied for redundancy payment. If the Bank loses the case, it must pay, from the administration fee, for the lawsuits and the monthly salary of NTD 35,100, from December 25, 2008 to December 25, 2009, and the fourth of the corresponding month to the payment with the annual interest rate of 5%.
e. The litigant was a dismissed employee of the Bank and applied for payment of holiday bonus and annual performance bonus. If the Bank loses the case, it must pay, from the administration fee, for the lawsuits, holiday bonus NTD 10,953 and new year bonus NTD 36,550.
6. Important Contract Type of
Contracts Counterpart Period Content Condition
The counterpart is liable to domestic currency depositor or beneficiary when the Bank is unable to perform its obligations to pay the deposit or the trust fund beneficiary..
The maximum indemnity for the same depositor is NTD 1.5 million.
Deposit Insurance
Policy
Central Deposit Insurance
Corp.
Signed on September 2,
1987
For financing applied for by small and medium businesses, when insufficient or lacking of guarantee was presumed while such a proposal is generally reviewed and accepted, the Bank may apply for a credit guarantee from this Fund for the insufficient part
While the Bank undertakes credit granting services and signs contracts for loans with small and medium businesses, the Bank will follow credit granting regulations in approved by authority and the conditions listed in the letter of guarantee of the Fund.
Small & Medium
Business Credit Guarantee Contract
Small & Medium
Business Credit Guarantee
Fund
Signed on December 1,
1997
Signed on December 23, 1999
Provide rating services upon request of the Bank.
The Bank shall provide complete, effective, timely and reliable information.
Credit Rating Agreement
Taiwan Rating Corporation
The Insurance company shall be liable to the dishonesty of employees, property at operating locations, property in delivery, forgery of bills and securities, forgery of currency, mistakes, of securities or contracts and negligence of shortage of bills.
It is bounded by general conditions, special conditions and other restrictions listed in the letter of approval made by the Insurance company.
January 1, 2009 ~
January 1, 2010
Bank Comprehensive Insurance Policy
Shinkong Insurance Co.
Signed on September 02, 2008
Development Contract
Develop the collection platform of Sunny Bank ITSower None
Chen Jia Interior Design,
Co. Ltd.
Signed on May 10th
2008
Interior Design on the new location of Changhua Branch.
Construction Contract None
7. The process of Securitized Products
None
46

XI. Financial Status 1. Brief Balance Sheet and Statement of Income
(1) Brief Balance Sheet Unit: NT$ Thousands
Financial Information of Recent 5 Years Year (Note 2) Subject 2008 2007 2006 2005 2004
Cash and Dues from Banks 39,979,517 14,612,302 16,984,891 16,815,172 9,855,918Financial Assets at Fair Value
through Profit or Loss (Note 3) 9,443,723 34,543,144 29,047,227 31,767,176 21,181,880
Reverse Repurchase Note and Bond Investment - - - - 1,625,924
Receivables 4,636,477 3,605,712 5,087,618 4,800,369 4,534,525Discounts and Loans 166,298,395 172,892,491 184,364,343 166,654,215 126,404,592
Available-for-Sale Financial Assets 3,978,337 4,741,885 4,209,951 2,315,849 -
Hold-to-maturity Financial Assets 117,673 172,091 287,498 315,815 -Equity Investments – Equity
Method 277,322 273,722 273,157 216,459 237,366
Other Financial Assets 313,648 397,261 397,261 446,173 251,495Fixed Assets 9,369,343 9,500,231 9,686,166 9,662,124 7,426,864
Intangible Assets 1,071,830 1,181,348 1,366,814 1,355,756 579,447Other Assets 2,725,407 2,850,480 2,574,916 1,992,932 812,882Total Assets 238,211,672 244,770,667 254,279,842 236,342,040 172,910,893
Call Loans and Due to Banks 5,985,843 14,689,448 10,038,458 8,377,938 9,380,041Financial Liabilities at Fair Value
through Profit or Loss 134,602 328 140 - -
Notes and Bonds Issued under Repurchase Agreement 1,689,706 519,960 8,127,593 5,774,401 4,107,736
Payables 4,828,760 2,391,122 4,415,896 3,332,613 1,689,740Deposits and Remittances 208,865,235 207,362,142 213,010,449 202,965,741 146,038,213Financial Bonds Payable 5,509,400 6,509,400 4,000,000 2,000,000 1,000,000
Reserve for Land Revaluation Increment Tax 133,726 261,507 264,110 344,749 145,767
Other Liabilities 434,871 404,703 612,076 640,100 279,390
Before distribution 227,582,143 232,138,610 240,468,722 223,435,542 162,640,887Total Liabilities After distribution
(Note 1) 227,582,143 232,138,610 240,468,722 223,449,128 162,662,870
Capital 12,439,281 12,439,281 12,439,281 10,915,265 8,200,000Capital Surplus 11,228 11,228 11,228 11,228 11,228
Before distribution (1,894,108) 417,792 1,555,944 1,980,005 2,058,778Retained Earnings After distribution
(Note 1) (1,894,108) 417,792 1,555,944 1,527,138 1,326,012
Unrealized Revaluation Increment of Land 256,642 - - - -
Unrealized Profit or Loss on Financial Instruments 37,599 (15,131) 22,272 - -
Other Shareholders’ Equity (221,113) (221,113) (217,605) - -Before distribution 10,629,529 12,632,057 13,811,120 12,906,498 10,270,006Total
Shareholders’
Equity
After distribution (Note 1) 10,629,529 12,632,057 13,811,120 12,892,912 10,248,023
Note 1: Appropriation of profit or loss for 2008. Note 2: The financial data for above years have been approved by Independent auditors. Note 3: Securities and securities purchased from 2004 is not planned to be re-classified and are financial
assets at fair value through profit or loss.
(2) Brief Income Statement Unit: NT$ Thousands except EPS in NT$
Financial Information of Recent 5 Years Year (Note 1) Subject 2008 2007 2006 2005 2004 Net Interest Income $2,657,185 $3,211,040 $3,753,822 $3,389,571 $3,290,356Other Net Income (Loss) (297,750) 807,177 1,071,283 1,075,724 835,171
47

except Interest Bad Debt Expenses 1,942,246 2,118,614 1,800,171 1,061,814 339,855Operating Expenses 2,889,089 3,167,755 3,252,810 2,612,488 2,481,494Net profit Before Tax of Operating Departments (2,471,900) (1,268,152) (227,876) 790,993 1,304,178
Net profit After Tax of Operating Departments (2,311,900) (1,138,152) (170,271) 653,993 1,045,178
Income from Discontinued Department (Net After Tax) - - - - -
Extraordinary Gain or Loss (Net After Tax) - - - - -
Cumulative Effect of Changes in Accounting Principles (Net After Tax)
- - 199,077 - -
Current Profit & Loss (2,311,900) (1,138,152) 28,806 653,993 1,045,178Earnings (Loss) per share (1.89) (0.93) 0.02 0.69 1.18
Note 1: The above financial data shown in the last five years have been audited and accredited by accountants.
(3) Audited by CPAs for years and Auditing Opinion In 2004, because of the internal duty adjustment of Deloitte & Touche, certifying accountants became Shao, Chih-Ming and Kuo, Cheng-Hung. The banks had adopted outright purchase/sale for reverse repurchase agreement of notes and bonds. However, since 2004, according to “Regulations Governing the Preparation of Financial Reports by Publicly Held Banks”, the Bank switched to the financial approach. Additionally, the Bank, in 2005, merged with Kao Shin Commercial Bank and adopted the newly announced IAS 35 “Accounting Principles of Asset Impairment”. Therefore, in 2004 to 2005, the Bank received reports with modified unqualified opinion. From 2006 to 2008, the Bank still appointed Shao, Chih-Ming and Kuo, Cheng-Hung of Deloitte & Touche for certifying for the Bank. The Bank sold NIL to MACS, the loss was deferred and amortized through 5 years according to “Financial Institutions Merger Act”, which is not consistent with GAAP. Also, newly announced IAS 34 “Accounting Principles of Financial Products” and IAS 36 “Financial Instrument: Recognition and Measurement” and other new provisions supplementary in other accounting standards. Hence, qualified opinion report was received.
48

2. Financial Analysis (1) Financial Ratio Analysis of the Parent Company
Financial Analysis for the Last Five Years
Year(Note 2)Item 2008 2007 2006 2005 2004
Ratio of Loans to Deposits (%) 80.81 84.67 87.59 83.17 87.53Ratio of Overdue Loans (%) 2.60 2.87 2.65 3.09 2.00Ratio of Interest Expense to Average Deposits 2.24 2.02 1.66 1.32 1.30
Ratio of Interest Revenue to Average Loans 4.25 4.12 4.06 3.84 4.17
Total Asset Turnover (times) 0.01 0.02 0.02 0.02 0.02Average Operating Revenue Per Employee (In NT thousand) 1,078 1,634 1,881 1,705 2,095
Man
agem
ent
Average Earnings Per Employee (1,056) (463) 11 250 531(In NT thousand) Rate of Return on Tier-1Capital (%) (24.91) (10.99) (0.14) 7.60 15.09
Return on Assets (%) (0.96) (0.46) 0.01 0.32 0.64Return on Shareholders’ Equity (%) (19.88) (8.61) 0.22 5.64 11.01Net Income Ratio (%) (97.99) (28.32) 0.60 14.65 25.33Pr
ofita
bilit
y
Earnings Per Share (NT$) ( Note 1) (1.89) (0.93) 0.02 0.69 1.18Total Debt Ratio 95.51 94.81 94.55 94.52 94.04Financial
Structure (%) Fixed Asset to Equity Ratio 88.14 75.21 70.13 74.86 72.32
Assets Growth Rate (2.68) (3.74) 7.59 36.68 11.76Growth (%) Profitability Growth Rate 94.92 7,731.00 (102.05) (39.35) 11.06
Cash Flow Ratio 204.44 (36.28) 20.16 (6) (44.88)Cash Flow Adequacy Ratio 1,014.11 (316.61) 4.57 (264.59) (142.64)Cash Flow
(%) Cash Flow Reinvestment Ratio (138.60) (57.12) (21.69) 11.23 35.07
Liquid Reserves Ratio (%) 18.04 16.50 10.17 13.76 9.76
Total Secured Loans of Stakeholders (in NT thousand) 2,571,981 2,633,463 2,505,400 2,607,587 2,317,633
Ratio of Total Secured Loans of Stakeholders to total loans (%) 1.47 1.43 1.32 1.51 1.76
Market Share of Assets 0.66 0.72 0.76 0.74 0.58
Market Share of Net Worth 0.31 0.38 0.46 0.46 0.40
Market Share of Deposits 0.94 1.01 1.00 1.00 0.76Scope of Operating
Market Share of Loans 0.91 0.97 1.06 0.98 0.80Description for changes in ratios: 1. The decrease in Total Asset Turnover, Average Operating Revenue Per Employee, Average Earnings Per Employee,
Rate of Return on Tier-1 Capita, Return on Assets, Net Income Ratio, Earnings Per Share and Profitability Growth Rate arose because the narrowed interest spread and higher loss on Financial Instruments at Fair Value through Profit or Loss caused lower net income and higher net loss.
2. The decrease in Assets growth rate mainly resulted from the decrease in discount and loans. 3. Cash Flow Ratio and Cash Flow Adequacy Ratio rose because of higher net cash inflow of 2008 operating activities. 4. Cash Flow Reinvestment Ratios are lower because the increment of net cash inflow of 2008 operating activities is
larger than net cash outflow of 2008 investment. Note 1 : It is calculated on a basis of the number of shares retroactively adjusted. Note 2 : The above financial data shown in the last five years have been audited and accredited by accountants
49

Description 1: Formula for financial ratios: 1. Management
(1) Ratio of loans to deposits = Loans/ Deposits (2) Ratio of overdue loans = Overdue loans/ Loans (3) Ratio of interest expense to average deposits = Interest Expense/ Average deposits (4) Ratio of interest revenue to average loans = Interest revenue/ Average loans (5) Total asset turnover=Net income/ Total Asset (6) Average operating revenue per employee (Note 5) = Net income/ Total employees (7) Average earnings per employee = Income after Tax/ Total employees
2. Profitability (1) Rate of return on Tier-1 capital = Income before Tax/ Average Tier-1 capital (2) Return on Assets = Income after Tax/ Average Assets (3) Return on Shareholders’ Equity = Income after Tax/ Average shareholders' equity (4) Net income ratio = Income after Tax/ Net income (5) Earnings per share = (Income after Tax- Dividends of Preferred Shares) / Weighted average outstanding shares. (Note 3)
3. Financial Structure (1) Total Debt Ratio =Total Liabilities /Total Assets (2) Fixed Assets to Equity Ratio =Net Fixed assets / Net Equity 4. Growth Rate
(1) Assets growth rate = (Total Assets of the Year - Total Assets of the Previous Year) / Total Assets of the Previous Year
(2) Profitability growth rate = (Income before Tax of the Year - Income before Tax of the Year) / Income before Tax of the Year
5. Cash Flow (Description 6) (1) Cash Flow Ratio = Net operating cash flow / (due from other banks + commercial paper payable +
financial asset at fair value through profit or loss + Bills & Bonds Sold under Repurchase Agreements + payables of maturity within one year
(2) Cash Flow Adequacy Ratio =Net operating cash flow in the last five years/ (capital expenditures + cash dividends) in the last five year
(3) Cash Flow Reinvestment Ratio = Cash flow for operation/ cash flow for investment 6. Liquid Reserves Ratio = Current assets required by Central Bank/Liabilities allocated for liquid reserve 7. Scope of Operating
(1) Market Share of Assets = Total Asset / Total Asset of All Financial Institutions Available for Deposits and Loans (Note 4) (2) Market Share of Net worth = Total Net worth / Total net worth of All Financial Institutions Available for Deposits and Loans (3) Market Share of Deposits = Total Deposits / Total net worth of All Financial Institutions Available for Deposits and Loans (4) Market Share of Loans = Total Loans / Total Loans of All Financial Institutions Available for Deposits and Loans
Description 2: Liability is deducted the reserve for guarantee, reserve for securities trading losses, the Reserve for Failed Trade Losses and Contingency Reserve
Description 3: Attention should be paid to for using the above formulas. 1. It is calculated on a basis of weighted average number of shares instead of the number of shares issued at the
end of the year. 2. Weighted average numbers of shares shall be calculated with considering the available period for capital
surplus transferred to common stock or retained earning transferred to common stock, 3. While calculating annual and semi-annual EPS, it should be retroactively adjusted in proportion of increment
without considering the issuance period of such increment upon retain earnings recapitalization or capital surplus recapitalization.
4. In case the preferred shares are non-convertible accumulated preferred shares, the annual dividends (whether distributed or not) shall deducted from net loss after tax or added to net loss after tax.
5. In case preferred shares are not accumulative, the dividends of preferred shares shall be deducted from net income after tax when any net income after tax occurs. When there is loss after tax, adjustment is not necessary.
Description 4: All financial institutions covering the services of deposit and loans include domestic banks, branches of foreign banks, credit cooperative, credit departments of fishermen’s and farmers’ association and trust investment companies as well.
Description 5: Operating revenue refers to the total amount of interest and non-interest revenue. Description 6: While cash flow analysis is measured, special attention should be paid to the following matters:
1. Net operating cash flow is cash inflow for operation in the Cash Flow Statement 2. Capital expenditure means cash outflow for annual capital investment. 3. Cash dividend including cash dividend for common stock and Preferred Shares. 4. Fixed asset gross is total fixed assets before the deduction of accumulated depreciation.
50

51
(2) Capital Adequacy Unit: NT$ Thousands Capital Adequacy Ratio in the Last Five Years Year
Analytical items 2008 2007 2006 2005 2004
Capital Adequacy Ratio As of April 30, 2 0 0 9
Common Stock 12,439,281 12,439,281 12,439,281 10,915,265 8,200,000 Perpetual Cumulated Preferred Stock - - - - -
Subordinated Debts without Maturity Dates - - - - -
Capital Collected in Advance - - - - - Capital Surplus (Except for Property Appraisal Surplus) 11,228 11,228 11,228 11,228 11,228
Legal Reserve 389,998 1,528,150 1,519,508 1,323,310 1,009,757 Special Reserve 27,794 27,794 - - - Accumulated Reserve (2,311,900) (1,138,152) 36,436 656,695 1,049,021 Minority Interest - - - - - Other Shareholders’ Equity (225,907) (237,006) (217,833) - - Minus: Goodwill 1,034,579 1,150,579 1,333,579 1,333,579 544,876 Minus: Unamortized Loss on Sales of Non-performing Loan 128,126 164,734 - - -
Minus: Capital Allowance 287,291 350,976 335,208 226,316 244,430
Tier-1 Capital
Total Tier-1 Capital 8,880,498 10,965,006 12,119,833 11,346,603 9,480,700 Perpetual Cumulated Preferred Stock - - - - -
Subordinated Debts without Maturity Dates - - - - -
Property Appraisal Surplus 256,642 - - - - 45% of Unrealized Gains on Financial instruments in Available-for-sale
19,076 342 10,124 15,145 122,675
Convertible Bonds - - - - - The Operating Reserve and Allowance for Bad Debt 1,449,645 1,759,522 286,484 506,415 427,058
Long-term Subordinated Debts 4,248,500 4,709,400 2,800,000 1,400,000 600,000 Non-perpetual Preferred Stocks - - - - - The Sum of Perpetual Cumulated Preferred Stock and Subordinated Debts without Maturity Dates Exceeds 15% of Total Tier 1 Asset
- - - - -
Minus: Capital Allowance 287,291 350,976 335,208 226,315 244,430
Tier-2 Capital
Total Tier-2 Capital 5,686,572 6,118,288 2,761,400 1,695,245 905,303 Short-term Subordinated Debts - - - - - Non-perpetual Preferred Stocks - - - - - Tier 3
Capital Total Tier-3 Capital - - - - -
Ow
n C
apita
l
Self-owned Capital 14,567,070 17,083,294 14,881,233 13,041,848 10,386,003 Standardized Approach 146,260,054 151,740,512 152,075,214 138,392,245 100,563,678 Internal Ratings-based Approach - - - - - Credit Risk Asset Securitization 23,535 683,428 - - - Basic Indicator Approach 7,311,468 8,415,364 - - - Standardized Approach / Alternative Standardized Approach
- - - - - Operational Risk
Advanced Measurement Approach - - - - -
Standardized Approach 9,105,429 12,265,351 17,720,066 15,309,909 10,870,808 Market Risk Internal Model Approach - - - - -
Ris
k-W
eigh
ted
Ass
ets
Risk-Weighted Assets 162,700,486 173,104,655 169,795,280 153,702,154 111,434,486 Capital Adequacy 9.87 8.76 8.49 9.32 Tier 1 Capital to Risk Asset 6.33 7.14 7.38 8.51 Tier 2 Capital to Risk Asset 3.54 1.62 1.11 0.81 Tier 3 Capital to Risk Asset 0 0 0 0 Total Common Stock to Total Asset 5.08 4.89 4.62 4.74
N/A (Note 2)
Note 1: 1. Self-owned Capital = Tier 1 Capital +Tier II Capital + Tier III Capital 2. Risk-Weighted Assets = Credit Risk Weighted Risk Asset + Capital Requirement of Operational Risk and Market Risk × 12.5. 3. Capital Adequacy = Self-owned Capital/ Risk-Weighted Assets 4. Tier 1 Capital to Risk Asset = Tier I Capital/Risk-Weighted Assets 5. Tier 2 Capital to Risk Asset = Tier II Capital/Risk-Weighted Assets 6. Tier 3 Capital to Risk Asset = Capital III Capital/Risk-Weighted Assets 7. Total Common Stock to Total Asset = Total Common Stock/ Total Asset 8. The self-owned capital to risk asset ratio of the Bank meets the current regulations.
Note 2: Not Applicable because the Bank is not a public listed or OTC listed company.

3. Supervisor Auditing Report
Supervisor Auditing Report, Supervisors Sunny Bank Ltd.
It is hereby to approve the 2007 Annual Report, financial statements, consolidated financial statements and surplus distribution proposals produced and submitted by the Board of Directors. The financial statements and consolidated financial statements have been audited and certified by CPAs Koop Cheng Hung and Shao Chih Ming of Deloitte & Touche Taiwan. After reviewing the results by supervisors, no unconformity in all statements are found. The Annual Report is thereby prepared according to Article 219 of Corporate Law.
To: 2009 Shareholders’ Meeting
Standing Supervisor
Hsu, Po-Hsiung Supervisor
Tsai, Wen-Hsiung Supervisor
Chen, Sen-Jung Supervisor
Kao, Ming-Chih Supervisor
Chiang, Chun-Huai
Date: March 26, 2009
52

4. Financial Statement
Independent Auditor’s Report To: Sunny Bank Ltd.:
We have audited the accompanied Balance Sheets of : Sunny Bank as of December 31, 2008
and 2007, and the related Income Statement, Statements of Changes in Shareholders’ Equity, and
Cash Flow Statement for from January 1 to December 31 in 2008 and 2007. These financial
statements are the responsibility of the Bank’s management. Our responsibility is to express an
opinion on these financial statements based on our audits.
We conducted our audits in accordance with the Rules Governing the Audit of Financial
Statements by Certified Public Accountants and auditing standards generally accepted in the
Republic of China. Those rules and standards require that we plan and perform the audit to obtain
reasonable assurance about whether the financial statements are free of material misstatement. An
audit includes examining, on a test basis, evidence supporting the amounts and disclosures in the
financial statements. An audit also includes assessing the accounting principles used and significant
estimates made by management, as well as evaluating the overall financial statement presentation.
We believe that our audits and the report of the other auditor provide a reasonable basis for our
opinion.
As described in Note 26 attached to the Financial Statements, Sunny Bank Ltd., in 2007 and
2006, sold Non-Performing Loans to asset management corporations and thus generated loss of
NT$967,884,000. According to the “Financial Institution Merger Law”, the loss could be deferred
and amortized through 5 years. Unamortized balance is listed in “Other assets – Loss of
non-recognized sale of liability” and thus inconsistent with generally accepted accounting principles.
If the sale of the said loss were not deferred, then other assets – Loss of non-recognized sale of
liability on December 31 2008 and 2007 should be reduced by NT$585,954,000 and
NT$779,531,000 respectively. Also, net loss for 2008 and 2007 should be deducted
NT$193,577,000 and added NT$ 7,765,000 respectively.
In our opinions, except for Loss of sale of liability not being fully recognized in that year
pursuant to GAAP, the financial statements referred to in the first paragraph present fairly, in all
material respects, the financial position of Sunny Bank as of December 31, 2008 and 2007, and the
results of its operations and its cash flows for the years then ended, in conformity with the Criteria
Governing the Preparation of Financial Reports by Public Banks and accounting principles
generally accepted in the Republic of China.
53

The detailed accounts shown in the 2008 financial statements made by Sunny Bank Ltd. are
available for supplementary and analysis and have been audited by us on the process described in
the second paragraph. In our opinions, the major aspects of the detailed accounts are consistent with
the information shown in the financial statements listed in the first paragraph.
The 2008 Consolidated Financial Statements of Sunny Bank Ltd. and its subsidiaries have
been audited by us and the auditing report of the qualified opinion was submitted and filed on
March 12, 2009 for reference.
Deloitte & Touche Taiwan C.P.A. - Shao, Chih-Ming C.P.A. - Kuo, Cheng-Hung
Shao, Chih-Ming (with signature) Kuo, Cheng-Hung
(with signature) Securities And Futures Commission, Ministry of Finance
Securities And Futures Commission, Ministry of Finance
Approval File No.: Tai-tsai-tseng-6-tzu-ti No. 0930128050
Approval File No.: Tai-tsai-tseng-6-tzu-ti No. 0920123784.
March 12, 2009
54

55
Sunny Bank Ltd. BALANCE SHEET December 31, 2008 & 2007
Unit: NT$ Thousands, Except Par Value in NT$
December 31, 2008 December 31, 2007 Percent Change
Code Assets Amount Amount (%) 11000 Cash (Note 4) $ 4,607,347 $ 4,292,065 7 11500 Due from the Central Bank and Other
Banks (Note 5) 35,372,170 10,320,237 243 12000 Financial Assets at Fair Value through
Profit or Loss (Note 2, 3, 6, & 27) 9,443,723 34,543,144 ( 73 ) 13000 Accounts Receivable - Net (Note 2, 7 &
26) 4,636,477 3,605,712 29 13500 Discounts and Loans - Net (Note 2, 8 &
26) 166,298,395 172,892,491 ( 4 ) 14000 Available-for-Sale Financial Assets (Note
2, 9 & 27) 3,978,337 4,741,885 ( 16 ) 14500 Hold-to-maturity Financial Assets (Note 2
& 10) 117,673 172,091 ( 32 ) 15000 Equity Investments - Equity Method (Note
2 & 11) 277,322 273,722 1 15500 Other Financial Asset –Net (Note 2 and
12) 313,648 397,261 ( 21) Fixed Asset ( Note 2 and 13) Cost 18501 Land 6,636,369 6,705,460 ( 1 )18521 House and Building 2,859,779 2,837,183 1 18551 Miscellaneous Equipment 1,326,147 1,298,334 2 Total Cost 10,822,295 10,840,977 - Revaluation Increment 302,032 183,047 65 Cost and Revaluation Increment 11,124,327 11,024,024 1 Less: Accumulated Depreciation 1,798,942 1,663,746 8 9,325,385 9,360,278 - 18571 Unfinished Construction and
Prepayments For Business Facilities 43,958 139,953 ( 69 )
18500 Net Fixed Assets 9,369,343 9,500,231 ( 1 ) 19000 Intangible Assets (Note 2 & 14) 1,071,830 1,181,348 ( 9 ) 19500 Other Assets (Note 2, 15, 21, 26, 27 & 28) 2,725,407 2,850,480 ( 4 ) 10000 Total Assets $ 238,211,672 $ 244,770,667 ( 3 )
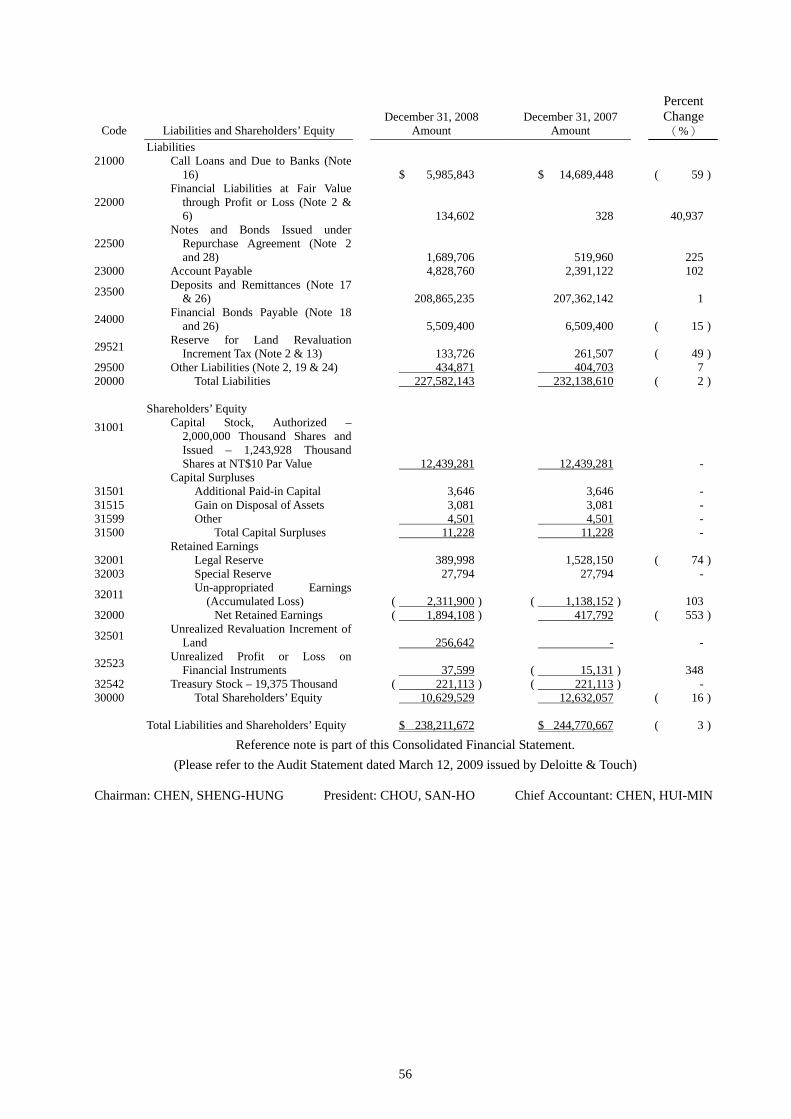
56
December 31, 2008 December 31, 2007 Percent Change
Code Liabilities and Shareholders’ Equity Amount Amount (%) Liabilities 21000 Call Loans and Due to Banks (Note
16) $ 5,985,843 $ 14,689,448 ( 59 )
22000 Financial Liabilities at Fair Value
through Profit or Loss (Note 2 & 6) 134,602 328 40,937
22500 Notes and Bonds Issued under
Repurchase Agreement (Note 2 and 28) 1,689,706 519,960 225
23000 Account Payable 4,828,760 2,391,122 102
23500 Deposits and Remittances (Note 17 & 26) 208,865,235 207,362,142 1
24000 Financial Bonds Payable (Note 18 and 26) 5,509,400 6,509,400 ( 15 )
29521 Reserve for Land Revaluation Increment Tax (Note 2 & 13) 133,726 261,507 ( 49 )
29500 Other Liabilities (Note 2, 19 & 24) 434,871 404,703 7 20000 Total Liabilities 227,582,143 232,138,610 ( 2 ) Shareholders’ Equity 31001
Capital Stock, Authorized –2,000,000 Thousand Shares and Issued – 1,243,928 Thousand Shares at NT$10 Par Value
12,439,281 12,439,281 - Capital Surpluses 31501 Additional Paid-in Capital 3,646 3,646 - 31515 Gain on Disposal of Assets 3,081 3,081 - 31599 Other 4,501 4,501 - 31500 Total Capital Surpluses 11,228 11,228 - Retained Earnings 32001 Legal Reserve 389,998 1,528,150 ( 74 )32003 Special Reserve 27,794 27,794 -
32011 Un-appropriated Earnings (Accumulated Loss) ( 2,311,900 ) ( 1,138,152 ) 103
32000 Net Retained Earnings ( 1,894,108 ) 417,792 ( 553 )
32501 Unrealized Revaluation Increment of Land 256,642 - -
32523 Unrealized Profit or Loss on Financial Instruments 37,599 ( 15,131 ) 348
32542 Treasury Stock – 19,375 Thousand ( 221,113 ) ( 221,113 ) - 30000 Total Shareholders’ Equity 10,629,529 12,632,057 ( 16 ) Total Liabilities and Shareholders’ Equity $ 238,211,672 $ 244,770,667 ( 3 )
Reference note is part of this Consolidated Financial Statement. (Please refer to the Audit Statement dated March 12, 2009 issued by Deloitte & Touch)
Chairman: CHEN, SHENG-HUNG President: CHOU, SAN-HO Chief Accountant: CHEN, HUI-MIN
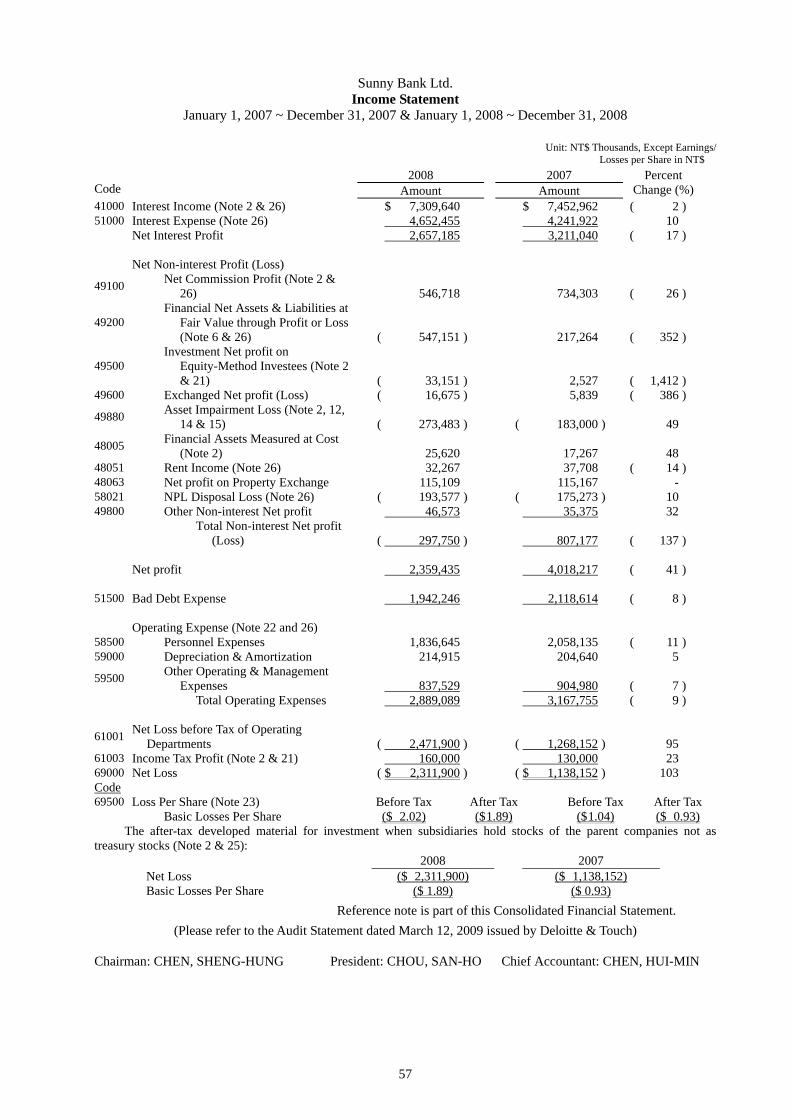
57
Sunny Bank Ltd. Income Statement
January 1, 2007 ~ December 31, 2007 & January 1, 2008 ~ December 31, 2008
Unit: NT$ Thousands, Except Earnings/ Losses per Share in NT$
2008 2007 Code Amount Amount
Percent Change (%)
41000 Interest Income (Note 2 & 26) $ 7,309,640 $ 7,452,962 ( 2 ) 51000 Interest Expense (Note 26) 4,652,455 4,241,922 10 Net Interest Profit 2,657,185 3,211,040 ( 17 ) Net Non-interest Profit (Loss)
49100 Net Commission Profit (Note 2 & 26) 546,718 734,303 ( 26 )
49200 Financial Net Assets & Liabilities at
Fair Value through Profit or Loss (Note 6 & 26) ( 547,151 ) 217,264 ( 352 )
49500 Investment Net profit on
Equity-Method Investees (Note 2 & 21) ( 33,151 ) 2,527 ( 1,412 )
49600 Exchanged Net profit (Loss) ( 16,675 ) 5,839 ( 386 )
49880 Asset Impairment Loss (Note 2, 12, 14 & 15) ( 273,483 ) ( 183,000 ) 49
48005 Financial Assets Measured at Cost (Note 2) 25,620 17,267 48
48051 Rent Income (Note 26) 32,267 37,708 ( 14 ) 48063 Net profit on Property Exchange 115,109 115,167 - 58021 NPL Disposal Loss (Note 26) ( 193,577 ) ( 175,273 ) 10 49800 Other Non-interest Net profit 46,573 35,375 32
Total Non-interest Net profit (Loss) ( 297,750 ) 807,177 ( 137 )
Net profit 2,359,435 4,018,217 ( 41 ) 51500 Bad Debt Expense 1,942,246 2,118,614 ( 8 ) Operating Expense (Note 22 and 26) 58500 Personnel Expenses 1,836,645 2,058,135 ( 11 ) 59000 Depreciation & Amortization 214,915 204,640 5
59500 Other Operating & Management Expenses 837,529 904,980 ( 7 )
Total Operating Expenses 2,889,089 3,167,755 ( 9 )
61001 Net Loss before Tax of Operating Departments ( 2,471,900 ) ( 1,268,152 ) 95
61003 Income Tax Profit (Note 2 & 21) 160,000 130,000 23 69000 Net Loss ( $ 2,311,900 ) ( $ 1,138,152 ) 103 Code 69500 Loss Per Share (Note 23) Before Tax After Tax Before Tax After Tax Basic Losses Per Share ($ 2.02) ($ 1.89) ($ 1.04) ($ 0.93) The after-tax developed material for investment when subsidiaries hold stocks of the parent companies not as treasury stocks (Note 2 & 25):
2008 2007 Net Loss ($ 2,311,900) ($ 1,138,152) Basic Losses Per Share ($ 1.89) ($ 0.93)
Reference note is part of this Consolidated Financial Statement. (Please refer to the Audit Statement dated March 12, 2009 issued by Deloitte & Touch)
Chairman: CHEN, SHENG-HUNG President: CHOU, SAN-HO Chief Accountant: CHEN, HUI-MIN
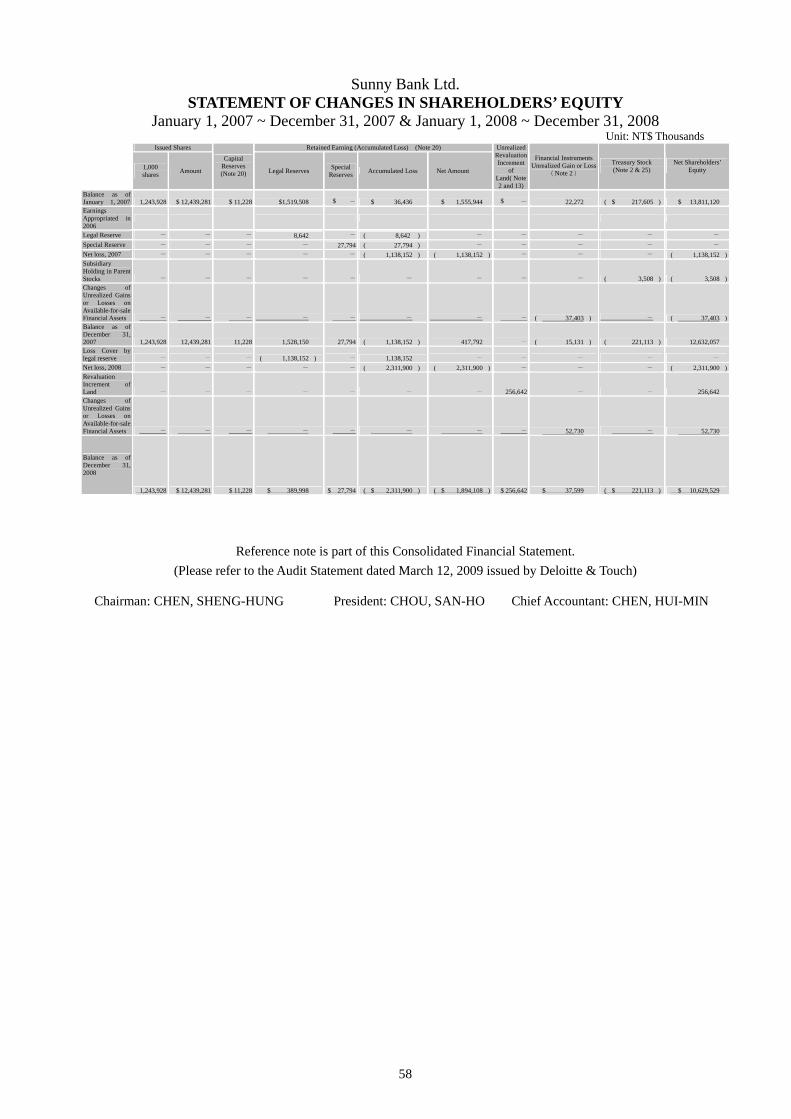
58
Sunny Bank Ltd. STATEMENT OF CHANGES IN SHAREHOLDERS’ EQUITY
January 1, 2007 ~ December 31, 2007 & January 1, 2008 ~ December 31, 2008 Unit: NT$ Thousands
Issued Shares Retained Earning (Accumulated Loss) (Note 20)
1,000 shares Amount
Capital Reserves (Note 20) Legal Reserves Special
Reserves Accumulated Loss Net Amount
Unrealized Revaluation Increment
of Land( Note 2 and 13)
Financial Instruments Unrealized Gain or Loss
(Note 2)
Treasury Stock (Note 2 & 25)
Net Shareholders’ Equity
Balance as of January 1, 2007 1,243,928 $ 12,439,281 $ 11,228 $1,519,508 $ - $ 36,436 $ 1,555,944 $ - 22,272 ( $ 217,605 ) $ 13,811,120 Earnings Appropriated in 2006
Legal Reserve - - - 8,642 - ( 8,642 ) - - - - - Special Reserve - - - - 27,794 ( 27,794 ) - - - - - Net loss, 2007 - - - - - ( 1,138,152 ) ( 1,138,152 ) - - - ( 1,138,152 )Subsidiary Holding in Parent Stocks - - - - - - - - - ( 3,508 ) ( 3,508 )Changes of Unrealized Gains or Losses on Available-for-sale Financial Assets - - - - - - - - ( 37,403 ) - ( 37,403 )Balance as of December 31, 2007 1,243,928 12,439,281 11,228 1,528,150 27,794 ( 1,138,152 ) 417,792 - ( 15,131 ) ( 221,113 ) 12,632,057 Loss Cover by legal reserve - - - ( 1,138,152 ) - 1,138,152 - - - - - Net loss, 2008 - - - - - ( 2,311,900 ) ( 2,311,900 ) - - - ( 2,311,900 )Revaluation Increment of Land - - - - - - - 256,642 - - 256,642 Changes of Unrealized Gains or Losses on Available-for-sale Financial Assets - - - - - - - - 52,730
- 52,730
Balance as of December 31, 2008
1,243,928 $ 12,439,281 $ 11,228 $ 389,998 $ 27,794 ( $ 2,311,900 ) ( $ 1,894,108 ) $ 256,642 $ 37,599 ( $ 221,113 ) $ 10,629,529
Reference note is part of this Consolidated Financial Statement.
(Please refer to the Audit Statement dated March 12, 2009 issued by Deloitte & Touch) Chairman: CHEN, SHENG-HUNG President: CHOU, SAN-HO Chief Accountant: CHEN, HUI-MIN

59
Sunny Bank Ltd. Cash Flow Statement
January 1, 2008 ~ December 31, 2008 & January 1, 2007 ~ December 31, 2007 Unit: NT$ Thousands
Reference note is part of this Consolidated Financial Statement.
(Please refer to the Audit Statement dated March 12, 2009 issued by Deloitte & Touch)
Chairman: CHEN, SHENG-HUNG President: CHOU, SAN-HO Chief Accountant: CHEN, HUI-MIN
2 0 0 8 2 0 0 7Cash Inflows from Operating Activities:
Net Loss ( $ 2,311,900 ) ( $ 1,138,152 ) Bad Debt Expense 1,942,246 2,118,614 Loss on Impairment of Assets 273,483 183,000 Loss on Selling of Non-performing Loans 193,577 175,273 Depreciation 193,011 181,939 Amortization 21,904 22,701 Investment Income (Loss) on Equity-Method
Investees 33,151 ( 2,527 ) Net profit on Disposal of Assets ( 22,367 ) ( 100,511 ) Profits on Disposal of Foreclosed Collateral ( 92,742 ) ( 14,656 ) Financial Assets Valuation Gains (Loss) at Fair Value
through Profit or Loss 225,682 ( 89,543 ) Realized Gains on Available-for-sale Financial Assets ( 2,066 ) ( 3,408 ) Deferred Income Tax ( 254,961 ) ( 256,577 ) Changes in Financial Instruments at Fair Value
through Profit or Loss 25,008,013 ( 5,406,186 ) Increase in Receivables ( 1,355,488 ) ( 96,714 ) Increase/Decrease in Payables 2,437,638 ( 2,024,774 )
Net Cash Inflow (Outflow) Generated from Operating Activities 26,289,181
( 6,451,521 ) Cash Inflows from Investing Activities:
Increase in Available-for-sale Financial Assets ( 240,547 ) ( 1,974,791 ) Proceeds from Disposal of Available-for-sale
Financial Assets 1,060,902 1,408,862 Decrease in Held-to-maturity Financial Assets 54,418 115,407 Increase in other financial assets ( 63,870 ) - Increase in Equity Investment under Equity Method ( 38,762 ) ( 1,546 ) Decrease (Increase) in Due from the Central Bank and
Other Banks ( 25,051,933 ) 878,782 Decrease in Discounts and Loans 4,976,573 9,922,777 Purchasing Fixed Assets ( 88,629 ) ( 542,534 ) Proceeds from Disposal of Assets 106,635 473,422 Proceeds from Disposal of Foreclosed Collateral 327,099 136,302 Proceeds from Selling of Non-performing Loans - 858,000 Increase in Intangible Assets ( 25,552 ) ( 15,747 ) Increase in Other Assets 15,884 36,263
Cash Inflows (Outflows) from Investing Activities ( 18,967,782 ) 11,295,197
Cash Inflows from Financial Activities: Decrease/Increase in Notes and Bonds Issued under
Repurchase Agreement 1,169,746 ( 7,607,633 ) Increase (Decrease) in Call Loans and Due to Banks ( 8,703,605 ) 4,650,990 Increase (Decrease) in Deposits and Remittances 1,503,093 ( 5,648,307 ) Increase (Decrease) in Financial Bonds Payable ( 1,000,000 ) 2,509,400 Increase (Decrease) in Other Liabilities 24,649 ( 241,933 )
Cash Outflows from Financial Activities ( 7,006,117 ) ( 6,337,483 ) Net Increase (Decrease) in Cash 315,282 ( 1,493,807 ) Balance at Year Beginning 4,292,065 5,785,872
Balance at Year End $ 4,607,347 $ 4,292,065 Complementary Declaration of Cash Flow Information:
Paying Interest $ 4,546,700 $ 4,149,933 Paying Income Tax $ 94,961 $ 125,937
Non-cash Investing and Financing Activities Fixed asset re-classified as idle asset $ 148,084 $ - Revaluation Increment of Land $ 139,520 $ - Rental asset re-classified as idle asset $ 58,400 $ -
Sunny Bank Ltd. Notes to Financial Statements
For Years 2008 and 2007 (Unless otherwise specified, all amounts are in NT thousand)
1.Company History and Operation Scope
The Bank is a public-listed company with business in: services of commercial banks approved by the Banking Law, savings and trust services and other related services approved by the authority. The Bank owns a network of 96 business units in Taiwan by the end of 2008.
The Trust Department of Sunny Bank Ltd. undertakes planning, management and operations of trust investment services regulated by the Banking Law and trust services in investment of domestic securities and funds.
The numbers of employees at the end of 2008 and 2007 were 2,189 and 2,459 respectively 2.Summary of Important Accounting Policies
The accompanying financial statements have been prepared in conformity with the Criteria Governing the Preparation of Financial Reports by Public Banks, Guidelines Governing the Preparation of Financial Reports by Securities Issuers and accounting principles generally accepted in the Republic of China. In preparing financial statements in conformity with these guidelines, criteria and principles, the Bank is required to make certain estimates and assumptions that could affect the amounts of valuation of some financial instruments, reserve for losses on guarantees, depreciation, loss on asset impairment, pension, income tax and losses on a suspended lawsuit (lawsuit losses do not include any adjustments that might be required when related contingent liabilities become probable or determinable in the future) etc. Actual results could differ from these estimates.
Since the operating cycle in the banking industry cannot be reasonably identified, accounts included in the Bank’s financial statements were not classified as current or non-current. Nevertheless, accounts were properly categorized according to the nature of each account and sequenced by liquidity. The maturity analysis of assets and liabilities is shown in Note 29. The Bank’s significant accounting policies are summarized as follows:
Basis of Financial Statements
The accompanying financial statements include the accounts of the Head Office, OBU and all branches. All interoffice transactions and balances have been eliminated.
60
Financial Instruments at Fair Value through Profit or Loss Changes in the fair value of interest include loss of financial commodity's purpose of the
transaction, which is financial asset or financial debts. The view from the original series, designated to measure the fair value and changes in fair value loss is recognized that financial interests or financial asset debt’s original recognition, fair value is measured, and continued after the evaluation to measure the fair value and changes in fair value recognized year loss benefits. According to the examples, the purchase or sale of financial products is under the delivery date method.
Derivative products failed to meet hedge accounting; classification is the purpose of the transaction financial asset or financial debts. Fair value is positive, as a financial asset; fair value is negative, as financial debts.
Fair value: The listing of securities is the balance sheet day ending price, beneficial certificates is the balance sheet day net assets value, domestic bonds is the Taiwan securities service balance sheet day reference price, other markets financial products use evaluation method to estimate the fair value.
Overdue Receivables
In accordance with the “Regulations of Reserve for Evaluated Banking Assets Loss and Collections for Non-performing Loans” by the Executive Yuan's Financial Supervisory Commission BPK the overdue loans and other authorized credit accounts are due and haven’t been paid off and have been approved by the Board, as collection accounts together with estimated interest receivable.
Transfer from loans to allowance for Bad Debts listed in the discount and loan accounts, if they are non-listed in transfer from loans to allowance for Bad Debts then list in other assets.
Allowance for Loan Losses and Reserve for Guarantees
Allowances for bad debts and losses on guarantees are estimated according to the risk of uncollectible specific loans, receivables, delinquent loans, other financial assets and guarantees as well as the uncollectible risk of overall credit portfolio referred to above.
The Bank assesses the collective possibility of credit portfolio based on the borrowers' /clients' delinquent status and financial condition in accordance with regulations issued by the Ministry of Finance ("MOF").These rules state that, if loans, receivables, delinquent loans, and other financial assets are deemed uncollectible, full provisions should be made and recognized as current expense. If the possibility of collection is deemed low, provisions of at least 50% of the credit should be made and the loss should be recognized as an expense currently. The regulations were revised in July 2005 to reclassify deteriorating loans into "Special Mention," "Substandard," "Doubtful," and "Uncollectible” categories. Provisions should be made at 2%, 10%, 50%, and 100% respectively, for each loan category, as the minimum standard of the allowance for bad loans and guarantee.
Unrecoverable portions of delinquent loans are written off upon approval of board of directors.
Available-for-Sale Financial Assets Available-for-sale financial assets are initially measured at fair value plus transaction costs that
are directly attributable to the acquisition. At each balance sheet date subsequent to initial recognition, available-for-sale financial assets are re-measured at fair value, with changes in fair value recognized in equity until the financial assets are disposed of, at which time, the cumulative gain or loss previously recognized in equity is included in profit or loss for the year. The regular way purchases or sales of stocks and mutual funds are recognized and derecognized on a trade date
61
basis. Besides, settlement date basis are applied to all other financial assets. The basis of the fair value: bonds are valued at prices quoted by the Taiwan GreTai Securities
Market on balance sheet date. The fair value of financial assets and financial liabilities without quoted prices in an active market are valued on valuation techniques.
Stock dividends are not recognized as investment income but are recorded as an increase in the number of shares. The total number of shares subsequent to the increase is used for recalculation of cost per share. The difference between the initial cost of a debt instrument and its maturity amount is amortized using the effective interest method, with the amortized interest recognized in profit or loss. An impairment loss is recognized when there is objective evidence that the financial asset is impaired. Any subsequent decrease in impairment loss of an equity instrument classified as available for- sale is recognized directly in equity. If the fair value of a debt instrument classified as available-for-sale subsequently increases as a result of an event which occurred after the impairment loss was recognized, the decrease in impairment loss is reversed to profit.
Held-to-Maturity Financial Assets
Held-to-maturity financial assets are carried at amortized cost using the effective interest method. Held-to-maturity financial assets are initially measured at fair value plus transaction costs that are directly attributable to the acquisition. Profit or loss is recognized when the financial assets are derecognized, impaired, or amortized. The regular way purchases or sales of stocks and mutual funds are accounted for using a trade date basis. Besides, settlement date basis are applied to all other financial assets.
An impairment loss is recognized when there is objective evidence that the investment is impaired. The impairment loss is reversed if an increase in the investment's recoverable amount is due to an event which occurred after the impairment loss was recognized; however, the adjusted carrying amount of the investment may not exceed the carrying amount that would have been determined had no impairment loss been recognized for the investment in prior years. Equity Investments - Equity Method
Under the equity method, the investment is initially recognized at cost and the carrying amount is increased or decreased to recognize the investor's share of the profit or loss of the investee. Distributions received from an investee reduce the carrying amount. The total number of shares subsequent to the increase is used for recalculation of cost per share. Under this method, the investments are carried at cost on the acquisition date. The excess of the costs over the fair value of identifiable net assets, representing goodwill, are no longer amortized. The impairment test is held every year and whenever specific items or environment show that goodwill might have been impaired. When specific incident or any change in the environment indicates any possible impairment against goodwill, an impairment test should be conducted, too. If, through the evaluation with the recoverable amount, significant impairment occurs, the impaired section can be recognized as loss.
Cash dividend distributed by invested companies will not be recognized gains on investment and will be only recoded as an increase in shares held.
The Company shares held by a subsidiary will be re-classified as treasury stock at equity approach.
62
Other Financial Instruments Investments in equity instruments, including unlisted stocks, with no quoted market prices in
an active market or with fair values that cannot be reliably measured are recognized at cost. If evidence shows these financial assets are impaired, losses are recognized. However, the reversal of impairment losses is prohibited.
Debt instruments with no quoted market prices in active markets but with fixed or the amount received can be decidable are carried at amortized cost. Its accounting procedures are similar to those financial instruments held to maturity. However, the disposal timing is not limited.
If evidence shows these financial assets are impaired, losses are recognized immediately. If impairment losses are reversed clearly because of events occurring after the recognition of impairment losses, impairment losses can be reversed. However, the reversal should not result in the carrying amount of financial assets exceeding the amortized cost that would have been determined had no impairment loss been recognized. Fixed Asset
Properties are stated at cost less accumulated depreciation. Major betterments and renewals are capitalized, while repairs and maintenance are expensed as incurred.
Depreciation is calculated by the straight-line method over service lives initially estimated as follows: office equipment, 3 to 5 years; transportation equipment, 5 years; and computer equipment, 3 years. Leasehold improvements are amortized over 5 years. For assets still in use beyond their original estimated service lives, further depreciation is calculated on the basis of any remaining salvage value and the estimated additional service lives.
While re-evaluating fixed assets, net amount will be credited to capital reserve in addition to adding the increment of re-evaluated assets and reserve for land value-added tax. The depreciation is calculated based on durable years remained upon the re-evaluation.
Sunny Bank Ltd. and its subsidiaries determine the cash generating unit which fixed assets and goodwill belong to. The evaluations on impairment loss will be made based on the above said cash generating unit. If there is a major impairment loss arising from such assets after evaluating the carrying value based on related amount receivable, a reduction on the carrying value shall be made from the goodwill listed in the cash generating unit first. Then, the rest impairment loss will be amortized proportionally shall be made from the carrying values of other assets listed in the cash generating unit.
Upon sales or other disposal of properties, their cost and related accumulated depreciation are removed from the accounts. The resulting gain (loss) is credited (charged) to current income. Intangible Asset
Goodwill generated due to merger and partial undertaking will not be amortized. However, the annual loss undergoes regular testing.
Computer software is amortized over 3 years at straight-line method.
63

Other Assets Assumed collaterals and residuals are recorded at cost. These are stated at the lower of cost or
realizable value on the balance sheet date. An impairment loss is recognized when future recoverable values of assumed collaterals and residuals are less than their carrying values. The loss is reversed and a gain is recognized when future recoverable values of these assumed collaterals and residuals recover afterward. The reversed book value should be less than the book value if no impairment has happened.
Rental and idle assets are valued at Lower Of Cost Less Accumulated Depreciation Or Fair Value. Depreciation is calculated by the straight-line method over service lives of 3 to 50 years.For assets still in use beyond their original estimated service lives, further depreciation is calculated on the basis of any remaining salvage value and the estimated additional service lives. Asset Impairment Sunny Bank Ltd. and its subsidiaries determine the cash generating unit which Equity Investment under Equity Method, fixed asset, goodwill and idle assets belong to. The evaluations on impairment loss will be made based on the above said cash generating unit. If there is a major impairment loss arising from such assets after evaluating the carrying value based on related amount receivable, a reduction on the carrying value shall be made from the goodwill listed in the cash generating unit first. Then, the rest impairment loss will be amortized proportionally shall be made from the carrying values of other assets listed in the cash generating unit. If the recoverable amount of the assets increases, the reversal of impairment loss is credited to current income. However, loss reversal should not be more than the carrying amount (net of amortization) had the impairment not been recognized. Bonds or Securities Purchased/Sold under Specific Agreements
Bonds or securities sold under repurchase agreement are recorded at sale price. Interest revenues and expenses are recorded on accrual basis. Pensions
Pension cost under a defined benefit plan is determined by actuarial valuations. Unlisted temporary net payment of asset and the balance of pension will be amortized in linear approach on a basis of 22 years. The payment of pension shall be made from pension reserve and then offset against pension liability.
Contributions made under a defined contribution plan are recognized as pension cost during the years in which employees render services.
64

Interest Income and Fee Income Recognition Loans are recorded at outstanding principal amounts. The interest income on loans is
recognized on an accrual basis. When the loans become past due and are considered uncollectible, the principal and interest receivable are transferred to delinquent accounts, and the accrual of interest income ceases. The Bank will recognize a gain when the delinquent interest is collected. The interest income on loans is recognized on an accrual basis. When the loans become past due and are considered uncollectible, the principal and interest receivable are transferred to delinquent loan accounts, and the accrual of interest income is ceased. Interest income will be recognized when the delinquent interest is collected. If the repayment of loan is extended under an agreement, the related interest should be recognized as deferred revenue and recognized as income when collected.
Fee income is recognized when income is received and main service is completed. Treasury Stock
The reacquisition of issued stock is accounted for by the cost method. Under this method, the reacquisition cost is debited to the treasury stock account.
The stocks of the parent company that are held by a subsidiary are reclassified from investments in shares of stock to treasury stock. The amount reclassified is equivalent to the carrying value of the investments in shares of stock shown in the books of the subsidiary. Income Tax
The Bank applies intra-year and inter-year allocations for its income tax. Deferred income tax assets and liabilities are recognized for the tax effects of temporary differences, unused loss carryforward and unused tax credits. Valuation allowances are provided to the extent, if any, that it is more likely than not that deferred income tax assets will not be realized.
Tax credits for certain acquisitions of equipment or technology, research and development expenditure, personnel training expenditure and equity investments acquisition, are recognized as reduction of current income tax.
Adjustments of prior years’ tax liabilities are accounted for as part of income tax expense of the current year.
An additional tax at 10% of un-appropriated earnings is provided for as income tax in the year the shareholders approve to retain the earnings.
If the minimum tax that applicable to Alternative Minimum Tax Act is higher than the income tax payable for regular income, the additional tax payable should be recorded as the income tax expense for the year.
Commitments and Contingencies
If losses on commitments and contingencies are considered probable and can be reasonably estimated, the losses are recorded in the statement of income for the current period. If the amount could not be evaluated reasonably, the facts should be disclosed.
65
Foreign Currency Transactions Foreign exchange is listed into the accounts in original currency transacted. Foreign currency
accounts of loss and profit are converted to New Taiwan Dollars based on the exchange rates announced by the Central Bank and transferred to NTD accounts at end of every month. The foreign currency accounts of assets and liabilities which are not generated from forward exchange transaction contracts are converted to New Taiwan Dollars based on the exchange rates on Balance Sheet date. The difference arising from such conversion will be recorded as exchange loss and profit of the current year. Reclassifications
Certain accounts of the financial statements for the years ended 2007 have been reclassified to conform to the presentation of financial statements as of and for the year ended 2008. 3.Reasons and Effects of Changes in Accounting Principles
In March 2007, the Accounting Research and Development Foundation issued Interpretation 2007-052, which requires companies to recognize bonuses to employees and remunerations to directors and supervisors as compensation expenses from January 1, 2008. These bonuses were previously recorded as appropriations from earnings. This accounting change had no significant impact on the financial statements for 2008. 4.Cash
December 31, 2008 December 31, 2007Cash on Hand $ 3,006,512 $ 3,408,427 Checks for Clearance 1,233,600 642,755 Due from banks 367,235 240,883
$ 4,607,347 $ 4,292,065 5.Due from the Central Bank and Other Banks
December 31, 2008 December 31, 2007Due from the Central Bank $ 27,650,039 $ 351,930 Deposit Reserve 5,491,299 6,458,163 Call Loan to Banks 2,230,832 3,510,144
$ 35,372,170 $ 10,320,237
Deposit reserve is appropriated to the deposit reserve account at the Central Bank at legal reserve rate and based on the monthly average balance of deposits. At the end of 2008 and 2007, NT$ 5,339,771,000 and NT$5,284,452,000 are respectively shown in the deposit reserve account. Such deposit reserve cannot be used before the monthly adjustment.
66

6.Financial Instruments at Fair Value through Profit or Loss December 31, 2008 December 31, 2007
Trading Financial Assets
Commercial Paper II $ 7,637,814 $ 18,280,627 Beneficiary Certificate 1,321,331 293,493 Listed/OTC Common Stock 291,746 660,680 Government Bond 116,112 117,686 Negotiable Certificate of Deposit 6,351 15,154,415 Others 70,369 36,243
$ 9,443,723 $ 34,543,144 Trading Financial Liabilities
Credit Default Swaps $ 130,359 $ - Exchange Swap 4,243 328
$ 134,602 $ 328
The main purpose of directing the transactions of derivative financial products, in 2008 and 2007 is to correspond with the customer demands and the foreign exchange fun adjustment and risk management.
Until the end of 2008 and 2007, the non-expired derivative financial commodity contract amount (principal) is as follows:
December 31, 2008 December 31, 2007Trading Purpose
Credit Default Swaps $ 1,179,864 $ - Exchange Swap 1,842,901 1,666,011
In 2008 and 2007, net income of the Bank generated by financial assets for transaction was NT$205,522,000 and NT$239,927,000. Net loss of the Bank generated by financial liability for transaction was NT$341,629,000 and NT$22,663,000.
7.Net Receivables
December 31, 2008 December 31, 2007Spot Foreign Exchange Remittance Receivable
$ 2,209,463 $ 196,753
Credit Card Payment Receivable 988,141 1,378,493 Selling of Non-performing Loans Receivable
970,857 1,328,873
(Cont’d )
67

(Cont’d)
December 31, 2008 December 31, 2007Interest Receivable $ 407,593 $ 468,747 Others 298,503 472,866
4,874,557 3,845,732 Less: Allowance for Bad Debts 238,080 240,020
$ 4,636,477 $ 3,605,712 8.Net Discounts and Loans
December 31, 2008 December 31, 2007Short-term Loan $ 16,459,569 $ 12,967,602 Short-term Loan Secured 19,866,343 19,589,681 Mid-term Loan 17,745,454 21,166,137 Mid-term Loan Secured 9,506,370 13,470,869 Long-term Loan 6,661,209 7,943,385 Long-term Loan Secured 94,537,680 95,950,163 Receivables on Demand 3,960,967 4,392,305 Export Finance 39,519 85,676
168,777,111 175,565,818 Less: Allowance for Bad Debts 2,478,716 2,673,327
$ 166,298,395 $ 172,892,491
As of December 31, 2008 and 2007, the balance of loans and credits for which accrual of interest revenues was discontinued amounted to NT$3,960,967,000 and NT$4,392,305,000 respectively. The unrecognized interest revenues on these loans and credits amounted to NT$ 148,421,000 and NT$158,437,000 for the years ended 2008 and 2007 respectively.
Details and changes for Allowance for Bad Debts are as follows:
2008
Unable to Take Back Risk in
Specific Creditors’ Right
Potential Risk in Whole
Creditor’s Right Combination Total
Balance at Year Beginning
$2,457,435 $ 215,892 $2,673,327
Prov-Bad Debt 1,062,441 555,082 1,617,523 Written-off Loans ( 2,004,743 ) - ( 2,004,743 ) Recovery of Written-off
Loans
192,609 - 192,609
Balance in Year End $1,707,742 $ 770,974 $2,478,716
68

2007
Unable to Take Back Risk in
Specific Creditors’ Right
Potential Risk in Whole
Creditor’s Right Combination Total
Balance at Year Beginning $2,004,680 $ 206,112 $2,210,792 Prov-Bad Debt 1,539,276 9,780 1,549,056 Written-off Loans ( 1,345,997 ) - ( 1,345,997 ) Recovery of Written-off Loans 259,476 - 259,476
Balance in Year End $2,457,435 $ 215,892 $2,673,327 9.Available-for-Sale Financial Assets
December 31, 2008 December 31, 2007Commercial Paper II $ 1,383,238 $ 1,428,524 Asset-Backed Commercial Paper 1,212,869 1,277,645 Corporate Bond 781,567 978,072 Government Bond 495,895 930,812 Beneficial Securities 50,028 48,916 Others 54,740 77,916
$ 3,978,337 $ 4,741,885
10.Hold-to-maturity Financial Assets December 31, 2008 December 31, 2007
Beneficial Securities $ 117,673 $ 172,091
Beneficiary securities invested by the Bank on December 31, 2008 and 2007 were both mature in July 2011. The effective interest rate is 1.62-2.7%.
11.Equity Investments – Equity Method
December 31, 2008 December 31, 2007
Stock Holding
% Amount Amount
Stock Holding
% Unlisted Corporation Sunny Securities Co., Ltd $ 207,517 97.7 $ 226,428 97.7 Ontario Securities Investment
Trust 38,762 20.0 - - Gold Sunny Assets
Management Co., Ltd. 19,258 100.0 37,484 100.0 Sunny Life Insurance
Brokerage Co., Ltd. 10,228 39.9 8,033 39.9 Sunny Property Insurance
Brokerage Co., Ltd. 1,557 20.0 1,777 20.0
$ 277,322 $ 273,722
69
Equity investments and related investment loss/gain at equity approach is calculated according to financial statements audited by accountants.
The Bank and its subsidiaries hold 50% of and acquired the control over Sunny Life Insurance Brokerage Co., Ltd. and Sunny Property & Insurance Brokerage Co., Ltd. All the accounts of subsidiaries have been incorporated into the preparation of the consolidated financial statements of 2008 and 2007.
12.Other Financial Instruments
December 31, 2008 December 31, 2007Financial Assets Carried at Cost
Unlisted Common Stock Financial Information Service Co., Ltd.
$ 115,771 $ 115,771
Taiwan Financial Asset Service Corp.
50,000 50,000
Taiwan Depository And Clearing Corp.
21,490 21,490
Unlisted Preferred Stock Bank of Panhsin 110,000 110,000
Farglory Life Insurance Co., Ltd.
- 100,000
297,261 397,261
Non-active Market Debt Instruments
Structured Deposit 163,870 - Accumulated Impairment 147,483 -
16,387 -
$ 313,648 $ 397,261
The investments are carried at cost because they have no active market quotation and the fair value can not be measured reliably.
13.Fixed Assets
December 31, 2008 December 31, 2007Incremental Value from Revaluation:
Land $ 281,856 $ 161,211 House and Building 20,176 21,836
$ 302,032 $ 183,047 Accumulative Depreciation: House and Building $ 769,783 $ 718,422 Miscellaneous Equipment 1,029,159 945,324
$ 1,798,942 $ 1,663,746
70

According the regulation, the Bank re-evaluated its land in 1982, 1991, 1993 and 2008 and its asset other than the land in 1982.
14.Intangible Assets
December 31, 2008 December 31, 2007Goodwill $ 1,034,579 $ 1,150,579 Computer Software 37,251 30,769
$ 1,071,830 $ 1,181,348
In 2008 and 2007, the Bank evaluated the recoverable amount of its goodwill and recognized its impairment of NT$ 116,000,000 and NT$183,000,000, respectively, in branches in South Taiwan and Kaohsiung and Pingtung area. The recoverable amount is based on its usable value. The discount rates adopted for evaluation of usable value were 7.67% and 11.27% respectively.
15.Other Assets
December 31, 2008 December 31, 2007Deferred Tax Asset $ 892,391 $ 637,430 Unrecognized Loss on NPL Disposal
585,954 779,531
Collateral-Less: Net Allowance for Reduction $241,668,000 in 2008 and $326,282,000 in 2007. 447,629 681,986
Rental Assets-Less: Net Accumulated Depreciation $ 10,742,000 for 2008 and $ 13,084,000 for 2007
315,881 445,386 Refundable Deposit 250,213 257,234 Idle Assets-Less: Net Accumulated
Depreciation $ 15,303,000 and Accumulated Impairment $ 10,000,000.
196,123 - Other 37,216 48,913
$ 2,725,407 $ 2,850,480 16.Call Loans and Due to Banks
December 31, 2008 December 31, 2007Due to Banks $ 5,585,843 $ 13,664,113 Call Loan to Banks 400,000 1,025,335
$ 5,985,843 $ 14,689,448
71
17.Deposits and Remittances December 31, 2008 December 31, 2007
Savings Deposit $ 129,282,081 $ 126,233,474 Time Deposit 63,408,000 62,991,354 Current Deposit 14,015,352 15,788,351 Check Deposit 1,884,115 2,028,815 Treasury Deposit 258,119 301,420 Remittances 17,568 18,728
$ 208,865,235 $ 207,362,142 18.Financial Bonds Payable
At the end of 2008 and 2007, the interest rates carried by subordinated financial debentures are 2.51-3.80% and 2.55-3.85%. The interest is paid semiannually or annually. The principal will be paid at one sum lump at maturity and paid off in April 2014.
19.Other Liabilities
December 31, 2008 December 31, 2007Advance Receipts $ 219,898 $ 181,487 Deposits Received 79,661 85,084 Reserve for Guarantee 73,462 73,462 Other 61,850 64,670
$ 434,871 $ 404,703 20.Shareholders’ Equity
The capital reserve generated from the disposal of assets premium cannot be used other than reimbursing loss in accordance with related regulations. The premium derived from issuing of stocks at a price exceeding face value and the capital reserve generated from donation can be appropriated to the account of capital and such increased new shares will be distributed to shareholders in proportion of shareholdings. The capital stock appropriated from capital reserve shall be at a limited ratio every year.
In accordance with the Article of Incorporation, the Banking Law and other related regulations, any annual earnings should first be used for paying tax and making up previous losses, if any, and then the Bank will appropriate 30% of the remaining surplus as a legal reserve except that the legal reserve has reached the amount of total paid-in capital. Then Sunny Bank Ltd. will make special reserve or retain surplus based on our needs. The final remained surplus will be distributed as follows:
(1) Rewards for Directors and Supervisors: 1.5% (2) Employee bonus: 3% (3) Stock dividends: 95.5% When the previously mentioned legal reserve does not reach the amount of total capital, the
maximum cash surplus distribution shall not exceed 15% of total capital. When the bank allocates surplus, it must conform to the regulations and recognize special
reserve from after-taxed earnings of the current year and the unallocated earnings of the previous years for the deduction of shareholders’ earnings (such as unrealized income of financial products) and unamortized balance of the loss on sale of non-performing loans. Subsequently, if the deduction of shareholder’s equity is reverse or the loss on sale of non-performing loans is amortized, earnings
72

should be distributed for the reversed amount or amortized amount. For a sound financial structure and balance capital adequacy, dividend payment is based on the
bank capital budget planning, stock dividend distributed to retain the principle of the necessary funds. If the budget surplus is acquired and capital adequacy rate is higher than the required standard by authority, part of the surplus can be distributed as cash dividend, and shall not be less than 10% of total dividend. If the distributed cash dividend per share is less than NT$0.1, stock dividend can be distributed instead.
The appropriation of profit or loss for 2007 and surplus distribution for 2006 proposed by the Board of Directors and approved at the Shareholders’ Meeting of Sunny Bank Ltd. in June 2008 and 2007 and the dividend per share are as follows:
2007 2006 Appropriation Of
Profit Or Loss Surplus Distribution
Legal Reserve $ 1,138,152 $ 8,642 Special Reserve - 27,794
The 2008 surplus distribution has not been decided by the Board of Directors by the date of
auditing statement by CPAs. Please visit “Public Information Service” for related approval and details.
Under the Company Law, legal reserve should be appropriated until the reserve equals the Bank's paid-in capital. This reserve should only be used to offset a deficit. When the reserve reaches 50% of the Bank's paid-in capital, the amount over 50% of the Bank's paid-in capital may be declared as dividends or bonus if the Bank has no earnings.
While making surplus distribution, the tax deductions for shareholders except those who are the residents of R.O.C. can be calculated according to the rate of tax deduction on dividend distribution date.
73
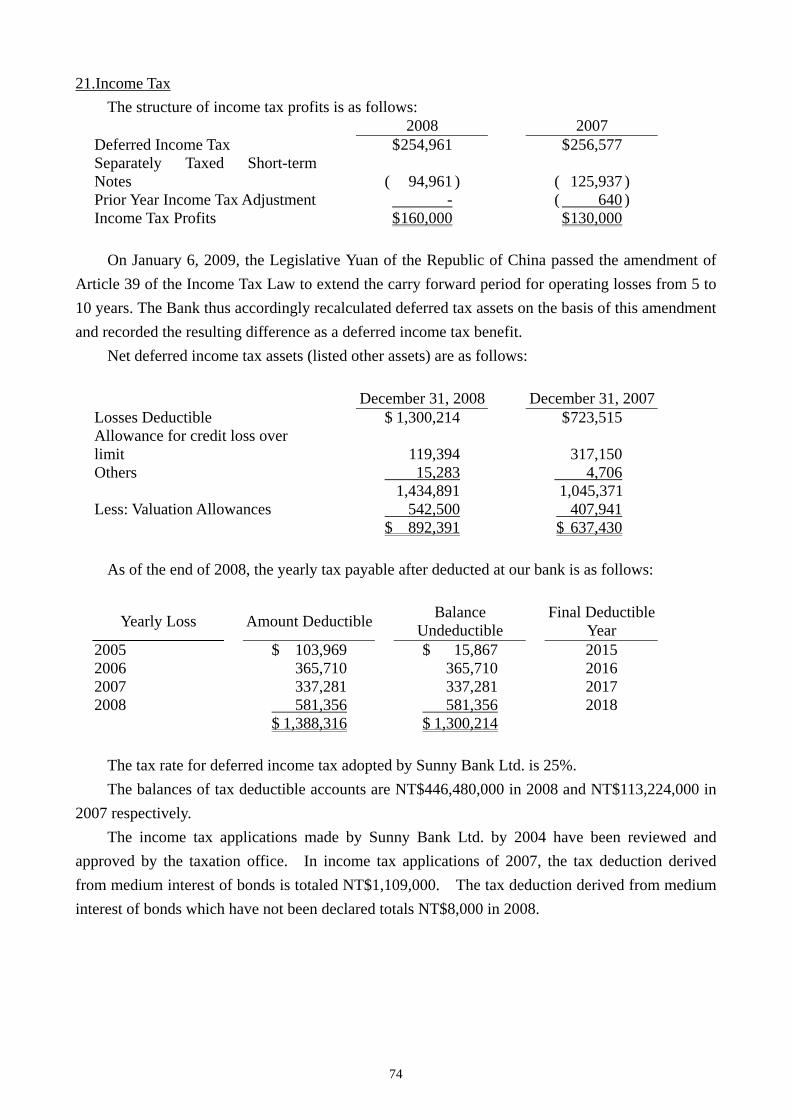
21.Income Tax The structure of income tax profits is as follows:
2008 2007 Deferred Income Tax $ 254,961 $ 256,577 Separately Taxed Short-term Notes
( 94,961 ) ( 125,937 )
Prior Year Income Tax Adjustment - ( 640 ) Income Tax Profits $ 160,000 $ 130,000
On January 6, 2009, the Legislative Yuan of the Republic of China passed the amendment of Article 39 of the Income Tax Law to extend the carry forward period for operating losses from 5 to 10 years. The Bank thus accordingly recalculated deferred tax assets on the basis of this amendment and recorded the resulting difference as a deferred income tax benefit.
Net deferred income tax assets (listed other assets) are as follows:
December 31, 2008 December 31, 2007Losses Deductible $ 1,300,214 $ 723,515 Allowance for credit loss over limit
119,394 317,150
Others 15,283 4,706
1,434,891 1,045,371 Less: Valuation Allowances 542,500 407,941 $ 892,391 $ 637,430
As of the end of 2008, the yearly tax payable after deducted at our bank is as follows:
Balance Undeductible
Final Deductible Year Yearly Loss Amount Deductible
2005 $ 103,969 $ 15,867 2015 2006 365,710 365,710 2016 2007 337,281 337,281 2017 2008 581,356 581,356 2018
$ 1,388,316 $ 1,300,214
The tax rate for deferred income tax adopted by Sunny Bank Ltd. is 25%. The balances of tax deductible accounts are NT$446,480,000 in 2008 and NT$113,224,000 in
2007 respectively. The income tax applications made by Sunny Bank Ltd. by 2004 have been reviewed and
approved by the taxation office. In income tax applications of 2007, the tax deduction derived from medium interest of bonds is totaled NT$1,109,000. The tax deduction derived from medium interest of bonds which have not been declared totals NT$8,000 in 2008.
74

22.Personnel, Depreciation and Amortization Costs 2008 2007
Personnel Cost $ 1,581,602 $ 1,779,073 Salary and Reward 84,511 93,437 Pension 113,628 126,799 Insurance Premium 56,904 58,826 Others
$ 1,836,645 $ 2,058,135 $ 193,011Depreciation $ 181,939 $ 21,904Amortization $ 22,701
23.Losses Per Share
The calculation of the numerator and the denominator for Basic Loss Per Share is disclosed below:
Earnings Per Share(NTD) Amount (Numerator) 1000 Shares
(Denominator)
Before Tax After Tax Before Tax After Tax
2008
Basic Loss Per Share ( $2,471,900 ) ( $2,311,900 ) 1,224,553 ( $ 2.02 ) ( $ 1.89 )
2007
Basic Loss Per Share ( $1,268,152 ) ( $1,138,152 ) 1,224,658 ( $ 1.04 ) ( $ 0.93 ) 24.Pension
Retirement policies are available for formal employees. According to the policy, pension for retired employees will be paid on a basis of seniority and the average monthly salary during six months before retirement.
3.76% of monthly salary of an employee is appropriated as pension reserve. Such reserve will be handed to our Pension Reserve Supervisory Committee and deposited at Bank of Taiwan under the name of this Committee.
The pension plan under the LPA is a defined contribution plan. Based on the LPA, the Bank makes monthly contributions to employees' individual pension accounts at 6% of monthly salaries and wages. Such pension costs were $67,200 thousand and $66,360 thousand for the years ended December 31, 2008 and 2007, respectively.
75

Information about the defined benefit plan was as follows: (1)Net Pension Cost 2008 2007 Service Cost $ 22,937 $ 26,868 Interest Cost 19,732 18,320 Expected Return from Pension
Fund Assets
( 20,308 ) ( 14,000 ) Amortization ( 5,050 ) ( 4,111 ) Net Pension Cost $ 17,311 $ 27,077
(2)Pension Funded Status and Assets & Liabilities Declared Amount Adjustment
December 31, 2008 December 31, 2007 Pension Benefit Obligations
Vested Benefit Obligation $ 214,523 $ 232,084 Non-vested Benefit Obligation 311,579 308,812
Accumulated Benefit Obligation
526,102 540,896
Add. Benefit.-Future 218,278 170,966
Projected Benefit Obligation 744,380 711,862 Fair Value-Pension ( 616,648 ) ( 684,448 ) Fund Status 127,732 27,414 Unrecognized Net Assets 52,805 57,606 Unrecognized Prior Service Cost 33,201 - Unrecognized Pension Gain/Loss ( 204,798 ) ( 85,264 ) Accrued Pension Liabilities
(Prepaid Pension)
$ 8,940 ( $ 244 )
(3)Vested Benefit in accordance with the Measures of Employee Pension Retirement
$ 288,796 $ 290,572 (4)Assumptions of Pension Benefit
Obligation
Discount Rate 2.25% 3% Future Salary Growth Rate 2.5% 2.5% Pension Fund Assets Expected
Rate of Return
2.25% 3% (5)Pension Reserve Appropriation and Payment Status
2008 2007 Appropriation $ 8,127 $ 236,058 Payment $ 94,710 $ 100,250
76
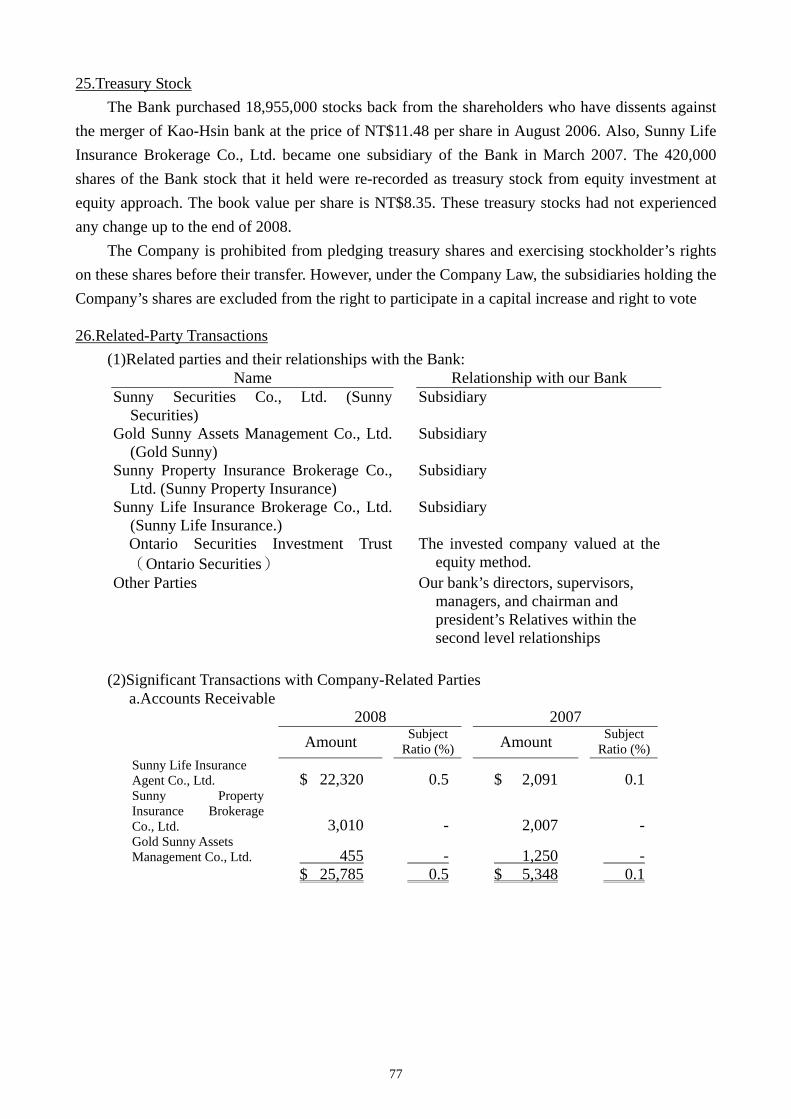
25.Treasury Stock The Bank purchased 18,955,000 stocks back from the shareholders who have dissents against
the merger of Kao-Hsin bank at the price of NT$11.48 per share in August 2006. Also, Sunny Life Insurance Brokerage Co., Ltd. became one subsidiary of the Bank in March 2007. The 420,000 shares of the Bank stock that it held were re-recorded as treasury stock from equity investment at equity approach. The book value per share is NT$8.35. These treasury stocks had not experienced any change up to the end of 2008.
The Company is prohibited from pledging treasury shares and exercising stockholder’s rights on these shares before their transfer. However, under the Company Law, the subsidiaries holding the Company’s shares are excluded from the right to participate in a capital increase and right to vote 26.Related-Party Transactions
(1)Related parties and their relationships with the Bank: Name Relationship with our Bank
Sunny Securities Co., Ltd. (Sunny Securities)
Subsidiary
Gold Sunny Assets Management Co., Ltd. (Gold Sunny)
Subsidiary
Sunny Property Insurance Brokerage Co., Ltd. (Sunny Property Insurance)
Subsidiary
Sunny Life Insurance Brokerage Co., Ltd. (Sunny Life Insurance.)
Subsidiary
Ontario Securities Investment Trust(Ontario Securities)
The invested company valued at the equity method.
Other Parties Our bank’s directors, supervisors, managers, and chairman and president’s Relatives within the second level relationships
(2)Significant Transactions with Company-Related Parties a.Accounts Receivable
2008 2007 Subject
Ratio (%)Subject
Ratio (%) Amount Amount
Sunny Life Insurance Agent Co., Ltd. $ 22,320 0.5 $ 2,091 0.1 Sunny Property Insurance Brokerage Co., Ltd.
3,010 - 2,007 - Gold Sunny Assets Management Co., Ltd. 455 - 1,250 -
$ 25,785 0.5 $ 5,348 0.1
77
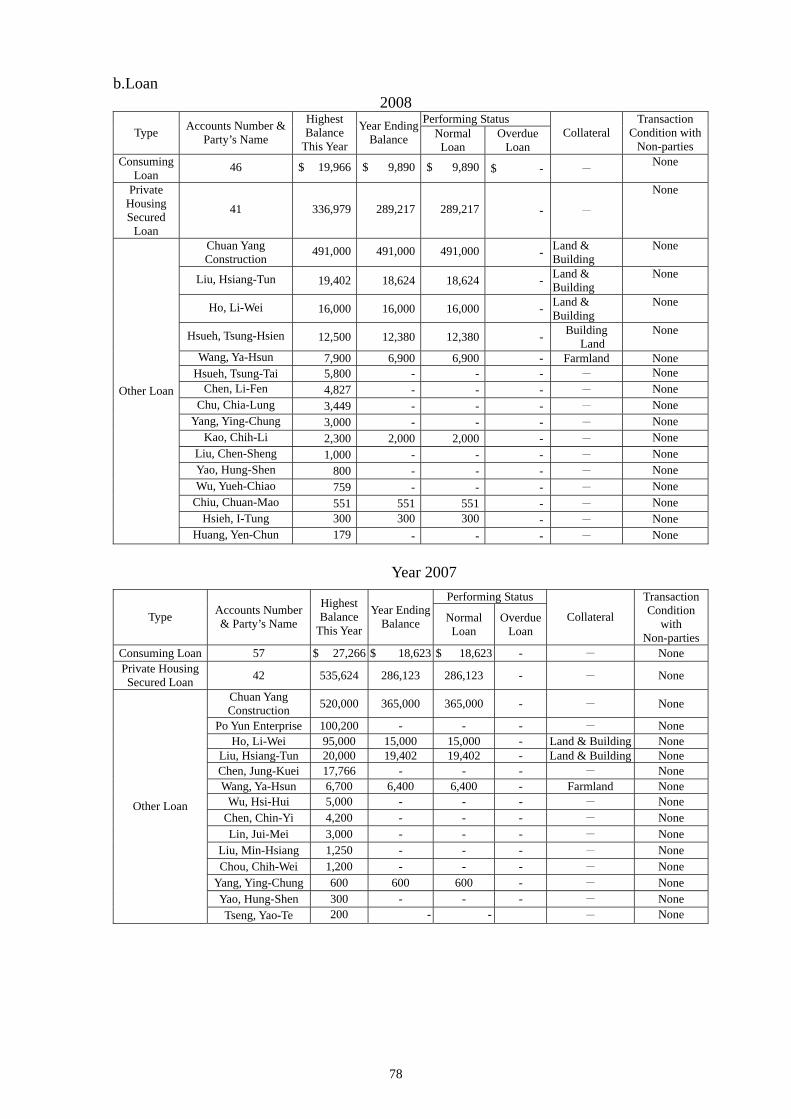
78
b.Loan 2008
Performing Status Type Accounts Number &
Party’s Name
Highest Balance
This Year
Year Ending Balance Normal
Loan Overdue
Loan Collateral
Transaction Condition with
Non-parties Consuming
Loan 46 $ 19,966 $ 9,890 $ 9,890 $ - - None
Private Housing Secured
Loan
41 336,979 289,217 289,217 - -
None
Chuan Yang Construction
491,000 491,000 491,000 - Land & Building
None
Liu, Hsiang-Tun 19,402 18,624 18,624 - Land & Building
None
Ho, Li-Wei 16,000 16,000 16,000 - Land & Building
None
Hsueh, Tsung-Hsien 12,500 12,380 12,380 - Building Land
None
Wang, Ya-Hsun 7,900 6,900 6,900 - Farmland None Hsueh, Tsung-Tai 5,800 - - - - None
Chen, Li-Fen 4,827 - - - - None Chu, Chia-Lung 3,449 - - - - None
Yang, Ying-Chung 3,000 - - - - None Kao, Chih-Li 2,300 2,000 2,000 - - None
Liu, Chen-Sheng 1,000 - - - - None Yao, Hung-Shen 800 - - - - None Wu, Yueh-Chiao 759 - - - - None
Chiu, Chuan-Mao 551 551 551 - - None Hsieh, I-Tung 300 300 300 - - None
Other Loan
Huang, Yen-Chun 179 - - - - None
Year 2007 Performing Status
Type Accounts Number & Party’s Name
HighestBalance
This Year
Year Ending Balance Normal
Loan Overdue
Loan Collateral
Transaction Condition
with Non-parties
Consuming Loan 57 $ 27,266 $ 18,623 $ 18,623 - - None Private Housing Secured Loan 42 535,624 286,123 286,123 - - None
Chuan Yang Construction 520,000 365,000 365,000 - - None
Po Yun Enterprise 100,200 - - - - None Ho, Li-Wei 95,000 15,000 15,000 - Land & Building None
Liu, Hsiang-Tun 20,000 19,402 19,402 - Land & Building None Chen, Jung-Kuei 17,766 - - - - None Wang, Ya-Hsun 6,700 6,400 6,400 - Farmland None
Wu, Hsi-Hui 5,000 - - - - None Chen, Chin-Yi 4,200 - - - - None Lin, Jui-Mei 3,000 - - - - None
Liu, Min-Hsiang 1,250 - - - - None Chou, Chih-Wei 1,200 - - - - None
Yang, Ying-Chung 600 600 600 - - None Yao, Hung-Shen 300 - - - - None
Other Loan
Tseng, Yao-Te 200 - - - None

c.Deposit
December 31, 2008 December 31, 2007 Annual
Percentage Rate (%)
Annual Percentage Rate (%)
Subject Ratio (%)
Subject Ratio (%)
Balance Balance
Other Parties $ 497,529 0.3 0-9 $ 379,189 0.2 0-9 Ontario Securities
47,903 - 0.2-1.25 - - -
Gold Sunny 35,197 - 0.2 212,497 0.1 0-0.2 Sunny Life Insurance
23,513 - 0-0.2 16,688 - 0-1.82
Sunny Property Insurance
21,241 - 0.2-1.77 8,273 - 0.2
Sunny Securities 9,304 - 0-0.2 9,777 - 0-0.2
$ 634,687 0.3 $ 626,424 0.3 d.Interest Income
2008 2007 Subject
Ratio (%) Amount Amount Subject
Ratio (%)Other Parties $ 28,071 0.4 $ 28,745 0.4
e.Interest Expenses
2008 2007 Subject
Ratio (%) Amount Amount Subject
Ratio (%) Other Parties $ 9,622 0.2 $ 9,114 0.2 Others 418 - 188 -
$ 10,040 0.2 $ 9,302 0.2 f.Net Commission Profit
2008 2007 Subject
Ratio (%) Amount Amount Subject
Ratio (%) Sunny Life Insurance $ 73,183 13.4 $ 32,730 4.5 Gold Sunny 14,837 2.7 3,768 0.5 Sunny Property Insurance
14,648 2.7 9,531 1.3
$ 102,668 18.8 $ 46,029 6.3 g.Brokers Charges (the deduction for net income for financial assets and liabilities at fair
value through profit or loss) 2008 2007
Subject Ratio (%)
Amount Amount Subject Ratio (%)
Sunny Securities $ 23,552 4.3 $ 21,822 10.0
79

h.Rent The rented operating places between our bank and subsidiary are as follows
Rent Income Receiving Method
Deposit in SecurityLessee Due Date 2008 2007
Sunny Securities
September 2112 Monthly Receiving
$ 800 $ 10,038 $ 9,069
Sunny Life Insurance
July 2009 Monthly Receiving
- 870 870
November 2009 Monthly Receiving
12 72 72 Gold Sunny
For the lease between the Bank and related parties, market prices are referred to for rent
negotiation. The lease is carried out on general payment term.
i.Sale of Non-Performing Loans The bank, through open tender, sold 41,272 and 2,327 accounts of non-performing loans,
amounted NT$1,041,038 and NT$1,394,846,000, to Sunny Assets Management in 2007 and 2006 respectively. The base dates are July 25, 2007 and November 30, 2006 and the transaction prices are NT$858,000,000 and NT$610,000,000 dollars. The entrusted proceeds will be paid in installment starting from the date of signature to July 31, 2010 and December 26, 2009 respectively. In accordance with contract provisions, the Bank, starting from the base date, will transfer current and future rights, benefits, and the contention of lawsuits to Sunny Assets Management Co. Loss on sale of NPL ware NT$183,038,000 and NT$784,846,000. According to “Financial Institution Merger Act” the loss will be deferred and amortized over five years. The unamortized balance will be recorded as other assets. Its changes are as follows:
2008 2007
$ 779,531 $ 771,766 Balance at Year Beginning - 183,038 Increase During This Year
Amortization During This Year
193,577 175,273
$ 585,954Balance at Year End $ 779,531
80
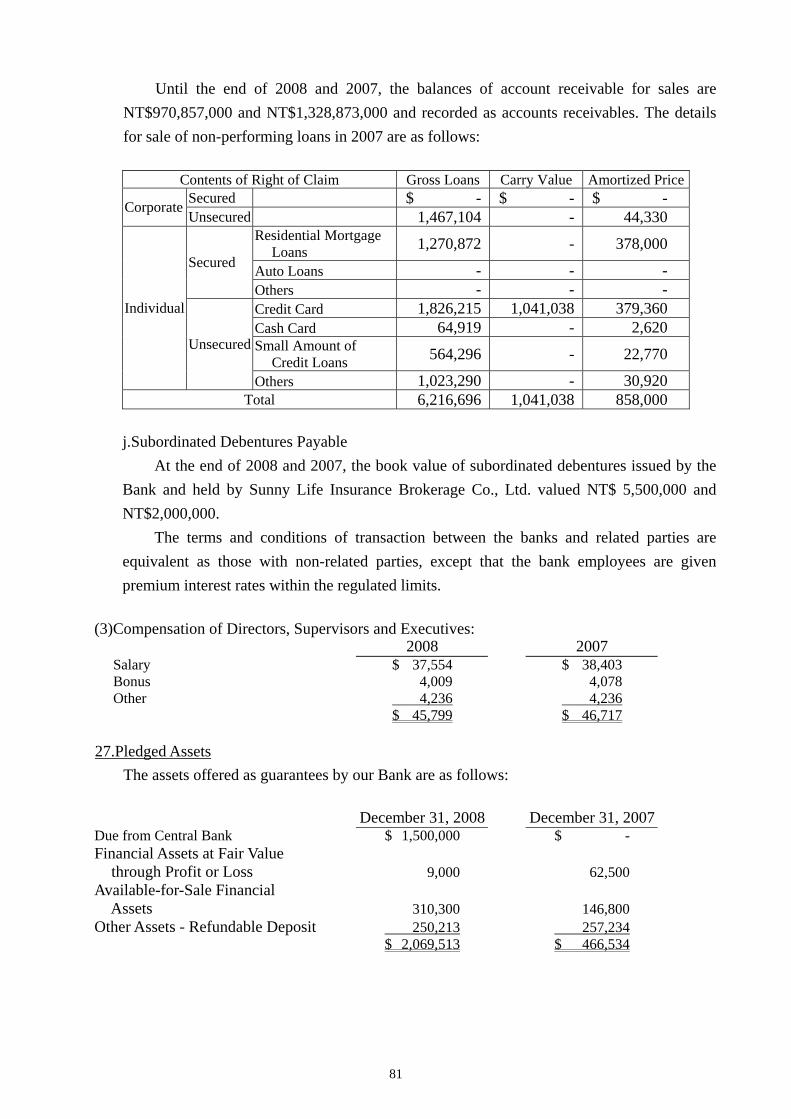
Until the end of 2008 and 2007, the balances of account receivable for sales are NT$970,857,000 and NT$1,328,873,000 and recorded as accounts receivables. The details for sale of non-performing loans in 2007 are as follows:
Contents of Right of Claim Gross Loans Carry Value Amortized Price
$ - $ - $ - Secured Corporate 1,467,104 - 44,330 Unsecured Residential Mortgage
Loans 1,270,872 - 378,000
Auto Loans - - - Secured
- - - Others 1,826,215 1,041,038 379,360 Credit Card
Cash Card 64,919 - 2,620 Individual
Small Amount of Credit Loans 564,296 - 22,770 Unsecured
1,023,290 - 30,920 Others Total 6,216,696 1,041,038 858,000
j.Subordinated Debentures Payable
At the end of 2008 and 2007, the book value of subordinated debentures issued by the Bank and held by Sunny Life Insurance Brokerage Co., Ltd. valued NT$ 5,500,000 and NT$2,000,000.
The terms and conditions of transaction between the banks and related parties are equivalent as those with non-related parties, except that the bank employees are given premium interest rates within the regulated limits.
(3)Compensation of Directors, Supervisors and Executives:
2008 2007 Salary $ 37,554 $ 38,403 Bonus 4,009 4,078 Other 4,236 4,236
$ 45,799 $ 46,717 27.Pledged Assets The assets offered as guarantees by our Bank are as follows:
December 31, 2008 December 31, 2007Due from Central Bank $ 1,500,000 $ - Financial Assets at Fair Value
through Profit or Loss
9,000 62,500 Available-for-Sale Financial
Assets
310,300 146,800 Other Assets - Refundable Deposit 250,213 257,234
$ 2,069,513 $ 466,534
81

The aforementioned pledged assets are offered and deposited at the court as the deposit for performing provisional seizure against obligors, deposit for lease, reserve for credit card payment, reserve for reimbursement required by the Trust Department, operation bond of bond dealers and savings deposit of bill providers and guarantees as for central bank remittance system. In addition, negotiable C/Ds are also provided as guarantee against daily overdraw for central bank real-time total clearing mechanism. The quota for such guarantee is subject to change from time to time and the quota remained at the end of the day can be taken as current reserve. 28.Contingent Liabilities and Commitments
(1)In addition to those mentioned in notes, the Bank had the following contingent liabilities and commitments as of December 31, 2008:
At the end of 2008, bonds and notes with repurchase agreement amounted NT$ 1,689,706,000 and, under agreement, should be repurchased successively with NT$ 1,690,270,000 before January 10, 2009.
As of the end of 2008, the Bank has sold, with repurchase agreement, NT$ 1,490,627,000 for Financial Liabilities at Fair Value through Profit or Loss and NT$ 199,079,000 for Available-for-Sale Financial Assets.
(2)The lease of places rented by the Bank for business units will expire by the end of March 2013. The refundable deposit totals NT$109,947 (listed in other assets). The rental totals NT$ 38,310,000 in 2008.
The contracted rental payable in the next five years is as follows:
Year Amount 2009 $ 32,411 2010 11,717 2011 8,477 2012 6,756 2013 1,672
82

29.Financial Instruments Related Information (1)Fair Value Information
December 31, 2008 December 31, 2007 Book Value Fair Value Book Value Fair Value Financial Assets
Financial Assets Book Value of Which Equals to Fair Value $ 44,833,767 $ 44,833,767 $ 18,350,622 $ 18,350,622
Financial Assets at Fair Value through Profit or Loss 9,443,723 9,443,723 34,543,144 34,543,144
Available-for-Sale Financial Assets 3,978,337 3,978,337 4,741,885 4,741,885 Discounts and Loans 166,298,395 166,298,395 172,892,491 172,892,491 Hold-to-maturity Financial Assets 117,673 117,673 172,091 172,091 Non-active Market Debt Instruments 16,387 16,387 - - Financial Liabilities
Financial Liabilities Book Value of Which Equals to Fair Value 221,449,205 221,449,205 225,047,756 225,047,756
Financial Liabilities at Fair Value through Profit or
Loss 134,602 134,602 328 328 Financial Bonds Payable 5,509,400 5,509,400 6,509,400 6,509,400
(2)Methods and assumptions used to estimate the fair values of financial instruments were as follows:
The carrying amounts of the following short-term financial instruments approximate their fair values because of their short maturities: due from the Central Bank and call loans from banks, bonds purchased under resell agreements, receivables (excluding Tax Refund Receivable), other financial assets, due to banks and the Central Bank, bonds and securities sold under repurchase agreements, payables and remittances.
Fair values of financial instruments at FVTPL and available for-sale or held-to-maturity financial assets are based on their quoted prices in an active market. For those instruments with no quoted market prices, their fair values are determined using valuation techniques incorporating estimates and assumptions consistent with those generally used by other market participants to price financial instruments.
Discounts, loans and deposits are interest-bearing financial assets liabilities and their carrying values approach to their fair values. The carrying amount of delinquent loans is the estimated collectable amount which is the book value less allowance for bad debt. Therefore, the fair value of loans and deposits is determined at their carrying value.
Investments accounted for by the equity method and financial assets carried at cost are investments in unquoted shares, which have no quoted prices in an active market and entail an unreasonably high cost to obtain verifiable fair values. Therefore, no fair value is presented.
83

The fair values of financial bonds are calculated at the discount value of expected cash flow. The discount rate is on a basis of the bond interest rates which Sunny Bank Ltd. can obtain (with similar mature date).
Since it is not necessary to list the fair values for part of our financial products and non-financial products, the above listed total fair value does not represent the total value of Sunny Bank Ltd.
(3)Fair values of financial assets and liabilities using based on quoted market prices or valuation
techniques were as follows: Amount decided by Public Quotation Amount decided by Evaluation Method
December 31,
2008 December 31,
2007 December 31,
2008 December 31,
2007 Financial Assets at Fair Value
through Profit or Loss $ 1,731,323 $ 1,071,859 $ 7,712,400 $ 33,471,285 Available-for-Sale Financial Assets 1,280,941 1,912,180 2,697,396 2,829,705 Financial Liabilities at Fair
Value through Profit or Loss - - 134,602 328
(4)Valuation losses/gains arising from changes in fair value of financial instruments at FVTPL using
quoted market prices and valuation techniques were NT$225,682,000 of loss and NT$89,543,000 of gain for the years ended December 31, 2008 and 2007, respectively.
(5)The financial assets with fair value risk from interest rate exposure on December 31, 2008 and 2007 were NT$11,822,344,000 and NT$38,385,776,000 respectively. The financial assets with the cash flow risk from interest rate exposure were NT$43,732,000 and NT$90,705,000.
(6)The interest income associated with financial assets or liabilities other than at FVTPL in 2008
and 2007 were NT$6,905,595,000 and NT$7,054,864,000 respectively. Unrealized gain from available-for- sale financial assets amounted to NT$54,741 thousand and NT$37,403 thousand for the years ended December 31, 2008 and 2007, respectively, is classified as adjustments to shareholders' equity.
84
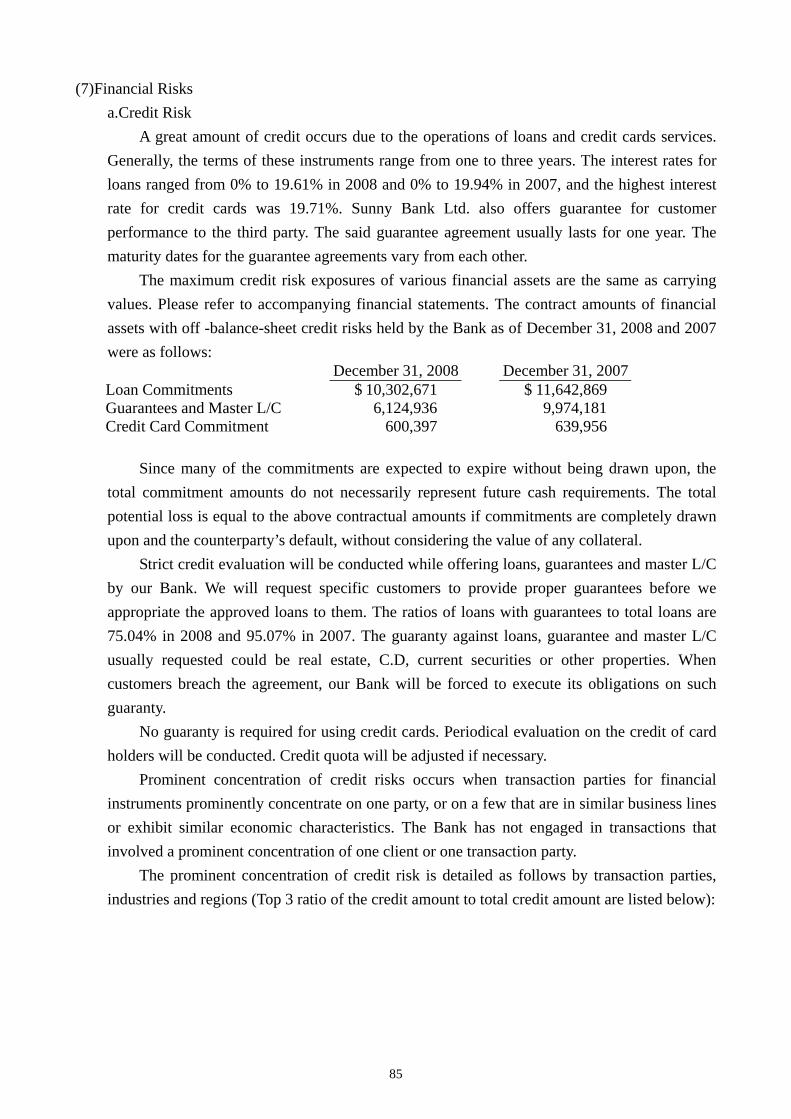
(7)Financial Risks a.Credit Risk
A great amount of credit occurs due to the operations of loans and credit cards services. Generally, the terms of these instruments range from one to three years. The interest rates for loans ranged from 0% to 19.61% in 2008 and 0% to 19.94% in 2007, and the highest interest rate for credit cards was 19.71%. Sunny Bank Ltd. also offers guarantee for customer performance to the third party. The said guarantee agreement usually lasts for one year. The maturity dates for the guarantee agreements vary from each other.
The maximum credit risk exposures of various financial assets are the same as carrying values. Please refer to accompanying financial statements. The contract amounts of financial assets with off -balance-sheet credit risks held by the Bank as of December 31, 2008 and 2007 were as follows:
December 31, 2008 December 31, 2007 Loan Commitments $ 10,302,671 $ 11,642,869 Guarantees and Master L/C 6,124,936 9,974,181 Credit Card Commitment 600,397 639,956
Since many of the commitments are expected to expire without being drawn upon, the
total commitment amounts do not necessarily represent future cash requirements. The total potential loss is equal to the above contractual amounts if commitments are completely drawn upon and the counterparty’s default, without considering the value of any collateral.
Strict credit evaluation will be conducted while offering loans, guarantees and master L/C by our Bank. We will request specific customers to provide proper guarantees before we appropriate the approved loans to them. The ratios of loans with guarantees to total loans are 75.04% in 2008 and 95.07% in 2007. The guaranty against loans, guarantee and master L/C usually requested could be real estate, C.D, current securities or other properties. When customers breach the agreement, our Bank will be forced to execute its obligations on such guaranty.
No guaranty is required for using credit cards. Periodical evaluation on the credit of card holders will be conducted. Credit quota will be adjusted if necessary.
Prominent concentration of credit risks occurs when transaction parties for financial instruments prominently concentrate on one party, or on a few that are in similar business lines or exhibit similar economic characteristics. The Bank has not engaged in transactions that involved a prominent concentration of one client or one transaction party.
The prominent concentration of credit risk is detailed as follows by transaction parties, industries and regions (Top 3 ratio of the credit amount to total credit amount are listed below):
85
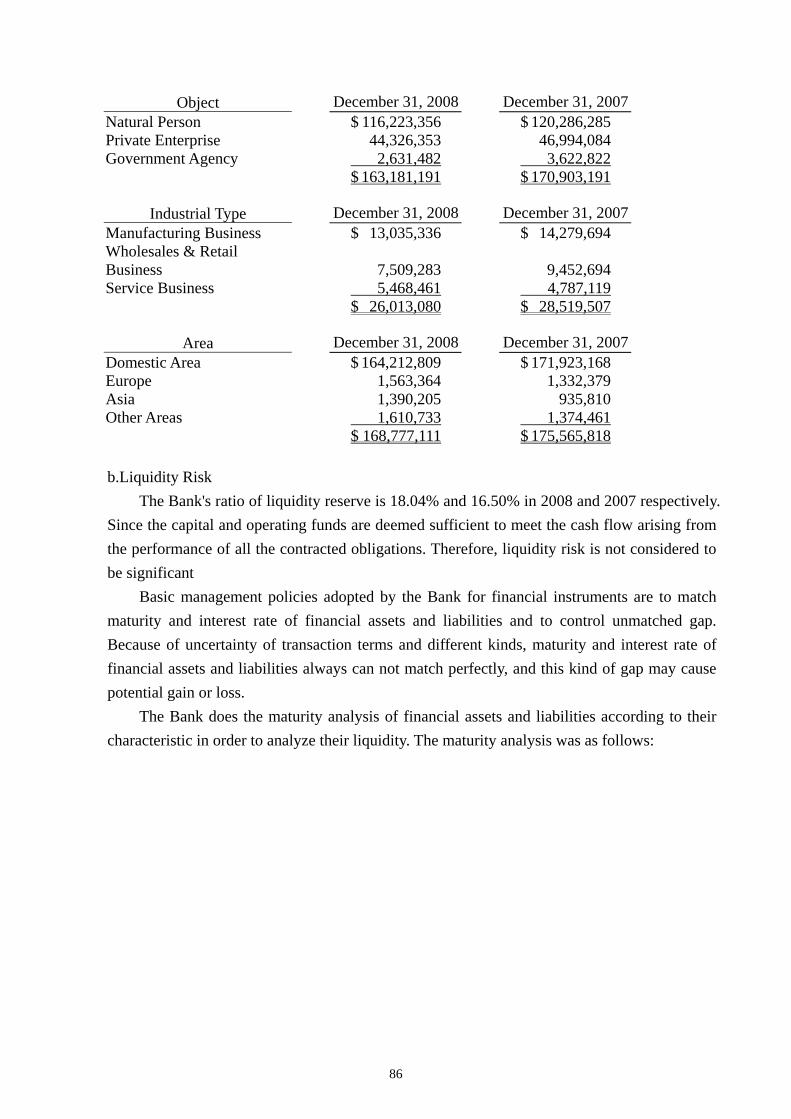
Object December 31, 2008 December 31, 2007
Natural Person $ 116,223,356 $ 120,286,285 Private Enterprise 44,326,353 46,994,084 Government Agency 2,631,482 3,622,822
$ 163,181,191 $ 170,903,191
December 31, 2008 December 31, 2007 Industrial Type Manufacturing Business $ 13,035,336 $ 14,279,694 Wholesales & Retail Business 7,509,283 9,452,694 Service Business 5,468,461 4,787,119
$ 26,013,080 $ 28,519,507
Area December 31, 2008 December 31, 2007 Domestic Area $ 164,212,809 $ 171,923,168 Europe 1,563,364 1,332,379 Asia 1,390,205 935,810 Other Areas 1,610,733 1,374,461
$ 168,777,111 $ 175,565,818
b.Liquidity Risk The Bank's ratio of liquidity reserve is 18.04% and 16.50% in 2008 and 2007 respectively.
Since the capital and operating funds are deemed sufficient to meet the cash flow arising from the performance of all the contracted obligations. Therefore, liquidity risk is not considered to be significant
Basic management policies adopted by the Bank for financial instruments are to match maturity and interest rate of financial assets and liabilities and to control unmatched gap. Because of uncertainty of transaction terms and different kinds, maturity and interest rate of financial assets and liabilities always can not match perfectly, and this kind of gap may cause potential gain or loss.
The Bank does the maturity analysis of financial assets and liabilities according to their characteristic in order to analyze their liquidity. The maturity analysis was as follows:
86

87
December 31 2008
Overdue within
1 month
Over 1 ~3
months
Over 3 ~6
months
Over 6 months ~
1 year
Over 1 year ~ 7
years Over
7 years Total
Assets Cash $4,607,347 $ - $ - $ - $ - $ - $4,607,347 Due from the Central Bank and Other Banks 35,372,170 - - - - - 35,372,170 Financial Assets at Fair Value through Profit
or Loss
7,653,151 1,668,582 4,975 53,326 63,689 - 9,443,723 Total Receivables 4,874,557 - - - - - 4,874,557 Total Discounts and Loans 14,994,233 12,438,881 11,538,249 11,014,366 26,067,148 92,724,234 168,777,111Available-for-Sale Financial Assets 492,642 2,103,464 - - 1,208,621 173,610 3,978,337 Hold-to-maturity Financial Assets - - - - 117,673 - 117,673 Total Non-active Market Debt Instruments - - - - 163,870 - 163,870
Total Assets $67,994,100 $16,210,927 $11,543,224 $11,067,692 $27,621,001 $92,897,844 $227,334,788 Liabilities Financial Liabilities at Fair Value through
Profit or Loss
$ 8,864 $ - $ 16,387 $ 71,775 $ 37,576 $ - $ 134,602 Call Loans and Due to Banks 5,985,843 - - - - - 5,985,843 Notes and Bonds Issued under Repurchase
Agreement
1,689,706 - - - - - 1,689,706 Payables 4,828,760 - - - - - 4,828,760 Deposits and Remittances 86,981,724 36,331,429 28,994,042 41,712,998 14,845,042 - 208,865,235Financial Bonds Payable - - - - 5,509,400 - 5,509,400
Total Liabilities $99,494,897 $36,331,429 $29,010,429 $41,784,773 $20,392,018 $ - $227,013,546
December 31 2007
Overdue within
1 month
Over 1 ~3
months
Over 3 ~6
months
Over 6 months ~
1 year
Over 1 year ~ 7
years Over
7 years Total
Assets Cash $4,292,065 $ - $ - $ - $ - $ - $4,292,065 Due from the Central Bank and Other Banks 10,320,237 - - - - - 10,320,237 Financial Assets at Fair Value through Profit
or Loss
22,819,250 7,011,591 4,522,663 71,954 117,686 - 34,543,144 Total Receivables 3,845,732 - - - - - 3,845,732 Total Discounts and Loans 15,243,201 8,998,567 12,432,107 10,031,484 36,163,740 92,696,719 175,565,818Available-for-Sale Financial Assets 397,532 2,358,620 199,829 398,878 1,196,817 190,209 4,741,885 Hold-to-maturity Financial Assets - - - - 172,091 - 172,091
Total Assets $56,918,017 $18,368,778 $17,154,599 $10,502,316 $37,650,334 $92,886,928 $233,480,972 Liabilities Financial Liabilities at Fair Value through Profit or Loss
$ 328 $ - $ - $ - $ - $ - $ 328
Call Loans and Due to Banks 14,689,448 - - - - - 14,689,448 Notes and Bonds Issued under Repurchase
Agreement
519,960 - - - - - 519,960 Payables 2,391,122 - - - - - 2,391,122 Deposits and Remittances 87,864,136 32,399,609 31,071,465 39,406,788 16,620,144 - 207,362,142Financial Bonds Payable - - 1,000,000 - 5,509,400 - 6,509,400
Total Liabilities $105,464,994 $32,399,609 $32,071,465 $39,406,788 $22,129,544 $ - $231,472,400

30.Capital Adequacy Ratio
The Banking Law and related regulations require that the Bank maintain a capital adequacy ratio
(CAR) of at least 8%. Thus, if the Bank's CAR falls below 8%, the authority may impose certain
restrictions on its earning distribution.
Year 12/31/2008 12/31/2007 Analytical Items Tier-1 capital $ 8,880,498 $ 10,965,006 Tier-2 capital 5,686,572 6,118,288 Tier 3 Capital - -
Own Capital
Own Capital 14,567,070 17,083,294 Standardized Approach 146,260,054 151,740,512 Internal Ratings-based Approach
- - Credit Risk
Asset Securitization 23,535 683,428 Basic Indicator Approach 7,311,468 8,415,364 Standardized Approach / Alternative Standardized Approach
- - Operation
al Risk Advanced Measurement Approach
- -
Risk- Weighted
Assets
Standardized Approach 9,105,429 12,265,351 Market Risk Internal Model Approach - -
Risk-Weighted Assets 162,700,486 173,104,655 Capital Adequacy 8.95% 9.87% Tier 1 Capital to Risk Asset 5.46% 6.33% Tier 2 Capital to Risk Asset 3.49% 3.54% Tier 3 Capital to Risk Asset - - Total Common Stock to Total Asset 5.22% 5.08%
Self-owned Capital = Tier 1 Capital +Tier II Capital + Tier III Capital Risk-Weighted Assets = Credit Risk Weighted Risk Asset + Capital Requirement of
Operational Risk and Market Risk × 12.5 Capital Adequacy = Self-owned Capital/ Risk-Weighted Assets Tier 1 Capital to Risk Asset = Tier I Capital/Risk-Weighted Assets Tier 2 Capital to Risk Asset = Tier II Capital/Risk-Weighted Assets Tier 3 Capital to Risk Asset = Capital III Capital/Risk-Weighted Assets Total Common Stock to Total Asset = Total Common Stock/ Total Assets
88

89
31.Average Value and Average Rate of Yield Assets and Interest Payment Liabilities: Year 2008 Year 2007
Average Value Average
Rate %
Average Value Average
Rate %
Assets
Cash - Due from Banks $ 318,917 0.48 $ 419,741 0.24Reverse Repurchase Note and Bond Investment 10,936 1.13 - -Due from the Central Bank and Other Banks 20,765,127 1.81 11,514,425 1.30Financial Assets at Fair Value through Profit or
Loss 18,558,277 2.18 21,576,677
1.85Available-for-Sale Financial Assets 4,237,278 2.33 4,670,479 2.14Hold-to-maturity Financial Assets 155,949 2.48 249,911 2.28Non-active Market Debt Instruments 237,296 4.76 - -Receivables 1,310,881 9.23 2,208,924 8.16Discounts and Loans 171,031,926 3.67 188,996,420 3.50 Liabilities
Notes and Bonds Issued under Repurchase
Agreement 1,790,573 1.98 4,416,852
1.62Funds Borrowed from Central Bank and Banks - - 459,171 3.50Call Loans and Due to Banks 9,243,030 2.44 14,720,632 2.16Current Deposit 13,303,846 0.28 14,355,880 0.34Current Savings Deposit 39,551,490 0.63 46,912,529 0.67Time Deposit 59,837,625 2.70 44,143,405 2.44Time Savings Deposit 85,160,030 2.64 91,143,193 2.24Treasury Deposit 212,223 0.95 206,637 1.12Negotiable Certificate of Deposit 2,696,438 2.24 7,940,510 1.95Financial Bonds Payable 5,874,991 3.02 6,115,901 3.21 32.Loan assets quality, concentration of crediting risk, sensitive information of interest rates,
profitability and structure analysis of the maturation of NTD
Loan Assets Quality Month / Year December 31, 2008 December 31, 2007
Business / Items Amount of
non-performing loans (Note 1)
Gross loans Non-performing
loan ratio (%) (Note 2)
Allowance for doubtful
accounts
Average ratio (%) (Note 3)
Amount of non-performingloans (Note 1)
Gross loans Non-performing
loan ratio (%) (Note 2)
Allowance for doubtful
accounts
Average ratio (%) (Note 3)
Secured loans 1,120,922 21,212,405 5.28% 278,901 24.88% 1,073,096 25,042,205 4.29% 355,591 33.14%Corporate Banking Unsecured loans 1,028,617 31,872,045 3.23% 1,540,256 149.74% 1,374,035 31,386,840 4.38% 1,355,567 98.66%
Residential mortgage loans (Note 4) 858,036 50,697,592 1.69% 233,567 27.22% 986,996 54,346,734 1.82% 229,128 23.21%
Cash card services - - - - - - - - - -Consumer banking
Small amount of credit loans (Note 5) 160,704 5,463,586 2.94% 94,322 58.69% 350,530 6,485,236 5.41% 359,177 102.47%
Secured loans 1,120,962 56,520,922 1.98% 250,989 22.39% 1,142,517 54,692,802 2.09% 280,710 24.57%
Others (Note
6) Unsecured loans 103,105 3,010,561 3.42% 80,681 78.25% 106,455 3,612,001 2.95% 93,154 87.51%
Gross loan business 4,392,346 168,777,111 2.60% 2,478,716 56.43% 5,033,629 175,565,818 2.87% 2,673,327 53.11%
Amount of
overdue accounts
Balance of accounts
Receivable Overdue
account ratio (%)
Overdue account ratio (%)
Allowance for doubtful
accounts
Coverage ratio
Amount of overdue accounts
Balance of accounts
Receivable Overdue
account ratio (%)
Overdue account ratio (%)
Allowance for doubtful
accounts
Coverage ratio
Credit card services 25,402 988,141 2.57% 23,474 92.41% 38,042 1,378,493 2.76% 77,084 202.63%Without recourse factoring
(Note 7) - - - - - - - - - -
Overdue loans with debt negotiated terms which have been performed and exempted from reporting as non-performing loan ( Note 8)
59,377 91,013
Overdue receivables with debt negotiated terms which have been performed and exempted from reporting as non-performing loan (Note 8)
372,141 548,674
Amounts of executed debt-restructuring projects not reported as nonperforming loans or receivables (Note 9)
25,175 -
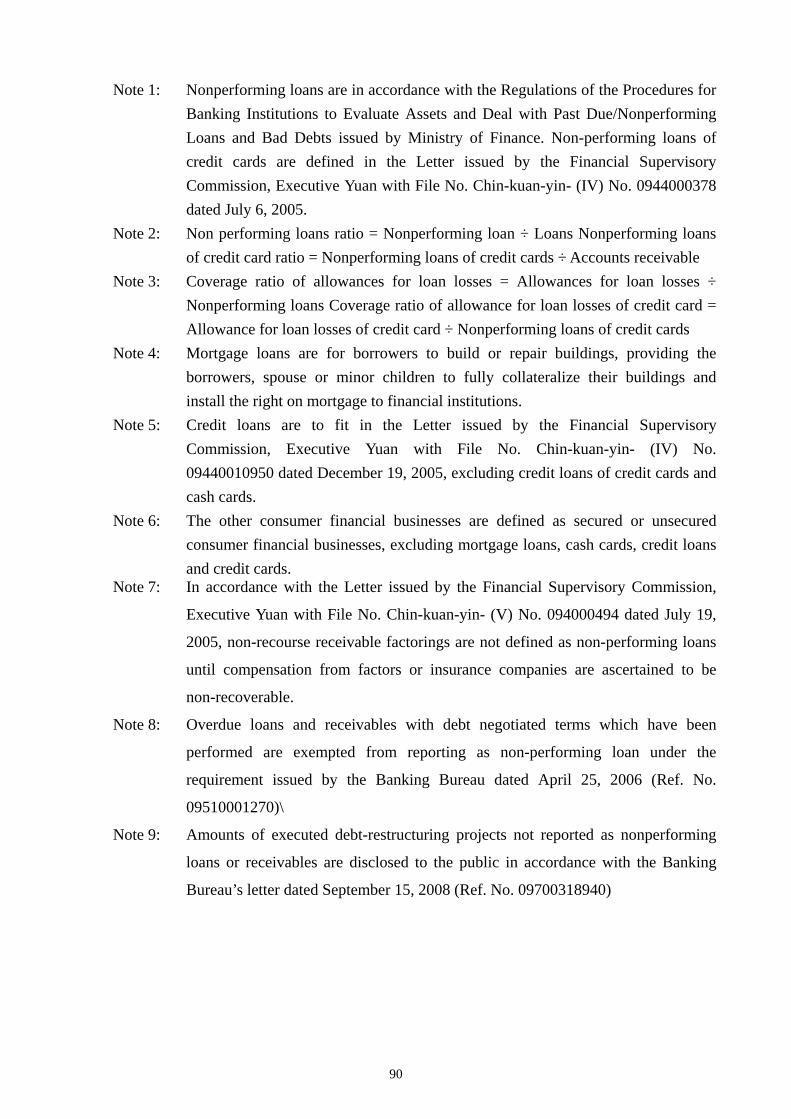
Note 1: Nonperforming loans are in accordance with the Regulations of the Procedures for Banking Institutions to Evaluate Assets and Deal with Past Due/Nonperforming Loans and Bad Debts issued by Ministry of Finance. Non-performing loans of credit cards are defined in the Letter issued by the Financial Supervisory Commission, Executive Yuan with File No. Chin-kuan-yin- (IV) No. 0944000378 dated July 6, 2005.
Note 2: Non performing loans ratio = Nonperforming loan ÷ Loans Nonperforming loans of credit card ratio = Nonperforming loans of credit cards ÷ Accounts receivable
Note 3: Coverage ratio of allowances for loan losses = Allowances for loan losses ÷ Nonperforming loans Coverage ratio of allowance for loan losses of credit card = Allowance for loan losses of credit card ÷ Nonperforming loans of credit cards
Note 4: Mortgage loans are for borrowers to build or repair buildings, providing the borrowers, spouse or minor children to fully collateralize their buildings and install the right on mortgage to financial institutions.
Note 5: Credit loans are to fit in the Letter issued by the Financial Supervisory Commission, Executive Yuan with File No. Chin-kuan-yin- (IV) No. 09440010950 dated December 19, 2005, excluding credit loans of credit cards and cash cards.
Note 6: The other consumer financial businesses are defined as secured or unsecured consumer financial businesses, excluding mortgage loans, cash cards, credit loans and credit cards.
Note 7: In accordance with the Letter issued by the Financial Supervisory Commission,
Executive Yuan with File No. Chin-kuan-yin- (V) No. 094000494 dated July 19,
2005, non-recourse receivable factorings are not defined as non-performing loans
until compensation from factors or insurance companies are ascertained to be
non-recoverable.
Note 8: Overdue loans and receivables with debt negotiated terms which have been
performed are exempted from reporting as non-performing loan under the
requirement issued by the Banking Bureau dated April 25, 2006 (Ref. No.
09510001270)\
Note 9: Amounts of executed debt-restructuring projects not reported as nonperforming
loans or receivables are disclosed to the public in accordance with the Banking
Bureau’s letter dated September 15, 2008 (Ref. No. 09700318940)
90
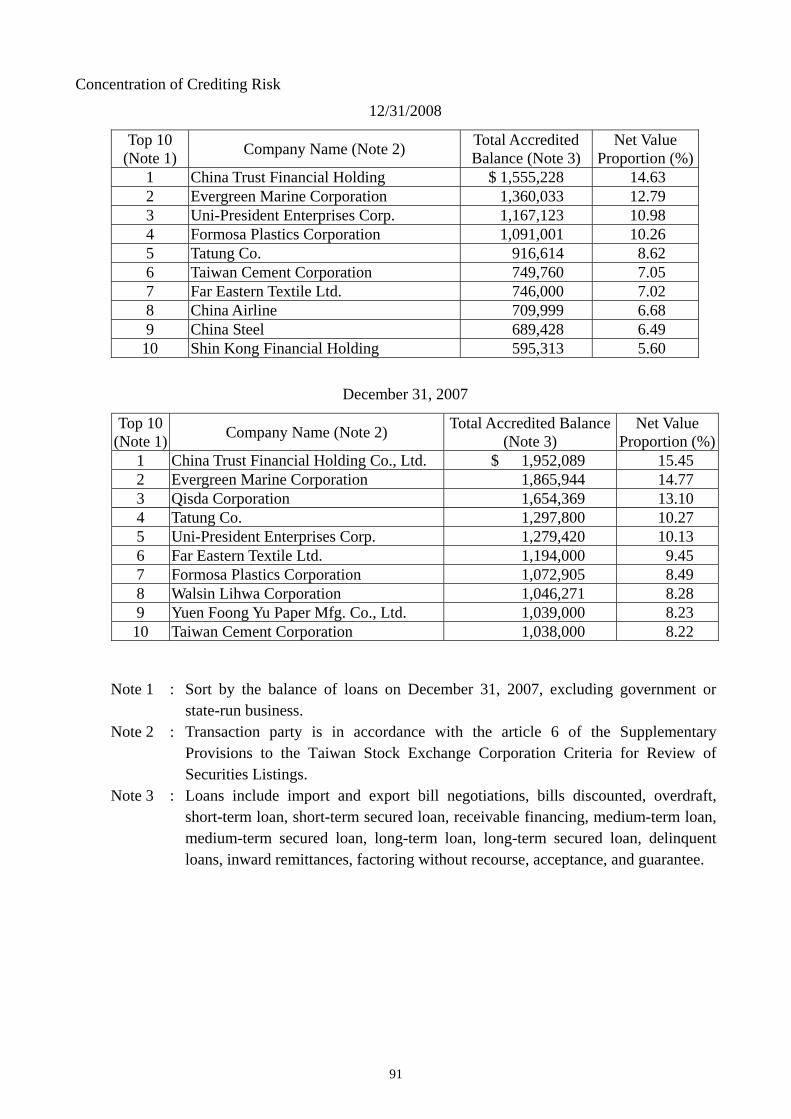
Concentration of Crediting Risk
12/31/2008
Top 10 (Note 1)
Total Accredited Balance (Note 3)
Net Value Proportion (%)Company Name (Note 2)
1 China Trust Financial Holding $ 1,555,228 14.63 2 Evergreen Marine Corporation 1,360,033 12.79
3 Uni-President Enterprises Corp. 1,167,123 10.98
4 Formosa Plastics Corporation 1,091,001 10.26
5 Tatung Co. 916,614 8.62
6 Taiwan Cement Corporation 749,760 7.05
7 Far Eastern Textile Ltd. 746,000 7.02
8 China Airline 709,999 6.68 9 China Steel 689,428 6.49 10 Shin Kong Financial Holding 595,313 5.60
December 31, 2007
Top 10 (Note 1)
Total Accredited Balance (Note 3)
Net Value Proportion (%)Company Name (Note 2)
1 China Trust Financial Holding Co., Ltd. $ 1,952,089 15.45 2 Evergreen Marine Corporation 1,865,944 14.77
3 Qisda Corporation 1,654,369 13.10
4 Tatung Co. 1,297,800 10.27
5 Uni-President Enterprises Corp. 1,279,420 10.13
6 Far Eastern Textile Ltd. 1,194,000 9.45
7 Formosa Plastics Corporation 1,072,905 8.49
8 Walsin Lihwa Corporation 1,046,271 8.28
9 Yuen Foong Yu Paper Mfg. Co., Ltd. 1,039,000 8.23
10 Taiwan Cement Corporation 1,038,000 8.22
Note 1 : Sort by the balance of loans on December 31, 2007, excluding government or state-run business.
Note 2 : Transaction party is in accordance with the article 6 of the Supplementary Provisions to the Taiwan Stock Exchange Corporation Criteria for Review of Securities Listings.
Note 3 : Loans include import and export bill negotiations, bills discounted, overdraft, short-term loan, short-term secured loan, receivable financing, medium-term loan, medium-term secured loan, long-term loan, long-term secured loan, delinquent loans, inward remittances, factoring without recourse, acceptance, and guarantee.
91

Sensitive Information of Interest Rates
Sensitivity Analysis of Interest Rate for Assets and Liabilities (NTD) December 31, 2008
Expressed in NT$ Thousands, %
Items 1-90 days 91-180 days 181-1 year Over 1 year Total Interest-rate-sensitive Assets $ 165,215,183 $ 14,421,286 $ 5,741,179 $ 17,534,862 $ 202,912,510Interest-rate-sensitive Liabilities 89,251,828 71,972,149 32,400,186 19,120,827 212,744,990Interest-rate-sensitive Gap 75,963,355 ( 57,550,863) ( 26,659,007 ) ( 1,585,965 ) ( 9,832,480 )Net Value 11,818,242Ratio of Interest-rate-sensitive Assets to Interest-rate-sensitive Liabilities (%) 95.38% Ratio of Interest-rate-sensitive Gap to Shareholders’ Equity (%) ( 83.20% )
December 31, 2007
Expressed in NT$ Thousands, %
Items 1-90 days 91-180 days 181-1 year Over 1 year Total Interest-rate-sensitive Assets $ 175,054,542 $ 10,948,270 $ 1,204,194 $ 22,926,565 $ 210,133,571 Interest-rate-sensitive Liabilities
95,914,881 80,411,515 24,749,223 17,668,424 218,744,043
Interest-rate-sensitive Gap 79,139,661 ( 69,463,245 ) ( 23,545,029 ) 5,258,141 ( 8,610,472 )Net Value 12,605,355 Ratio of Interest-rate-sensitive Assets to Interest-rate-sensitive Liabilities (%) 96.06% Ratio of Interest-rate-sensitive Gap to Shareholders’ Equity (%) ( 68.31% )
Note: The amounts listed above include accounts in NT dollars only (i.e., excluding foreign
currency) for both head office and domestic and foreign branches.
Interest-sensitive assets and liabilities are interest-earning assets and interest bearing
liabilities with income or cost affected by interest rate fluctuations.
Interest sensitivity gap = Interest-sensitive assets - Interest-sensitive liabilities
Ratio of interest-sensitive assets to interest-sensitive liabilities = (Interest-sensitive
assets/ Interest-sensitive liabilities)
92

Sensitivity Analysis of Interest Rate for Assets and Liabilities (USD)
December 31, 2008 (Expressed in US$ Thousands, %)
Items 1-90 days 91-180 days 181-1 year Over 1 year Total Interest-rate-sensitive Assets $ 186,685 $ 28,930 $ 2,284 $ - $ 217,899 Interest-rate-sensitive Liabilities 151,622 48,286 25,991 - 225,899 Interest-rate-sensitive Gap 35,063 ( 19,356 ) ( 23,707 ) - ( 8,000 )Net Value ( 36,270 )Ratio of Interest-rate-sensitive Assets to Interest-rate-sensitive Liabilities (%) 96.46% Ratio of Interest-rate-sensitive Gap to Shareholders’ Equity (%) 22.06%
December 31, 2007
Expressed in US$ Thousands, % Items 1-90 days 91-180 days 181-1 year Over 1 year Total Interest-rate-sensitive Assets $ 260,323 $ 64,885 $ 1,247 $ 1,756 $ 328,211Interest-rate-sensitive Liabilities 200,547 86,749 23,236 14 310,546Interest-rate-sensitive Gap 59,776 ( 21,864 ) ( 21,989 ) 1,742 17,665Total Shareholders’ Equity 822Ratio of Interest-rate-sensitive Assets to Interest-rate-sensitive Liabilities (%) 105.69%Ratio of Interest-rate-sensitive Gap to Shareholders’ Equity (%) 2,149.03%
Note: The amounts listed above include accounts in US dollars for head office, domestic
branches, OBU and foreign branches, excluding contingent asset and contingent
liabilities.
Interest-sensitive assets and liabilities are interest-earning assets and interest bearing
liabilities with income or cost affected by interest rate fluctuations.
Interest sensitivity gap = Interest-sensitive assets - Interest-sensitive liabilities
Ratio of interest-sensitive assets to interest-sensitive liabilities = (Interest-sensitive
assets/ Interest-sensitive liabilities)
Profitability
Items December 31, 2008 December 31, 2007 Before Tax ( 1.02 ) ( 0.51 ) Return on Total Assets (%) After Tax ( 0.96 ) ( 0.46 ) Before Tax ( 21.25 ) ( 9.59 ) Return on Shareholders’
Equity (%) After Tax ( 19.88 ) ( 8.61 ) Net profit Margin Ratio (%) ( 28.32 )
Note:
Return on total assets = Income before (after) income tax/average total assets.
Return on shareholders’ equity = Income before (after) income tax/average shareholders’ equity.
Net profit margin ratio = Income after income tax / total operating revenues.
93
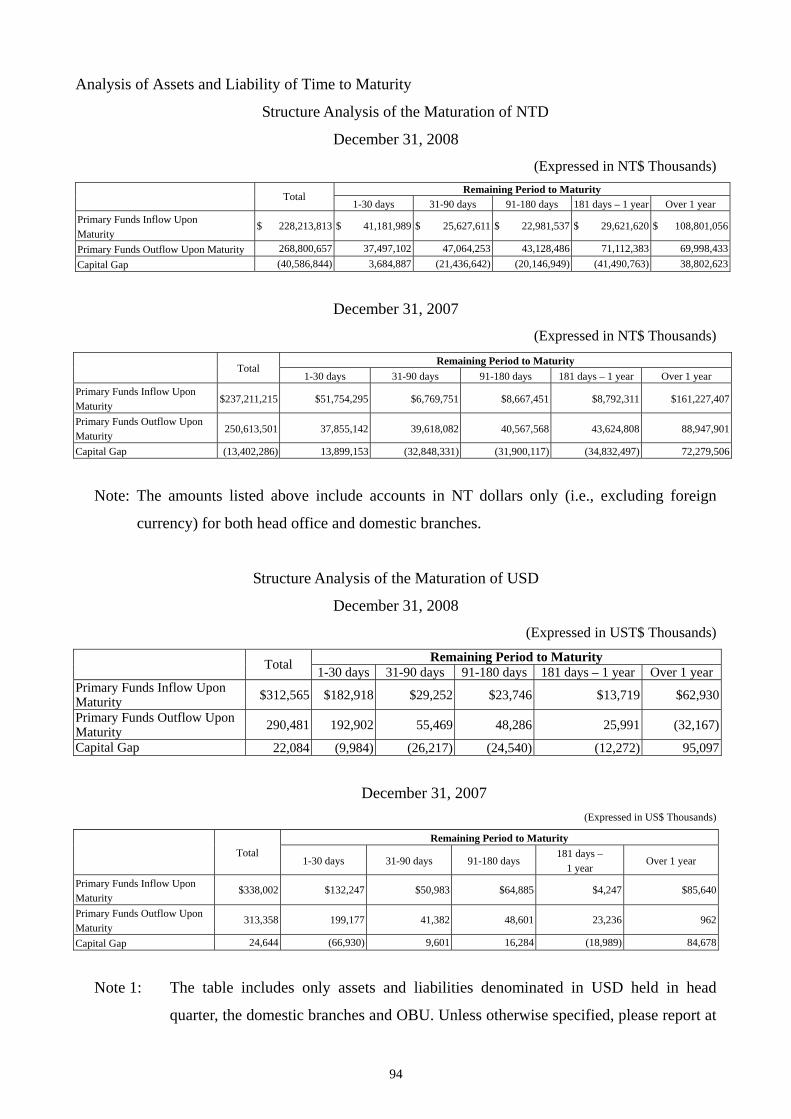
Analysis of Assets and Liability of Time to Maturity
Structure Analysis of the Maturation of NTD
December 31, 2008
(Expressed in NT$ Thousands) Remaining Period to Maturity
Total 1-30 days 31-90 days 91-180 days 181 days – 1 year Over 1 year
Primary Funds Inflow Upon $ 228,213,813 $ 41,181,989 $ 25,627,611 $ 22,981,537 $ 29,621,620 $ 108,801,056Maturity
268,800,657 37,497,102 47,064,253 43,128,486 71,112,383 69,998,433Primary Funds Outflow Upon Maturity(40,586,844) 3,684,887 (21,436,642) (20,146,949) (41,490,763) 38,802,623Capital Gap
December 31, 2007
(Expressed in NT$ Thousands)
Remaining Period to Maturity Total
1-30 days 31-90 days 91-180 days 181 days – 1 year Over 1 year Primary Funds Inflow Upon Maturity
$237,211,215 $51,754,295 $6,769,751 $8,667,451 $8,792,311 $161,227,407
Primary Funds Outflow Upon Maturity
250,613,501 37,855,142 39,618,082 40,567,568 43,624,808 88,947,901
Capital Gap (13,402,286) 13,899,153 (32,848,331) (31,900,117) (34,832,497) 72,279,506
Note: The amounts listed above include accounts in NT dollars only (i.e., excluding foreign
currency) for both head office and domestic branches.
Structure Analysis of the Maturation of USD
December 31, 2008
(Expressed in UST$ Thousands)
Remaining Period to Maturity Total 1-30 days 31-90 days 91-180 days 181 days – 1 year Over 1 yearPrimary Funds Inflow Upon Maturity $312,565 $182,918 $29,252 $23,746 $13,719 $62,930
Primary Funds Outflow Upon Maturity 290,481 192,902 55,469 48,286 25,991 (32,167)
Capital Gap 22,084 (9,984) (26,217) (24,540) (12,272) 95,097
December 31, 2007 (Expressed in US$ Thousands)
Remaining Period to Maturity Total 181 days –
1 year 1-30 days 31-90 days 91-180 days Over 1 year
Primary Funds Inflow Upon Maturity
$338,002 $132,247 $50,983 $64,885 $4,247 $85,640
Primary Funds Outflow Upon Maturity
313,358 199,177 41,382 48,601 23,236 962
24,644 (66,930) 9,601 16,284 (18,989) 84,678Capital Gap
Note 1: The table includes only assets and liabilities denominated in USD held in head
quarter, the domestic branches and OBU. Unless otherwise specified, please report at
94

the book value. Un-recorded sections does not require reporting (such as planned
issuance of convertible C.D, bonds or stocks)
Note 2: If offshore assets account for more than 10% of total assets of the Bank,
supplementary disclosure should be provided.
The Content and Amount of Trust Services Engaged in According to Trust Enterprise Act
Trust Balance Sheet
December 31, 2008 Trust Assets Trust Liabilities
$ 186,159 Securities Under Custody For Customers Payable
$ 16,379,493 Bank Deposit
Trust Capital Short-term Investment 17,073,903 19,660,154 Money Trust Fund Investment 2,097,313 1,692,265 Real Estate TrustBond Investment 1,239,303 1,239,303 Negotiable
Securities Trust Stock Investment
Accumulated Profit or Loss Real Estate -
1,549,672 168,660 Principal Accumulated Profit or Loss
Land
Securities Under Custody For Customers
16,379,493 ( 614,032
Profit/Loss This Year )
$ 38,525,843 $ 38,525,843
Trust Property Catalogue
December 31, 2008
Investment Item Accounting Amount Bank Deposit
Due from our Bank $ 186,159 Short-term Investment -
Fund Investment - NTD Trust $ 12,063,883 - Foreign
Currency Trust
4,997,020
- Pre-need Contract Trust
13,000
Bond Investment - NTD Trust 115,755 - Foreign
Currency Trust
1,981,558
Stock Investment 1,239,303 20,410,519
Real Estate - Land 1,549,672 Securities Under Custody For Customers
16,379,493
$ 38,525,843
95

Trust Income Statement
Year 2008
Investment Item Accounting Amount Trust Income Interest $ 4,130 Dividend 713,556 Gain on Sale of Properties 179,468 Realized capital gain 41,673 $ 938,827
Trust Expenses Administrative Expenses 9,756
Tax 71,153 Interest 113 Commission 5,965 Loss on Sale of Properties 1,465,657 Realized Exchange Loss 215 1,552,859
($ 614,032 ) Note: The above Income Statement represents the income of trusted assets in Trust Department
of the Bank and is not included in income of the Bank.
Trust Balance Sheet
December 31, 2007
Trust Assets Trust Liabilities Bank Deposit $ 410,931 Other Liabilities $ - Short-term Investment
Trust Capital
Fund Investment
19,017,640 Money Trust 21,223,149
Bond Investment
1,495,915 Real Estate Trust
2,307,402
1,267,403 Negotiable Securities Trust
1,267,403 Stock Investment
Accumulated Profit or Loss
Real Estate-
Land 2,232,985 Principal Accumulated Profit or Loss
( 1,718,754 )
Profit/Loss This Year
1,345,674
$ 24,424,874 $ 24,424,874
96

Trust Property Catalogue
December 31, 2007
Investment Item Accounting Amount Bank Deposit
Due from our Bank $ 410,931 Short-term Investment - Fund Investment - NTD Trust $ 13,429,587 - Foreign
Currency Trust
5,585,053
- Pre-need Contract Trust
3,000
Bond Investment - NTD Trust 501,157 - Foreign
Currency Trust
994,758
Stock Investment 1,267,403 21,780,958
Real Estate - Land 2,232,985
$ 24,424,874
Trust Income Statement
Year 2007
Investment Item Accounting Amount Trust Income Interest $ 3,685
Rent 67,682 Dividend 656,025 Gain on Sale of Properties 901,543 Realized capital gain 59,773 $ 1,688,708
Trust Expenses Administrative Expenses 95,569
Tax 38,678 Interest 715 Commission 6,102 Loss on Sale of Properties 192,552 Income Tax 498 Other Expenses 8,920 343,034
$ 1,345,674 Note: The above Income Statement represents the income of trusted assets in Trust
Department of the Bank and is not included in income of the Bank.
34.Disclosures Under Statutory Requirements Other than Table 1-2, no other information should be disclosed.
97

35.Financial Information by Department Industry information The business which Sunny Bank Ltd. operates belongs to single industry in accordance with the Banking Law.
Regional information Until the end of 2008, The Bank has not established overseas operating departments.
Admission to export information Until the end of 2008, the bank doesn't have export admission.
Major customers The banks do not have net income exceeds Admission Interests of over 10% from a single client.
98

Sunny Bank Ltd.
Information on Invested Enterprises
Year 2008
Table 1
Unit: NT$ Thousands
Consolidated Holdings by the Bank and Affiliated Enterprises (Note 2)
Total Holding
at the Year End
Yearly Income
for Investee
Company
Yearly Recognized
Invested Income
Conjectural share
holding
Current Share
Holding
Major Business
Items
Par Value
Invested Company
Investee Company Location RemarkShares
Percentage ( 1,000 shares)
(%) (1,000 shares)
(1,000 shares)
(%)
Sunny Securities Co.,
Our Bank
Taipei City
Securities Investment Subsidiaries97.7 $207,517 ($18,465) 29,500 - 29,500 97.7
($18,903)Ltd.
Financial Institution Creditor's Right (Money) Appraisal and Auction
Gold Sunny Assets Taipei
City Subsidiaries100.0 19,258 (17,386) (17,386) 5,000 - 5,000 100.0Management Co., Ltd.
Sunny Life Insurance Life
Insurance Brokerage
Agent Co., Ltd.
Taipei City
2,500 Subsidiaries1,500 - 1,500 99.939.9 10,228 5,085 (Note 1)
Sunny Property Insurance Brokerage Co., Ltd.
Property Insurance Brokerage
Taipei City Subsidiaries20.0 1,557 1,000 200 605 - 605 100.0
Company Invested atEquity Method
Securities Investment Trust Services
Ontario Securities Investment Trust
Taipei City
20.0 38,762 (31,748) - 6,006 - 6,006 20.0
Note 1: Including investment gains at NT$2,033,000, the amortization of the difference between investment cost and net equity at
NT$467,000. Note 2: Current or Conjectural share holdings of invested enterprises by the Bank, directors, supervisors, presidents, vice presidents
and affiliated enterprises in conformity of the definition of Company Law are incorporated.
99
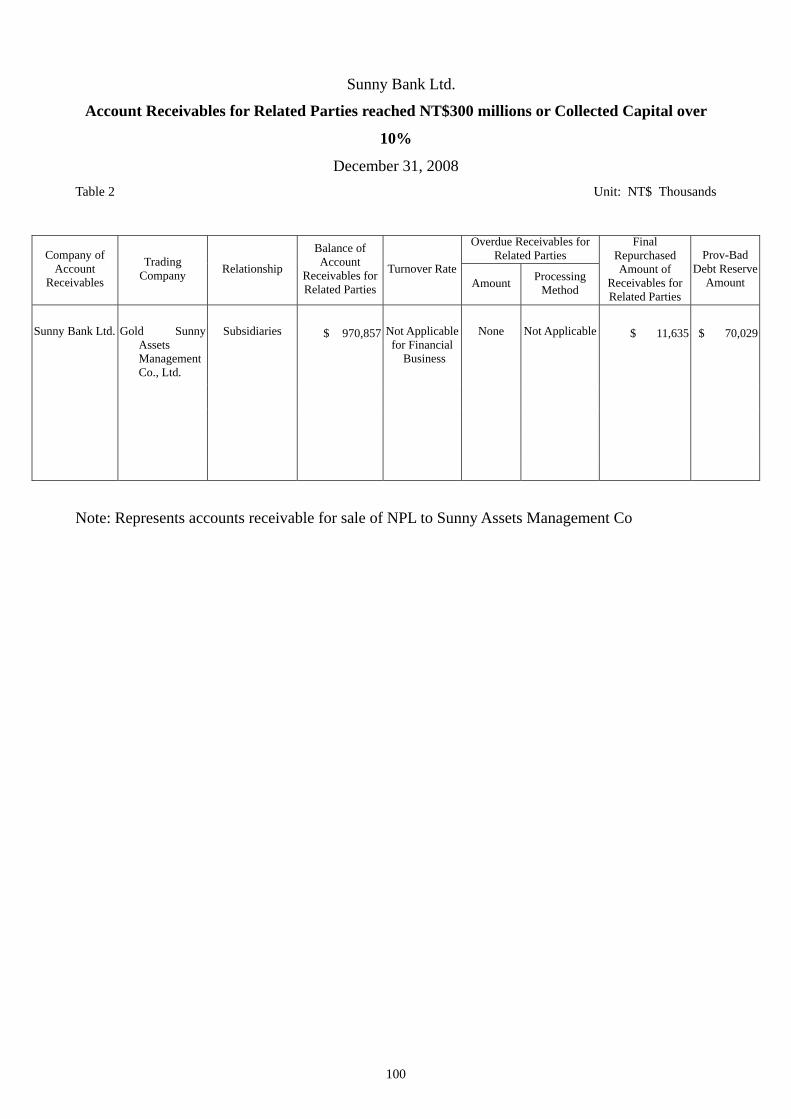
Sunny Bank Ltd.
Account Receivables for Related Parties reached NT$300 millions or Collected Capital over
10%
December 31, 2008 Table 2 Unit: NT$ Thousands
Overdue Receivables for
Related Parties Final
Repurchased Amount of
Receivables for Related Parties
Balance of Account
Receivables for Related Parties
Company of Account
Receivables
Prov-Bad Debt Reserve
Amount
Trading Company Turnover RateRelationship Processing
Method Amount
Sunny Bank Ltd. Gold Sunny
Assets Management Co., Ltd.
Subsidiaries Not Applicable for Financial
Business
None Not Applicable $ 970,857 $ 11,635 $ 70,029
Note: Represents accounts receivable for sale of NPL to Sunny Assets Management Co
100
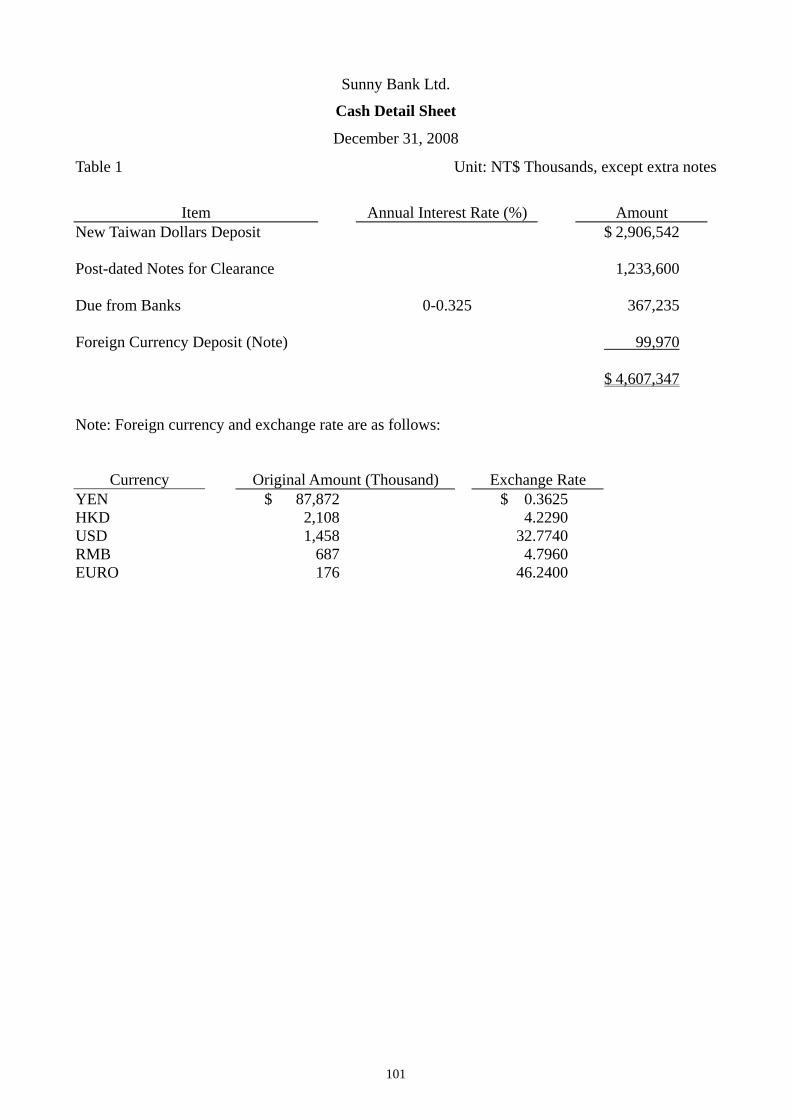
Sunny Bank Ltd.
Cash Detail Sheet
December 31, 2008
Table 1 Unit: NT$ Thousands, except extra notes
Item Annual Interest Rate (%) Amount New Taiwan Dollars Deposit $ 2,906,542 Post-dated Notes for Clearance 1,233,600 Due from Banks 0-0.325 367,235 Foreign Currency Deposit (Note) 99,970
$ 4,607,347
Note: Foreign currency and exchange rate are as follows:
Currency Original Amount (Thousand) Exchange Rate YEN $ 87,872 $ 0.3625
HKD 2,108 4.2290 USD 1,458 32.7740
RMB 687 4.7960 EURO 176 46.2400
101
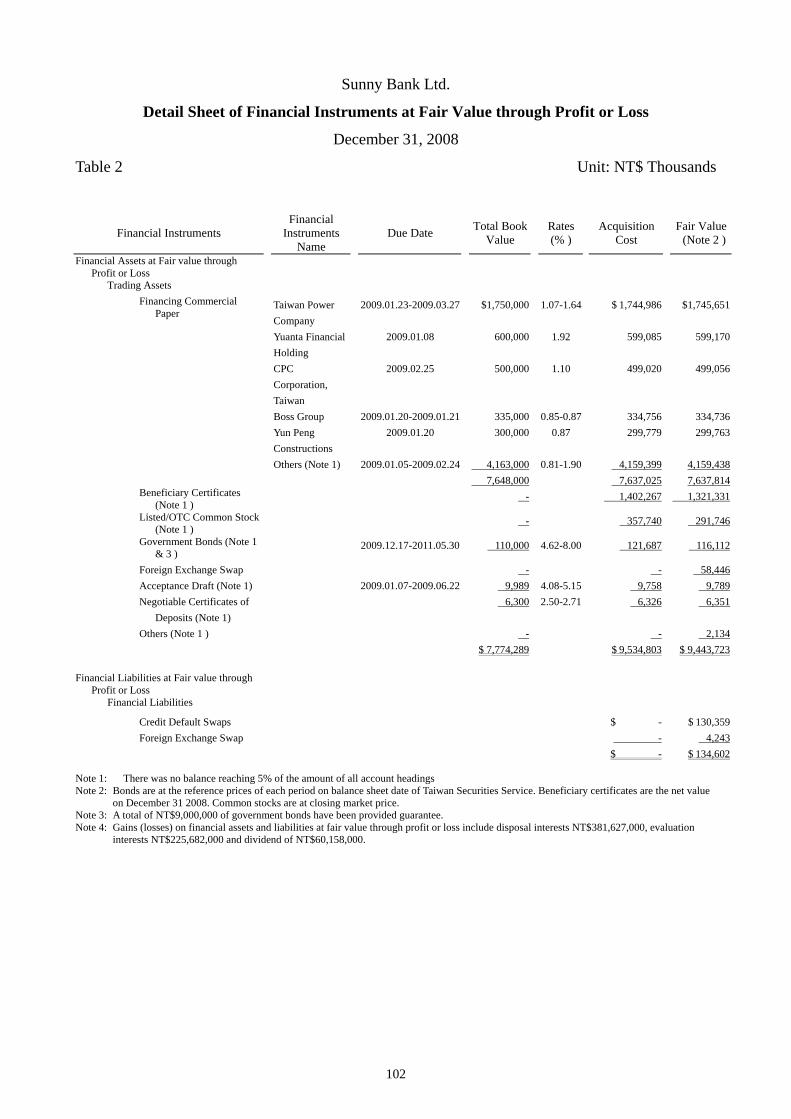
Sunny Bank Ltd.
Detail Sheet of Financial Instruments at Fair Value through Profit or Loss
December 31, 2008
Table 2 Unit: NT$ Thousands
Financial
Instruments Name
Total Book Value
Rates (% )
Acquisition Cost
Fair Value (Note 2 )Financial Instruments Due Date
Financial Assets at Fair value through Profit or Loss
Trading Assets Financing Commercial
Paper Taiwan Power
Company 2009.01.23-2009.03.27 $1,750,000 1.07-1.64 $ 1,744,986 $1,745,651
Yuanta Financial Holding
2009.01.08 600,000 1.92 599,085 599,170
CPC Corporation, Taiwan
2009.02.25 500,000 1.10 499,020 499,056
Boss Group 2009.01.20-2009.01.21 335,000 0.85-0.87 334,756 334,736 Yun Peng
Constructions 2009.01.20 300,000 0.87 299,779 299,763
4,163,000 0.81-1.90 4,159,399 4,159,438 Others (Note 1) 2009.01.05-2009.02.24 7,648,000 7,637,025 7,637,814
Beneficiary Certificates (Note 1 )
- 1,402,267 1,321,331
Listed/OTC Common Stock (Note 1 )
- 357,740 291,746
Government Bonds (Note 1 & 3 )
110,000 4.62-8.00 121,687 116,112 2009.12.17-2011.05.30
Foreign Exchange Swap - - 58,446Acceptance Draft (Note 1) 2009.01.07-2009.06.22 9,989 4.08-5.15 9,758 9,789Negotiable Certificates of
Deposits (Note 1) 6,300 2.50-2.71 6,326 6,351
Others (Note 1 ) - - 2,134 $ 7,774,289 $ 9,534,803 $ 9,443,723
Financial Liabilities at Fair value through
Profit or Loss
Financial Liabilities Credit Default Swaps $ - $ 130,359
- 4,243Foreign Exchange Swap $ - $ 134,602
Note 1: There was no balance reaching 5% of the amount of all account headings Note 2: Bonds are at the reference prices of each period on balance sheet date of Taiwan Securities Service. Beneficiary certificates are the net value
on December 31 2008. Common stocks are at closing market price. Note 3: A total of NT$9,000,000 of government bonds have been provided guarantee. Note 4: Gains (losses) on financial assets and liabilities at fair value through profit or loss include disposal interests NT$381,627,000, evaluation
interests NT$225,682,000 and dividend of NT$60,158,000.
102

103
Sunny Bank Ltd.
Detail Sheet of Available-for-sale Financial Asset
December 31, 2008 Table 3 Unit: Apart from price is NTD, others are in NT$ Thousands
Abstract Fair Value (Note 2 )
Financial Instruments
Name of Financial Instruments
Value Date Due date Book
Value Rates (%)
Acquisition Cost
Evaluation Adjustment
Unit Price Total Amount Note
Commercial Paper II
Asia Cement 2009.03.11 $300,000 1.87 $298,592 $347 $298,939
GEM Terminal Industry
2009.03.27 250,000 1.92-2.01 248,809 2,671 251,480
Far Eastern Department Store
2009.01.23 200,000 2.00 199,079 2,395 201,474
Fortune Motors 2009.01.16 140,000 2.09-2.23 139,241 1,850 141,091 President
Securities 2009.01.05-2009.02.23 450,000 1.12-2.50 448,520 1,033 449,553
Hanping Electronics
2009.03.23 40,000 2.03 39,802 899 40,701
1,380,000 1,374,043 9,195 1,383,238 Commercial Paper II
Special Purpose Trust of Taishin Bond Assets 2009.02.13-2009.02.24 1,207,000 2.02-2.24 1,200,617 12,252 1,212,869
Corporate Bonds
2004 Yangming 2B
10.11 2011.10.11 200,000 3.30 201,294 (27) 201,267
2006 Formosa Petrochemical 4
10.20 2011.10.20 200,000 2.09 199,904 936 200,840
2005 Nan Ya Technology 3
12.19 2010.12.19 150,000 2.25 150,198 (448) 149,750
Yangming Marine (The 13th in 2006)
10.23 2011.10.23 100,000 2.09 100,014 (1,426) 98,588
2007 Nan Ya Technology 1
05.31 2012.05.31 50,000 2.29 49,939 (649) 49,290
2006 Inotera Memories, Inc. 2
01.05 2012.01.05 50,000 2.23 49,965 (763) 49,202
Yangming Marine Transportation
11.23 2012.11.23 30,000 6.02 32,631 (1) 32,630
780,000 783,945 (2,378) 781,567 Government Bonds (Note 3)
Central Government Bonds A – Jan. 2006
01.06 2011.01.06 200,000 1.75 200,035 2,140 $101.0891 202,175
Central Government Bonds B – Jan. 1998 (Note 3)
02.20 2013.02.20 100,000 6.88 111,002 9,607 120.6221 120,609
Central Government Bonds A – Jun. 2001
08.07 2016.08.07 100,000 3.75 111,441 3,895 115.3413 115,336
Central Government Bonds A – Jun. 2005
07.20 2010.07.20 50,000 2.00 50,187 576 101.5279 50,763
Others 01.22 2019.01.22 5,800 5.25 5,768 1,244 120.9082 7,012 Note 1 455,800 478,433 17,462 495,895 Beneficiary Securities
Sungchiang Real Estate Trust of Shin Kong Life Insurance
08.08;
02.08 2013.08.08 46,745 2.21 46,745 3,283 50,028
Others - 54,944 (204) 54,740 Note 1 $3,869,545 $3,938,727 $39,610 $3,978,337 Note 1: There was no balance reaching 5% of the amount of all account headings. Note 2: Bonds are at the reference prices of each period of Taiwan Securities Service on December 31 2008. Note 3: A total NT$310,300,000 of government bonds have been provided guarantee.

Sunny Bank Ltd.
Detail Sheet of Equity Investment - Equity Method
Year 2008 Unit: NT$ Thousands
Table 4
Increase During This
Year Investment
Income Recognized under
Equity Method (Note 1)
Beginning Balance Ending Balance Adjusted Items of
Shareholders’ Equity (Note 2)
1,000 Shares
Holding Share %
Amount (Note 3)Name of Investee
Company 1,000 Shares Amount
1,000 Shares
Amount
Sunny Securities Co., Ltd.
29,500 $ 226,428 - $ - ($ 18,465) ($ 446) 29,500 97.7 $ 207,517
Ontario Securities Investment Trust
- - 6,006 38,762 - - 6,006 20.0 38,762
Gold Sunny Assets Management Co., Ltd.
5,000 37,484 - - (17,386) (840) 5,000 100.0 19,258 Sunny Life Insurance Brokerage Co., Ltd.
(former name Yin Lien Life Insurance Agent Co., Ltd.) 600 8,033 - - 2,500 (305) 600 39.9 10,228 Sunny Property Insurance Brokerage
Co., Ltd. (former name: Yin Lien Property Insurance Brokerage Co., Ltd.) 1,777 - - 200 (420121 ) 121 20.0 1,557 $ 273,722 $ 38,762 ($ 33,151) ($ 2,011) $ 277,322
Note 1: Calculated according to the financial statements of the same period audited by CPAs for invested companies.
Note 2: Unrealized loss for Available for Sale Financial Asset
Note 3: Not provided as pledge or collateral.
104

105
Sunny Bank Ltd.
Detail Sheet of Fixed Assets Change
Year 2008 Table 5 Unit: NT$ Thousands
Item Beginning Balance Increasing Decreasing Reclassification (Note) Ending Balance
Cost Land $ 6,705,460 $ - $ 18 ($ 69,073 ) $ 6,636,369House and Building 2,837,183 - 1,514 24,110 2,859,779Miscellaneous Equipment
1,298,334 15,479 39,780 52,114 1,326,147
10,840,977 15,479 41,312 7,151 10,822,295
Revaluation Increment
Land 161,211 139,520 18,875 - 281,856House and Building 21,836 - 1,660 - 20,176
183,047 139,520 20,535 - 302,032
Cost and Revaluation Increment
11,024,024 $ 154,999 $ 61,847 $ 7,151 11,124,327
Less: Accumulated Depreciation
House and Building 718,422 $ 68,247 $ 2,976 ($ 13,910 ) 769,783Miscellaneous Equipment
945,324 123,020 39,185 - 1,029,159
1,663,746 $ 191,267 $ 42,161 ($ 13,910 ) 1,798,942
9,360,278 9,325,385
Construction in Process 139,953 $ 73,150 $ - ($ 169,145 ) 43,958
$ 9,500,231 $ 9,369,343
Note: The net value reclassified to Idle Asset amounted to NT$ 148,084,000.

Sunny Bank Ltd.
Detail Sheet of Payables
December 31, 2008
Table 6 Unit: NT$ Thousands
Item Amount Spot Exchange Payable $ 2,208,874 Post-dated Notes for Clearance Payable 1,233,600 Interest Payable 799,339 Others (Note) 586,947
$ 4,828,760
Note: There was no balance reaching 5% of the amount of all account headings.
106
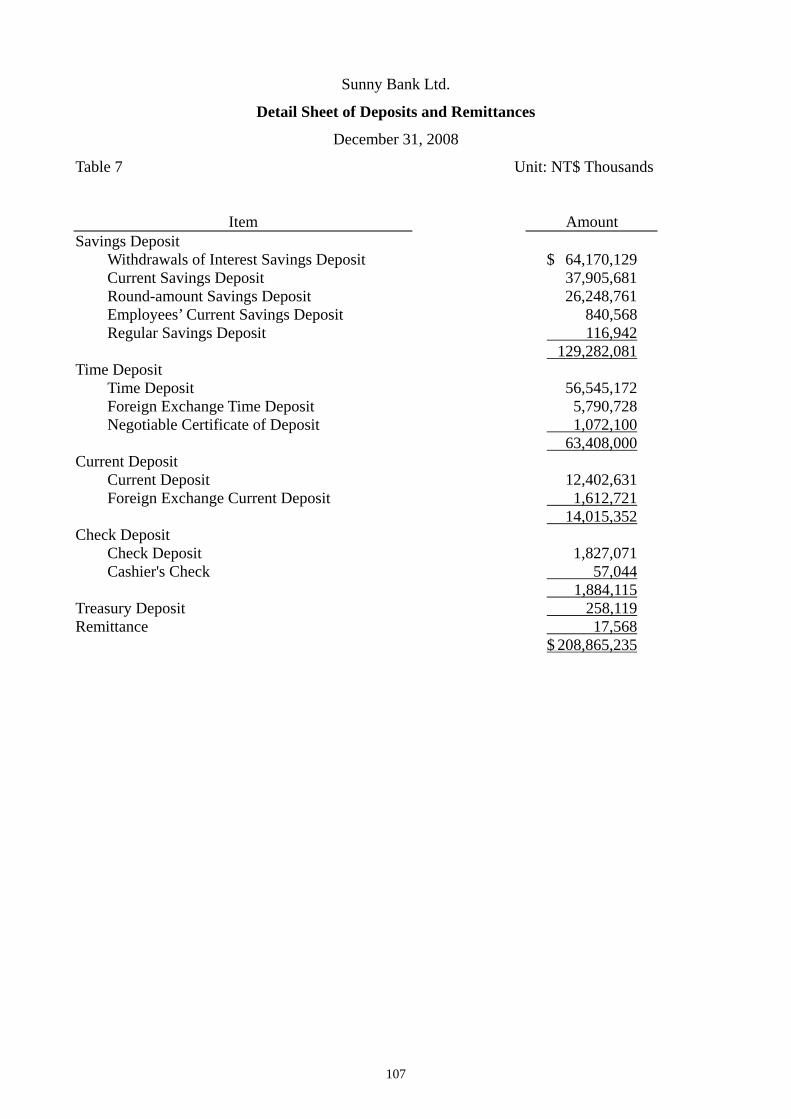
Sunny Bank Ltd.
Detail Sheet of Deposits and Remittances
December 31, 2008
Table 7 Unit: NT$ Thousands
Item Amount Savings Deposit
Withdrawals of Interest Savings Deposit $ 64,170,129 Current Savings Deposit 37,905,681 Round-amount Savings Deposit 26,248,761 Employees’ Current Savings Deposit 840,568
116,942Regular Savings Deposit
129,282,081
Time Deposit Time Deposit 56,545,172 Foreign Exchange Time Deposit 5,790,728
1,072,100Negotiable Certificate of Deposit
63,408,000
Current Deposit Current Deposit 12,402,631 Foreign Exchange Current Deposit 1,612,721
14,015,352
Check Deposit Check Deposit 1,827,071 Cashier's Check 57,044
1,884,115
Treasury Deposit 258,119
Remittance 17,568
$ 208,865,235
107

Sunny Bank Ltd.
Detail Sheet of Financial bonds Payable
December 31, 2008
Table 8 Unit: NT$ Thousands
Interest Rates
(%) Total Issued
Amount Title Issuance Period Term of principal repayment
The First Subordinated Financial Debentures in 2006
From May 16, 2006 to Nov. 16, 2011
Total payback at maturity. Annual payment of interest at the single interest rate.
2.55 $ 2,000,000
The First Type A Bond Subordinated Financial Debentures in 2007
From Apr. 9, 2007 to Apr. 9, 2014
Total payback at maturity. Annual payment of interest at the single interest rate
3.00 1,800,000
The First Type B Bond Subordinated Financial Debentures in 2007
From Apr. 9, 2007 to Apr. 9, 2014
Total payback at maturity. Floating interest rates according to the listed floating interest rates of general deposit for one-year CD in Bank of Taiwan with a quarterly resetting and annual interest payment.
3.26 1,100,000
The Second Type A Bond Subordinated Financial Debentures in 2007
From Nov. 16, 2007 to May. 16, 2013
Total payback at maturity. Annual payment of interest at the single interest rate
3.60 203,500
The Second Type B Bond Subordinated Financial Debentures in 2007
From Nov. 16, 2007 to May. 16, 2013
Total payback at maturity. Floating interest rates according to the listed floating interest rates of general deposit for one-year CD in Bank of Taiwan with a quarterly resetting and annual interest payment.
2.96 101,000
The Second Type B Bond Subordinated Financial Debentures in 2007
From Dec. 26, 2007 to Feb. 26, 2014
Total payback at maturity. Annual payment of interest at the single interest rate
3.80 261,000
43,900The Third Type B Bond Subordinated Financial Debentures in 2007
From Dec. 26, 2007 to Feb. 26, 2014
Total payback at maturity. Floating interest rates according to the listed floating interest rates of general deposit for one-year CD in Bank of Taiwan with a quarterly resetting and annual interest payment.
2.51
$ 5,509,400
108

Sunny Bank Ltd.
Detail Sheet of Interest Income
Year 2008
Table 9 Unit: NT$ Thousands
Item Amount Loan Interest
Short-term $ 1,057,989 Middle-term 1,239,106 Long-term 3,449,730 Overdraft Interest 152,512
5,899,337
Financial Assets Interest 535,111
Credit Card Circulation Interest 120,945
Inter-bank Offered Interest
Transferred Deposit Interests 249,180 Reserve Interest 94,654 Interbank Interest 32,240 Deposit Interest 103
376,177
Foreign Exchange Interest 284,063
Others 94,007
$ 7,309,640
109

Sunny Bank Ltd.
Detail Sheet of Interest Expense
Year 2008
Table 10 Unit: NT$ Thousands
Item Amount Deposit Interest
Withdrawals of Interest Savings Deposit $ 1,630,769 Time Deposit 1,616,197 Round-amount & Regular Savings
Deposit 617,102
Current Savings Deposit 182,832 Negotiable Certificate of Deposit 60,316 Employees’ Current Savings Deposit 67,678 Current Deposit 37,623 Treasury Deposit 2,021
4,214,538
Inter-bank Offered Interest
Deposit Transfers from Post Office 72,674 Call Loans from Banks 19,760 Due to Banks 132,532
224,966
Financial Bond Deposit 177,290
Notes and Bonds Issued under Repurchase
Agreement 35,428
Others 233
$ 4,652,455
110

Sunny Bank Ltd.
Detail Sheet of Net profit from Commission
Year 2008
Table11 Unit: NT$ Thousands
Item Amount Commission Interest
Trust Business $ 188,244 Loan Business 120,783 Agency Business 112,117 Credit Card Business 69,776 Guaranty Fee 33,769 Inter-bank Business 30,911 Other (Note) 70,200
625,800
Commission Expenditure
Credit Card Business 28,307 Inter-bank Business 14,518 Trust Business 10,504 Loan Business 6,267 Agency Business 6,116 Foreign Exchange Business 4,717 Other (Note) 8,653
79,082
Net profit from Commission $ 546,718
Note: There was no balance reaching 5% of the amount of all account headings.
111

Sunny Bank Ltd.
Detail Sheet of Operating Expense
Year 2008
Table 12 Unit: NT$ Thousands
Item Amount Payroll and Bonus $ 1,581,602 Tax 243,044 Depreciation 193,011 Insurance Premium 113,628 Pension 84,511 Amortization 21,904 Others (Note) 651,389
$ 2,889,089
Note: There was no balance reaching 5% of the amount of its according account headings.
112

5. Consolidated Financial Statement of Recent Year
Representation of Consolidated Financial Statement
The consolidated entities within the Consolidated Financial Statement of Affiliated Enterprises in
accordance with the Criteria Governing Preparation of Affiliation Report, Consolidated Business
Reports and Consolidated Financial Statements of Affiliated Enterprises are identical to the entities
within the consolidated financial statement in accordance with Statement of IAS 7 “Consolidated
Financial Statements”. All information should be disclosed in the Consolidated Financial Statement
of Affiliated Enterprises is disclosed in the consolidated financial statement in accordance with IAS
7 “Consolidated Financial Statements”. Consequently, Sunny Bank Ltd. would not prepare the
Consolidated Financial Statement of Affiliated Enterprises separately.
Sunny Bank Ltd.
Chairman Chen, Sheng-Hung
March 12 2009
113

Independent Auditor’s Report
To: Sunny Bank Ltd.:
We have audited the accompanied Consolidated Balance Sheet of Sunny Bank and its affiliated
enterprises as of December 31, 2008 and 2007, and the related Consolidated Income Statement,
Consolidated Statements of Changes in Shareholders’ Equity, and Consolidated Cash Flow
Statement for from January 1 to December 31 in 2008 and 2007. These financial statements are
the responsibility of the Bank’s management. Our responsibility is to express an opinion on these
financial statements based on our audits.
We conducted our audits in accordance with the Rules Governing the Audit of Financial
Statements by Certified Public Accountants and auditing standards generally accepted in the
Republic of China. Those rules and standards require that we plan and perform the audit to obtain
reasonable assurance about whether the financial statements are free of material misstatement. An
audit includes examining, on a test basis, evidence supporting the amounts and disclosures in the
consolidated financial statements. An audit also includes assessing the accounting principles used
and significant estimates made by management, as well as evaluating the overall consolidated
financial statement presentation. We believe that our audits and the report of the other auditor
provide a reasonable basis for our opinion.
As described in Note 26 attached to the Financial Statements, Sunny Bank Ltd., with in 2007
and 2006, sold Non-Performing Loans to asset management corporations and thus generated loss of
NT$ 967,884,000. According to the “Financial Institution Merger Law”, the loss could be deferred
and amortized through 5 years. Unamortized balance is listed in “Other assets – Loss of
non-recognized sale of liability” and thus inconsistent with generally accepted accounting principles.
If the sale of the said loss were not deferred, then other assets – Loss of non-recognized sale of
liability on December 31, 2008 and 2007 should be reduced by NT$585,954,000 and
NT$779,531,000 respectively. Also, net loss for 2008 and 2007 should be reduced NT$
193,577,000 and added NT$ 7,765,000.
114

In our opinions, except for Loss of sale of liability not being fully recognized in that year
pursuant to GAAP, the financial statements referred to in the first paragraph present fairly, in all
material respects, the financial position of Sunny Bank and its subsidiaries as of December 31, 2008
and 2007, and the results of its consolidated operations and cash flows for the years then ended, in
conformity with the Criteria Governing the Preparation of Financial Reports by Public Banks,
Guidelines Governing the Preparation of Financial Reports by Securities Issuers, Business
Accounting Law and Regulation on Business Entity Accounting Handling and accounting
principles generally accepted in the Republic of China.
Deloitte & Touche Taiwan C.P.A. - Shao, Chih-Ming C.P.A. - Kuo, Cheng-Hung
Shao, Chih-Ming (with signature) Kuo, Cheng-Hung (with signature)
Securities And Futures Commission, Ministry of Finance
Securities And Futures Commission, Ministry of Finance
Approval File No.: Approval File No.: Tai-tsai-tseng-6-tzu-ti No. 0930128050 Tai-tsai-tseng-6-tzu-ti No. 0920123784
MRCH 12, 2009
115
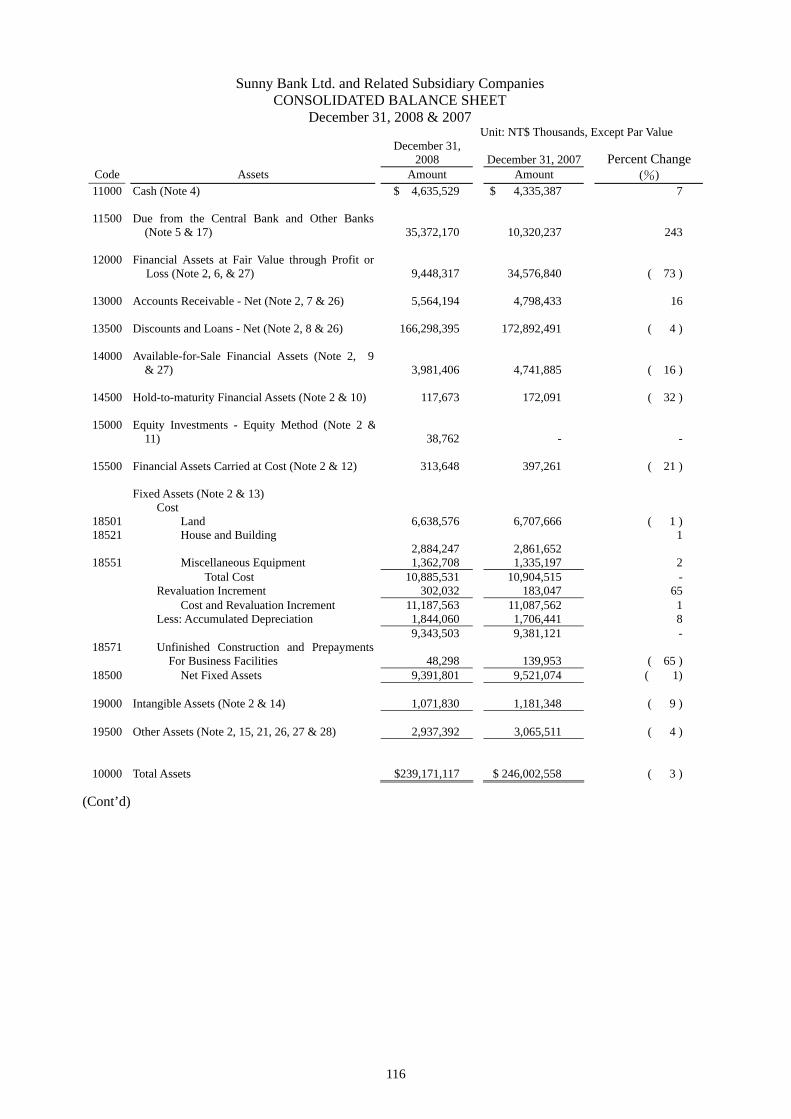
Sunny Bank Ltd. and Related Subsidiary Companies CONSOLIDATED BALANCE SHEET
December 31, 2008 & 2007 Unit: NT$ Thousands, Except Par Value
December 31, 2008 Percent Change December 31, 2007
Code Assets Amount Amount (%) 11000 Cash (Note 4) $ 4,635,529 $ 4,335,387 7
11500 Due from the Central Bank and Other Banks
(Note 5 & 17) 35,372,170 10,320,237 243
12000 Financial Assets at Fair Value through Profit or Loss (Note 2, 6, & 27) 9,448,317 34,576,840 ( 73 )
13000 Accounts Receivable - Net (Note 2, 7 & 26) 5,564,194 4,798,433 16
13500 Discounts and Loans - Net (Note 2, 8 & 26) 166,298,395 172,892,491 ( 4 )
14000 Available-for-Sale Financial Assets (Note 2, 9
& 27) 3,981,406 4,741,885 ( 16 )
14500 Hold-to-maturity Financial Assets (Note 2 & 10) 117,673 172,091 ( 32 )
15000 Equity Investments - Equity Method (Note 2 &11) 38,762 - -
15500 Financial Assets Carried at Cost (Note 2 & 12) 313,648 397,261 ( 21 )
Fixed Assets (Note 2 & 13) Cost
18501 Land 6,638,576 6,707,666 ( 1 ) 18521 House and Building 1
2,884,247 2,861,652 18551 Miscellaneous Equipment 1,362,708 1,335,197 2
Total Cost 10,885,531 10,904,515 - Revaluation Increment 302,032 183,047 65 Cost and Revaluation Increment 11,187,563 11,087,562 1 Less: Accumulated Depreciation 1,844,060 1,706,441 8 9,343,503 9,381,121 -
18571 Unfinished Construction and Prepayments For Business Facilities 48,298 139,953 ( 65 )
18500 Net Fixed Assets 9,391,801 9,521,074 ( 1)
19000 Intangible Assets (Note 2 & 14) 1,071,830 1,181,348 ( 9 )
19500 Other Assets (Note 2, 15, 21, 26, 27 & 28) 2,937,392 3,065,511 ( 4 )
10000 Total Assets $239,171,117 $ 246,002,558 ( 3 )
(Cont’d)
116
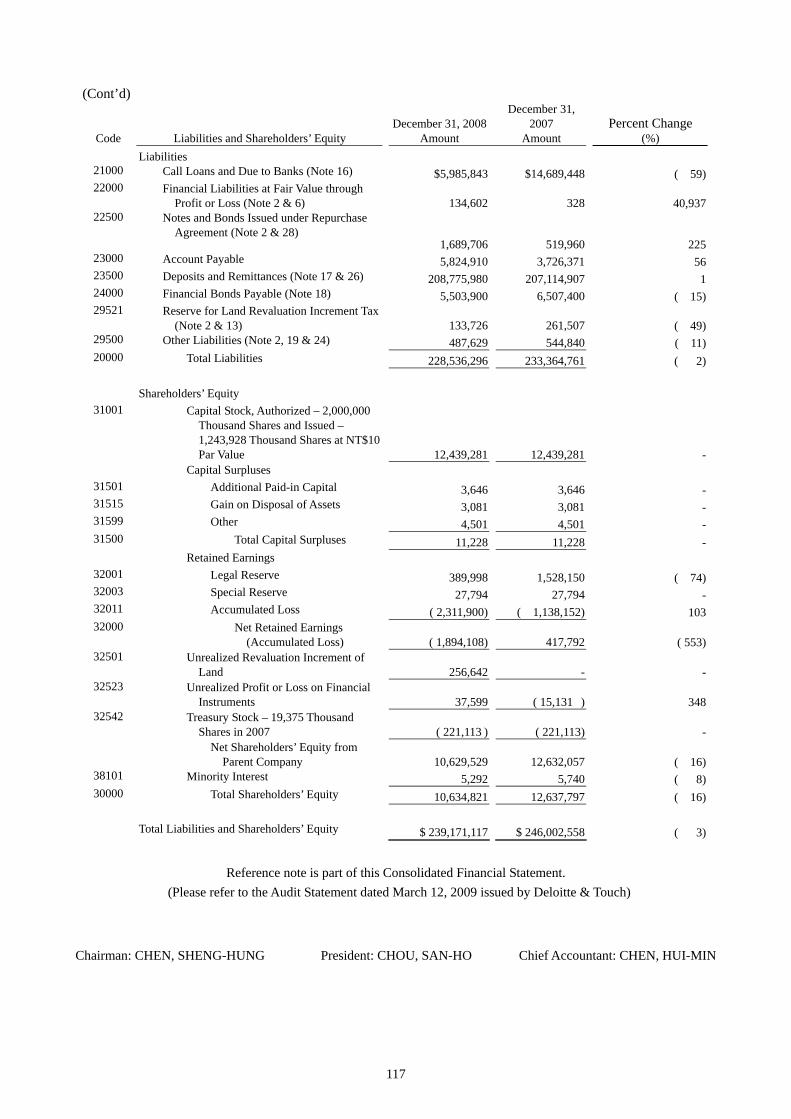
(Cont’d) December 31,
2007 Percent Change December 31, 2008 Code Liabilities and Shareholders’ Equity Amount Amount (%)
Liabilities 21000 Call Loans and Due to Banks (Note 16) $5,985,843 $14,689,448 ( 59)22000 Financial Liabilities at Fair Value through
Profit or Loss (Note 2 & 6) 134,602 328 40,93722500
519,960
Notes and Bonds Issued under Repurchase Agreement (Note 2 & 28)
225 1,689,70623000 Account Payable 5,824,910 3,726,371 5623500 Deposits and Remittances (Note 17 & 26) 208,775,980 207,114,907 124000 Financial Bonds Payable (Note 18) 5,503,900 6,507,400 ( 15)29521 Reserve for Land Revaluation Increment Tax
(Note 2 & 13) 133,726 261,507 ( 49)29500 Other Liabilities (Note 2, 19 & 24) 487,629 544,840 ( 11)20000 Total Liabilities 228,536,296 233,364,761 ( 2)
Shareholders’ Equity
31001 Capital Stock, Authorized – 2,000,000 Thousand Shares and Issued – 1,243,928 Thousand Shares at NT$10 Par Value
12,439,281 12,439,281 - Capital Surpluses
31501 Additional Paid-in Capital 3,646 3,646 -31515 Gain on Disposal of Assets 3,081 3,081 -31599 Other 4,501 4,501 -31500 Total Capital Surpluses 11,228 11,228 -
Retained Earnings 32001 Legal Reserve 389,998 1,528,150 ( 74)32003 Special Reserve 27,794 27,794 -32011 Accumulated Loss ( 2,311,900) ( 1,138,152) 10332000 Net Retained Earnings
(Accumulated Loss) ( 1,894,108) 417,792 ( 553)32501 Unrealized Revaluation Increment of
Land 256,642 - -32523 Unrealized Profit or Loss on Financial
Instruments 37,599 ( 15,131 ) 34832542 Treasury Stock – 19,375 Thousand
Shares in 2007 ( 221,113 ) ( 221,113) - Net Shareholders’ Equity from
Parent Company 10,629,529 12,632,057 ( 16)38101 Minority Interest 5,292 5,740 ( 8)30000 Total Shareholders’ Equity 10,634,821 12,637,797 ( 16)
Total Liabilities and Shareholders’ Equity $ 239,171,117 $ 246,002,558 ( 3)
Reference note is part of this Consolidated Financial Statement.
(Please refer to the Audit Statement dated March 12, 2009 issued by Deloitte & Touch)
Chairman: CHEN, SHENG-HUNG President: CHOU, SAN-HO Chief Accountant: CHEN, HUI-MIN
117

118
Sunny Bank Ltd. and Related Subsidiary Companies CONSOLIDATED INCOME STATEMENTS
January 1 to December 31, 2008 & 2007
Unit: NT$ Thousands, Except Earnings/ Losses per Share in NT$
Year 2008 Year 2007 Code Amount Amount
Percent Change (%)
41000 Interest Income (Note 2 & 26) $ 7,309,640 $ 7,452,962 ( 2 ) 51000 Interest Expense (Note 26) 4,652,186 4,241,734 10
Net Interest Profit 2,657,454 3,211,228 ( 17 )
Net Non-interest Profit (Loss)
49100 Net Non-interest Profit (Loss) 499,547 783,267 ( 36 ) 49200 Net Income (Loss) for Financial Assets and
Liabilities at Fair Value through Profit or Loss. (Note 6)
( 557,429 ) 241,231 ( 331 )
49600 Net Exchange Profit (Loss) ( 16,675 ) 5,839 ( 386 ) 48005 Financial Assets Measured at Cost (Note 2) 25,620 17,267 48 48051 Rent Income 21,287 27,697 ( 23 ) 48063 Net profit on Property Exchange 115,227 111,184 4 55000 Asset Impairment Loss (Note 2, 10, 14 &
15) ( 273,483 ) ( 183,000 ) 49 58021 NPL Disposal Loss (Note 26) ( 193,577 ) ( 175,273 ) 10 49800 Other Non-interest Net profit 202,250 103,726
95 Total Non-interest Net profit (Loss) ( 177,233 ) 931,938
( 119 ) Net profit 2,480,221 4,143,166
( 40 )
51500 Bad Debt Expense 1,942,246 2,118,614 ( 8 )
Operating Expense (Note 22 & 26)
58500 Personnel Expenses 1,905,489 2,132,279 ( 11 ) 59000 Depreciation and Amortization 219,281 209,155 5 59500 Other Operating & Management Expenses 878,022 944,717
( 7 ) Total Operating Expenses 3,002,792 3,286,151
( 9 )
61001 Net Loss before Tax of Operating Departments ( 2,464,817 ) ( 1,261,599 ) 95
61003 Income Tax Profit (Note 2 & 21) 152,479 123,892 23
69000 Consolidated Net profit Loss ( $ 2,312,338 ) ( $ 1,137,707 ) 103
Attributed to: 69601 Shareholders from Parent Company ( $ 2,311,900 ) ( $ 1,138,152 ) 103 69603 Minority Shareholders’ Interest ( 438 ) 445
( 198 ) 69600 ( $ 2,312,338 ) ( $ 1,137,707 ) 103
code 69500 Earnings Per Share Losses (Note 23) Before Tax After Tax Before Tax After Tax Basic Losses Per Share ($ 2.01) ($ 1.89) ($ 1.04) ($ 0.93)
Reference note is part of this Consolidated Financial Statement. (Please refer to the Audit Statement dated March 12, 2009 issued by Deloitte & Touch)
Chairman: CHEN, SHENG-HUNG President: CHOU, SAN-HO Chief Accountant: CHEN, HUI-MIN

119
Sunny Bank Ltd. and Related Subsidiary Companies CONSOLIDATED STATEMENT OF CHANGES IN SHAREHOLDERS’ EQUITY
January 1 to December 31, 2008 & 2007
Unit: NT$ Thousands
Issued Shares Retained Earning (Accumulated Loss) (Note 20)
1,000
shares Amount
Capital Reserves
(Note 20) Legal Reserves Special
Reserves Accumulated Loss Net Amount
Unrealized
Revaluation
Increment
of Land
( Note 2 and
13)
Financial InstrumentsUnrealized Gain or
Loss
(Note 2)
Treasury Stock
(Note 2 & 25)
Minority
Shareholding
Net Shareholders’
Equity
Balance as of
January 1, 2007 1,243,928 $ 12,439,281 $ 11,228 $1,519,508 $ - $ 36,436 $ 1,555,944 $ - $ 22,272 ( $ 217,605 ) $ 6,949 $ 13,811,120
Earnings
Appropriated in
2006
Legal Reserve - - - 8,642 - ( 8,642 ) - - - - - -
Special Reserve - - - - 27,794 ( 27,794 ) - - - - - -
Subsidiary
Holding in Parent
Stocks - - - - - - - - - ( 3,508 ) - ( 3,508 )
Change in Minority
Shareholdings - - - - - - - - - - (1,654) ( 1,654 )
Consolidated Net
Loss, 2007 - - - - - ( 1,138,152 ) ( 1,138,152 ) - - - 445 ( 1,137,707 )
Changes of
Unrealized Gains
or Losses on
Available-for-sale
Financial Assets - - - - - - - - ( 37,403 ) - - ( 37,403 )
Balance as of
December 31,
2007 1,243,928 12,439,281 11,228 1,528,150 27,794 ( 1,138,152 ) 417,792 - ( 15,131 ) ( 221,113 ) 5,740 12,632,057
Loss Cover by legal
reserve - - - ( 1,138,152 ) - 1,138,152 - - - - - -
Consolidated Net
Loss, 2008 - - - - - ( 2,311,900 ) ( 2,311,900 ) - - - ( 438) ( 2,311,900 )
Revaluation
Increment of
Land - - - - - - - 256,642 - - - 256,642
Changes of
Unrealized Gains
or Losses on
Available-for-sale
Financial Assets - - - - - - - - 52,730
- ( 10) 52,730
Balance as of
December 31,
2008 1,243,928 $ 12,439,281 $ 11,228 $ 389,998 $ 27,794 ( $ 2,311,900 ) ( $ 1,894,108 ) $ 256,642 $ 37,599 ( $ 221,113 ) $ 5,292 $ 10,629,529
Reference note is part of this Consolidated Financial Statement. (Please refer to the Audit Statement dated March 12, 2009 issued by Deloitte & Touch)
Chairman: CHEN, SHENG-HUNG President: CHOU, SAN-HO Chief Accountant: CHEN, HUI-MIN
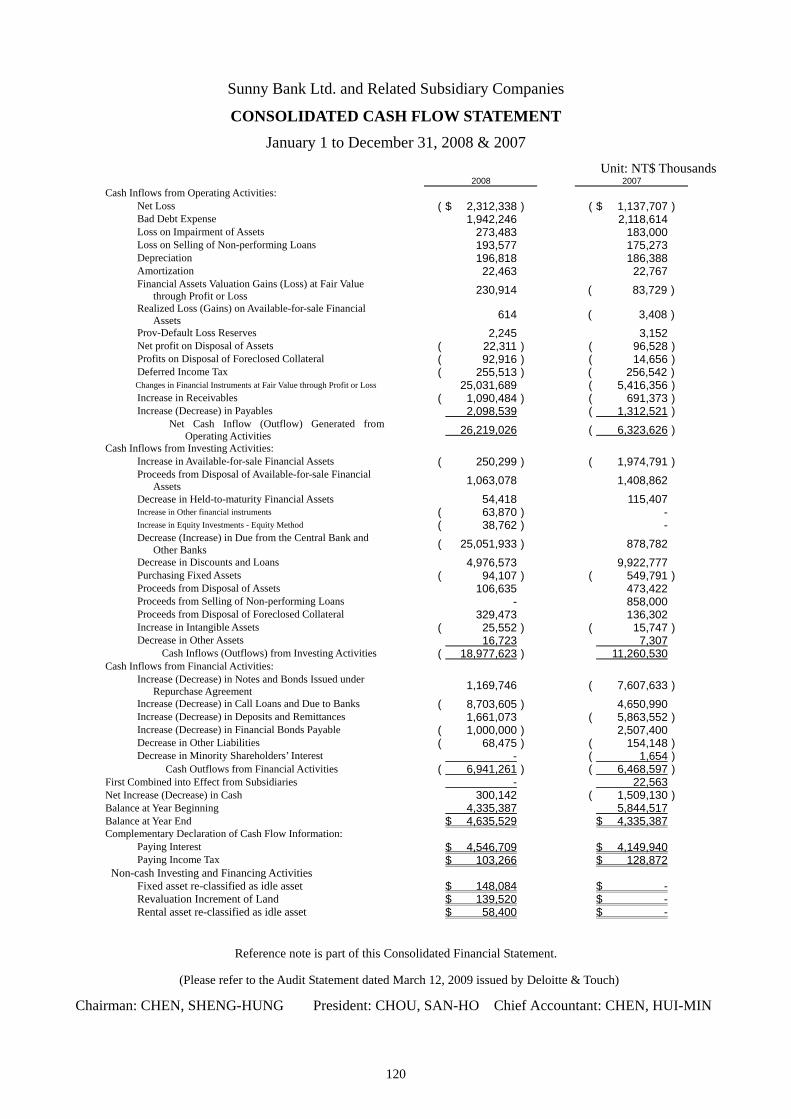
120
Sunny Bank Ltd. and Related Subsidiary Companies
CONSOLIDATED CASH FLOW STATEMENT January 1 to December 31, 2008 & 2007
Unit: NT$ Thousands 2008 2007 Cash Inflows from Operating Activities:
Net Loss ( $ 2,312,338 ) ( $ 1,137,707 ) Bad Debt Expense 1,942,246 2,118,614 Loss on Impairment of Assets 273,483 183,000 Loss on Selling of Non-performing Loans 193,577 175,273 Depreciation 196,818 186,388 Amortization 22,463 22,767 Financial Assets Valuation Gains (Loss) at Fair Value
through Profit or Loss 230,914 ( 83,729 ) Realized Loss (Gains) on Available-for-sale Financial
Assets 614 ( 3,408 ) Prov-Default Loss Reserves 2,245 3,152 Net profit on Disposal of Assets ( 22,311 ) ( 96,528 ) Profits on Disposal of Foreclosed Collateral ( 92,916 ) ( 14,656 ) Deferred Income Tax ( 255,513 ) ( 256,542 ) Changes in Financial Instruments at Fair Value through Profit or Loss 25,031,689 ( 5,416,356 ) Increase in Receivables ( 1,090,484 ) ( 691,373 ) Increase (Decrease) in Payables 2,098,539 ( 1,312,521 )
Net Cash Inflow (Outflow) Generated from Operating Activities 26,219,026 ( 6,323,626 )
Cash Inflows from Investing Activities: Increase in Available-for-sale Financial Assets ( 250,299 ) ( 1,974,791 ) Proceeds from Disposal of Available-for-sale Financial
Assets 1,063,078 1,408,862 Decrease in Held-to-maturity Financial Assets 54,418 115,407 Increase in Other financial instruments ( 63,870 ) - Increase in Equity Investments - Equity Method ( 38,762 ) - Decrease (Increase) in Due from the Central Bank and
Other Banks ( 25,051,933 ) 878,782 Decrease in Discounts and Loans 4,976,573 9,922,777 Purchasing Fixed Assets ( 94,107 ) ( 549,791 ) Proceeds from Disposal of Assets 106,635 473,422 Proceeds from Selling of Non-performing Loans - 858,000 Proceeds from Disposal of Foreclosed Collateral 329,473 136,302 Increase in Intangible Assets ( 25,552 ) ( 15,747 ) Decrease in Other Assets 16,723 7,307
Cash Inflows (Outflows) from Investing Activities ( 18,977,623 ) 11,260,530
Cash Inflows from Financial Activities: Increase (Decrease) in Notes and Bonds Issued under
Repurchase Agreement 1,169,746 ( 7,607,633 ) Increase (Decrease) in Call Loans and Due to Banks ( 8,703,605 ) 4,650,990 Increase (Decrease) in Deposits and Remittances 1,661,073 ( 5,863,552 ) Increase (Decrease) in Financial Bonds Payable ( 1,000,000 ) 2,507,400 Decrease in Other Liabilities ( 68,475 ) ( 154,148 ) Decrease in Minority Shareholders’ Interest - ( 1,654 )
Cash Outflows from Financial Activities ( 6,941,261 ) ( 6,468,597 ) First Combined into Effect from Subsidiaries - 22,563
Net Increase (Decrease) in Cash 300,142 ( 1,509,130 ) Balance at Year Beginning 4,335,387 5,844,517
Balance at Year End $ 4,635,529 $ 4,335,387 Complementary Declaration of Cash Flow Information:
Paying Interest $ 4,546,709 $ 4,149,940 Paying Income Tax $ 103,266 $ 128,872
Non-cash Investing and Financing Activities Fixed asset re-classified as idle asset $ 148,084 $ - Revaluation Increment of Land $ 139,520 $ - Rental asset re-classified as idle asset $ 58,400 $ -
Reference note is part of this Consolidated Financial Statement.
(Please refer to the Audit Statement dated March 12, 2009 issued by Deloitte & Touch)
Chairman: CHEN, SHENG-HUNG President: CHOU, SAN-HO Chief Accountant: CHEN, HUI-MIN

Sunny Bank Ltd. and Subsidiaries
Notes to Consolidated Financial Statements For Years 2008 and 2007
(Unless otherwise specified, all amounts are in NT thousand) 1.Company History and Operation Scope
Sunny Bank Cord Ltd. (Parent Company) is a public-listed company with business in: services of commercial banks approved by the Banking Law, savings and trust services and other related services approved by the authority. The Trust Department of Sunny Bank Ltd. undertakes planning, management and operations of trust investment services regulated by the Banking Law and trust services in investment of domestic securities and funds. The Bank owns a network of 96 business units in Taiwan by the end of 2008.
Investment relationships and shareholdings between Parent Company and subsidiaries whose
consolidated financial statements were produced at the end of 2008 are as follows: 97.68%
Sunny Securities Co., Ltd.
Major business of subsidiaries is as follows:
Subsidiaries Major business Sunny Securities Co., Ltd. Entrusted with securities services in TSEC Market
and its branches and acting as a futures introducing broker
Gold Sunny Assets Management Co., Ltd. Financial Institution Creditor's Right (Money) Appraisal and Auction
Sunny Life Insurance Brokerage Co., Ltd. Life Insurance Brokerage Sunny Property Insurance Brokerage Co.,
Ltd. Property Insurance Brokerage
Sunny Life Insurance Brokerage Co., Ltd. Parent Company
Sunny Property Insurance Brokerage Co., Ltd.
Gold Sunny Assets Mana
39.99%
20%
100%
60%
40%
40%
gement Ltd.
121

The numbers of employees in Parent Company and subsidiaries at the end of 2008 and 2007 were 2,285 and 2,558 respectively
2.Summary of Important Accounting Policies The accompanying consolidated financial statements have been prepared in conformity with
the Criteria Governing the Preparation of Financial Reports by Public Banks, Guidelines Governing the Preparation of Financial Reports by Securities Issuers and Generally Accepted Accounting Principles in the Republic of China. In preparing financial statements in conformity with these criteria, guidelines and principles, the Bank is required to make certain estimates and assumptions that could affect the amounts of the allowances for possible losses, reserve for losses on guarantees, depreciation, loss on asset impairment, pension, income tax and employee bonuses and remuneration to directors and supervisors, etc. Actual results could differ from these estimates.
The main body of this consolidated financial report is focused on the banking industry. Since the operating cycle in the banking industry cannot be reasonably identified, accounts included in the Bank’s financial statements were not classified as current or non-current. Nevertheless, accounts were properly categorized according to the nature of each account and sequenced by liquidity. The maturity analysis of assets and liabilities is shown in Note 29. The Bank’s significant accounting policies are summarized as follows: Criteria for Preparation of Consolidated Financial Reports
The accounts of all subsidiaries that Parent Company directly or indirectly owned over 50% of the voting stocks and less than 50% of the voting stocks but with controlling power is consolidated. All significant intercompany balances and transactions have been eliminated upon consolidation. However, loss arising from sale of non-performing loans to Sunny Assets Management Ltd, according to Financial Institutions Merger Law, can be amortized over 5 years and is inconsistent with GAAP. Such loss is thus not eliminated.
The consolidated financial statements include the accounts of the Parent Company, Sunny Securities Ltd, Sunny Assets Management Ltd, Sunny Life Insurance Brokerage Co., Ltd., and Sunny Property & Insurance Brokerage Co., Ltd. However, since March 2007, Parent Company has directly and indirectly owned over 50% of shares of Sunny Assets Management Ltd and Sunny Life Insurance Brokerage Co., Ltd. Therefore, they are not included into consolidated financial reports of 2006. Basis of Financial Statements
The accompanying financial statements include the accounts of the Head Office, OBUs and subsidiaries. All interoffice transactions and balances have been eliminated.
122
Financial Assets and Liabilities at Fair Value through Profit or Loss Changes in the fair value of interest include loss of financial commodity's purpose of the
transaction, which is financial asset or financial debts. The view from the original series, designated to measure the fair value and changes in fair value loss is recognized that financial interests or financial asset debt’s original recognition, fair value is measured and continued after the evaluation to measure the fair value and changes in fair value recognized year loss benefits. According to the examples, the purchase or sale of financial products is under the delivery date method.
Derivative products failed to meet hedge accounting; classification is the purpose of the transaction financial asset or financial debts. Fair value is positive, as a financial asset; fair value is negative, as financial debts.
Fair value: The listing of securities is the balance sheet day ending price, beneficial certificates is the balance sheet day net assets value, domestic bonds is the Taiwan securities service balance sheet day reference price, other markets financial products use evaluation method to estimate the fair value. Purchased Loans Receivables
Non-performing loans that Golden Sunny Assets Management Ltd. purchased from financial institutions are recorded at cost. After these loans are collected, the according cost to purchase the loans will be written off at the cost recovery method. Upon the full recovery of acquisition cost, profit will be recognized.
Upon the acquisition of loans, the amount of total payment and other necessary cost should be taken as the initial evaluation basis for loan acquisition. According to the relative fair value, cost of each loan should be recorded as purchased loans receivables. Any expenditure for participating in bidding should be recorded as expense.
Marketing and processing expenses from purchase to sale of these loans should be recognized as expenses. If debtors are incapable of paying debt off and the court implements seizure and injunction, the implementation expenses, such as court-ruling application fee, collateral auction ruling fee and field appraisal fee, should be recorded as operation expense.
Overdue Receivables
In accordance with the “Regulations of Reserve for Evaluated Banking Assets Loss and Collections for non-performing Loans” by the Executive Yuan's Financial Supervisory Commission BPK the overdue loans and other authorized credit accounts are due and haven’t been paid off and have been approved by the Board, as collection accounts together with estimated interest receivable.
Transfer from loans to allowance for Bad Debts listed in the discount and loan accounts, if they are non-listed in transfer from loans to allowance for Bad Debts then list in other assets.
123

Allowance for Loan Losses and Reserve for Guarantees Allowances for bad debts and losses on guarantees are estimated according to the risk of
uncollectible specific loans, receivables, delinquent loans, other financial instruments and guarantees as well as the uncollectible risk of overall credit portfolio referred to above.
The Parent Company assesses the collective possibility of credit portfolio based on the borrowers' /clients' delinquent status and financial condition in accordance with regulations issued by the Ministry of Finance ("MOF").These rules state that, if loans, receivables, delinquent loans, and other financial instruments are deemed uncollectible, full provisions should be made and recognized as current expense. If the possibility of collection is deemed low, provisions of at least 50% of the credit should be made and the loss should be recognized as an expense currently. The regulations were revised in July 2005 to reclassify deteriorating loans into "special mention," "substandard," "doubtful," and "uncollectible” categories. Provisions should be made at 2%, 10%, 50%, and 100%, respectively, for each loan category, as the minimum standard of the allowance for bad loans and guarantee.
Unrecoverable portions of delinquent loans are written off upon approval of board of directors. Sunny Assets Management Ltd should evaluate possible loss and recognize allowance for bad
debt for the balance of purchased loans receivables on the date of Balance Sheet.
Available-for-Sale Financial Assets Available-for-sale financial assets are initially measured at fair value plus transaction costs that
are directly attributable to the acquisition. At each balance sheet date subsequent to initial recognition, available-for-sale financial assets are re-measured at fair value, with changes in fair value recognized in equity until the financial assets are disposed of, at which time, the cumulative gain or loss previously recognized in equity is included in profit or loss for the year. The regular way purchases or sales of stocks and mutual funds are recognized and derecognized on a trade date basis. Besides, settlement date basis are applied to all other financial instruments.
The basis of the fair value: bonds are valued at prices quoted by the Taiwan GreTai Securities Market on balance sheet date. The fair value of financial assets and financial liabilities without quoted prices in an active market are valued on valuation techniques.
Stock dividends are not recognized as investment income but are recorded as an increase in the number of shares. The total number of shares subsequent to the increase is used for recalculation of cost per share. The difference between the initial cost of a debt instrument and its maturity amount is amortized using the effective interest method, with the amortized interest recognized in profit or loss. An impairment loss is recognized when there is objective evidence that the financial asset is impaired. Any subsequent decrease in impairment loss of an equity instrument classified as available for- sale is recognized directly in equity. If the fair value of a debt instrument classified as available-for-sale subsequently increases as a result of an event which occurred after the impairment loss was recognized, the decrease in impairment loss is reversed to profit.
124
Held-to-Maturity Financial Assets Held-to-maturity financial assets are carried at amortized cost using the effective interest
method. Held-to-maturity financial assets are initially measured at fair value plus transaction costs that are directly attributable to the acquisition. Profit or loss is recognized when the financial assets are derecognized, impaired, or amortized. The regular way purchases or sales of stocks and mutual funds are accounted for using a trade date basis. Besides, settlement date basis are applied to all other financial instruments.
An impairment loss is recognized when there is objective evidence that the investment is impaired. The impairment loss is reversed if an increase in the investment's recoverable amount is due to an event which occurred after the impairment loss was recognized; however, the adjusted carrying amount of the investment may not exceed the carrying amount that would have been determined had no impairment loss been recognized for the investment in prior years.
Equity Investments - Equity Method
Under the equity method, the investment is initially recognized at cost and the carrying amount is increased or decreased to recognize the investor's share of the profit or loss of the investee. Distributions received from an investee reduce the carrying amount. The total number of shares subsequent to the increase is used for recalculation of cost per share.
Cash dividend distributed by invested companies will not be recognized gains on investment and will be only recoded as an increase in shares held. Other financial instruments
Financial assets carried at cost are investments in equity instruments with no quoted prices in an active market and with fair values that cannot be reliably measured, such as non-publicly traded stocks and stocks traded in the Emerging Stock Market, and should be measured at their original cost. An impairment loss is recognized when there is objective evidence that the asset is impaired. A reversal of this impairment loss is not allowed.
Debt instruments with no quoted market prices in active markets but with fixed or the amount received can be decidable are carried at amortized cost. Its accounting procedures are similar to those financial instruments held to maturity. However, the disposal timing is not limited.
An impairment loss is recognized when there is objective evidence that the Investments in Debt Security with No Active Market are impaired. The impairment loss is reversed if an increase in the investment's recoverable amount is due to an event which occurred after the impairment loss was recognized; however, the adjusted carrying amount of the investment may not exceed the carrying amount that would have been determined had no impairment loss been recognized for the investment in prior years.
Fixed Asset Properties are stated at cost less accumulated depreciation. Major betterments and renewals are
capitalized, while repairs and maintenance are expensed as incurred.
125
Depreciation is calculated by the straight-line method over service lives initially estimated as follows: office equipment, 3 to 60 years; miscellaneous equipment: 3 to 15 years. For assets still in use beyond their original estimated service lives, further depreciation is calculated on the basis of any remaining salvage value and the estimated additional service lives.
While re-evaluating fixed assets, net amount will be credited to capital reserve in addition to adding the increment of re-evaluated assets and reserve for land value-added tax. The depreciation is calculated based on durable years remained upon the re-evaluation.
Upon sales or other disposal of properties, their cost and related accumulated depreciation are removed from the accounts. The resulting gain (loss) is credited (charged) to current income. Intangible Asset Goodwill generated due to merger and partial undertaking will not be amortized. However, the annual loss undergoes regular testing. Computer software is amortized averagely over 3 years. Other Assets
Assumed collaterals and residuals are recorded at cost. These are stated at the lower of cost or realizable value on the balance sheet date. An impairment loss is recognized when future recoverable values of assumed collaterals and residuals are less than their carrying values. The loss is reversed and a gain is recognized when future recoverable values of these assumed collaterals and residuals recover afterward. The reversed book value should be less than the book value if no impairment has happened.
Rental and idle assets are valued at Lower of Cost Less Accumulated Depreciation Or Fair Value. Depreciation is calculated by the straight-line method over service lives of 3 to 50 years. For assets still in use beyond their original estimated service lives, further depreciation is calculated on the basis of any remaining salvage value and the estimated additional service lives. Asset Impairment
The parent company and its subsidiaries determine the cash generating unit which Equity Investment under Equity Method, fixed asset, goodwill and idle assets belong to. The evaluations on impairment loss will be made based on the above said cash generating unit. If there is a major impairment loss arising from such assets after evaluating the carrying value based on related amount receivable, a reduction on the carrying value shall be made from the goodwill listed in the cash generating unit first. Then, the rest impairment loss will be amortized proportionally shall be made from the carrying values of other assets listed in the cash generating unit. If the recoverable amount of the assets increases, the reversal of impairment loss is credited to current income. However, loss reversal should not be more than the carrying amount (net of amortization) had the impairment not been recognized.
126

Bonds or Securities Purchased/Sold under Specific Agreements Bonds or securities sold under repurchase agreement are recorded at sale price. Interest
revenues and expenses are recorded on accrual basis. Pension
Pension cost under a defined benefit plan is determined by actuarial valuations. The payment of pension shall be made from pension reserve and then offset against pension liability.
Contributions made under a defined contribution plan are recognized as pension cost during the years in which employees render services. Interest Income and Fee Income Recognition
Loans are recorded at outstanding principal amounts. The interest income on loans is recognized on an accrual basis. When the loans become past due and are considered uncollectible, the principal and interest receivable are transferred to delinquent accounts, and the accrual of interest income ceases. The Bank will recognize a gain when the delinquent interest is collected. The interest income on loans is recognized on an accrual basis. When the loans become past due and are considered uncollectible, the principal and interest receivable are transferred to delinquent loan accounts, and the accrual of interest income is ceased. Interest income will be recognized when the delinquent interest is collected. If the repayment of loan is extended under an agreement, the related interest should be recognized as deferred revenue and recognized as income when collected.
Fee income is recognized when income is received and main service is completed. Treasury Stock
The reacquisition of issued stock is accounted for by the cost method. Under this method, the reacquisition cost is debited to the treasury stock account. Income Tax
The Bank applies intra-year and inter-year allocations for its income tax. Deferred income tax assets and liabilities are recognized for the tax effects of temporary differences, unused loss carry forward and unused tax credits. Valuation allowances are provided to the extent, if any, that it is more likely than not that deferred income tax assets will not be realized.
Tax credits for certain acquisitions of equipment or technology, research and development expenditure, personnel training expenditure and equity investments acquisition, are recognized as reduction of current income tax.
Adjustments of prior years’ tax liabilities are accounted for as part of income tax expense of the current year.
An additional tax at 10% of un-appropriated earnings is provided for as income tax in the year the shareholders approve to retain the earnings.
127
If the minimum tax that applicable to Alternative Minimum Tax Act is higher than the income tax payable for regular income, the additional tax payable should be recorded as the income tax expense for the year.
Commitments and Contingencies
If losses on commitments and contingencies are considered probable and can be reasonably estimated, the losses are recorded in the statement of income for the current period. If the amount could not be evaluated reasonably, the facts should be disclosed.
Foreign Currency Transactions
Foreign exchange is listed into the accounts in original currency transacted. Foreign currency accounts of loss and profit are converted to New Taiwan Dollars based on the exchange rates announced by the Central Bank and transferred to NTD accounts at end of every month. The foreign currency accounts of assets and liabilities which are not generated from forward exchange transaction contracts are converted to New Taiwan Dollars based on the exchange rates on Balance Sheet date. The difference arising from such conversion will be recorded as exchange loss and profit of the current year.
Reclassifications
Certain accounts of the financial statements for the years ended 2008 have been reclassified to conform to the presentation of financial statements as of and for the year ended 2007.
3.Reasons and Effects of Changes in Accounting Principles In March 2007, the Accounting Research and Development Foundation issued Interpretation
No. 2007-052, which requires companies to recognize bonuses to employees and remunerations to directors and supervisors as compensation expenses from January 1, 2008. These bonuses were previously recorded as appropriations from earnings. This accounting change had no significant impact on the financial statements for 2008.
4.Cash
December 31, 2008 December 31, 2007 Cash on Hand $ 3,006,577 $ 3,408,556 Checks for Clearance 1,233,600 642,755 Due from banks 395,352 284,076
$ 4,635,529 $ 4,335,387
128

5.Due from the Central Bank and Other Banks
December 31, 2008 December 31, 2007 Due from the Central Bank $ 27,650,039 $ 351,930 Deposit Reserve 5,491,299 6,458,163 Call Loan to Banks 2,230,832 3,510,144
$ 35,372,170 $ 10,320,237
Deposit reserve is appropriated to the deposit reserve account at the Central Bank at legal reserve
rate and based on the monthly average balance of deposits. At the end of 2008 and 2007,
NT$5,339,771,000 and NT$5,284,452,000 are respectively shown in the deposit reserve account.
Such deposit reserve cannot be used before the monthly adjustment.
6.Financial Instruments at Fair Value through Profit or Loss
December 31, 2008 December 31, 2007 Trading Financial Assets
Commercial Paper II $ 7,637,814 $ 18,280,627 Beneficiary Certificate 1,321,331 293,493 Listed/OTC Common Stock 296,340 694,376 Government Bond 116,112 117,686
6,351 15,154,415 Negotiable Certificate of Deposit Others 70,369 36,243
$ 9,448,317 $ 34,576,840 Trading Financial Liabilities
Credit Default Swaps $ 130,359 $ - Exchange Swap 4,243 328
$ 134,602 $ 328
The main purpose of directing the transactions of derivative financial products, on 2008 and
2007 is to correspond with the customer demands and the foreign exchange fun adjustment and risk
management.
Until the end of 2008 and 2007, the non-expired derivative financial commodity contract
amount (principal) is as follows:
December 31, 2008 December 31, 2007 Trading Purpose
Credit Default Swaps $ 1,179,864 $ - Exchange Swap 1,842,901 1,666,011
129

In 2008 and 2007, net loss and net income of the Bank generated by financial assets for
transaction was NT$215,800,000 and NT$263,894,000. In 2008 and 2007, net loss of the Bank
generated by financial liability for transaction was NT$341,629,000 and NT$22,663,000.
7.Net Receivables
December 31, 2008 December 31, 2007Spot Foreign Exchange Remittance Receivable
$ 2,209,463 $ 196,753
Credit Card Payment Receivable 988,141 1,378,493 Selling of Non-performing Loans Receivable 970,857 1,328,873 Buying Creditor’s Right Receivable 922,111 1,224,794 Interest Receivable 407,593 468,747 Others 304,109 440,793
5,802,274 5,038,453 Less: Allowance for Bad Debts 238,080 240,020
$ 5,564,194 $ 4,798,433
8.Net Discounts and Loans
December 31, 2008 December 31, 2007Short-term Loan $ 16,459,569 $ 12,967,602 Short-term Loan Secured 19,866,343 19,589,681 Mid-term Loan 17,745,454 21,166,137 Mid-term Loan Secured 9,506,370 13,470,869 Long-term Loan 6,661,209 7,943,385 Long-term Loan Secured 94,537,680 95,950,163 Receivables on Demand 3,960,967 4,392,305 Export Finance 39,519 85,676
168,777,111 175,565,818 Less: Allowance for Bad Debts 2,478,716 2,673,327
$ 166,298,395 $ 172,892,491
As of the years ended 2008 and 2007, the balance of loans and credits for which accrual of
interest revenues was discontinued amounted to NT$3,960,967,000 and NT$4,392,305,000,
respectively. The unrecognized interest revenues on these loans and credits amounted to
NT$148,421,000 and NT$158,437,000 for the years ended 2008 and 2007, respectively.
130
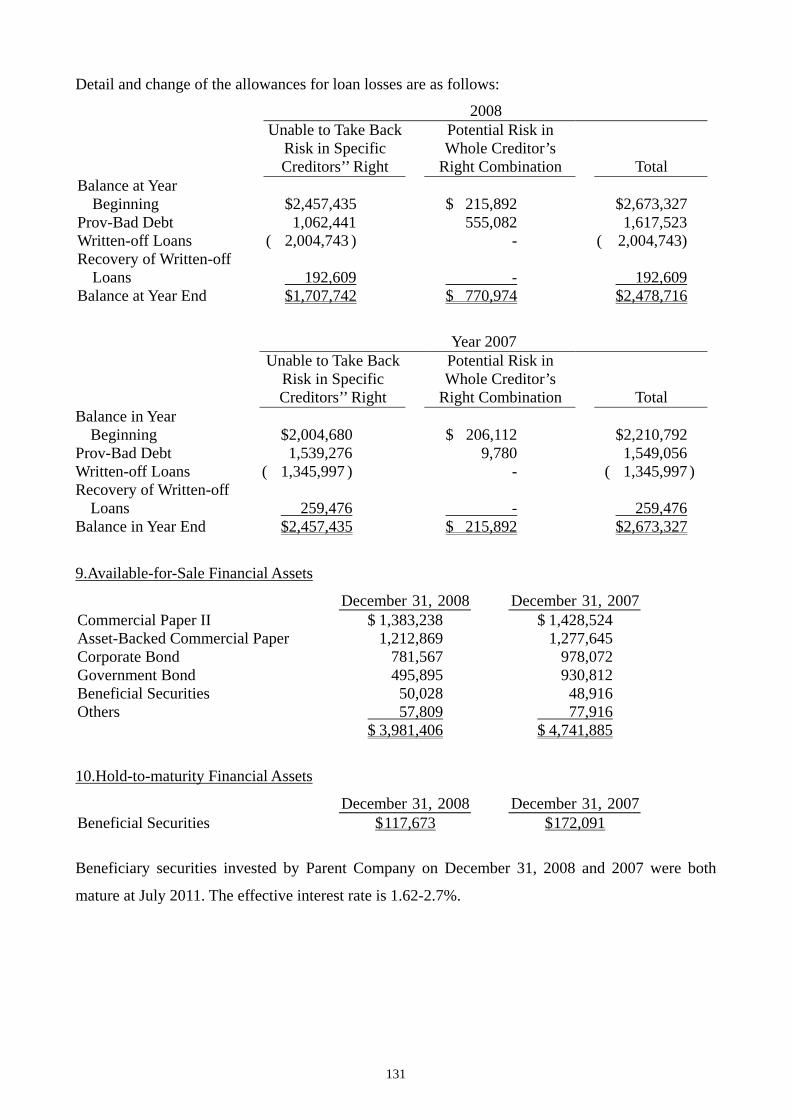
Detail and change of the allowances for loan losses are as follows:
2008
Unable to Take Back Risk in Specific Creditors’’ Right
Potential Risk in Whole Creditor’s
Right Combination Total Balance at Year
Beginning
$2,457,435 $ 215,892 $2,673,327 Prov-Bad Debt 1,062,441 555,082 1,617,523 Written-off Loans ( 2,004,743 ) - ( 2,004,743) Recovery of Written-off
Loans
192,609 - 192,609
Balance at Year End $1,707,742 $ 770,974 $2,478,716
Year 2007
Unable to Take Back Risk in Specific Creditors’’ Right
Potential Risk in Whole Creditor’s
Right Combination Total Balance in Year
Beginning
$2,004,680 $ 206,112 $2,210,792 Prov-Bad Debt 1,539,276 9,780 1,549,056 Written-off Loans ( 1,345,997 ) - ( 1,345,997 ) Recovery of Written-off
Loans
259,476 - 259,476
Balance in Year End $2,457,435 $ 215,892 $2,673,327
9.Available-for-Sale Financial Assets
December 31, 2008 December 31, 2007 Commercial Paper II $ 1,383,238 $ 1,428,524 Asset-Backed Commercial Paper 1,212,869 1,277,645 Corporate Bond 781,567 978,072 Government Bond 495,895 930,812 Beneficial Securities 50,028 48,916 Others 57,809 77,916
$ 3,981,406 $ 4,741,885
10.Hold-to-maturity Financial Assets
December 31, 2007 December 31, 2008 Beneficial Securities $ 117,673 $ 172,091
Beneficiary securities invested by Parent Company on December 31, 2008 and 2007 were both
mature at July 2011. The effective interest rate is 1.62-2.7%.
131
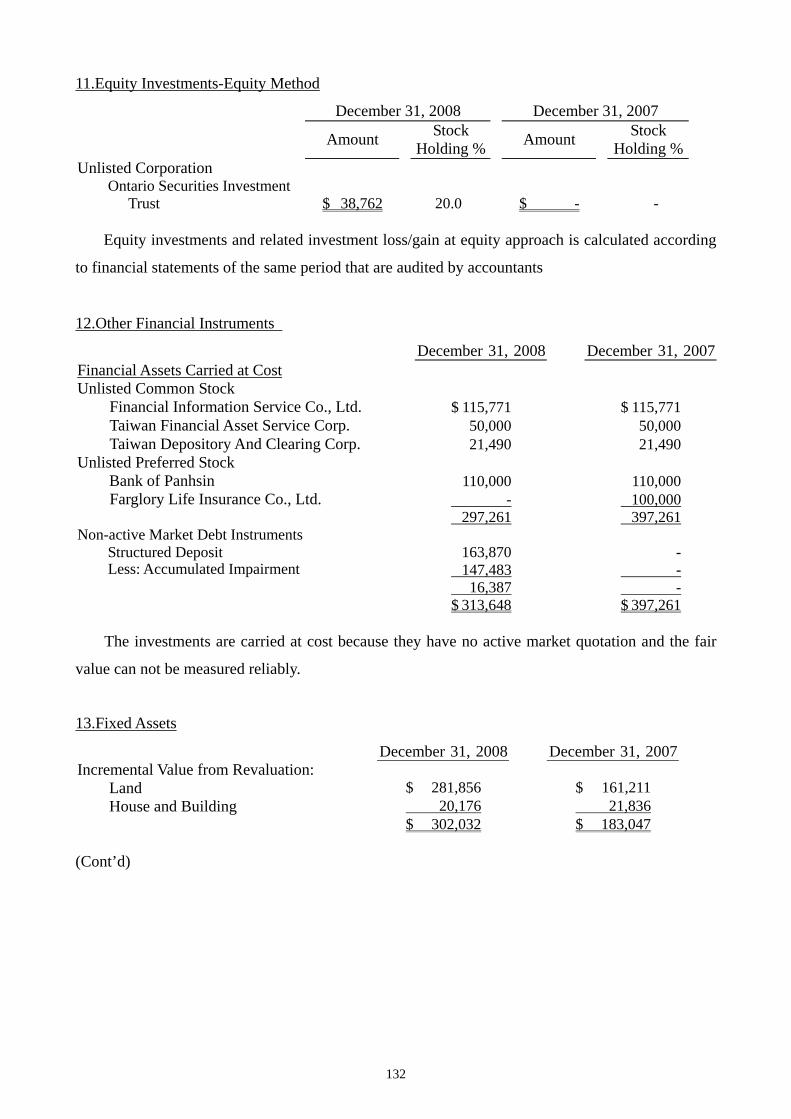
11.Equity Investments-Equity Method
December 31, 2008 December 31, 2007
Stock
Holding %Amount Amount Stock Holding %
Unlisted Corporation Ontario Securities Investment
Trust $ 38,762 20.0 $ - -
Equity investments and related investment loss/gain at equity approach is calculated according
to financial statements of the same period that are audited by accountants
12.Other Financial Instruments
December 31, 2008 December 31, 2007 Financial Assets Carried at Cost
Unlisted Common Stock
Financial Information Service Co., Ltd. $ 115,771 $ 115,771 Taiwan Financial Asset Service Corp. 50,000 50,000 Taiwan Depository And Clearing Corp. 21,490 21,490
Unlisted Preferred Stock Bank of Panhsin 110,000 110,000
Farglory Life Insurance Co., Ltd. - 100,000
297,261 397,261
Non-active Market Debt Instruments Structured Deposit 163,870 - Less: Accumulated Impairment 147,483 -
16,387 -
$ 313,648 $ 397,261
The investments are carried at cost because they have no active market quotation and the fair
value can not be measured reliably.
13.Fixed Assets
December 31, 2008 December 31, 2007 Incremental Value from Revaluation: Land $ 281,856 $ 161,211 House and Building 20,176 21,836
$ 302,032 $ 183,047 (Cont’d)
132
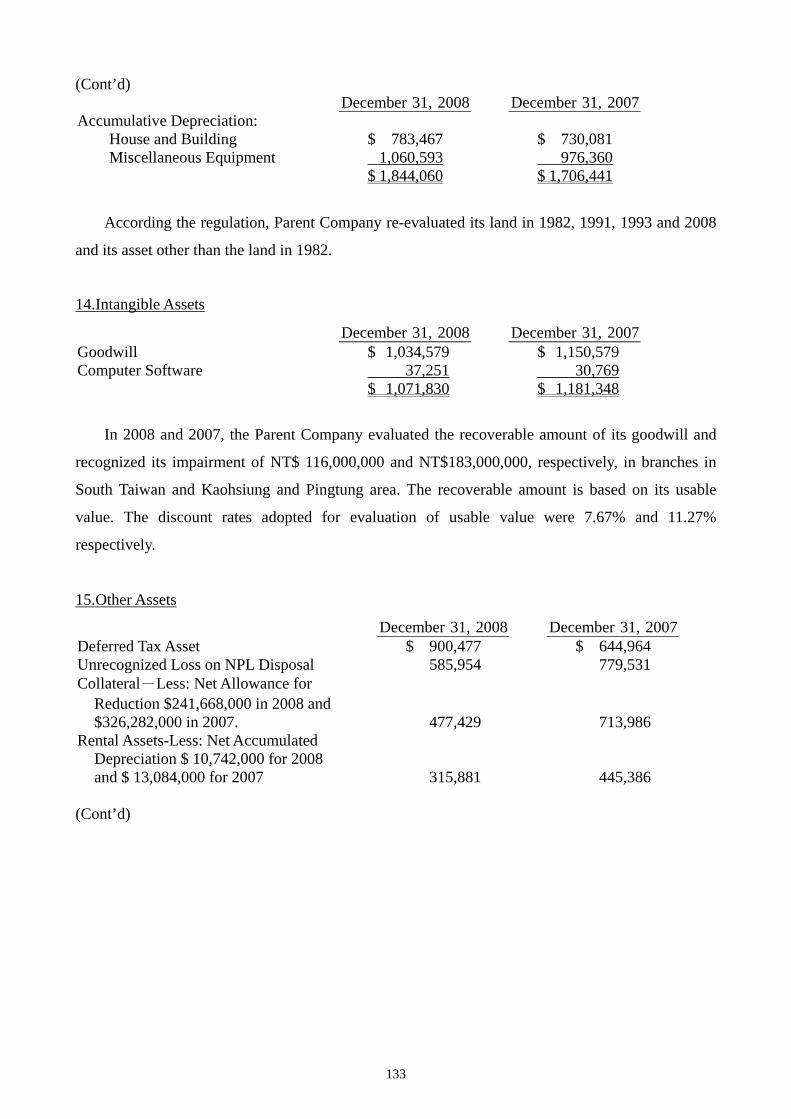
(Cont’d) December 31, 2008 December 31, 2007
Accumulative Depreciation: House and Building $ 783,467 $ 730,081 Miscellaneous Equipment 1,060,593 976,360
$ 1,844,060 $ 1,706,441
According the regulation, Parent Company re-evaluated its land in 1982, 1991, 1993 and 2008
and its asset other than the land in 1982.
14.Intangible Assets
December 31, 2008 December 31, 2007 Goodwill $ 1,034,579 $ 1,150,579 Computer Software 37,251 30,769
$ 1,071,830 $ 1,181,348
In 2008 and 2007, the Parent Company evaluated the recoverable amount of its goodwill and
recognized its impairment of NT$ 116,000,000 and NT$183,000,000, respectively, in branches in
South Taiwan and Kaohsiung and Pingtung area. The recoverable amount is based on its usable
value. The discount rates adopted for evaluation of usable value were 7.67% and 11.27%
respectively.
15.Other Assets
December 31, 2008 December 31, 2007 Deferred Tax Asset $ 900,477 $ 644,964 Unrecognized Loss on NPL Disposal 585,954 779,531
Collateral-Less: Net Allowance for Reduction $241,668,000 in 2008 and $326,282,000 in 2007. 477,429 713,986
Rental Assets-Less: Net Accumulated Depreciation $ 10,742,000 for 2008 and $ 13,084,000 for 2007
315,881 445,386 (Cont’d)
133

(Cont’d)
December 31, 2008 December 31, 2007 $ 258,485 Refundable Deposit $ 251,464
Idle Assets-Less: Net Accumulated Depreciation $ 15,303,000 and Accumulated Impairment $ 10,000,000.
196,123 - Operating Deposit 90,000 90,000 Pledged Certificate of Time Deposit 60,000 60,000 Others 60,064 73,159
$ 2,937,392 $ 3,065,511
16.Call Loans and Due to Banks
December 31, 2008 December 31, 2007 Due to Banks $ 5,585,843 $ 13,664,113 Call Loan to Banks 400,000 1,025,335
$ 5,985,843 $ 14,689,448
17.Deposits and Remittances
December 31, 2008 December 31, 2007 Savings Deposit $ 129,282,081 $ 126,233,474 Time Deposit 63,388,000 62,991,354 Current Deposit 13,946,877 15,541,116 Check Deposit 1,883,335 2,028,815 Treasury Deposit 258,119 301,420 Remittances 17,568 18,728
$ 208,775,980 $ 207,114,907
18.Financial Bonds Payable
At the end of 2008 and 2007, the interest rates carried by subordinated financial debentures are
2.51-3.80% and 2.55-3.85%. The interest is paid semiannually or annually. The principal will be
paid at one sum lump at maturity and paid off in April 2014.
134

19.Other Liabilities
December 31, 2008 December 31, 2007 Advance Receipts $ 219,860 $ 254,581 Deposits Received 78,849 84,270 Reserve for Guarantees 73,462 73,462 Reserve for Contract-Breaking Loss 23,347 21,309 Others 92,111 111,218
$ 487,629 $ 544,840
20.Shareholders’ Equity
The capital reserve generated from the disposal of assets premium cannot be used other than
reimbursing loss in accordance with related regulations. The premium derived from issuing of
stocks at a price exceeding face value and the capital reserve generated from donation can be
appropriated to the account of capital and such increased new shares will be distributed to
shareholders in proportion of shareholdings. The capital stock appropriated from capital reserve
shall be at a limited ratio every year.
In accordance with the Article of Incorporation, the Banking Law and other related regulations,
any annual earnings should first be used for paying tax and making up previous losses, if any, and
then the Parent Company will appropriate 30% of the remaining surplus as a legal reserve except
that the legal reserve has reached the amount of total paid-in capital. Then the Parent Company will
make special reserve or retain surplus based on our needs. The final remained surplus will be
distributed as follows:
(1) Rewards for Directors and Supervisors: 1.5%
(2) Employee bonus: 3%
(3) Stock dividends: 95.5%
When the previously mentioned legal reserve does not reach the amount of total capital, the
maximum cash surplus distribution shall not exceed 15% of total capital.
When the Parent Company allocates surplus, it must conform to the regulations and recognize
special reserve from after-taxed earnings of the current year and the unallocated earnings of the
previous years for the deduction of shareholders’ earnings (such as unrealized income of financial
products) and unamortized balance of the loss on sale of non-performing loans. Subsequently, if the
deduction of shareholder’s equity is reverse or the loss on sale of non-performing loans is amortized,
earnings should be distributed for the reversed amount or amortized amount.
135

For a sound financial structure and balance capital adequacy, dividend payment is based on the
bank capital budget planning, stock dividend distributed to retain the principle of the necessary
funds. If the budget surplus is acquired and capital adequacy rate is higher than the required
standard by authority, part of the surplus can be distributed as cash dividend, and shall not be less
than 10% of total dividend. If the distributed cash dividend per share is less than NT$0.1, stock
dividend can be distributed instead.
The appropriation of profit or loss for 2007 and surplus distribution for 2006 proposed by the
Board of Directors and approved at the Shareholders’ Meeting of the Parent Company in June 2008
and 2007 and the dividend per share are as follows:
2007 2006 Appropriation Of
Profit Or Loss Surplus Distribution
Legal Reserve $ 1,138,152 $ 8,642 Special Reserve - 27,794
The 2008 surplus distribution has not been decided by the Board of Directors by the date of
auditing statement by CPAs. Please visit “Public Information Service” for related approval and
details.
Under the Company Law, legal reserve should be appropriated until the reserve equals the
Parent Company's paid-in capital. This reserve should only be used to offset a deficit. When the
reserve reaches 50% of the Parent Company's paid-in capital, the amount over 50% of the Parent
Company 's paid-in capital may be declared as dividends or bonus if the Parent Company has no
earnings.
While making surplus distribution, the tax deductions for shareholders except those who are the
residents of R.O.C. can be calculated according to the rate of tax deduction on dividend distribution
date.
21.Income Tax The composition of income interests is as follows:
2008 2007 Income Tax Payable ( $ 7,978 ) ( $ 5,645 ) Deferred Income Tax 255,513 256,542 Separately Taxed Short-term Notes ( 94,961 ) ( 125,937 ) Undistributed Earnings Settlement of the Surtax ( 54 ) ( 418 ) Prior Year Income Tax Adjustment ( 41 ) ( 650 ) Income Interests $ 152,479 $ 123,892
On January 6, 2009, the Legislative Yuan of the Republic of China passed the amendment of
Article 39 of the Income Tax Law to extend the carry forward period for operating losses from 5 to
136

10 years. The Bank and its subsidiaries thus accordingly recalculated deferred tax assets on the
basis of this amendment and recorded the resulting difference as a deferred income tax benefit.
Net deferred income tax assets (listed other assets) are as follows:
December 31, 2008 December 31, 2007 Losses Deductible $ 1,307,742 $ 726,697 Allowance for credit loss over limit 121,785 317,150 Others 22,499 13,761
1,452,026 1,057,608 Less: Valuation Allowances 551,549 412,644
$ 900,477 $ 644,964
As of the end of 2008, the yearly tax payable after deducted at our bank is as follows:
Yearly Loss Amount Deductible Balance Undeductible Final Deductible Year2005 $ 103,969 $ 15,867 2015 2006 365,933 365,933 2016 2007 340,240 340,240 2017 2008 585,702 585,702 2018
$ 1,395,844 $ 1,307,742
The tax rate for deferred income tax adopted by Parent Company and subsidiaries is 25%.
Information about integrated income tax was as follows:
Balance of tax credit accounts:
Company Name December 31, 2008 December 31, 2007 Parent Company $ 446,480 $ 113,224 Sunny Securities Co., Ltd. 10,158 4,522
Sunny Life Insurance Brokerage Co., Ltd. 8,426 8,265 Sunny Property Insurance Brokerage Co.,
Ltd.
1,089 1,024 - - Gold Sunny
Tax credit rates:
Year 2007 Company Name Year 2008 (%) Realized (%)
Sunny Life Insurance Brokerage Co., Ltd. 33.33 (estimated) 47.76
Sunny Property Insurance Brokerage Co., Ltd. 43.77 (estimated) 42.69
The tax credits allocable to shareholders of subsidiaries are based on the balance of the ICA on
the dividend distribution date. Therefore, expected tax credits rate for 2008 earning distribution may
need adjustment due to the difference between the possible and the actual expected tax credits.
137

The income tax applications made by the Parent Company and its subsidiaries by 2006 and
2005 have been reviewed and approved by the taxation office. In income tax applications of 2007,
the tax deduction derived from medium interest of bonds is totaled NT$1,109,000. The tax
deduction derived from medium interest of bonds which have not been declared totals NT$8,000 in
2008.
22.Personnel, Depreciation and Amortization Costs
2008 2007 Personnel Cost
Salary and Reward $ 1,639,818 $ 1,845,307 Pension 88,437 96,941 Insurance Premium 118,200 130,804 Others 59,034 59,227
$ 1,905,489 $ 2,132,279 Depreciation $ 196,818 $ 186,388 Amortization $ 22,463 $ 22,767
23.Loss Per Share
Disclosure for numerator and denominator of basic losses per share is as follows:
Amount (Numerator) 1000 Shares Earnings Per Share (NTD) Before Tax After Tax (Denominator) Before Tax After Tax
2008
Basic Loss Per Share ( $ 2,471,900 ) ( $ 2,311,900 ) 1,224,553 ( $ 2.02 ) ( $ 1.89 ) 2007
Basic Loss Per Share ( $ 1,268,152 ) ( $ 1,138,152 ) 1,224,658 ( $ 1.04 ) ( $ 0.93 )
24.Pension
Retirement policies are available for formal employees. According to the policy, pension for
retired employees will be paid on a basis of seniority and the average monthly salary during six
months before retirement.
3.76% of monthly salary of an employee was appropriated as pension reserve and, upon
approval, the rate is changed to 2%. Such reserve will be handed to our Pension Reserve
Supervisory Committee and deposited at Bank of Taiwan under the name of this Committee.
The pension plan under the LPA is a defined contribution plan. Based on the LPA, the Parent
Company makes monthly contributions to employees' individual pension accounts at 6% of
monthly salaries and wages. Such pension costs were $70,566 thousand and $69,521 thousand for
the years ended December 31, 2008 and 2007, respectively.
Information about the defined benefit plan was as follows:
138
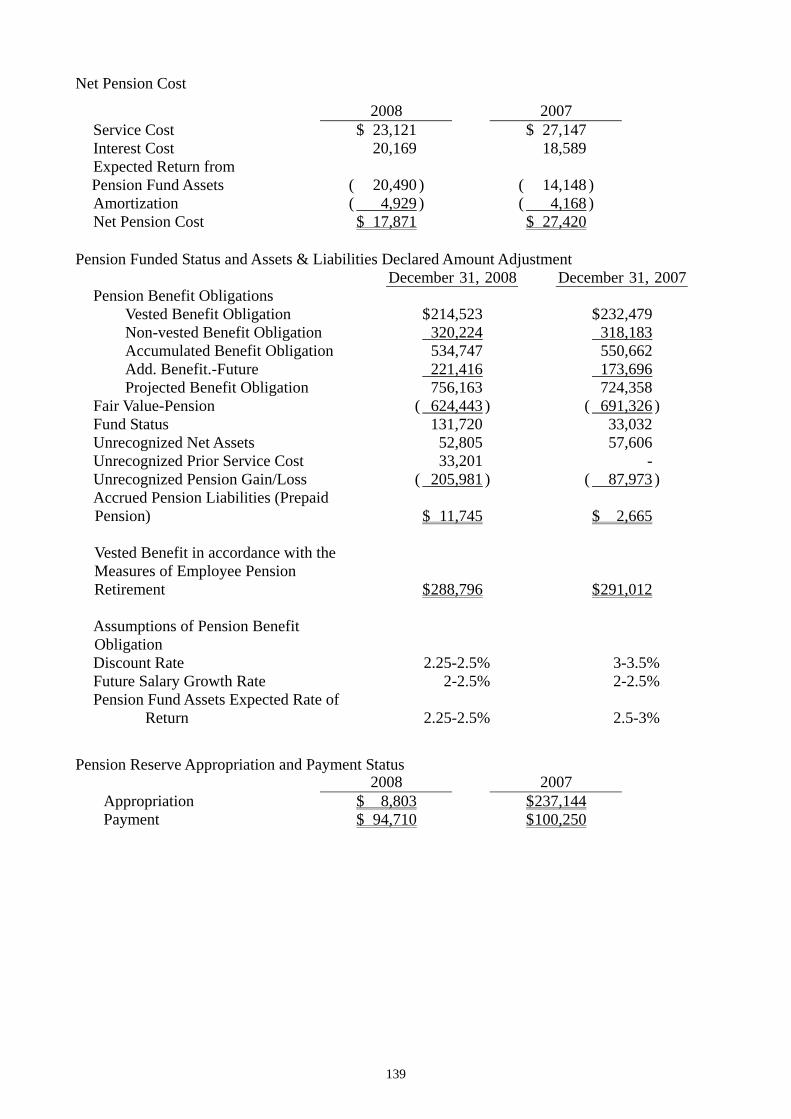
Net Pension Cost
2008 2007 Service Cost $ 23,121 $ 27,147 Interest Cost 20,169 18,589 Expected Return from
Pension Fund Assets
( 20,490 ) ( 14,148 ) Amortization ( 4,929 ) ( 4,168 ) Net Pension Cost $ 17,871 $ 27,420
Pension Funded Status and Assets & Liabilities Declared Amount Adjustment
December 31, 2008 December 31, 2007 Pension Benefit Obligations Vested Benefit Obligation $ 214,523 $ 232,479 Non-vested Benefit Obligation 320,224 318,183
Accumulated Benefit Obligation 534,747 550,662 Add. Benefit.-Future 221,416 173,696
Projected Benefit Obligation 756,163 724,358 Fair Value-Pension ( 624,443 ) ( 691,326 ) Fund Status 131,720 33,032 Unrecognized Net Assets 52,805 57,606 Unrecognized Prior Service Cost 33,201 - Unrecognized Pension Gain/Loss ( 205,981 ) ( 87,973 ) Accrued Pension Liabilities (Prepaid
Pension)
$ 11,745 $ 2,665
Vested Benefit in accordance with the Measures of Employee Pension Retirement
$ 288,796 $ 291,012 Assumptions of Pension Benefit
Obligation
Discount Rate 2.25-2.5% 3-3.5% Future Salary Growth Rate 2-2.5% 2-2.5% Pension Fund Assets Expected Rate of
Return
2.25-2.5% 2.5-3%
Pension Reserve Appropriation and Payment Status 2008 2007
Appropriation $ 8,803 $ 237,144 Payment $ 94,710 $ 100,250
139

25.Treasury Stock Parent Company purchased 18,955,000 stocks back from the shareholders who have dissents
against the merger of Kao-Hsin bank at the price of $ 11.48 per share in August 2006. Also, Sunny
Life Insurance Brokerage Co., Ltd. became one subsidiary of Parent Company in March 2007. The
420,000 shares of Parent Company stock that it held were re-recorded as treasury stock from equity
investment at equity approach. The book value per share is $ 8.35. These treasury stocks had not
experienced any change up to the end of 2008.
Parent Company is prohibited from pledging treasury shares and exercising stockholder’s rights
on these shares before their transfer. However, under the Company Law, the subsidiaries holding
shares of Parent Company are excluded from the right to participate in a capital increase and right
to vote
26.Related-Party Transactions Related parties and their relationships with the Bank:
Name Relationship with our Bank Gold Sunny Assets Management Co., Ltd.
(Gold Sunny) Subsidiary
Ontario Securities Investment Trust (Ontario Securities)
The invested company valued at the equity method.
Other Parties Our bank’s directors, supervisors, managers, and chairman and president’s Relatives within the second level relationships
Significant Transactions with Parent Company-Related Parties
Loan
2008 Performing Status Accounts
Number & Party’s Name
Highest Accounts Number &
Party’s Name
Year Ending Balance
Accounts Number &
Party’s Name
Type Balance This Year
Type Type
Consuming Loan
None 46 $ 19,966 $ 9,890 $ 9,890 - $ -
Private Housing
Secured Loan
None 41 336,979 289,217 289,217 - -
Chuan Yang Construction
Land & Building None 491,000 491,000 491,000 -
Liu, Hsiang-Tun 19,402 18,624 18,624 - Land & Building None Ho, Li-Wei 16,000 16,000 16,000 - Land & Building None
Hsueh, Tsung-Hsien
None 12,500 12,380 12,380 - Building Land
Wang, Ya-Hsun 7,900 6,900 6,900 - Farmland None Hsueh,
Tsung-Tai 5,800 - - - - None Other Loan
Chen, Li-Fen None - 4,827 - - - Chu, Chia-Lung None - 3,449 - - -
Yang, Ying-Chung
None - 3,000 - - -
(Cont’d)
140
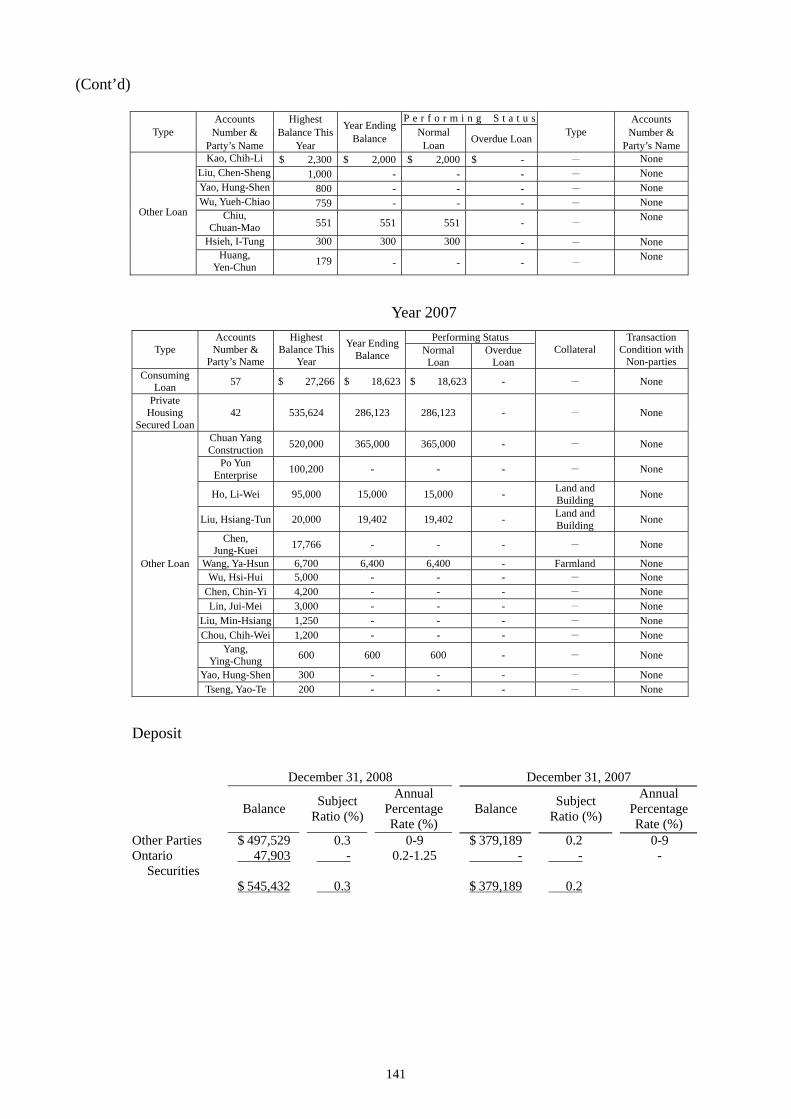
(Cont’d)
P e r f o r m i n g S t a t u s Accounts Number &
Party’s Name
Highest Accounts Number &
Party’s Name
Year Ending Balance Type Type Normal
Loan Balance This
Year Overdue Loan
Kao, Chih-Li None - $ 2,300 $ 2,000 $ 2,000 $ - Liu, Chen-Sheng None - 1,000 - - - Yao, Hung-Shen None - 800 - - - Wu, Yueh-Chiao None - 759 - - -
Chiu, Chuan-Mao 551 551 551 - - None Other Loan
Hsieh, I-Tung 300 300 300 None - - Huang,
Yen-Chun None 179 - - - -
Year 2007 Performing Status Accounts
Number & Party’s Name
Highest Transaction Condition with
Non-parties
Year Ending Balance Type Collateral Balance This
Year Normal Loan
Overdue Loan
Consuming Loan - 57 $ 27,266 $ 18,623 $ 18,623 - None
Private Housing
Secured Loan - 42 535,624 286,123 286,123 - None
Chuan Yang Construction - 520,000 365,000 365,000 - None
Po Yun Enterprise - 100,200 - - - None
Land and Ho, Li-Wei 95,000 15,000 15,000 - None Building Land and Liu, Hsiang-Tun 20,000 19,402 19,402 - None Building
Chen, Jung-Kuei - 17,766 - - - None
Wang, Ya-Hsun 6,700 6,400 6,400 - Farmland None Wu, Hsi-Hui 5,000 - - - - None
Other Loan
- Chen, Chin-Yi 4,200 - - - None - Lin, Jui-Mei 3,000 - - - None - Liu, Min-Hsiang 1,250 - - - None - Chou, Chih-Wei 1,200 - - - None
Yang, Ying-Chung - 600 600 600 - None
- Yao, Hung-Shen 300 - - - None - Tseng, Yao-Te 200 - - - None
Deposit
December 31, 2008 December 31, 2007 Annual
Percentage Rate (%)
Annual Percentage Rate (%)
Subject Ratio (%)
Subject Ratio (%) Balance
Balance
Other Parties $ 497,529 0.3 0-9 $ 379,189 0.2 0-9 Ontario
Securities 47,903 - 0.2-1.25 - - -
$ 545,432 0.3 $ 379,189 0.2
141

Interest Income
2008 2007 Subject
Ratio (%) Amount Amount Subject
Ratio (%) Other Parties $ 28,071 0.4 $ 28,745 0.4
Interest Expenses
2008 2007 Subject
Ratio (%) Amount Amount Subject
Ratio (%) Other Parties $ 9,622 0.2 $ 9,114 0.2 Ontario Securities 149 - - -
$ 9,771 0.2 $ 9,114 0.2
Sale of Non-Performing Loans
Parent Company, through open tender, sold 41,272 and 2,327 accounts of
non-performing loans, amounted NT$1,041,038,000 and NT$1,394,846,000 to Golden
Sunny Assets Management in 2008 and 2007 respectively. The base dates are July 25, 2007
and November 30, 2006 and the transaction prices are NT$858,000,000 and
NT$610,000,000 dollars. The entrusted proceeds will be paid in installment starting from
the date of signature to July 31, 2010 to December 26, 2009 respectively. In accordance
with contract provisions, Parent Company, starting from the base date, will transfer current
and future rights, benefits, and the contention of lawsuits to Golden Sunny Assets
Management Co. Loss on sale of NPL ware NT$183,038,000 and NT$784,846,000.
According to “Financial Institution Merger Act”, the loss will be deferred and amortized
over five years. The unamortized balance will be recorded as other assets. Its changes are
as follows:
2008 2007 $ 779,531 $ 771,766 Balance atYear Beginning - 183,038 Increase During This Year
Amortization During This Year
193,577 175,273
$ 585,954Balance at Year End $ 779,531
142
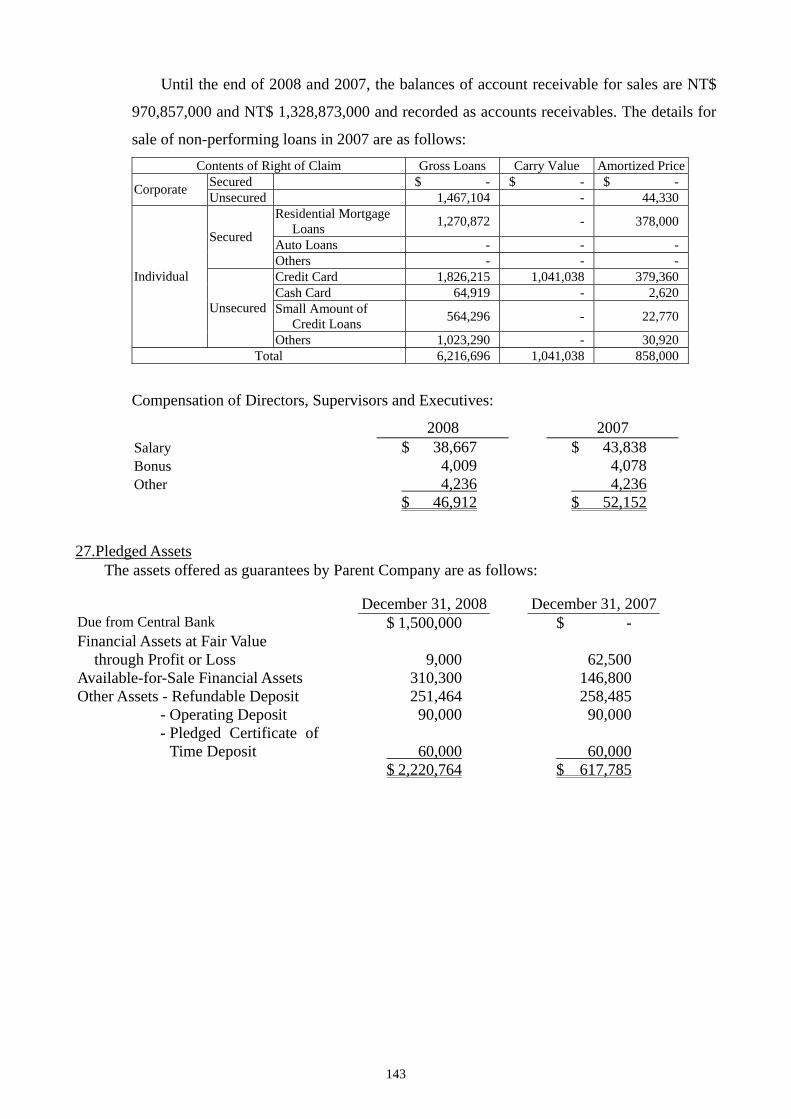
Until the end of 2008 and 2007, the balances of account receivable for sales are NT$
970,857,000 and NT$ 1,328,873,000 and recorded as accounts receivables. The details for
sale of non-performing loans in 2007 are as follows: Contents of Right of Claim Gross Loans Carry Value Amortized Price
Secured $ - $ - $ -Corporate Unsecured 1,467,104 - 44,330Residential Mortgage
Loans 1,270,872 - 378,000
Auto Loans - - -Secured
Others - - -Credit Card 1,826,215 1,041,038 379,360Cash Card 64,919 - 2,620
Individual
Small Amount of Credit Loans 564,296 - 22,770Unsecured
Others 1,023,290 - 30,920Total 6,216,696 1,041,038 858,000
Compensation of Directors, Supervisors and Executives:
2008 2007 $ 38,667 $ 43,838 Salary 4,009 4,078 Bonus 4,236 4,236 Other
$ 46,912 $ 52,152
27.Pledged Assets The assets offered as guarantees by Parent Company are as follows:
December 31, 2008 December 31, 2007 $ 1,500,000 $ - Due from Central Bank
Financial Assets at Fair Value through Profit or Loss
9,000 62,500
Available-for-Sale Financial Assets 310,300 146,800 Other Assets - Refundable Deposit 251,464 258,485
- Operating Deposit 90,000 90,000 - Pledged Certificate of
Time Deposit
60,000 60,000
$ 2,220,764 $ 617,785
143

The aforementioned pledged assets are offered and deposited at the court as the deposit for
performing provisional seizure against obligors, deposit for lease, reserve for credit card payment,
reserve for reimbursement required by the Trust Department, savings deposit of bill providers and
guarantees as for central bank remittance system. In addition, negotiable C/Ds are also provided as
guarantee against daily overdraw for central bank real-time total clearing mechanism. The quota for
such guarantee is subject to change from time to time and the quota remained at the end of the day
can be taken as current reserve.
28.Contingent Liabilities and Commitments
In addition to those mentioned in notes, the Parent Company and its subsidiaries had the
following contingent liabilities and commitments as of December 31, 2008:
At the end of 2008, bonds and notes with repurchase agreement amounted NT$ 1,689,706,000
and, under agreement, should be repurchased successively with NT$ 1,690,270,000 before January
10, 2009.
As of the end of 2008, the Parent Company and its subsidiaries has sold, with repurchase
agreement, NT$ 1,490,627,000 for Financial Liabilities at Fair Value through Profit or Loss and
NT$ 199,079,000 for Available-for-Sale Financial Assets.
The lease of places rented by the Parent Company and its subsidiaries for business units will
expire by the end of March 2013. The refundable deposit totals NT$110,247,000 (listed in other
assets). The rental totals NT$ 39,150,0000 in 2008.
The contracted rental payable in the next five years is as follows:
Year Amount 2009 $ 32,411 2010 11,717 2011 8,477 2012 6,756 2013 1,672
144

29.Financial Product Information
Fair Value Information
December 31, 2008 December 31, 2007 Book Value Fair Value Book Value Fair Value Financial Assets
Financial Assets Book Value of Which Equals to Fair Value $ 45,959,798 $ 45,959,798 $ 19,758,529 $ 19,758,529
Financial Assets at Fair Value through Profit or Loss 9,448,317 9,448,317 34,576,840 34,576,840Available-for-Sale Financial Assets 3,981,406 3,981,406 4,741,885 4,741,885Discounts and Loans 166,298,395 166,298,395 172,892,491 172,892,491Hold-to-maturity Financial Assets 117,673 117,673 172,091 172,091Non-active Market Debt Instruments 16,387 16,387 - - Financial Liabilities
Financial Liabilities Book Value of Which Equals to Fair Value 222,355,288 222,355,288 226,134,956 226,134,956
Financial Liabilities at Fair Value through Profit or Loss 134,602 134,602 328 328Financial Bonds Payable 5,503,900 5,503,900 6,507,400 6,507,400
Methods and assumptions used to estimate the fair values of financial instruments were as follows:
The carrying amounts of the following short-term financial instruments approximate their fair
values because of their short maturities: due from the Central Bank and call loans from banks,
bonds purchased under resell agreements, receivables (excluding Tax Refund Receivable), other
financial instruments, due to banks and the Central Bank, bonds and securities sold under
repurchase agreements, payables and remittances.
Fair values of financial instruments at FVTPL and available for-sale or held-to-maturity
financial assets are based on their quoted prices in an active market. For those instruments with no
quoted market prices, their fair values are determined using valuation techniques incorporating
estimates and assumptions consistent with those generally used by other market participants to price
financial instruments.
Discounts, loans and deposits are interest-bearing financial assets liabilities and their carrying
values approach to their fair values. The carrying amount of delinquent loans is the estimated
collectable amount which is the book value less allowance for bad debt. Therefore, the fair value of
loans and deposits is determined at their carrying value.
145
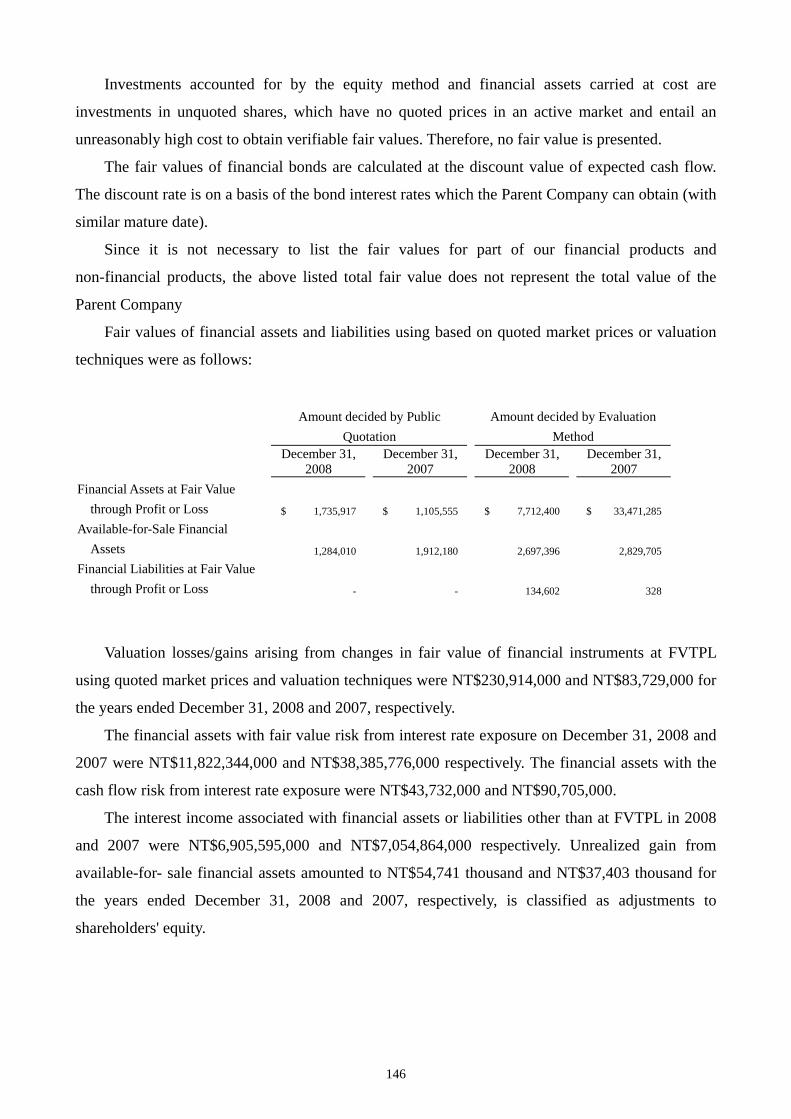
Investments accounted for by the equity method and financial assets carried at cost are
investments in unquoted shares, which have no quoted prices in an active market and entail an
unreasonably high cost to obtain verifiable fair values. Therefore, no fair value is presented.
The fair values of financial bonds are calculated at the discount value of expected cash flow.
The discount rate is on a basis of the bond interest rates which the Parent Company can obtain (with
similar mature date).
Since it is not necessary to list the fair values for part of our financial products and
non-financial products, the above listed total fair value does not represent the total value of the
Parent Company
Fair values of financial assets and liabilities using based on quoted market prices or valuation
techniques were as follows:
Amount decided by Public Quotation
Amount decided by Evaluation Method
December 31,
2008 December 31,
2007 December 31,
2008 December 31,
2007 Financial Assets at Fair Value
through Profit or Loss $ 1,735,917 $ 1,105,555 $ 7,712,400 $ 33,471,285
Available-for-Sale Financial Assets 1,284,010 1,912,180 2,697,396 2,829,705
Financial Liabilities at Fair Value through Profit or Loss - - 134,602 328
Valuation losses/gains arising from changes in fair value of financial instruments at FVTPL
using quoted market prices and valuation techniques were NT$230,914,000 and NT$83,729,000 for
the years ended December 31, 2008 and 2007, respectively.
The financial assets with fair value risk from interest rate exposure on December 31, 2008 and
2007 were NT$11,822,344,000 and NT$38,385,776,000 respectively. The financial assets with the
cash flow risk from interest rate exposure were NT$43,732,000 and NT$90,705,000.
The interest income associated with financial assets or liabilities other than at FVTPL in 2008
and 2007 were NT$6,905,595,000 and NT$7,054,864,000 respectively. Unrealized gain from
available-for- sale financial assets amounted to NT$54,741 thousand and NT$37,403 thousand for
the years ended December 31, 2008 and 2007, respectively, is classified as adjustments to
shareholders' equity.
146

Financial Risks
Credit Risk
A great amount of credit occurs due to the operations of loans and credit cards services.
Generally, the terms of these instruments last mostly over seven years. The interest rates for
loans ranged from 0% to 19.61% in 2008 and 0% to 19.94% in 2007, and the highest interest
rate for credit cards was 19.71%. The Parent Company also offers guarantee for customer
performance to the third party. The said guarantee agreement usually lasts for one year. The
maturity dates for the guarantee agreements vary from each other.
The maximum credit risk exposures of various financial assets are the same as carrying
values. Please refer to accompanying financial statements. The contract amounts of financial
assets with off -balance-sheet credit risks held by the Parent Company as of December 31,
2008 and 2007 were as follows:
December 31, 2008 December 31, 2007
$ 10,302,671 $ 11,642,869 Loan Commitments 6,124,936 9,974,181 Guarantees and Master L/C 600,397 639,956 Credit Card Commitment
Since many of the commitments are expected to expire without being drawn upon, the total
commitment amounts do not necessarily represent future cash requirements. The total potential
loss is equal to the above contractual amounts if commitments are completely drawn upon and
the counterparty’s default, without considering the value of any collateral.
Strict credit evaluation will be conducted while offering loans, guarantees and master L/C
by the Parent Company. We will request specific customers to provide proper guarantees before
we appropriate the approved loans to them. The ratios of loans with guarantees to total loans
are 75.04% in 2008 and 95.07% in 2007. The guaranty against loans, guarantee and master L/C
usually requested could be real estate, C.D, current securities or other properties. When
customers breach the agreement, the Parent Company will be forced to execute its obligations
on such guaranty.
147

No guaranty is required for using credit cards. Periodical evaluation on the credit of card
holders will be conducted. Credit quota will be adjusted if necessary.
Prominent concentration of credit risks occurs when transaction parties for financial
instruments prominently concentrate on one party, or on a few that are in similar business lines
or exhibit similar economic characteristics. The Parent Company has not engaged in
transactions that involved a prominent concentration of one client or one transaction party.
The prominent concentration of credit risk is detailed as follows by transaction parties,
industries and regions (Top 3 ratio of the credit amount to total credit amount are listed below):
Object December 31, 2008 December 31, 2007 Natural Person $ 116,223,356 $ 120,286,285 Private Enterprise 44,326,353 46,994,084 Government Agency 2,631,482 3,622,822
$ 163,181,191 $ 170,903,191
Industrial Type December 31, 2008 December 31, 2007 Manufacturing Business $ 13,035,336 $ 14,279,694 Wholesales & Retail Business 7,509,283 9,452,694 Service Business 5,468,461 4,787,119
$ 26,013,080 $ 28,519,507
Area December 31, 2008 December 31, 2007 Domestic Area $ 164,212,809 $ 171,923,168 Europe 1,563,364 1,332,379 Asia 1,390,205 935,810 Other Areas 1,610,733 1,374,461
$ 168,777,111 $ 175,565,818
148
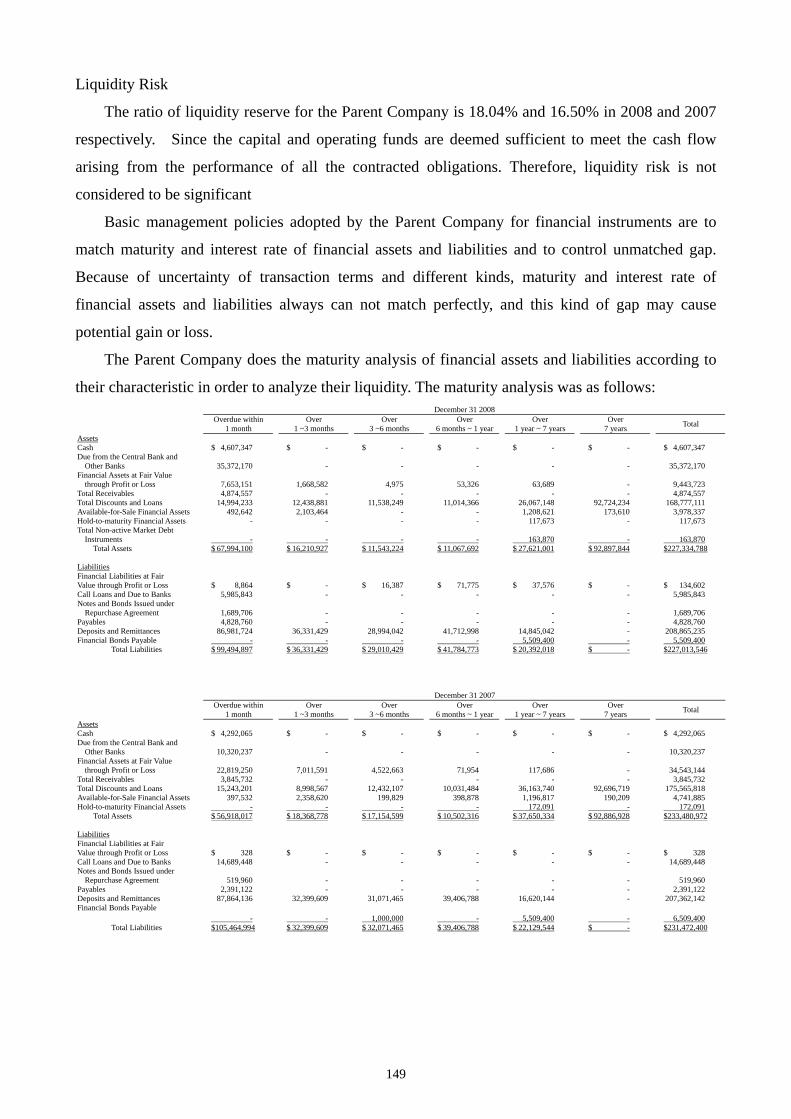
149
Liquidity Risk
The ratio of liquidity reserve for the Parent Company is 18.04% and 16.50% in 2008 and 2007
respectively. Since the capital and operating funds are deemed sufficient to meet the cash flow
arising from the performance of all the contracted obligations. Therefore, liquidity risk is not
considered to be significant
Basic management policies adopted by the Parent Company for financial instruments are to
match maturity and interest rate of financial assets and liabilities and to control unmatched gap.
Because of uncertainty of transaction terms and different kinds, maturity and interest rate of
financial assets and liabilities always can not match perfectly, and this kind of gap may cause
potential gain or loss.
The Parent Company does the maturity analysis of financial assets and liabilities according to
their characteristic in order to analyze their liquidity. The maturity analysis was as follows: December 31 2008
Overdue within
1 month Over 1 ~3 months
Over 3 ~6 months
Over 6 months ~ 1 year
Over 1 year ~ 7 years Over
7 years Total
Assets Cash $ 4,607,347 $ - $ - $ - $ - $ - $ 4,607,347 Due from the Central Bank and
Other Banks
35,372,170 - - - - - 35,372,170 Financial Assets at Fair Value
through Profit or Loss
7,653,151 1,668,582 4,975 53,326 63,689 - 9,443,723 Total Receivables 4,874,557 - - - - - 4,874,557 Total Discounts and Loans 14,994,233 12,438,881 11,538,249 11,014,366 26,067,148 92,724,234 168,777,111 Available-for-Sale Financial Assets 492,642 2,103,464 - - 1,208,621 173,610 3,978,337 Hold-to-maturity Financial Assets - - - - 117,673 - 117,673 Total Non-active Market Debt
Instruments
- - - - 163,870 - 163,870
Total Assets $ 67,994,100 $ 16,210,927 $ 11,543,224 $ 11,067,692 $ 27,621,001 $ 92,897,844 $227,334,788 Liabilities Financial Liabilities at Fair Value through Profit or Loss
$ 8,864 $ - $ 16,387 $ 71,775 $ 37,576 $ - $ 134,602
Call Loans and Due to Banks 5,985,843 - - - - - 5,985,843 Notes and Bonds Issued under
Repurchase Agreement
1,689,706 - - - - - 1,689,706 Payables 4,828,760 - - - - - 4,828,760 Deposits and Remittances 86,981,724 36,331,429 28,994,042 41,712,998 14,845,042 - 208,865,235 Financial Bonds Payable - - - - 5,509,400 - 5,509,400
Total Liabilities $ 99,494,897 $ 36,331,429 $ 29,010,429 $ 41,784,773 $ 20,392,018 $ - $227,013,546
December 31 2007
Overdue within
1 month Over 1 ~3 months
Over 3 ~6 months
Over 6 months ~ 1 year
Over 1 year ~ 7 years Over
7 years Total
Assets Cash $ 4,292,065 $ - $ - $ - $ - $ - $ 4,292,065 Due from the Central Bank and
Other Banks
10,320,237 - - - - - 10,320,237 Financial Assets at Fair Value
through Profit or Loss
22,819,250 7,011,591 4,522,663 71,954 117,686 - 34,543,144 Total Receivables 3,845,732 - - - - - 3,845,732 Total Discounts and Loans 15,243,201 8,998,567 12,432,107 10,031,484 36,163,740 92,696,719 175,565,818 Available-for-Sale Financial Assets 397,532 2,358,620 199,829 398,878 1,196,817 190,209 4,741,885 Hold-to-maturity Financial Assets - - - - 172,091 - 172,091
Total Assets $ 56,918,017 $ 18,368,778 $ 17,154,599 $ 10,502,316 $ 37,650,334 $ 92,886,928 $233,480,972 Liabilities Financial Liabilities at Fair Value through Profit or Loss
$ 328 $ - $ - $ - $ - $ - $ 328
Call Loans and Due to Banks 14,689,448 - - - - - 14,689,448 Notes and Bonds Issued under
Repurchase Agreement
519,960 - - - - - 519,960 Payables 2,391,122 - - - - - 2,391,122 Deposits and Remittances 87,864,136 32,399,609 31,071,465 39,406,788 16,620,144 - 207,362,142 Financial Bonds Payable
- - 1,000,000 - 5,509,400 - 6,509,400
Total Liabilities $105,464,994 $ 32,399,609 $ 32,071,465 $ 39,406,788 $ 22,129,544 $ - $231,472,400

30.Capital Adequacy Ratio The Banking Law and related regulations require that the Bank maintain a capital adequacy
ratio (CAR) of at least 8%. Thus, if the Bank's CAR falls below 8%, the authority may impose
certain restrictions on its earning distribution.
Year 12/31/2008 12/31/2007 Analytical Items $ 9,005,070 $ 11,103,321 Tier-1 capital
Tier-2 capital 5,805,817 6,250,416 Tier 3 Capital - -
Own Capital
Own Capital 14,810,887 17,353,737 147,361,977 153,170,021 Standardized Approach
Internal Ratings-based Approach - - Credit Risk
23,535 683,428 Asset Securitization 7,514,573 8,646,870 Basic Indicator Approach
Standardized Approach / Alternative Standardized Approach
- - Operational Risk
Advanced Measurement Approach - -
Risk- Weighted
Assets
9,120,754 12,316,349 Standardized Approach Market Risk - - Internal Model Approach
Risk-Weighted Assets 164,020,839 174,816,668 9.03% 9.93% Capital Adequacy 5.49% 6.35% Tier 1 Capital to Risk Asset 3.54% 3.58% Tier 2 Capital to Risk Asset - - Tier 3 Capital to Risk Asset 5.20% 5.06% Total Common Stock to Total Asset
Self-owned Capital = Tier 1 Capital +Tier II Capital + Tier III Capital Risk-Weighted Assets = Credit Risk Weighted Risk Asset + Capital Requirement of
Operational Risk and Market Risk × 12.5 Capital Adequacy = Self-owned Capital/ Risk-Weighted Assets Tier 1 Capital to Risk Asset = Tier I Capital/Risk-Weighted Assets Tier 2 Capital to Risk Asset = Tier II Capital/Risk-Weighted Assets Tier 3 Capital to Risk Asset = Capital III Capital/Risk-Weighted Assets Total Common Stock to Total Asset = Total Common Stock/ Total Assets
150

151
31.Average Value and Average Rate of Yield Assets and Interest Payment Liabilities: Year 2008 Year 2007 Average Value Average Rate
% Average Value Average Rate %
Assets
Cash - Due from Banks $ 318,917 0.48 $ 419,741 0.24 Reverse Repurchase Note and Bond Investment 10,936 1.13 - - Due from the Central Bank and Other Banks 20,765,127 1.81 11,514,425 1.30 Financial Assets at Fair Value through Profit or
Loss
18,558,277 2.18 21,576,677
1.85 Available-for-Sale Financial Assets 4,237,278 2.33 4,670,479 2.14 Hold-to-maturity Financial Assets 155,949 2.48 249,911 2.28 Non-active Market Debt Instruments 237,296 4.76 - - Receivables 1,310,881 9.23 2,208,924 8.16 Discounts and Loans 171,031,926 3.67 188,996,420 3.50 Liabilities
Notes and Bonds Issued under Repurchase
Agreement
1,790,573 1.98 4,416,852
1.62 Funds Borrowed from Central Bank and Banks - - 459,171 3.50 Call Loans and Due to Banks 9,243,030 2.44 14,720,632 2.16 Current Deposit 13,303,846 0.28 14,355,880 0.34 Current Savings Deposit 39,551,490 0.63 46,912,529 0.67 Time Deposit 59,837,625 2.70 44,143,405 2.44 Time Savings Deposit 85,160,030 2.64 91,143,193 2.24 Treasury Deposit 212,223 0.95 206,637 1.12 Negotiable Certificate of Deposit 2,696,438 2.24 7,940,510 1.95 Financial Bonds Payable 5,874,991 3.02 6,115,901 3.21
Parent Company’s Loan assets quality, concentration of crediting risk, sensitive information of
interest rates, profitability and structure analysis of the maturation of NTD
Loan Assets Quality 12/31/2008 12/31/2007
Business / Items Amount of
non-performing loans (Note 1)
Gross loansNon-performin
g loan ratio (%) (Note 2)
Allowance for doubtful
accounts
Average ratio (%) (Note 3)
Amount of non-performi
ng loans (Note
1)
Gross loans Non-performing loan ratio
(%) (Note 2)
Allowance for doubtful
accounts
Average ratio (%) (Note 3)
Secured loans 1,120,922 21,212,405 5.28% 278,901 24.88% 1,073,096 25,042,205 4.29% 355,591 33.14%Corporate Banking Unsecured loans 1,028,617 31,872,045 3.23% 1,540,256 149.74% 1,374,035 31,386,840 4.38% 1,355,567 98.66%
Residential mortgage loans (Note 4) 858,036 50,697,592 1.69% 233,567 27.22% 986,996 54,346,734 1.82% 229,128 23.21%
Cash card services - - - - - - - - - -Consumer banking Small amount of credit loans
(Note 5) 160,704 5,463,586 2.94% 94,322 58.69% 350,530 6,485,236 5.41% 359,177 102.47%
Secured loans 1,120,962 56,520,922 1.98% 250,989 22.39% 1,142,517 54,692,802 2.09% 280,710 24.57% Others ( N o t e 6 ) Unsecured loans 103,105 3,010,561 3.42% 80,681 78.25% 106,455 3,612,001 2.95% 93,154 87.51%
Gross loan business 4,392,346 168,777,111 2.60% 2,478,716 56.43% 5,033,629 175,565,818 2.87% 2,673,327 53.11%
Amount of
overdue accounts
Balance of accounts
Receivable Overdue
account ratio (%)
Overdue account ratio
(%)
Allowance for doubtful
accounts
Coverage ratio
Amount of overdue accounts
Balance of accounts
Receivable Overdue
account ratio (%)
Overdue account ratio
(%)
Allowance for doubtful
accounts
Coverage ratio
Credit card services 25,402 988,141 2.57% 23,474 92.41% 38,042 1,378,493 2.76% 77,084 202.63%Without recourse factoring
(Note 7) - - - - - - - - - -Overdue loans with debt negotiated terms which
have been performed and exempted from reporting as non-performing loan ( Note 8)
59,377 91,013
Overdue receivables with debt negotiated terms which have been performed and exempted from reporting as non-performing loan (Note 8)
372,141 548,674
Amounts of executed debt-restructuring projects not reported as nonperforming loans or receivables (Note 9)
25,175 -
Note 1: Nonperforming loans are in accordance with the Regulations of the Procedures for Banking Institutions to
Evaluate Assets and Deal with Past Due/Nonperforming Loans and Bad Debts issued by Ministry of
Finance. Non-performing loans of credit cards are defined in the Letter issued by the Financial Supervisory
Commission, Executive Yuan with File No. Chin-kuan-yin- (IV) No. 0944000378 dated July 6, 2005.
Note 2: Non performing loans ratio = Nonperforming loan ÷ Loans Nonperforming loans of credit card ratio =
Nonperforming loans of credit cards ÷ Accounts receivable
Note 3: Coverage ratio of allowances for loan losses = Allowances for loan losses ÷ Nonperforming loans Coverage
ratio of allowance for loan losses of credit card = Allowance for loan losses of credit card ÷ Nonperforming
loans of credit cards
Note 4: Mortgage loans are for borrowers to build or repair buildings, providing the borrowers, spouse or minor
children to fully collateralize their buildings and install the right on mortgage to financial institutions.
Note 5: Credit loans are to fit in the Letter issued by the Financial Supervisory Commission, Executive Yuan with
File No. Chin-kuan-yin- (IV) No. 09440010950 dated December 19, 2005, excluding credit loans of credit
cards and cash cards.
Note 6: The other consumer financial businesses are defined as secured or unsecured consumer financial businesses,
excluding mortgage loans, cash cards, credit loans and credit cards.
Note 7: In accordance with the Letter issued by the Financial Supervisory Commission, Executive Yuan with File
No. Chin-kuan-yin- (V) No. 094000494 dated July 19, 2005, non-recourse receivable factorings are not
defined as non-performing loans until compensation from factors or insurance companies are ascertained to
be non-recoverable.
Note 8: Overdue loans and receivables with debt negotiated terms which have been performed are exempted from
reporting as non-performing loan under the requirement issued by the Banking Bureau dated April 25, 2006
(Ref. No. 09510001270)\
Note 9: Amounts of executed debt-restructuring projects not reported as nonperforming loans or receivables are
disclosed to the public in accordance with the Banking Bureau’s letter dated September 15, 2008 (Ref. No.
09700318940)
152

Concentration of Crediting Risk 12/31/2008
Top 10 (Note 1)
Total Accredited Balance (Note 3)
Net Value Proportion (%) Company Name (Note 2)
1 $ 1,555,228 14.63 China Trust Financial Holding 2 1,360,033 12.79 Evergreen Marine Corporation
3 1,167,123 10.98 Uni-President Enterprises Corp.
4 1,091,001 10.26 Formosa Plastics Corporation
5 916,614 8.62 Tatung Co.
6 749,760 7.05 Taiwan Cement Corporation
7 746,000 7.02 Far Eastern Textile Ltd.
8 709,999 6.68 China Airline 9 689,428 6.49 China Steel 10 595,313 5.60 Shin Kong Financial Holding
December 31, 2007 Top 10
(Note 1) Total Accredited Balance (Note 3)
Net Value Proportion (%) Company Name (Note 2)
China Trust Financial Holding Co., Ltd. 1 $ 1,952,089 15.45
2 1,865,944 14.77 Evergreen Marine Corporation
3 1,654,369 13.10 Qisda Corporation
4 1,297,800 10.27 Tatung Co.
5 1,279,420 10.13 Uni-President Enterprises Corp.
6 1,194,000 9.45 Far Eastern Textile Ltd.
7 1,072,905 8.49 Formosa Plastics Corporation
8 1,046,271 8.28 Walsin Lihwa Corporation
9 1,039,000 8.23 Yuen Foong Yu Paper Mfg. Co., Ltd.
10 1,038,000 8.22 Taiwan Cement Corporation
Note 1 : Sort by the balance of loans on December 31, 2007, excluding government or state-run business.
Note 2 : Transaction party is in accordance with the article 6 of the Supplementary Provisions to the Taiwan Stock Exchange Corporation Criteria for Review of Securities Listings.
Note 3 : Loans include import and export bill negotiations, bills discounted, overdraft, short-term loan, short-term secured loan, receivable financing, medium-term loan, medium-term secured loan, long-term loan, long-term secured loan, delinquent loans, inward remittances, factoring without recourse, acceptance, and guarantee.
153

Sensitive Information of Interest Rates
Sensitivity Analysis of Interest Rate for Assets and Liabilities (NTD) December 31, 2008
Expressed in NT$ Thousands, % Items 1-90 days 91-180 days 181-1 year Over 1 year Total
Interest-rate-sensitive Assets $ 165,215,183 $ 14,421,286 $ 5,741,179 $ 17,534,862 $ 202,912,510Interest-rate-sensitive Liabilities 89,251,828 71,972,149 32,400,186 19,120,827 212,744,990Interest-rate-sensitive Gap 75,963,355 ( 57,550,863 ) ( 26,659,007 ) ( 1,585,965 ) ( 9,832,480 )Net Value 11,818,242Ratio of Interest-rate-sensitive Assets to Interest-rate-sensitive Liabilities (%) 95.38% Ratio of Interest-rate-sensitive Gap to Shareholders’ Equity (%) ( 83.20% )
December 31, 2007
Expressed in NT$ Thousands, %
Items 1-90 days 91-180 days 181-1 year Over 1 year Total $ 175,054,542 $ 10,948,270 $ 1,204,194 $ 22,926,565 $ 210,133,571Interest-rate-sensitive Assets 95,914,881 80,411,515 24,749,223 17,668,424 218,744,043Interest-rate-sensitive Liabilities
( 23,545,029 ) 5,258,141 ( 8,610,472 ) 79,139,661 ( 69,463,245 )Interest-rate-sensitive Gap Net Value 12,605,355
96.06%Ratio of Interest-rate-sensitive Assets to Interest-rate-sensitive Liabilities (%) ( 68.31% )Ratio of Interest-rate-sensitive Gap to Shareholders’ Equity (%)
Note: The amounts listed above include accounts in NT dollars only (i.e., excluding foreign
currency) for both head office and domestic and foreign branches.
Interest-sensitive assets and liabilities are interest-earning assets and interest bearing
liabilities with income or cost affected by interest rate fluctuations.
Interest sensitivity gap = Interest-sensitive assets - Interest-sensitive liabilities
Ratio of interest-sensitive assets to interest-sensitive liabilities = (Interest-sensitive assets/
Interest-sensitive liabilities)
154
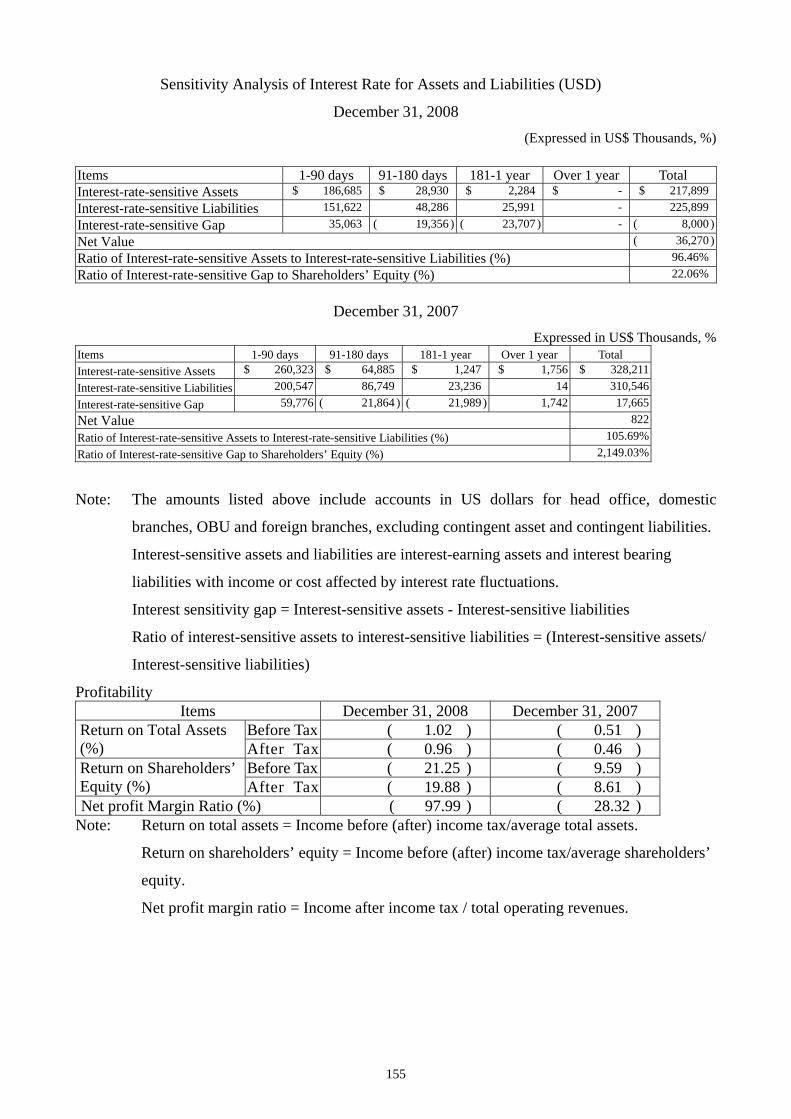
Sensitivity Analysis of Interest Rate for Assets and Liabilities (USD)
December 31, 2008 (Expressed in US$ Thousands, %)
Items 1-90 days 91-180 days 181-1 year Over 1 year Total Interest-rate-sensitive Assets $ 186,685 $ 28,930 $ 2,284 $ - $ 217,899Interest-rate-sensitive Liabilities 151,622 48,286 25,991 - 225,899Interest-rate-sensitive Gap 35,063 ( 19,356 ) ( 23,707 ) - ( 8,000 )Net Value ( 36,270 )Ratio of Interest-rate-sensitive Assets to Interest-rate-sensitive Liabilities (%) 96.46%Ratio of Interest-rate-sensitive Gap to Shareholders’ Equity (%) 22.06%
December 31, 2007
Expressed in US$ Thousands, % Items 1-90 days 91-180 days 181-1 year Over 1 year Total
$ 260,323 $ 64,885 $ 1,247 $ 1,756 $ 328,211 Interest-rate-sensitive Assets 200,547 86,749 23,236 14 310,546 Interest-rate-sensitive Liabilities 59,776 ( 21,864 ) ( 21,989 ) 1,742 17,665 Interest-rate-sensitive Gap
Net Value 822 105.69% Ratio of Interest-rate-sensitive Assets to Interest-rate-sensitive Liabilities (%) 2,149.03% Ratio of Interest-rate-sensitive Gap to Shareholders’ Equity (%)
Note: The amounts listed above include accounts in US dollars for head office, domestic
branches, OBU and foreign branches, excluding contingent asset and contingent liabilities.
Interest-sensitive assets and liabilities are interest-earning assets and interest bearing
liabilities with income or cost affected by interest rate fluctuations.
Interest sensitivity gap = Interest-sensitive assets - Interest-sensitive liabilities
Ratio of interest-sensitive assets to interest-sensitive liabilities = (Interest-sensitive assets/
Interest-sensitive liabilities)
Profitability Items December 31, 2008 December 31, 2007
Before Tax ( 1.02 ) ( 0.51 ) Return on Total Assets (%) After Tax ( 0.96 ) ( 0.46 )
Before Tax ( 21.25 ) ( 9.59 ) Return on Shareholders’ Equity (%) After Tax ( 19.88 ) ( 8.61 ) Net profit Margin Ratio (%) ( 97.99 ) ( 28.32 )
Note: Return on total assets = Income before (after) income tax/average total assets.
Return on shareholders’ equity = Income before (after) income tax/average shareholders’
equity.
Net profit margin ratio = Income after income tax / total operating revenues.
155
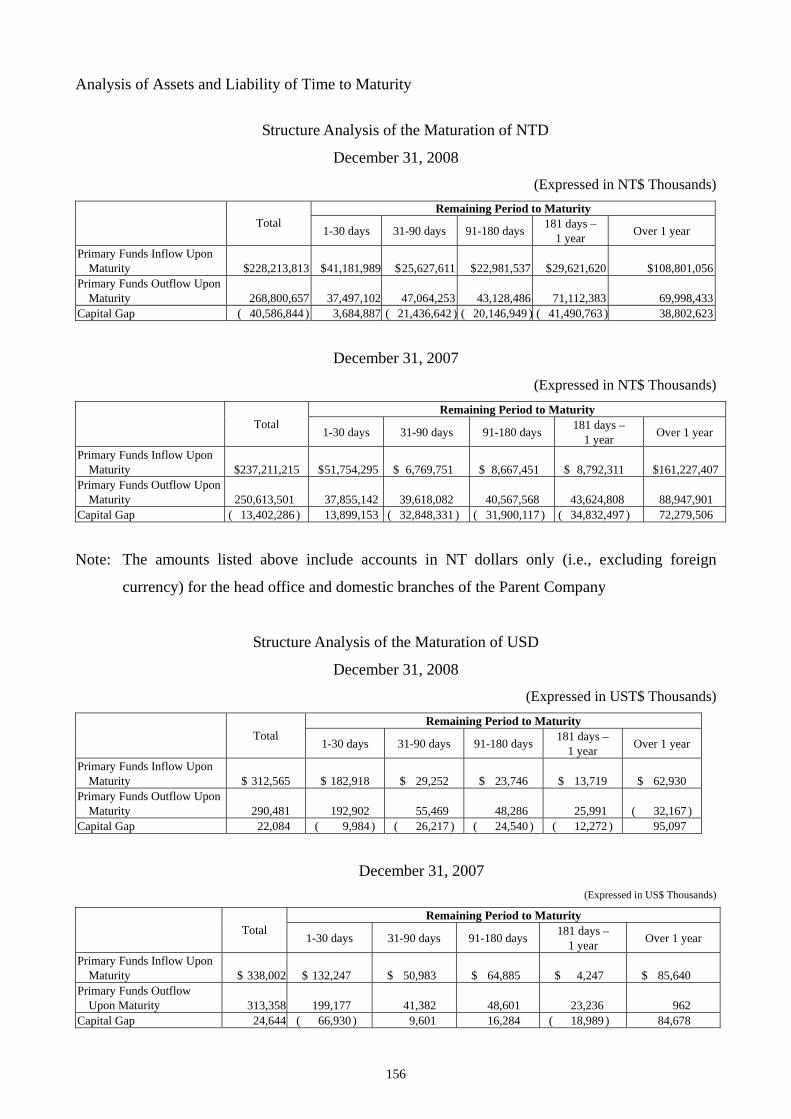
Analysis of Assets and Liability of Time to Maturity
Structure Analysis of the Maturation of NTD
December 31, 2008
(Expressed in NT$ Thousands) Remaining Period to Maturity
Total 181 days – 1 year 1-30 days 31-90 days 91-180 days Over 1 year
Primary Funds Inflow Upon Maturity $228,213,813 $ 41,181,989 $ 25,627,611 $ 22,981,537 $ 29,621,620 $108,801,056
Primary Funds Outflow Upon Maturity 268,800,657 37,497,102 47,064,253 43,128,486 71,112,383 69,998,433
Capital Gap ( 40,586,844 ) 3,684,887 ( 21,436,642 ) ( 20,146,949 ) ( 41,490,763 ) 38,802,623
December 31, 2007
(Expressed in NT$ Thousands)
Remaining Period to Maturity Total 181 days –
1 year 1-30 days 31-90 days 91-180 days Over 1 year
Primary Funds Inflow Upon Maturity $237,211,215 $ 51,754,295 $ 6,769,751 $ 8,667,451 $ 8,792,311 $161,227,407
Primary Funds Outflow Upon Maturity 250,613,501 37,855,142 39,618,082 40,567,568 43,624,808 88,947,901
Capital Gap ( 13,402,286 ) 13,899,153 ( 32,848,331 ) ( 31,900,117 ) ( 34,832,497 ) 72,279,506
Note: The amounts listed above include accounts in NT dollars only (i.e., excluding foreign
currency) for the head office and domestic branches of the Parent Company
Structure Analysis of the Maturation of USD
December 31, 2008
(Expressed in UST$ Thousands)
Remaining Period to Maturity Total 181 days –
1 year 1-30 days 31-90 days 91-180 days Over 1 year
Primary Funds Inflow Upon Maturity $ 312,565 $ 182,918 $ 29,252 $ 23,746 $ 13,719 $ 62,930
Primary Funds Outflow Upon Maturity 290,481 192,902 55,469 48,286 25,991 ( 32,167 )
Capital Gap 22,084 ( 9,984 ) ( 26,217 ) ( 24,540 ) ( 12,272 ) 95,097
December 31, 2007 (Expressed in US$ Thousands)
Remaining Period to Maturity Total 181 days –
1 year 1-30 days 31-90 days 91-180 days Over 1 year
Primary Funds Inflow Upon Maturity $ 338,002 $ 132,247 $ 50,983 $ 64,885 $ 4,247 $ 85,640
Primary Funds Outflow Upon Maturity 313,358 199,177 41,382 48,601 23,236 962
Capital Gap 24,644 ( 66,930 ) 9,601 16,284 ( 18,989 ) 84,678
156
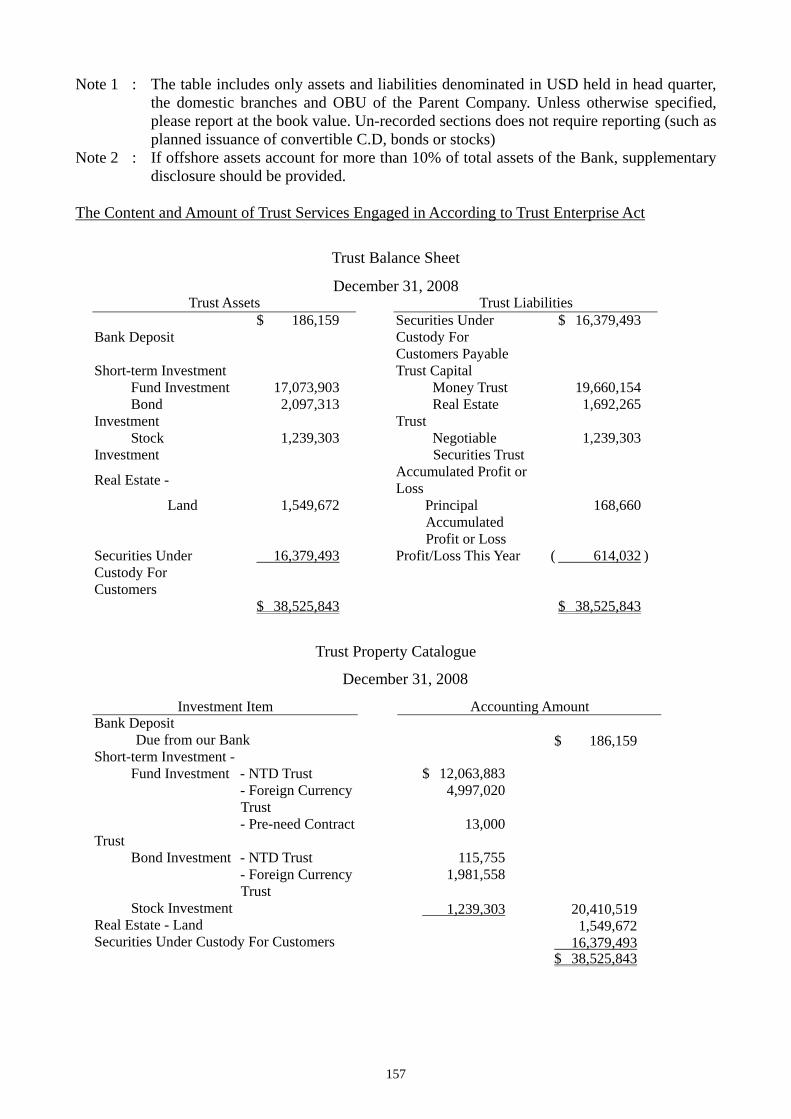
Note 1 : The table includes only assets and liabilities denominated in USD held in head quarter, the domestic branches and OBU of the Parent Company. Unless otherwise specified, please report at the book value. Un-recorded sections does not require reporting (such as planned issuance of convertible C.D, bonds or stocks)
Note 2 : If offshore assets account for more than 10% of total assets of the Bank, supplementary disclosure should be provided.
The Content and Amount of Trust Services Engaged in According to Trust Enterprise Act
Trust Balance Sheet
December 31, 2008 Trust Assets Trust Liabilities
$ 186,159 Securities Under Custody For Customers Payable
$ 16,379,493 Bank Deposit
Short-term Investment Trust Capital Fund Investment 17,073,903 Money Trust 19,660,154 Bond
Investment 2,097,313 Real Estate
Trust 1,692,265
Stock Investment
1,239,303 Negotiable Securities Trust
1,239,303
Accumulated Profit or Loss
Real Estate -
Land 1,549,672 Principal Accumulated Profit or Loss
168,660
Securities Under Custody For Customers
16,379,493 Profit/Loss This Year ( 614,032
)
$ 38,525,843 $ 38,525,843
Trust Property Catalogue
December 31, 2008
Investment Item Accounting Amount Bank Deposit
Due from our Bank $ 186,159 Short-term Investment - Fund Investment - NTD Trust $ 12,063,883 - Foreign Currency
Trust 4,997,020
13,000 - Pre-need Contract Trust
Bond Investment - NTD Trust 115,755 - Foreign Currency
Trust 1,981,558
Stock Investment 1,239,303 20,410,519
Real Estate - Land 1,549,672 Securities Under Custody For Customers 16,379,493
$ 38,525,843
157

Trust Income Statement
Year 2008
Investment Item Accounting Amount Trust Income Interest $ 4,130 Dividend 713,556 Gain on Sale of Properties 179,468 Realized capital gain 41,673 $ 938,827
Trust Expenses Administrative Expenses 9,756
Tax 71,153 Interest 113 Commission 5,965 Loss on Sale of Properties 1,465,657 Realized Exchange Loss 215 1,552,859
( $ 614,032 )
Note: The above Income Statement represents the income of trusted assets in Trust Department of
the Parent Company and is not included in income of the Parent Company.
Trust Balance Sheet
December 31, 2007
Trust Assets Trust Liabilities Bank Deposit $ 410,931 Other Liabilities $ - Short-term Investment
Trust Capital
Fund Investment
19,017,640 Money Trust 21,223,149
Bond Investment
1,495,915 Real Estate Trust
2,307,402
1,267,403 Negotiable Securities Trust
1,267,403 Stock Investment
Accumulated Profit or Loss
Real Estate-
Land 2,232,985 Principal Accumulated Profit or Loss
( 1,718,754 )
Profit/Loss This Year
1,345,674
$ 24,424,874 $ 24,424,874
158

Trust Property Catalogue
December 31, 2007
Investment Item Accounting Amount Bank Deposit
Due from our Bank $ 410,931 Short-term Investment - Fund Investment - NTD Trust $ 13,429,587 - Foreign
Currency Trust
5,585,053
- Pre-need Contract Trust
3,000
Bond Investment - NTD Trust 501,157 - Foreign
Currency Trust
994,758
Stock Investment 1,267,403 21,780,958
Real Estate - Land 2,232,985
$ 24,424,874
Trust Income Statement
Year 2007
Investment Item Accounting Amount Trust Income Interest $ 3,685
Rent 67,682 Dividend 656,025 Gain on Sale of Properties 901,543 Realized capital gain 59,773 $ 1,688,708
Trust Expenses Administrative Expenses 95,569
Tax 38,678 Interest 715 Commission 6,102 Loss on Sale of Properties 192,552 Income Tax 498 Other Expenses 8,920 343,034
$ 1,345,674
Note: The above Income Statement represents the income of trusted assets in Trust Department
of the Parent Company and is not included in income of the Parent Company.
159

Disclosures Under Statutory Requirements
Other than Table 1-3, no other information should be disclosed.
Financial Information by Department
Industry information
The main businesses that Parent Company and subsidiaries that engaged in are all
commercial banking operations allowed legally. However, the revenue, income/loss and
recognizable assets of the department should account for over 90% of totaled according items
of industrial departments.
Regional Information
Until the end of 2008, the Parent Company and the subsidiaries have not established
overseas operating departments.
Admission to export information
Until the end of 2008, the Parent Company and the subsidiaries don't have export
admission.
Major customers
The Parent Company and the subsidiaries do not have net income exceeds Admission
Interests of over 10% from a single client.
160

Sunny Bank Ltd. and Subsidiaries
Information on Invested Enterprises
Year 2008
Table 1
Unit: NT$ Thousands Consolidated Holdings by the Bank and Subsidiaries and Affiliated Enterprises ( N o t e 2 )
Year End Holding
T o t a lInvested Company
Investee Company Location
Major Business
Items Percentage ( % )
P a r V a l u e
Yearly Income
for Investee
Company
Yearly Recognized
Invested Income
Current Share
Holding
Conjectural share
holding
R e m a r kShares
Percentage ( 1,000 shares)
(1,000 shares)
(1,000 shares)
(%)
Our Bank
Sunny Securities Co., Ltd.
Taipei City
Securities Investment
97.7 $207,517 ($18,903) ($18,465) 29,500 - 29,500 97.7 Subsidiaries( Note 3)
Gold Sunny Assets
Taipei City
100.0 19,258 (17,386) (17,386) 5,000 - 5,000 100.0 SubsidiariesFinancial Institution Creditor's Right (Money) Appraisal and Auction
( Note 3)Management Co., Ltd.
Sunny Life Insurance
Taipei City
Life Insurance Brokerage
39.9 10,228 5,085 2,500 1,500 - 1,500 99.9 Subsidiaries (Note 1) ( Note 3)
Agent Co., Ltd.
Sunny Property Insurance Brokerage Co., Ltd.
Taipei City
20.0 1,557 1,000 200 605 - 605 100.0 SubsidiariesProperty Insurance Brokerage
( Note 3)
Ontario Securities Investment Trust
20.0 38,762 (31,748) - 6,006 - 6,006 20.0 Company Invested at Equity Method
Securities Investment Trust Services
Taipei City
Note 1: Including investment gains at NT$2,033,000, the amortization of the difference between investment cost and net equity at NT$467,000.
Note 2: Current or Conjectural share holdings of invested enterprises by the Bank, directors, supervisors, presidents, vice presidents and affiliated
enterprises in conformity of the definition of Company Law are incorporated. Note 3: Related content is written off during the production of consolidated financial reports.
161

Sunny Bank Ltd.
Account Receivables for Related Parties reached NT$300 millions or Collected Capital over
10%
December 31, 2008 Table 2 Unit: NT$ Thousands
Overdue Receivables
for Related Parties Balance of Account
Receivables for Related
Parties
Final Repurchased Amount of
Receivables for Related Parties
Prov-Bad Debt Reserve
Amount
Company of Account Receivables
Turnover Rate Trading Company Relationship Processing
Method Amount
Sunny Bank Ltd. Gold Sunny Assets
Management Co., Ltd. Subsidiaries $ 970,857 Not
Applicable for Financial Business
None Not Applicable
$ 11,635 $ 70,029
Note: Represents accounts receivable for sale of NPL to Sunny Assets Management
162
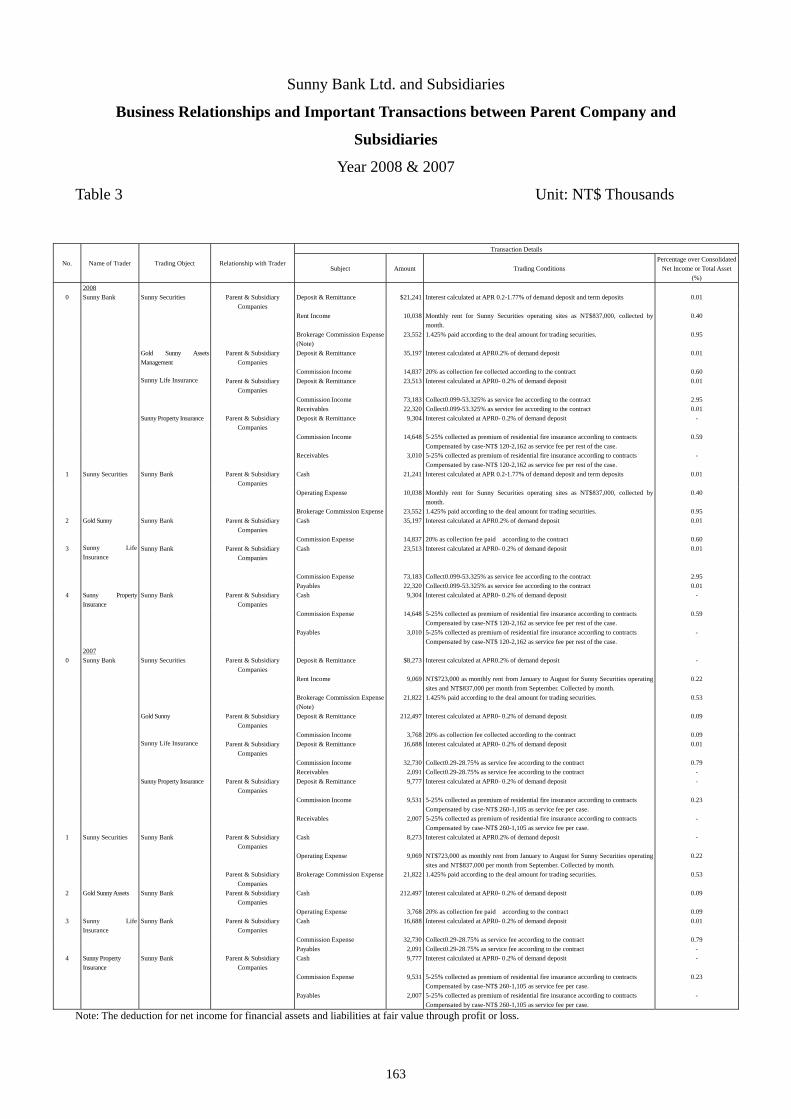
163
Sunny Bank Ltd. and Subsidiaries
Business Relationships and Important Transactions between Parent Company and
Subsidiaries
Year 2008 & 2007
Table 3 Unit: NT$ Thousands
Transaction Details
No. Name of Trader Trading Object Relationship with Trader Subject Amount Trading Conditions
Percentage over Consolidated Net Income or Total Asset
(%) 2008
0 Sunny Bank Sunny Securities Parent & Subsidiary Companies
Deposit & Remittance $21,241 Interest calculated at APR 0.2-1.77% of demand deposit and term deposits 0.01
Rent Income 10,038 Monthly rent for Sunny Securities operating sites as NT$837,000, collected by month.
0.40
Brokerage Commission Expense (Note)
23,552 1.425% paid according to the deal amount for trading securities. 0.95
Gold Sunny Assets Management
Parent & Subsidiary Companies
Deposit & Remittance 35,197 Interest calculated at APR0.2% of demand deposit 0.01
Commission Income 14,837 20% as collection fee collected according to the contract 0.60 Sunny Life Insurance
Parent & Subsidiary
Companies Deposit & Remittance 23,513 Interest calculated at APR0- 0.2% of demand deposit 0.01
Commission Income 73,183 Collect0.099-53.325% as service fee according to the contract 2.95 Receivables 22,320 Collect0.099-53.325% as service fee according to the contract 0.01 Sunny Property Insurance Parent & Subsidiary
Companies Deposit & Remittance 9,304 Interest calculated at APR0- 0.2% of demand deposit -
Commission Income 14,648 5-25% collected as premium of residential fire insurance according to contracts Compensated by case-NT$ 120-2,162 as service fee per rest of the case.
0.59
Receivables 3,010 5-25% collected as premium of residential fire insurance according to contracts Compensated by case-NT$ 120-2,162 as service fee per rest of the case.
-
1 Sunny Securities Sunny Bank Parent & Subsidiary Companies
Cash 21,241 Interest calculated at APR 0.2-1.77% of demand deposit and term deposits 0.01
Operating Expense 10,038 Monthly rent for Sunny Securities operating sites as NT$837,000, collected by month.
0.40
Brokerage Commission Expense 23,552 1.425% paid according to the deal amount for trading securities. 0.95 2 Gold Sunny Sunny Bank Parent & Subsidiary
Companies Cash 35,197 Interest calculated at APR0.2% of demand deposit 0.01
Commission Expense 14,837 20% as collection fee paid according to the contract 0.60 3 Sunny Life
Insurance
Sunny Bank Parent & Subsidiary Companies
Cash 23,513 Interest calculated at APR0- 0.2% of demand deposit 0.01
Commission Expense 73,183 Collect0.099-53.325% as service fee according to the contract 2.95 Payables 22,320 Collect0.099-53.325% as service fee according to the contract 0.01
4 Sunny Property Insurance
Sunny Bank Parent & Subsidiary Companies
Cash 9,304 Interest calculated at APR0- 0.2% of demand deposit -
Commission Expense 14,648 5-25% collected as premium of residential fire insurance according to contracts Compensated by case-NT$ 120-2,162 as service fee per rest of the case.
0.59
Payables 3,010 5-25% collected as premium of residential fire insurance according to contracts Compensated by case-NT$ 120-2,162 as service fee per rest of the case.
-
2007 0 Sunny Bank Sunny Securities Parent & Subsidiary
Companies Deposit & Remittance $8,273 Interest calculated at APR0.2% of demand deposit -
Rent Income 9,069 NT$723,000 as monthly rent from January to August for Sunny Securities operating sites and NT$837,000 per month from September. Collected by month.
0.22
Brokerage Commission Expense (Note)
21,822 1.425% paid according to the deal amount for trading securities. 0.53
Gold Sunny Parent & Subsidiary Companies
Deposit & Remittance 212,497 Interest calculated at APR0- 0.2% of demand deposit 0.09
Commission Income 3,768 20% as collection fee collected according to the contract 0.09 Sunny Life Insurance
Parent & Subsidiary
Companies Deposit & Remittance 16,688 Interest calculated at APR0- 0.2% of demand deposit 0.01
Commission Income 32,730 Collect0.29-28.75% as service fee according to the contract 0.79 Receivables 2,091 Collect0.29-28.75% as service fee according to the contract - Sunny Property Insurance Parent & Subsidiary
Companies Deposit & Remittance 9,777 Interest calculated at APR0- 0.2% of demand deposit -
Commission Income 9,531 5-25% collected as premium of residential fire insurance according to contracts Compensated by case-NT$ 260-1,105 as service fee per case.
0.23
Receivables 2,007 5-25% collected as premium of residential fire insurance according to contracts Compensated by case-NT$ 260-1,105 as service fee per case.
-
1 Sunny Securities Sunny Bank Parent & Subsidiary Companies
Cash 8,273 Interest calculated at APR0.2% of demand deposit -
Operating Expense 9,069 NT$723,000 as monthly rent from January to August for Sunny Securities operating sites and NT$837,000 per month from September. Collected by month.
0.22
Parent & Subsidiary Companies
Brokerage Commission Expense 21,822 1.425% paid according to the deal amount for trading securities. 0.53
2 Gold Sunny Assets Sunny Bank Parent & Subsidiary Companies
Cash 212,497 Interest calculated at APR0- 0.2% of demand deposit 0.09
Operating Expense 3,768 20% as collection fee paid according to the contract 0.09 3 Sunny Life
Insurance Sunny Bank Parent & Subsidiary
Companies Cash 16,688 Interest calculated at APR0- 0.2% of demand deposit 0.01
Commission Expense 32,730 Collect0.29-28.75% as service fee according to the contract 0.79 Payables 2,091 Collect0.29-28.75% as service fee according to the contract -
4 Sunny Property Insurance
Sunny Bank Parent & Subsidiary Companies
Cash 9,777 Interest calculated at APR0- 0.2% of demand deposit -
Commission Expense 9,531 5-25% collected as premium of residential fire insurance according to contracts Compensated by case-NT$ 260-1,105 as service fee per case.
0.23
Payables 2,007 5-25% collected as premium of residential fire insurance according to contracts Compensated by case-NT$ 260-1,105 as service fee per case.
-
Note: The deduction for net income for financial assets and liabilities at fair value through profit or loss.

6. Effects of Financial Difficulties Experienced by the Bank and Related Enterprises on the Bank
Financial Status in Most Recent Year and to the Annual Report Publication Date: None
VII. REVIEW OF FINANCIAL POSITION AND OPERATION RESULTS/ ANALYSIS
AND ASSESSMENT
1. Financial Position Analysis Unit: NT$ Thousands
Difference Year Item 2008 2007
Amount % Cash, Due from Central Bank and Other Banks $ 39,979,517 $ 14,612,302 $ 25,367,215 174 Financial Assets at Fair Value through Profit or Loss 9,443,723 34,543,144 (25,099,421) (73)Receivables 4,636,477 3,605,712 1,030,765 29 Discounts and Loans 166,298,395 172,892,491 (6,594,096) (4)Available-for-Sale Financial Assets 3,978,337 4,741,885 (763,548) (16)Hold-to-maturity Financial Assets 117,673 172,091 (54,418) (32)Equity Investments – Equity Method 277,322 273,722 3,600 1 Other Financial Instruments 313,648 397,261 (83,613) (21)Fixed Assets 9,369,343 9,500,231 (130,888) (1)Intangible Assets 1,071,830 1,181,348 (109,518) (9)Other Assets 2,725,407 2,850,480 (125,073) (4)Total Assets 238,211,672 244,770,667 (6,558,995) (3)Call Loans and Due to Banks 5,985,843 14,689,448 (8,703,605) (59)Financial Liabilities at Fair Value through Profit or Loss
134,602 328 134,274 40,937
Notes and Bonds Issued under Repurchase Agreement 1,689,706 519,960 1,169,746 225 Payables 4,828,760 2,391,122 2,437,638 102 Deposits and Remittances 208,865,235 207,362,142 1,503,093 1 Financial Bonds Payable 5,509,400 6,509,400 (1,000,000) (15)Reserve for Land Revaluation Increment Tax 133,726 261,507 (127,781) (49)Other Liabilities 434,871 404,703 30,168 7 Total Liabilities 227,582,143 232,138,610 (4,556,467) (2)Capital 12,439,281 12,439,281 - - Capital Surpluses 11,228 11,228 - - Retained Earnings (1,894,108) 417,792 (2,311,900) (553)Unrealized Profit or Loss on Financial Instruments 256,642 - 256,642 -Treasury Stock 37,599 (15,131) 52,730 348Total Shareholders’ Equity (221,113) (221,113) - -Unrealized Profit or Loss on Financial Instruments 10,629,529 12,632,057 (2,002,528) (16)Description for Changes in Increment Percentages: 1. The decrease in Cash, due from central bank and other banks, financial assets at fair value through profit or loss resulted mainly from the
decrease in financial products investment, the capital of which was transferred to undertaking the certificate of deposit of Central Bank. 2. The increase in receivables resulted from the increase in spot foreign exchange remittance receivable. 3. The decrease in financial assets held to maturity mainly results from the redemption of beneficiary certificates of counterparts according to
the contracts. 4. The decrease in other financial instrument mainly resulted from the redemption of preferred stock investment at maturity. 5. The decrease in due to Central Bank and other banks mainly results from the decrease in due to other banks. 6. The increase in financial liabilities at fair value through profit or loss mainly results from increase in evaluation loss for currency exchange. 7. The increase in bills & bonds sold under repurchase agreements mainly results from the lower interest rate costs, which increases
undertaking. 8. The increase in accounts payable mainly results from increase in foreign remittances and notes of other banks payable and exchange
accounts. 9. The decrease in reserve for land revaluation increment tax mainly resulted from land reevaluation. 10. The decrease in retained earnings mainly resulted from the increase in net loss of the period. 11. The increase in Unrealized Profit or Loss on Financial Instruments mainly resulted from the land reevaluation of the year. 12. Increases in unrealized gain on financial products mainly results from increase in evaluation gain on available-for-sale financial assets.
164
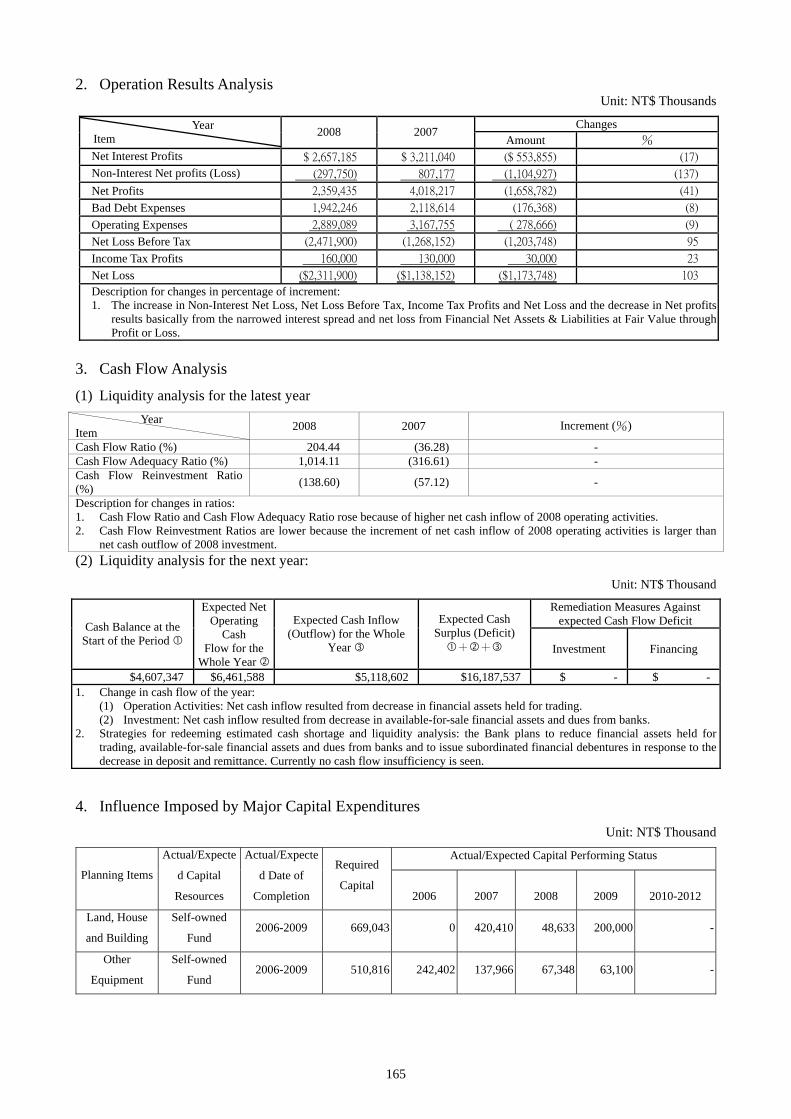
2. Operation Results Analysis Unit: NT$ Thousands
Changes Year Item 2008 2007
% Amount Net Interest Profits $ 2,657,185 $ 3,211,040 ($ 553,855) (17)
Non-Interest Net profits (Loss) (297,750) 807,177 (1,104,927) (137)
Net Profits 2,359,435 4,018,217 (1,658,782) (41)
Bad Debt Expenses 1,942,246 2,118,614 (176,368) (8)
Operating Expenses 2,889,089 3,167,755 ( 278,666) (9)
Net Loss Before Tax (2,471,900) (1,268,152) (1,203,748) 95
Income Tax Profits 160,000 130,000 30,000 23
Net Loss ($2,311,900) ($1,138,152) ($1,173,748) 103
Description for changes in percentage of increment: 1. The increase in Non-Interest Net Loss, Net Loss Before Tax, Income Tax Profits and Net Loss and the decrease in Net profits
results basically from the narrowed interest spread and net loss from Financial Net Assets & Liabilities at Fair Value through Profit or Loss.
3. Cash Flow Analysis
(1) Liquidity analysis for the latest year Year Increment (%) 2008 2007 Item
Cash Flow Ratio (%) 204.44 (36.28) - Cash Flow Adequacy Ratio (%) 1,014.11 (316.61) - Cash Flow Reinvestment Ratio (%) (138.60) (57.12) -
Description for changes in ratios: 1. Cash Flow Ratio and Cash Flow Adequacy Ratio rose because of higher net cash inflow of 2008 operating activities. 2. Cash Flow Reinvestment Ratios are lower because the increment of net cash inflow of 2008 operating activities is larger than
net cash outflow of 2008 investment. (2) Liquidity analysis for the next year:
Unit: NT$ Thousand
Remediation Measures Against expected Cash Flow Deficit
Expected Net Expected Cash
Surplus (Deficit) Expected Cash Inflow
(Outflow) for the Whole Year
Operating Cash Cash Balance at the
Start of the Period + + Flow for the Investment Financing
Whole Year $4,607,347 $6,461,588 $5,118,602 $16,187,537 $ - $ -
1. Change in cash flow of the year: (1) Operation Activities: Net cash inflow resulted from decrease in financial assets held for trading. (2) Investment: Net cash inflow resulted from decrease in available-for-sale financial assets and dues from banks.
2. Strategies for redeeming estimated cash shortage and liquidity analysis: the Bank plans to reduce financial assets held for trading, available-for-sale financial assets and dues from banks and to issue subordinated financial debentures in response to the decrease in deposit and remittance. Currently no cash flow insufficiency is seen.
4. Influence Imposed by Major Capital Expenditures Unit: NT$ Thousand
Actual/Expected Capital Performing Status Actual/Expecte
d Capital
Resources
Actual/Expecte
d Date of
Completion
Required
Capital Planning Items
2006 2007 2008 2009 2010-2012
Land, House
and Building
Self-owned
Fund 2006-2009 669,043 0 420,410 48,633 200,000 -
Other
Equipment
Self-owned
Fund 2006-2009 510,816 242,402 137,966 67,348 63,100 -
165

5. Reinvestment Policies of the Latest Year Unit: NT$ Thousand
Sunny Life Insurance Gold Sunny Assets Sunny Securities Co., Ltd.
Sunny Property Insurance Brokerage Co., Ltd.
Ontario Securities Investment Trust Invested Company Agent Co., Ltd. Management Co., Ltd.
Financial Institution Creditor's Right
(Money) Appraisal and Auction
Securities Investment
Securities Investment Trust Services
Property Insurance Brokerage Major Business Life Insurance Brokerage
Collected Capital 302,000 15,000 6,050 50,000 300,000
Shareholding (%) 97.68% 39.99% 20.00% 100.00% 20.02%
Amount 295,000 6,000 1,210 50,000 60,060
Par Value 207,517 10,228 1,557 19,258 38,762
Yearly Income (18,903) 5,085 1,000 (17,386) (31,748)
Recognized Invested Income (18,465) 2,500 200 (17,386) -
1. The revenue of agency service stays weak.
1. The investment market performs ill. Profit is infused by
commission income from sales of life insurance products.
Profit is infused by commission income from sales of property insurance products.
Cost of purchasing NPL has not yet been recovered.
Main Factor of Profit (Loss) 2. Dealing
Operation suffers from loss.
2. The sale of fund services has not reached the economy scale.
The future investment projects will conform to the demand of the Bank’s business
development.
6. Analysis and Evaluation Risk Management
(1) A Series of Qualitative and Quantitative Requirements For Risk Management:
A. Credit Risk Management System and Accrued Capital
2008 Credit Risk Management System
Disclosure Item Content 1. Credit risk strategies, objectives, policy and process
In order to effectively implement credit risk management to minimize loss on credit risks, “Principles of Credit Risk Management” was developed. Risk Management Dept was established to manage credit risks. Through risk recognition, evaluation, mitigation, supervision and reporting, The Bank expects to maintain the possible risks under bearable level and reach balance between risk and rewards and further elevate shareholders’ value.
2. Credit risk management organization and structure
The Bank established Risk Management Department, which is independent and directly supervised under Board of Directors, as “The planning unit for credit risk management.”
3. The scope and characteristics of the credit risk reporting and measurement system
If risk executives, during supervision, discover any drawback in risk management and could not respond due to authority limits or any other situations, Risk Management Dept. and other related units should be instantly reported to and take any necessary steps and propose improving procedures for the drawback.
4. The scope and characteristics of the credit risk reporting and measurement system
Each unit conducts analysis in response to credit risk events and evaluate pros and cons of each risk solutions. In addition to qualify internal control procedures, risks will be mitigated in the following ways: (1) Requires collateral or guarantee. (2) Utilize insurance or credit derivatives. (3) Credit-Guarantee fund. (4) Develop deposit-mitigation agreement.
5. Approach adopted for the regulatory reserve
The Standardized approach
166
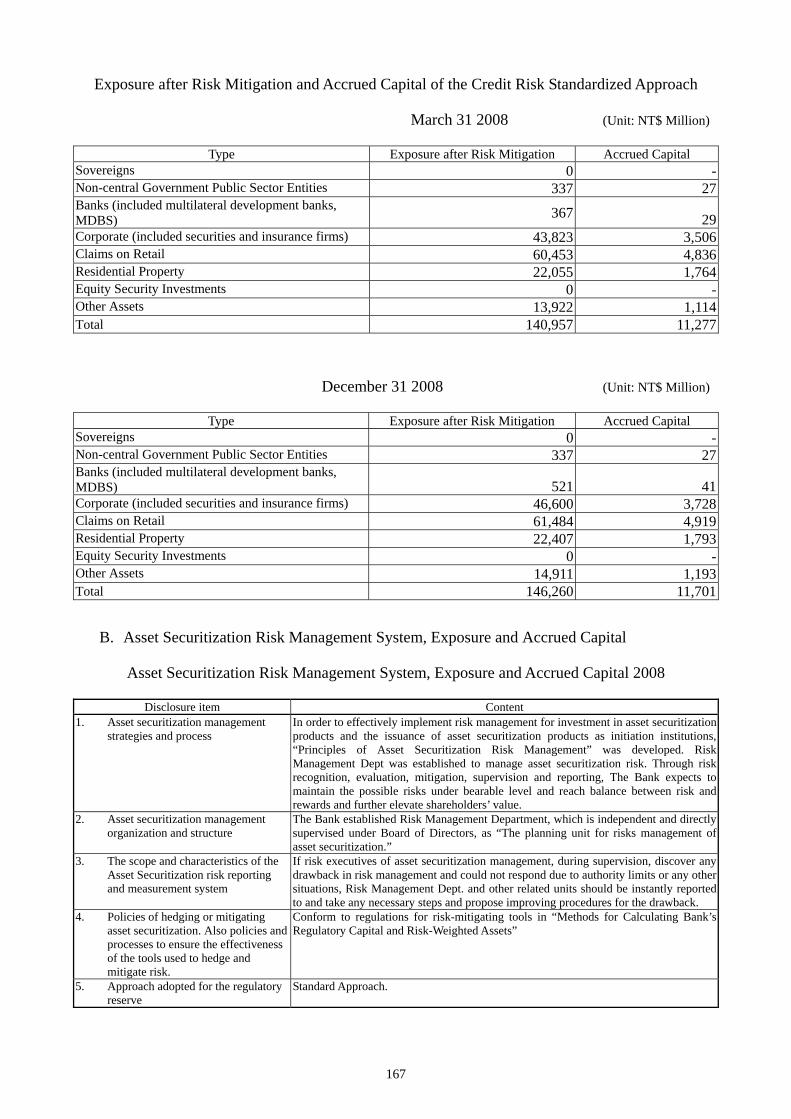
Exposure after Risk Mitigation and Accrued Capital of the Credit Risk Standardized Approach
March 31 2008 (Unit: NT$ Million)
Type Exposure after Risk Mitigation Accrued Capital 0 -Sovereigns
337 27Non-central Government Public Sector Entities Banks (included multilateral development banks, MDBS) 367 29
43,823 3,506Corporate (included securities and insurance firms) 60,453 4,836Claims on Retail 22,055 1,764Residential Property
0 -Equity Security Investments 13,922 1,114Other Assets
140,957 11,277Total
December 31 2008 (Unit: NT$ Million)
Type Exposure after Risk Mitigation Accrued Capital 0 -Sovereigns
337 27Non-central Government Public Sector Entities Banks (included multilateral development banks, MDBS) 521 41
46,600 3,728Corporate (included securities and insurance firms) 61,484 4,919Claims on Retail 22,407 1,793Residential Property
0 -Equity Security Investments 14,911 1,193Other Assets
146,260 11,701Total
B. Asset Securitization Risk Management System, Exposure and Accrued Capital
Asset Securitization Risk Management System, Exposure and Accrued Capital 2008
Disclosure item Content 1. Asset securitization management
strategies and process In order to effectively implement risk management for investment in asset securitization products and the issuance of asset securitization products as initiation institutions, “Principles of Asset Securitization Risk Management” was developed. Risk Management Dept was established to manage asset securitization risk. Through risk recognition, evaluation, mitigation, supervision and reporting, The Bank expects to maintain the possible risks under bearable level and reach balance between risk and rewards and further elevate shareholders’ value.
2. Asset securitization management organization and structure
The Bank established Risk Management Department, which is independent and directly supervised under Board of Directors, as “The planning unit for risks management of asset securitization.”
3. The scope and characteristics of the Asset Securitization risk reporting and measurement system
If risk executives of asset securitization management, during supervision, discover any drawback in risk management and could not respond due to authority limits or any other situations, Risk Management Dept. and other related units should be instantly reported to and take any necessary steps and propose improving procedures for the drawback.
4. Policies of hedging or mitigating asset securitization. Also policies and processes to ensure the effectiveness of the tools used to hedge and mitigate risk.
Conform to regulations for risk-mitigating tools in “Methods for Calculating Bank’s Regulatory Capital and Risk-Weighted Assets”
5. Approach adopted for the regulatory reserve
Standard Approach.
167

Asset Securitization Exposure and Accrued Capital
March 31 2009 Unit: NT$ Thousand Non-Originating Bank Originating Bank
Exposure Non Asset-Backed Commercial Paper Traditional Synthetic
Buy Or Hold Securitization
Exposures
Accrued Capital Before
Securitization
< Asset-Backed Commercial
Paper
Exposure Hold
PositionsNot Hold Position
Hold Positions
Not Hold Position
- -- - - -21,243 1,699Real Estate
Corporate Bonds, Financial Bonds - - - - - - - -
Total 21,243 1,699 - - - - - -Note: The above table represents exposure to asset securitization in the Bank.
December 31 2008 Unit: NT$ Thousands Non-Originating Bank Originating Bank
Exposure Non Asset-Backed Commercial Paper Traditional Synthetic
Buy Or Hold Securitization
Exposures
Accrued Capital Before
Securitization
Type Asset-Backed Commercial
Paper Exposure
Hold Positions
Not Hold Position
Hold Positions
Not Hold Position
- - - - - -23,535 1,883Real Estate Corporate Bonds, Financial Bonds - - - - - - - -
Total 23,535 1,883 - - - - - -Note: The above table represents exposure to asset securitization in the Bank.
Securitized Products (1) Summary of Investment in Securitized Products.
December 31 2009 Unit: NT$ Thousand Accounting Account
for Recognition Accumulated Gain or Loss on Evaluation
Accumulated Impairment Item (Note 1) Original Cost Par Value
CBO Held to maturity 35,994 0 0 35,994ABCP Available for sale 1,203,276 10,802 0 1,214,078REAT Available for sale 45,660 4,353 0 50,013REAT Held to maturity 70,218 0 0 70,218CMO Available for sale 50,820 (589) 0 50,231
December 31 2008 Unit: NT$ Thousand Accounting Account
for Recognition Accumulated Gain
or Loss on Evaluation
Accumulated Impairment Item (Note 1) Original Cost Par Value
CBO Held to maturity 43,732 0 0 43,732ABCP Available for sale 1,200,617 12,252 0 1,212,869REAT Available for sale 46,745 3,283 0 50,028REAT Held to maturity 73,941 0 0 73,941CMO Available for sale 51,667 (405) 0 51,262Note 1: This table includes domestic and foreign securitized products, items of which can be filled by the following categories.
(1) Mortgage-Backed Security (MBS): Including Residential Mortgage-Backed Securities (RMBS), Commercial Mortgage-Backed Securities (CMBS), Collateralized Mortgage Obligation (CMO) and other mortgage-backed securities.
(2) Asset-Backed Security (ABS): Including Commercial Loan Obligation (CLO), Collateralized Bonds Obligation (CBO), Credit Card Loan Obligation, Auto Loan Obligation, Consumer Loan/ Cash Card Loan Obligation, Lease Receivables Obligation and other obligations.
(3) Asset-Backed Commercial Paper (ABCP)。 (4) Collateralized Debt Obligations (CDO)。 (5) Real Estate Asset Trust (REAT)。 (6) Bonds issued through Structured Investment Vehicle (SIV) (7) Other securitized products.
Note 2: This table includes all of beneficiary securities or asset-based securities held by the Bank as an initiation institution.
168

(2) A. Information on the original cost of one single investment in securitized products reaches NT$ 300 million and above (excluding the position held by the Bank, as a securitization initiation institutes, for the purpose of credit enhancement should be disclosed: none
B. Information on the position held by the Bank, as a securitization initiation institutes, for the purpose of credit enhancement should be disclosed: None
C. Information on Bank’s service as a credit-damaged buying institute or a clearance buying institutes should be disclosed: None
(3) Information on the Bank’s service as a securitized product guarantor or its provision of liquidity facility should be disclosed: None.
C. Operational Risk Management System and Accrued Capital
2008 Operational Risk Management System
Disclosure item Content 1. Operational risk strategies and
process In order to effectively implement risk management to minimize the frequency and financial and non-financial loss for the operation risk events, “Principles of Operation Risk Management” was developed. Risk Management Dept was established to manage operation risk. Through risk recognition, evaluation, mitigation, supervision and reporting, the Bank expects to maintain the possible risks under the bearable level and reach balance between risk and rewards and further elevate shareholders’ value.
2. Operational risk management organization and structure
The Bank established Risk Management Department, which is independent and directly supervised under Board of Directors, as “The planning unit for operation risk management.”
3. The scope and characteristics of the operational risk reporting and measurement system
1. Each unit conducts impact analysis in response to operation risk events, instantly implement corrective measures, follow up and data collection, analyze its impacts and fill-in The Event Notification Sheet to report the event according to the operation risk events.
2. If risk executives, during supervision, discover any drawback in risk management, in addition to reporting the event according to the regulations of authority and the Bank, Risk Management Dept. should be instantly reported to.
4. Policies of hedging or mitigating asset securitization. Also policies and processes to ensure the effectiveness of the tools used to hedge and mitigate risk.
Conduct analysis according to the probability of the damage events and severity and evaluate pros and cons of each risk solutions. Other than qualifying internal control procedures, outsourcing or insurance is also allowed for risk mitigation.
5. Approach adopted for the regulatory reserve
Basic Indicator approach
Operational Risk Capital Requirement
March 31 2009 Unit: NT$ Thousand Year Gross Operating Profits Capital Requirement 2006 4,731,1152007 4,257,9142008 2,709,320Total 11,698,349 584,917
March 31 2008 Unit: NT$ Thousand Year Gross Operating Profits Capital Requirement 2006 4,731,1152007 4,257,914 2008 2,709,320Total 11,698,349 584,917
169
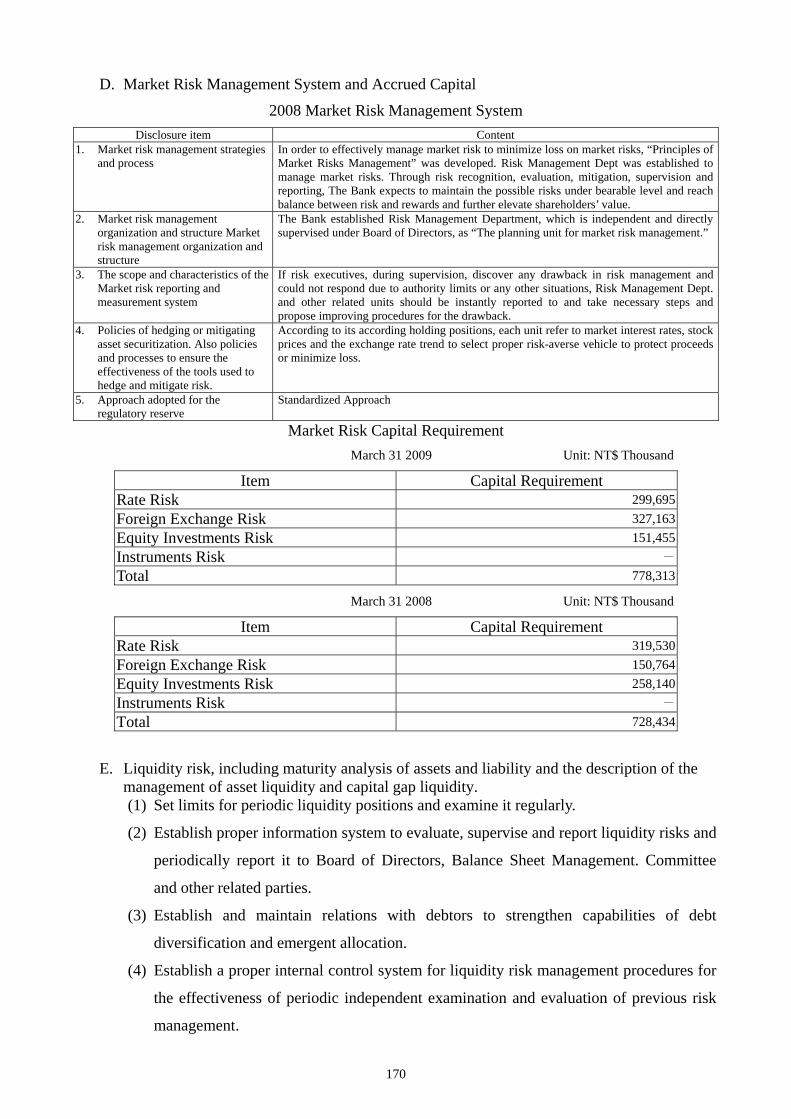
D. Market Risk Management System and Accrued Capital
2008 Market Risk Management System Disclosure item Content
1. Market risk management strategies and process
In order to effectively manage market risk to minimize loss on market risks, “Principles of Market Risks Management” was developed. Risk Management Dept was established to manage market risks. Through risk recognition, evaluation, mitigation, supervision and reporting, The Bank expects to maintain the possible risks under bearable level and reach balance between risk and rewards and further elevate shareholders’ value.
2. Market risk management organization and structure Market risk management organization and structure
The Bank established Risk Management Department, which is independent and directly supervised under Board of Directors, as “The planning unit for market risk management.”
3. The scope and characteristics of the Market risk reporting and measurement system
If risk executives, during supervision, discover any drawback in risk management and could not respond due to authority limits or any other situations, Risk Management Dept. and other related units should be instantly reported to and take necessary steps and propose improving procedures for the drawback.
4. Policies of hedging or mitigating asset securitization. Also policies and processes to ensure the effectiveness of the tools used to hedge and mitigate risk.
According to its according holding positions, each unit refer to market interest rates, stock prices and the exchange rate trend to select proper risk-averse vehicle to protect proceeds or minimize loss.
5. Approach adopted for the regulatory reserve
Standardized Approach
Market Risk Capital Requirement March 31 2009 Unit: NT$ Thousand
Item Capital Requirement Rate Risk 299,695 Foreign Exchange Risk 327,163 Equity Investments Risk 151,455 Instruments Risk -
Total 778,313
March 31 2008 Unit: NT$ Thousand
Item Capital Requirement Rate Risk 319,530 Foreign Exchange Risk 150,764 Equity Investments Risk 258,140 Instruments Risk -
Total 728,434
E. Liquidity risk, including maturity analysis of assets and liability and the description of the management of asset liquidity and capital gap liquidity. (1) Set limits for periodic liquidity positions and examine it regularly.
(2) Establish proper information system to evaluate, supervise and report liquidity risks and
periodically report it to Board of Directors, Balance Sheet Management. Committee
and other related parties.
(3) Establish and maintain relations with debtors to strengthen capabilities of debt
diversification and emergent allocation.
(4) Establish a proper internal control system for liquidity risk management procedures for
the effectiveness of periodic independent examination and evaluation of previous risk
management.
170

Structure Analysis of the Maturation of NTD
March 31 2009 Unit: NT$ Thousand Remaining Period to Maturity Remaining
Period to Maturity
181 days – 1 year Over 1 year1-30 days 31-90 days 91-180 days
Primary Funds Inflow upon Maturity $217,456,286 $46,748,305 $19,559,097 $18,396,327 $27,724,162 $105,028,395
Primary Funds Outflow upon Maturity
256,487,761 29,555,058 32,494,779 42,228,860 86,728,662 65,480,402
Capital Gap (39,031,475) 17,193,247 (12,935,682) (23,832,533) (59,004,500) 39,547,993 Note: This table only includes the amount of New Taiwan Dollars (excluding foreign currencies) in the head office and
both of domestic and foreign branches. December 31 2008 Unit: NT$ Thousand
Remaining Period to Maturity
Total 181 days – 1 year Over 1 year1-30 days 31-90 days 91-180 days
Primary Funds Inflow upon Maturity $228,213,813 $41,181,989 $25,627,611 $22,981,537 $29,621,620 $108,801,056
Primary Funds Outflow upon Maturity
268,800,657 37,497,102 47,064,253 43,128,486 71,112,383 69,998,433
Capital Gap (40,586,844) 3,684,887 (21,436,642) (20,146,949) (41,490,763) 38,802,623Note: This table only includes the amount of New Taiwan Dollars (excluding foreign currencies) in the head office and
both of domestic and foreign branches. Structure Analysis of the Maturation of USD
March 31 2009 Unit: US$ Thousands Remaining Period to Maturity Total 1-30 days 31-90 days 91-180 days 181 days – 1 year Over 1 year
Assets $374,652 $223,438 $58,859 $18,423 $20,627 $53,305Liabilities 345,044 214,528 76,764 24,045 27,485 2,222Gap 29,608 8,910 (17,905) (5,622) (6,858) 51,083Accumulated Gap 29,608 8,910 (8,995) (14,617) (21,475) 29,608
December 31 2008 Unit: US$ Thousands Remaining Period to Maturity Total 1-30 days 31-90 days 91-180 days 181 days – 1 year Over 1 year
Assets $312,565 $182,918 $29,252 $23,746 $13,719 $62,930Liabilities 290,481 192,902 55,469 48,286 25,991 (32,167)Gap 22,084 ( 9,984) (26,217) (24,540) ( 12,272) 95,097Accumulated Gap 22,084 (9,984) (36,201) (60,741) (73,013) 22,084
(2) The Influence of Domestic and Foreign Major Policies and Law Amendment Exerting on the Bank's Financial Structure and Responding Measures A. Domestic and Foreign Major Policies and Law Amendment
(1) The authority has developed regulations on bank’s operation of wealth management. On April 24, 2008, The Banker’s Association of Republic of China passed “Amendment to Self Regulations of the Bank’s Operations of Wealth Management and Financial Product Sale”, which placed more limitations on the subjects banks sell products to and required that, before selling structured products, financial advisors
171

confirm whether the customers possess investment expertise or financial capability and are able to shoulder the risks of according products.
(2) Financial Supervisory Commission, Executive Yuan, on June 17, 2008, revised and announced “”Guidelines for Trusted Investment of The Trust Businesses in Foreign Securities” and required banks not to initiate the promotion of specific foreign securities to the public.
(3) The International Accounting Standards Board, in order to stabilize the market, loosened the limitations on reclassification of financial assets for trading and allowed to reclassify financial assets (such as stocks and bonds) from “For Trading” to “Not-For Trading” to reduce the gigantic loss recognized due to the market value slump recently. Financial Accounting Standards Board of R.O.C also declared The 2nd Amendment to FASB Statement No.34 and conditionally loosened the regulations on the recognition of financial asset loss. The possibility that banks’ income fluctuates significantly due to loss on financial asset will fall greatly.
(4) On January 12, 2009, Legislation Yuan Passed Amendment to Inheritance And Gift Tax Law and lowered the max marginal rate from 50% to the single rate 10%. In addition, the exemption for estate tax was raised from NT$ 7.99 million to NT$ 12 million. The exemption for gift tax was raised from NT$1.11 million to NT$ 2.2 million. The installment period of estate tax was extended from 12 payments to 18 payments.
B. Since the bank learned domestic and foreign major policies and law amendment and expected its influence on the financial structures, the Bank has notified related units, developed responsive procedures and engaged in employee education and training. If internal articles or procedures are not consistent with new regulations, responsible units will revise the according articles or procedures.
(3) Influence of Changes in Technology and Industries on Banking Financial Operations and Related Measures. Information technology is rapidly advancing and widely used globally. The Bank will persist on exercising all kinds of electronic vehicles, such as computer systems and Internet, for security investment management, including bills and bonds, stocks, beneficiary certificates and mutual fund, bill and bond delivery and capital allocation, in order to smooth the operation of Finance Department and raise efficiency of capital use. The Bank has purchased industry and economics database for staff to enquire the latest industrial news on computer. Not only the quality of credit investigation and granting can be raised and credit-granting risk can be lowered, but also profit of short-term and long-term stock investment can be elevated and the risks can be avoided. Meanwhile, in order to strengthen risk management, the Bank has set investment limit according to the industries and group enterprises in order to diversify the investment risks on the Bank due to technological and industrial changes.
(4) Influence of Change in Image on Sunny Bank Ltd. and Relative Measures Sunny Bank Ltd. has been holding quality policies of “stability, prospects, professionalism and enthusiasm” to achieve sustainable operations since its establishment. In response to the government’s policies, the Bank has established quality culture and developed proactive, passionate, initiative and considerate service attitude. The Bank, through a variety of events, has advanced the Bank’s corporate image.
(5) Expected effects and possible risks for merging: A. Anticipated Effectiveness
(a) Effectively enlarge market share and increase the number of customers. (b) Enhance market recognition and effectively raise brand value. (c) Lift the overall operation value of Sunny Bank Ltd. (d) Raise the function of price negotiation to lower cost or increase revenue. (e) Generate the effectiveness of economic scale.
172

B. Possible Risks (a) The functions of Headquarters should be reinforced accordingly so as to handle the
expansion of management and avoid branches from ineffective operations and negligent management.
(b) There should a complete plan for information transmission and communication system so as to effectively transmit company policies.
(6) Expected effects and possible risks of expansion of branches 1. Expected effects
Through the expansion of the service locations, the major effect can be geographically expanded within the branch network. The Bank is able to provide well-rounded and diverse services to customers in different regions, segments, and attributes so as to expand the sources of the deposit and loan service and wealth management.
2. Possible Risks: The Bank’s management and operation risks may ascend consequently. However, with effective internal control and regulation-conforming mechanism, risks can be effectively minimized.
(7) Risks arising from centralized business: The Bank’s major businesses are centered on the deposit and loans. With excessive banks in the market, the Bank is facing a fierce price war in interest rates and service fee, which incurs operational risks for difficult raised profitability. The Bank continuously develops financial products in foreign exchange, trust and insurance and proactively develops wealth management, provides diverse financial services, gradually tunes the profitability structure and effectively minimizes and distributes various risks.
(8) Influence and Risk of Changes in Operational Rights: None (9) Significant Lawsuit or non-suit events or administrative litigation
1. Lawsuit or non-suit events arising from collection cases: (a) Corporate Financing and consumer housing mortgages: 2,863 cases (b) Small amount loan: 587 cases (c) Credit card: 2850 cases
2. In 2008 and by the report publication date, major lawsuits, non-suits or administrative litigation which have been verdict or in proceedings may result in great influence on depositors, shareholders’ equity or security prices, cases with over NT$3,000,000 are shown as follows: (1) The 1st Case: Request to confirm the inexistence of the debt on mortgage and discharge
of mortgage registration i. Lawsuit commencing from: December 9, 2004 ii. Major Parties: Plaintiff – Lai, Chun-Feng and Chung, Yu-Chen; Defendant – Sunny
Bank Ltd. iii. Dispute: the plaintiff request against Sunny Bank Ltd. to confirm the inexistence of
debt on mortgage and discharge of mortgage registration iv. Target Amount: NT$15,600,000. v. Resulted by April 30, 2000:
(i) The Bank lost the first instance remanded by High Court. The Bank plans to appeal to the court.
173

(2) The 2nd Case: A lawsuit in relating to confirm the inexistence of the debt arising from promissory notes. i. Lawsuit commencing from: April 6, 2005 ii. Major Parties: Plaintiff – Lai, Chun-Feng and Chung, Yu-Chen; Defendant: Sunny
Bank Ltd. iii. Dispute: the plaintiffs claim against Sunny Bank Ltd. for the confirmation of the
inexistence of the debt arising from the related promissory notes since Sunny Bank Ltd. claims to the court for determining that the promissory notes are fabricated.
iv. Target Amount: NT$10,000,000. v. Resulted by April 30, 2009.
(1) The Bank lost the first instance and plans to appeal to the court. This case is currently on trial in Taiwan Shihlin District Court.
(2) This case, as the aforementioned first case, belongs to a case of creditor’s rights.
(3) The 3rd Case: lawsuit in connection with return of deposit i. Lawsuit commencing from: April 14, 2005 ii. Major Parties: Plaintiffs – Chao, Tung-Hsin and Wang, Hui-Chun; Defendant: Sunny Bank Ltd. iii. Dispute: the plaintiffs claim that Sunny Bank Ltd. does not fulfill its obligations in
management in a careful manner which leads to their deposit withdrawn illegally by the third party. Therefore, a lawsuit is made against Sunny Bank Ltd. for the return of their deposit.
iv. Target Amount: NT$25,000,000 plus interest at an annual rate of 5% commencing from the next day after the copy of pleading arrives at the court till the date of redemption.
v. Resulted by April 30, 2009: (i) The Bank won the case in the 1st and 2nd instance. (ii) The counterpart filed an appeal and the Supreme Court dismissed it. The
judgment is finalized. (4) The 4th Case: lawsuit in connection with the confirmation of the non-existence of debt.
i. Lawsuit commencing from: November 30, 2006 ii. Major parties: Plaintiff: Wang, Lu-Chen; Defendant: Sunny Bank Ltd. iii. Dispute: the plaintiff requested to confirm the debt obligation not existed. iv. Requirement: NT$ 2,000,000 v. Resulted by April 30, 2009: The judgement that the Bank won the case is finalized.
(5) The 5th Case: lawsuit involving difference in pension. i. Lawsuit commencing from: February 9, 2006 ii. Major Parties: Plaintiff: 8 people including Hu, Chin-Fu; Defendant: Sunny Bank
Ltd. iii. Dispute: requested paying the pension difference. iv. Requirement: NT$4,496,189. v. Resulted by April 30, 2009:
(i) The Bank won the case in the 1st and 2nd instance. (ii)The counterparty appealed to the court and rejected. The case is finalized.
174

(6) The 6th Case: the claim for damage from MIS establishment. i. Lawsuit commencing from: September 12, 2007 ii. Major Parties: Petitioner: Sunny Bank Ltd.
Respondent: Intech Taiwan Corporation iii. Dispute: The respondent failed to finished establishment of Management
Information System. Thus the Bank petitioned the Respondent to shoulder the responsibility of the damage claim. In addition, the respondent, within the same arbitration procedure, petitioned the Bank for responsibility of the damage claim instead.
iv. Requirement: NT$116,918,751 and interested incurred until the payment date. The Respondent petitioned NT$ 7,585,400 interested incurred until the payment date.
v. Resulted by April 30, 2009: This case is currently under arbitration of The Arbitration Association of the Republic of China.
(7) The 7th Case: Damage Claim i. Lawsuit commencing from: December 26, 2007 ii. Major Parties: Plaintiff: Chen, Ruei-Ru
Defendant: Sunny Bank Ltd. iii. Dispute: Request the defendant to shoulder responsibility for the claim of copyright
infringement. iv. Requirement: NT$5,000,000 and interested incurred with 5% Annual rates from the
arrival of the pleading copy at the defendant’s to the payment date. v. Resulted by April 30, 2009: This case is currently:This case is currently on trial in
Taiwan Shihlin District Court. (8) The 8th Case: Request for indemnification of damages
i. Lawsuit commencing from: February 21, 2008 ii. Major parties: Plaintiff: Sunny Bank Ltd.; Defendant: Chuan-Hsian Wang iii. Dispute: request the defendant to take the responsibility for the damage
indemnification. iv. Requirement: NT$18,000,000 and interest at APR 5% starting from January 6,
2006 to the payment date. v. Resulted by April 30, 2009: The judgement that the Bank won the case is finalized.
C. In 2008 and by April 30, 2009, major lawsuits, non-suits or administrative litigation which involves directors, supervisors, presidents, or any major shareholders with more than 10% of shares and subsidiaries, and have been verdict or in proceedings, may result in great influence on depositors, shareholders’ equity or security prices: (a) Main Points: Violation of Banking Laws (b) Major Parties: Plaintiff: Chen, Sheng-Hung etc. (c) Summary of Lawsuits: The prosecutor indicted Chen, Sheng-Hung etc. for violation of
Banking Laws. (d) Resulted by April 30, 2009: This case is currently on trial in Taiwan Shihlin District
Court. (10) Other important risks and correspondent measures: None
175

7. Crisis Management Mechanism “Disaster Contingency Policies” and “Emergent Financing and Related Procedures” are set to deal with crisis. (1) Disaster Contingency Policies
A. Targets: establish major crisis management and contingency procedures, improve the understanding of employees for disaster contingency policies and strengthen precautions in order to reduce damage, effectively raise financing on disaster, restore normal operations, stabilize customers’ lives after disaster, recover social and economic orders as well as achieve a peaceful society.
B. Contingency Policies: (a) Precautions: A. holds educational trainings and practices. B. Strengthen protection
and inspection for facilities. (b) Actions: the contingency team shall actively gather at the Management Department
of the Head Office and coordinate each unit to deal with such emergency. (c) Actions after stabilizing disaster: A. the emergency contact person of each suffered
unit shall check each branch or administrative office upon disaster or after disaster being stabilized and report the facts to the chief executive director of the contingency team. B. Measures for controlling the consequences caused by disasters. C. Confirmation on the safety of employees and customers. D. Make announcements to customers to avoid customer panic and negative influence on customers’ rights. E. Confirmation of loss and evaluation on capital requirements.
(2) Emergent Financing and Related Procedures A. Purpose: the contingency plans are made in accordance with the “Regulations of
Liquidity Risks” so as to tackle the great loss of deposit in the emergent period and further to make capital financing upon major accidents.
B. Related Contingency Procedures: (a) The chief of the Finance Department shall suggest Chairman to call for an emergent
Assets and Liabilities Management Committee Meeting to: evaluate market influence and trend; examine current liquid positions; plan sources of capital financing and decide the procedures against the disaster.
(b) Actions immediately taken: list cash liquid position of all currencies; dispose the investment positions of bills, bonds and securities; obtain other banks capital in fixed period; Extend the expiry dates for liabilities of Sunny Bank Ltd. and avoid centralized expiry dates; Reduce liquid position gap; discuss if it is necessary to raise NCD and other interest rates for deposits for financing capital and
temporarily cease large amount of corporate loans and general credit loans. C. Steps of Financing:
(a) Confirm the capital able to be used at Sunny Bank Ltd. and capital financing sources (including Type A of reserve at the Central Bank, Type B of reserve at the Central Bank, Capital center, deposits at other banks, financial bonds, securities, etc.)
(b) Dumping of investment positions: confirm the investment positions owned; review the market for liquid assets ready to sell out and calculate market prices and profit or loss after dumping.
(c) Dumping of foreign exchange positions: dump foreign positions in all currencies. (d) Obtain other banks loans: confirm loans required; take the advantage of the
relationships established to obtain other banks support and obtain long-term other banks financial support under the persuasion by authoritative units.
(e) Expand bills and bonds with RP conditions: confirm RP position; take the advantage of the relationships established to persuade customers or other banks support.
(f) Keep depositors of Sunny Bank Ltd.: confirm sources of deposits; take the advantage of relationships established to keep our customers from disengagement.
176

(g) Rediscount and financing services by the Central Bank: review qualified securities for rediscount and make financing in accordance with the “Regulations of Financing Banks by the Central Bank”.
8. Other important events: None
177

VIII. Special Notes 1. Information of Related Enterprises
A. Related Enterprises’ Status
(1) Organization Chart of Related Enterprises
Shareholding
s 97.68%
Sunny Bank Co., Ltd.
Sunny Property Insurance Brokerage Co., Ltd.
Gold Sunny Assets Management Co., Ltd.
Shareholdings39.99%
Shareholdings20.00%
Shareholdings100.00%
Shareholdings 60%
Shareholdings 40%
Shareholdings 40%
Sunny Securities Co., Ltd.
Sunny Life Insurance Brokerage Co., Ltd.
Ontario Securities Investment Trust Shareholdings
20.02%
Note: 1. Sunny Life Insurance Brokerage Co., Ltd is held by Sunny Bank Co., Ltd with 39.99% of shares and by Sunny Securities Co.,
Ltd with 60% of shares. 2. Sunny Property Insurance Brokerage Co., Ltd is held by Sunny Bank Co., Ltd with 20% of shares, by Sunny Life Insurance
Brokerage Co., Ltd with 40% of shares and by Gold Sunny Assets Management Co., Ltd with 40% of shares. (2) Basic Information of Related Enterprises
Unit: NT$ Thousand Company Name Sunny Securities Co., Ltd. Gold Sunny Assets Management Co., Ltd. Company Name June 9, 1998 October 16, 2006
B1, No. 167/ B2, No. 165 Sec. 5, MinSheng E. Rd., Taipei City 5F, No. 255, Zhongzheng Rd., Taipei City Date of Establishment
Address NT$302,000 NT$50,000 Financial Institution Creditor's Right (Money) Appraisal and Auction Collected Capital Marketable Securities Entrusting and Trading
Company Name Sunny Life Insurance Brokerage Co., Ltd. Sunny Property Insurance Brokerage Co., Ltd. Date of Establishment February 15, 2001 August 14, 2003
2F, No. 205, ChangAn W. Rd., Tatung Dist., Taipei City
2F, No. 205, ChangAn W. Rd., Tatung Dist., Taipei City Address
Collected Capital NT$15,000 NT$6,050 Major Operating Item Life Insurance Brokerage Property Insurance Brokerage Company Name Ontario Securities Investment Trust - Date of Establishment July 08, 1998 -
8F., No.4, Sec. 3, Minquan E. Rd., Zhongshan Dist., Taipei City Address -
Collected Capital $300,000 - Major Operating Item - Securities Investment Trust Services
178

(3) Hold the same data of shareholders of affiliated companies: None (4) Directors and Supervisors of Affiliated Companies
Date: December 31 2008
Holding Share Company Name Title Name Stock (1,000) Proportion
Chairman Sunny Bank Co., Ltd Representative: Chen, Yung-Chun 29,500 Director Sunny Bank Co., Ltd Representative: Chen, Yu-Liang 29,500 Director Sunny Bank Co., Ltd Representative: Hsu, Chih-Jung 29,500 Director Sunny Bank Co., Ltd Representative: Chen, Hui-Min 29,500
Sunny Securities Co., Ltd. 97.68% 97.68%
Director Sunny Bank Co., Ltd Representative: Lee, Wen-Kuang 29,500 Supervisor Sunny Bank Co., Ltd Representative: Hsu, Yueh-Fang 29,500 Chairman Sunny Bank Co., Ltd Representative: Lin, Ming-Cheng 5,000
Director Sunny Bank Co., Ltd Representative: Lan, Yu-Lin 5,000 Director Sunny Bank Co., Ltd Representative: Lin, Chin-Yu 5,000
Gold Sunny Assets Management Co., Ltd. 100.00% 100.00%
Supervisor Sunny Bank Co., Ltd Representative: Kuo, Chih-Hung 5,000 Chairman Sunny Bank Co., Ltd Representative: Chen, Chin-Yi 600 39.99%
Director Sunny Bank Co., Ltd Representative: Chen, Chin-Yi 600 Director Huang, Cheng-Nan 0.002 - Director Sunny Securities Co., Ltd Representative: Chao, Fu-Tien 900
Sunny Life Insurance Brokerage Co., Ltd. 99.99%
60.00%Supervisor Sunny Securities Co., Ltd Representative: Hsu, Po-Hsiung 900 Chairm n a Sunny Bank Co., Ltd Representative: Chen, Chin-Yi 121 20.00%
Director Sunny Bank Co., Ltd Representative: Chang, Chi-Ming 121 Director Sunny Life Insurance Brokerage Co., Ltd. Representative:
Huang, Cheng-Nan 242
Director Sunny Life Insurance Brokerage Co., Ltd. Representative: Chao, Fu-Tien 242
40.00%Sunny Property
Insurance Brokerage Co., Ltd.
100.00%
Supervisor Gold Sunny Assets Management Co., Ltd. Representative: 242 40.00%Hsu, Po-Hsiung Chairman Teng, Cheng-Yu 210 -
Vice Chairman
Pan, Cheng-ching 0 -
Director Inter-Venture Trust Company Limited Representative: 6,716 - Ting, Yang-Hsiu Director Japan Business Limited, Representative: Cheng, Chih-Wei 1,260 - Director Pacific Securities, Co., Ltd: Lu, Hung-Ju 5,801 -
Ontario Securities Investment Trust
Director Chang, Yung-Ching 0 - Director Sunny Bank Co., Ltd Representative: Lin, Chih-Liang 6,006 20.02% Supervisor Li, Ke-Yi 0 -
B. Related Enterprises’ Operation Status: Unit: NT$ Thousands except EPS in NT$
Profit/Loss This Term Total
LiabilitiesOperating
Income EPS Company Name Capital Total Assets Net Value (After Tax) (After Tax)
Sunny Securities Co., Ltd. $302,000 $272,431 $44,496 $227,935 $86,273 ($18,903) ($0.63)Gold Sunny Assets Management Co., Ltd. 50,000 991,905 972,647 19,258 25,453 (17,386) (3.48)Sunny Life Insurance Brokerage Co., Ltd. 15,000 73,158 36,570 36,588 125,575 5,085 3.39
Sunny Property Insurance Brokerage Co., Ltd. 6,050 13,833 6,048 7,785 22,457 1,000 1.65
Ontario Securities Investment Trust 300,000 374,563 73,851 300,712 23,645 (31,748) (1.06)
B. Private Security Placement and Financial Debentures: None
C. Holding or disposal of the Bank stocks by subsidiaries Unit: NTD, shares; %
Amount endorsed
by the Bank for
the subsidiary
Held Shares and Amount on the Annual Report
Publication Date
Source of
Capital
Acquired Shares and
Amount
Disposed Shares and
Amount
Amount of Loan to the subsidiary
Collected Capital
Shareholding by the Bank
Acquisition or Disposal Date
Pledge Creation Subsidiary Profit/Loss
2008 - - - 420,059 shares - - - 3,508,320 Sunny Life Insurance Brokerage Co., Ltd.
Self owned
Until the Annual Report
Publication Date of the Year
$15,000 39.99% - - - 420,059 shares - - - 3,508,320
Note: As of the Annual Report Publication Date, Sunny Life Insurance Brokerage Co., Ltd. held 420,059 shares of the Bank’s stocks and did not
conduct any disposal during Year 2008. The rest subsidiaries did not hold or dispose any share of the Bank’s stocks.
179

180
D. Additional Supplementary Remarks: Head Office and Branches Unit Name Address Tel.
04 Management Department, Head Office 11271 No. 90, Sec. 1, Shihpai Rd., Peitou Dist., Taipei City (02) 2820-816601 Operation Department 11163 No. 255, Chungcheng Rd., Shihlin Dist., Taipei City (02) 2882-233002 Shihpai Branch 11271 No. 90, Sec. 1, Shihpai Rd., Peitou Dist., Taipei City (02) 2823-848003 Peitou Branch 11246 No. 152, Kuangming Rd., Peitou Dist., Taipei City (02) 2891-736105 Shihlin Branch 11169 No. 82, Tapei Rd., Shihlin Dist., Taipei City (02) 2882-366006 Tatun Branch 11252 No. 304, Chungho St., Peitou Dist., Taipei City (02) 2891-919607 Chientan Branch 11166 No. 141, Tungho St., Shihlin Dist., Taipei City (02) 2885-418108 Shetzu Branch 11173 No. 260, Sec. 5, Yenping N. Rd., Shihlin Dist., Taipei City (02) 2812-111209 Lanya Branch 11155 No. 169, Sec. 6, Chungshan N. Rd., Shihlin Dist., Taipei City (02) 2836-207210 Tienmu Branch 11153 No. 15, Tienmu E. Rd., Shihlin Dist., Taipei City (02) 2873-250011 Shechung Branch 11175 No. 220, Shechung St., Shihlin Dist., Taipei City (02) 2815-141512 ChiLin Mini-Branch 10459 No. 304 Chinlin Rd., Chungshan Dist., Taipei City (02) 2561-118813 Chengkung Branch 11489 No. 70, Sec. 4, Chengkung Rd., Neihu Dist., Taipei City (02) 2792-243314 Credit Cards Business Department 11271 No. 88, Sec. 1, Shihpai Rd., Peitou Dist., Taipei City (02) 2822-012215 Minsheng Branch 10589 No. 167, Sec. 5, Minsheng E. Rd., Sungshan Dist., Taipei City (02) 2760-633516 Yenchi Branch 10558 No. 11, Yenchi St., Sungshan Dist., Taipei City (02) 2578-620117 Mucha Branch 11648 No. 96, Sec. 3, Mucha Rd., Wenshan Dist., Taipei City (02) 2234-589018 Lungchiang Branch 10475 No. 49, Lane 356, Lungchiang Rd., Chungshan Dist., Taipei City (02) 2516-594519 Nanking Branch 10553 No. 132, Sec. 4, Nanking Ed., Rd., Sungshan Dist., Taipei City (02) 2579-022920 Chingmei Branch 11669 No. 95-12, Chinghou St., Wenshan Dist., Taipei City (02) 2930-020221 Chunghsing Branch 10478 No. 36, Sec. 3, Minsheng E. Rd., Chungshan Dist., Taipei City (02) 2516-526822 Hsinyi Branch 10681 No. 188, Sec. 4, Hsinyi Rd., Taan Dist., Taipei City (02) 2706-838823 Chungho Branch 23553 No. 245, Chienyi Rd., Chungho City, Taipei County (02) 2222-519924 Trust Department 10478 2F, No. 36, Sec. 3, Minsheng E. Rd., Chungshan Dist., Taipei City (02) 2517-560825 Yungho Branch 23443 No. 188, Sec. 1, Chungshan Rd., Yungho City, Taipei County (02) 2926-589926 Luchou Branch 24747 No. 393, Chihsien Rd., Luchou City, Taipei County (02) 8282-206827 Panchiao Branch 22063 No. 133, Sec. 1, Szuchuan Rd., Panchiao City, Taipei County (02) 2955-000828 Taishan Branch 24347 No. 110, Sec. 1, Mingchih Rd., Taishan Hsiang, Taipei County (02) 2297-979729 Hsinho Mini-Branch 23570 No. 89, Huahsin St., Chungho City, Taipei County (02) 8941-933930 Hsichou Branch 22072 No. 89, Sec. 3, Tuhsing Rd., Panchiao City, Taipei County (02) 2681-996031 Kuting Branch 10080 No. 40, Sec. 2, Tingchou Rd., Chungcheng Dist., Taipei City (02) 8369-228832 Hsinchuang Branch 24260 No. 533, Lungan Rd., Hsinchuang City, Taipei County (02) 8201-906933 Sanchung Branch 24151 No. 108, Sec. 4, Tzuchiang Rd., Sanchung City, Taipei County (02) 8981-717134 Finance Department 11271 No. 88, Sec. 1, Shihpai Rd., Peitou Dist., Taipei City (02) 2820-816635 Shuangho Branch 23556 No. 722, Chingping Rd., Chungho City, Taipei County (02) 8242-391936 Tayeh Mini-Branch 33049 No. 55, Sec. 1, Tale Rd., Taoyuan City, Taoyuan County (03) 347-889937 Fuhsing Branch 10547 No. 143, Fuhsing N. Rd., Sungshan Dist., Taipei City (02) 2719-616638 Taoyuan Branch 33048 No. 32-20, Chungshan E. Rd., Taoyuan City, Taoyuan County (03) 336-055539 Taan Branch 11056 No. 225, Sec. 3, Hoping E. Rd., Hsinyi Dist., Taipei City (02) 2733-771150 International Banking Department 10547 2F, No. 143, Fuhsing N. Rd., Sungshan Dist., Taipei City (02) 2719-161651 Hsintien Mini-Branch 23148 No. 263-5, Chungcheng Rd., HsinTien City, Taipei County (02) 8911-767652 Hsinfu Mini-Branch 24247 No. 800, Hsingfu Rd., Hsinchuang City, Taipei County (02) 2998-336653 Yuanlin Branch 51052 No. 12, Chinghsiu Rd., Yuanlin Town, Changhua County (04) 832-217156 Shetou Mini-Branch 51141 No. 257, Sec. 2, Yuanji Rd., Shetou Township, Changhua County (04) 872-1017
57 Pingtung Branch 90074 No. 70, Chungcheng Rd., Pingtung City, Pingtung County (08) 732-612358 Chungcheng Branch 90062 No. 293, Chungcheng Rd., Pingtung City, Pingtung County (08) 736-081159 Tzuyu Branch 90079 No. 114, West Sec., Tzuyu Rd., Pingtung City, Pingtung County (08) 753-922460 Hsinpu Branch 22049 No. 245, Szuwei Rd., Panchiao City, Taipei County (02) 8253-778961 Kaohsiung Branch 80766 No. 192, Chiuju 1st Rd., Sanmin Dist., Kaohsiung City (07) 384-316362 Chunghua Branch 70168 No. 102, Sec. 3, Chunghua E. Rd., East Dist. Tainan City (06) 267-075163 Chiayi Branch 60089 1F & 2F, No. 296 & 298, Chunghsing Rd., Chiayi City (05) 234-202365 Tainan Branch 70050 No. 148, Sec. 2, Chungyi Rd., Tainan City (06) 228-217166 Chienkang Branch 70262 No. 370, Sec. 2, Chienkang Rd., Tainan City (06) 261-213667 Tungning Branch 70160 No. 247, Tungning Rd., Tainan City (06) 237-514168 Anshun Branch 70941 No. 202, Sec. 1, Anho Rd., Tainan City (06) 256-314669 Hsihua Branch 70847 No. 359, Sec. 2, Chunghua W. Rd., Tainan City (06) 297-988070 Offshore Business Unit 10547 2F, No. 143, Fuhsing N. Rd., Sungshan Dist., Taipei City (02) 2719-161671 Hsinchu Branch 30041 No. 247, Chungyang Rd., Hsinchu City (03) 515-3608

181
Unit Name Address Tel. 72 Chingwu Branch 40147 No. 188, Chingwu E. Rd., East Dist., Taichung City (04) 2211-236873 Tsuoying Branch 81357 No. 102, Poai 2nd Rd., Tsuoying Dist., Kaohsiung City (07) 556-012875 Lingya Branch 80250 No. 22, Fuhsing 2nd Rd., Lingya Dist., Kaohsiung City (07) 331-006676 Taichung Branch 40354 No. 159, Sec. 1, Taichungkang Rd., West Dist., Taichung City (04) 2310-999677 Hsiangshang Mini-Branch 40356 No. 166, Sec. 1, Hsiangshang S. Rd., West Dist., Taichung City (04) 2472-252878 Neihu Branch 11493 No. 250, Sec. 1, Neihu Rd., Neihu Dist., Taipei City (02) 2658-669879 Chungli Branch 32097 No. 171, Chienhsing Rd., Chungli City, Taoyuan County (03) 428-222980 Wuku Branch 24872 No. 12, Sec. 1, Chunghsing Rd., Wuku Township, Taipei County (02) 8976-900081 Linsen Branch 30042 1F, No. 196, Linsen Rd., East Dist., Hsinchu City (03) 610-018982 Hsinhsing Branch 80049 No. 6, Chungcheng 4th Rd., Hsinhsing Dist., Kaohsiung City (07) 288-413183 Chingnien Branch 80252 No. 169-1, Chingnien 1st Rd., Lingya Dist., Kaohsiung City (07) 331-852685 Sanfeng Branch 80749 No. 293, Chunghua 3rd Rd., Sanming Dist., Kaohsiung City (07) 231-510186 Szuwei Branch 80245 No. 159, Chunghua 4th Rd., Lingya Dist., Kaohsiung City (07) 333-370187 Takung Branch 80342 No. 40, Takung Rd., Yencheng Dist., Kaohsiung City (07) 531-510588 Tashun Branch 80787 No. 41, Tashun 2nd Rd., Sanmin Dist., Kaohsiung City (07) 386-162289 Haikuang Branch 81346 No. 190, Tsuoyingta Rd., Tsuoying Dist., Kaohsiung City (07) 582-351190 Chienchen Branch 80266 No. 281, Santuo 2nd Rd., Lingya Dist., Kaohsiung City (07) 711-004691 Pingteng Branch 80745 No. 283, Tzuli 1st Rd., Sanmin Dist., Kaohsiung City (07) 321-462292 Mintsu Branch 80047 No. 218, Chungcheng 2nd Rd., Hsinhsing Dist., Kaohsiung City (07) 224-242693 Hsiaokang Branch 81254 No. 178-1, Kangchuang Rd., Hsiaokang Dist., Kaohsiung City (07) 806-517195 Liwen Branch 81358 No. 75, Liwen Rd., Tsuoying Dist., Kaohsiung City (07) 558-071196 Yuchang Branch 81156 No. 803, Chiachang Rd., Nantzu Dist., Kaohsiung City (07) 364-653097 Chienkuo Branch 80289 No. 124, Wumiao Rd., Lingya Dist., Kaohsiung City (07) 715-351398 Wuchia Branch 83084 No. 368, Wuchia 2nd Rd., Fengshan City, Kaohsiung County (07) 726-080199 Tingli Branch 80789 No. 142, Tingli Rd., Sanmin Dist., Kaohsiung City (07) 346-5955100 Nantzu Branch 81162 No. 55, Nantzu Rd., Nantzu Dist., Kaohsiung City (07) 353-5513101 Chishan Branch 84243 No. 158, Chungshan Rd., Chishan Town, Kaohsiung County (07) 661-2081102 Liukuei Mini-Branch 84441 No. 94, Kuangfu Rd., Yipao Village, Liukuei Township, Kaohsiung County (07) 689-2741103 Meinung Mini-Branch 84348 No. 25, Sec. 1, Chungcheng Rd., Meinung Town, Kaohsiung County (07) 681-8346107 Linyuan Branch 83248 No. 136, Linhsi Rd., Linyuan Township, Kaohsiung County (07) 643-8141108 Kangshan Branch 82065 No.16, Dade 1st Rd., Gangshan Township, Kaohsiung County (07) 623-6182109 Chungshan Branch 90065 1F, No. 187, Chungshan Rd., Pingtung City, Pingtung County (08) 733-1053110 Likang Branch 90546 No. 43, Likang Rd., Chunlin Village, Likang Township, Pingtung County (08) 775-7735111 Tungkang Branch 92843 No. 166, Chungcheng Rd., Tungkang Town, Pingtung County (08) 832-0887113 Chiali Branch 72254 No. 277, Hsinsheng Rd., Chiennan Li, Chili Town, Tainan County (06) 721-7398115 Yungkang Branch 71049 No. 625, Chunghua Rd., Yungkang City, Tainan County (06) 203-6607117 Jente Branch 71743 No. 273, Sec. 2, Chungcheng Rd., Jente Township, Tainan County (06) 270-6361118 Kuanghua Branch 60045 No. 119, Kuanghua Rd., East Dist., Chiayi City (05) 228-5830119 Taipei Branch 10451 No. 43, Sec. 1, Mingsheng E. Rd., Chungshan Dist., Taipei City (02) 2563-3710120 Changan Branch 10350 No. 205, Changan W. Rd., Tatung Dist., Taipei City (02) 2559-5500121 Luotung Branch 26548 No. 30, Chungcheng N. Rd., Luotung Town, Ilan County (03) 957-1259122 Chupei Branch 30264 No. 232 & 236, East Sec. 1, Kuangming 6th Rd., Chupei City,
Hsinchu County (03) 658-5818
123 Chunghsin Branch 24144 1F, No. 28, Sec. 4, Chunghsin Rd., Sanchung City, Taipei County (02) 2977-9886125 Changhua Branch 50063 No.187, Siaoyang Rd., Changhua City, Changhua County (04) 728-9399

182

