sport tourism a state of the industry report · sport tourism a state of the industry report 3...
TRANSCRIPT
April 2017
SPORT TOURISMA State of the Industry Report
in collaboration with

SPORT TOURISM A State of the Industry Report
KEY FINDINGS
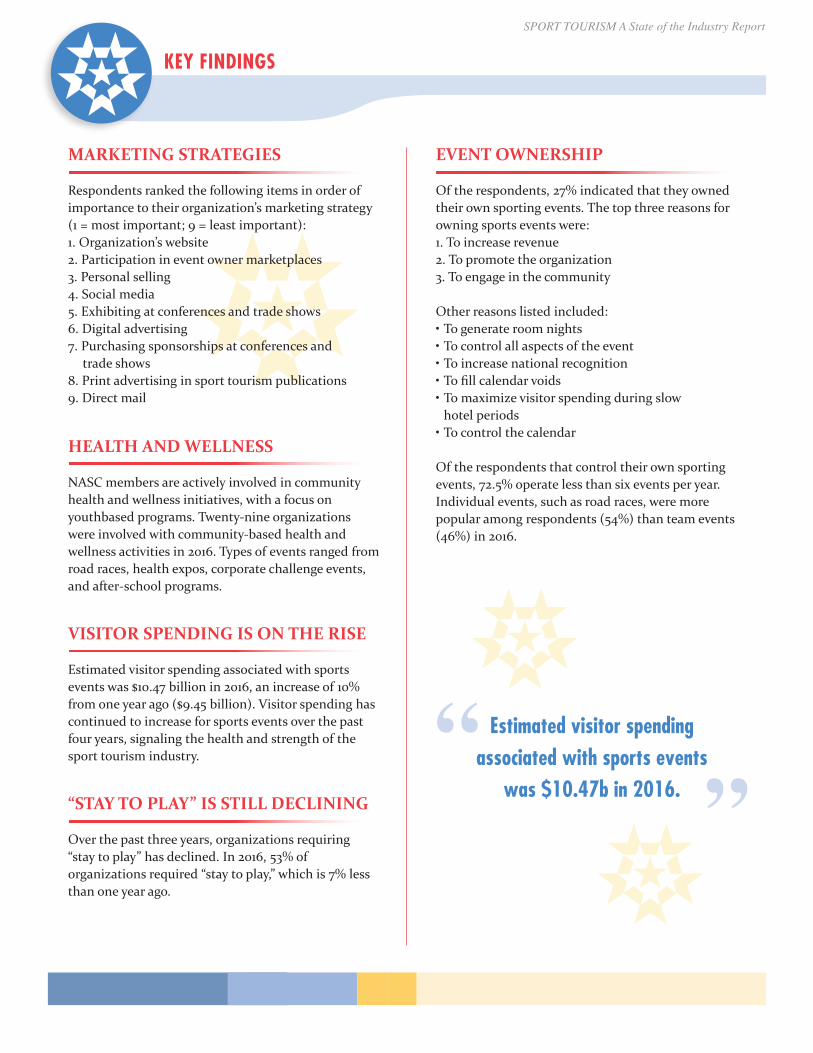
Estimated visitor spendingassociated with sports events
was $10.47b in 2016.
EVENT OWNERSHIP
Of the respondents, 27% indicated that they ownedtheir own sporting events. The top three reasons forowning sports events were:1. To increase revenue2. To promote the organization3. To engage in the community
Other reasons listed included:•Togenerateroomnights•Tocontrolallaspectsoftheevent•Toincreasenationalrecognition•Tofillcalendarvoids•Tomaximizevisitorspendingduringslow hotel periods•Tocontrolthecalendar
Of the respondents that control their own sportingevents,72.5%operatelessthansixeventsperyear.Individual events, such as road races, were more popular among respondents (54%) than team events (46%) in 2016.
MARKETING STRATEGIES
Respondents ranked the following items in order ofimportance to their organization’s marketing strategy(1 = most important; 9 = least important):1. Organization’s website2. Participation in event owner marketplaces3. Personal selling4. Social media5.Exhibitingatconferencesandtradeshows6. Digital advertising7. Purchasing sponsorships at conferences and trade shows8. Print advertising in sport tourism publications9. Direct mail
HEALTH AND WELLNESS
NASC members are actively involved in communityhealth and wellness initiatives, with a focus on youthbased programs. Twenty-nine organizations were involved with community-based health and wellness activities in 2016. Types of events ranged from roadraces,healthexpos,corporatechallengeevents,and after-school programs.
VISITOR SPENDING IS ON THE RISE
Estimated visitor spending associated with sportsevents was $10.47 billion in 2016, an increase of 10%from one year ago ($9.45 billion). Visitor spending hascontinued to increase for sports events over the pastfour years, signaling the health and strength of thesport tourism industry.
“STAY TO PLAY” IS STILL DECLINING
Over the past three years, organizations requiring“stay to play” has declined. In 2016, 53% of organizations required “stay to play,” which is 7% less than one year ago.
SPORT TOURISM A State of the Industry Report
1
GENERAL INFORMATION
BUDGET
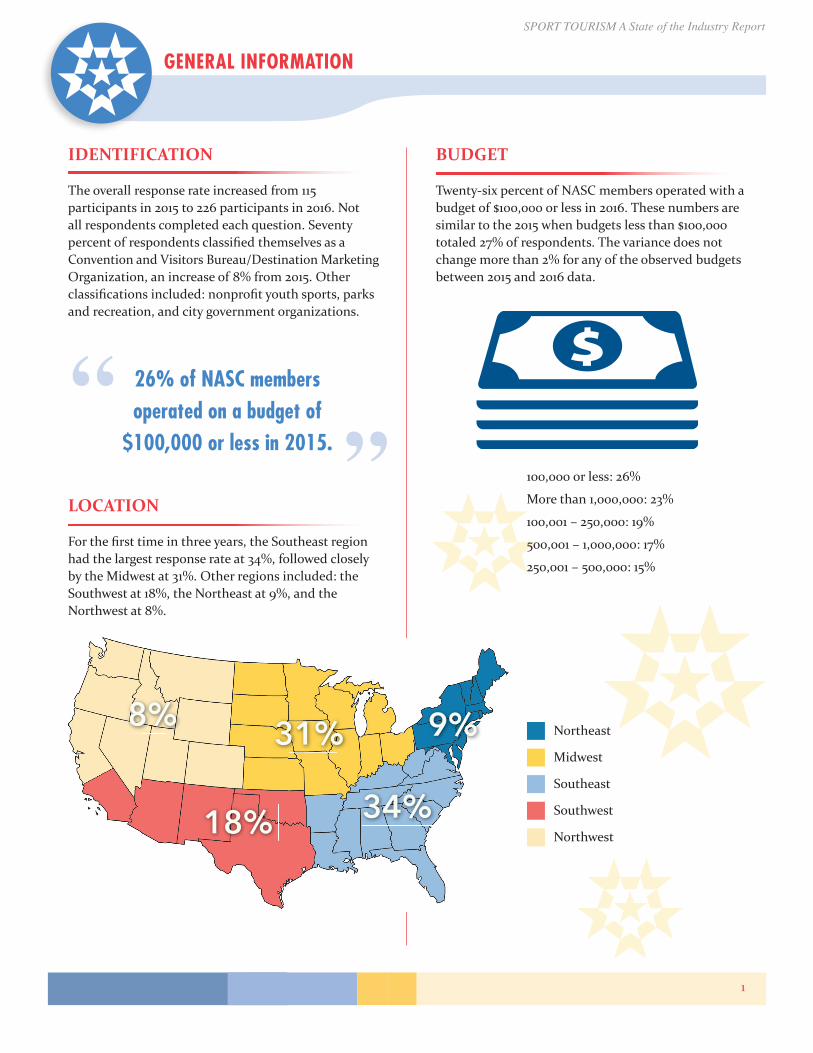
Twenty-sixpercentofNASCmembersoperatedwithabudget of $100,000 or less in 2016. These numbers aresimilar to the 2015 when budgets less than $100,000totaled 27% of respondents. The variance does notchange more than 2% for any of the observed budgetsbetween 2015 and 2016 data.
100,000 or less: 26%
More than 1,000,000: 23%
100,001 – 250,000: 19%
500,001 – 1,000,000: 17%
250,001 – 500,000: 15%
IDENTIFICATION
The overall response rate increased from 115 participants in 2015 to 226 participants in 2016. Not all respondents completed each question. Seventy percentofrespondentsclassifiedthemselvesasaConvention and Visitors Bureau/Destination Marketing Organization, an increase of 8% from 2015. Other classificationsincluded:nonprofityouthsports,parksand recreation, and city government organizations.
LOCATION
Forthefirsttimeinthreeyears,theSoutheastregionhad the largest response rate at 34%, followed closelyby the Midwest at 31%. Other regions included: theSouthwest at 18%, the Northeast at 9%, and the Northwest at 8%.
26% of NASC membersoperated on a budget of
$100,000 or less in 2015.
Northeast
Midwest
Southeast
Southwest
Northwest
SPORT TOURISM A State of the Industry Report
2
CALCULATION
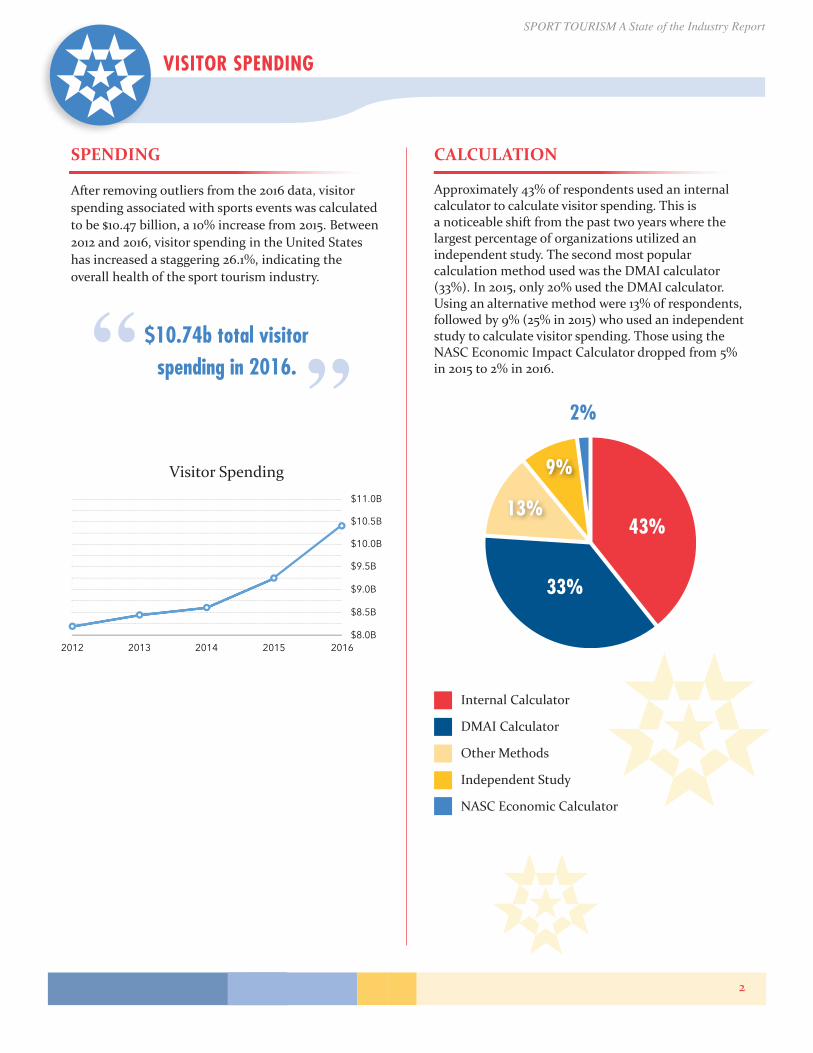
Approximately43%ofrespondentsusedaninternalcalculator to calculate visitor spending. This isa noticeable shift from the past two years where thelargest percentage of organizations utilized an independent study. The second most popular calculation method used was the DMAI calculator (33%). In 2015, only 20% used the DMAI calculator. Using an alternative method were 13% of respondents, followed by 9% (25% in 2015) who used an independent study to calculate visitor spending. Those using the NASC Economic Impact Calculator dropped from 5% in 2015 to 2% in 2016.
VISITOR SPENDING
SPENDING
After removing outliers from the 2016 data, visitorspending associated with sports events was calculatedto be $10.47 billion, a 10% increase from 2015. Between2012 and 2016, visitor spending in the United Stateshas increased a staggering 26.1%, indicating the overall health of the sport tourism industry.
$10.74b total visitorspending in 2016.
Visitor Spending
Internal Calculator
DMAI Calculator
Other Methods
Independent Study
NASC Economic Calculator
62%
34% 43%
33%
9%
2%
13%
2012 2013 2014 2015 2016$8.0B
$8.5B
$9.0B
$9.5B
$10.0B
$10.5B
$11.0B
SPORT TOURISM A State of the Industry Report
3
PERSONNEL
STAFFING
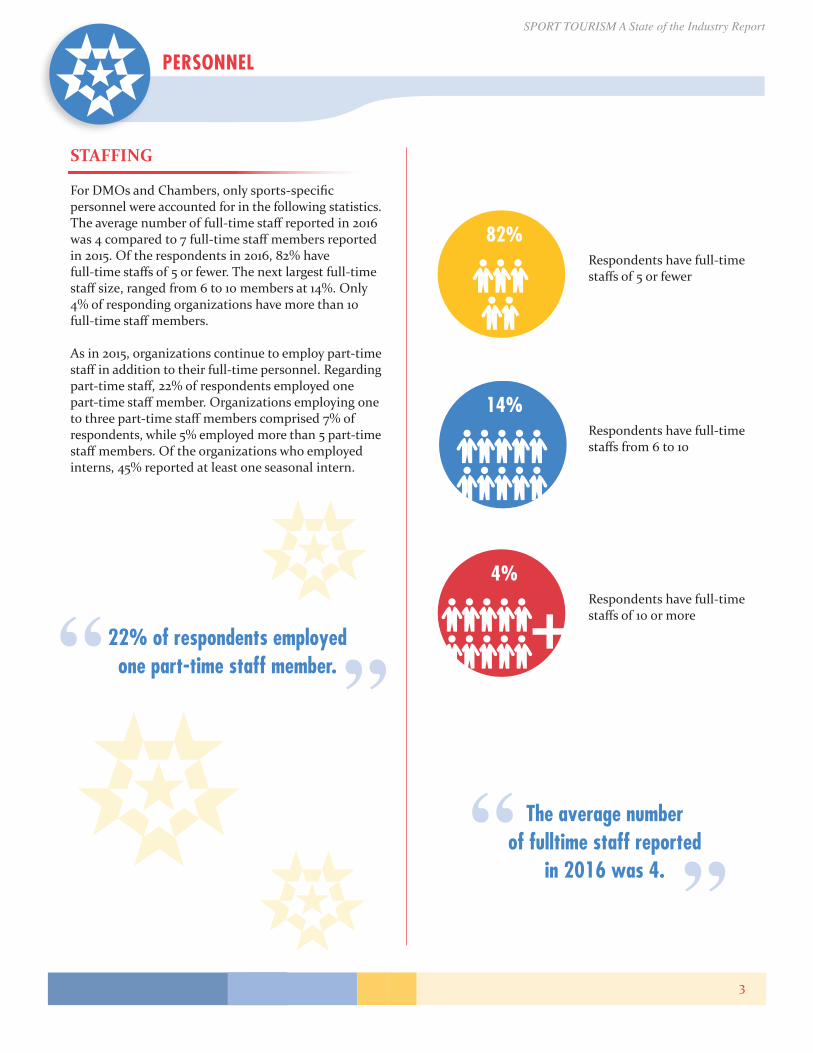
ForDMOsandChambers,onlysports-specificpersonnel were accounted for in the following statistics. Theaveragenumberoffull-timestaffreportedin2016was4comparedto7full-timestaffmembersreportedin 2015. Of the respondents in 2016, 82% have full-timestaffsof5orfewer.Thenextlargestfull-timestaffsize,rangedfrom6to10membersat14%.Only4% of responding organizations have more than 10 full-timestaffmembers.
As in 2015, organizations continue to employ part-timestaffinadditiontotheirfull-timepersonnel.Regardingpart-timestaff,22%ofrespondentsemployedonepart-timestaffmember.Organizationsemployingonetothreepart-timestaffmemberscomprised7%ofrespondents, while 5% employed more than 5 part-time staffmembers.Oftheorganizationswhoemployedinterns, 45% reported at least one seasonal intern.
22% of respondents employedone part-time staff member.
+
+
+
82%
14%
4%
Respondents have full-timestaffsof5orfewer
Respondents have full-timestaffsfrom6to10
Respondents have full-timestaffsof10ormore
The average number of fulltime staff reported
in 2016 was 4.
SPORT TOURISM A State of the Industry Report
4
BID FEES
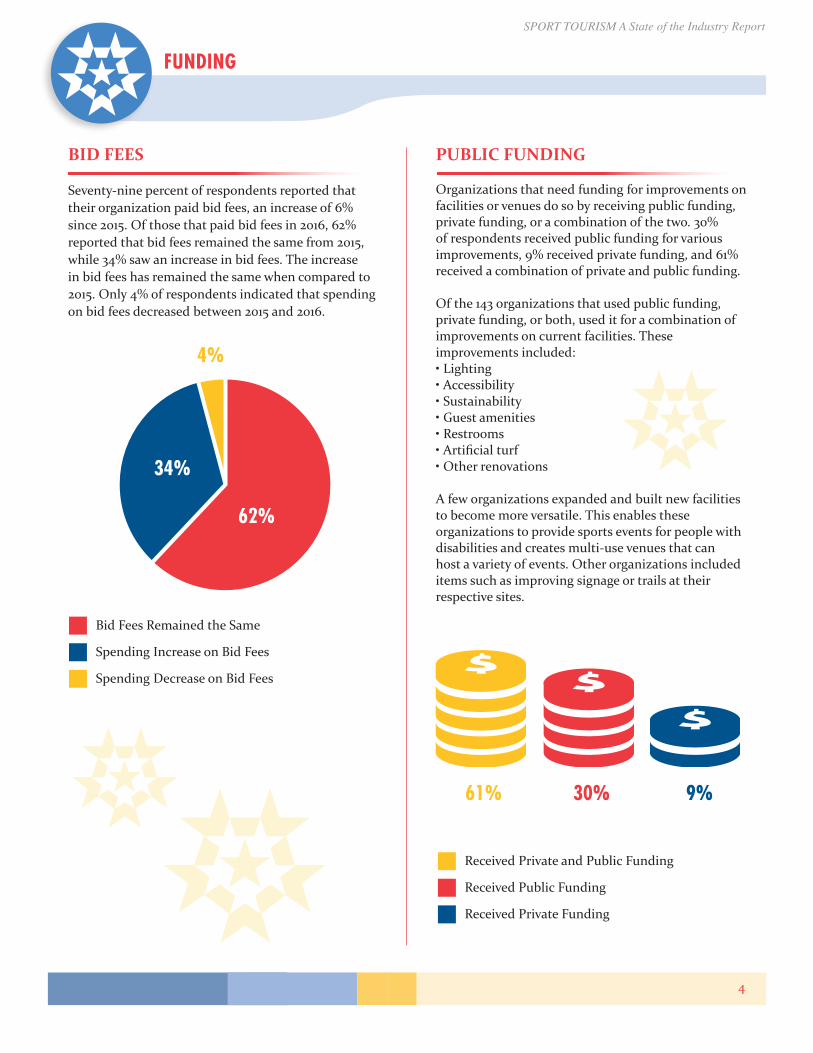
Seventy-nine percent of respondents reported thattheir organization paid bid fees, an increase of 6%since 2015. Of those that paid bid fees in 2016, 62%reported that bid fees remained the same from 2015,while 34% saw an increase in bid fees. The increasein bid fees has remained the same when compared to2015. Only 4% of respondents indicated that spendingon bid fees decreased between 2015 and 2016.
FUNDING
PUBLIC FUNDING
Organizations that need funding for improvements onfacilities or venues do so by receiving public funding,private funding, or a combination of the two. 30%of respondents received public funding for variousimprovements, 9% received private funding, and 61%received a combination of private and public funding.
Of the 143 organizations that used public funding,private funding, or both, used it for a combination ofimprovements on current facilities. These improvements included:•Lighting•Accessibility•Sustainability•Guestamenities•Restrooms•Artificialturf•Otherrenovations
Afeworganizationsexpandedandbuiltnewfacilitiesto become more versatile. This enables these organizations to provide sports events for people with disabilities and creates multi-use venues that can host a variety of events. Other organizations included items such as improving signage or trails at their respective sites.
61% 30% 9%
Received Private and Public Funding
Received Public Funding
Received Private Funding
62%
34%
4%
Bid Fees Remained the Same
Spending Increase on Bid Fees
Spending Decrease on Bid Fees
SPORT TOURISM A State of the Industry Report
5
MARKETING
MARKETING STRATEGY
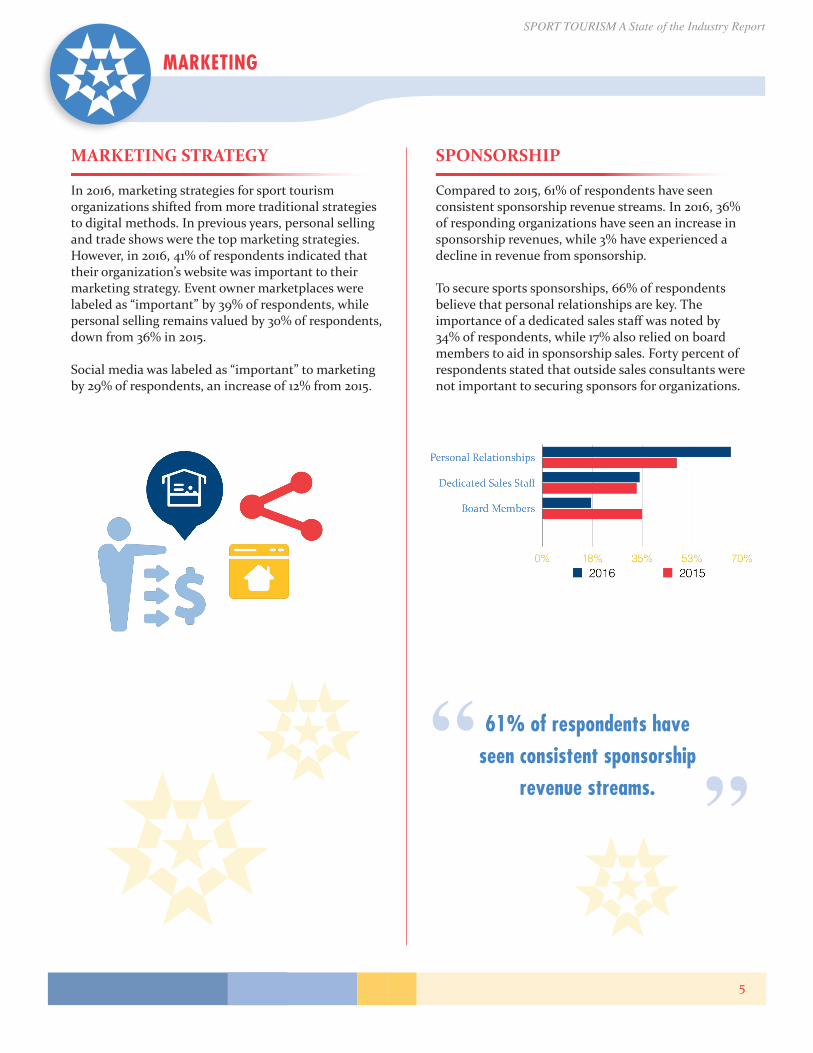
In 2016, marketing strategies for sport tourism organizations shifted from more traditional strategies to digital methods. In previous years, personal sellingand trade shows were the top marketing strategies.However, in 2016, 41% of respondents indicated thattheir organization’s website was important to theirmarketing strategy. Event owner marketplaces werelabeled as “important” by 39% of respondents, whilepersonal selling remains valued by 30% of respondents, down from 36% in 2015.
Social media was labeled as “important” to marketingby 29% of respondents, an increase of 12% from 2015.
SPONSORSHIP
Compared to 2015, 61% of respondents have seenconsistent sponsorship revenue streams. In 2016, 36%of responding organizations have seen an increase insponsorshiprevenues,while3%haveexperiencedadecline in revenue from sponsorship.
To secure sports sponsorships, 66% of respondentsbelieve that personal relationships are key. The importanceofadedicatedsalesstaffwasnotedby34% of respondents, while 17% also relied on board members to aid in sponsorship sales. Forty percent of respondents stated that outside sales consultants were not important to securing sponsors for organizations.
61% of respondents haveseen consistent sponsorship
revenue streams.
SPORT TOURISM A State of the Industry Report
6
SOCIAL MEDIA
PLATFORMS
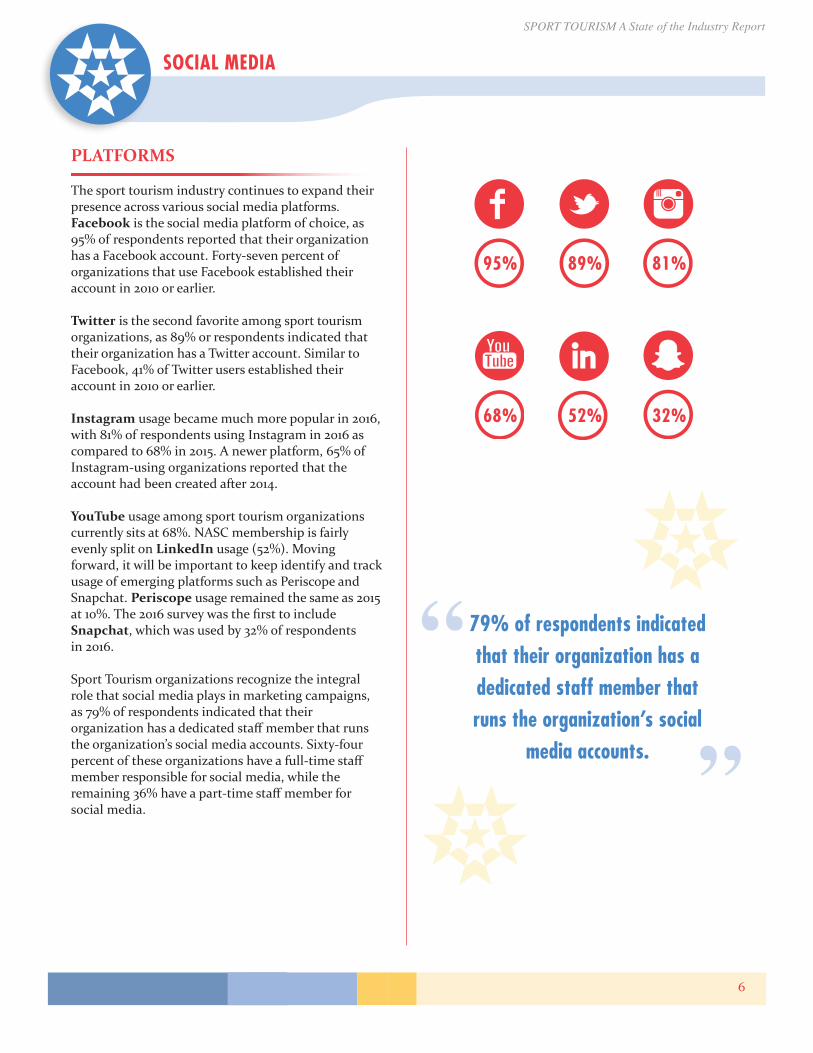
Thesporttourismindustrycontinuestoexpandtheirpresence across various social media platforms. Facebook is the social media platform of choice, as 95% of respondents reported that their organization has a Facebook account. Forty-seven percent of organizations that use Facebook established their account in 2010 or earlier.
Twitter is the second favorite among sport tourismorganizations, as 89% or respondents indicated thattheir organization has a Twitter account. Similar toFacebook, 41% of Twitter users established their account in 2010 or earlier.
Instagram usage became much more popular in 2016,with 81% of respondents using Instagram in 2016 ascompared to 68% in 2015. A newer platform, 65% ofInstagram-using organizations reported that the account had been created after 2014.
YouTube usage among sport tourism organizationscurrently sits at 68%. NASC membership is fairlyevenly split on LinkedIn usage (52%). Moving forward, it will be important to keep identify and trackusage of emerging platforms such as Periscope andSnapchat. Periscope usage remained the same as 2015at10%.The2016surveywasthefirsttoincludeSnapchat, which was used by 32% of respondents in 2016.
Sport Tourism organizations recognize the integralrole that social media plays in marketing campaigns,as 79% of respondents indicated that their organizationhasadedicatedstaffmemberthatrunstheorganization’ssocialmediaaccounts.Sixty-fourpercentoftheseorganizationshaveafull-timestaffmember responsible for social media, while the remaining36%haveapart-timestaffmemberforsocial media.
79% of respondents indicatedthat their organization has adedicated staff member thatruns the organization’s social
media accounts.
95%
68%
89%
52%
81%
32%
SPORT TOURISM A State of the Industry Report
7
EVENT OWNERSHIP
The 2016 survey included new questions about eventownership. Of the responding organizations, 27%indicated they own their own sports events. The topthree ranked reasons for owning sports events were:
1. Increase revenue2. Make the organization’s presence known in the community3. Engage in the community
Of the respondents that reported owning their ownsporting events, 73% indicated that they own and operatefiveorfewereventsperyear.Theseorganization owned events are made up of individual events, such as road races, which were slightly more popular among respondents at 54%, while the other 46% owned at least one team event in 2016.
EVENT OPERATIONS
Throughout 2016, organizations hosted an average of53 sports events. This is an 18% increase from 2015’saverage of 45 sports events.
COMMUNITY WELLNESS
Also new in 2016, respondents were asked to describetheir organization’s role in community-based healthand wellness activities. Of those respondents whoinvolved in community health and wellness, a vast majority indicated that programs were youth-based. The following were the top ways that sports organizations supported community health and well-ness in 2016:
1. Youth Festivals and After-School Programs2. Partnerships with Parks & Recreation Departments for Community Runs and Walks3.Financialandoperationalsupportforexisting community events
FACILITIES AND EVENT OPERATIONS
SPORT TOURISM A State of the Industry Report
8
SURVEY OBJECTIVE
A research team from Ohio University Sports Administration worked with the National Association of Sports Commissions (NASC) to create the 2016 State of the Industry Report. The research team was tasked with creating and distributing a survey, collecting and analyzing the gathered data, and identifying current trends within the Sports Tourism Industry. Ultimately, 226 organizations began takingthe survey, but not every organization responded to each question. Therefore, response rates vary per question and only those that responded were used for analysis.
SURVEY COORDINATION
Together, the NASC and Ohio University researchteams reviewed and edited the 2015 survey. Once editedbybothparties,thefinal2016surveywascreated and distributed.
SURVEY DISTRIBUTION
The survey was created using Qualtrics research system and distributed via e-mail to all NASC members. It was e-mailed by an NASC employee in December2016 and closed in February 2017.All information was submittedanonymously and the Ohio University research only contacted NASCmembersinordertoverifyvisitorspendingfigures.
In order to increase survey participation, the NASCofferedthechancetowinanAppleWatchtoonerespondent, chosen at random.
METHODOLOGY
DATA ANALYSIS
TheOhioUniversityresearchteamexportedthedataintoMicrosoftExcelbeforesortingandorganizingtheinformation for analysis. The researchers cleaned thedata, removed outlier data, and used descriptive analysisto provide actionable results to the NASC membership.
Ohio University Research Team: Valerie Dunlap, NickKopka,AliSpeck&Dr.HeatherLawrence-Benedict

National Association of Sports Commissions9916 Carver Rd., Suite 100Cincinnati, OH 45242