spotlight on juice: an analysis of research on the role of
TRANSCRIPT

Page 1 of 28
AUSTRALIAN BEVERAGES COUNCIL
Spotlight on juice:
An analysis of research on the role of juice in the Australian diet

Page 2 of 28
Executive Summary
The Australian Dietary Guidelines [ADG] recognise the positive contribution juice (no added sugar) makes to a healthy dietary pattern and its role in helping many Australians meet their recommended daily fruit serves. Juice is included in the ‘core food’ fruit recommendations: 125mL of fruit juice with no added sugar can be included as a serve of fruit occasionally.
While the ADG recognise the role of juice in a healthy dietary pattern, the proposed Health Star Rating [HSR] system communicates the contrary, with juice scoring as low as a 2.5 star rating, signalling to consumers that juice is not a healthier choice.
As the ADG were developed over seven years ago, the Australian Beverages Council Limited [ABCL] commissioned a research dossier to address this contradiction by collating the latest evidence related to juice consumption in Australia and its contribution to Australian dietary quality. By doing so, this dossier can provide valuable direction to inform further discussions on the proposed HSR for juice.
This latest evidence confirms the ADG position, that juice is part of the ‘core food’ fruit group and can make a positive contribution to the Australian diet and is associated with markers of healthy diets:
• Juice makes a significant contribution to daily micronutrient intakes of juice consumers, for example, 57% to vitamin C, around 17% to folate and 14-16% to potassium intakes;
• Juice makes a relatively low contribution to daily energy intakes of juice consumers (5%), total sugar intake (20%) and zero contribution to added sugar intake, as the sugar in juice is naturally occurring;
• Juice consumption is associated with multiple markers of a healthy diet, including
higher total diet quality scores and lower discretionary food consumption; and • Juice consumption is associated with healthy lifestyle behaviours, such as greater
levels of physical activity, with consumer research indicating that health is a key motivator for choosing juice.
One of the key roles of juice is to help Australians meet their minimum recommended daily fruit serves:
• Including juice (125mL) as a serve of fruit significantly increased the percentage of the Australian population who met their daily fruit recommendations from 10% to 24% (2011-12 National Nutrition and Physical Activity Survey); and
• In some groups, such as young adults aged 19-30, the effect was even greater with the inclusion of juice increasing compliance from 4% to 18%.
This is an important consideration as fruit and vegetable intakes remain low:
• 95% of children do not meet their minimum recommended daily fruit and vegetable serves;
• 52% of adults do not meet their minimum recommended daily fruit serves; and • 94% of adults do not meet their minimum recommended daily vegetable serves.
Within this context, national nutrition survey data and sales data both show a sustained decline in juice consumption over the past decade, which may be contributing to many Australians not meeting their fruit recommendations.

Page 3 of 28
For instance, evidence suggests for juice consumers there is a strong correlation with better dietary quality, characterised by higher diet quality score and lower consumption of discretionary foods.
Food-based dietary guidelines from other developed countries have also included juice as a core food in varying serve sizes in recognition of the contribution it makes to dietary quality and in support of consumers reaching the minimum recommended number of serves of fruit and vegetables per day.
The juice category has evolved significantly over the last decade to become a diverse category with a wide range of beverages including both ambient and chilled juices, vegetable juices, fruit and vegetable blends as well as diluted juices. This innovation has ensured there are numerous options for consumers, including many lower-sugar products.
In recognition of the changes within the juice category and the needs of the population to maintain a well-balanced diet, food policy and regulations should be updated commensurate with these important changes in the juice category. This is a key consideration for the HSR given its primary purpose is to help consumers make healthier choices within categories. Yet, the current proposed changes to the HSR overlook the positive contribution of juice to Australian diet.
In December 2019, the Australia and New Zealand Ministerial Forum on Food Regulation [the Forum] published its recommendations as part of the formal review of the HSR after five years of implementation (June 2014 to June 2019). In relation to juice, the following changes have been recommended:
• July 2020 - the Forum elected to score juice (no added sugar) based on sugar content and FVNL modifying points only, resulting in juice products scoring between 2.5 and 4 stars; and
• June 2014 - juice (no added sugar) could score up to five stars to recognise the nutritional benefits of the product’s fruit, vegetable, nut and legume [FVNL] content.
The proposed change to the juice (no added sugar) HSR is likely to have a number of unintended consequences including:
• Stifling industry innovation and adoption of HSR – there is little incentive for companies to create new products and utilise the HSR if it does not truly represent the nutritional value of the product;
• Consumer confusion – many juice consumers may consider changing to other beverages with less nutritional value and this may impact on their diet quality including meeting their minimum daily fruit and vegetable serves;
• Decreased credibility of HSR – the non-alignment with the ADG recommendations and inconsistent approach for juice calls the system into question and adds to confusion about its efficacy; and
• Continued decline in consumption of juice and therefore contributing further to percentage of Australians that do not meet their daily fruit intake.
The change in the HSR overlooks the positive contribution made by juice (no added sugar) to dietary quality and, if it remains unchanged, will dissuade consumers from making healthier choices through the purchase of juice (no added sugar). The industry supports the HSR as an important and effective communication tool, but its success is based on pragmatic and structural reform every five years and the HSR algorithm and policy decisions reflecting the current evidence base on juice (no added sugar) and the role it plays in the diets of consumers.

Page 4 of 28
Key recommendations:
The ABCL recommends that juice (no added sugar) should automatically score 4 stars in the HSR, based on strong evidence indicating that:
• Juice makes a significant contribution to micronutrient intakes of consumers • Juice makes a relatively low contribution to energy and total sugar intakes of
consumers, and zero contribution to added sugar intake
• Juice consumption is declining, at the same time fruit and vegetable consumption remains low and significantly below recommended levels
• Juice consumption is associated with multiple markers of a healthy diet, including total diet quality score, and
• Juice provides a positive contribution to a healthy dietary pattern, consistent with the dietary guidelines where juice is included in the ‘core food’ fruit recommendations.

Page 5 of 28
Contents
Executive Summary ...................................................................................................................... 2
Contents ....................................................................................................................................... 5
Project Background ....................................................................................................................... 6
Technical definitions ..................................................................................................................... 6
Introduction .................................................................................................................................. 7
1. The role of juice in the Australian diet .................................................................................... 8
1.1 Association between fruit juice and markers of a healthy diet .......................................... 8
1.1.2 Inclusion in the Australian Dietary Guidelines .................................................................. 9
1.1.3 Oral health impacts ......................................................................................................... 10
1.1.4 Glycaemic load ................................................................................................................ 10
1.2 Contribution to nutrient intakes .................................................................................... 11
1.2.1 Contribution to children’s nutrient intakes ......................................................................... 13
1.2.2 Contribution to adult’s nutrient intakes Vitamin C, folate and potassium .......................... 13
1.2 Nutrient composition comparisons: juice and whole fruit ................................................... 14
1.3 Beverage substitution modelling .................................................................................... 15
1.4 Consumption trends over time....................................................................................... 15
2. The juice category ............................................................................................................... 17
2.1 What does the category look like in 2020? ..................................................................... 17
3. Juice Consumption .............................................................................................................. 18
3.1 Who drinks juice? .......................................................................................................... 18
3.1.1. Children ........................................................................................................................... 18
3.1.2. From adolescent to adulthood ....................................................................................... 18
3.2 When do consumers drink juice? ................................................................................... 19
3.3 How much are consumers drinking? ............................................................................... 19
3.4 Why do consumers drink juice? ..................................................................................... 19
4. HSR Modelling ..................................................................................................................... 21
4.1 Calculator modelling ...................................................................................................... 21
6. International guidelines and policy issues related to juice..................................................... 23
6.1 Comparison of Australian and international dietary guidelines related to juice ............... 23
6.2 Policy initiatives related to juice .................................................................................... 24
6.2.1 United States ................................................................................................................... 24
6.2.1 United Kingdom .............................................................................................................. 25
References .................................................................................................................................. 26

Page 6 of 28
Ingredients: Orange Juice (100%).
Ingredients: Water, Reconstituted Fruit Juice [Apple, Pear (14%), Pineapple (11%), Passionfruit (0.5%)], Sugar, Food Acid (Citric Acid), Vitamin C, Flavours.
Project Background
This dossier is a collation of the latest evidence on juice consumption and the role it plays in
the Australian diet. References to “juice” in this report refers to fruit and/or vegetable juice
with no added sugar. It has been noted in this report where a certain study may include fruit
drinks and/or cordials etc.
Research methodology:
To scan the literature for new evidence related to the contribution of juice with no added
sugar to the Australian diet, a literature search was undertaken via journal search engine
PubMed using the terms ((juice) AND (australia)) AND (diet). Papers published from 2012
onwards were scanned for relevance. This resulted in 15 studies identified for analysis. These
papers and other relevant reports and documents were analysed for this dossier.
Technical definitions
Juice:
As per Standard 2.6.1 Fruit Juice and Vegetable Juice in the Australia and New Zealand Food Standards Code [FSC], the definition of juice is:
‘…the liquid portion, with or without pulp, obtained from fruit and/or vegetables or the
endocarp only of citrus fruit, excluding lime and includes a product that is obtained from concentrating juice and then reconstituting it with water, and can have the additions of sugar,
salt, herbs and spices’.
(Food Standards Australia New Zealand 2015).
A typical juice (no added sugar) ingredients list follows:
Fruit drinks:
Fruit drinks have a lower fruit and vegetable content, and may contain other ingredients such as water, sugar and permitted additives at Good Manufacturing Practice (GMP), like flavouring substances and sweeteners, according to the FSC with maximum permitted limits as per Standard 2.6.2 Non-alcoholic Beverages and Brewed Soft Drinks (Food Standards Australia New Zealand 2015).
A typical fruit juice drink ingredients list follows:

Page 7 of 28
Introduction
The Australian Dietary Guidelines [ADG] provide guidance to Australians about the amount and types of foods to eat for health and wellbeing. The recommendations are based on an evidence-based approach overseen by the NHMRC with the latest guidelines developed in 2013 (National Health and Medical Research Council 2013). A review of the 2013 ADG has been recently announced. The overall goal of following a dietary pattern in line with the ADG, is for Australians to optimise their nutrient intake for good health and to reduce the risk of chronic health problems such as heart disease, type 2 diabetes, some cancers and obesity.
ADG Recommendations for juice:
• 125mL of fruit juice with no added sugar can be included as a serve of fruit “occasionally”.
• Fruit juice is not recommended for infants under the age of 12 months.
The ADG recognise the important nutrient contribution juice makes to a healthy dietary pattern and its role in helping many Australians meet their recommended daily fruit serves. As the Dietary Guidelines were developed over seven years ago, the ABCL commissioned this research dossier to synthesise the latest research on the role of juice in the diet.
By doing so, the collated evidence will provide valuable direction to inform further discussions on the proposed Health Star Rating System [HSR] for juice. As the HSR is designed to help consumers make healthier choices when choosing packaged foods, it would be appropriate for the HSR for juice to be both aligned with the current ADG guidance on juice as part of the ‘core food’ fruit group and the latest evidence-base on juice’s role in the Australian diet.

Page 8 of 28
1. The role of juice in the Australian diet
1.1 Association between fruit juice and markers of a healthy diet
Consumers, industry stakeholders and government acknowledge the importance of a high quality and healthy diet as one of the most powerful ways to meet many of the important health markers. While Australians have never had more choice of dietary options, evidence suggests that increasing incidence of chronic disease indicates the need for additional work to improve dietary decisions and patterns across a broad swathe of Australian society.
There are numerous ways in which Australians can choose foods that improve their health and wellbeing while reducing their risk of chronic disease, including heart disease, hypertension (high blood pressure), type 2 diabetes, osteoporosis, and certain types of cancer. A healthy diet can, among other factors, help:
• Give Australians the best start in life;
• Australians to live as long as possible, supported by good health;
• Reduce the burden on the health system;
• Facilitate a healthy and enjoyable life; and
• Improve health outcomes among certain groups.
The ADG encourage Australians to eat plenty of fruit and vegetables as two of the five core food groups. This recommendation is based on the evidence from a 2013 study showing that dietary patterns consisting of high intake of fruit and vegetables, as well as other core foods were found to reduce the risk and incidence of conditions such as heart disease and stroke (National Health and Medical Research Council 2013). This recommendation in the dietary guidelines has been further supported by evidence from a large Australian cohort study that found that total fruit and vegetable intake was inversely associated with all-cause mortality in a cohort of adults aged 45 and over (Nguyen 2016).
Secondary analysis of repeated Australian Health Surveys, however, shows that children meeting the guidelines for fruit and vegetable intake has not changed substantially from 2011- 12 to 2014-15 - only 5.1% of children met the recommendation for both fruit and vegetable intakes in 2014-15 (Mihrshahi 2019).
Similarly, the proportion of Australian adults not meeting the recommendations has not changed substantially. From 2007-08 to 2017-18, there has been little change with 49-52% of adults not meeting the fruit recommendation and 93-94% not meeting the vegetables recommendations (Figure 1) (Australian Institute of Health and Welfare 2019).

Page 9 of 28
Figure 1. Trend in the prevalence of inadequate fruit and vegetable intake for persons aged
18 and over, 2007–08 to 2017–18
1.1.1 Total diet quality
For both children and adults, consumers of fruit juice had a higher diet quality score indicating higher compliance with the ADG (+5.5/100 points), a lower intake of energy from discretionary foods (-3% energy) and a higher vegetable intake than those who did not consume fruit juice (0.1 serves more for children and 0.3 serves more for adults). Children who consumed fruit juice had greater intakes of core foods than non-consumers (G. B. Hendrie 2015).
Similarly, an analysis of the CSIRO online tool Healthy Diet Score found that total fruit and vegetable intake was positively correlated with diet score, such that fruit and vegetable intake can be used as a proxy marker for a healthy diet (Hendrie and Noakes 2017). Findings from a re- analysis of the 2007 Australian National Children’s Nutrition and Physical Activity Survey found that when fruit juice was consumed, the diet was found to be significantly lower in total and saturated fat, and significantly higher in total folate, carbohydrate, vitamin C, pro-vitamin A, magnesium and potassium (Flinders Partners 2010).
1.1.2 Inclusion in the Australian Dietary Guidelines
The ADG provide guidance to Australians about the amount and types of foods to eat for health and wellbeing. The recommendations are based on scientific evidence, developed after in-depth review of good quality research. By following a dietary pattern in line with the ADG, Australians will optimise their nutrient intake for good health and to reduce the risk of chronic health problems such as heart disease, type 2 diabetes, some cancers and obesity.
Inadequate fruit and vegetable consumption in Australian adults
100
90
80
70
60
50
40
30
20
10
0
2007-08 2011-12 2014-15 2017-18
Year
Inadequate fruit consumption Inadequate vegetable consumption
% o
f ad
ult
s n
ot
con
sum
ing
the
reco
mm
end
ed
serv
es
Page 10 of 28
According to the secondary analysis of the 2011-12 National Nutrition and Physical Activity Survey (NNPAS), most Australians were not meeting their daily fruit intake recommendations, however including fruit juice as a serve of fruit at 125 mL significantly increased the percentage who met recommendations from 10% to 24%. In some groups e.g. young adults aged 19-30, the effect was even greater with the inclusion of fruit juice increasing compliance from 4% to 18% (G. B. Hendrie 2015).
2017-18 data shows that compliance with the ADG fruit recommendation is still poor for adults, with 49 per cent of adults not consuming the recommended daily serves, which is largely unchanged since 2007-8. In contrast, children (aged 2-17) have improved compliance with the fruit intake recommendation, increasing from 70.1% in 2014-15 to 73% (Australian Bureau of Statistics 2017).
1.1.3 Oral health impacts
Oral health is an important pillar of overall health. Impacts to oral health can affect daily activities including eating, speaking and sleeping. Moreover, impacts to oral health can cause pain, discomfort and infection. Some foods, nutrients and dietary patterns have been associated with poor oral health.
An analysis of the 2015 NSW Schools Physical Activity and Nutrition Survey (SPANS) of children aged 5-16 found that fruit juice consumption was not associated with oral health impacts. Of all beverage categories, the prevalence of oral health impacts was lowest among juice consumers (Hardy 2018). This finding is supported by international research that showed that juice with no added sugar was not associated with dental caries (Vargas 2014). Hardy et al., proposed that the natural sugars in fruit juice may have less carcinogenicity than those in other beverages or that juice consumers may have a healthier diet overall (2018).1
1.1.4 Glycaemic load
Diets with a high glycaemic index (GI) or glycaemic load (GL) have been associated with risk of overweight and obesity. GL is a measure that considers the GI of the foods/drinks eaten as well as the portion size of carbohydrate consumed, whereby a lower GL diet is considered to be a healthier one. Data from long-term epidemiological studies shows that optimising dietary GI and GL reduces the risk of type 2 diabetes, coronary heart disease and age-related macular degeneration (Chiu CJ 2011).
Children
One study of Australian children and adolescents aged 2-16 found that decreasing trends were seen for both GI and GL of the diet and % energy from sugars from 1995-2012. Fruit and vegetable juices were found to contribute minimally to the GL of the diet – 5.5% per capita in 2012 and 11.2% per consumer in 2012. The contribution of fruit and vegetable juices to the GL of children’s diets has seen a downward trend from 1995 to 2012 – per capita, juices have fallen from 9.9% in 1995 to 5.5% in 2012, and per consumer, juices have fallen from 13% in 1995 to
1 Note that in this study, fruit juice consumption reported by participants may have included fruit drinks due to the nature of the survey questions.

Page 12 of 28
11.2% in 2012, with fruit and vegetable juices falling from the 11th highest contributor to GL in 1995 to 14th in 2007 and 2012 (Yeung 2018). 2
Adults
Analysis of the 2011-12 Australian Health Survey (AHS) data found that fruit and vegetable juices and cordials contributed small amounts to the GL of Australian adult’s diets; between 2.3 and 3.9% in different age groups per capita with a decreasing trend seen with increasing age. Per consumer, GL contribution also decreased with age from a 12.5% contribution in 19-30 years and a 9.9% contribution in 71+ year old (Louie 2017).3
1.2 Contribution to nutrient intakes
Juice with no added sugar provides micronutrients that are essential for human health including:
Vitamin C
• Important role in immune system function and essential as an antioxidant and for collagen production; and
• 27% of vitamin C in the diet comes from fruit and vegetable juices (Australian Bureau of
Statistics: Department of Health and Aged Care 1998).
Folate
• Essential for red blood cell production and to make DNA; and
• Some Juice products are now fortified with folate to help Australian’s meet their daily intakes, as there are limited dietary sources of folate (National Health and Medical Research Council, 2014).
Potassium
• An important electrolyte, essential to the function of nerves and muscles.
The National Nutrition and Physical Activity Survey (NNPAS) was completed in 2011-12 as part of the Australian Health Survey and is the latest comprehensive research on Australia’s population dietary and nutrient intakes. The NNPAS is independent government research that studies a representative sample of the population. Secondary analysis of this research has been used in this report and separates analysis by two groups - the total population and consumers (G. B. Hendrie 2015). Juice was only consumed on the day before the survey by 23% of children and 15% of adults, therefore it is useful to look at both consumer and total population data to tell the whole story. Over the total population, juice contributes less than 1% of total daily energy (kilojoules) intake to Australians and 3.5% of total daily sugar intake. The following analysis is by consumer only and provides the most up-to-date data on the diets of juice consumers.
2 Note that this study includes fruit drinks with juice. 3 Note that this study combined cordials with juice.

Page 13 of 28
1.2.1 Contribution to children’s nutrient intakes Vitamin C, folate and potassium Secondary analysis of the 2011-12 NNPAS showed that fruit juice was the top beverage contributor to vitamin C intakes for children (Riley 2019). Secondary analysis by consumers showed that fruit juice contributed 57% of total daily vitamin C, 16.5% of total folate and 16% of total potassium intake for consumers (G. B. Hendrie 2015).
Energy (kilojoules)
Fruit juice contributed 5.3% of total daily energy intake for consumers, which is substantially less than the 9.3% from sugar-sweetened beverages (G. B. Hendrie 2015). For children, milk and flavoured milk were the leading beverage contributors to energy (Riley 2019).
Total sugar
Fruit juice contributed 20.2% of total daily sugar intake for children consumers, which is substantially less than the 35.4% from sugar-sweetened beverages (G. B. Hendrie 2015). For children, fruit juice was the top beverage contributor to sugar intake, however it is important to note that the sugars are naturally-occurring sugars, not added sugars (Riley 2019).
For 2 year old children, fruit and vegetable juices and drinks were found to be the largest contributor to free sugar intake (10.7%), however this analysis did not separate fruit drinks from juices (Devenish 2019).
1.2.2 Contribution to adult’s nutrient intakes
Vitamin C, folate and potassium
Secondary analysis of the 2011-12 NNPAS showed that fruit juice was the top beverage contributor to vitamin C intakes for adults (Riley 2019). Secondary analysis by consumers showed that fruit juice contributed 57% of total daily vitamin C, 16.8% of total folate and 13.8% of total potassium intake for consumers (G. B. Hendrie 2015).
Energy (kilojoules)
Fruit juice contributed 5.2% of total daily energy intake for consumers, which is substantially less than the 10.3% from sugar-sweetened beverages (G. B. Hendrie 2015). For adults, alcoholic drinks and coffee were the leading beverage contributors to energy (Riley 2019).

Page 14 of 28
Total sugar
Fruit juice contributed 20.5% of total daily sugar intake for consumers, which is substantially less than the 41.4% from sugar-sweetened beverages (G. B. Hendrie 2015). For adults, coffee and soft drinks were the top contributors to sugar intake (Riley 2019).
Table 1 shows the contribution fruit juice makes to the nutrient intakes of adult and children consumer’s diets.
Table 1. Contribution of juice to adult and children consumer’s nutrient intakes (Riley 2019)
(G. B. Hendrie 2015)
Contribution to total daily nutrient intake
Adults Children
Vitamin C 57.0% 57.0%
Folate 16.8% 16.5%
Potassium 13.8% 16.0%
Energy (kilojoules) 5.2% 5.3%
Sugar (total) 20.5% 20.2%
1.2 Nutrient composition comparisons: juice and whole fruit
While dietary analysis shows that juice makes a significant contribution to micronutrient intakes while contributing a small amount to energy intake, comparison of nutrient composition of juice and their whole fruit counterparts shows that while juice is missing the fibre, it provides comparable or more micronutrients for fewer kilojoules, as per the ADG serves (Table 2).
Table 2. Nutrient comparison of selected juices and their fruit counterparts - Australian Food
Composition Database (Food Standards Australia New Zealand 2019)
Nutrient per ADG serve
Orange juice (125 mL)
Whole orange (150 g)
Apple and blackcurrant juice (125 mL)
Whole apple (150 g)
Energy4 (kJ) 144 232 214 327
Carbohydrate (g)
7.1 10.7 12.1 18.6
Total sugars (g) 7.1 12.3 12.1 18
Added sugars (g)
0 0 0 0
Fibre (g) 0.4 3.6 0 4
Vitamin C (mg) 90 78 35 10
Folate5 (ug) 66 94 0 88
Potassium (mg) 190 285 124 170
4 Energy without dietary fibre 5 Dietary folate equivalents

Page 15 of 28
Analysis from the United States showed that juice also retained much of its antioxidant content compared to its whole fruit counterparts (Crowe 2013). Similarly, a study of Australian adolescents shows that juice is the top contributor to flavonoid intake, providing 44% of flavonoids for 14 year old adolescents and 38% for 17 year old adolescents (Kent 2020).
1.3 Beverage substitution modelling
Two modelling studies have been undertaken in Australia to understand the effect of beverage substitution.
One study modelled the effects of beverage substitution in adolescence on obesity outcomes in early adulthood and found that substituting sugar-sweetened beverages for 100% fruit juice led to reductions in BMI and waist circumference, although this was not statistically significant (M. R. Zheng 2019). Another modelling study in adults found that substituting a serve of sugar- sweetened beverage for juice with no added sugar was associated with a 0.14 point decrease in BMI and a 0.3 cm decrease in waist circumference (M. S. Zheng 2017).
While modelling studies have limitations as they are not real-world studies, these results support the inclusion of fruit juice as an occasional beverage in the dietary guidelines.
1.4 Consumption trends over time
A comparison of the 1995 National Nutrition Survey and 2011-12 NNPAS results shows that adult fruit juice intake fell by 8.5% across the time period from 58.6 kg to 53.6 kg per person per year6, while children’s (2-18) intake fell almost 30% from 96.9 kg to 67.9 kg per person per year (Ridoutt 2016)7. The 2011 data indicates an average intake of 147 g fruit equivalent per day for adults and 186 g fruit equivalent per day for children – both equal to approximately a serve of whole fruit (Figure 2). This sharp decline in juice consumption coincides with no change in the percentage of adults consuming the recommended serves of fruit and vegetables. The percentage of children consuming the recommended serves of fruit has only increased by 3% from 2014-15 to 2017-18, while the percentage consuming enough fruit and vegetables has not changed significantly (Australian Bureau of Statistics, 2017; Mihrshahi, 2019). While volume sales data has demonstrated the decline in juice consumption, there has not been a National Nutrition Survey since 2011-12, leaving a gap in consumption data.
6 Volume of juice was converted to raw food equivalent in kg. 7 It is not clear whether juice drinks were included as ‘juice’.

Page 16 of 28
Conclusion:
• Juice makes a significant contribution to Vitamin C intakes, while only making a small
contribution to energy and sugar intakes. For instance, for adult consumers juice
provides 57% of Vitamin C intake but only 5.2% of energy intake.
• As per the ADG serves, compared to whole fruit, juice provides more or comparable
levels of micronutrients for fewer kilojoules i.e. is more nutrient dense. It is important
to note that juice does not contribute any added sugars to the diet.
• Consumption of fruit juice in Australia has been declining over time, while fruit and
vegetable consumption has not increased.
• While sales data has shown a sustained decline in juice consumption to 2018, there has
not been a national nutrition survey since 2011-12, leaving a gap in accurate
consumption data of both juice and whole fruit and vegetables.
• Juice consumption is associated with multiple measures of a healthy diet, including
total diet quality score, higher vegetable intakes and lower discretionary food intakes.
• Juice consumption allows many Australian consumers to achieve their recommended
intake of fruit, as per the ADG which include juice as an ‘occasional’ serve to the core
fruit group. Scoring juice according to the final HSR Calculator may have the unintended
consequence of dissuading consumers from consuming juice that is helping them to
meet their recommended fruit intake.
• Juice consumption is associated with other markers of a healthy diet, like good oral
health and low contribution to glycaemic load.
Figure 2. Trend in fruit juice consumption from 1995 to 2011 for adults and children, as grams
fruit equivalent.
Trend in fruit juice consumption, 1995 to 2011
290
240
190
140
90
40
1995 2011
Children Adults
aver
age
gram
s fr
uit
eq
uiv
per
per
son
per
day

Page 17 of 28
Conclusion:
• There has been remarkable innovation in the juice category in line with consumer
trends to provide plenty of nutritious choices and this is predicted to continue into the
next decade.
• The juice category includes vegetable juices as well as fruit and vegetable blends and
juices with functional ingredients that can make significant contributions to daily
nutrient intakes
2. The juice category
2.1 What does the category look like in 2020?
The juice category in 2020 looks vastly different to the juice category 5 or 10 years ago, due to the high level of local innovation. Since 2008, chilled juice has expanded rapidly, growing in value by more than $140 million. Likewise, premium lines are expected to continue growing, including fruit and vegetable blends, pressed or crushed juices and unique juice blends (Australian Beverages Council 2019).
The juice category is likely to see more innovation in the future, with new products likely to include fruit and vegetable blends that feature exotic herbal and functional ingredients such as ginger, turmeric, and mint. Other novel juice products likely to grow include functional juice shots/tonics and coconut-water based juices.8
8 Predictions are based on current market and industry trends, and are a guide only.

Page 18 of 28
3. Juice Consumption
3.1 Who drinks juice?
Fruit juice is the third most commonly consumed beverage among Australians, after water and SSBs, consumed by less than a quarter of children (23%) and 15% of adults on the day of the survey (G. B. Hendrie 2015). To place juice consumption in perspective, this compares to almost 50% of children and over 30% of adults consuming SSBs on the day of the survey.
3.1.1. Children
Two to three-year-old children were most likely to consume fruit juice, with consumption similar across genders for all age groups. Higher socioeconomic status (SES) was associated with higher fruit juice intakes among children (G. B. Hendrie 2015). A study of Australian children between 2004 and 2017 showed that fruit juice was commonly introduced at 1 and 2 years of age, after which there was a sharp decline away from fruit juice consumption, coupled with a simultaneous increase in soft drink and cordial consumption (Cockburn 2018). The study found that at age 0-1, higher proportions of juice consumers were recorded in regional and remote areas, low SES areas and among those with a medical condition. A study in NSW found the majority of children aged 5 to 16 (56%) never drank juice or had less than 1 cup a week (Hardy LL 2016).
3.1.2. From adolescent to adulthood
A survey of South Australians 15 years and over found that 25% of respondents had consumed fruit juice once a week with 10% consuming it every day. Consistent with other research, fruit juice consumers were younger and had higher educational attainment. An association was found between exercise and fruit juice consumption whereby juice consumers were 1.8 times more likely to exercise everyday than non-consumers (Miller 2019). For males, juice consumption was associated with SES, but not for females (G. B. Hendrie 2015).
Consumer research confirms that men (27.6%) are slightly more likely than women (26.3%) to consume packaged fruit juice, with young people of both genders being the most avid consumers. Among men, consumption peaks among 18 to 24-year olds (34.6%), while the 65+ bracket is least likely to drink it (25.5%). Similarly, among women, consumption peaks at the age of 14-17 with 38.8% consuming fruit juice/drinks in an average week, while women aged 65 or older are the lowest consumers with only 19.9% consuming in an average week (Roy Morgan 2016).
Page 19 of 28
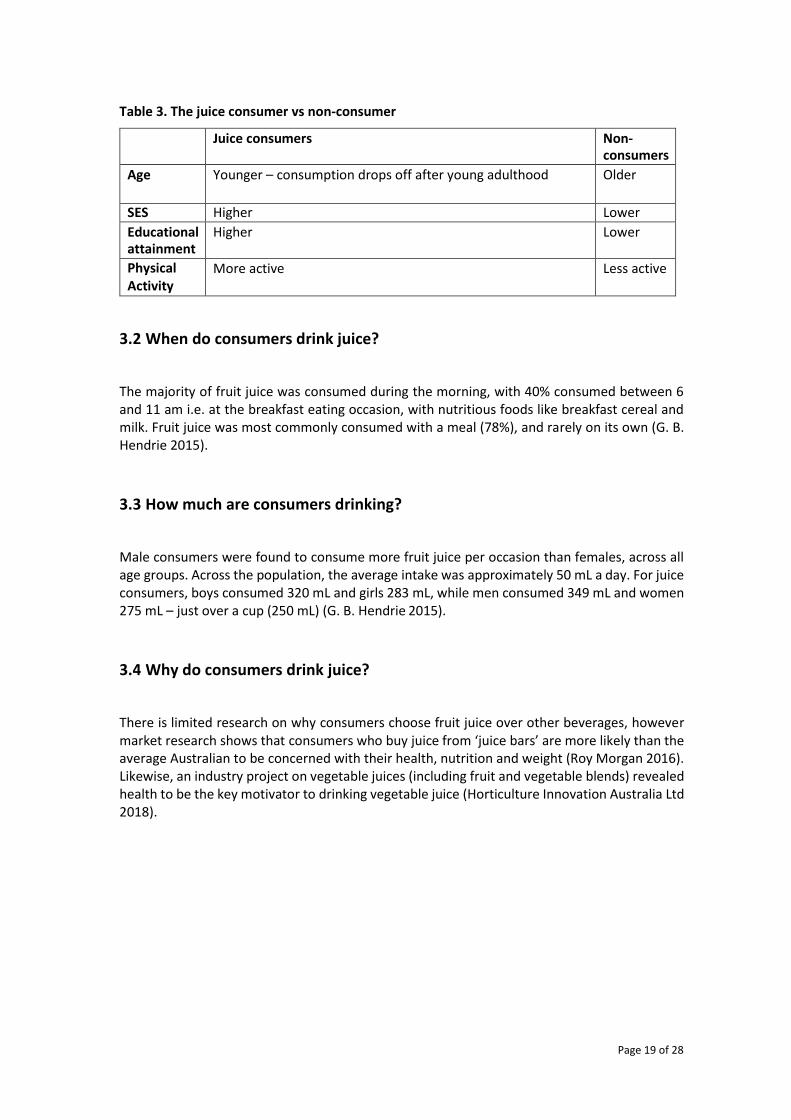
Table 3. The juice consumer vs non-consumer
Juice consumers Non- consumers
Age Younger – consumption drops off after young adulthood Older
SES Higher Lower
Educational attainment
Higher Lower
Physical Activity
More active Less active
3.2 When do consumers drink juice?
The majority of fruit juice was consumed during the morning, with 40% consumed between 6 and 11 am i.e. at the breakfast eating occasion, with nutritious foods like breakfast cereal and milk. Fruit juice was most commonly consumed with a meal (78%), and rarely on its own (G. B. Hendrie 2015).
3.3 How much are consumers drinking?
Male consumers were found to consume more fruit juice per occasion than females, across all age groups. Across the population, the average intake was approximately 50 mL a day. For juice consumers, boys consumed 320 mL and girls 283 mL, while men consumed 349 mL and women 275 mL – just over a cup (250 mL) (G. B. Hendrie 2015).
3.4 Why do consumers drink juice?
There is limited research on why consumers choose fruit juice over other beverages, however market research shows that consumers who buy juice from ‘juice bars’ are more likely than the average Australian to be concerned with their health, nutrition and weight (Roy Morgan 2016). Likewise, an industry project on vegetable juices (including fruit and vegetable blends) revealed health to be the key motivator to drinking vegetable juice (Horticulture Innovation Australia Ltd 2018).

Page 20 of 28
• Fruit juice is the third most commonly consumed beverage after water and SSBs,
however consumption is still low with about half as many consumers as SSBs
• Fruit juice is more commonly consumed by younger demographics – with first
introduction at age 1-2 and consumption falling after young adulthood.
• Fruit juice consumers are more likely to be of a higher SES and educational
attainment, as well as more physically active.
• Fruit juice is most commonly consumed at breakfast time or with other meals, most
frequently consumed as a glass serving (~250 mL).
• Consumer research is limited, however some local insights suggest fruit juice
purchasing is driven by health as the key motivator.
Conclusion:

Page 21 of 28
4. HSR Modelling
4.1 Calculator modelling
On 19 December 2019, the Australia and New Zealand Ministerial Forum on Food Regulation published a response to the recommendations of the HSR Five-Year Review. (Health Star Rating 2020) As per these recommendations, the HSR calculator was revised to better discern water from other non-dairy beverages to provide consumers with clear and informed healthier choices. Under the final HSR calculator, juice with no added sugar scores between 2.5 and 4 stars, with most fruit juices scoring 2.5. 9
Consumer research has consistently indicated that the HSR is useful, with 77% of respondents in 2018 agreeing that the HSR helps them identify healthier choices within a category (National Heart Foundation of Australia 2019). While there is no cut-off officially endorsed by the HSR governance, researchers and the NSW state health department have adopted the use of a 3.5 HSR as a distinction between core and discretionary foods (Crino, et al. 2018) (Jones, Rådholm and Neal 2018) (Dunford, Thomas and Wu 2015). As juice is included as an occasional serve in the core fruit group in the dietary guidelines, it would seem appropriate for juice to be awarded an HSR consistent with the distinctions used academically between core and discretionary foods.
Similarly, while it is recognised that juice only counts towards fruit serves ‘occasionally’, its HSR should be more aligned with other foods that count towards fruit serves, reflecting the positive contribution it can make in helping Australians meet their recommended fruit intake (Table 3). While the HSR is to be used within a category, i.e. juice is not to be compared with dried fruit, it is incongruous that juice scores so poorly compared to other core foods in the ‘fruit’ group. Furthermore, as the revised calculator takes into account fruit, vegetable, nut and legume (FVNL) content as modifying points, it seems incongruous that products up to 100% FVNL content can receive such low HSR scores.
9 ABCL modelling based on final HSR Calculator

Page 22 of 28
Conclusion:
• The scoring of juice as per calculator 1 does not accurately reflect the widely-used
academic cut-off of 3.5 as the distinction between core and discretionary foods, as
juice is considered a core food to be included ‘occasionally’.
• This scoring is also incongruous with the scoring of other foods within the ‘fruit’
group, and with the inclusion of the FVNL modifying points given juice has 100%
FVNL content.
• An automatic HSR score of 4 for juice would allow the HSR to be better aligned with
the dietary guidelines and minimise consumer confusion.
Table 3. Proposed Health Star Ratings for foods/drinks in the ‘fruit’ group compared to ADG
position
ITEM QUANTITY per
ADG serve MINIMUM STARS CORE OR
DISCRETIONARY ADG Position
Whole fruit 150 grams
Core (≥3.5)
Core Food
Juice (no added sugar)
125 mL
Discretionary (≤ 3.5)
Core Food
Dried fruit 40 grams
Core (≥3.5)
Core Food
“Unlike fruit and dried fruit, the HSR rating for juice is not aligned with the Australian Dietary Guidelines recommendation and unfairly communicates juice as a discretionary
choice, like cakes and lollies to consumers”.

Page 23 of 28
6. International guidelines and policy issues related to juice
6.1 Comparison of Australian and international dietary guidelines related to juice
Most international food-based dietary guidelines provide guidance on including fruit juice as a serve of fruit and/or vegetables, with quantities ranging from 100-250 mL counting as a serve. (Fruit Juice Matters 2020)
Table 4. Comparison of Australian & International Guidelines on Juice
COUNTRY GUIDANCE SERVING SIZE NOTES
Australia 125mL of fruit juice with no added sugar can be included as a serve of fruit “occasionally”
125 mL counts as one serve of fruit
USA “Although fruit juice can be part of healthy eating patterns, it is lower than whole fruit in dietary fibre and when consumed in excess can contribute extra calories. Therefore, at least half of the recommended amount of fruits should come from whole fruits. When juices are consumed, they should be 100% juice, without added sugars”.
One cup of 100% fruit juice counts as 1 cup of fruit
These guidelines are currently under review with the 2020 Dietary Guidelines Advisory Committee’s (DGAC) recommendations published. The DGAC cites limited evidence that fruit juice consumption is associated with BMI or any other measures of adiposity. The DGAC also recognises the contribution nutritious beverages like juice make to the American diet, providing at least a third of the intake of “shortfall nutrients” like Vitamin C. (Dietary Guidelines Advisory Committee. 2020)

Page 24 of 28
UK The UK Dietary Guidelines were last reviewed in 2016, with the review resulting in fruit juice being removed from the fruit and vegetable segment and encompassed in the hydration and water group. EatWell provides the guidance: “ (National Health Service 2019)
“Remember that fruit juice and smoothies should be limited to no more than a combined total of 150ml a day.”
Ireland Ireland’s dietary guidelines and Food Pyramid were revised in 2015-16. The guidelines encourage consumption of 5-7 servings of fruit and vegetables per day, with juice with no added sugar considered a serving. (Fruit Juice Matters 2020)
150 mL of juice with no added sugar is considered a serving of fruit for adults, while 100 mL is considered a serving for children.
Juice is visually represented in the food pyramid for both adults and children, with the guidance for children stating “Orange juice is rich in vitamin C. When your child drinks unsweetened orange juice and eats an iron-containing breakfast cereal, it helps them absorb iron. Iron is an important nutrient for young children”.
6.2 Policy initiatives related to juice
6.2.1 United States
The US Dietary Guidelines are currently under review, with the Dietary Guidelines Advisory Committee (DGAC) submitting their report in July 2020. The DGAC’s report includes a recommendation, “The Committee suggests that less than 6 percent of energy from added sugars is more consistent with a dietary pattern that is nutritionally adequate while avoiding excess energy intake from added sugars than is a pattern with less than 10 percent energy from added sugars. The advisory committee found that added sugars make up on average 13 percent of our daily energy intake”. The DGAC also cites limited evidence that fruit juice consumption is associated with BMI or any other measures of adiposity. The DGAC also recognises the contribution nutritious beverages like juice make to the American diet, providing at least a third of the intake of “shortfall nutrients” like Vitamin C. (Dietary Guidelines Advisory Committee. 2020)

Page 25 of 28
Conclusion:
• Food-based dietary guidelines around the world consider fruit juice to be a core food, with a serve size generally stipulated to contribute to
fruit/veg intakes. However, serve sizes are inconsistent across the world.
• The US Dietary Guidelines consider fruit juice a core food, with the next Dietary Guidelines likely to maintain this recommendation.
• The UK EatWell Guide does not consider juice to count towards a fruit/veg serve, however allows consumption of 150 mL a day. The UK also has a
reformulation program to reduce the sugar in juices by 5% and set a 150 kcal limit on a serve.
Dietary guidelines in Ireland consider fruit juice to be a core food with a one serve contributing to the daily recommended fruit and veg intakes for both
children (100 mL) and adults (150 mL).
This recommendation, coupled with the FDA’s focus on added sugar labelling, suggests that beverages with added sugar are likely to be targeted more heavily in the next Dietary Guidelines, rather than juice with no added sugar. (US Food & Drug Administration 2016)
6.2.1 United Kingdom
Based on the success of the Soft Drink Industry Levy and the voluntary sugar reduction scheme, Public Health England introduced a sugar reduction scheme for juice and milk-based drinks in 2018. A progress report is expected in 2022 with targets set for mid-2021. (Public Health England 2018) 10
The ambition for juices is:
• 5% sugar simple weighted average reduction for juice blends by mid-2021 to 8.9g per 100 mL
• Simple average applied to 100% mono-fruit/vegetable juice of 9.7 g per 100 mL
• All juice-based drinks (including blended juices, smoothies and mono-juices) to meet a 150kcal per serve maximum guideline for products likely to be consumed in a single occasion by mid-2021.
The lower ambition for juice compared to other categories e.g. milk drinks subject to 10% reduction, reflects PHE’s understanding of the significant absence of opportunity to reduce sugar levels in these drinks, in addition to the need to meet compositional legislative requirements for 100% fruit and vegetable juices.
10 Note juice drinks with added sugar are included in the SDIL so are not covered by this program.

Page 26 of 28
References Australian Beverages Council. 2019. Growing for the Future.
https://www.australianbeverages.org/growing-for-the-future/. Australian Bureau of Statistics. 2017. “National Health Survey; First results.”
https://www.abs.gov.au/statistics/health/health-conditions-and-risks/national- health-survey-first-results/latest-release.
Australian Bureau of Statistics: Department of Health and Aged Care. 1998. “National nutrition survey. Nutrient intakes and physical measurements.” Canberra.
Australian Institute of Health and Welfare. 2019. Poor Diet. 19 July. https://www.aihw.gov.au/reports/food-nutrition/poor-diet/contents/poor-diet-in- adults.
Chiu CJ, Liu S, Willett WC, et al. 2011. “Informing food choices and health outcomes by use of the dietary glycemic index.” Nutr Rev.
Cockburn, N., Lalloo, R., Schubert, L., & Ford, P. J. 2018. “Beverage consumption in Australian children.” European journal of clinical nutrition 72 (3): 401-409.
Crino, M., G. Sacks, E. Dunford, K. Trieu, J. Webster, S. Vandevijvere, B. Swinburn, J.Y. Wu, and B Neal. 2018. “Measuring the Healthiness of the Packaged Food Supply in Australia.” Nutrients 702.
Crowe, Kristi Michele, and Elizabeth Murray. 2013. “Deconstructing a fruit serving: comparing the antioxidant density of select whole fruit and 100% fruit juices.” Journal of the Academy of Nutrition and Dietetics 1354-1358.
Devenish, G., Golley, R., Mukhtar, A., Begley, A., Ha, D., Do, L., & Scott, J. A. 2019. “Free sugars intake, sources and determinants of high consumption among Australian 2- year-olds in the SMILE cohort.” Nutrients 161.
Dietary Guidelines Advisory Committee. 2020. cientific Report of the 2020 Dietary Guidelines Advisory Committee: Advisory Report to the Secretary of Agriculture and the Secretary of Health and Human Services. Washington, DC: U.S. Department of Agriculture, Agricultural Research Service.
Dunford, E.C.M., M. Thomas, and J Wu. 2015. echnical Report: Alignment of NSW Healthy Food Provision Policy with the Health Star Rating System. Sydney: NSW Ministry of Health.
Flinders Partners. 2010. “Analysis of the 2007 Australian National Children's Nutrition and Physical Activity Survey. Report for Australian Beverages Council Ltd.”
Food Standards Australia New Zealand. 2015. “Australia New Zealand Food Standards Code – Standard 2.6.1 – Fruit juice and vegetable juice.”
—. 2019. Australian Food Composition Database. https://www.foodstandards.gov.au/science/monitoringnutrients/afcd/Pages/default .aspx.
Food Standards Australia New Zealand. 2015. “Standard 2.6.2 - Non-alcoholic beverages and brewed soft drinks.”
Food Standards Australia New Zealand, . 2015. “Australia New Zealand Food Standards Code – Standard 2.6.1 – Fruit juice and vegetable juice.”
Fruit Juice Matters. 2020. Fruit Juice in the Dietary Guidelines. https://fruitjuicematters.uk/en/consumption-and-behaviour/fruit-juice-in-the- dietary-guidelines.

Page 27 of 28
Hardy LL, Mihrshahi S, Drayton BA, Bauman, A. 2016. NSW Schools Physical Activity and Nutrition Survey (SPANS) 2015: Full Report. 2016: NSW Department of Health.
Hardy, L. L., Bell, J., Bauman, A., & Mihrshahi, S. 2018. “Association between adolescents’ consumption of total and different types of sugar-sweetened beverages with oral health impacts and weight status.” Australian and New Zealand journal of public health (Australian and New Zealand journal of public health) 42 (1): 22-26.
Health Star Rating . 2020. Formal review of the system after five years of implementation (June 2014 to June 2019). http://healthstarrating.gov.au/internet/healthstarrating/publishing.nsf/Content/for mal-review-of-the-system-after-five-years.
Healthy Ireland. 2019. The Food Pryamid. https://assets.gov.ie/7649/3049964a47cb405fa20ea8d96bf50c91.pdf.
Healthy Ireland, . 2020. “A Visual Guide to The Children's Food Pyramid.” https://www.gov.ie/pdf/?file=https://assets.gov.ie/89226/7534d199-bfd5-4bc5- 844a-8bde3073655b.pdf#page=null.
Hendrie, G.A., Baird, D., Syrette, J., Barnes, M., Riley, M. 2015. Consumption of non-dairy, non-alcoholic beverages in the Australian population: A secondary analysis of the National Nutrition Survey 2011-12. Australia: CSIRO.
Hendrie, Gilly, and Manny Noakes. 2017. Fruit, Vegetables and Diet Score. Hortculture Innovation Australia.
Horticulture Innovation Australia Ltd. 2018. “Final Report: Market Opportunity for Vegetable Juices.” https://www.horticulture.com.au/globalassets/laserfiche/assets/project- reports/vg16016/vg16016-final-report-complete.pdf.
Jones, A., K. Rådholm, and B Neal. 2018. “Defining ‘Unhealthy’: A Systematic Analysis of Alignment between the Australian Dietary Guidelines and the Health Star Rating System.” Nutrients 501.
Kent, K., Charlton, K., O’Sullivan, T. et al. 2020. “Estimated intake and major food sources of flavonoids among Australian adolescents.” Eur J Nutr.
Louie, J. C. Y., Jones, M., Barclay, A. W., & Brand-Miller, J. C. 2017. “Dietary glycaemic index and glycaemic load among Australian adults–results from the 2011–2012 Australian Health Survey. .” Scientific reports 43882.
Mihrshahi, Seema, Rimma Myton, Stephanie R. Partridge, Emma Esdaile, Louise L. Hardy, and Joanne Gale. 2019. “Sustained low consumption of fruit and vegetables in Australian children: Findings from the Australian National Health Surveys.” Health Promotion Journal of Australia.
Miller, C., Wakefield, M., Braunack-Mayer, A., Roder, D., O’Dea, K., Ettridge, K., & Dono, J. 2019. “Who drinks sugar sweetened beverages and juice? An Australian population study of behaviour, awareness and attitudes.” BMC Obesity 6 (1): 1.
National Health and Medical Research Council. 2013. Australian Dietary Guidelines. Canberra: National Health and Medical Research Council.
National Health and Medical Research Council, . 2014. Folate. https://www.nrv.gov.au/nutrients/folate.
National Health Service. 2019. “The Eatwell Guide.” http://www.nhs.uk/live-well/eat- well/the-eatwell-guide/.

Page 28 of 28
National Heart Foundation of Australia. 2019. “Report on the monitoring of the implementation of the Health Star Rating system in the first four years of implementation: June 2014 to June 2018.”
Nguyen, B., Bauman, A., Gale, J., Banks, E., Kritharides, L., & Ding, D. 2016. “Fruit and vegetable consumption and all-cause mortality: evidence from a large Australian cohort study.” International Journal of Behavioral Nutrition and Physical Activity 9.
Public Health England. 2018. “Sugar reduction: juice and milk based drinks.” https://www.gov.uk/government/publications/sugar-reduction-juice-and-milk- based-drinks.
Ridoutt, B., Baird, D., Bastiaans, K., Hendrie, G., Riley, M., Sanguansri, P., ... & Noakes, M. 2016. “Changes in food intake in Australia: Comparing the 1995 and 2011 National Nutrition Survey Results disaggregated into basic foods.” Foods 5 (2): 40.
Riley, M. D., Hendrie, G. A., & Baird, D. L. 2019. “Drink Choice is Important: Beverages Make a Substantial Contribution to Energy, Sugar, Calcium and Vitamin C Intake among Australians.” Nutrients 1389.
Roy Morgan. 2016. Fruit juice brands fighting for shrinking market (except for trend-buster Nudie). http://www.roymorgan.com/findings/7023-fruit-juice-brands-fighting-for- shrinking-market-except-nudie-201610250954.
Shrapnel, W. S., & Butcher, B. E. 2020. “Sales of Sugar-Sweetened Beverages in Australia: A Trend Analysis from 1997 to 2018.” Nutrients 12 (4): 1016.
U.S. Department of Health and Human Services and U.S. Department of Agriculture. 2015. “2015–2020 Dietary Guidelines for Americans. 8th Edition.” http://health.gov/dietaryguidelines/2015/guidelines/.
US Food & Drug Administration. 2016. Changes to the Nutrition Facts Label. https://www.fda.gov/food/food-labeling-nutrition/changes-nutrition-facts-label.
Vargas, C.M., Dye, B.A., Kolasny, C.R., Buckman, D.W., McNeel, T.S., Tinanoff, N., Marshall, T.A. and Levy, S.M. 2014. “Early childhood caries and intake of 100 percent fruit juice: Data from NHANES, 1999-2004.” The Journal of the American Dental Association 1254-1261.
Yeung, C. H. C., Kusnadi, D. T. L., Barclay, A. W., Brand-Miller, J. C., & Louie, J. C. Y. 2018. “The Decreasing Trend in Dietary Glycaemic Index and Glycaemic Load in Australian Children and Adolescents between 1995 and 2012.” Nutrients 1312.
Zheng, M., Rangan, A., Huang, R. C., Beilin, L. J., Mori, T. A., Oddy, W. H., & Ambrosini, G. L. 2019. “Modelling the effects of beverage substitution during adolescence on later obesity outcomes in early adulthood: results from the Raine study.” Nutrients 2928.
Zheng, M., Sui, Z., Li, Z., & Rangan, A. 2017. “ A modeling study of beverage substitution and obesity outcomes among Australian adults.” Nutrition 71-75.