spread sheets & charts computer applications. rowcolumn run side to side horizontal ...
TRANSCRIPT

Spread Sheets & ChartsSpread Sheets & Charts
Computer ApplicationsComputer Applications
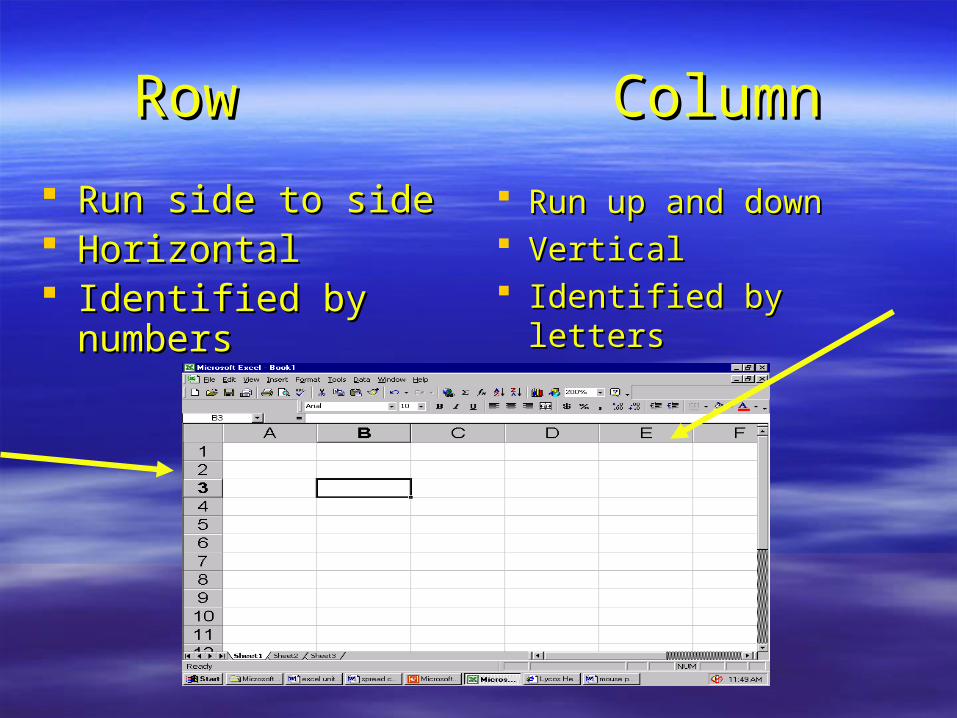
RowRow ColumnColumn
Run side to sideRun side to side HorizontalHorizontal Identified by Identified by
numbersnumbers
Run up and downRun up and down VerticalVertical Identified by lettersIdentified by letters

CellCell
When a row and column meet, cross, When a row and column meet, cross, or intersector intersect
A1 (Cell Address)A1 (Cell Address)
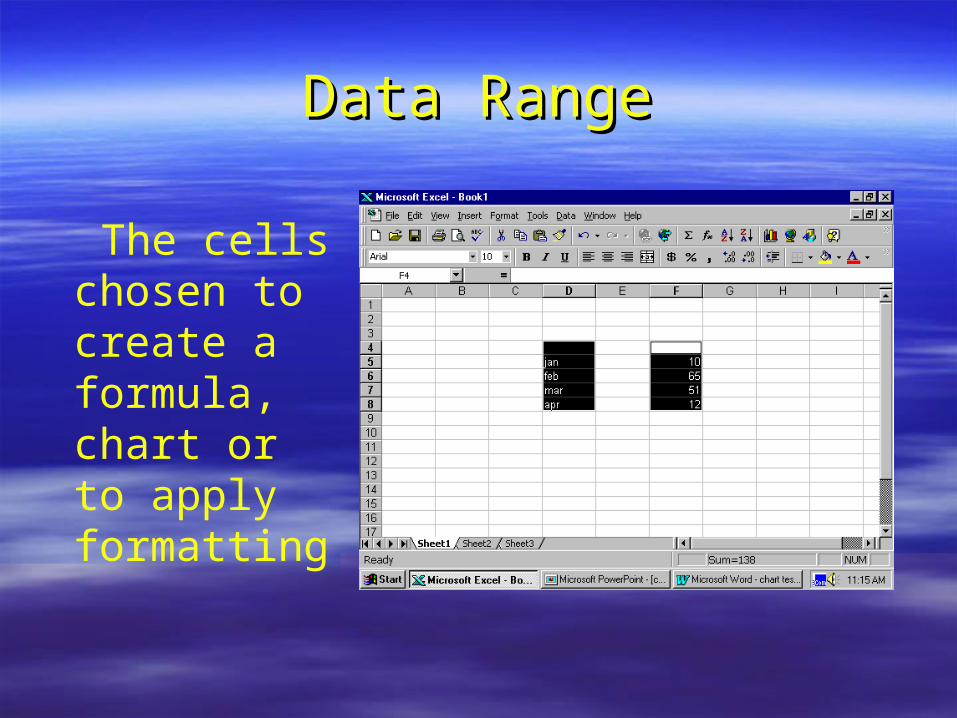
Data RangeData Range
The cells chosen to create a formula, chart or to apply formatting
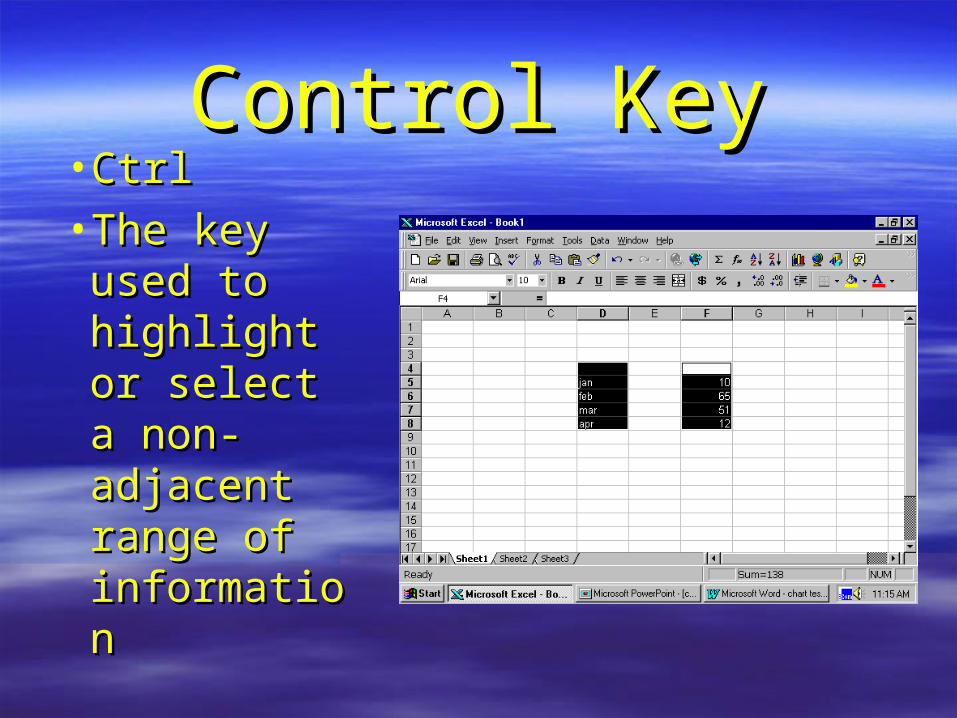
Control KeyControl Key•CtrlCtrl•The key The key used to used to highlight or highlight or select a select a non-non-adjacent adjacent range of range of informationinformation
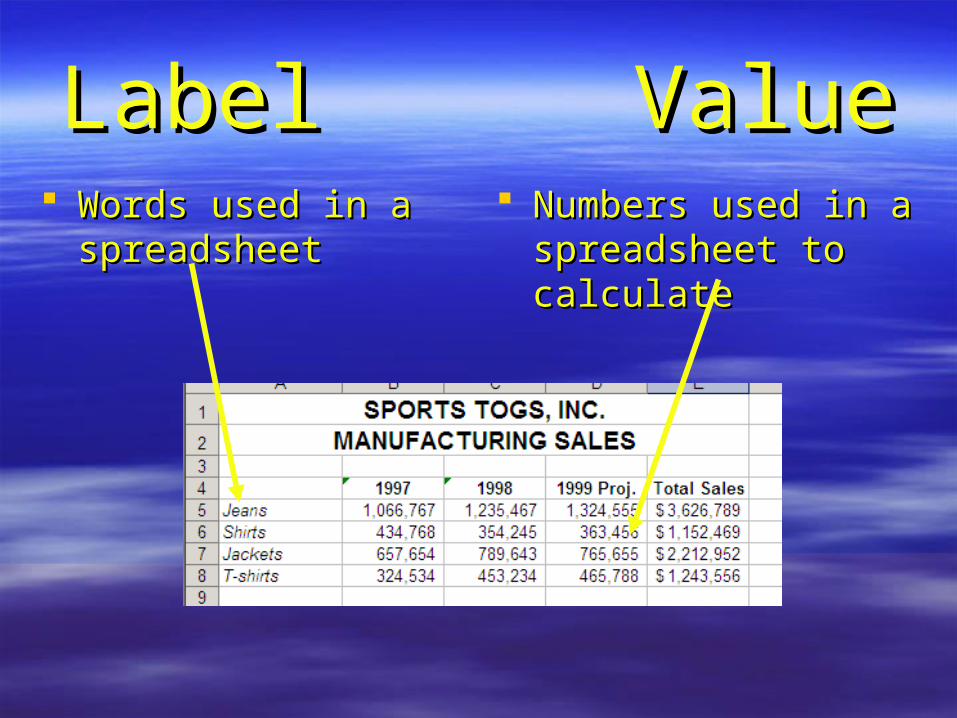
LabelLabel ValueValue Words used in a Words used in a
spreadsheetspreadsheet Numbers used in a Numbers used in a
spreadsheet to spreadsheet to calculatecalculate
Numeric LabelNumeric Label Numbers used as Numbers used as
words in a words in a spreadsheetspreadsheet
Place an apostrophe Place an apostrophe before the numberbefore the number
Computer reads as Computer reads as a worda word
Example: ‘1997Example: ‘1997
FormulaFormula An entry that causes a An entry that causes a
calculationcalculation
Equal Sign (=)Equal Sign (=) Symbol used to tell the computer to do Symbol used to tell the computer to do
some mathsome math ==sum(x1:x10)sum(x1:x10)

Colon (:)Colon (:) Symbol used to include Symbol used to include everything in everything in
betweenbetween Use a colonUse a colon
=sum(a2=sum(a2::d2)d2)
Instead of typing Instead of typing =sum(a2+b2+c2+d2)=sum(a2+b2+c2+d2)
Total FormulaTotal Formula Formula used to find the Formula used to find the SUMSUM of a range of a range =SUM(A2:D2)=SUM(A2:D2)
Average FormulaAverage Formula Formula used to find the Formula used to find the AVERAGEAVERAGE of of
a rangea range =AVERAGE(A2:D2)=AVERAGE(A2:D2)
Highest FormulaHighest Formula Formula used to find the highest number Formula used to find the highest number
in a rangein a range =MAX(C2:H2)=MAX(C2:H2)
Formula used to find the lowest number in a rangeFormula used to find the lowest number in a range =MIN(C2:H2)=MIN(C2:H2)
Lowest FormulaLowest Formula
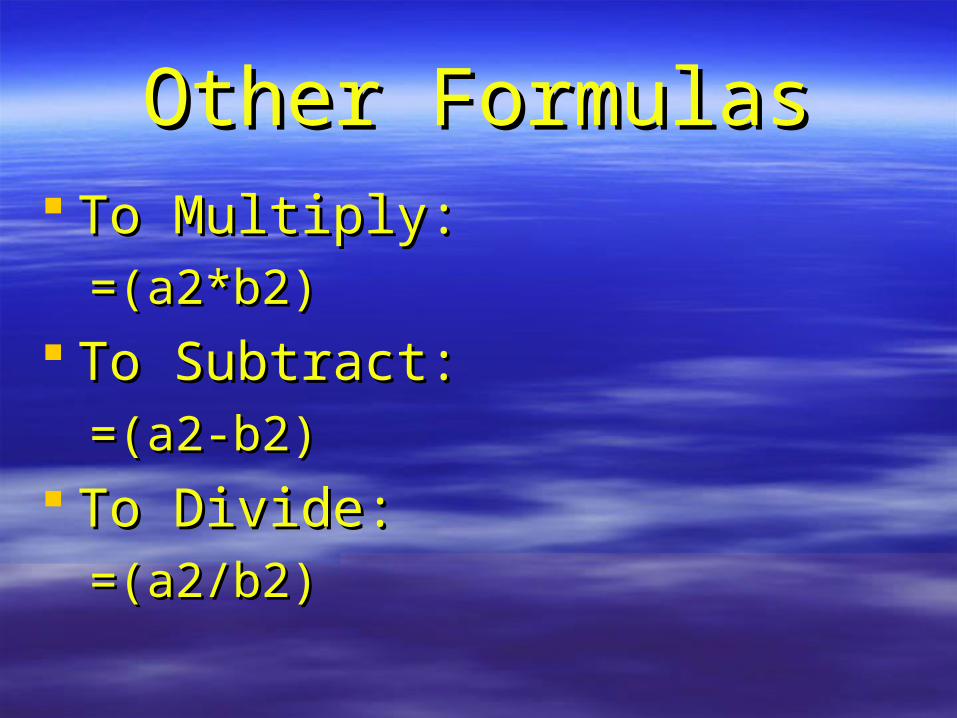
Other FormulasOther Formulas To Multiply: To Multiply:
=(a2*b2)=(a2*b2) To Subtract:To Subtract:
=(a2-b2)=(a2-b2) To Divide:To Divide:
=(a2/b2)=(a2/b2)
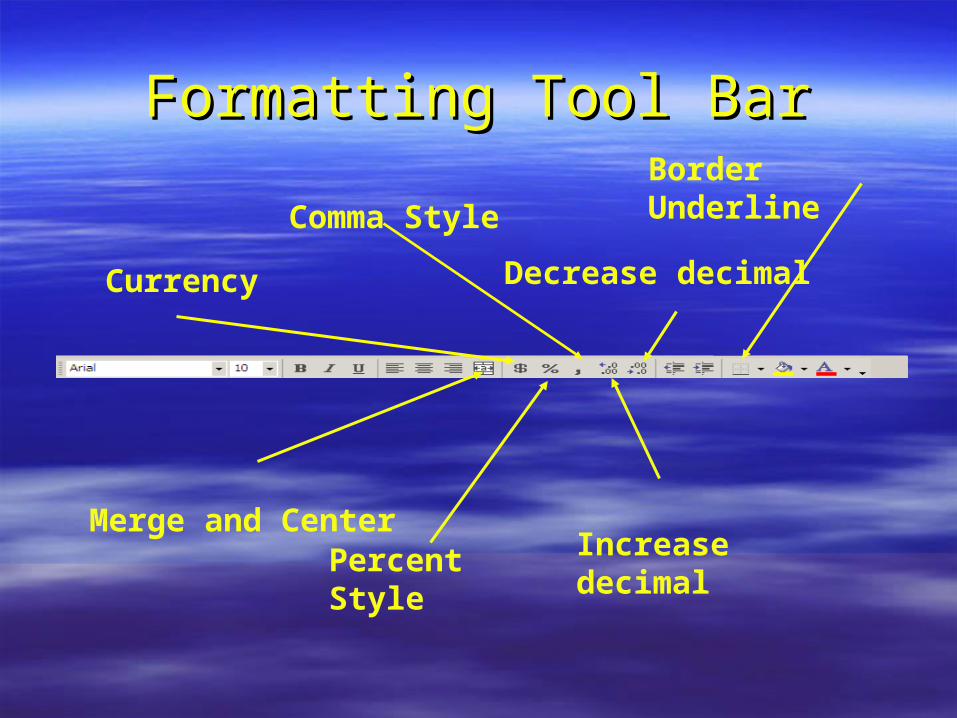
Formatting Tool BarFormatting Tool Bar
Increase decimal
Currency
Merge and Center
Decrease decimal
Comma Style
Percent Style
Border Underline
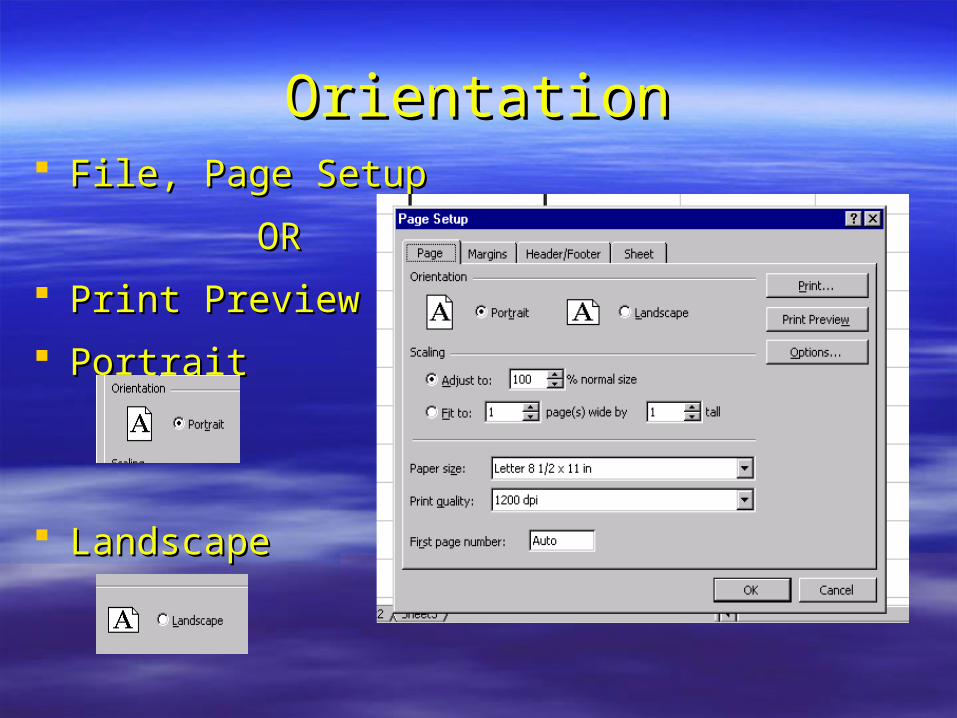
OrientationOrientation File, Page SetupFile, Page Setup
OROR
Print PreviewPrint Preview
PortraitPortrait
LandscapeLandscape
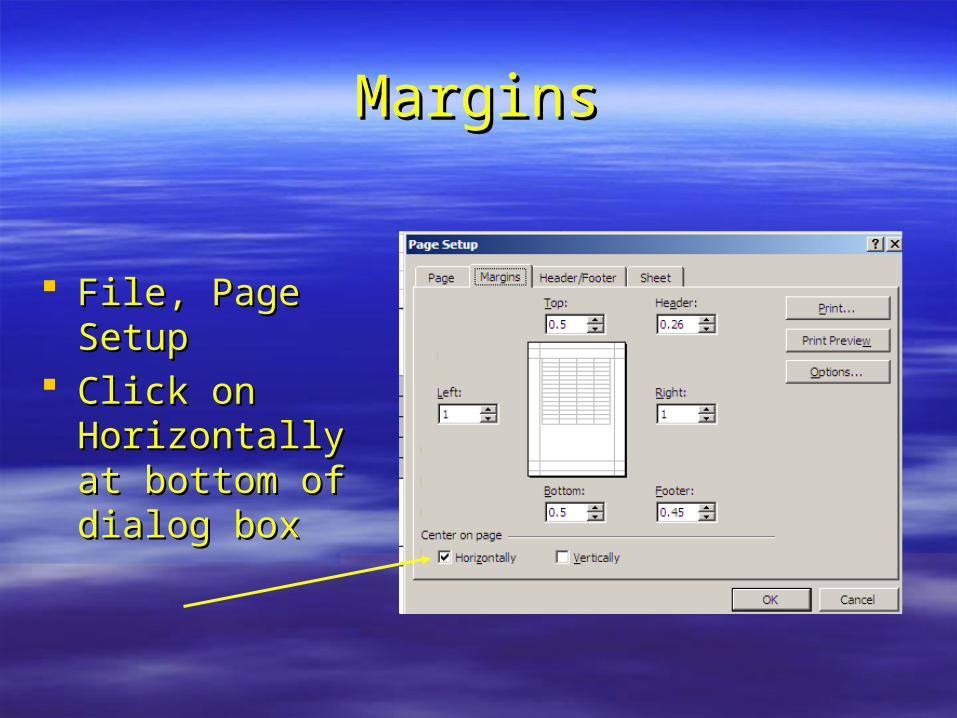
MarginsMargins
File, Page SetupFile, Page Setup Click on Click on
Horizontally at Horizontally at bottom of bottom of dialog boxdialog box
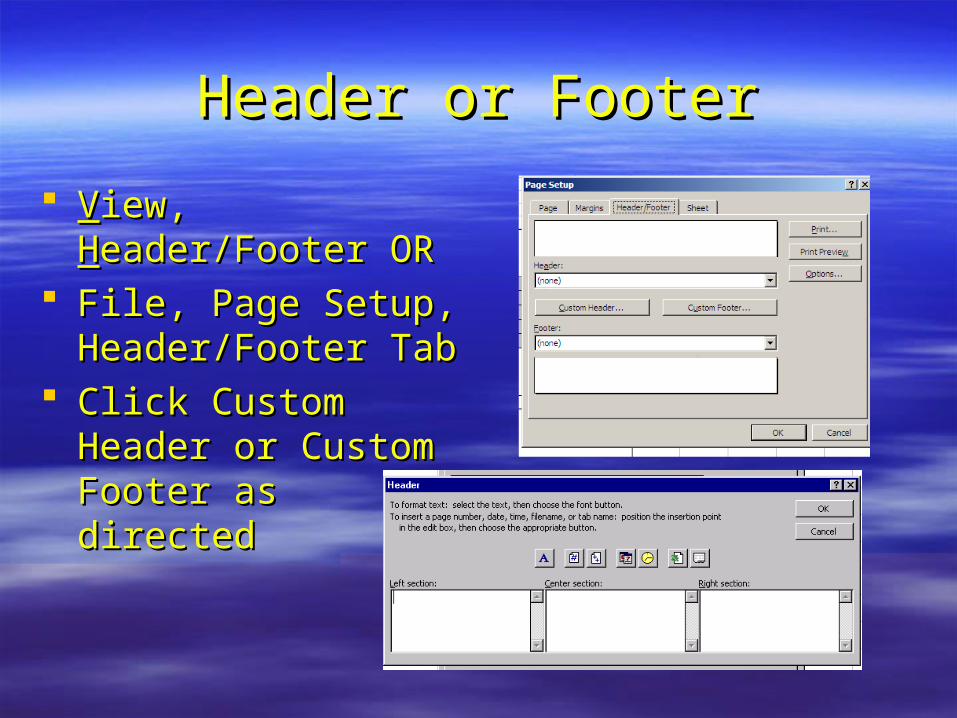
Header or FooterHeader or Footer
VView, iew, HHeader/Footer eader/Footer OROR
File, Page Setup, File, Page Setup, Header/Footer TabHeader/Footer Tab
Click Custom Click Custom Header or Custom Header or Custom Footer as directedFooter as directed
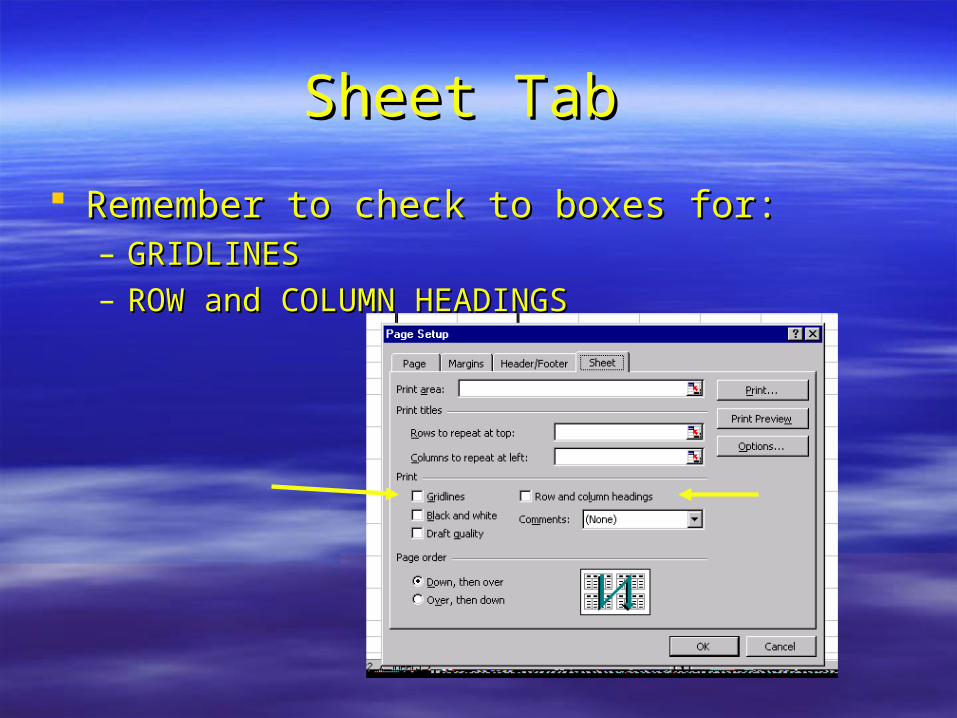
Sheet TabSheet Tab
Remember to check to boxes for:Remember to check to boxes for:– GRIDLINESGRIDLINES– ROW and COLUMN HEADINGSROW and COLUMN HEADINGS
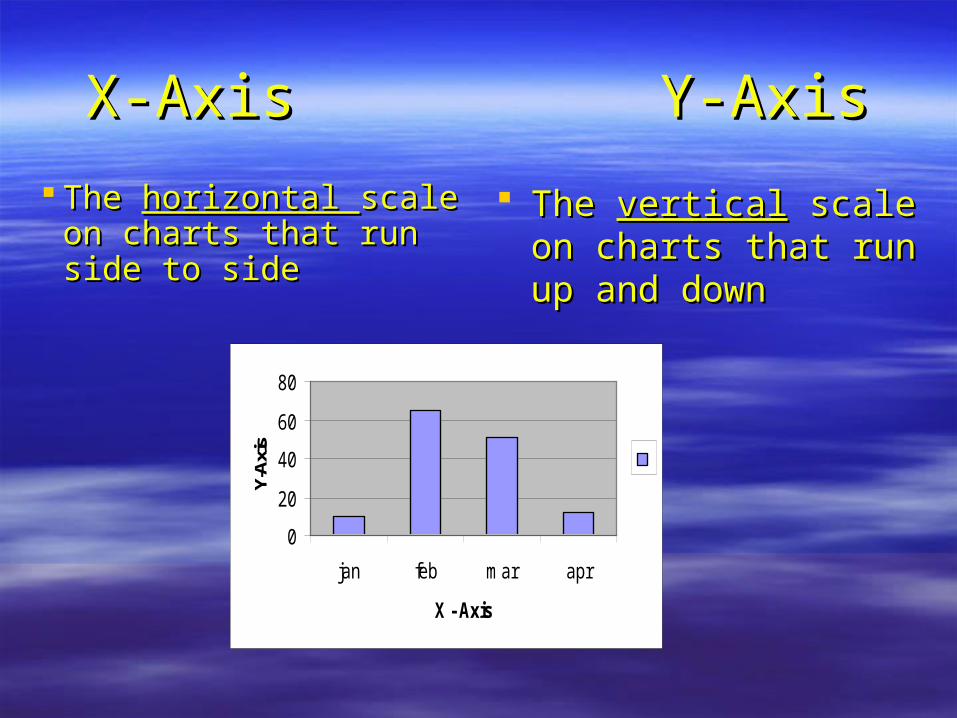
X-AxisX-Axis Y-AxisY-Axis
The The horizontal horizontal scale scale on charts that run on charts that run side to sideside to side
The The verticalvertical scale scale on charts that run on charts that run up and downup and down
0
20
40
60
80
jan feb mar apr
X - Axis
Y-A
xis
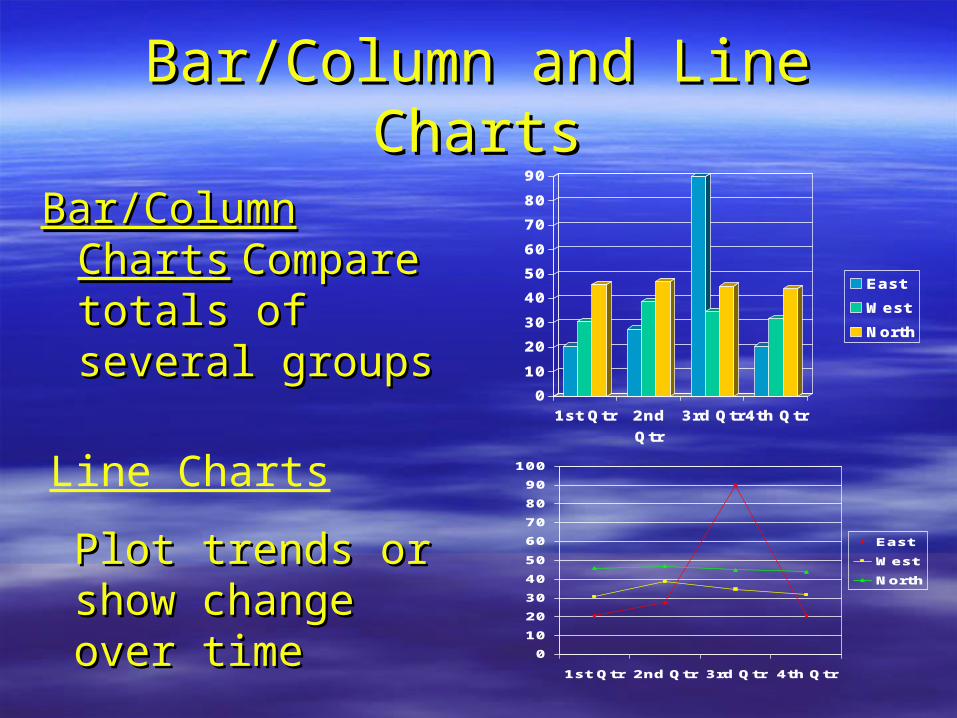
Bar/Column and Line ChartsBar/Column and Line Charts
Bar/Column ChartsBar/Column Charts Compare totals of Compare totals of several groupsseveral groups
0
10
20
30
40
50
60
70
80
90
1st Qtr 2nd
Qtr
3rd Qtr4th Qtr
East
West
North
0
10
20
30
40
50
60
70
80
90
100
1st Qtr 2nd Qtr 3rd Qtr 4th Qtr
East
West
North
Line Charts
Plot trends or Plot trends or show change show change over timeover time
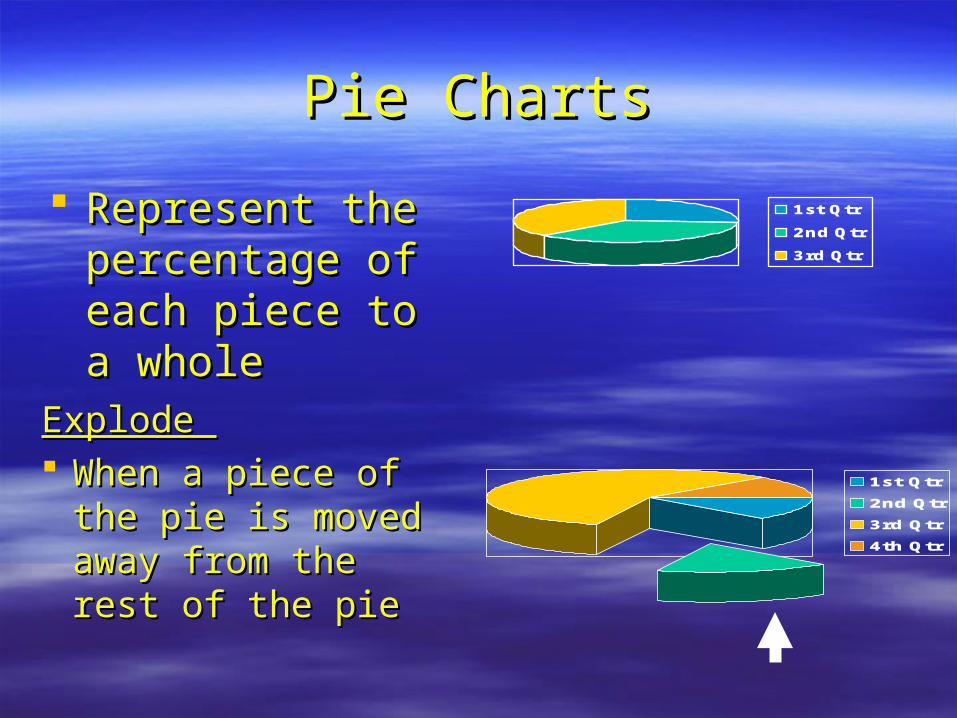
Pie ChartsPie Charts
Explode Explode When a piece of When a piece of
the pie is moved the pie is moved away from the away from the rest of the pierest of the pie
1st Qtr
2nd Qtr
3rd Qtr
1st Qtr
2nd Qtr
3rd Qtr
4th Qtr
Represent the Represent the percentage of percentage of each piece to a each piece to a wholewhole
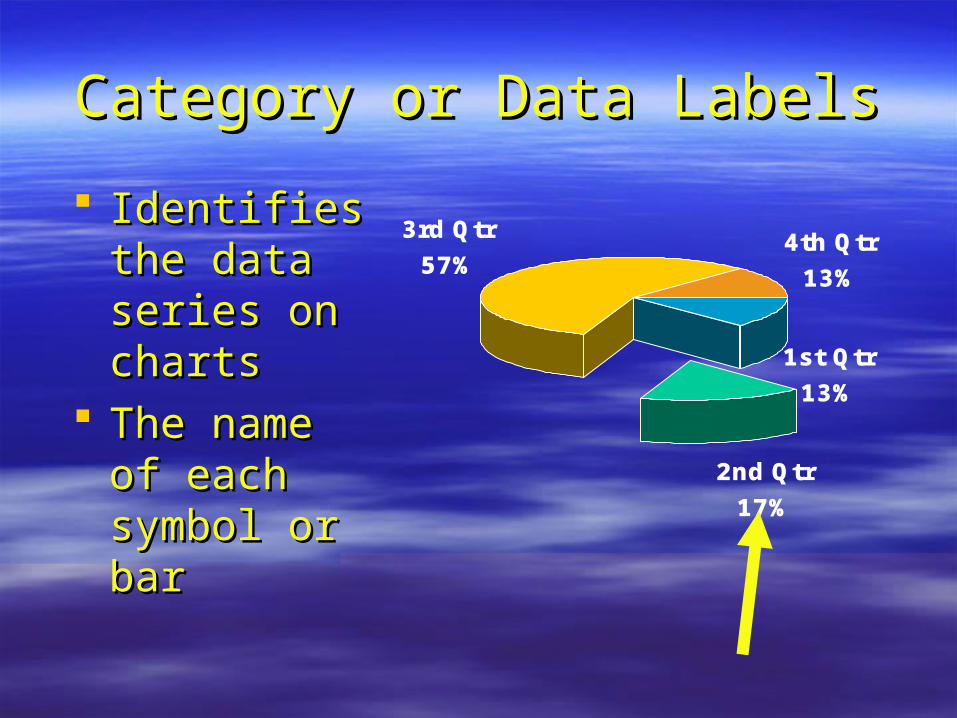
Category or Data LabelsCategory or Data Labels
Identifies Identifies the data the data series on series on chartscharts
The name The name of each of each symbol or symbol or barbar
1st Qtr
13%
2nd Qtr
17%
3rd Qtr
57%4th Qtr
13%
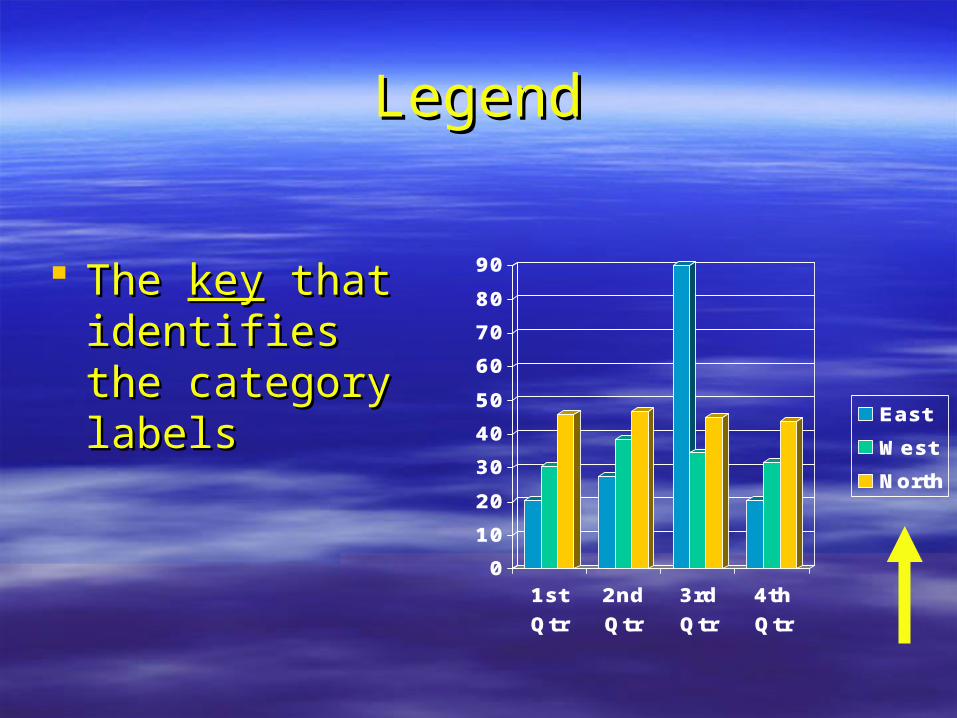
LegendLegend
The The keykey that that identifies the identifies the category labelscategory labels
0
10
20
30
40
50
60
70
80
90
1st
Qtr
2nd
Qtr
3rd
Qtr
4th
Qtr
East
West
North
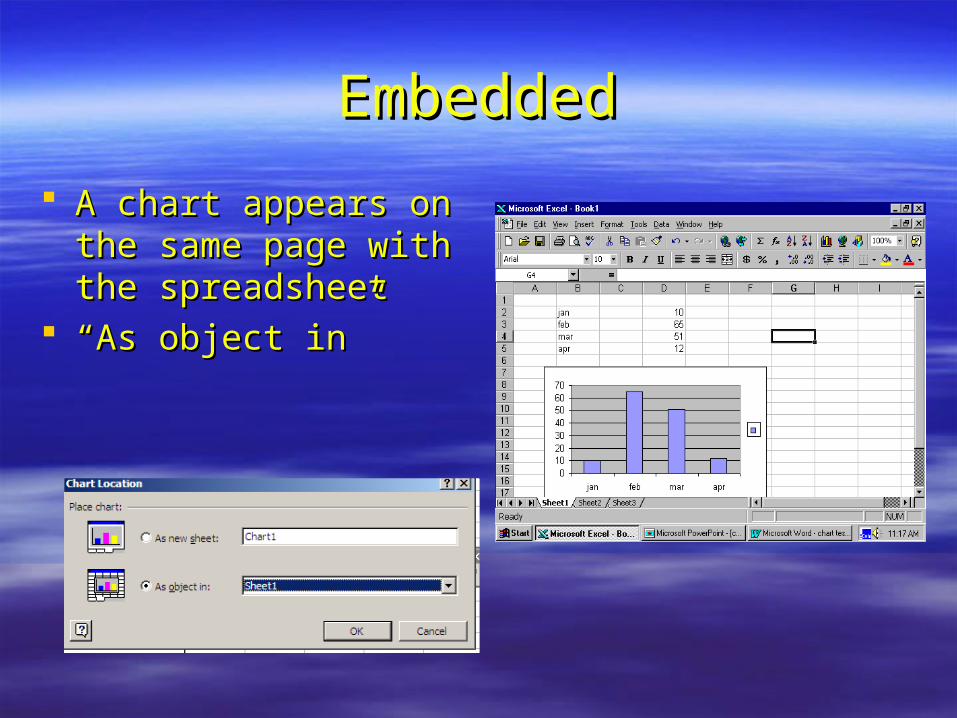
EmbeddedEmbedded
A chart appears on A chart appears on the same page with the same page with the spreadsheetthe spreadsheet
““As object in”As object in”
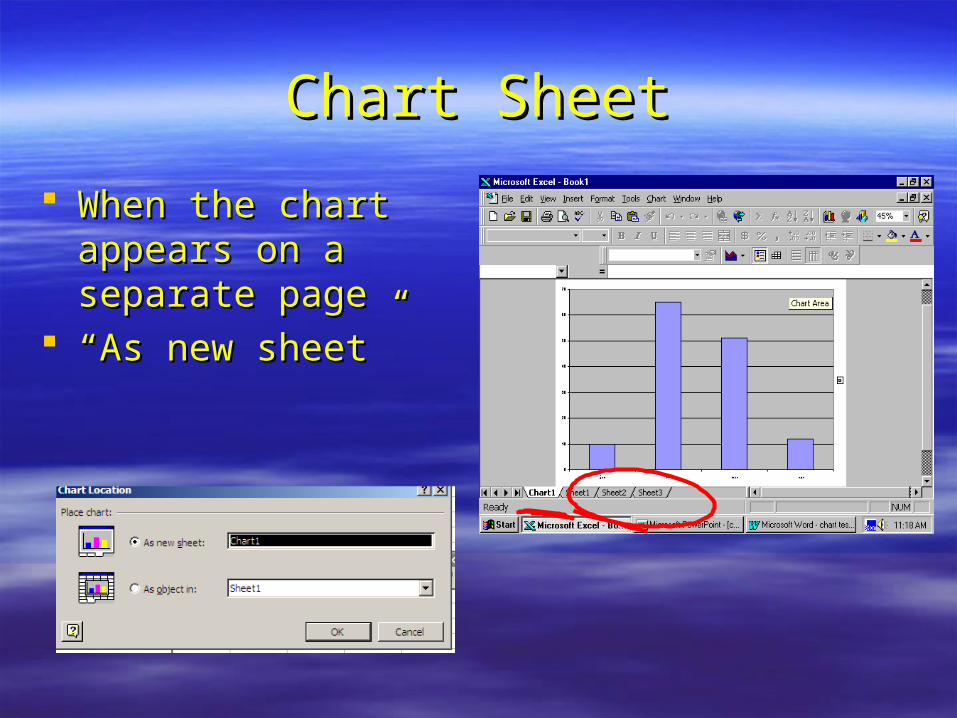
Chart SheetChart Sheet
When the chart When the chart appears on a appears on a separate pageseparate page
““As new sheet”As new sheet”