spread trading - singapore management university: … · 6 of 63 february 6, 2017 qf206 week 6...
TRANSCRIPT

1 of 63 February 6, 2017
QF206 Week 6
Spread Trading
Bread & Butter of Prop Traders
© Christopher Ting

2 of 63 February 6, 2017
QF206 Week 6
© Christopher Ting
Ex-SIMEX Locals
© Christopher Ting
Source: AFACT
Association of Financial and Commodity Traders

3 of 63 February 6, 2017
QF206 Week 6
Revenge of the Geeks
© Christopher Ting
During the open-outcry era, locals who were less “vocal” couldn’t match the big-time order-fillers.
But when the floor gave way to screen-based trading, locals who adapted to the new landscape of computer and automated trading survived and thrived.

4 of 63 February 6, 2017
QF206 Week 6
© Christopher Ting
Trading Arcade
© Christopher Ting

5 of 63 February 6, 2017
QF206 Week 6
Calendar Spread
© Christopher Ting
This is the simplest form of trading strategy and very easy to implement.
Roll
When the current near month futures contract is about to expire and to be replaced by the far month contract, i.e., the far month is going to become near month.
CTA (Commodity Trading Advisor) and other investors need to roll over their futures positions.
6 of 63 February 6, 2017
QF206 Week 6
Calendar Spread Conventions
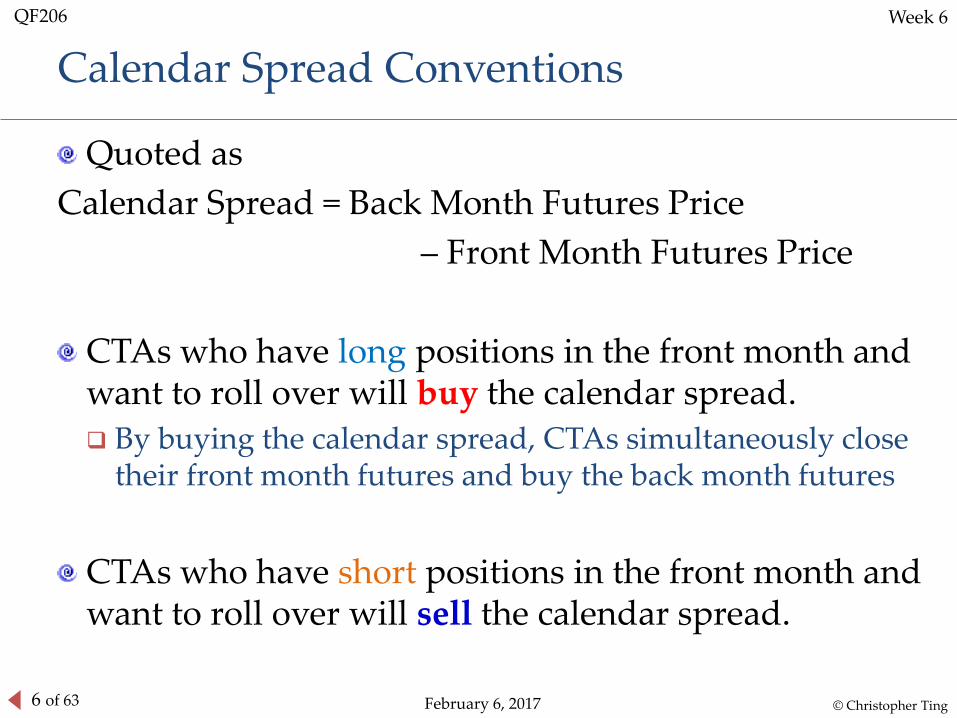
Quoted as
Calendar Spread = Back Month Futures Price
– Front Month Futures Price
CTAs who have long positions in the front month and want to roll over will buy the calendar spread.
By buying the calendar spread, CTAs simultaneously close their front month futures and buy the back month futures
CTAs who have short positions in the front month and want to roll over will sell the calendar spread.
© Christopher Ting

7 of 63 February 6, 2017
QF206 Week 6
What’s the Fair Price of a Calendar Spread?
© Christopher Ting
The fair price of a calendar spread is simply the difference of the fair prices of front month and back month contracts:
Fair Calendar Spread = Back Month Fair Price – Front Month Fair Price

8 of 63 February 6, 2017
QF206 Week 6
Market Neutral
© Christopher Ting
Calendar spread is inherently a long-short strategy.
Suppose the fair calendar spread is -1
Suppose the back month is traded at 330 index points and front month at 331 index points.
The market price of the spread is -1 index point
The market calendar spread is traded at the same value as the fair calendar spread,
If market rallies, the back month moves up by x points, the front month should also move up by x points.
The spread is still the same
330 + x – (331 + x) = 330 – 331 + x – x = -1

9 of 63 February 6, 2017
QF206 Week 6
© Christopher Ting
Outright Calendar SpreadCQG
© Christopher Ting
Exchange has created the calendar spread to facilitate CTAs to roll over their positions.
In this example of SIMSCI calendar spread, the fair spread is –0.2.
© Christopher Ting

10 of 63 February 6, 2017
QF206 Week 6
© Christopher Ting
CQG’s Auto-Spreader
Outright and synthetic calendar spreads
Set the auto-spread buying and selling according to the outright spread
© Christopher Ting

11 of 63 February 6, 2017
QF206 Week 6
© Christopher Ting
In this example of SIMSCI calendar spread, the fair spread is –0.8.
Why is the market outright spread different from the fair spread?
© Christopher Ting
Outright Calendar SpreadTT

12 of 63 February 6, 2017
QF206 Week 6
Calendar Spread
© Christopher Ting
Outright Spread Synthetic Spread Quoting Leg Hedging Leg
Jan 12, 2016
13 of 63 February 6, 2017
QF206 Week 6
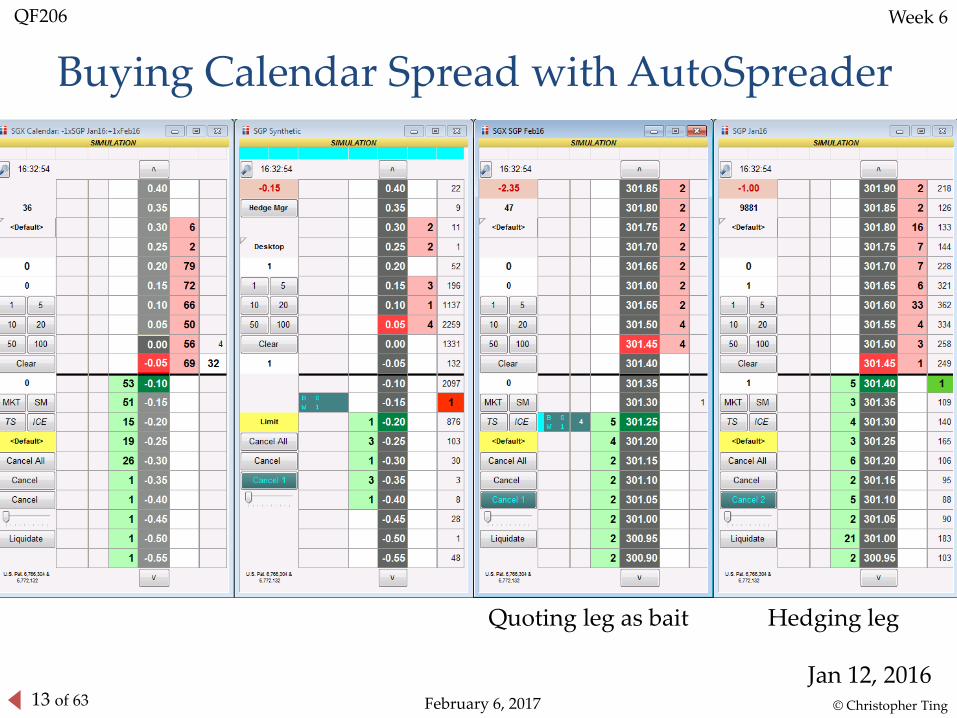
Buying Calendar Spread with AutoSpreader
© Christopher Ting
Quoting leg as bait Hedging leg
Jan 12, 2016

14 of 63 February 6, 2017
QF206 Week 6
Selling Calendar Spread with AutoSpreader
© Christopher Ting
Quoting leg as bait Hedging leg
Jan 12, 2016
4

15 of 63 February 6, 2017
QF206 Week 6
Buying and Selling Synthetically
© Christopher Ting
Quoting leg as bait Hedging leg
Jan 12, 2016

16 of 63 February 6, 2017
QF206 Week 6
Calendar Spread is Market Neutral
© Christopher Ting
Jan 16 and Feb 16 prices have come down a lot, but the calendar spread does not change much. Jan 26, 2016

17 of 63 February 6, 2017
QF206 Week 6
Sold and Bought a Calendar Spread
© Christopher Ting
Sold SGP Synthetic @ -0.25 Sold Feb 16 @ 287.00
bought Jan 16 @ 287.25
Bought SGP Synthetic @ -0.30 Bought Feb 16 @ 286.85
Sold Jan 16 @ 287.15
Earned 0.05 index point, which is one tick, i.e., $5
Need 4 trades to complete the round trip
Order Date Order Time Exch TimeWorkstation
TimeOrder GW Product Contract
Order Type B/S P/F Price Qty
1 26-Jan-16 12:16:52:756 12:17:57:534 12:17:57:536 SGX-C SGP 16-Feb Limit S F 287.00 1
2 26-Jan-16 12:17:57:534 12:17:57:591 12:17:57:592 SGX-C SGP 16-Jan Limit B F 287.25 1
3 26-Jan-16 12:17:57:592 12:17:57:000 12:17:57:000 Desktop Autospreader SGP Synthetic S F -0.25 1
4 26-Jan-16 13:09:51:235 13:09:52:449 13:09:52:449 SGX-C SGP 16-Feb Limit B F 286.85 1
5 26-Jan-16 13:09:52:449 13:09:52:502 13:09:52:503 SGX-C SGP 16-Jan Limit S F 287.15 1
6 26-Jan-16 13:09:52:503 13:09:52:000 13:09:52:000 Desktop Autospreader SGP Synthetic B F -0.30 1

18 of 63 February 6, 2017
QF206 Week 6
Outright versus Synthetic
© Christopher Ting
Whether using outright or synthetic, each position involves two trades.
You can use the outright to close the calendar position opened by synthetic.
Short a calendar spread synthetically Sold SGP Feb16 @ 292.90
Bought SGP Jan16 @ 292.95
Long a calendar spread outright at T+1 session Sold SGP Jan16 @ 291.00
Bought SGP Feb16 @ 290.85

19 of 63 February 6, 2017
QF206 Week 6
P&L of a Round-Trip Calendar Spread
© Christopher Ting
SGP Jan16 lost 39 ticks
291.00 – 292.95 = —1.95 index points
SGP Feb16 gained 41 ticks.
292.90 – 290.85 = 2.05 index points
The net gain is 0.10 index points, which is S$10.
Is the net position 1 contract oustanding?

20 of 63 February 6, 2017
QF206 Week 6
Quiz: What Happened?
© Christopher Ting
Quoting leg as bait Jan 26, 2016

21 of 63 February 6, 2017
QF206 Week 6
Quoting and Hedging on Both Legs to Buy!
© Christopher Ting
Jan 26, 2016

22 of 63 February 6, 2017
QF206 Week 6
Quoting and Hedging on Both Legs to Sell!
© Christopher Ting
Jan 26, 2016

23 of 63 February 6, 2017
QF206 Week 6
Quoting and Hedging on Both Legs to Trade
© Christopher Ting
Jan 26, 2016

24 of 63 February 6, 2017
QF206 Week 6
Quiz: What Happened?
© Christopher Ting

25 of 63 February 6, 2017
QF206 Week 6
Using the Outright Calendar Spread to Square Off Your Position
© Christopher Ting

26 of 63 February 6, 2017
QF206 Week 6
Mis-Hedges
© Christopher Ting

27 of 63 February 6, 2017
QF206 Week 6
Wait or Don’t Wait?
© Christopher Ting

28 of 63 February 6, 2017
QF206 Week 6
What are the risks of calendar spread?
© Christopher Ting
Mis-hedge!
When a synthetic spread order is legged, a mis-hedge occurs and the spreader becomes a direction speculator at the wrong starting line.
Basis risk: the spread price can change
Position size needs to be large, hence greater exposure.

29 of 63 February 6, 2017
QF206 Week 6
Summary of Spread Trading
© Christopher Ting
Quoting orders as “baits”
Limit orders placed on the less liquid leg
Hedge orders
When the quoting orders are hit, hedge orders are triggered and enter the more liquid futures market
If the quoting orders are sell (buy), hedge orders are buy (sell).
Hedge orders are limit orders.
How do you do spread trading, buy and sell contracts on different markets simultaneously?
Answer: HFT!

30 of 63 February 6, 2017
QF206 Week 6
Not one-to-one Spread Trading
For Advanced Prop Traders
© Christopher Ting

31 of 63 February 6, 2017
QF206 Week 6
Nikkei 225 Index Futures
© Christopher Ting
Big Nikkei at Osaka tick size: 10 points, multiplier ¥1,000
Mini Nikkei at Osaka tick size: 5 points, multiplier ¥100
Regular Nikkei at SGX tick size: 5 points, multiplier ¥500
Regular Nikkei NIY at CME tick size: 5 points, multiplier ¥500
Regular Nikkei NKD at CME tick size: 5 points, multiplier $5
Mutualoffset
32 of 63 February 6, 2017
QF206 Week 6
Calendar Spread for Nikkei Futures
© Christopher Ting
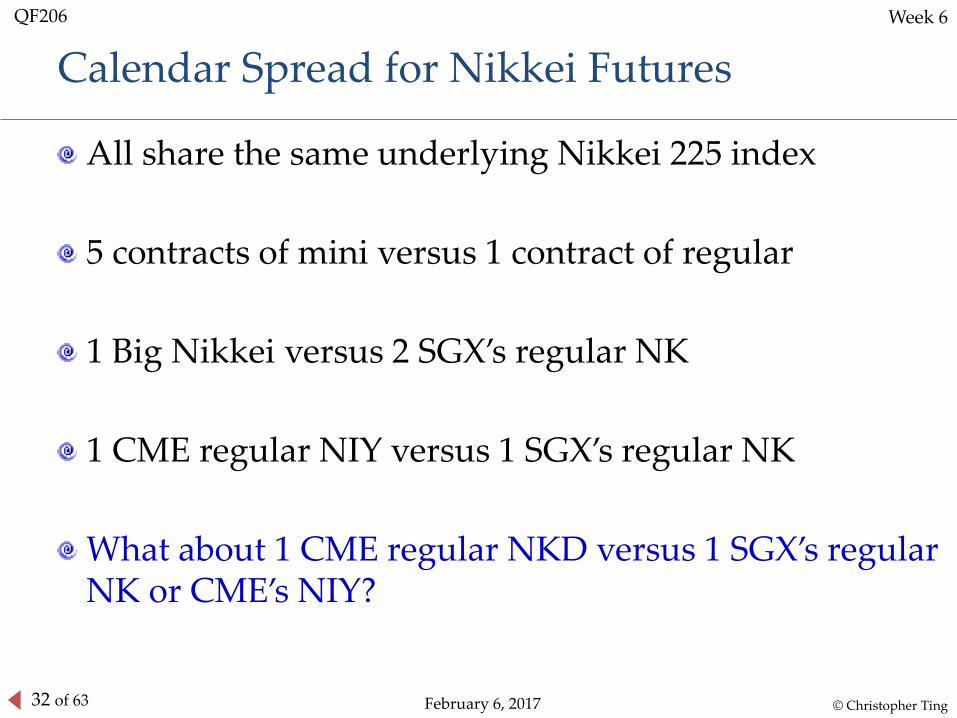
All share the same underlying Nikkei 225 index
5 contracts of mini versus 1 contract of regular
1 Big Nikkei versus 2 SGX’s regular NK
1 CME regular NIY versus 1 SGX’s regular NK
What about 1 CME regular NKD versus 1 SGX’s regular NK or CME’s NIY?

33 of 63 February 6, 2017
QF206 Week 6
Synthetic Cross-Market Spreads
© Christopher Ting
Nikkei futures versus Topix futures
Taiex futures versus MSCI Taiwan futures
Dax futures versus STOXX 50 futures
What is the ratio of one futures versus the other?
Concept
Notional value = index points × price multiplier
Example
SGX’s Nikkei 225 futures
14,600 × ¥500 = ¥7,300,000
Eurex’s DAX futures
9,300 × €25 = €232,500

34 of 63 February 6, 2017
QF206 Week 6
Cross-Market Spread Ratio
© Christopher Ting
Dax futures versus STOXX 50 futures as an example.
The multiplier of STOXX 50 futures is €10.
The underlying indexes are different but highly correlated!
Synthetic spread trading strategy can be constructed.
The key lies in: What’s the ratio R of Dax to STOXX 50?
Run the regression:
Dt = a + b St + et
Here, Dt is the notional amount of Dax futures and St is the notional amount of STOXX 50 futures.
The coefficient estimate b is the required ratio R.

35 of 63 February 6, 2017
QF206 Week 6
Specific Numbers
© Christopher Ting
Using the nearest to maturity active contracts of these two futures from June 23, 1998 to February 7, 2014, based on daily last prices, the linear regression result is
Dt = 24.7 + 3.7 St
So the ratio is 1 Dax futures contract to 3.7 STOXX 50 futures contracts.
In practice, we use 2 Dax futures contract to 7 STOXX 50 contracts as the ratio.

36 of 63 February 6, 2017
QF206 Week 6
Price Differential
© Christopher Ting
In calendar spread, we use only the price differential:
LegA.Price - LegB.Price
This differential is called the implied price, which was the calendar spread.
More generally,
LegA.Price * User-Defined Multiplier A
– Leg B Price * User-Defined Multiplier B
The user-defined multiplier takes into account the contract unit (price multiplier).

37 of 63 February 6, 2017
QF206 Week 6
Example
© Christopher Ting
In the earlier example of Dax versus STOXX 50,
Dt = 3.7 St + a constant
So the price differential dt is
dt =Dt —3.7 × St
Leg A’s price is the Dax futures price Dt
Leg A’s multiplier is 1
Leg B’s price is the STOXX 50 price St
Leg B’s multiplier is 3.7
If the change in price differential is much bigger than 24.7, sell the spread, which is 2 Dax futures contracts to 7 STOXX 50 contracts.

38 of 63 February 6, 2017
QF206 Week 6
Summary by Quiz Questions
© Christopher Ting
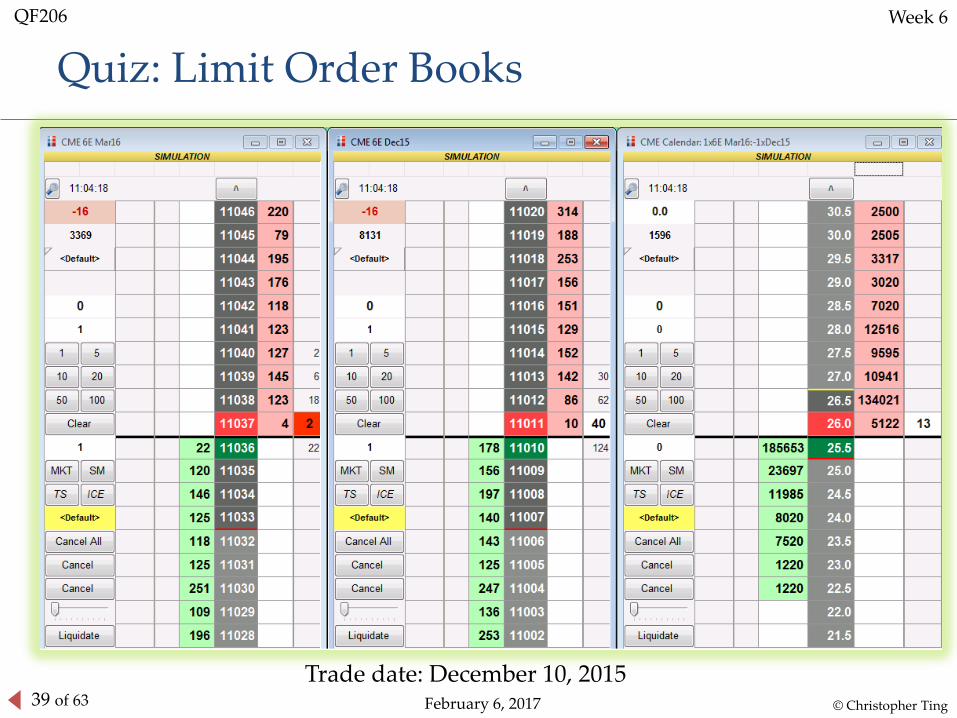
The limit-order books of EUR/USD futures 6E in the next slide are a snapshot on December 10, 2015.
Considering the liquidity, which leg or futures product should you put out as bait?
Suppose you have constructed a synthetic calendar spread.
what should be the buying price of the calendar spread?
What should be the selling price of the calendar spread?
39 of 63 February 6, 2017
QF206 Week 6
Quiz: Limit Order Books
© Christopher Ting
Trade date: December 10, 2015
40 of 63 February 6, 2017
QF206 Week 6
A Tale of Two Futures:$ versus ¥ Nikkei 225 Index Futures
Quanto Spread
© Christopher Ting

41 of 63 February 6, 2017
QF206 Week 6
Learning Objectives
Define quanto
Understand inter-market spread trading strategy
Analyze the P&L of a short quanto position
© Christopher Ting

42 of 63 February 6, 2017
QF206 Week 6
Quanto
Quantos are derivatives where the payoff is defined using variables measured in one currency but paid in another currency.
Example:
Futures contract providing a payoff of NT – F dollars(USD) rather than yens (JPY) to the buyer of NKD.
Here, NT is the Nikkei 225 index value at maturity T and F is the futures price that the buyer has entered.
© Christopher Ting

43 of 63 February 6, 2017
QF206 Week 6
Nikkei 225 Futures in USD and JPY
Contract Multiplier USD 5 for NKD; JPY 500 for NIY
Minimum Price Change (Tick) 5 index points
Final Settlement: Cash-settled to Special Opening Quotation of the Nikkei 225 Index on 2nd Friday of the contract expiry month
Last Trading Day 3:15 p.m. Central Time on the day preceding final settlement – usually the Thursday prior to 2nd Friday of the contract expiry month
Contract Months: Quarterlies for NKD; Quarterlies and Serials for NIY
© Christopher Ting

44 of 63 February 6, 2017
QF206 Week 6
Trading Hours
At 3:30 p.m. Singapore Time, T+1 session for Nikkei index futures opens
Simex: (multiplier ¥500, tick size 5 index points)
Osaka:
Big (multiplier ¥1,000, tick size 10 index points)
Mini (multiplier ¥100, tick size 5 index points)
Before 2011
At 4 p.m. Singapore Time, NKD futures market opens
At 7 p.m. Singapore Time, NIY futures market opens
Now
NKD and NIY trade almost around the clock
© Christopher Ting

45 of 63 February 6, 2017
QF206 Week 6
CME’s NKD, NIY, and SGX’s NK
© Christopher Ting
NKD Mar16
Bid Size Price Ask Size
18970 13
18965 7
18960 15
18955 7
18950 16
18945 12
18940 22
18935 10
18930 10
18925 2
35 -35 70
1 18920
7 18915
11 18910
7 18905
9 18900
9 18895
15 18890
7 18885
15 18880
6 18875
NIY Mar16
Bid Size Price Ask Size
18935 9
18930 17
18925 10
18920 19
18915 10
18910 11
18905 14
18900 10
18895 9
18890 8
80 26 54
5 18880
11 18875
14 18870
26 18865
24 18860
19 18855
19 18850
28 18845
17 18840
11 18835
NK Mar16
Bid Size Price Ask Size
18935.00 15
18930.00 14
18925.00 8
18920.00 12
18915.00 12
18910.00 35
18905.00 16
18900.00 16
18895.00 28
18890.00 11
102 -5 107
10 18880.00
32 18875.00
12 18870.00
29 18865.00
19 18860.00
16 18855.00
13 18850.00
23 18845.00
10 18840.00
7 18835.00
46 of 63 February 6, 2017
QF206 Week 6
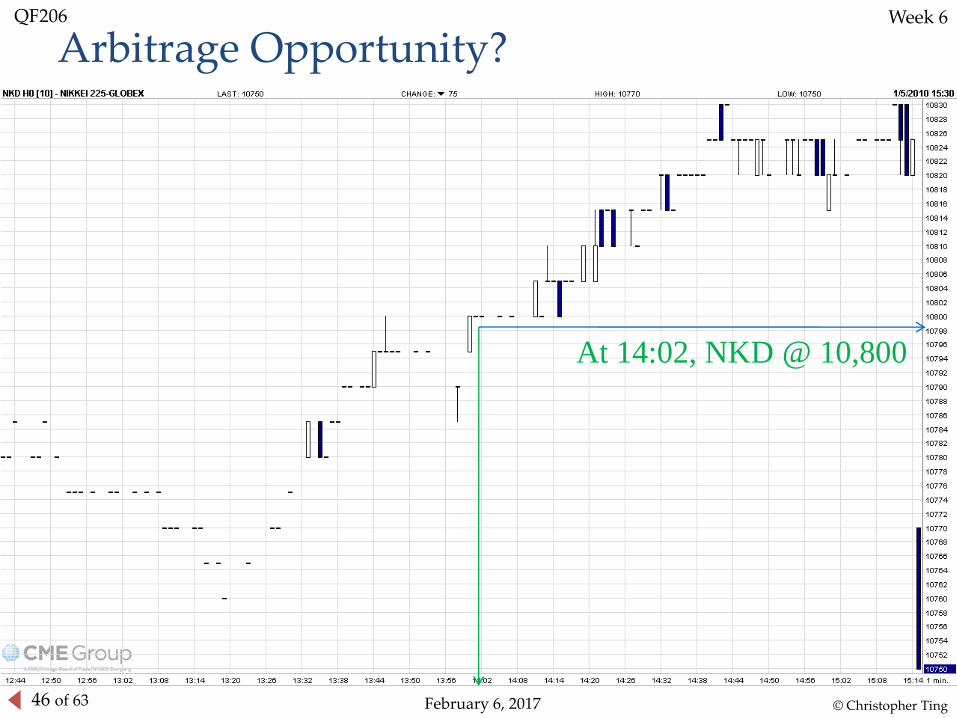
Arbitrage Opportunity?
At 14:02, NKD @ 10,800
© Christopher Ting

47 of 63 February 6, 2017
QF206 Week 6
Arbitrage Opportunity?
At 14:02, NIY @ 10,735
© Christopher Ting
48 of 63 February 6, 2017
QF206 Week 6
Motivating Questions
© Christopher Ting
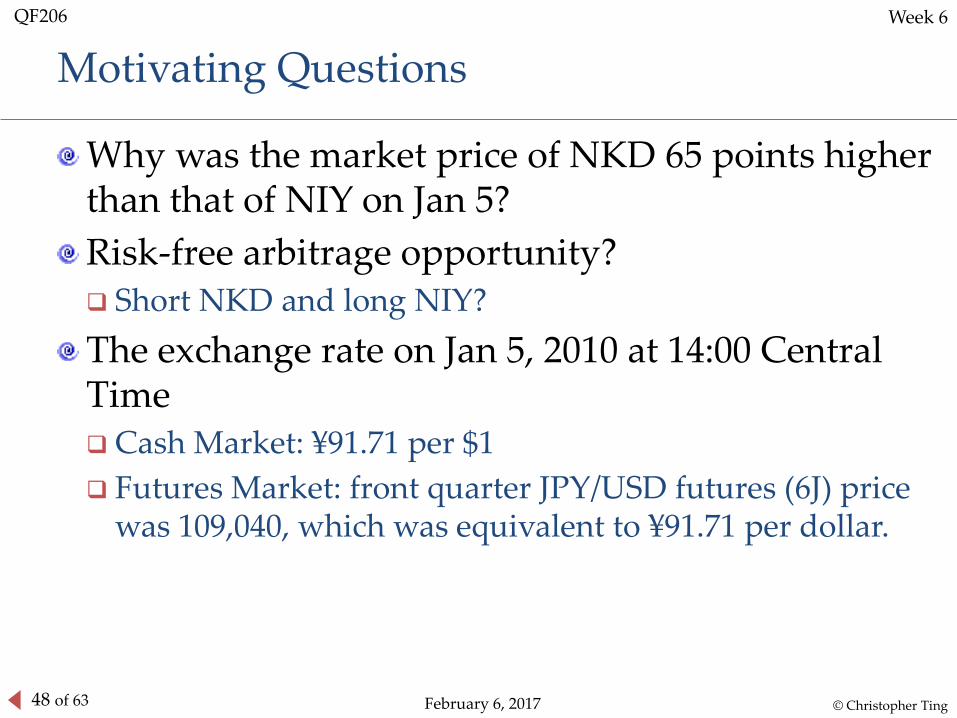
Why was the market price of NKD 65 points higher than that of NIY on Jan 5?
Risk-free arbitrage opportunity? Short NKD and long NIY?
The exchange rate on Jan 5, 2010 at 14:00 Central Time Cash Market: ¥91.71 per $1
Futures Market: front quarter JPY/USD futures (6J) price was 109,040, which was equivalent to ¥91.71 per dollar.
49 of 63 February 6, 2017
QF206 Week 6
Follow-up Question
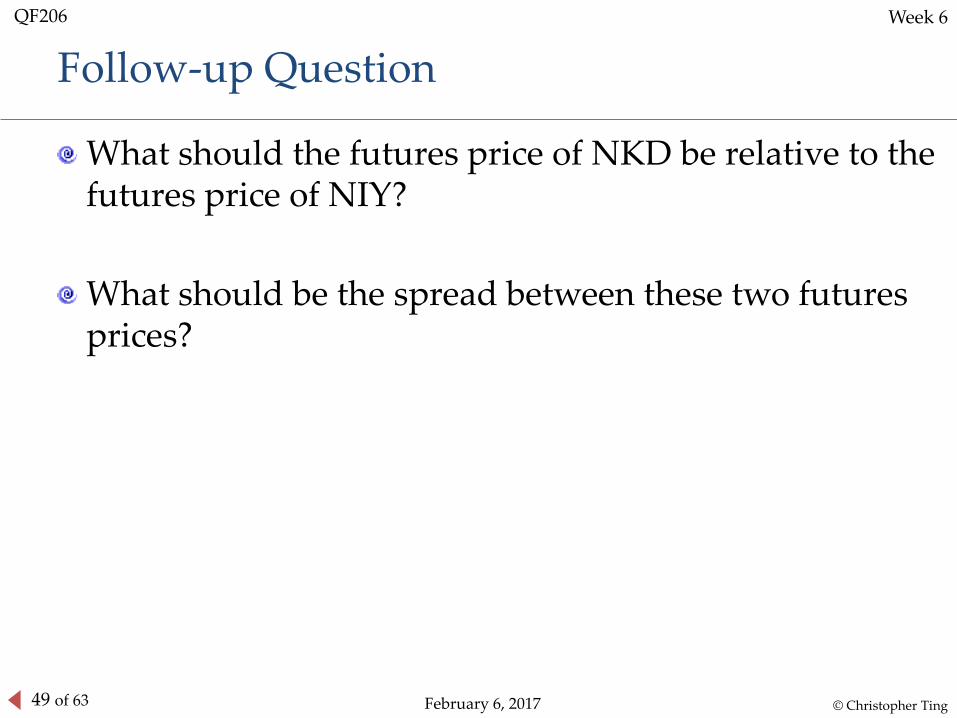
What should the futures price of NKD be relative to the futures price of NIY?
What should be the spread between these two futures prices?
© Christopher Ting

50 of 63 February 6, 2017
QF206 Week 6
NKD – NIY Spread
At time t=0, let N0 be the cash Nikkei index value, and the NKD and NIY futures prices are, respectively, F$
and F¥ . The time to maturity from time t=0 is T. The fair-value spread is, using stochastic calculus,
It is a product of the cash index level, N0, the time to maturity T, and the covariance C between Nikkei N and the USD-JPY exchange rate S, i.e., how many Japanese yens are needed to buy 1 US dollar.
F$ – F¥ = N0 CT
© Christopher Ting

51 of 63 February 6, 2017
QF206 Week 6
Behavior of the NKD – NIY Spread
© Christopher Ting
When cash market N goes up, dollar tends to strengthen (i.e., S increases), and vice versa.
In other words, when dollar strengthens (i.e., Sincreases), cash market N tends to go up. Why?
Dollar strengthening means Yen depreciating, which will be helpful to export-oriented companies in Nikkei 225 index N, so N tends to go up.
Thus the covariance between the (percentage) change in N and the (percentage) change in S is positive.

52 of 63 February 6, 2017
QF206 Week 6
Illustration
© Christopher Ting
Suppose the covariance is 0.0225, the index level is at 10,680 and the time to maturity is 3 months.
The spread is about 60 index points:
10,680 0.0225 3/12 = 60.1

53 of 63 February 6, 2017
QF206 Week 6
Money-Making Opportunity?
© Christopher Ting
At maturity, T = 0, the NKD – NIY spread is zero. This is the linear time decay effect.
Since the NKD – NIY spread is positive, one can take a short position in this spread (i.e. sell NKD and buy NIY), and hold this spread position until maturity to benefit from the time decay.
Is it a good money-making opportunity?

54 of 63 February 6, 2017
QF206 Week 6
Quanto Spread’s Time Decay (2010 Dec)
© Christopher Ting
55 of 63 February 6, 2017
QF206 Week 6
Profit and Loss
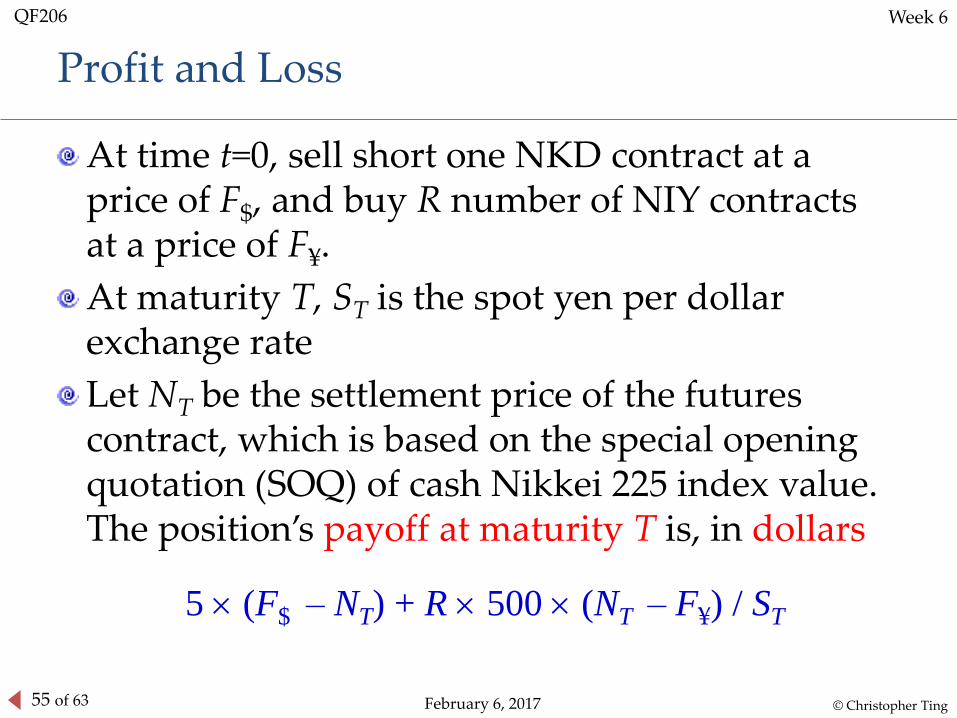
At time t=0, sell short one NKD contract at a price of F$, and buy R number of NIY contracts at a price of F¥.
At maturity T, ST is the spot yen per dollar exchange rate
Let NT be the settlement price of the futures contract, which is based on the special opening quotation (SOQ) of cash Nikkei 225 index value. The position’s payoff at maturity T is, in dollars
5 (F$ – NT) + R 500 (NT – F¥) / ST
© Christopher Ting

56 of 63 February 6, 2017
QF206 Week 6
Profit and Loss (cont’d)
Suppose the (hedge) ratio R is chosen to be
Then the P&L is
which is
100= 0S
R
5 (F$ –NT) + 5 S0 (NT – F¥) / ST
)(515 $0 FFFN
S
ST
T
¥¥
CTNFNS
ST
T
00 515L&P
¥
© Christopher Ting

57 of 63 February 6, 2017
QF206 Week 6
Stock-Market Neutrality if R = S0/100
© Christopher Ting
The paper P&L does not change if forex remains unchanged.
Valuation before maturity
Earlier, F$ is the short form for F$,0 and likewise F¥ for F¥,0.
At time t, for which 0 < t < T, the short position in NKD and the long position in NIY will have a paper P&L (PP&L), in USD:
PP&Lt= 5 (F$,0 – F$,t) + 5 S0 (F¥,t – F¥,0) / St
Under the assumption of S0 = St , it follows that
PP&Lt = 5 (F$,0 – F$,t) + 5 (F¥,t – F¥,0)
If at time u, F$,u = F$,t + x and F¥,u= F¥,t + x, then,
PP&Lu = 5 [(F$,0 –(F$,t+ x)) + (F¥,t + x – F¥,0)]
= 5 [F$,0 – F$,t + F¥,t – F¥,0 ] = PP&Lt

58 of 63 February 6, 2017
QF206 Week 6
What is Covariance?
© Christopher Ting
A measure of how two assets move together.
Recall that when cash market N goes up (down), dollar tends to strengthen (weaken) and S increases (decreases). So we expect C to be positive.
How should C be estimated?
At 3 PM Tokyo time, observe both the cash market index N and the USD-JPY exchange rate S. Do it for many days.
Calculate two time series of daily returns, called r1t and r2t.
Calculate the average values of r1t and r2t, called a1 and a2.
From M pairs of returns, r1t and r2t , the covariance is computed as
221
111
1arar
MC t
M
tt

59 of 63 February 6, 2017
QF206 Week 6
P&L Example: Normal Market
© Christopher Ting
Same parameters as in the illustration, the spread is 60 points. Thus, gain from time decay is $5 60 = $300.
Suppose S0 = 90 yens per dollar.
So the ratio R is short 10 NKD contracts and long 9 NIY contracts.
Suppose ST is 87 yens per dollar, i.e., dollar weakens, and the settlement is 800 points lower, i.e., NT – F¥ = –800 at maturity.
Then 5 (90 – 87)/87 = 15/87, and the P&L per NKD contract is
–$800 15/87 + $300 = $162.07.

60 of 63 February 6, 2017
QF206 Week 6
P&L Example: Market Crashes
© Christopher Ting
Suppose the market crashes, and ST becomes 85 yens per dollar, i.e., dollar weakens substantially, and the settlement is 2,000 points lower, i.e., NT – F¥ = –2,000.
Then 5 (90 – 85)/85 = 25/85, and the P&L at maturity is, for every NKD contract,
–$2,000 25/85 + $300 = –$288.24.
61 of 63 February 6, 2017
QF206 Week 6
P&L Example: Market Rally
© Christopher Ting
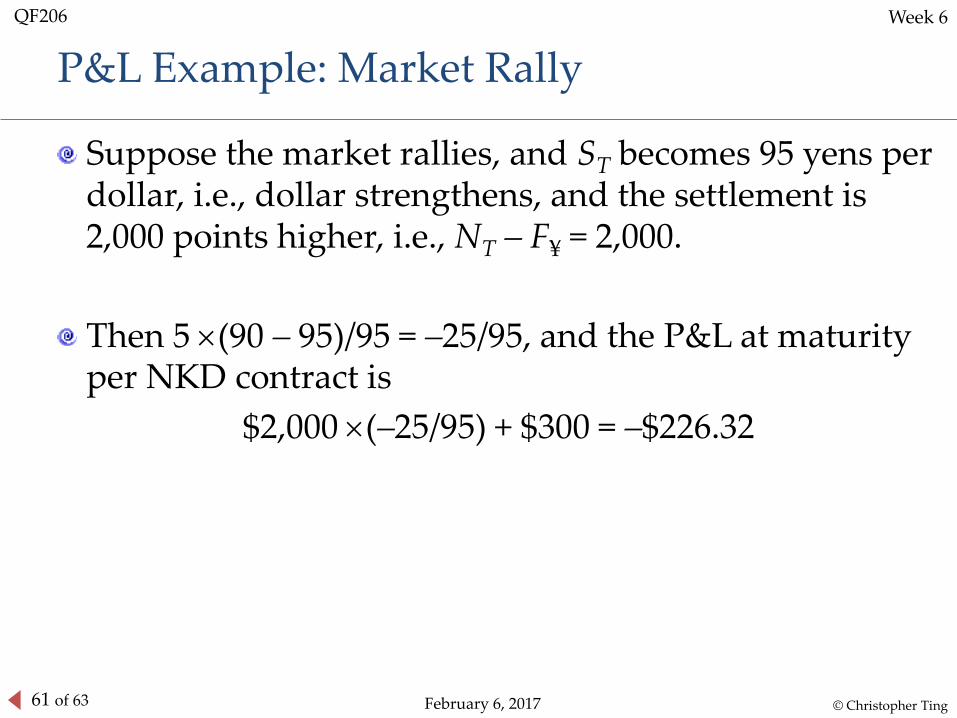
Suppose the market rallies, and ST becomes 95 yens per dollar, i.e., dollar strengthens, and the settlement is 2,000 points higher, i.e., NT – F¥ = 2,000.
Then 5 (90 – 95)/95 = –25/95, and the P&L at maturity per NKD contract is
$2,000 (–25/95) + $300 = –$226.32
62 of 63 February 6, 2017
QF206 Week 6
Bottom Line
© Christopher Ting
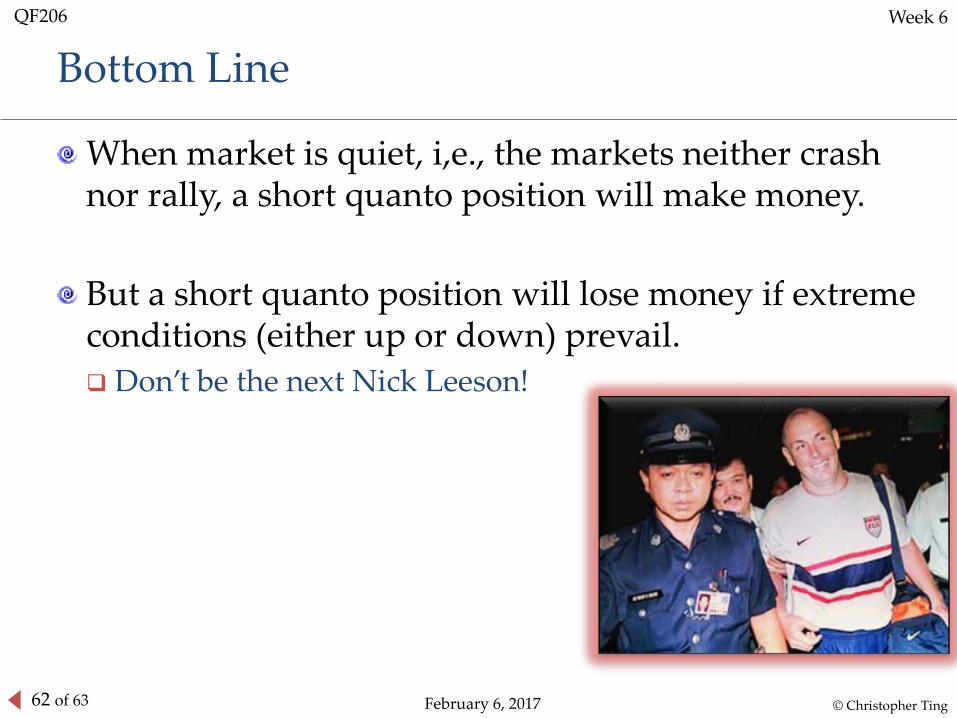
When market is quiet, i,e., the markets neither crash nor rally, a short quanto position will make money.
But a short quanto position will lose money if extreme conditions (either up or down) prevail.
Don’t be the next Nick Leeson!

63 of 63 February 6, 2017
QF206 Week 6
Remarks and Summary
© Christopher Ting
Quanto spread is a volatility trading strategy.
If big moves are expected, then long the quanto spread.
Otherwise, sell the quanto spread
You can also do the intra-day quanto spread. But make sure you have closed your position before the end of the trading session.
In Singapore, it is better to use NK as the fungible substitute of NIY because the latency is lower.