spring 2016 michigan m-step guide to reports€¦ · analysis report will also provide aggregate...
TRANSCRIPT

TM
Spring 2016 Michigan M-STEP Guide to Reports
Updated November 9, 2016

2 2016 M-STEP Guide to Reports
Table of Contents
Table of Contents
Section 1: Introduction . . . . . . . . . . . . . . . . . . . . . . . . . . . . . . 3What’s in this Guide? . . . . . . . . . . . . . . . . . . . . . . . . . . . . . .3
Family Educational Rights and Privacy Act (FERPA) . . . . . .3
Invalid Tests . . . . . . . . . . . . . . . . . . . . . . . . . . . . . . . . . . . . .3
Report Descriptions . . . . . . . . . . . . . . . . . . . . . . . . . . . . . . .4
Section 2: Scoring . . . . . . . . . . . . . . . . . . . . . . . . . . . . . . . . . 5Scoring by Item Type . . . . . . . . . . . . . . . . . . . . . . . . . . . . . .5
Multiple Choice Item Scores . . . . . . . . . . . . . . . . . . . 5
Constructed Response Item Scores . . . . . . . . . . . . . . 5
Technology Enhanced Item Scores . . . . . . . . . . . . . . . 5
Performance Tasks . . . . . . . . . . . . . . . . . . . . . . . . . . 6
Differences between Online and Paper/Pencil Items . . . . . . . . . . . . . . . . . . . . . . . 6
How Scores are Reported . . . . . . . . . . . . . . . . . . . . . . . . . . .7
Scale Scores . . . . . . . . . . . . . . . . . . . . . . . . . . . . . . 7
Assessment Claims . . . . . . . . . . . . . . . . . . . . . . . . . 7
Student Growth Percentiles . . . . . . . . . . . . . . . . . . . . 8
Performance Levels . . . . . . . . . . . . . . . . . . . . . . . . . 8
Section 3: Performance Level Descriptors and Ranges
for Grades 3-8 . . . . . . . . . . . . . . . . . . . . . . . . . . . . . . . . . 9Performance Level (PL) Descriptors . . . . . . . . . . . . . . . . . .9
Section 4: The Dynamic Score Reporting System . . . . . . . . 11The Secure Site . . . . . . . . . . . . . . . . . . . . . . . . . . . . . . . . . 11
Functionality . . . . . . . . . . . . . . . . . . . . . . . . . . . . . . . . . . . 12
Section 5: Reports . . . . . . . . . . . . . . . . . . . . . . . . . . . . . . . . . 14Student Level Data Reports . . . . . . . . . . . . . . . . . . . . . . . 14
Student Record Labels . . . . . . . . . . . . . . . . . . . . . . 14
Individual Student Report . . . . . . . . . . . . . . . . . . . . 15
Parent Report . . . . . . . . . . . . . . . . . . . . . . . . . . . . 17
Student Roster . . . . . . . . . . . . . . . . . . . . . . . . . . . 19
Student Overview . . . . . . . . . . . . . . . . . . . . . . . . . 21
Aggregate Data Reports . . . . . . . . . . . . . . . . . . . . . . . . . . 22
Target Analysis Report . . . . . . . . . . . . . . . . . . . . . . 22
Expectation Analysis . . . . . . . . . . . . . . . . . . . . . . . . 24
Demographic Report . . . . . . . . . . . . . . . . . . . . . . . 25
Comprehensive Report . . . . . . . . . . . . . . . . . . . . . . 27
Student Data File . . . . . . . . . . . . . . . . . . . . . . . . . . 28
Section 6: Additional Resources . . . . . . . . . . . . . . . . . . . . 29Additional Sources of Assessment Results . . . . . . . . . . . . 29
BAA Secure Site Data files . . . . . . . . . . . . . . . . . . . 29
MI School Data . . . . . . . . . . . . . . . . . . . . . . . . . . . 29
General Resources . . . . . . . . . . . . . . . . . . . . . . . . . 29
Section 7: Contact Information . . . . . . . . . . . . . . . . . . . . 30

3
Introd
uctio
n
www .michigan .gov/mstepFOR HELP, call 1-877-560-8378, option 3
Section 1: Introduction
What’s in this Guide?This guide is intended to help educators understand and use the results from the Spring 2016 Michigan Student Test of Educational Progress (M-STEP) . Reports available for the M-STEP include student level and aggregate level data reports .
Student level reports provide individual student level performance data . The Student Record Labels, Individual Student Report, Parent Report, Student Roster, and Student Overview reports all provide data at the individual student level .
Aggregate level reports provide performance data based on groups of students—groups by grade, by school, by district, ISD, and state . The aggregate level reports are the Comprehensive Report, Demographic Report, and Expectation Analysis Report . When available, the Target Analysis Report will also provide aggregate level, assessment target data for ELA and mathematics .
A complete list of available reports is provided on page 4 . Detailed descriptions of each report can be found in Section 5 of this guide .
Also included in this guide are the following sections:
• Section 2 provides information on item types and how scores are reported .
• Section 3 describes performance level categories and ranges .
• Section 4 explains how to access reports .
• Section 5 provides detailed descriptions of each report .
• Section 6 includes additional resources, both for additional information regarding sources of assessment results as well as general information regarding statewide assessments . Users are encouraged to review these additional resources for further information on statewide assessment reporting .
Family Educational Rights and Privacy Act (FERPA)Reports that provide student level data include federally protected student data . It is imperative that report users understand the sensitive and confidential nature of the data presented on M-STEP reports and comply with all Federal Education Rights and Privacy Act (FERPA) regulations: www .ed .gov/policy/gen/guid/fpco/ferpa/index .html .
Invalid TestsStudents who attempted an M-STEP content area test in Spring 2016, but did not receive a valid test score, are reported on the student level reports only . While the test score is not reported, the reason for the invalid test is provided . These students do not count toward accountability, but will negatively impact participation rates . Students who do not receive a valid score are not included on aggregated reports . Tests may be flagged as invalid for the following reasons:
• Student Prohibited Behavior
• Tested in incorrect grade (Out of Level)
• Did not meet “attemptedness” criteria
– The student did not answer enough questions to calculate an overall scale score
• Non-standard accommodation administered
• Other misadministrations
– Student not given correct test – Student not provided appropriate designated support or accommodation
– Paper/Pencil test materials not returned according to schedule – See M-STEP Test Administration Manual for additional examples
Introduction
4 2016 M-STEP Guide to Reports
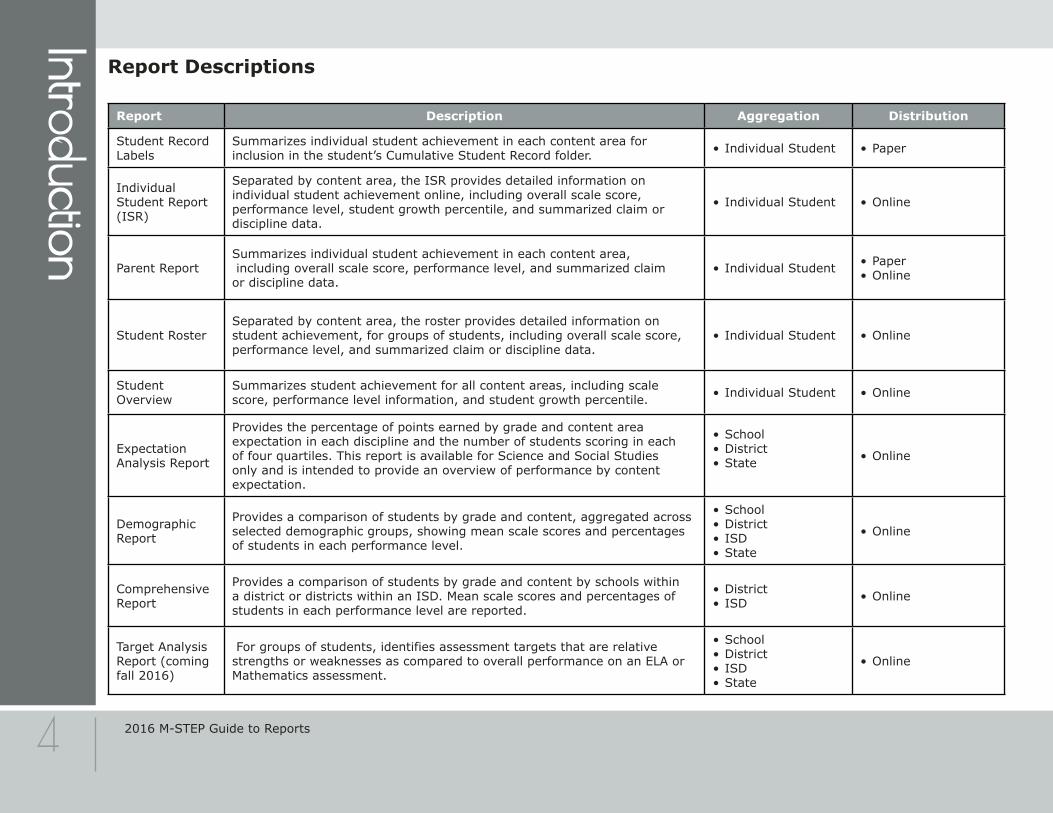
Report Descriptions
Report Description Aggregation Distribution
Student Record Labels
Summarizes individual student achievement in each content area for inclusion in the student’s Cumulative Student Record folder . • Individual Student • Paper
Individual Student Report(ISR)
Separated by content area, the ISR provides detailed information on individual student achievement online, including overall scale score, performance level, student growth percentile, and summarized claim or discipline data .
• Individual Student • Online
Parent ReportSummarizes individual student achievement in each content area, including overall scale score, performance level, and summarized claim or discipline data .
• Individual Student • Paper• Online
Student RosterSeparated by content area, the roster provides detailed information on student achievement, for groups of students, including overall scale score, performance level, and summarized claim or discipline data .
• Individual Student • Online
Student Overview
Summarizes student achievement for all content areas, including scale score, performance level information, and student growth percentile . • Individual Student • Online
Expectation Analysis Report
Provides the percentage of points earned by grade and content area expectation in each discipline and the number of students scoring in each of four quartiles . This report is available for Science and Social Studies only and is intended to provide an overview of performance by content expectation .
• School • District • State • Online
Demographic Report
Provides a comparison of students by grade and content, aggregated across selected demographic groups, showing mean scale scores and percentages of students in each performance level .
• School• District• ISD• State
• Online
Comprehensive Report
Provides a comparison of students by grade and content by schools within a district or districts within an ISD . Mean scale scores and percentages of students in each performance level are reported .
• District• ISD • Online
Target Analysis Report (coming fall 2016)
For groups of students, identifies assessment targets that are relative strengths or weaknesses as compared to overall performance on an ELA or Mathematics assessment .
• School• District• ISD• State
• Online

5
Scor
ing
www .michigan .gov/mstepFOR HELP, call 1-877-560-8378, option 3
Section 2: Scoring
Scoring by Item TypeAll of the processes employed to assess overall student performance begin at the item level . There are three types of items on the M-STEP: Multiple Choice (MC) items, Constructed Response (CR) items, and Technology Enhanced (TE) items . Item scores are used in the statistical models and transformations that result in scale scores .
Multiple Choice Item Scores
The Spring 2016 M-STEP Science and Social Studies assessment contains Multiple Choice items and field-test only Technology Enhanced items . The M-STEP ELA and mathematics assessments include MC items . When responding to multiple choice items, students select from the available options, only one of which is a correct response to the item . Students who select only the correct option receive a score of one (1) on the MC item . Students who select one of the incorrect options, multiple options, or did not respond receive a score of zero (0) . The string of responses from the MC items (e .g . 1,0,0,0,1,…,1) serves as input for the statistical models used to derive scale scores . MC items are scanned and scored by computer . In Spring 2016, all content area assessments - ELA, mathematics, science, and social studies - included multiple choice items .
Constructed Response Item Scores
In Spring 2016, the ELA and Math tests included operational Constructed Response (CR) items . ELA contained 2-point Claim 2 (writing) items in CAT and 2-point Claim 4 (research) items in the Performance Tasks, as well as 6-point Written Extended Response (WER) items located in the Performance Tasks (described below) . The modes for the WER items were narrative, explanatory/informational, and opinion/argumentative . In mathematics, the maximum points for CR items ranged from one (1) to three (3) points .
Most CR items requiring typed or written answers are evaluated by human scorers . Guided by precise criteria, scorers review a response for accuracy and completeness and assign points based on how well the requirements of the prompt are fulfilled according to a scoring rubric for the specific item . Extensive professional practice and research have refined and validated the critical steps that ensure consistency in scoring . Scorers are trained to ignore extraneous factors such as neatness and to focus on the comprehension demonstrated in the response .
Automated Scoring (AI) is also used for a portion of MDE selected items in both ELA and Mathematics . The first year an item is AI scored, it receives a 20% read-behind—meaning a human scorer also reads and scores the item—and the correlation between these two scores is examined to ensure accuracy of AI scoring . In subsequent years, AI scored items receive a 10% read-behind . Due to the high-stakes nature of these large-scale assessments, the MDE has taken every step possible to minimize scoring subjectivity, and maximize scoring objectivity . .
Technology Enhanced Item Scores
Technology Enhanced (TE) items are computer-delivered test questions which include specialized interactions that allow students to respond to tasks that go beyond what can be covered in traditional MC and CR items . TE items usually require students to produce information, as opposed to simply selecting a choice from answer options . The scoring for most TE items is automated similar to MC items, eliminating the need for human scorers in the majority of cases . TE item types include the following:
Drag and Drop—students can drag pictures or words into boxes or “drop zones” to indicate an answer .
Choice Interaction—similar to a multiple-choice item, but the item can have more than four options, and any number of the options can be correct or incorrect .

6 2016 M-STEP Guide to Reports
Scoring
Hotspot (Count or Selection)—graphics are selectable; for Count, students can choose a particular number of hotspots to show their answer; for Selection, students select a specific hotspot to choose their answer .
Matching Interaction—an interaction grid that allows the students to select areas of matching between an option in the row with an option in the column .
Keypad Input—a math item type that contains an embedded keyboard for math functions that can be used to answer the question .
Evidence Based Selected Response—an item consisting of two parts . Each part is multiple choice or hot text paragraph with answers embedded in the paragraph .
Hot Text Highlight (List and Paragraph)—text is selectable, and once selected, will highlight for the students; for Line, the students can select one or more lines of text to answer the question; Hot text paragraph involves answers embedded within a paragraph(s) . Students select word(s), phrase(s), sentence(s), and/or paragraph(s) according to the instructions in the stem or question .
Order—a list of items or sentences that can be arranged by the students in the correct order .
In Science and Social Studies for Spring 2016, the field test TE items do not factor into the student scores at this time . In ELA and Math, the TE items are scored as part of the operational test .
Performance Tasks
Performance Tasks are extended activities that measure knowledge and skills across multiple standards using real-world tasks . The Performance Tasks require students to demonstrate analytical, organizational, and research skills to complete the tasks . The students are provided with a stimulus or source material that is linked to a set of test items .
Students in all grades, 3-8, receive a performance task in mathematics . In ELA, only students in grades 5 and 8 are assessed with a performance task . Each math Performance Task set contains 5-6 test items, and ELA Performance Tasks contain 3-4 test items . The students must interact with the stimulus or source material in order to answer the items in the set . Item types for ELA in the Performance Tasks included CR (including the 6-point Writing Extended Response items), and TE items . Math Performance Tasks included CR and TE items .
For math, some of the test items in the Performance Tasks have dependency to each other, meaning that the answer a student provides for one test question would affect the correct response needed for an associated test question .
Differences between Online and Paper/Pencil Items
The MC and CR items appeared the same in both the online testing environment and the paper/pencil print forms . Due to the computer interactions involved in the TE items, the paper/pencil print forms featured variations of the TE items called companion items that tested the same concepts and skills as the corresponding TE items . The variations were modified for use in a print form .
The print variations of the TE items are created in various ways . In some cases, gridded response boxes are used to allow students to synthesize an answer while still allowing for automated scoring . In other cases, students are asked to write short answers in their answer documents . Some TE items are converted to multiple-select items (similar to Choice Interaction but with more than four options and possibly more than one correct answer) or table interactions (where the students fill in portions of a table to complete the question) . In all cases the companion items maintain the same point values as their TE counterparts .
7
Scor
ing
www .michigan .gov/mstepFOR HELP, call 1-877-560-8378, option 3
How Scores are Reported
Scale Scores
Students receive an overall scale score in each content area for which a valid test was returned . Scale scores are the basic unit of reporting . A scaled score is calculated from a total number of obtained score points that is statistically adjusted and converted into a consistent, standardized scale that permits direct and fair comparisons of scores from different forms of a test either within the same administration year or across years (Tan & Michel, 2011) . Established psychometric procedures are used to ensure that a given scale score represents the same level of performance regardless of the test form . Scale scores are especially suitable for comparing the performance of different groups of students in the same grade from year to year and for maintaining the same performance standard across the years . While scale scores are comparable across tests in a given content area within the same grade, they are not comparable across content areas or grades . Each overall scale score is indicated by a single number . An error band is noted for each scale score . The error band indicates the range of scores that the student would be likely to achieve if he or she were to take the test multiple times .1
Assessment Claims
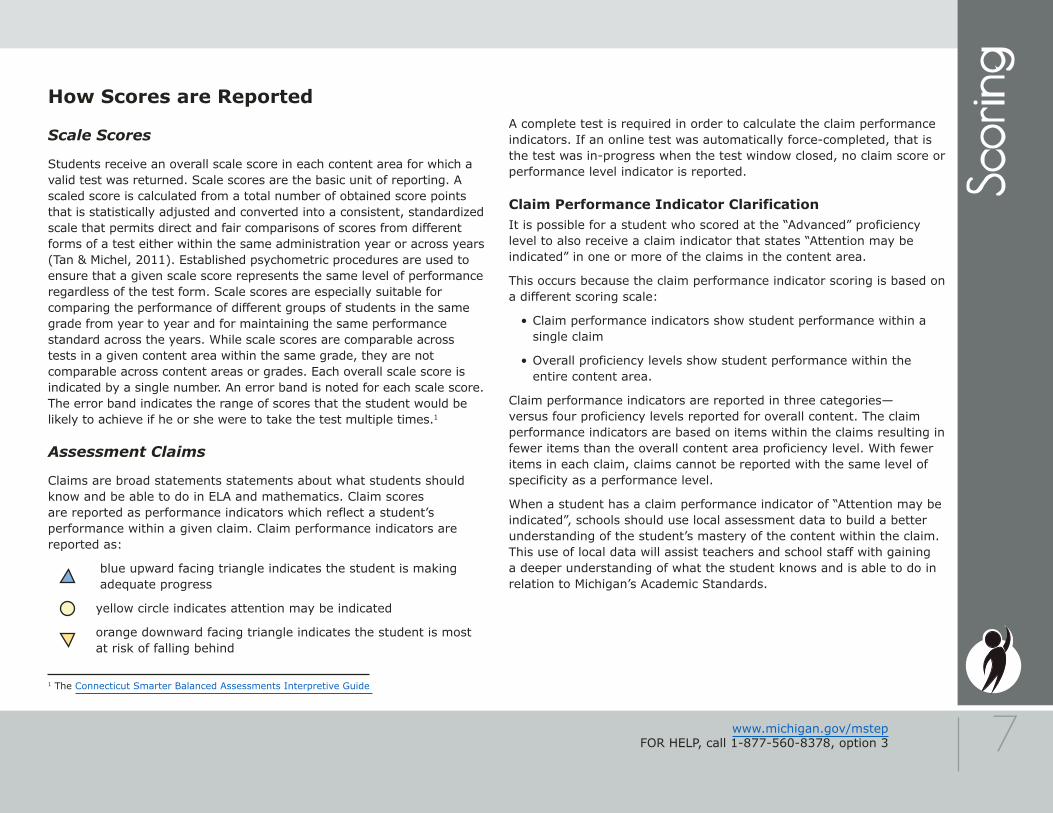
Claims are broad statements statements about what students should know and be able to do in ELA and mathematics . Claim scores are reported as performance indicators which reflect a student’s performance within a given claim . Claim performance indicators are reported as:
blue upward facing triangle indicates the student is making adequate progress
yellow circle indicates attention may be indicated
orange downward facing triangle indicates the student is most at risk of falling behind
A complete test is required in order to calculate the claim performance indicators . If an online test was automatically force-completed, that is the test was in-progress when the test window closed, no claim score or performance level indicator is reported .
Claim Performance Indicator ClarificationIt is possible for a student who scored at the “Advanced” proficiency level to also receive a claim indicator that states “Attention may be indicated” in one or more of the claims in the content area .
This occurs because the claim performance indicator scoring is based on a different scoring scale:
• Claim performance indicators show student performance within a single claim
• Overall proficiency levels show student performance within the entire content area .
Claim performance indicators are reported in three categories—versus four proficiency levels reported for overall content . The claim performance indicators are based on items within the claims resulting in fewer items than the overall content area proficiency level . With fewer items in each claim, claims cannot be reported with the same level of specificity as a performance level .
When a student has a claim performance indicator of “Attention may be indicated”, schools should use local assessment data to build a better understanding of the student’s mastery of the content within the claim . This use of local data will assist teachers and school staff with gaining a deeper understanding of what the student knows and is able to do in relation to Michigan’s Academic Standards .
1 The Connecticut Smarter Balanced Assessments Interpretive Guide

8 2016 M-STEP Guide to Reports
Scoring
Student Growth Percentiles
Student Growth Percentiles (SGPs) will appear on the Individual Student Report, Student Overview, and in the school data files accessed through the Secure Site . SGPs replaced Performance Level Change (PLC) on prior score reports, which relied on consistent proficiency standards from year to year . The assessment transition to the M-STEP necessitated an accompanying change in the reporting of student growth .
Student growth percentiles represent one powerful way to understand growth . Values for SGPs in Michigan range from 1-99, and can be interpreted in similar ways to other forms of percentiles . Scores close to 50 represent average growth . Higher SGPs indicate higher growth, while lower SGPs indicate lower growth . These percentiles are relative to students in Michigan, who had comparable achievement scores on prior state-level tests . Because of this, only students who received valid scores on the most recent state assessment in a content area and have a valid score on this year’s test will receive SGPs . It also follows that SGPs will not be available for students who take M-STEP/MI-Access FI tests in fourth grade science, fifth grade social studies, and third grade ELA or mathematics .
The addition of SGPs to Individual Student Reports, Student Overview Reports, and data files can add important context to understand the growth of individual students and growth patterns within groupings of students . When combined with achievement scores and proficiency categories, SGPs can help educators understand how student achievement scores compare to their peers in the state who had comparable prior test scores . Teachers and administrators should recognize, however, that SGPs will be less stable in the first year of any assessment transition; this is particularly true in Michigan, where the transition to M-STEP in 2014-2015 encompassed changing standards, testing windows, and delivery modes . SGPs generated in 2015-2016, for the second year of M-STEP, should generally be more stable .
Performance Levels
M-STEP scale scores within each subject area can be described in ranges . The labels applied to these ranges are known as Performance Levels . The M-STEP performance levels are: (1) Not Proficient, (2) Partialy Proficient, (3) Proficient, and (4) Advanced . The divisions between the levels are often referred to as cut scores . Scale score and performance level range tables are located on the following pages .
The cut scores are typically recommended by a panel comprised of educators and other stakeholders throughout the state in a process known as standard setting . To set these standards, the panel uses detailed descriptions of what students in each of the performance levels should know and be able to do . Based upon these detailed descriptions and actual assessment items, the panel recommends the score that best separates each performance level from the next to the Michigan Superintendent of Public Instruction . The State Superintendent then recommends the results of the standard setting (or modifications of these standards) to the Michigan State Board of Education (SBE) . The SBE is the authority who approves the final cut scores and performance level ranges . While the performance level descriptors necessarily differ by grade and subject area, student achievement, as defined by the obtained performance level, can be reasonably compared across subjects within a grade . Such a comparison can be used to indicate whether students are meeting Michigan content standards in each subject and grade .

9
Perfor
man
ce L
evel
s
www .michigan .gov/mstepFOR HELP, call 1-877-560-8378, option 3
Section 3: Performance Level Descriptors and Ranges for Grades 3-8
Performance Level (PL) DescriptorsAdvanced – PL 4: The student’s performance exceeds grade level content standards and indicates substantial understanding and application of key concepts defined for Michigan students . The student needs support to continue to excel .
Proficient – PL 3: The student’s performance indicates understanding and application of key grade level content standards defined for Michigan students . The student needs continued support to maintain and improve proficiency .
Partially Proficient – PL 2: The student needs assistance to improve achievement . The student’s performance is not yet proficient, indicating a partial understanding and application of the grade level content standards defined for Michigan students .
Not Proficient – PL 1: The student needs intensive intervention and support to improve achievement . The student’s performance is not yet proficient and indicates minimal understanding and application of the grade level content standards defined for Michigan students .
2016 M-STEP Performance Level Scale Score Ranges
Subject Grade Level 1 Not Proficient
Level 2 Partially Proficient
Level 3 Proficient
Level 4 Advanced
ELA
3 1203-1279 1280-1299 1300-1316 1317-1357
4 1301-1382 1383-1399 1400-1416 1417-1454
5 1409-1480 1481-1499 1500-1523 1524-1560
6 1508-1577 1578-1599 1600-1623 1624-1655
7 1618-1678 1679-1699 1700-1725 1726-1753
8 1721-1776 1777-1799 1800-1827 1828-1857

10 2016 M-STEP Guide to Reports
Performance Levels
2016 M-STEP Performance Level Scale Score Ranges
Subject Grade Level 1 Not Proficient
Level 2 Partially Proficient
Level 3 Proficient
Level 4 Advanced
Mathematics
3 1217-1280 1281-1299 1300-1320 1321-1361
4 1310-1375 1376-1399 1400-1419 1420-1455
5 1409-1477 1478-1499 1500-1514 1515-1550
6 1518-1578 1579-1599 1600-1613 1614-1650
7 1621-1678 1679-1699 1700-1715 1716-1752
8 1725-1779 1780-1799 1800-1814 1815-1850
Science
4 1280-1373 1374-1399 1400-1409 1410-1444
7 1593-1680 1681-1699 1700-1716 1717-1757
11 2008-2078 2079-2099 2100-2119 2120-2161
Social Studies
5 1396-1457 1458-1499 1500-1529 1530-1566
8 1702-1770 1771-1799 1800-1830 1831-1868
11 2016-2068 2069-2099 2100-2130 2131-2164
11
Dyna
mic S
core
Rep
ortin
g
www .michigan .gov/mstepFOR HELP, call 1-877-560-8378, option 3
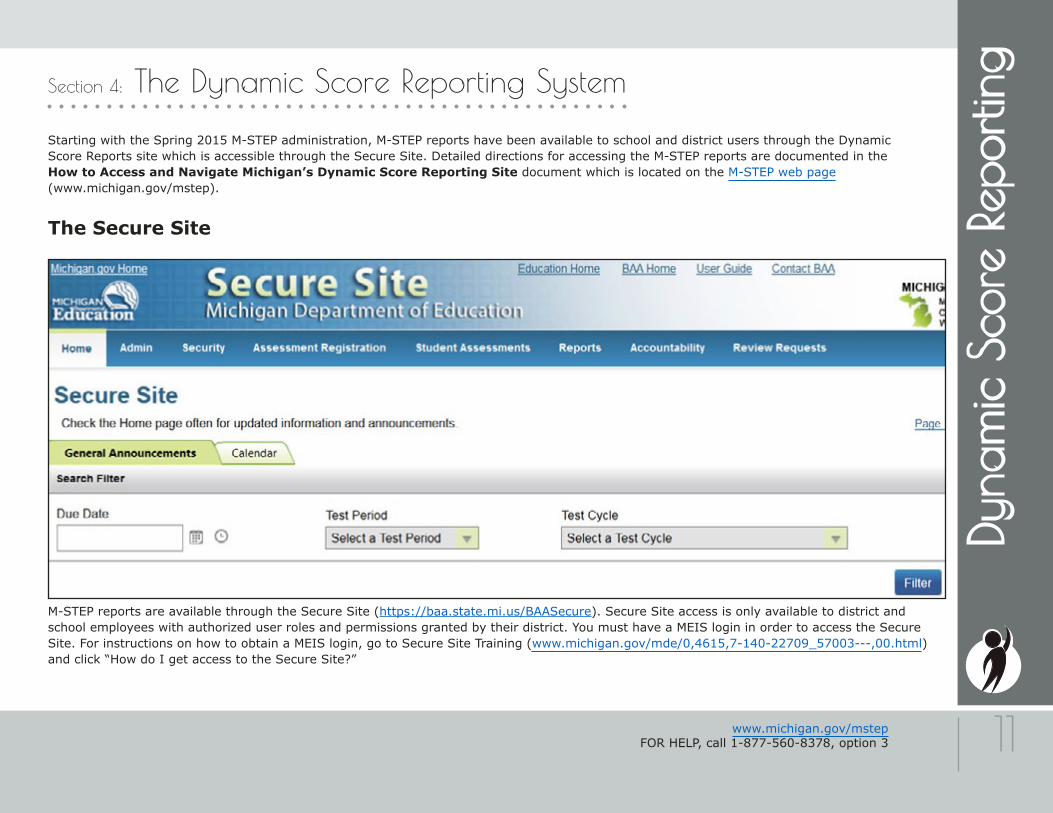
Section 4: The Dynamic Score Reporting System
Starting with the Spring 2015 M-STEP administration, M-STEP reports have been available to school and district users through the Dynamic Score Reports site which is accessible through the Secure Site . Detailed directions for accessing the M-STEP reports are documented in the How to Access and Navigate Michigan’s Dynamic Score Reporting Site document which is located on the M-STEP web page (www .michigan .gov/mstep) .
The Secure Site
M-STEP reports are available through the Secure Site (https://baa .state .mi .us/BAASecure) . Secure Site access is only available to district and school employees with authorized user roles and permissions granted by their district . You must have a MEIS login in order to access the Secure Site . For instructions on how to obtain a MEIS login, go to Secure Site Training (www .michigan .gov/mde/0,4615,7-140-22709_57003---,00 .html) and click “How do I get access to the Secure Site?”

12
Dyna
mic S
core
Rep
ortin
g
www .michigan .gov/mstepFOR HELP, call 1-877-560-8378, option 3
FunctionalityMichigan’s Dynamic Score Reporting site provides data for a variety of reports . Regardless of the selected report, users will encounter the following components:
1 . Filter Pane: (left) This section allows the user to filter by grade, content area, reporting code, and individual students . This pane also allows the user to generate reports . The options available in the Filter Pane vary depending on the report .
2 . Go to Student Quick Link: (left) Allows user to jump to a student selected in the Filter Pane .
3 . Information and PDF buttons: (left) These allow the user to view detailed information about each report and to generate a printable PDF of the report .
4 . Welcome Page: (right) The Welcome Page provides detailed directions for accessing the reports based on user role .

13 2016 M-STEP Guide to Reports
Dynamic Score Reporting
5 . Report Body: (below) The report body contains the selected report with the results of the filtered input .

14
Repo
rts
www .michigan .gov/mstepFOR HELP, call 1-877-560-8378, option 3
Section 5: Reports
Student Level Data ReportsStudent Record Labels
The Student Record Labels (right) provide summary student performance levels for individual students . The labels include district and school information, student demographic information, M-STEP administration cycle information, and overall student performance level for tested content areas .
Student Record Labels are provided for inclusion in the students’ Cumulative Student Record or CA-60 folder . They are printed and shipped to the school where the student tested in late summer .

15
Repo
rts
www .michigan .gov/mstepFOR HELP, call 1-877-560-8378, option 3
Individual Student Report
The Individual Student Report (ISR) (right) provides information about student performance by content area . Each student will have a separate ISR for each content assessed . The report is divided into three main sections:
1 Student demographic information
2 Overall content performance
3 Detailed claim data for English language arts (ELA) and mathematics and discipline and content expectation data for science and social studies .
Student Demographic InformationThis section provides identifying information about the student including name, grade, gender, date of birth, race/ethnicity, Unique Identification Code (UIC), and, if provided by the school, the district student ID . The report will indicate if the student has been identified as a Student with Disability, English learner, or formerly limited English proficiency in the Michigan Student Data System (MSDS) . Additionally, any designated supports or accommodations the student received are displayed .
Overall Content PerformanceOverall content area Scale Scores, including margin of error and the associated performance level, are provided as a graphic and as a table . Ranges for each performance level are also shown on the graphic . Student Growth Percentile in grades 4-8 ELA and mathematics, grade 7 science, and grade 8 social studies will be populated on the reports later in the fall .
1
2
3

16 2016 M-STEP Guide to Reports
Reports
Claims and DisciplinesClaim performance levels for English language arts and mathematics are reported . The following indicators of claim performance are used:
blue upward facing triangle indicates the student is making adequate progress
yellow circle indicates attention may be indicated
orange downward facing triangle indicates the student is most at risk of falling behind
To help understand assessment claims and targets, MDE has produced ELA and mathematics crosswalks for each grade . Educators can use the crosswalks to see the alignment between claims, targets, and content standards . The crosswalks can be found at www .michigan .gov/mstep .
Science and social studies content standards are organized by disciplines . Raw scores, that is points earned out of total points possible, are reported for each discipline . Raw scores are not comparable across test forms .
FiltersUsers may choose from several filters prior to report generation:
• Grade
• Content Area
• Reporting Code (formerly known as Class/Group Code)
• Home-schooled
• Performance Level
• Students (one, multiple, or all students may be selected)

17
Repo
rts
www .michigan .gov/mstepFOR HELP, call 1-877-560-8378, option 3
Parent Report
Parent Reports (right and next page) are printed and shipped to schools for distribution to parents .
The Parent Report provides information for parents about student performance in tested content areas . This report includes four main sections:
1 Superintendent Letter
2 Overall content performance
3 Detailed claim data for English language arts (ELA) and mathematics, and discipline and content expectation data for science and social studies .
4 Definitions for Parents
5 Performance Level Descriptors
Superintendent LetterThe Superintendent Letter to parents describes the M-STEP test administration, provides a brief overview of the data contained in the report, and provides a list of resources for the parent or guardian .
Overall Content PerformanceOverall content area Scale Scores, including margin of error and the associated performance level, are provided as a graphic and as a table . Ranges for each performance level are also shown on the graphic .
Claim performance levels for English language arts and mathematics are reported . An upward facing blue triangle indicates the student is making adequate progress; a yellow circle indicates attention may be indicated; and a downward facing orange triangle indicates the student is most at risk of falling behind .
1
2
4
3

18 2016 M-STEP Guide to Reports
Reports
Science and social studies content standards are organized by disciplines . Raw scores, that is points earned out of total points possible, are reported for each discipline . Raw scores are not comparable across test forms .
DefinitionsThe following definitions are provided:
Claims—Claims are used as a means to organize assessment targets . Claims apply to English language arts and mathematics . Within the claims, assessment targets are used to organize the standards . A claim score reflects a student’s performance on test items within that claim .
Disciplines—Disciplines are used as a means to organize content standards and expectations . Disciplines apply to science and social studies . A discipline score reflects a student’s performance on the test items within the discipline .
Claim Performance Indicators —The claim performance symbol is an indicator of a student’s performance on an English language arts or mathematics claim . A blue triangle pointing up indicates the student is making adequate progress on a claim . A circle indicates attention may be indicated for a student to continue meeting the claim . An orange triangle pointing down indicates the student is most at risk of falling behind on a claim .
Margin of Error—Educational measurements are attempts to capture a student’s true score, or ability, in the area being assessed . The margin of error around the student score is an estimate of the range or scores one would expect if the same student was to be measured repeatedly with parallel assessments .
2 2
3 3
5
19
Repo
rts
www .michigan .gov/mstepFOR HELP, call 1-877-560-8378, option 3
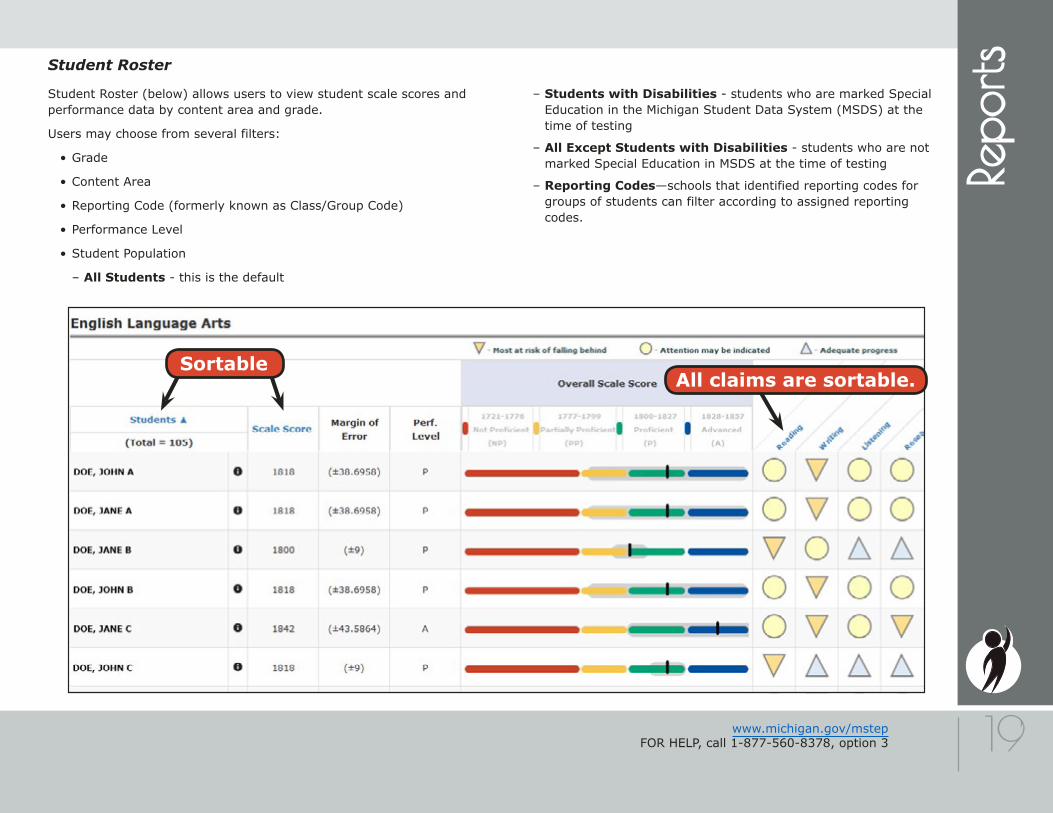
Student Roster
Student Roster (below) allows users to view student scale scores and performance data by content area and grade .
Users may choose from several filters:
• Grade
• Content Area
• Reporting Code (formerly known as Class/Group Code)
• Performance Level
• Student Population
– All Students - this is the default
– Students with Disabilities - students who are marked Special Education in the Michigan Student Data System (MSDS) at the time of testing
– All Except Students with Disabilities - students who are not marked Special Education in MSDS at the time of testing
– Reporting Codes—schools that identified reporting codes for groups of students can filter according to assigned reporting codes .
All claims are sortable .Sortable
20 2016 M-STEP Guide to Reports
Reports
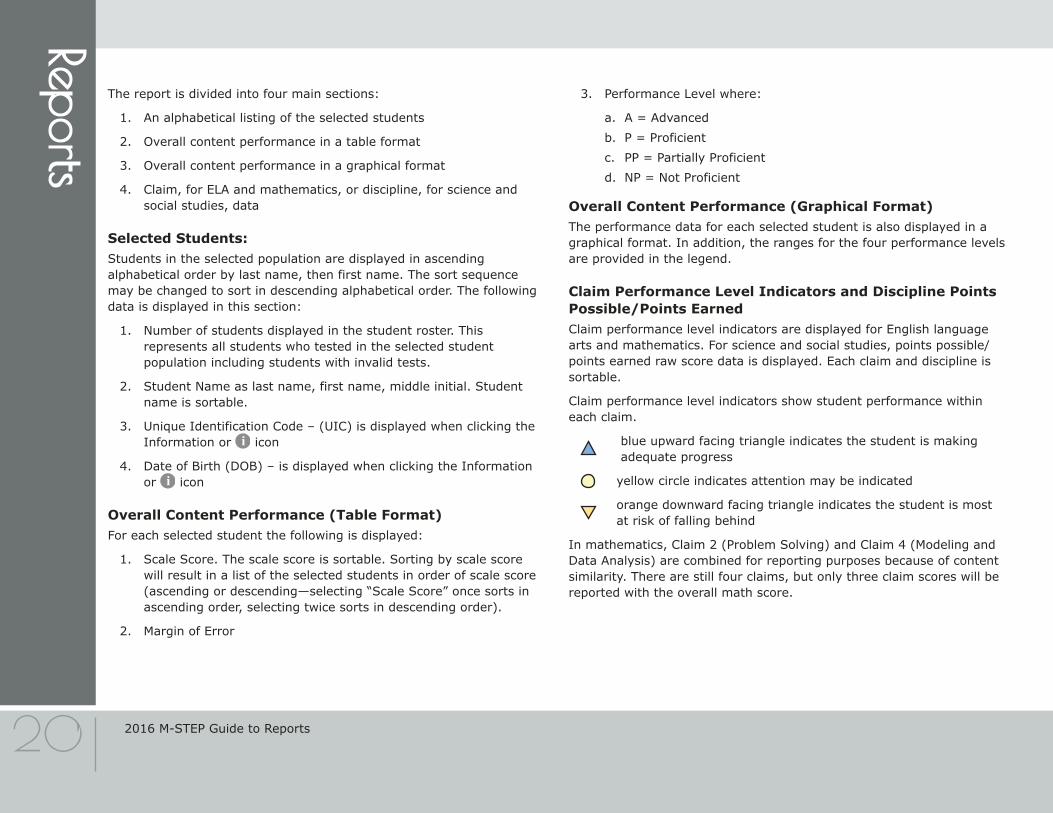
The report is divided into four main sections:
1 . An alphabetical listing of the selected students
2 . Overall content performance in a table format
3 . Overall content performance in a graphical format
4 . Claim, for ELA and mathematics, or discipline, for science and social studies, data
Selected Students: Students in the selected population are displayed in ascending alphabetical order by last name, then first name . The sort sequence may be changed to sort in descending alphabetical order . The following data is displayed in this section:
1 . Number of students displayed in the student roster . This represents all students who tested in the selected student population including students with invalid tests .
2 . Student Name as last name, first name, middle initial . Student name is sortable .
3 . Unique Identification Code – (UIC) is displayed when clicking the Information or i icon
4 . Date of Birth (DOB) – is displayed when clicking the Information or i icon
Overall Content Performance (Table Format) For each selected student the following is displayed:
1 . Scale Score . The scale score is sortable . Sorting by scale score will result in a list of the selected students in order of scale score (ascending or descending—selecting “Scale Score” once sorts in ascending order, selecting twice sorts in descending order) .
2 . Margin of Error
3 . Performance Level where:
a . A = Advancedb . P = Proficientc . PP = Partially Proficientd . NP = Not Proficient
Overall Content Performance (Graphical Format) The performance data for each selected student is also displayed in a graphical format . In addition, the ranges for the four performance levels are provided in the legend .
Claim Performance Level Indicators and Discipline Points Possible/Points Earned Claim performance level indicators are displayed for English language arts and mathematics . For science and social studies, points possible/points earned raw score data is displayed . Each claim and discipline is sortable .
Claim performance level indicators show student performance within each claim .
blue upward facing triangle indicates the student is making adequate progress
yellow circle indicates attention may be indicated
orange downward facing triangle indicates the student is most at risk of falling behind
In mathematics, Claim 2 (Problem Solving) and Claim 4 (Modeling and Data Analysis) are combined for reporting purposes because of content similarity . There are still four claims, but only three claim scores will be reported with the overall math score .

21
Repo
rts
www .michigan .gov/mstepFOR HELP, call 1-877-560-8378, option 3
Student Overview
The Student Overview (below) provides summary information about student performance in all tested content in the selected grade .
For each selected student the following data is displayed for each tested content in both graphical and table format:
1 Scale Score
2 Margin of Error
3 Performance Level1 2
3

22 2016 M-STEP Guide to Reports
Reports
Aggregate Data Reports
Target Analysis Report
The Michigan Student Test of Educational Progress (M-STEP) Target Analysis report provides information about relative strengths and relative weaknesses by assessment target in English language arts and mathematics for a school, district, ISD, and the state . The report is intended to provide an overview of relative strengths and weaknesses in English language arts and mathematics by assessment target as compared to student performance on the test as a whole .
The population of students to be displayed may be selected by the user . Users may select from the following student populations:
• All Students – this is the default
• All Except Students with Disabilities – students who are not marked Special Education in the Michigan Student Data System (MSDS) at the time of testing
• Students with Disabilities – students who are marked Special Education in MSDS at the time of testing
The report displays the Number of Students Assessed with valid scores in the school, district, ISD, and state (not all students were assessed on every assessment target or received the same number of items on each target), and the relative performance on the assessment target as compared to the test as a whole .
About the Data:• Both online and paper/pencil test takers are included in the
reported results .
• Only valid test scores are included in the reported results .
• Students who did not complete the assessment and whose assessment was force-submitted are excluded from the reported results .
• Homeschool students are excluded from the reported results .
• Only English language arts and mathematics content areas are included .
• Nonpublic students are reported only at the school level .
• Not all students were assessed with the same number of items on each assessment target .
• Data is reported for assessment targets only when the aggregate group includes at least:
– 15 unique students per target – 3 unique items per target – 25 responses per target –
Downloadable CSV File The CSV File contains detailed aggregate data . The data includes school information, the number of students with valid scores, claim information, target information, and the strength or weakness indicators . The downloadable CSV file icon is displayed in the upper right corner of the report next to the pdf icon .

23
Repo
rts
www .michigan .gov/mstepFOR HELP, call 1-877-560-8378, option 3
How to Read this Report:This report is an aggregate report that shows relative strengths and weaknesses on each target as compared to performance on the test as a whole in a school, district, ISD, and the state . The first row identifies the entity for each column: School, District, ISD, and State . The second row identifies the Number of Students Assessed with valid scores for each entity: School, District, ISD, and the state . The third row identifies Claim 1 for the content area – either English language arts or mathematics . This row is gray and the text is centered . The first column of the next rows lists the assessment targets for that claim . The second through fifth columns contain information about the aggregate group’s performance on the assessment target as compared to the test as a whole .
The relative strengths and weaknesses are only valid within each identified aggregate group – which means the report must be read vertically – by aggregate group . Comparisons between or among aggregate groups are not valid or appropriate .
The district information is based on the district aggregate group – and therefore not comparable to the school, ISD, or state . Again, the ISD relative strength and weakness indicators are relative to the performance of the ISD group on the test as a whole . This is not comparable to the data displayed for the school, district, or state .
Each assessment target contains a symbol that indicates the relative performance of the aggregate group as compared to the test as a whole:
An upward pointing blue triangle indicates a relative strength in the assessment target as compared to the aggregate group’s performance on the test as a whole .
A circle indicates neither a strength nor a weakness in the assessment target as compared to the aggregate group’s performance on the test as a whole .
School Target Analysis ReportGrade 05 | English Language Arts | All Students
Relative Strength Neither Strength or Weakness Relative Weakness Insufficient Data to Report*Number of Students Assessed
School District ISD State
Target 1: Given an inference or conclusion, use explicitdetails from a narrative text to support the inference orconclusion.
Target 2: Identify or summarize central ideas/key eventsin a narrative text.
Target 3: In narrative text, determine word meaningbased on context, relationships, structure, or use ofresources.
103 205 309 512
Claim 1: Reading
**
A downward pointing orange triangle indicates a relative weakness in the assessment target as compared to the aggregate group’s performance on the test as a whole .
* An asterisk indicates there is insufficient data to report on the relative performance in the assessment target as compared to the aggregate group’s performance on the test as a whole . Data is reported for assessment targets only when the aggregate group includes at least:
– 15 unique students per target – 3 unique items per target – 25 responses per target
NOTE: This report compares assessment target performance to overall test performance within the school, district, ISD, or state; therefore comparisons between or among schools, districts, ISDs, or the state are not valid or appropriate .

24 2016 M-STEP Guide to Reports
Reports
Expectation Analysis
Expectation Analysis (below) provides the percentage of points earned by grade and content area expectations in each discipline (Science and Social Studies) and the number of students scoring in each of four quartiles . The report is intended to provide an overview of performance by content expectation .
Users may choose from several filters:
• Grade
• Content Area
• Reporting Code (formerly known as Class/Group Code)
• Student Population
– All Students - this is the default
– Students with Disabilities - students who are marked Special Education in the Michigan Student Data System (MSDS) at the time of testing
– All Except Students with Disabilities - students who are not marked Special Education in MSDS at the time of testing
Reporting Codes—schools that identified reporting codes for groups of students can filter according to assigned reporting codes . Individual students may have a different number of points possible associated with an expectation depending on the test form they received .
The report displays the Number of Students Assessed in the expectation (not all students were assessed on every expectation), the average percentage of points earned, and the number of students scoring in one of four bands or quartiles: 0-25%, 26-50%, 51-75%, and 76-100% points earned out of points possible .
Year: 2016 | Assessment: M-STEP | ISD Code: 00000 | ISD Name: ABCDE ISD | District Code: 00000 | District Name: ABC Public Schools| School Code: 00000 | School Name: ABC Elementary School | Reporting Code: All
School Expectation Analysis ReportGrade 5 | Social Studies | All Students
Expectation H HistoryNo. of StudentsAssessed perExpectation
Average% PointsEarned
Number of Students With:
0-25%PointsEarned
26-50%PointsEarned
51-75%PointsEarned
76-100%PointsEarned
3H3.0.03 Describe causal relationships amongthree MI events
96 42.7 55 0 0 41
3H3.0.05 Use text: how American Indiansadapted to environment
96 81.3 18 0 0 78
3H3.0.06 Describe interactions: AmericanIndians and Europeans
96 77.1 22 0 0 74
4H3.0.02 Use primary/secondary to explainMichigan migration
96 40.6 57 0 0 39
4H3.0.03 How do natural resources/industriesaffect MI cities
96 53.1 45 0 0 51
4H3.0.05 Use visual data to comparepast/present MI economy
96 33.3 64 0 0 32
4H3.0.08 Describe past/current threats to MInatural resources
96 40.6 57 0 0 39
5U1.1.03 Describe Eastern WoodlandAmerican Indian life
96 51.6 24 45 0 27

25
Repo
rts
www .michigan .gov/mstepFOR HELP, call 1-877-560-8378, option 3
Demographic Report
The Demographic Report (below) provides a comparison of students by grade and content, aggregated across selected demographic groups, showing the percentages proficient at each level (Advanced, Proficient, Partially Proficient, and Not Proficient) . The Demographic Report is available at the School, District, ISD, and State levels .
The population of students to be displayed may be selected by the user .
Users may select from the following student populations:
All Students—this is the default
All Except Students with Disabilities—students who are not marked Special Education in the Michigan Student Data System (MSDS) at the time of testing
Students with Disabilities—students who are marked Special Education in MSDS at the time of testing
Year: 2016 | Assessment: M-STEP | ISD Code: 00000 | ISD Name: ABCDE ISD | District Code: 00000 | District Name: ABC Public Schools
District Demographic Report Grade 5 | All Students
English Language ArtsAll grade 5 students
Grade 5 Economically Disadvantaged: Nostudents
A 15241560 Advanced
P 15001523 Proficient
PP 14811499 Partially Proficient
NP 14091480 Not Proficient
Demographic SubgroupsNo. of
StudentsAssessed
MeanScaleScore
% atNP
% atPP
% atP
% atA
% atA & P*
All 343 1503 13 30 38 19 56Gender
Male 165 1501 19 28 36 17 53Female 178 1505 8 33 39 20 60
EthnicityAmerican Indian or Alaska Native <Asian 11 1508 18 18 36 27 64Black or African American 18 1487 39 39 22 0 22Native Hawaiian or Other PacificIslander <
White 277 1506 9 30 40 21 61Two or More Races 15 1494 33 27 33 7 40Hispanic or Latino 20 1492 20 45 30 5 35
Additional Reporting GroupsEconomically Disadvantaged: Yes 116 1498 17 41 29 13 42Economically Disadvantaged: No 227 1506 12 25 42 22 63ELs: Yes <ELs: No 334 1503 13 30 37 19 57Formerly LEP <Migrant <Homeless <
AccommodationStandard Accommodation allstudents <
Nonstandard Accommodation all students <
Standard Accommodation ELonly <
Nonstandard Accommodation EL only <
< No summary scores provided if less than 10 students. * Value may not equal the exact sum of Levels A & P due to rounding.
A 19%
P 38%
PP 30%
NP 13%
A 22%
P 42%
PP 25%
NP 12%
12
3

26 2016 M-STEP Guide to Reports
Reports
After the user selects a grade to view, all tested content for that grade is displayed sequentially in alphabetical order . The report is divided into three main sections:
1 Overall performance level percentages for the selected student population in the grade and content displayed in graphical format .
2 Demographic subgroup performance level data for each subgroup in table format .
3 If a demographic subgroup is selected, then a graphical display of the performance level percentages for that subgroup is displayed under the overall graph for easy comparison .
Overall Performance Level Percentages Graphic For all students in the selected grade, student population, and displayed content, the percentages of advanced, proficient, partially proficient, and not proficient students are displayed in a horizontal bar graph . The legend beneath the graph provides the scale score ranges associated with each performance level .
Demographic Subgroup Performance Level Data Table Performance level data, including the number of students assessed, mean scale score, and percentages of students in each performance level - Advanced, Proficient, Partially Proficient, Not Proficient—as well as advanced and proficient combined, are displayed for a number of demographic subgroups in a table . The demographic subgroups reported are:
• Gender
– Male – Female
• Ethnicity
– American Indian or Alaska Native – Asian – Black or African American – Hispanic or Latino – Native Hawaiian or Other Pacific Islander – Two or More Races – White
• Additional Reporting Groups
– Economically Disadvantaged: Yes – Economically Disadvantaged: No – English Learners (ELs) : Yes – ELs: No – Formerly Limited English Proficiency (LEP) – Migrant – Homeless
• Students with Disabilities
– Standard Accommodation—all students – Nonstandard Accommodation—all students – Standard Accommodation—EL only – Nonst andard Accommodation—EL only
Demographic Subgroup Performance Level Percentages Graphic The user may select a demographic subgroup in the demographic table to compare against the overall student population . The selected demographic subgroup will be highlighted and a corresponding horizontal bar graph of the performance level percentages will display under the overall performance level graph .

27
Repo
rts
www .michigan .gov/mstepFOR HELP, call 1-877-560-8378, option 3
Comprehensive Report
The Comprehensive Report (below) provides a comparison of students by grade and content, aggregated across schools and districts, showing the percentages proficient at each level (Advanced, Proficient, Partially Proficient, and Not Proficient) . The Comprehensive Report is available at the ISD and District levels .
The population of students to be displayed may be selected by the user . Users may select from the following student populations:
All Students—this is the default
All Except Students with Disabilities—students who are not marked Special Education in the Michigan Student Data System (MSDS) at the time of testing
Students with Disabilities—students who are marked Special Education in MSDS at the time of testing
After the user selects a grade to view, all tested content for that grade is displayed sequentially in alphabetical order . The report is divided into three main sections:
1 Overall performance level percentages for the selected student population in the grade and content displayed in graphical format .
2 Entity performance level data for each school (district report) or district (ISD report) in table format .
3 If an entity is selected in the table, then a graphical display of the performance level percentages for that entity is displayed under the overall graph for easy comparison .
1
2
3

28 2016 M-STEP Guide to Reports
Reports
Overall Performance Level Percentages Graphic For all students in the selected grade, student population, and displayed content, the percentages of Advanced, Proficient, Partially Proficient, and Not Proficient students are displayed in a horizontal bar graph . The legend beneath the graph provides the scale score ranges associated with each performance level .
Entity Performance Level Data Table Performance level data, including the number of students assessed, mean scale score, and percentages of students in each performance level—Advanced, Proficient, Partially Proficient, Not Proficient—as well as advanced and proficient combined, are displayed for the applicable entities in a table .
• For ISD level reports, performance data for the districts in the ISD are reported .
• For district level reports, performance data for the schools, excluding nonpublic schools, in the district are reported .
Entity Performance Level Percentages Graphic The user may select an entity in the entity table to compare against the overall ISD or district performance data . The selected entity will be highlighted and a corresponding horizontal bar graph of the performance level percentages will display under the overall performance level graph .
Student Data File
The Student Data File (right) contains detailed individual student data in an excel file . This data includes school information, student demographic data, test administration data, and student performance data .
School information—student ISD, District, and School Code
Student Demographic Data—Includes grade, name, gender, ethnicity, UIC, Date of Birth . Also includes subgroup information including Economically disadvantaged, Special Education, Limited English Proficiency, Migrant status and HomeSchooled information
Test Administration Data—Includes online/paper-pencil format, valid or invalid test, if invalid, includes reason for invalidation of the test, also includes whether student received accomodations .
Student Performance Data—Includes student scale score, Student Growth Percentile, Raw score data for Science and Social Studies, and Claim performance indicators for ELA and Math
The Student Data File is provided for schools to use as a data resource for school or district level data reviews . Schools or districts can use the Student Data File to manipulate and evaluate data in ways that support School Improvement goals or other data-based-decision making purposes .
M-STEP Spring 2016 Student Data File Format
The downloaded file containing Student Test Scores is a Comma Delimited File (CSV). Please note: fields containing “Reporting Level” information are referring to Claims for ELA/Math and
Disciplines for Science/Social Studies. C o l u m n
Field Descriptor Field Type (length)
Format
A TestCycleID M-STEP test period and Fiscal Year
text(20)
B ISDCode ISD Code Number varchar(5) 99999 C DistrictCode School District Code Number varchar(5) 99999 D SchoolCode School Code Number varchar(5) 99999 E FeederSchoolCode Prior school number that
student attended varchar(5) 99999
F Grade Student Grade varchar(2) G LastName Student Last Name varchar(25) H FirstName Student First Name varchar(25) I MiddleInitial Student Middle Initial char(1) J Gender Student’s Gender; M for Male
and F for Female char(1)
K Ethnicity Student’s ethnic code: 0=Native Hawaiian or Other Pacific Islander 1=American Indian or Alaska Native 3=Black or African American 4=Hispanic or Latino 5=White 6=Two or more Races 9=Asian
int(1) 9
L UIC Student UIC char(10) M StudentNumber Student Number from Local
School District varchar(20)
N BirthDate Student’s Date of Birth datetime(8) mm/dd/yyyy O Barcode Student’s BAA Bar Code
Number varchar(10)
P ED Economically Disadvantaged: 1 – Yes 0 – No
varchar(1)
Q SE Special Education: 1 - Yes 0 - No
varchar(1)
R LEP Limited English Proficiency: 1 – Yes 0 - No
varchar(1)
29
Add
ition
al R
esou
rces
www .michigan .gov/mstepFOR HELP, call 1-877-560-8378, option 3
Section 6: Additional Resources
Additional Sources of Assessment Results
BAA Secure Site Data files
Data files are available for download from the BAA Secure Site Student Test Scores window for authorized school and district users . The BAA Secure Site can be accessed by authorized users at www .michigan .gov/baa-secure .
• Student Data File—includes individual student test results and performance
• Aggregate Data File—includes aggregated school, district, or ISD assessment results
MI School Data
MI School Data is an online public portal that provides views of Michigan education data to help make informed educational decisions, to help improve instruction and to enable school systems to prepare a higher percentage of students to succeed in rigorous high school courses, college and challenging careers . (www .michigan .gov/mischooldata)
General Resources
General additional resources are available on the M-STEP webpage (www .michigan .gov/mstep):
• For instructions on how to obtain access to the Dynamic Reporting Site, go to Secure Site Training (www .michigan .gov/mde/0,4615,7-140-22709_57003---,00 .html) and click How do I get access to the Secure Site?
• 2016 M-STEP and MME Performance Level (PL) Descriptors
• 2016 M-STEP Performance Level Scale Score Ranges
• 2016 M-STEP Student Data File Format
• Videos and information regarding Computer Adaptive Testing (CAT)
• Spring 2017-2019 Statewide Summative Assessments Calendar
• M-STEP: What it is, What it means, and What it Offers— presentation
• Online Practice for M-STEP ELA, Math, Science and Social Studies
• Sample Item Sets
• Math and ELA Crosswalk Documents with Claims, Targets, and Standards
Also, be sure to sign up for the Office of Student Assessments’ Spotlight Newsletter (http://www .michigan .gov/mde/0,4615,7-140-22709_70117-280911--,00 .html) for weekly up-to-date information about Statewide Summative Assessments

30 2016 M-STEP Guide to Reports
Contact Inform
ation
Section 7: Contact Information
School administrators, teachers, and counselors should become familiar with the report layouts and information contained in this document . If you have questions after reviewing this Guide to reports, or need additional information about M-STEP administration procedures, content, scheduling, appropriate assessment of or accommodations for students with disabilities or English language learners (ELLs), please contact the Michigan Department of Education Division of Educator, Student, and School Supports, using the contact information listed below:
Division of Educator, Student, and School Supports
Andrew Middlestead, Director, Office of Student Assessments
Katherine Cermak, Manager, Test Administration and Reporting
Phoebe Gohs, M-STEP Consultant, Test Administration and Reporting
Linda Howley, Manager, Test Development
Suzanne Hindman, ELA Consultant
Kyle Ward, Mathematics Consultant
Scott Koenig, Social Studies Consultant
Tamara Smolek, Science Consultant
John Jaquith, Assessment Consultant for Students with Disabilities
Jennifer Paul, Assessment Consultant for English Language Learners
Ji Zeng, Ph .D ., Lead Psychometrician, Psychometrics
Phone: 1-877-560-8378, option 3
Fax: 517-335-1186
Website: www .michigan .gov/mstep
E-mail: BAA@michigan .gov