spring/summer 2008 - usarray
TRANSCRIPT

121°W 120°W 119°W 118°W 117°W
36°N
37°N
38°N
39°N
40°N
Arizona
Nevada
CaliforniaPacific Ocean
Longitude
Latitude
45
40
50
35
45
3530
30
35
30
Great Valley
Mt.Whitney
DeathValley
Fresno
LakeTahoe
LongValley
broadbandseismometer
35crustalthicknesscontour
Basinand Range
Reno
Sacramento
Ow
ens Valley
Yosemite line
Yos. Nat.
Park
Figure 1: Topographic map of the Sierra Nevada region where elevations over 4000 m (13,000 ft) are shown in white and elevations below 0 m are shown in dark green. Locations of the seismic stations are displayed for the Sierra Nevada EarthScope Project (blue triangles), the Transportable Array (red diamonds), and the 1997 Sierran Paradox PASSCAL Experiment (yellow circles). Variations in crustal thickness, from 30 to 50 km, are indicated by black contours. The white oval outlines the Long Valley caldera.
Extreme topography dots the landscape of southeastern California. At over 4400 m (14,500 ft) above sea level, Mt. Whitney, in the Sierra Nevada mountains, represents the highest elevation in the contiguous United States. Less than 150 km (100 miles) to the east, the lowest elevations in North America are found at Bad Water Basin within Death Valley National Park, which descends more than 80 m (250 ft) below sea level (Figure 1). As EarthScope explores the North American continent at depth, it seeks to identify what struc-tures below the Earth’s surface relate to the evolution of this extremely diverse landscape. By recording ground movement from nearby earthquakes as well as those around the globe, the seismometers within USArray provide data that can be used to investigate a wide range of Earth structure including the thickness of the crust.
Seismic data recorded by the Transportable Array (TA) component of USArray provide a broad uniform framework to investigate continental tectonics. However, in settings where dramatic structural changes occur over short distances, the ~70-km (~45-mile) station spac-ing of the TA is too coarse to investigate features within the crust and mantle at the neces-sary scales. The Flexible Array is a configurable seismograph component of USArray that can be deployed in such settings to complement TA sampling where closer station spacing is required. The Sierra Nevada EarthScope Project (SNEP) was a Flexible Array experiment that was designed, deployed, and maintained by researchers from the University of Arizona, the University of Colorado, the University of South Carolina, and Purdue University. The experi-ment consisted of two 15-month deployments of approximately 50 broadband seismometers within the first footprint of the Transportable Array between the spring of 2005 and the fall of 2007 (Figure 1). A third phase consisted of a linear array across Yosemite National Park. The closer SNEP station spacing of ~25 km (15 miles) or less allowed investigation of structural variations that could not be found using only data recorded by the Transportable Array.
The Sierra Nevada has its origins some 90 million years ago when the large, oceanic Farallon plate was subducting beneath the western margin of North America. During a 10-15 million year interval, massive melting was triggered deep within the continental volca-nic arc associated with the subduction zone, and large volumes of granitic melts separated from a denser residue. The melts ascended into the upper crust and solidified as a huge batholith that would become the surface rocks into which the Sierran peaks would be carved by water and ice. Buried beneath the batholith, the residue rocks were held in place by
(continued on page 3)
spring/summer 2008
onSitenewsletter
featured science:Using the Flexible Array to Study the Origin of the Sierra Nevada
the flattening of the subducting slab that would eventually push volcanism and deformation far inland during the Laramide (Rocky Mountain) orogeny. When the flat slab foundered and the transition to the San Andreas transform plate boundary occurred, the heavy residue started to “delaminate” and sink into the underlying mantle. The purpose of the SNEP project is to investigate how pervasive this delamination event was, when and how it occurred, and how it affected the surface of the Earth.
Many of the SNEP observations thus far display patterns that differ between the eastern and western Sierra Nevada (Figures 1 and 2). The crustal thickness, the strength of the Moho seismic signal, and the distribution of seismicity and active volcanism are all different between the eastern and western portions of the region. If these structures relate to lithospheric removal, they suggest an asymme-try in the form of the delaminating root. SNEP observations compare well with numerical models of delamination, in which the
Anne M. Tréhu, ESNO Director
From the EarthScopeNational Office
With the anticipated completion of its core facilities in September 2008, EarthScope is enter-ing a new phase of exciting science, outreach and educational efforts. New analyses of EarthScope data are appearing in the scientific literature and are reshaping our understanding of Earth’s dynamic processes and deep structure. The scientific community is being challenged to move beyond conventional forms of publication and provide modeling results as data products that can be used as a foundation for new, multi-disciplinary studies. The EarthScope National Office (ESNO) is facilitating a national speaker series that highlights the integrative and inclusive nature of EarthScope and a series of workshops to develop tools and techniques for presenting EarthScope science to the public.
This issue’s featured science article high-lights the Sierra Nevada EarthScope Project, a research effort incorporating USArray Flexible Array (FA) instruments. The flexible components of USArray and PBO allow scientists to propose focused studies of well-defined scientific prob-lems that require higher resolution than is possible with the Transportable Array seismometers or PBO GPS instruments alone. Several FA experiments are currently under way in California, Oregon, Idaho, Washington, and elsewhere, and cam-paign GPS instruments are measuring deforma-tion of the Rio Grande Rift in New Mexico and Colorado. Meanwhile, the Transportable Array component of EarthScope continues rolling east. With the Adopt-A-Station program, some of these state-of-the-art seismic stations remain in place as research and educational institutions pay for equipment replacement, leaving a permanent enhancement to local and regional earthquake monitoring and research.
The EarthScope National Office is pleased to work with UNAVCO and IRIS to relate these excit-ing results to the EarthScope community. If there is a topic of special interest to you, please let us know by contacting the EarthScope National Office ([email protected]).

PBO Statusas of
June 1, 2008
Alaska
Puerto Rico
GPS InstalledGPS PlannedCampaign GPSBorehole StrainmeterLong Baseline Laser Strainmeter
PBO Data Products All PBO data prod-ucts are immediately freely available and can be accessed at http://pboweb.unavco.org.
PBO Regional OfficesAlaska 907-346-1523
Pacific Northwest 509-933-3221
Basin and Range 801-466-4634
Northern California 510-215-8100
Southern California 951-779-6400
2
UNAVCO builds and operates the Plate Boundary Observatory (PBO) as part of the NSF-funded EarthScope program, which collects data on the interactions between the Pacific and North American plates in the form of 3-D motions and earthquake data. When completed in October 2008, the PBO will comprise the largest integrated geodetic and seismic network in the United States and the second largest in the world.
As of June 1, 2008, UNAVCO has com-pleted 775 of the 875 planned GPS sta-tions, 62 of 103 borehole strainmeters and seismometers, three of five long baseline laser strainmeters, and eight of 28 borehole tiltmeter stations.
A recent publication (Mattia et al., 2008, in the online journal Terra Nova) used PBO data to study the recent 2005-2006 erup-tion of Mt. Augustine, located southwest of Anchorage, Alaska. PBO GPS stations on the volcano recorded the steady increase of micro-earthquakes preceding the erup-tion, which provides clues about the mov-ing magma underneath (http://pboweb.unavco.org/?pageid=13&newsid=192).
As of February 2008, PBO Siting Outreach Specialist Jayme Margolin has given 20 presentations at or near PBO sites, includ-ing a May 2008 talk in Yellowstone National Park about the ongoing LiDAR, GPS, and strainmeter applications. ■
Coring of SAFOD phase 3, including recovery of rock samples from the active San Andreas Fault, was completed in the summer of 2007. Following the December 2007 Core Sample Party at the U.S. Geological Survey in Menlo Park, California, the SAFOD Sample Committee received and evaluated sample requests from 28 coordinated research groups representing nine countries. Sample allocation and distribution is currently under way. All sampling, distribution, and curation is done at the Gulf Coast Repository, which also handles cores from the Integrated Ocean Drilling Program (http://iodp.tamu.edu/curation/gcr/index.html). For viewing the core retrieved from the San Andreas Fault, visit the SAFOD Core Viewer at http://www.earthscope.org/data/safod_core_viewer. ■
project status: SAFOD
The field crews have been active throughout the winter and spring as the Transportable Array continues to slowly roll eastward. Installation of new stations was focused in New Mexico and the Big Bend area of Texas where 86 stations began trans-mitting data this year. Having completed nearly all planned stations in New Mexico, the crews are currently installing stations in central Colorado as they work their way northward. During the first five months of 2008, more than 65 stations have been removed from parts of California, Oregon, Washington, and Nevada. The seismom-eters and other electronic equipment from these stations are shipped to other sites to be used again.
All stations in the array are monitored remotely by the Array Network Facility located at the Scripps Institution of Ocean-ography at the University of California, San Diego. This facility acquires the continuous data recorded by each station in near-real time, 24 hours a day, 7 days a week,
project status: USArray
365 days a year. Using sophisticated tools, the facility collects information on how each station is performing, including instrument response functions, power usage, and the quality and status of the data. In addition,
the facility transmits the data to the archive at the Data Management Center where it is freely available to the public. For more information, visit the Array Network Facility at http://anf.ucsd.edu. ■
project status: PBO
Operating Station: 408Construction Phase: 25Permitting Phase: 87Station Adopted: 21Station Removed: 136Future Site
USArray Statusas of
June 1, 2008
Real-Time Station Status To view a map of current Transport-able Array stations, visit http://www.earthscope.org and click on ‘Current Status Map’. To view seismograms recorded at a USArray station, go to http://usarray.seis.sc.edu/ and enter the station code.
Transportable Array Coordinating Office [email protected] 1-800-504-0357
MohoMoho
Dep
th (k
m)
0
20
Dep
th (k
m)
40
60
80
100
0
40
140
80
100
160
120
Lithosphere
Asthenosphere
Great ValleySierra Nevada
magma
Owens Valley
0 30 60 90 120 150 180 210 240 270 300Distance along pro�le (km)
EarthScope News3
featured science: Using the Flexible Array to Study the Origin of the Sierra Nevada
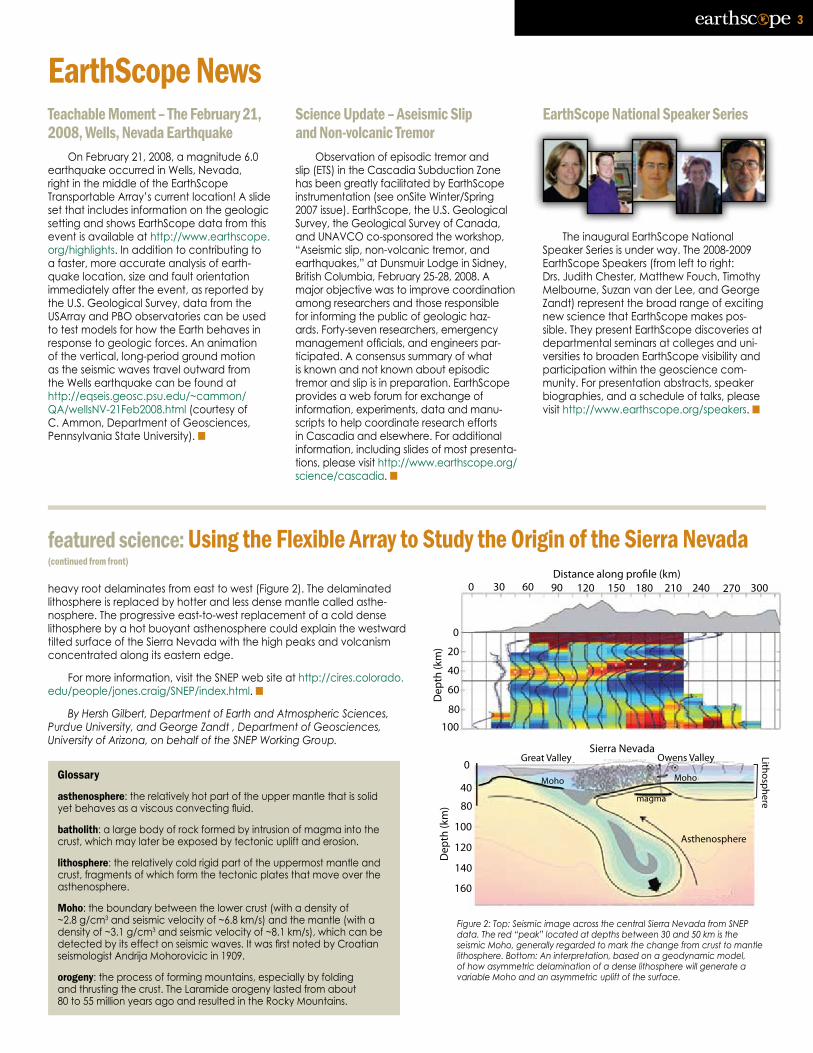
heavy root delaminates from east to west (Figure 2). The delaminated lithosphere is replaced by hotter and less dense mantle called asthe-nosphere. The progressive east-to-west replacement of a cold dense lithosphere by a hot buoyant asthenosphere could explain the westward tilted surface of the Sierra Nevada with the high peaks and volcanism concentrated along its eastern edge.
For more information, visit the SNEP web site at http://cires.colorado.edu/people/jones.craig/SNEP/index.html. ■
By Hersh Gilbert, Department of Earth and Atmospheric Sciences, Purdue University, and George Zandt , Department of Geosciences, University of Arizona, on behalf of the SNEP Working Group.
(continued from front)
Figure 2: Top: Seismic image across the central Sierra Nevada from SNEP data. The red “peak” located at depths between 30 and 50 km is the seismic Moho, generally regarded to mark the change from crust to mantle lithosphere. Bottom: An interpretation, based on a geodynamic model, of how asymmetric delamination of a dense lithosphere will generate a variable Moho and an asymmetric uplift of the surface.
Science Update – Aseismic Slip and Non-volcanic Tremor
Observation of episodic tremor and slip (ETS) in the Cascadia Subduction Zone has been greatly facilitated by EarthScope instrumentation (see onSite Winter/Spring 2007 issue). EarthScope, the U.S. Geological Survey, the Geological Survey of Canada, and UNAVCO co-sponsored the workshop, “Aseismic slip, non-volcanic tremor, and earthquakes,” at Dunsmuir Lodge in Sidney, British Columbia, February 25-28, 2008. A major objective was to improve coordination among researchers and those responsible for informing the public of geologic haz-ards. Forty-seven researchers, emergency management officials, and engineers par-ticipated. A consensus summary of what is known and not known about episodic tremor and slip is in preparation. EarthScope provides a web forum for exchange of information, experiments, data and manu-scripts to help coordinate research efforts in Cascadia and elsewhere. For additional information, including slides of most presenta-tions, please visit http://www.earthscope.org/science/cascadia. ■
Teachable Moment – The February 21, 2008, Wells, Nevada Earthquake
On February 21, 2008, a magnitude 6.0 earthquake occurred in Wells, Nevada, right in the middle of the EarthScope Transportable Array’s current location! A slide set that includes information on the geologic setting and shows EarthScope data from this event is available at http://www.earthscope.org/highlights. In addition to contributing to a faster, more accurate analysis of earth-quake location, size and fault orientation immediately after the event, as reported by the U.S. Geological Survey, data from the USArray and PBO observatories can be used to test models for how the Earth behaves in response to geologic forces. An animation of the vertical, long-period ground motion as the seismic waves travel outward from the Wells earthquake can be found at http://eqseis.geosc.psu.edu/~cammon/QA/wellsNV-21Feb2008.html (courtesy of C. Ammon, Department of Geosciences, Pennsylvania State University). ■
EarthScope National Speaker Series
The inaugural EarthScope National Speaker Series is under way. The 2008-2009 EarthScope Speakers (from left to right: Drs. Judith Chester, Matthew Fouch, Timothy Melbourne, Suzan van der Lee, and George Zandt) represent the broad range of exciting new science that EarthScope makes pos-sible. They present EarthScope discoveries at departmental seminars at colleges and uni-versities to broaden EarthScope visibility and participation within the geoscience com-munity. For presentation abstracts, speaker biographies, and a schedule of talks, please visit http://www.earthscope.org/speakers. ■
Glossary
asthenosphere: the relatively hot part of the upper mantle that is solid yet behaves as a viscous convecting fluid.
batholith: a large body of rock formed by intrusion of magma into the crust, which may later be exposed by tectonic uplift and erosion.
lithosphere: the relatively cold rigid part of the uppermost mantle and crust, fragments of which form the tectonic plates that move over the asthenosphere.
Moho: the boundary between the lower crust (with a density of ~2.8 g/cm3 and seismic velocity of ~6.8 km/s) and the mantle (with a density of ~3.1 g/cm3 and seismic velocity of ~8.1 km/s), which can be detected by its effect on seismic waves. It was first noted by Croatian seismologist Andrija Mohorovicic in 1909.
orogeny: the process of forming mountains, especially by folding and thrusting the crust. The Laramide orogeny lasted from about 80 to 55 million years ago and resulted in the Rocky Mountains.
EarthScope onSite is published four times a year by EarthScope (www.earthscope.org) To be added to or deleted from the mailing list for this newsletter, please send an email stating the action you wish us to take to: [email protected] or contact the EarthScope onSite Newsletter Editor, EarthScope National Office, College of Oceanic and Atmospheric Sciences, Oregon State University, 104 COAS Admin. Bldg., Corvallis, OR 97331-5503, Tel: 541-737-0500, Fax: 541-737-2064. Be sure to include your name, complete mailing address, telephone number, and email address.
Editors Jochen Braunmiller, OSU/EarthScope National Office [email protected] M. Dorr, IRIS/USArray [email protected] Tallerday, UNAVCO/PBO [email protected]
Production Manager/Copy Editor Perle M. Dorr, IRIS/USArray [email protected]
onSitenewsletter
EarthScope is funded by the National Science Foundation. EarthScope is being constructed, operated, and maintained as a collaborative effort with UNAVCO Inc., the Incorporated Research Institutions for Seismology, and Stanford University, with contributions from the US Geological Survey, NASA and several other national and international organizations. This material is based upon work supported by the National Science Foundation under Grants No. EAR-0323310, EAR-0323309, EAR-0323700, EAR-0323938, EAR-0323311, and EAR-0323704. Any opinions, findings, and conclusions or recommendations expressed in this material are those of the author(s) and do not necessarily reflect the views of the National Science Foundation.
EarthScope National Office College of Oceanic and Atmos. Sciences Oregon State University 104 COAS Admin. Bldg. Corvallis, OR 97331-5503
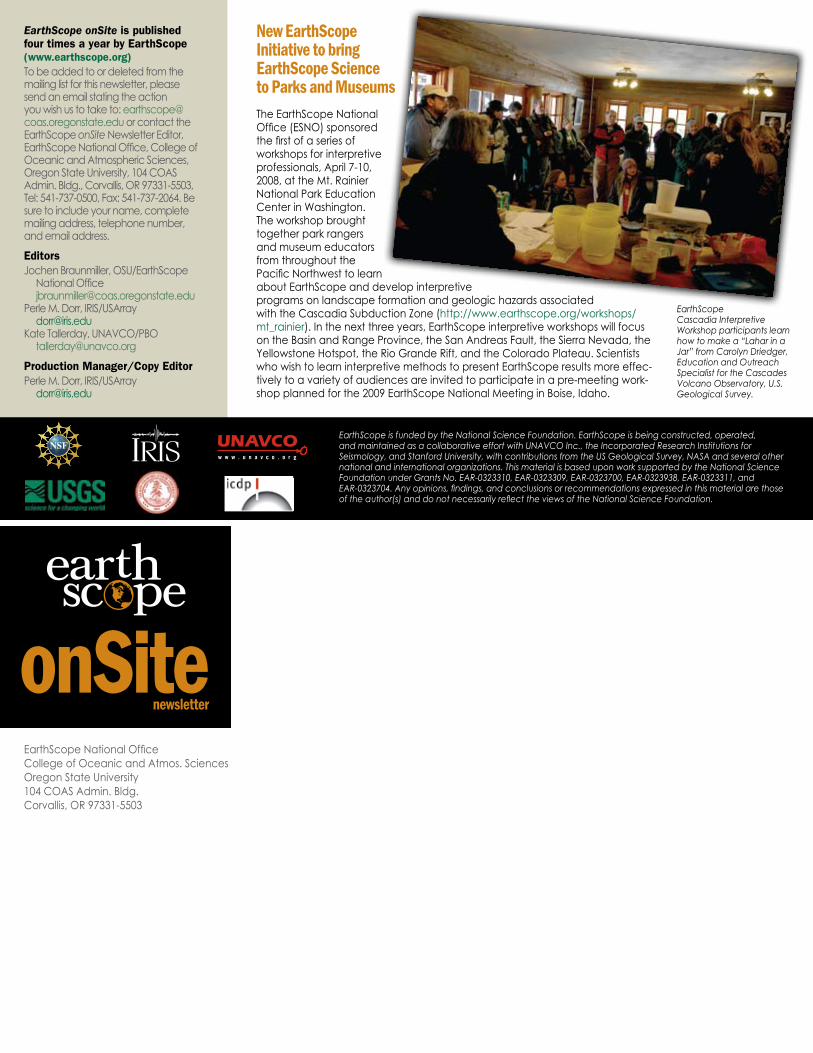
New EarthScope Initiative to bring EarthScope Science to Parks and MuseumsThe EarthScope National Office (ESNO) sponsored the first of a series of workshops for interpretive professionals, April 7-10, 2008, at the Mt. Rainier National Park Education Center in Washington. The workshop brought together park rangers and museum educators from throughout the Pacific Northwest to learn about EarthScope and develop interpretive programs on landscape formation and geologic hazards associated with the Cascadia Subduction Zone (http://www.earthscope.org/workshops/mt_rainier). In the next three years, EarthScope interpretive workshops will focus on the Basin and Range Province, the San Andreas Fault, the Sierra Nevada, the Yellowstone Hotspot, the Rio Grande Rift, and the Colorado Plateau. Scientists who wish to learn interpretive methods to present EarthScope results more effec-tively to a variety of audiences are invited to participate in a pre-meeting work-shop planned for the 2009 EarthScope National Meeting in Boise, Idaho.
EarthScope Cascadia Interpretive Workshop participants learn how to make a “Lahar in a Jar” from Carolyn Driedger, Education and Outreach Specialist for the Cascades Volcano Observatory, U.S. Geological Survey.