sprt calibration uncertainties and internal quality control at a
TRANSCRIPT

SPRT Calibration Uncertainties and Internal Quality Control at a Commercial SPRT Calibration Facility
T. J. Wiandt1,2
1 Fluke Corporation, Hart Scientific Division, American Fork, Utah United States. 2 E-mail: [email protected]
Preprint: Tempmeko 2007 (Presented 22 May 2007)

ABSTRACT
The Hart Scientific Division of the Fluke Corporation operates two accredited SPRT
calibration facilities, one at the Hart Scientific factory in Utah, USA, and the other at a service
facility in Norwich, UK. The US facility is accredited through NVLAP and the UK facility is
accredited through UKAS. Both provide SPRT calibrations using similar equipment and
procedures, and at similar levels of uncertainty. These uncertainties are among the lowest
available commercially. To achieve and maintain low uncertainties, it is required that the
calibration procedures be thorough and optimized for achieving these low uncertainties.
However, to minimize customer downtime, it is also important that the instruments be
calibrated in a timely manner and returned to the customer. Consequently, subjecting the
instrument to repeated calibrations or extensive repeated measurements is not a viable
approach. Additionally, these laboratories provide SPRT calibration services involving a wide
variety of SPRT designs. These designs behave differently, yet predictably, when subjected to
calibration measurements. To this end, a variation evaluation strategy involving both
statistical process control and internal consistency measures is utilized to provide confidence
in both the instrument calibration and the calibration process.
This paper describes the calibration facilities, procedure, uncertainty analysis, and internal
quality assurance measures employed in the calibration of SPRTs. Data will be reviewed and
generalities will be presented. Finally, challenges and considerations for future improvements
will be discussed.
KEY WORDS: accreditation; calibration; fixed point cell; NVLAP; quality assurance;
SPRT; statistical process control; UKAS; uncertainty evaluation.
Preprint: Tempmeko 2007 (Presented 22 May 2007)

1. INTRODUCTION
Low uncertainty SPRT calibrations, such as those described as NVLAP accuracy class I [1],
are demanding and complex. Much has been written in an effort to explore the difficulties and
enlighten those interested. Supplying such calibrations in a commercial setting poses many
challenges, particularly if it is the desire of the laboratory to provide calibrations of this
caliber along with world-class customer service. The Hart Scientific Division of the Fluke
Corporation operates two SPRT calibration facilities, one at the Hart Scientific Factory in
Utah, USA, and the other at a service facility in Norwich, UK. Both of these laboratories are
required to calibrate SPRTs to low levels of uncertainty, provide good service to customers,
maintain competitive pricing, and remain profitable. Additionally, these laboratories are
required (by the user base) to maintain accreditation in good standing. Consequently, the
demands of the customer are not the only demands that must be met. Together these
challenges are not insignificant. This paper will detail some of the rational and methods used,
discuss additional measurements and analysis included as part of the calibration as additional
quality measures, and present the uncertainty analysis in an uncertainty budget format.
Consequently, the purpose of this paper is twofold, first, to present the criteria believed by the
author to be necessary for high quality SPRT calibrations and second, to demonstrate that this
standard has been met in the two aforementioned laboratories.
2. CALIBRATION PROCESS
2.1. Calibration Facilities
Both the laboratory in the Utah location and the laboratory in the Norwich location were
purposely built for the calibration of high accuracy thermometers, including SPRTs, noble
metal thermocouples, and reference standard quality PRTs. (In this context, the author is
using the term “reference standard quality PRT” to denote a PRT designed to be used as a
laboratory calibration standard that may or may not meet ITS-90 requirements.) [2] The
laboratory spaces are approximately 55 m2 and temperature controlled at 23 °C ± 2 °C. The
equipment is arranged to facilitate both throughput and safe handling. To the extent possible,
the mains power is split so the measurement instruments can be powered from clean sources
Preprint: Tempmeko 2007 (Presented 22 May 2007)

electrically isolated from the baths, furnaces, and other apparatus, as well as the factories
themselves. The US laboratories is equipped with the all the ITS-90 fixed points, furnaces,
and baths to cover the temperature range from the freezing point of silver to the triple point of
argon, covering all intermediate sub-ranges. Sealed fixed point cells are utilized. A dedicated
furnace, bath, cryostat, or other apparatus exists for each fixed point. A triple point of argon
cell is not used in day-to-day calibrations. Rather, the triple point of argon is approximated to
a low level of uncertainty in a specially built LN2 cryostat. [3] The UK laboratory is similarly
equipped with the exception of the TPAr cell. The LN2 cryostat is utilized exclusively for this
temperature point in the UK laboratory. Both laboratories are equipped with redundant cells
for quality control purposes (described in a companion paper). Each laboratory is equipped
with both AC and DC bridges, reference resistors, DVMs, thermometer readouts, and
associated electronic test equipment to perform the electrical measurements to the required
levels of accuracy. The measurement cabling is designed such that all connections are made
either directly to the measurement instrument or in the vicinity of the cell/furnace system and
then to the measurement instrument through shielded dual twisted pair cable. Finally,
computers are used to control the measurement equipment and collect the data.
2.2. Calibration Procedure
Much has been written describing the calibration and uncertainty analysis of SPRTs.
Procedures vary depending on which particular aspects of the calibration the laboratory
wishes to optimize. For example, procedures have been developed to optimize throughput or
efficiency at the cost of uncertainties. Conversely, procedures have been developed to achieve
the lowest possible uncertainties without regard to throughput or efficiency. As a commercial
supplier of SPRTs and calibrations, it was our desire to develop a calibration procedure that
would provide uncertainties sufficiently low to meet our customer’s needs while maintaining
adequate levels of throughput and efficiency for our laboratory to remain profitable.
Additionally, we felt it was necessary to incorporate quality assurance tests to detect problems
early in the procedure to both eliminate measurements that would have to be repeated and
prevent calibration errors. Finally, it was our desire to use similar procedures for both of our
Preprint: Tempmeko 2007 (Presented 22 May 2007)
laboratories while still allowing ample flexibility to meet the requirements of the accreditation
bodies under which we are accredited.
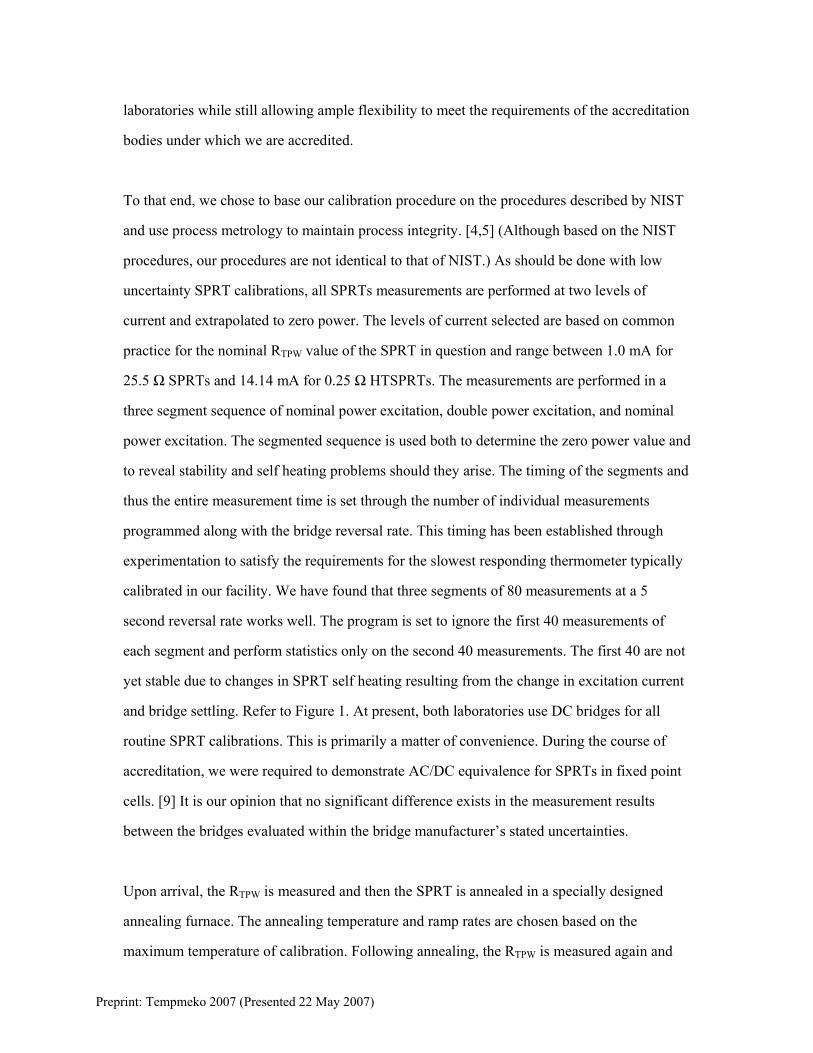
To that end, we chose to base our calibration procedure on the procedures described by NIST
and use process metrology to maintain process integrity. [4,5] (Although based on the NIST
procedures, our procedures are not identical to that of NIST.) As should be done with low
uncertainty SPRT calibrations, all SPRTs measurements are performed at two levels of
current and extrapolated to zero power. The levels of current selected are based on common
practice for the nominal RTPW value of the SPRT in question and range between 1.0 mA for
25.5 Ω SPRTs and 14.14 mA for 0.25 Ω HTSPRTs. The measurements are performed in a
three segment sequence of nominal power excitation, double power excitation, and nominal
power excitation. The segmented sequence is used both to determine the zero power value and
to reveal stability and self heating problems should they arise. The timing of the segments and
thus the entire measurement time is set through the number of individual measurements
programmed along with the bridge reversal rate. This timing has been established through
experimentation to satisfy the requirements for the slowest responding thermometer typically
calibrated in our facility. We have found that three segments of 80 measurements at a 5
second reversal rate works well. The program is set to ignore the first 40 measurements of
each segment and perform statistics only on the second 40 measurements. The first 40 are not
yet stable due to changes in SPRT self heating resulting from the change in excitation current
and bridge settling. Refer to Figure 1. At present, both laboratories use DC bridges for all
routine SPRT calibrations. This is primarily a matter of convenience. During the course of
accreditation, we were required to demonstrate AC/DC equivalence for SPRTs in fixed point
cells. [9] It is our opinion that no significant difference exists in the measurement results
between the bridges evaluated within the bridge manufacturer’s stated uncertainties.
Upon arrival, the RTPW is measured and then the SPRT is annealed in a specially designed
annealing furnace. The annealing temperature and ramp rates are chosen based on the
maximum temperature of calibration. Following annealing, the RTPW is measured again and
Preprint: Tempmeko 2007 (Presented 22 May 2007)

the ΔRTPW is calculated. This process is repeated until the RTPW repeats to within the
resistance equivalent of 0.25 mK, with a maximum of five attempts.
Once stability has been achieved, the calibration process commences starting at the maximum
temperature and proceeding in sequence to the lowest temperature. Each fixed point
measurement is followed by an RTPW measurement. Care is taken to ensure that the RTPW is
measured within a few hours of the preceding fixed point in order to capture the RTPW in the
appropriate oxidation state. Measurements are taken at all fixed points inclusive within the
given range. During the calibration, the RTPW measurements are monitored for stability. The
maximum permissible ΔRTPW is related to the uncertainties desired and varies from the
resistance equivalent of 0.75 mK to 2.0 mK. The resistance equivalent of 0.75 mK indicates
the best possible repeatability expectation for an SPRT and reflects what is considered ideal
behavior [6]. For ΔRTPW performance between 0.75 mK and 2.0 mK, an uncertainty
component termed “Uncertainty due to propagated repeatability of RTPW” is added which is
computed based on the effect of a somewhat unpredictable RTPW on WT90. This was found to
be necessary because a great number of otherwise well performing SPRTs will not satisfy the
0.75 mK RTPW requirement. If the RTPW varies by more than the maximum permitted, the
calibration is halted. In general, if this occurs, the SPRT is re-annealed and the calibration
attempted again. If the stability requirement is exceeded a second time, the customer is
consulted and a decision is made as to how to proceed. Typically, the customer elects to
accept the slightly larger uncertainty resulting from the increased instability. Both laboratories
utilize the same cut-off criteria.
2.3. Process Control
Process metrology is observed throughout the calibration process. The process metrology
philosophy suggests that each calibration measurement is a snapshot of an event that exists
within a series of measurements. As such, observation and evaluation of the series will
provide insight into the process. Statistical quantification of these measurements will provide
additional variables for consideration in the uncertainty evaluation. To this end, the
Preprint: Tempmeko 2007 (Presented 22 May 2007)

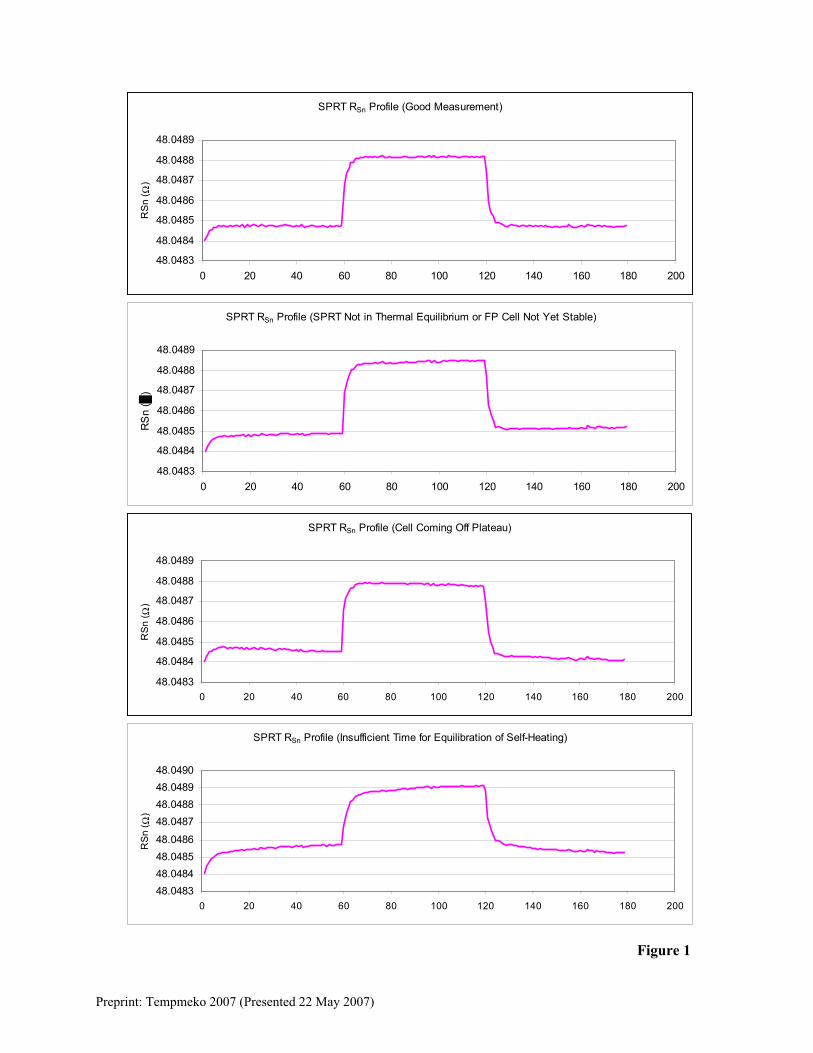
calibration process is kept in a state of statistical process control. At the onset of cell
realization and at the conclusion of the use of the plateau, a dedicated “check standard” SPRT
is inserted into the fixed point cell and measured. Immediately following these measurements,
the RTPW is determined and a pair of WT90 values are calculated and plotted. Two check
statistics are computed from these measurements and used either to accept or reject the day’s
work, and as variables in the uncertainty evaluation. The check statistics reflect the status of
the entire measurement process, including fixed point cell, SPRT, measurement system,
realization method, and metrologist. In the event of an out-of-limits condition, the work is
repeated the following day. The check statistics limits have been set at 2σ. All fixed point
cells are monitored and evaluated in this manner without exception. Refer to Figure 2 for
examples.
2.4. Additional Measurement Process Checks
In addition to the repeatability of the calibration process, proper fixed point measurements
involve other variables which require evaluation. To this end, NVLAP has created a list with
additional measurements that are required prior to successful accreditation. The list is
contained in NVLAP Lab Bulletin LB-10-2004 (revised in February 2007) [7]. This document
describes the three tier proficiency test criteria as well as the additional tests and information
required during the assessment. The list contains the following: 1) fixed point cell sample
purity analysis, 2) fixed point cell phase transition repeatability (n ≥ 10) (demonstrated
through process control graphs described above), 3) heat flux measurements while on plateau,
demonstrating acceptable thermal equilibrium, 4) fixed point cell phase transition curves
(entire curves for each cell), 5) measurement system repeatability, 6) bridge linearity, and 7)
and measurement in redundant fixed points. Additionally, for tiers one and two, the fixed
point cells themselves were required to be tested traceable to NIST (or other NMI). Refer to
Figure 3 for examples of some of these tests performed internally on working cells. Although
these requirements apply specifically to the U.S. laboratory, they amount to prudent
laboratory practice for high accuracy fixed point measurements and were recommended by
NIST well before Hart Scientific was contemplating accreditation. As a result, these
Preprint: Tempmeko 2007 (Presented 22 May 2007)

additional measurements were undertaken in our Norwich facility even though UKAS did not
explicitly require it.
As described above, the calibration procedure provides for one set of measurements at each
fixed point from highest to lowest. This calibration process is designed to capture and expose
any instability or misbehaviour of the SPRT undergoing calibration. Process repeatability (as
demonstrated by the check standard statistics) along with the RTPW stability (observed
throughout the calibration process) are intended to quantify the repeatability of the normal
SPRT. However, the opinion among some SPRT calibration specialists exists that some
demonstration of repeatability at temperatures other than the triple point of water is necessary.
To this end, for calibrations up to the freezing point of aluminium or zinc, the Norwich
facility is required by UKAS to perform duplicate WT90 determinations at whichever of these
points constitutes the termination point of the calibration. Consequently, a set of data has been
collected demonstrating the SPRT repeatability of WAl and WZn. No clear acceptability
criterion has been established by UKAS. The data are shown in Figure 4. Note the standard
deviation of the data is very close to the process repeatability as evaluated by the check
standard for the freezing points of aluminium and zinc. Since both of these sets of
measurements are intended to demonstrate SPRT repeatability, one can conclude that the
process repeatability variable captured by the check standard is an acceptable model for
individual SPRT repeatability.
Much work has been done in the thermometry community to investigate and reveal non-
uniqueness (subrange inconsistencies) present in the ITS-90. [8, 9] As a result of this work,
expectations as to a particular SPRT’s subrange inconsistencies can be formed. As a further
quality control measure, the calibration procedure requires WT90 determinations at all fixed
points inclusive with the range of calibration. The difference between the computed WT90 and
the measured WT90 is a combination of calibration error and non-uniqueness for the subject
SPRT. If the values exceed expectations, the calibration may be repeated. Some data are
shown in Figure 5.
Preprint: Tempmeko 2007 (Presented 22 May 2007)

Finally, the WT90 relationship between defining fixed points for a given family [10] of SPRTs
(SPRT designs or models) has been demonstrated and documented. Although not conclusive,
this relationship can be viewed as a set of expected behaviour characteristics for the subject
SPRT. With this in mind, these relationships are evaluated for the subject SPRT as it
compares to the SPRT family to which it belongs. The information gained is used both as a
quality control measure and as an indication that characteristics me be changing among the
family. This check does not constitute pass/fail criteria. However, if the observed values do
not meet expectations, the calibration may be repeated.
2.5. Uncertainty Evaluation and Discussion
Uncertainty evaluation for fixed point calibrations has been given much attention in the
literature. Additionally, the NVLAP Lab Bulletin previously mentioned includes a list of
uncertainty components which require evaluation for laboratories seeking NVLAP
accreditation for ITS-90 fixed point cells for SPRT calibrations. Consequently, the author has
little to add to the information presently available. As a result, the uncertainty evaluation for
the US facility is presented in Table I without elaboration. The uncertainty evaluation for the
Norwich facility is essentially identical. The differences pertain primarily to the number of
samples (the Norwich facility has fewer due to lower volume and recent history) and the
quality of the electrical measurements (the Norwich facility experiences superior noise results
due to the newer test equipment and the unique mains wiring scheme).
3. CONCLUSIONS AND FUTURE DIRECTION
It has been shown that low uncertainty SPRT calibrations in a commercial laboratory setting
can be attained through rigorous consideration of the challenges presented to the metrologist
and careful execution of calibration methods. Much of the information required is available in
the literature. The balance can be obtained through communication with peers, experienced
insight, and investigation with the laboratory itself. Finally, sufficient structure exists with the
Preprint: Tempmeko 2007 (Presented 22 May 2007)

ITS-90 and among the instruments being calibrated to improve the quality of the result
through redundant measurements and consideration of the relationships among instruments.
Two clear directions for improvement are suggested. First, to continue the investigation into
SPRT family relationships in an effort to establish pass/fail criteria and, second, to investigate
the bias indicated by the calibration error and subrange inconsistency data at the freezing
point of indium. Finally, in an effort to improve the efficiency of the laboratories, much effort
is being expended to further automate the collection, collation, and evaluation of calibration
data.
ACKNOWLEDGMENTS
The author would like to thank Mike Coleman and Tom Harper for assistance in evaluating
the data and Ron Ainsworth for his invaluable assistance in theoretical and philosophical
discussions regarding SPRT calibrations. Additionally, both Greg Strouse of NIST and
Maurice Chattle of UKAS have been extremely helpful over the years in providing guidance
in formulating good practice in SPRT and fixed point work.
Preprint: Tempmeko 2007 (Presented 22 May 2007)

REFERENCES
1. C.D. Faison and C.S. Brickencamp, editors, NIST Handbook 150-2H, Calibration
Laboratories Technical Guide for Thermodynamic Measurements
2. M. Zhao, X. Li, and D. Chen, National Conference of Standards Laboratories (2000), A
High Quality Platinum Resistance Thermometer to 661 °C.
3. T. Wiandt, in 8th International Symposium on Temperature and Thermal Measurements
in Industry and Science, Vol. 2, B. Fellmuth, J. Seidel, G. Scholz, ed. (VDE VERLAG
GMBH, 2001), pp.789-794.
4. G.F. Strouse, in Temperature: Its Measurement and Control in Science and Industry,
Vol. 6, Part 1, J. F. Schooley, ed. (AIP, New York, 1992), pp. 169-174.
5. B.W. Mangum, G.T. Furukawa, C.W. Meyer, G.f. Strouse, and W.L. Tew, in 6th
International Symposium on Temperature and Thermal Measurements in Industry and
Science, P. Marcarino, ed. (Levrotto & Bella – Torino 1996), pp. 33-38.
6. G.F. Strouse, in Temperature: Its Measurement and Control in Science and Industry,
Vol. 7, Part 2, D.C. Ripple, ed. (AIP, New York, 2003), pp. 879-884.
7. NVLAP Lab Bulletin LB-10-2004 Thermometry Proficiency Tests (2007).
8. G.F. Strouse, in Temperature: Its Measurement and Control in Science and Industry,
Vol. 6, Part 1, J. F. Schooley, ed. (AIP, New York, 1992), pp. 165-178.
9. K.D. Hill and A.G. Steele, in Temperature: Its Measurement and Control in Science and
Industry, Vol. 7, Part 1, D.C. Ripple, ed. (AIP, New York, 2003), pp. 53-58.
10. R.E. Ainsworth, in Temperature: Its Measurement and Control in Science and Industry,
Vol. 7, Part 1, D.C. Ripple, ed. (AIP, New York, 2003), pp. 423-427.
Preprint: Tempmeko 2007 (Presented 22 May 2007)

Table I. SPRT Calibration Uncertainty Budget for calibration at the ITS-90 Fixed
Points for the US Facility
Uncertainty Evaluation
Type A Evaluation Code LN2 Hg TPW MPGa FPIn FPSn FPZn FPAl FPAgmK mK mK mK mK mK mK mK mK
Process variability as observed by check standard SPRT A1 0.270 0.080 0.070 0.100 0.160 0.260 0.350 0.550 2.087Precision of measurement (procedure limit n = 40) A2 0.024 0.010 0.013 0.014 0.021 0.026 0.037 0.053 0.075
Total A A 0.27 0.08 0.07 0.10 0.16 0.26 0.35 0.55 2.09n 227 343 171 73 65 452 513 46 13
Type B EvaluationUncertainty in fixed point value (reference cell certification) B1 0.087 0.100 0.035 0.040 0.250 0.300 0.400 0.750 1.750Uncertainty in SPRT self-heating correction B2 0.006 0.006 0.006 0.006 0.012 0.012 0.012 0.012 0.017Uncertainty in hydrostatic head correction B3 0.021 0.021 0.006 0.003 0.010 0.006 0.008 0.005 0.016Uncertainty due to non-ideal immersion profile B4 0.087 0.009 0.003 0.001 0.003 0.002 0.014 0.014 0.144Uncertainty due to Rtpw propagation B5 0.021 0.085 0.000 0.112 0.161 0.189 0.257 0.338 0.429Uncertainty due to shunt losses B6 0.000 0.000 0.000 0.000 0.000 0.000 0.000 0.000 0.000Uncertainty due to bridge nonlinearity B7 0.003 0.012 0.014 0.016 0.024 0.029 0.042 0.061 0.087Uncertainty due to reference resistor instability during process B8 0.003 0.012 0.014 0.016 0.024 0.029 0.042 0.061 0.087
Total B B 0.13 0.13 0.04 0.12 0.30 0.36 0.48 0.83 1.81
Total Standard Uncertainty U 0.30 0.16 0.08 0.16 0.34 0.44 0.59 0.99 2.76
Total Expanded Uncertainty (k =2) U' 0.60 0.31 0.16 0.32 0.68 0.89 1.19 1.99 5.53
Notes:1) The actual error (ΔT) in the reference cell temperature is not included because the data is corrected during use of the cell. The uncertainty in the correction is included in the uncertainty value shown.
2) All uncertainties are shown as standard uncertainties based on an assumed probability distribution. The distribution assumed is discussed in the "Code" section on page 2.
Preprint: Tempmeko 2007 (Presented 22 May 2007)
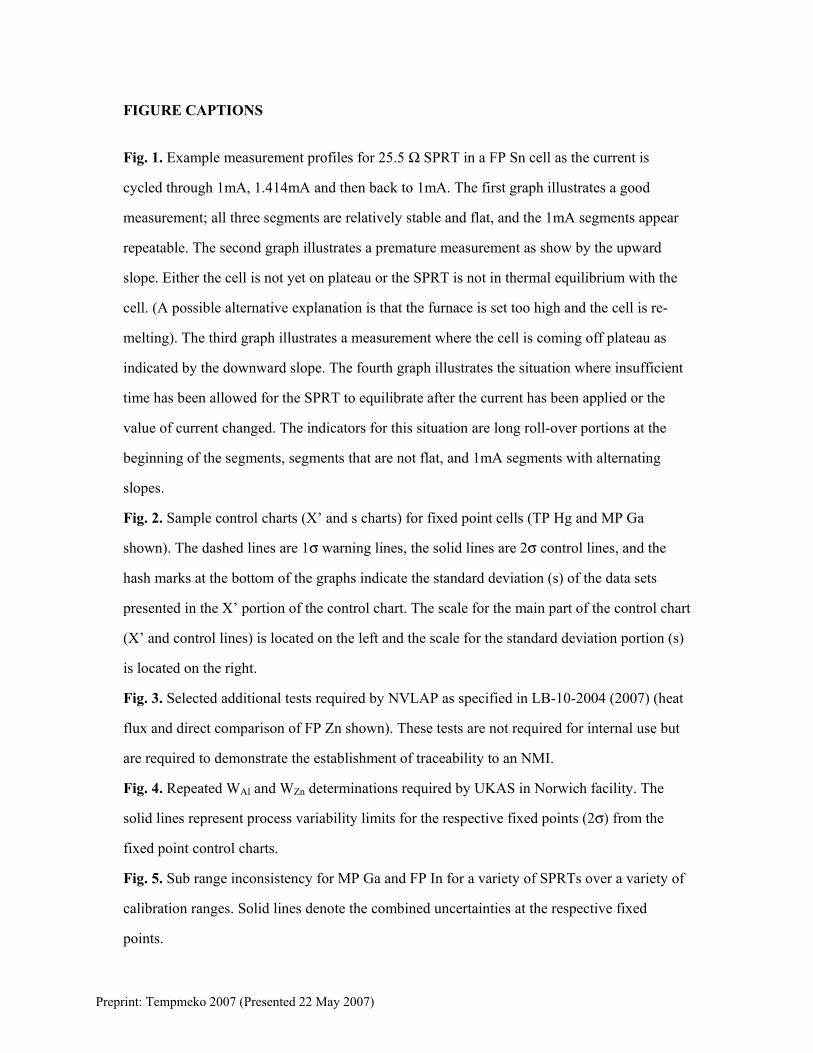
FIGURE CAPTIONS
Fig. 1. Example measurement profiles for 25.5 Ω SPRT in a FP Sn cell as the current is
cycled through 1mA, 1.414mA and then back to 1mA. The first graph illustrates a good
measurement; all three segments are relatively stable and flat, and the 1mA segments appear
repeatable. The second graph illustrates a premature measurement as show by the upward
slope. Either the cell is not yet on plateau or the SPRT is not in thermal equilibrium with the
cell. (A possible alternative explanation is that the furnace is set too high and the cell is re-
melting). The third graph illustrates a measurement where the cell is coming off plateau as
indicated by the downward slope. The fourth graph illustrates the situation where insufficient
time has been allowed for the SPRT to equilibrate after the current has been applied or the
value of current changed. The indicators for this situation are long roll-over portions at the
beginning of the segments, segments that are not flat, and 1mA segments with alternating
slopes.
Fig. 2. Sample control charts (X’ and s charts) for fixed point cells (TP Hg and MP Ga
shown). The dashed lines are 1σ warning lines, the solid lines are 2σ control lines, and the
hash marks at the bottom of the graphs indicate the standard deviation (s) of the data sets
presented in the X’ portion of the control chart. The scale for the main part of the control chart
(X’ and control lines) is located on the left and the scale for the standard deviation portion (s)
is located on the right.
Fig. 3. Selected additional tests required by NVLAP as specified in LB-10-2004 (2007) (heat
flux and direct comparison of FP Zn shown). These tests are not required for internal use but
are required to demonstrate the establishment of traceability to an NMI.
Fig. 4. Repeated WAl and WZn determinations required by UKAS in Norwich facility. The
solid lines represent process variability limits for the respective fixed points (2σ) from the
fixed point control charts.
Fig. 5. Sub range inconsistency for MP Ga and FP In for a variety of SPRTs over a variety of
calibration ranges. Solid lines denote the combined uncertainties at the respective fixed
points.
Preprint: Tempmeko 2007 (Presented 22 May 2007)
SPRT RSn Profile (Good Measurement)
48.0483
48.0484
48.0485
48.0486
48.0487
48.0488
48.0489
0 20 40 60 80 100 120 140 160 180 200
RSn
( Ω)
SPRT RSn Profile (SPRT Not in Thermal Equilibrium or FP Cell Not Yet Stable)
48.0483
48.0484
48.0485
48.0486
48.0487
48.0488
48.0489
0 20 40 60 80 100 120 140 160 180 200
RS
n (
)
SPRT RSn Profile (Cell Coming Off Plateau)
48.0483
48.0484
48.0485
48.0486
48.0487
48.0488
48.0489
0 20 40 60 80 100 120 140 160 180 200
RSn
( Ω)
SPRT RSn Profile (Insufficient Time for Equilibration of Self-Heating)
48.048348.048448.048548.0486
48.048748.048848.048948.0490
0 20 40 60 80 100 120 140 160 180 200
RS
n ( Ω
)
Figure 1
Preprint: Tempmeko 2007 (Presented 22 May 2007)
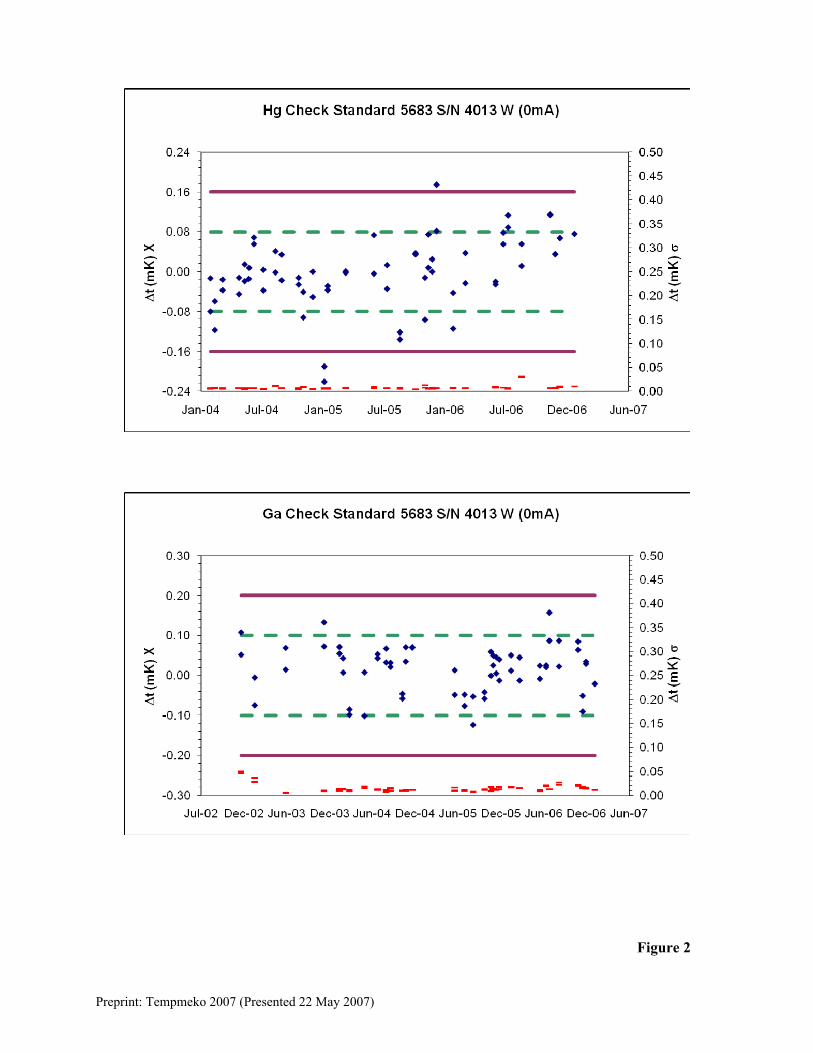
Figure 2
Preprint: Tempmeko 2007 (Presented 22 May 2007)

Figure 3
Preprint: Tempmeko 2007 (Presented 22 May 2007)
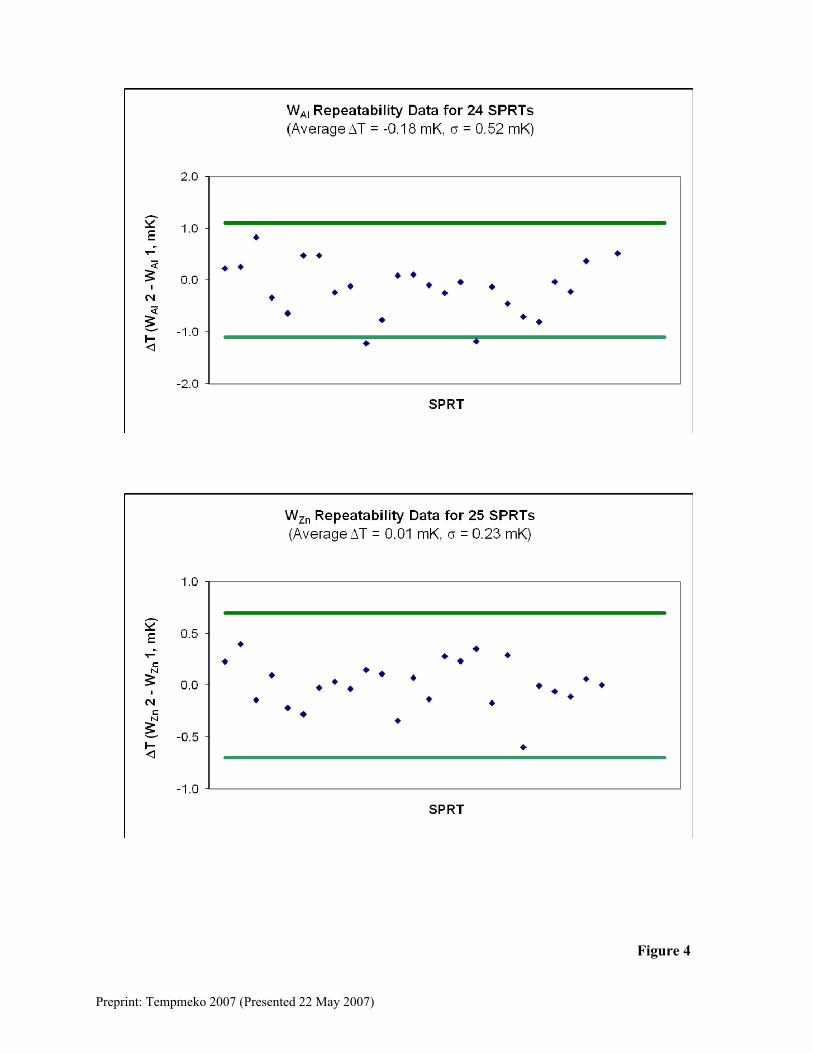
Figure 4
Preprint: Tempmeko 2007 (Presented 22 May 2007)

Figure 5
Preprint: Tempmeko 2007 (Presented 22 May 2007)