sputnik user manual -...
TRANSCRIPT

1
Sputnik User Manual
Environment scan is designed to record time dynamic of different processes using Bio-Well with connected supplement:
Sputnik sensor
GETTING STARTED .................................................................................................................1
ENVIRONMENT SCAN .............................................................................................................2
ENVIRONMENT SCAN RESULTS ...............................................................................................4
VIEW FEATURES .....................................................................................................................4
ANALYZE RESULTS ..................................................................................................................6
UNDERSTANDING RESULTS ....................................................................................................8
TESTING WATER ................................................................................................................... 10
GETTING STARTED Sputnik Overview
Sputnik is a special sensor and accompanying attachments that affix to your
Bio-Well device that will allow you to perform a Environment Scan. In order to
conduct these scans, you must have the Bio-Well device and a Bio-Well
Subscription Plus (or above) subscription. For more information on
subscriptions, visit www.Bio-Well.com.
Environment scans for experienced users with a solid understanding of GDV
Technique.

2
When Sputnik is ordered, you will receive
the following items:
- Sputnik Sensor
- Titanium Cylinder holder
- Bio-Well stand
- Grounding Cable
ENVIRONMENT SCAN
Setting up Sputnik
To conduct an Environment Scan, you will use the following items:
- Bio-Well Device
- USB Cable
- Bio-Well Software
- Sputnik Sensor
- Titanium Cylinder
Caution: The Sputnik sensor contains very sharp edges. Handle with care and
keep out of the reach of children at all times.
1. To connect your Bio-Well device to your computer, connect one end of
the USB cable to the back of the Bio-Well device where the USB icon is
indicated. Connect the opposite end of the USB cable to a computer.
2. Clean the optical lens with a cloth (you may use alcohol).
3. Carefully place thin glass plate in the middle of the optical lens.
4. Next, insert the Titanium Cylinder Insert into the lens window on the
front of the device. Be sure to first remove the Finger Insert from the lens
window. To remove the Titanium Cylinder Insert, gently press down on
the bottom, outer edge of the Finger Insert and gently pull outward,
taking care not to scratch the lens.
5. Position Bio-Well on a stand.

3
6. Connect the end of the Sputnik Sensor to the Titanium Cylinder Insert.
Conducting an Environment Scan
1. In the software navigation, select Environment.
2. Click Start. The system will begin taking a series of test
images automatically. A successful test will display a ring
(similar to the image of a finger scan). In case of distorted
images, check the Titanium cylinder holder position. (Move it up and
down gently).
3. Click Start and wait for three minutes and thirty seconds while the graph
line stabilizes.
4. Once the graph indicates the background data has been collected, the
Add Label button will illuminate. Add labels as needed to indicate shifting
events within the environment (e.g. yoga, meditation, etc.)
5. Allow for the scan to run for a minimum of thirty minutes for accurate
results. You can run the scan for as long as you wish. Once finished, click
Stop.
4
Environment Scan Results What it Shows
The Environment Scan view shows the energy shifts of an environment
measured as five parameters:
1. Area: shows the amount of light photons emitted from environment to
Sputnik sensor.
2. Intensity: shows the intensity of the emission from each photon.
3. Energy: shows the level of energy of the light emitted from environment to
Sputnik sensor.
4. Deviation E: measures the level of non-uniformity of the area graph curve.
5. Deviation S: measures the level of non-uniformity of the energy graph curve.
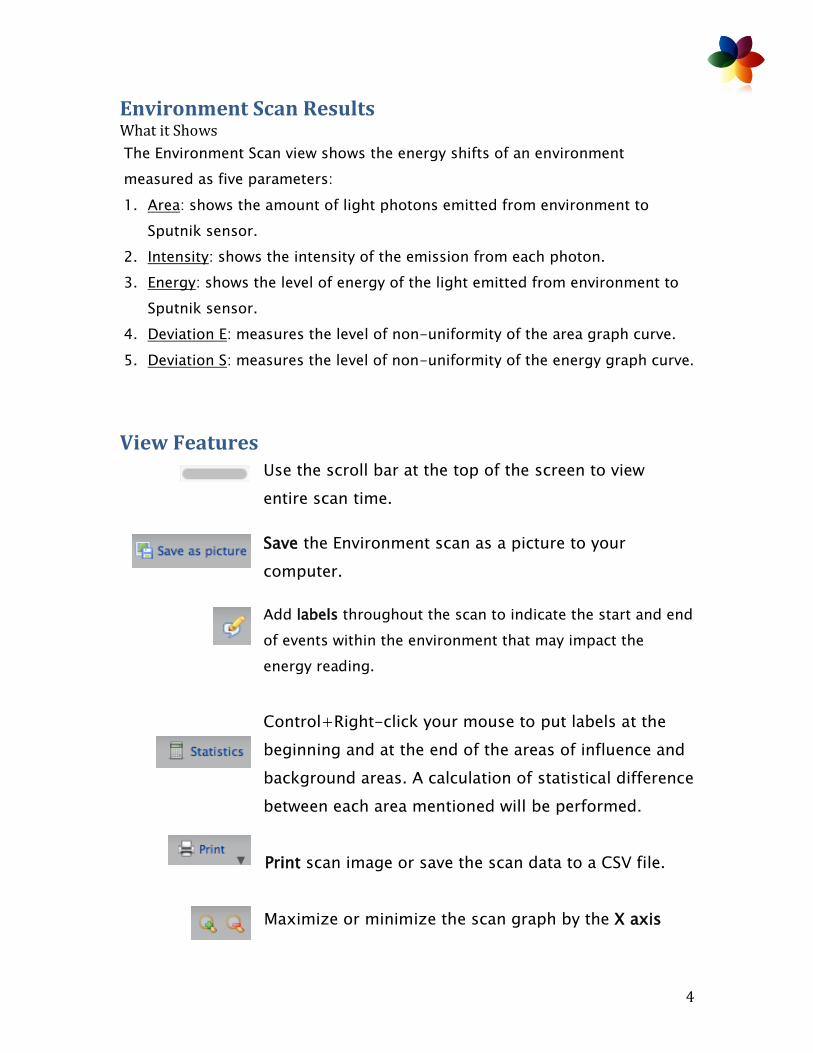
View Features Use the scroll bar at the top of the screen to view
entire scan time.
Save the Environment scan as a picture to your
computer.
Add labels throughout the scan to indicate the start and end
of events within the environment that may impact the
energy reading.
Control+Right-click your mouse to put labels at the
beginning and at the end of the areas of influence and
background areas. A calculation of statistical difference
between each area mentioned will be performed.
Print scan image or save the scan data to a CSV file.
Maximize or minimize the scan graph by the X axis

5
(time).
Maximize or minimize the scan graph by the Y axis
(energy).
Use the To Beginning, Next, Previous, To End buttons
to navigate through various time frames.
Use the Preferences option to select graph colors and
plot parameters to customize your graph.
Select which of the five available parameter views
you’d like to view for each scan.

6
Analyze Results Press Statistics and you will see a new screen.
Right-click your mouse to put labels at the beginning and at the end of the areas
of influence and background areas.
To evaluate significance of your data add labels every 5, 10 or 15 minutes
depending on the time of your recording. You may leave or correct previously
inserted labels.

7
Press Calculate button and you will see the screen with analysis.
A calculation of statistical difference between each lavelled area will be
performed.
Save, Print graphs or save the scan data to a CSV file at the main screen.
8
Understanding Results
In analysis we pay attention to three main parameters:
o Area;
o Energy;
o Deviation of Area.
In many cases in the background recording we detect decrease (very rare
increase) of parameters during 15-30 minutes, even longer. It is related to
the interaction of a Sputnik sensor with environment. That is why we
recommend to take measurements for at least half an hour, or longer,
when possible.
Before recording an important event you need to record background signal
without any disturbances for at least half an hour or longer.
Environment parameters have their level of variation. In a calm
environment variation of parameter have the following levels:
o Area 5%- < 10%
o Energy < 10%
o Deviation S < 20%
If you see much higher variations, this is an indication of turbulent
processes in the environment. This may be an indication of High Energy
places or changes in weather or geophysical conditions.
During efficient meditation or other energy practice you may detect strong
variations of parameters (please see some examples below). Depending
on the character of the event variations may be detected for one of the
parameters (Area or Energy, or Deviation) or for all of the parameters. In
any case to be considered significant variations should be stronger then
mentioned above levels.

9
Example 1. At these graphs you may see time lines of parameters before and
in the process of Mantra meditation by Jonni Pollard. We can see clear
reflection of the meditation process (marked by the red line) for all the
parameters.
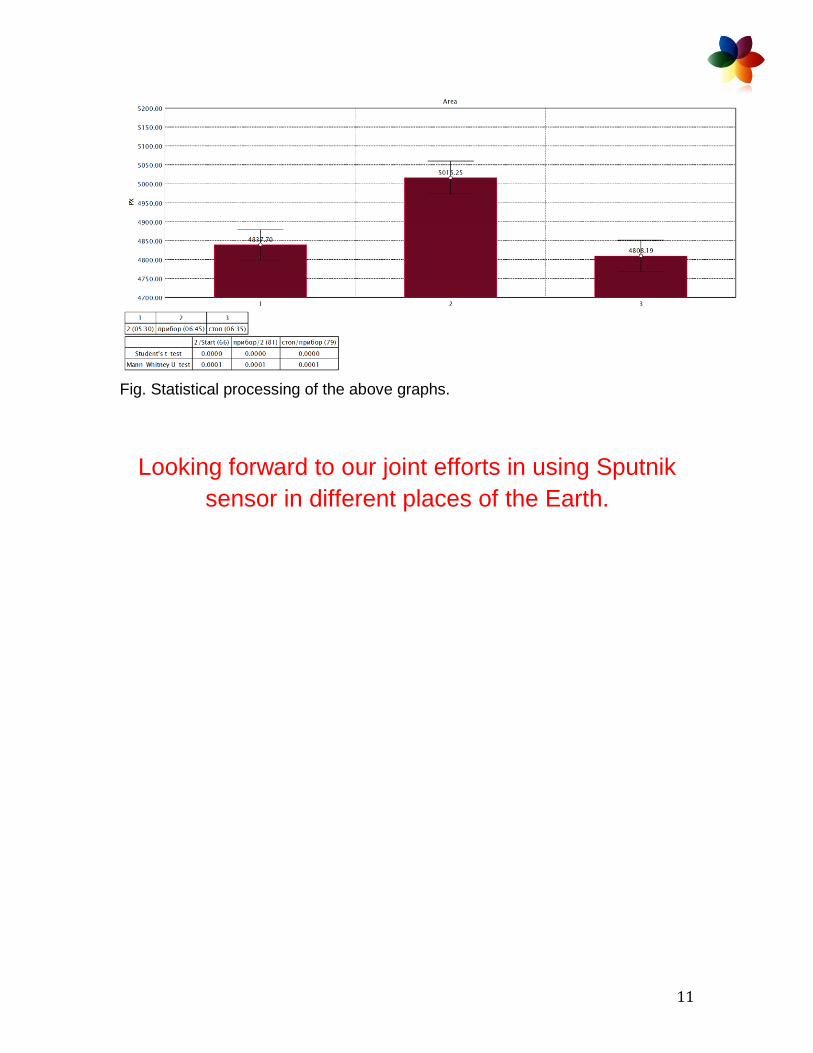
Example 2. Statistical processing of Area recorded during Joe Dispenza workshop.
Numbers at X axis indicate intervals labeled every 10 minutes. We can see significant
decrease of parameters during meditation.
The level of parameters will be different for different places and energy conditions at the
given moment. In our experiments we did not record the value of energy higher than
4*10-4 Joules. For one and the same place this value depends on the atmospheric
conditions and moon phase. We need to collect more data to establish numeric criteria.

10
Testing Water
Insert standard Pt water electrode into water or other liquid and connect it to the
Ti cylinder.
Take dynamic readings of water as described above.
Analyze time dynamic process of water and see its intercommunication with
environment.
When water dynamics becomes stable, you may check the influence to water
from different devices and human intention. See example below.
Fig. Example of water dynamics with the influence from imprinted device (marked
by arrows).
11
Fig. Statistical processing of the above graphs.
Looking forward to our joint efforts in using Sputnik
sensor in different places of the Earth.