sputter coated hydroxyapatite thin films to increase...
TRANSCRIPT

THESIS
SPUTTER DEPOSITED HYDROXYAPATITE THIN FILMS TO ENHANCE OSSEOINTEGRATION
Submitted by
Nicholas Alfred Riedel
Department of Mechanical Engineering
In partial fulfillment of the requirements
For the Degree of Master of Science
Colorado State University
Fort Collins, Colorado
Spring 2010

ii
COLORADO STATE UNIVERSITY
March 11th, 2010 WE HEREBY RECOMMEND THAT THE THESIS PREPARED UNDER OUR SUPERVISION BY
NICHOLAS ALFRED RIEDEL ENTITLED SPUTTER DEPOSITED HYDROXYAPATITE THIN FILMS TO
ENHANCE OSSEOINTEGRATION BE ACCEPTED AS FULFILLING IN PART REQUIREMENTS FOR THE
DEGREE OF MASTER OF SCIENCE.
Committee on Graduate Work
_________________________________________
Amy Prieto
_________________________________________
Advisor: John Williams
_________________________________________
Co-Advisor: Ketul Popat
_________________________________________
Department Head: Allan Kirkpatrick

iii
ABSTRACT OF THESIS
SPUTTER COATED HYDROXYAPATITE THIN FILMS TO INCREASE OSSEOINTEGRATION
As the demand for hip and knee replacements continues to grow, researchers look to increase the
operational lifetimes of these implants. Many of these implants fail as a result of aseptic loosening caused
from repeated loading of these joints. It is thought that implant life could be extended by improving the
interface between the implant and natural tissue. To this effect, hydroxyapatite coatings have been
demonstrated to improve implant to bone bonding and allow a more natural integration of the metallic
substrates. This work explores the potential of using ion beam etching and sputter deposition to produce
a hydroxyapatite thin film with a unique surface topography that would potentially enhance
osseointegration.
First, the effects of ion etching bare titanium were evaluated. Three ion energies (300 eV, 700 eV, and
1100 eV) were used to etch either as-received or polished substrates. Topographical changes were
examined by scanning electron microscopy. Rat mesenchymal stem cells were differentiated to
osteoblasts to test the biocompatibility of the surfaces with bone cells. It was found that ion etching the
titanium increases cellular activity, and an ion energy of 700 eV appears to create the most beneficial
topography.
Hydroxyapatite thin films were then sputter deposited on titanium substrates etched at 700 eV. After
the coatings were deposited, some of the hydroxyapatite films were re-etched in efforts to induce a
unique topography. It was found that the hydroxyapatite coatings improved short term cell response but
degraded over the course of the culture. Further investigation showed the as-sputtered coatings were
amorphous.

iv
To prevent degradation of the coatings, annealed films were then prepared by heat treating at 600 0C
for 2 hours. X-ray diffraction was used to confirm the presence of a crystalline hydroxyapatite phase. Films
were immersed in culture media for four weeks, showing no signs of degradation. Ion etching performed
on the substrates post annealing yielded a unique topography in the hydroxyapatite film.
A final study was conducted evaluating the MSC response to the annealed and post-anneal etched
films. It was found that the post-anneal etched hydroxyapatite coating had the highest cellular activity,
indicating that this preparation may be an effective means to enhance osseointegration on medical
implants.
Nicholas Alfred Riedel Department of Mechanical Engineering
Colorado State University Fort Collins, CO 80523
Spring 2010

v
ACKNOWLEDGMENTS
It is a pleasure to thank the many people who made this thesis possible. First and foremost I would
like to thank my parents Tom and Cindy Riedel for the love and support they have provided over the
course of my entire life. Words cannot express my gratitude. I am also greatly indebted to the remainder
of my family; particularly my grandparents Al and Ann Riedel, and Clem and Jan Kalthoff for their
encouragements in all my academic pursuits.
I wish to express my thanks to my advisor, Dr. John Williams, for allowing me to work in his
laboratory and for his contagious enthusiasm for knowledge. His insight and guidance into the world of
ion beam processing made this paper possible. Equally important were the contributions of my co-
advisor, Dr. Ketul Popat. I would like to thank Dr. Popat for the use of his laboratory and the direction he
has provided into the world of biomaterials and cell culture.
I would also like to thank Dr. Amy Prieto for taking time from her busy schedule to review this thesis
and serve as a committee member.
A great deal of thanks is also deserved by the many colleagues that have supported my work. I would
like to show my appreciation to Dr. Casey Farnell and Dr. Cody Farnell for answering any number of
questions I had related to vacuum chambers and the sputtering process. Many thanks also go out to Daisy
Williams, for her ideas and contributions with experiment set-up and equipment maintenance. I also
appreciate the assistance provided by Tim Ruckh with the cell cultures. My thanks go out to David Prawel
for his help in obtaining XRD data on the hydroxyapatite films. I also wish to recognize the efforts of the
individuals on the senior design team I had the pleasure of working with during the collection of some of
this data. This included: Ross Bulkley, Zach Glueckert, Nathan Miller, Nathan Trujillo, and Kevin Wills.
Finally I wish to thank my friends for all the emotional support, camaraderie, entertainment, and
caring they provided. I would especially like to thank my adopted brothers Nick Weaver, Nathan Werner,
Sam Bechara, and Eric Lum, without whom I’d be lost.

vi
TABLE OF CONTENTS Introduction..................................................................................................................................................... 1
Materials and Methods ................................................................................................................................... 5
Ion Beam Etching ......................................................................................................................................... 6
Sputter Coating............................................................................................................................................ 8
Etched Titanium Substrate Evaluation ........................................................................................................ 9
Hydroxyapatite Substrate Evaluation ........................................................................................................ 10
Annealing Study ......................................................................................................................................... 12
Annealed Hydroxyapatite Substrate Evaluation........................................................................................ 13
Biological Characterization ........................................................................................................................ 14
Short Term Cell Response ...................................................................................................................... 16
Long Term Cell Response ....................................................................................................................... 16
Results and Discussion .................................................................................................................................. 18
Ion Beam Etching ....................................................................................................................................... 18
Etched Titanium Substrate Evaluation ...................................................................................................... 18
Short Term Cell Response ...................................................................................................................... 22
Long Term Cell Response ....................................................................................................................... 29
Discussion .............................................................................................................................................. 33
Hydroxyapatite Substrate Evaluation ........................................................................................................ 34
Short Term Cell Response ...................................................................................................................... 37
Long Term Cell Response ....................................................................................................................... 39
Discussion .............................................................................................................................................. 41
Annealing Study ......................................................................................................................................... 43
Annealed Hydroxyapatite Substrate Evaluation........................................................................................ 51
Short Term Cell Response ...................................................................................................................... 51
Long Term Cell Response ....................................................................................................................... 55
Discussion .............................................................................................................................................. 59
Conclusions.................................................................................................................................................... 60
Works Cited ................................................................................................................................................... 62

vii
LIST OF TABLES
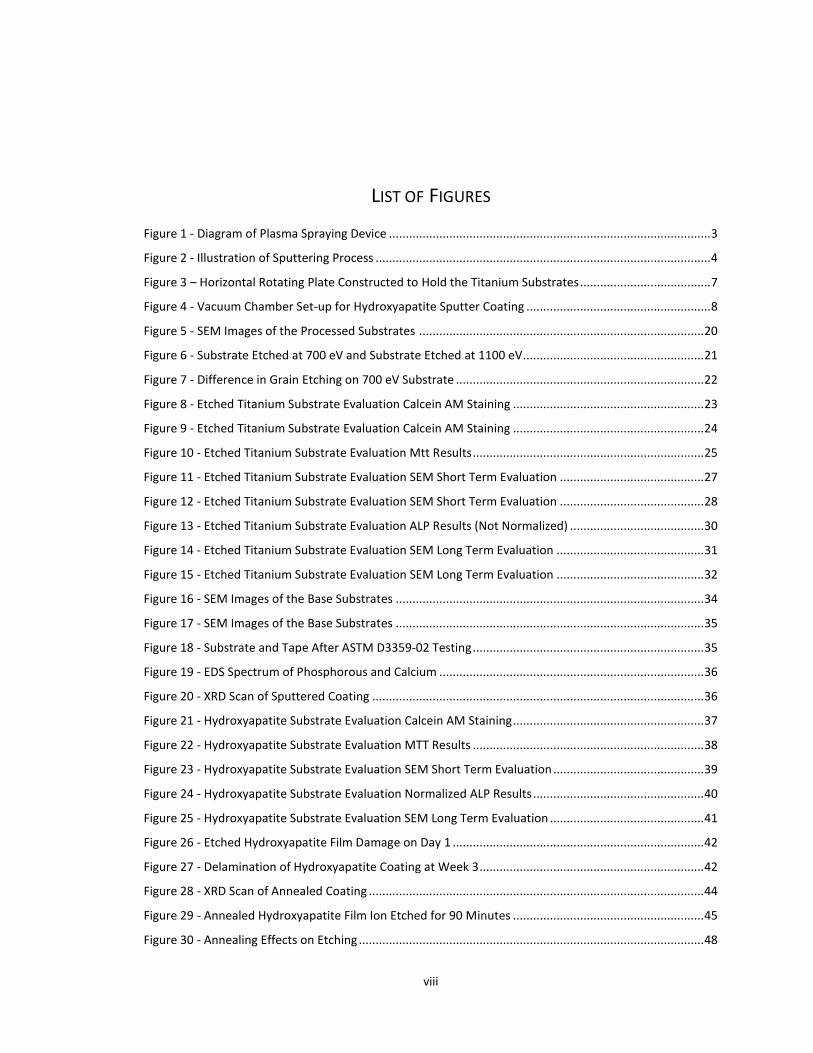
Table 1 - Properties of Commercially Available Hydroxyapatite Coatings ...................................................... 2
Table 2 - Etched Titanium Substrate Labeling ............................................................................................... 10
Table 3 - Hydroxyapatite Substrate Evaluation Labeling ............................................................................... 11
Table 4 - Substrates Used in Degradation Testing......................................................................................... 13
Table 5 - Annealed Hydroxyapatite Substrate Evaluation Labeling .............................................................. 13
Table 6 - Calculated Etch Rates ..................................................................................................................... 18
viii
LIST OF FIGURES
Figure 1 - Diagram of Plasma Spraying Device ................................................................................................ 3
Figure 2 - Illustration of Sputtering Process .................................................................................................... 4
Figure 3 – Horizontal Rotating Plate Constructed to Hold the Titanium Substrates ....................................... 7
Figure 4 - Vacuum Chamber Set-up for Hydroxyapatite Sputter Coating ....................................................... 8
Figure 5 - SEM Images of the Processed Substrates ..................................................................................... 20
Figure 6 - Substrate Etched at 700 eV and Substrate Etched at 1100 eV ...................................................... 21
Figure 7 - Difference in Grain Etching on 700 eV Substrate .......................................................................... 22
Figure 8 - Etched Titanium Substrate Evaluation Calcein AM Staining ......................................................... 23
Figure 9 - Etched Titanium Substrate Evaluation Calcein AM Staining ......................................................... 24
Figure 10 - Etched Titanium Substrate Evaluation Mtt Results ..................................................................... 25
Figure 11 - Etched Titanium Substrate Evaluation SEM Short Term Evaluation ........................................... 27
Figure 12 - Etched Titanium Substrate Evaluation SEM Short Term Evaluation ........................................... 28
Figure 13 - Etched Titanium Substrate Evaluation ALP Results (Not Normalized) ........................................ 30
Figure 14 - Etched Titanium Substrate Evaluation SEM Long Term Evaluation ............................................ 31
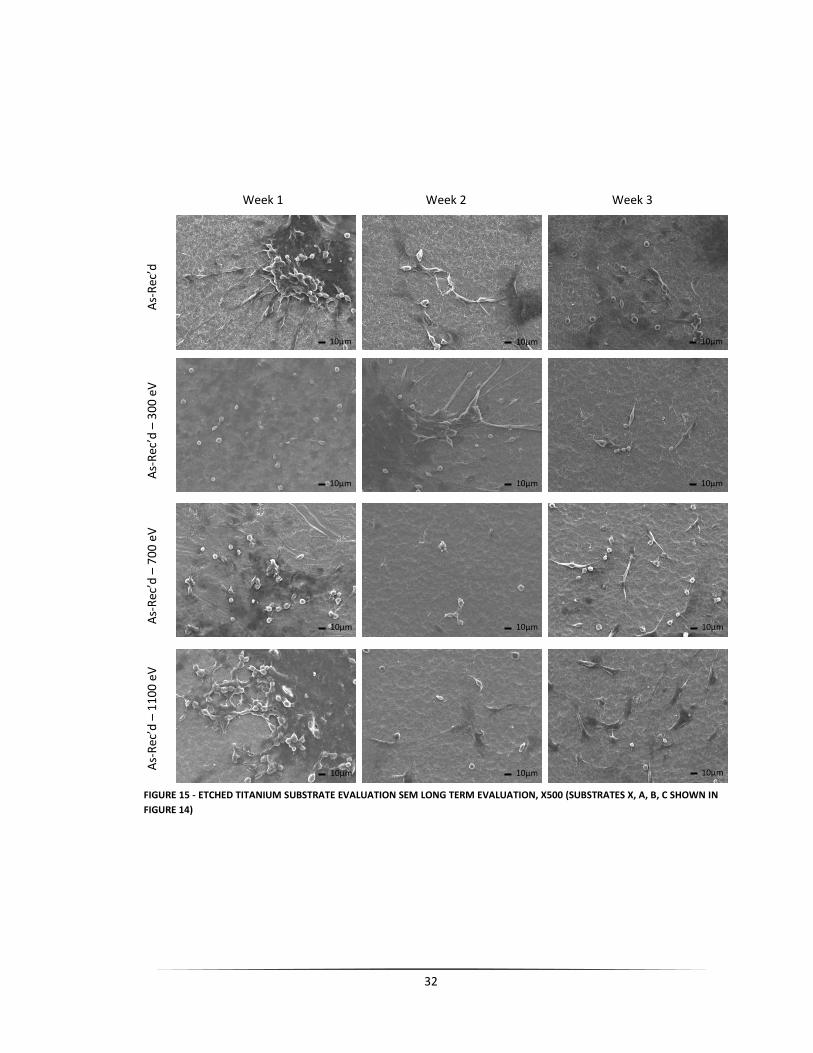
Figure 15 - Etched Titanium Substrate Evaluation SEM Long Term Evaluation ............................................ 32
Figure 16 - SEM Images of the Base Substrates ............................................................................................ 34
Figure 17 - SEM Images of the Base Substrates ............................................................................................ 35
Figure 18 - Substrate and Tape After ASTM D3359-02 Testing ..................................................................... 35
Figure 19 - EDS Spectrum of Phosphorous and Calcium ............................................................................... 36
Figure 20 - XRD Scan of Sputtered Coating ................................................................................................... 36
Figure 21 - Hydroxyapatite Substrate Evaluation Calcein AM Staining ......................................................... 37
Figure 22 - Hydroxyapatite Substrate Evaluation MTT Results ..................................................................... 38
Figure 23 - Hydroxyapatite Substrate Evaluation SEM Short Term Evaluation ............................................. 39
Figure 24 - Hydroxyapatite Substrate Evaluation Normalized ALP Results ................................................... 40
Figure 25 - Hydroxyapatite Substrate Evaluation SEM Long Term Evaluation .............................................. 41
Figure 26 - Etched Hydroxyapatite Film Damage on Day 1 ........................................................................... 42
Figure 27 - Delamination of Hydroxyapatite Coating at Week 3 ................................................................... 42
Figure 28 - XRD Scan of Annealed Coating .................................................................................................... 44
Figure 29 - Annealed Hydroxyapatite Film Ion Etched for 90 Minutes ......................................................... 45
Figure 30 - Annealing Effects on Etching ....................................................................................................... 48

ix
Figure 31 - Degradation Substrates After Two Weeks Immersion ................................................................ 49
Figure 32 - Degradation Substrates After Four Weeks Immersion ............................................................... 50
Figure 33 - Annealed Hydroxyapatite Substrate Evaluation Calcien AM Staining ......................................... 52
Figure 34 - Annealed Hydroxyapatite Substrate Evaluation MTT Results ..................................................... 53
Figure 35 - Annealed Hydroxyapatite Substrate Evaluation SEM Short Term Evaluation ............................. 54
Figure 36 - Annealed Hydroxyapatite Substrate Evaluation Normalized ALP Results ................................... 55
Figure 37 - Annealed Hydroxyapatite Substrate Evaluation SEM Long Term Evaluation .............................. 56
Figure 38 - Annealed Hydroxyapatite Substrate Evaluation Osteocalcin Staining ........................................ 58

1
INTRODUCTION
Over the past few decades, orthopedic procedures such as hip and knee replacements have become
commonplace in most developed nations. It is estimated that in the year 2015, nearly 600,000 hip
replacements and 1.4 million knee replacements will be performed in the United States alone (1). Since
these operations are painful to endure and can cost upwards of $30,000, it would be ideal if the life of the
implant exceeded the lifetime of the patient. Unfortunately, these implants often work loose over time
and require revision surgeries to re-secure or insert new hardware. The expected in-service life of total
knee replacements is between 10 to 15 years before this revision is required (2). The successes of these
procedures are highly dependent on a number of factors including competency of the surgeon, post
operation infections, and the interaction between the implant and the surrounding tissue. From an
implant design perspective, little can be done to improve the skill of the surgeon so it is necessary to focus
primarily on materials optimization to promote natural tissue integration.
Although most materials selected for implant use (titanium, stainless steel, etc.) are bio-inert, it is
possible to improve the interactions between the implant and the body. One of the most popular
methods to increase natural tissue integration is to coat the implant with a bioactive material. In the case
of hard tissue implants, the favored bioactive coating has been the bio-ceramic hydroxyapatite
(Ca5(PO4)3OH). Living bone is comprised of a mixture of hydroxyapatite crystals dispersed in type I
collagen; and to a lesser extent a combination of non-collagenous proteins, polysaccharides, and
glycoproteins. Since hydroxyapatite is a substance naturally produced by the body, there is no adverse
response to the material when it is implanted. The theory behind coating implants with this material
would be for the body to chemically recognize the implant as bone and integrate living bone into the
coating.
2
The use of hydroxyapatite to increase osseointegration was first introduced in 1985 by Furlong and
Osborn, when their study indicated that coated implants exhibited direct interaction with new bone after
only ten days post insertion (3). From that time forward, interest in hydroxyapatite coatings for implant
stabilization has increased. Animal models including rats, rabbits, dogs, sheep, goats, and pigs have been
used to examine the effectiveness of these coatings in-vivo (4). After this extensive testing,
hydroxyapatite coatings were approved for use in human subjects. Currently, there are a number of
commercial implants available for human use; a few of these are summarized in Table 1, taken from a
review by Dumbleton and Manley (5). Clinical reviews of human implantations in both hip and knee
replacements have shown that hydroxyapatite coatings are an effective way to enhance the
osseointegration of the metal implants (6)(7)(8)(9)(10).
TABLE 1 - PROPERTIES OF COMMERCIALLY AVAILABLE HYDROXYAPATITE COATINGS (5)
Manufacturer Hydroxyapatite Content (%)
Crystallinity (%) Thickness (µ) Porosity (%) Location of Coating
Stryker Orthopaedics (Osteonics)
>90 70 50 Dense Proximal part of
stem
Stryker Orthopaedics
(Benoist Girard) >90 >75 60 <10
Proximal part of stem
Joint Replacement Instrumentation
(JRI) 200 Fully coated stem
DePuy, J & J (Landanger)
>50 155 ± 50 <10 Fully coated stem
Biomet 62 55 5 Proximal part of
stem
Smith and Nephew 200 ± 50 20 Proximal part of
stem
Corin 97 >75 80-120 3-10 Proximal part of
stem
Centerpulse (Intermedics)
94 72 55 ± 5 3 Proximal part of
stem
Zimmer 70 (and 30% tri-
calcium phosphate) 80-130
Proximal part of stem
There are a number of methods to deposit hydroxyapatite coatings including (but not limited to):
thermal spraying, sputter coating, dip coating, sol-gel, electrophoretic deposition, biomimetic coating, and
hot isostatic pressing (4)(11). The most common technique of applying hydroxyapatite in the manufacture

3
of total joint replacements is plasma spraying (a form of thermal spraying). In this process, powdered
hydroxyapatite is fed into a high temperature plasma jet directed at the substrate. Temperatures
obtained in the core of the gun can reach up to 12,000 K, effectively melting the powder (12). The plasma
jet then propels the molten hydroxyapatite towards the target. Melted droplets impact and solidify on the
cool substrate, building a coating on the surface. The properties of the coatings can be altered by
controlling variables such as: the plasma gas, gas flow rates, powder sizes, powder feed rates, energy
inputs, spray distance, and substrate cooling (13).
FIGURE 1 - DIAGRAM OF PLASMA SPRAYING DEVICE (12)
Although plasma spraying is the most common method of hydroxyapatite application, the nature of
the process creates a number of issues with the quality of the coating (14). Since the coating is built from
the coalescence of melted droplets impacted on the substrate surface, it is common for voids and micro-
cracks to exist throughout (15). These imperfections result in lower mechanical properties than bulk
hydroxyapatite and act as stress concentrators. It is also difficult to maintain a high quality phase
composition as the extreme temperatures can cause decomposition of the hydroxyapatite into tri-calcium
phosphate or calcium oxide (4)(16). The plasma sprayed coatings are often amorphous due to the rapid
cooling rates and de-hydroxylation during spraying (17). Lastly, it is difficult to achieve uniform coatings
under 50 µm in thickness due to the relatively large molten particles and randomness of distribution on
the substrate.
4
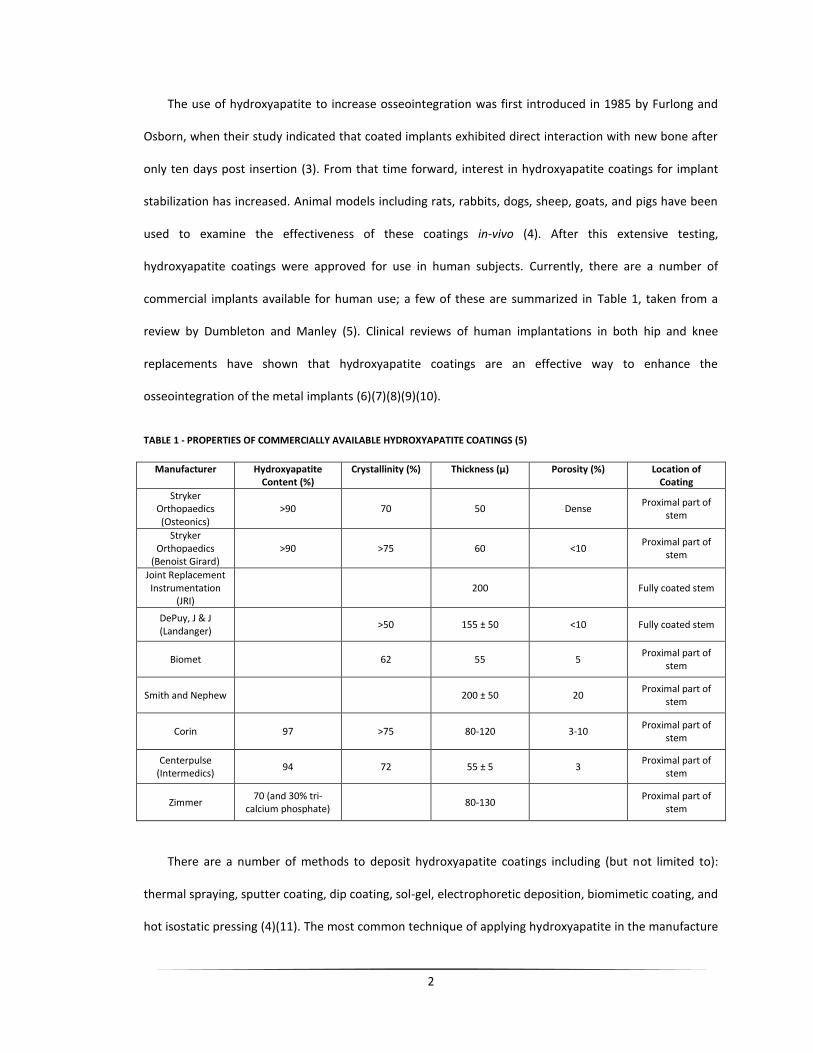
As an alternative to plasma spraying, ion beam sputtering has been researched for the deposition of
high quality hydroxyapatite coatings (4)(18)(19)(20)(21). Since the sputter process involves the molecular
deposition of material it is possible to build thin, uniform, highly dense coatings and avoid some of the
pitfalls associated with plasma spraying. In the sputtering process, a target surface is bombarded by
energetic ions. When the ions impact the target, their energy is transferred to the surface and
subsequently causes structural reorganization at the atomic level and ejection of atoms off of the surface.
In the low pressure environment, the sputtered particles travel in the direction they initially left the target
until they strike a subsequent surface or chamber wall and deposit. By strategically placing objects in the
vacuum chamber, out of the ion beam path, it is possible to collect the freed particles. Eventually, enough
particles will accumulate on the surface to form a uniform, thin film of the target material. Figure 2
illustrates the sputtering process.
FIGURE 2 - ILLUSTRATION OF SPUTTERING PROCESS
Because the sputtering process causes a rearrangement of atoms on the surface of the bombarded
material, ion beams can also be used to create unique textures on a surface. Therefore, it may be possible
to etch the titanium substrate or the deposited hydroxyapatite film in such a way to enhance osteoblast
reaction to the surface. This work examines the possibility of using ion beam etching and sputter
deposition to produce a hydroxyapatite thin film with a unique surface topography that would potentially
enhance osseointegration.
5
MATERIALS AND METHODS
Deposition substrates were prepared from .063”x 12”x 20” medical grade Ti6Al4V-ELI titanium alloy
sheets (Online Metal Supply). Ti6Al4V is commonly used in many commercial medical implants due to its
biocompatibility, high fatigue strength, high corrosion resistance, and low modulus. The extra-low
interstitial (ELI) is a higher purity form of the alloy with lower specified limits on interstitial elements such
as Fe, C, and O. This higher purity results in increased mechanical properties such as a higher resistance to
fatigue crack growth. The metal sheets were sheared with a hydraulic press into workable substrates,
approximately 1 cm x 1 cm. The edges of the substrates were then lightly ground to remove any burrs and
smooth the corners. De-burred substrates were then placed in a diluted Simple Green® solution and
ultrasonically cleaned for five minutes. Subsequent ultrasonic cleanings of the same duration included: a
second bath in a Simple Green® solution, a water bath to rinse the substrates, and an acetone bath to
remove any final contaminants. The substrates were handled only with nitrile gloves and carefully stored
to prevent unnecessary contamination.
Calcium phosphate tribasic (hydroxyapatite) powder (Alfa Aesar, CAS #12167-74-7) was used to
create sputtering targets. Water was slowly added to approximately 200 mL hydroxyapatite powder
(loosely packed) and thoroughly mixed until a free flowing blend was obtained. This solution was then
poured onto a stainless steel sheet and spread into a 12” diameter target. A heat gun was used to speed
the evaporation of the water as the target dried. As water in the solution evaporated, small cracks formed
across the entirety of the target. By the time the target was dry the cracks completely permeated the
hydroxyapatite, but the material was coherent enough to serve as a horizontally oriented sputtering
target. Once dry, the target was placed in the vacuum chamber for either immediate use or storage. Each
target could be used for 10-15 hours of sputtering before excessive crack growth occurred that presented
6
a risk of exposing the stainless steel backing plate, which would have resulted in a co-sputtering of the
stainless steel constituents.
ION BEAM ETCHING
To etch the substrates an 8cm ion source was used to create a beam of energetic argon ions. The
etching rate was controlled by adjusting the number of ions leaving the source (beam current). Since the
ion beam diverges as it moves away from the source there was no guarantee that the ion densities, and
therefore etching rates, would be consistent over the entire area of the beam. Therefore, in an effort to
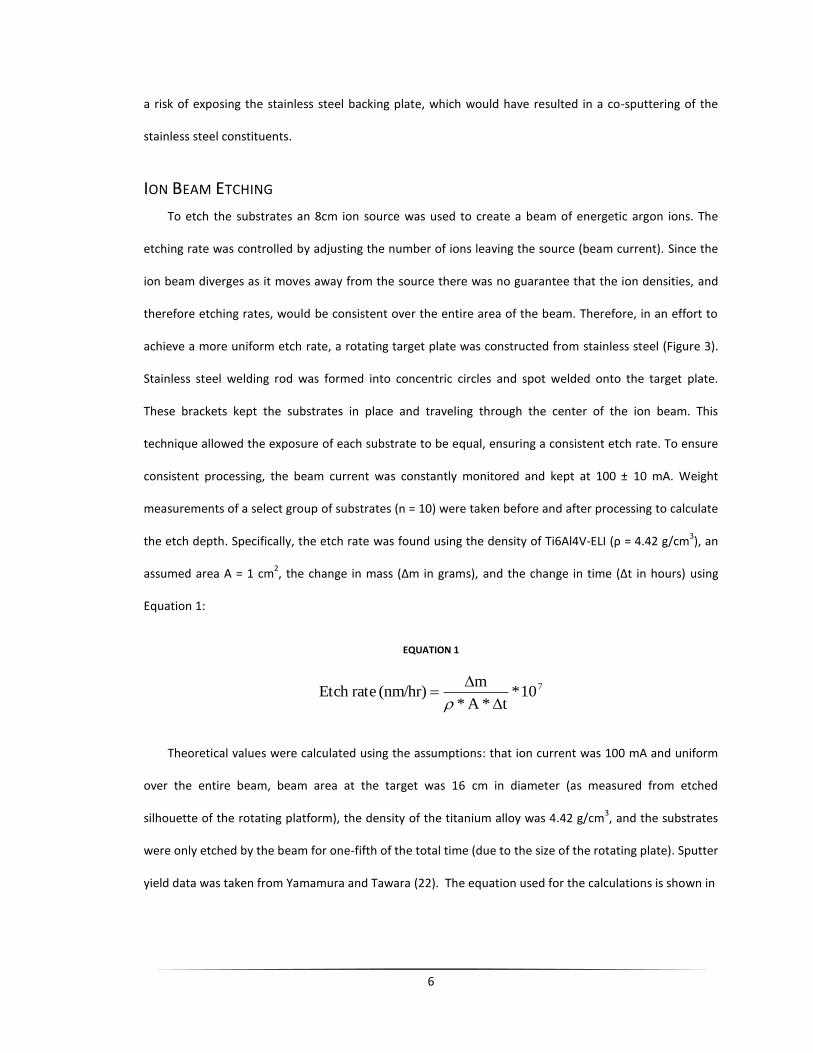
achieve a more uniform etch rate, a rotating target plate was constructed from stainless steel (Figure 3).
Stainless steel welding rod was formed into concentric circles and spot welded onto the target plate.
These brackets kept the substrates in place and traveling through the center of the ion beam. This
technique allowed the exposure of each substrate to be equal, ensuring a consistent etch rate. To ensure
consistent processing, the beam current was constantly monitored and kept at 100 ± 10 mA. Weight
measurements of a select group of substrates (n = 10) were taken before and after processing to calculate
the etch depth. Specifically, the etch rate was found using the density of Ti6Al4V-ELI (ρ = 4.42 g/cm3), an
assumed area A = 1 cm2, the change in mass (Δm in grams), and the change in time (Δt in hours) using
Equation 1:
EQUATION 1
710*t*A*
m (nm/hr) rateEtch
Theoretical values were calculated using the assumptions: that ion current was 100 mA and uniform
over the entire beam, beam area at the target was 16 cm in diameter (as measured from etched
silhouette of the rotating platform), the density of the titanium alloy was 4.42 g/cm3, and the substrates
were only etched by the beam for one-fifth of the total time (due to the size of the rotating plate). Sputter
yield data was taken from Yamamura and Tawara (22). The equation used for the calculations is shown in

7
Equation 2:
EQUATION 2
e*
m*j*Y rateEtch
Y: Sputter Yield (atoms/ion)
j: Ion Current (C/m2s)
m: Mass of Titanium Atom (kg/atom)
ρ: Density of Titanium (kg/m3)
e: Charge of an Electron (C)
FIGURE 3 – HORIZONTAL ROTATING PLATE CONSTRUCTED TO HOLD THE TITANIUM SUBSTRATES FOR UNIFORM ETCHING
Ti Substrates
(Area= 1 cm2)
Substrate
Holder Rotation
Axis
Ion Beam
Spot (Fixed)
8
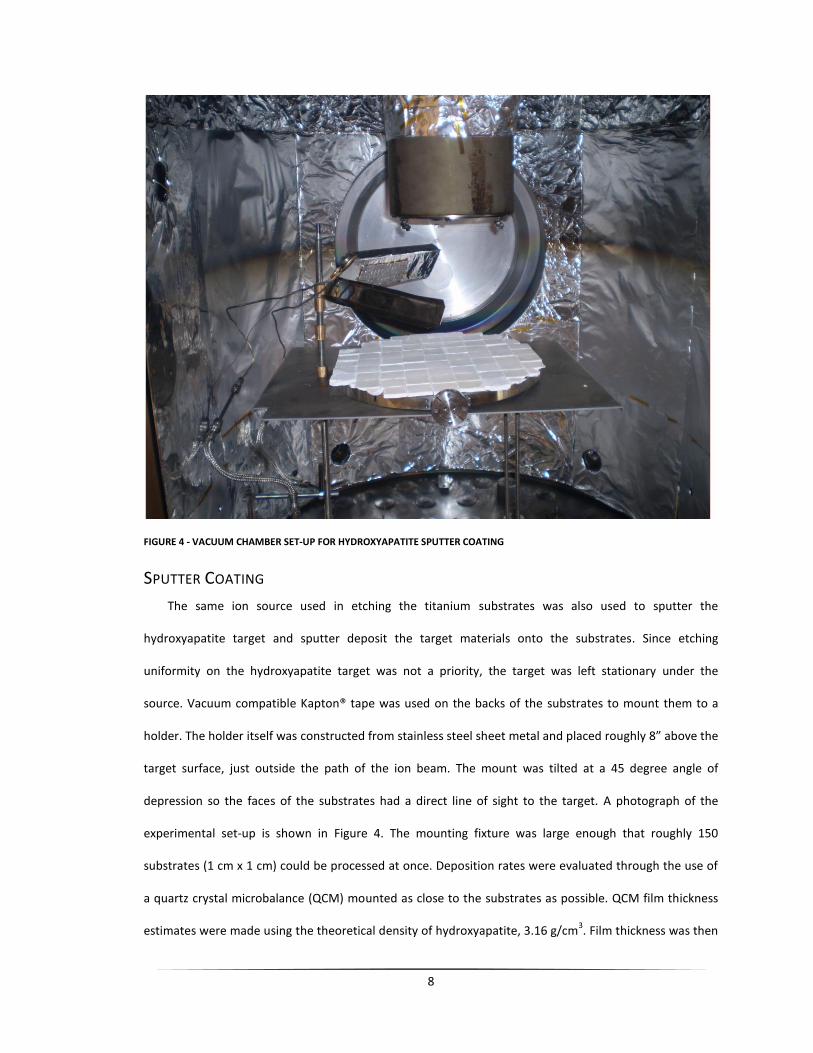
FIGURE 4 - VACUUM CHAMBER SET-UP FOR HYDROXYAPATITE SPUTTER COATING
SPUTTER COATING
The same ion source used in etching the titanium substrates was also used to sputter the
hydroxyapatite target and sputter deposit the target materials onto the substrates. Since etching
uniformity on the hydroxyapatite target was not a priority, the target was left stationary under the
source. Vacuum compatible Kapton® tape was used on the backs of the substrates to mount them to a
holder. The holder itself was constructed from stainless steel sheet metal and placed roughly 8” above the
target surface, just outside the path of the ion beam. The mount was tilted at a 45 degree angle of
depression so the faces of the substrates had a direct line of sight to the target. A photograph of the
experimental set-up is shown in Figure 4. The mounting fixture was large enough that roughly 150
substrates (1 cm x 1 cm) could be processed at once. Deposition rates were evaluated through the use of
a quartz crystal microbalance (QCM) mounted as close to the substrates as possible. QCM film thickness
estimates were made using the theoretical density of hydroxyapatite, 3.16 g/cm3. Film thickness was then

9
verified through profilometry of substrates from each processing batch. This was done by first marking
the selected substrates with a permanent marker and placing these substrates at the ends and in the
center of the mounting plates. When processing was complete the permanent marker line, and
subsequently the deposited film over the ink, were removed by gently rubbing with a q-tip soaked with
isopropyl alcohol. Care was taken to not disturb the film deposited on the substrate next to the line. This
removal of the marker line and coating deposited above resulted in a physical step between the bare
substrate and the deposited film next to where the marker line once was. A profilometer was then used
to determine the thickness of the coating by dragging the tip across the cleaned line and onto the coated
regions of the substrate.
ETCHED TITANIUM SUBSTRATE EVALUATION
This study was used to evaluate the topographies created by etching the titanium surfaces with
varied ion energies. It was also meant to determine if there was a difference in created topographies
between substrates prepared from either a pre-polished surface or an as-received surface. Finally, a rat
mesenchymal stem cell (MSC) culture was used to evaluate the prepared substrates to elucidate any
differences in cellular reactions.
Polished substrates were prepared using a series of diamond and silica abrasives with polishing
wheels. Cleaned substrates were mounted, five at a time, into small cups with a polishing epoxy (Buehler,
#20-8132-032 and #20-8130-128). Metal washers were placed at the bottoms of the cups, beneath the
substrates, to ensure that the faces of the substrates would be planar to the polishing wheel. Once the
epoxy was hardened, the assembly was extracted from the cup and the washer was detached. Excess
epoxy around the mounted substrates was removed with 150 grit sandpaper until the faces of all
substrates were completely exposed and the surface was flat. The substrates were then ground for
roughly 10 minutes, under moderate pressure at 200 rpm, with a 30 micron diamond grinding disk
(Buehler, #41-5408) on a polishing wheel. The next treatment was a 9 μm diamond suspension (Buehler,
#40-6633) on a polishing cloth (Buehler, #40-8618). Each substrate set took approximately five minutes
under light to moderate pressure at 150 rpm to achieve a uniform polish. The final step was a 40 minute

10
vibratory polish using a solution of colloidal silica (Buehler, #40-6370-064) and hydrogen peroxide (30 wt.
%). The mixture was created in a 5:1 ratio with the lesser constituent being the hydrogen peroxide. This
series resulted in a near mirror finish on the substrates. Once the polishing was complete, the mounted
assemblies were heated in an oven until the epoxy softened and the substrates could be easily removed.
Excess epoxy remaining on the substrates was carefully scraped off with a razor blade; care was taken not
to damage the polished surface.
Once the polishing was complete, groups of substrates were then etched with ion energies of 300 eV,
700 eV, and 1100 eV. Eight sets of 56 substrates were etched for five hours; the labeling and preparation
of the substrates is shown in Table 2. Sets processed at the same ion energy with differing pretreatments
were processed simultaneously (for example, sets B and F were etched together). The substrates from
these sets were placed randomly onto the rotating target plate to ensure neutral processing. Etching was
performed in the manner described in the Ion Beam Etching section.
TABLE 2 – ETCHED TITANIUM SUBSTRATE LABELING
Substrate Label
A B C D E F G H
Pretreatment Polished Polished Polished Polished As-Rec’d As-Rec’d As-Rec’d As-Rec’d
Etching Ion Energy
Not Etched
300 eV 700 eV 1100 eV Not
Etched 300 eV 700 eV 1100 eV
After etching, the surfaces of the substrates were examined with a JEOL JSM-6500F scanning electron
microscopy (SEM) at a working distance of 10 cm and a voltage of 15 kV. The MSC response to these
surfaces was characterized through the methods described in the Biological Characterization section.
Three substrates were evaluated for each preparation at each time point (n = 3).
HYDROXYAPATITE SUBSTRATE EVALUATION
This study was used to evaluate the response of mesenchymal stem cells to hydroxyapatite coatings
prepared by ion beam sputter deposition. It also was used to examine what difference may be observed
between the response of MSCs to an as-deposited hydroxyapatite thin film and the response generated
by a hydroxyapatite film that had been re-etched after initial sputter deposition.

11
In the results of the Etched Titanium Substrate Evaluation, it was found that etching at 700eV on the
as-received surface showed an improved cellular response. It also appeared that this etching roughened
the surface enough to possibly create an improved physical bonding mechanism for the hydroxyapatite
coating. Therefore, the 700 eV etch was chosen as a suitable preparation for the substrates evaluated in
this study.
As-received substrates were etched at an ion energy of 700 eV (as described in Ion Beam Etching) for
approximately 20 hours to ensure a uniform surface on all substrates. A portion of the substrates were
then sputter coated (as described in Sputter Coating) with a calcium phosphate film. Ion energies of 700
eV were used to sputter the hydroxyapatite target. A film, roughly 1 µm thick, was deposited on the
titanium substrates. After deposition half the substrates received a second etching, again with 700 eV ion
energy. This etching was only 15 minutes in duration, as it was intended only to texturize the surface and
remove as little of the coating as necessary. Once the processing was complete, labels were engraved
onto the backs of the substrates. This resulted in the creation of three substrate groups; labeling and
corresponding substrate treatments are listed in Table 3.
TABLE 3 - HYDROXYAPATITE SUBSTRATE EVALUATION LABELING
Substrate Label I J K
Preparation Etched at
700 eV
Etched at 700 eV, sputter coated with
hydroxyapatite
Etched at 700 eV, sputter coated with hydroxyapatite,
Re-etched at 700eV
Adhesion of the calcium phosphate film was qualitatively evaluated by ASTM standard D3359-02
(Standard Test Methods for Measuring Adhesion by Tape Test). This test provided a simple means to
assess the quality of the film-substrate interface. First, a grid was scored into the substrate with a sharp
razor blade (the spacing between scores is approximately 1 mm). A length of Permacel 99 tape, the tape
recommended by the standard, was cut and placed with the adhesive on the face of the substrate. After
approximately 90 seconds, the tape was removed by pulling it quickly (without jerking) back upon itself as
close to a 180 degree angle as possible. The percent area of film removed was then qualitatively
12
appraised from being classification 5B (0% film removed) to classification 0B (more than 65% film
removed).
The surfaces of the substrates were examined with SEM at a working distance of 10 cm and a voltage
of 15 kV. Since hydroxyapatite is an insulator, all surfaces (including group E) were sputter coated with
5nm of gold before viewing to achieve better resolution in the SEM. Finally, the mesenchymal stem cell
response to these surfaces was characterized through the methods described in the Biological
Characterization section. Three substrates were evaluated for each preparation at each time point (n = 3).
ANNEALING STUDY
This study examined the use of heat treating to increase crystallinity in sputter deposited
hydroxyapatite films as well as evaluated the effects of ion etching on the annealed films. Annealed
substrates were prepared by heating the substrates in air with a Lindberg oven (1200 oC max) for 2 hours
at a temperature of 600 0C. X-ray diffraction was used to assess changes in crystallinity. To evaluate
etching effects, two sets of substrates were prepared; one with the as-deposited hydroxyapatite coating
and the other with the annealed hydroxyapatite coating. The substrates from these groups were then
subjected to 700 eV ion beam bombardment (as described in Ion Beam Etching) for durations of 15, 45,
90, or 180 minutes. Substrates were then gold coated (5 nm) and the surfaces were examined by SEM.
A study was then designed to evaluate the degradation of these coatings in an aqueous environment.
To evaluate the substrates, conditions similar to those of the cell culture were chosen to approximate an
actual culture. The substrates were placed in 24 well plates containing 1 mL of cell culture media and
incubated at 37 0C, 5% CO2. However, unlike an actual culture, there were no media changes made during
the four week time period. Three substrates were evaluated for each preparation at each time point (n =
3). Each substrate was weighed before the study began, and then reweighed after immersion to
determine if there was any distinguishable change in weight due to coating loss. Substrates were
evaluated at two weeks (14 days) and four weeks (28 days). SEM was used to evaluate changes in the
surface structure of the substrates. The substrate preparations tested are listed in Table 4.

13
TABLE 4 - SUBSTRATES USED IN DEGRADATION TESTING
Substrate Label L M N O P Q R
Pre-Etch None 700 eV 700 eV 700 eV 700 eV 700 eV 700 eV
Hydroxyapatite Coating
None 650 nm 650 nm 650 nm 650 nm 650 nm 650 nm
Heat Treatment None None None 600
0C
2 Hours 600
0C
2 Hours 800
0C
2 Hours 800
0C
2 Hours
Additional Etching None None 90 min None 90 min after
Anneal None
90 min after
Anneal
ANNEALED HYDROXYAPATITE SUBSTRATE EVALUATION
This study was used to compare the response of mesenchymal stem cells to crystalline and
amorphous hydroxyapatite coatings. The effects of a post annealing ion etch on the hydroxyapatite thin
films were also evaluated.
As-received substrates were etched at an ion energy of 700 eV (as described in Ion Beam Etching) for
approximately 15 hours to ensure a uniform surface on all substrates. A portion of the substrates were
then sputter coated (as described in Sputter Coating) with a calcium phosphate film. Ion energies of 700
eV were used to sputter the hydroxyapatite target. A film, roughly 650 nm thick, was deposited on the
titanium substrates. Annealed substrates were prepared by heating the substrates in air with a Lindberg
oven (1200 oC max) for 2 hours at a temperature of 600
0C. After deposition, half the annealed substrates
received a second etching, again with a 700 eV ion energy. The duration of the second etch was 1 hour
and 30 minutes. Once the processing was complete, labels were engraved onto the backs of the
substrates. This resulted in the creation of five substrate groups; labeling and corresponding substrate
treatments are listed in Table 5.
TABLE 5 - ANNEALED HYDROXYAPATITE SUBSTRATE EVALUATION LABELING
Substrate Label
S T U V W
Preparation As-Rec’d Etched at
700 eV
Etched at 700 eV, sputter coated
with hydroxyapatite
Etched at 700 eV, sputter coated with
hydroxyapatite, annealed at 600
oC
Etched at 700 eV, sputter coated with
hydroxyapatite, annealed at 600
oC,
re-etched at 700 eV

14
The mesenchymal stem cell response to these surfaces was characterized through the methods
described in the Biological Characterization. Three substrates were evaluated for each preparation at
each time point (n = 3).
In addition to the Biological Characterization, three weeks after differentiation substrates were
immune-labeled for osteocalin. Cells were fixed with 3.7% wt. formaldehyde, and permeabilized with 1%
triton-x by consecutive 15 minute soaks in each solution. Substrates were then incubated in a blocking
solution for 20 minutes. After rinsing with phosphate buffer solution, substrates were incubated with
primary osteocalin antibodies (V-19 purified goat polyclonal antibody of human origin, Santa Cruz
Biotechnology) for 60 minutes. Substrates were rinsed with PBS three times then incubated in FITC-
labeled secondary antibodies for osteocalcin (donkey antigoat IgG, Santa Cruz Biotechnology) for 45
minutes, shielded from light. Lastly, substrates were rinsed with PBS once more then imaged with a
florescence microscope (Carl Zeiss).
BIOLOGICAL CHARACTERIZATION
Before sterilization the substrates were placed in 24 well plates, one substrate per well. The
substrates were incubated at room temperature in a biosafety cabinet under ultraviolet (UV) light for 30
minutes in 70% ethanol. The ethanol was then aspirated and the substrates were washed with DI water
followed by PBS. Further, the substrates were incubated in standard cell culture media (α-MEM with 10%
fetal bovine serum (FBS, Sigma) and 1% penicillin/streptomycin (pen/strep, Sigma)) for 10 minutes. The
substrates were then exposed to UV light for another 10 minutes to complete the sterilization process.
The sterilized plates were then placed in an incubator to allow the substrates to soak in the culture media
overnight at 37 0C , 5% CO2.
To procure a MSC population to seed the substrates, the long bones (femur, humorous, tibia) were
aseptically harvested from two adult Wistar rats immediately after euthanization. After removal, the
bones were stored in sterilized PBS and kept on ice to prevent cell death. Once transported to a sterile
environment, the bones were removed from the PBS. Using scissors and sterile technique, the ends of the
bones were severed and 40 mL of the culture media was flushed through the medullary cavity repeatedly
15
and collected. The flushing was done using 10 mL syringes with 18 and 25 gauge needles. The media was
then filtered through a 70 μm porous nylon filter into a clean centrifuge tube to remove any bone chips or
other large unwanted debris. In order to ascertain the number of cells harvested, 25 μL of filtered celled
media was added to 25 μL of Trypan Blue Solution (0.4%, Sigma T8154) and a hemacytometer (Fisher
Scientific CAT#0267110) was then used to count the cells (25 µL of the celled solution was used in each
side of the cytometer resulting in two cell counts). Cell densities were estimated using the formula:
Count Average * 104 = Number of Cells/mL of Media
The celled media was then diluted to a concentration of 1 million cells/mL through the addition of
warmed, un-celled media. In order to seed the substrates, the sterilized plates were removed from the
incubator and the media the substrates were soaking in was aspirated. Celled media, 1 mL per well, was
then added to each well. Once seeded, the plates were placed back in the incubator.
To maintain the health and welfare of the cells, the cultures were kept incubated in a sterile
environment at simulated body conditions of 37 0C and 5% CO2. On Day 4, 0.5 mL of the media was
removed from the substrates and replaced with an equal amount of fresh media. A full media change was
performed on Day 7 using a differentiation media (α-MEM supplemented with 10% FBS, 1% Penn/Strep,
Dexamethasone (108 M), ascorbic acid (50 mg/ml), and β-glycerolphosphate (8 mmol)) to force the cells
to differentiate the osteoproginetor cells to an osteoblastic phenotype. This media was replaced every
other day for the remainder of the study.
At every time point evaluated over the course of the short term and long term responses, cells were
fixed on each surface to be examined with SEM. This allowed the changes in morphology to be tracked
according to both substrate preparation and time. To prepare , the cells were fixed in a solution of 3%
glutaraldehyde (Sigma), 0.1 M sodium cacodylate (Polysciences,Warrington, PA), and 0.1 M sucrose
(Sigma) for 45 minutes. Substrates were then soaked in buffer containing 0.1M sodium cacodylate and
0.1M sucrose. The cells were then dehydrated by soaking the substrates in increasing concentrations of
ethanol (35%, 50%, 70%, 95%, 100%) for 10 minutes each. Further dehydration was achieved by soaking

16
the substrates in hexamethyldisilazane (HMDS, Sigma) for 10 minutes. Before imaging, a 5 nm gold
coating was deposited on the substrates to increase conductance of the surface to improve SEM
resolution.
SHORT TERM CELL RESPONSE Early cellular activity was assessed on Day 1 and Day 4 through the use of a MTT assay (Sigma, CGD-
1). The assay protocol provided by the company was followed. MTT (3-[4,5-dimethylthiazol-2-yl]-2,5-
diphenyl tetrazolium bromide) solution was added to the culture media and allowed to incubate at 37 0C
for 3 hours. The mitochondrial dehydrogenases of productive cells cleaved the tetrazolium rings of the
MTT solution and resulted in the formation of purple formazan crystals. These crystals were dissolved
when the MTT solvent supplied in the kit was added to the solution in the wells. The substrate absorbance
was measured spectrophotometrically at a wavelength of 570 nm through the use of a FLUOstar Omega
(BMG Labtech). A background absorbance measured at 690 nm was subtracted from the original reading.
Cell adhesion and spatial organization was assessed qualitatively through calcein AM (Invitrogen)
fluorescence staining on Day 1, Day 4, and Day 7. Living cells use nonspecific cytosolic esterases to convert
the non-fluorescent calcein AM to fluorescent calcein, which can then be examined. Culture media was
aspirated and the substrates were gently rinsed with Phosphate Buffer Solution (PBS) to remove non-
adherent cells. A 2 µM solution of Calcein AM diluted in PBS was added to each well. To prevent photo-
bleaching, the substrates were shielded from light until cells were imaged using appropriate filters on a
Zeiss Axioplan 2 fluorescence microscope (Carl Zeiss).
LONG TERM CELL RESPONSE Cells were differentiated to an osteoblastic phenotype through the use of a differentiation media
after the first week of culture. The cell culture continued for an additional three weeks. The substrates
were assessed at Week 1 (14 days into the study), Week 2 (21 days), and Week 3 (28 days).
Osteoblast activity was monitored through the use of an alkaline phosphatase (ALP) colorimetric
assay (BioAssay Systems). The correlation between ALP and cellular activity could be made since ALP is a
17
hydrolase enzyme produced as a byproduct of active osteoblasts. The titanium substrates were moved
into fresh 24-well plates and a cell lysis reagent (CelLytic M, Sigma) was added to the wells and gently
shaken for 15 minuntes at room temperature. A solution of p-nitrophenyl phosphate and Mg Acetate,
prepared to kit specifications, was added to the lysis reagent. The ALP present in the reagent causes a
conversion of the p-nitrophenyl phosphate into yellow colored product (p-nitrophenol and phosphate).
The reaction rate is directly proportional to the enzyme activity. Substrates were read twice (t = 0 min and
t = 4 min) with a FLUOstar Omega (BMG Labtech) at a wavelength of 405 nm to determine this rate.
To normalize the results of the ALP assay, a bicinchoninic acid (BCA) colorimetric assay was
preformed to ascertain the quantity of total protein in the substrates. A BCA solution was mixed to kit
specifications. A calibration curve was prepared using an albumin standard methodically diluted with
deionized water. Substrates were moved into fresh 24-well plates and a cell lysis reagent (CelLytic M,
Sigma) was added to the wells and gently shaken for 15 minutes at room temperature. The BCA solution
was mixed with the lysed solution from the substrates and the albumin standards which had been placed
in a 96-well plate. These mixtures were then incubated at 37 0C for 30 minutes. The presence of protein
causes a reduction of the Cu2+
in the assay reagent into Cu1+
when in an alkaline medium. A measureable
purple-colored product is then produced by the chelation of two BCA molecules with a Cu1+
. The
absorbance of the substrates was then read at a wavelength of 562 nm with a FLUOstar Omega (BMG
Labtech) spectrophotometer. The substrate absorbance was then compared to the absorbance of the
calibration curve to extrapolate the amount of total protein in the substrates.

18
RESULTS AND DISCUSSION
ION BEAM ETCHING
Weight measurements were taken from 40 substrates from the etched titanium study, both pre-etch
and post etch; 10 from group B (300 eV), 10 from group F (300 eV), 10 from group D (1100 eV), and 10
from group H (1100 eV). The average change in mass for each ion energy was used to calculate the rate of
etching. Unfortunately the resolution on the scale used to record the weights only measured to ten-
thousandth of a gram, and weight changes were only on the order of a few ten-thousandths difference.
This means that there is likely a significant associated error with the rate calculations, but these are still
able to provide rough estimates for the rate of etch.
In a separate evaluation, 10 substrates were etched at 700 eV for 1.5 hours, with weights recorded
before and after etching. These weight measurements were taken on scale with resolution to a hundred-
thousandth of a gram. This means the errors associated with this etch value are likely less than the other
estimates. The rates calculated are given in Table 6.
TABLE 6 - CALCULATED ETCH RATES
300 eV 700 eV 1100 eV
Etch Rate (depth of etch) 108.6 nm/hr 162.9 nm/hr 447.9 nm/hr
Theoretical etch rate (depth of etch)
124 nm/hr 238 nm/hr 310 nm/hr
ETCHED TITANIUM SUBSTRATE EVALUATION After etching the titanium substrates with various ion energies, it appeared that the higher energy
ions were the most aggressive and dramatically affected the surface topography. The substrates etched at
300 eV and 700 eV showed little variance in surface topography from their pre-processed states.
However, the 1100 eV etch resulted in the same, unique topography regardless of the original state.
19
Figure 5 shows the SEM images taken of the processed substrates. The argon etching created hierarchical
surfaces with uniform structures at both the micro- and nano- level. At the micro- level, features ranging
in size from 5-15 µm were clearly distinguishable. The edges of these features terminate at the visible
grain boundaries of the alloy; for this reason it is believed that the coarseness is a result of uneven etching
of the grains themselves. It has been observed previously that the orientation of the titanium crystal
structure affects how susceptible each grain is to etching. This ion etching is a common albeit expensive
technique for exposing grain size in materials that are difficult to polish and/or chemically etch to reveal
grain structure (23).
At the nano- level the etching resulted in the formation of evenly spaced ripples in the titanium.
These waves in the material were regularly spaced, approximately 20 nm apart. As with the formation of
the micro- level features, the depth of the nano- features was also dependant on the ion energy; the
higher the ion energy, the more pronounced the ripples were. The differences in ion energies are
illustrated in Figure 6. This phenomenon has also been observed when argon is used to sputter copper
(24) and silver (25). Ripple formation on the silver substrates was noted to occur at ion energies greater
than 800 eV with substrate temperatures ranging from 270-320 K (25). Similar results were observed on
titanium in this study. Substrate temperature was not monitored, but the formation of ripples was only
apparent on the 700 eV and 1100 eV substrates.

20
Polished As-Rec’d
No
Etc
h
30
0 e
V E
tch
70
0 e
V E
tch
11
00
eV
Etc
h
FIGURE 5 - SEM IMAGES OF THE PROCESSED SUBSTRATES (X4000)
1µm
1µm
1µm
1µm
1µm
1µm
1µm 1µm

21
FIGURE 6 - SUBSTRATE ETCHED AT 700 EV (LEFT) AND SUBSTRATE ETCHED AT 1100 EV (RIGHT), (X90000)
Although these ripples appeared over most of the etched surface, not all grains showed these
formations. Figure 7 illustrates the differences observed between two grains. It is not certain, but this
disparity may be explained by a variation in orientation of the crystal structure of the alloy.

22
FIGURE 7 - DIFFERENCE IN GRAIN ETCHING ON 700 EV SUBSTRATE (X90000)
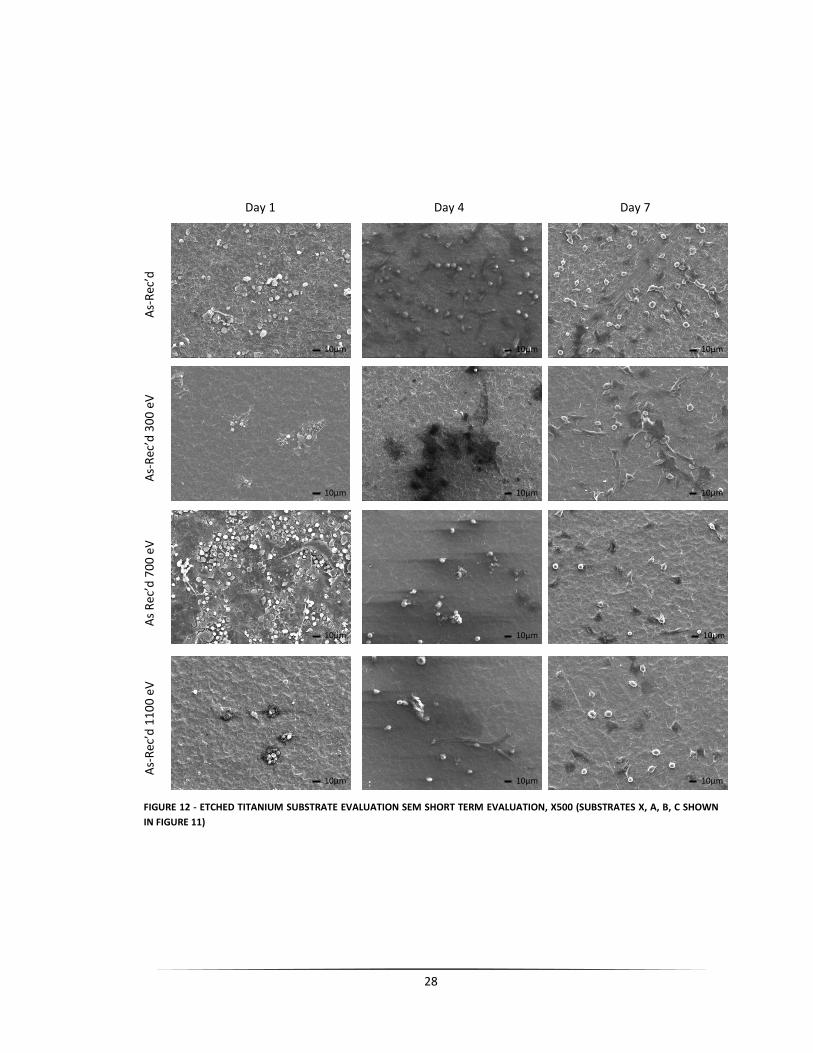
SHORT TERM CELL RESPONSE Short term evaluation of the MSC reactions to the surfaces began as soon as one day after seeding.
Calcein AM staining indicated that the cells were able to attach and remain viable across the surface of all
the substrates (Figure 8 and Figure 9). On Day 1 the number of adherent cells was similar on all of the
substrates, except the substrates etched at 1100 eV which displayed fewer cells. This trend continues over
Day 4 and Day 7, as the substrates etched at the highest energy consistently displayed fewer adhered
cells. The polished and as-received surfaces both appeared to maintain a large quantity of living cells;
however cells on the polished surface seemed to have a higher affinity to group while cells on the as-
received surface remained randomly distributed. This would suggest that the polished surface was more
conducive to cell mobility. The cellular reaction to the surfaces subjected to 300 eV or 700 eV ions was
similar regardless if the surface had been previously polished or as-received. As early as Day 4, the cells on
these substrates were grouping and advanced spreading was evident. This indicates that the topography
created by argon ion bombardment at 300 eV and 700 eV has a high cellular affinity and allows cellular
migration.

23
Day 1 Day 4 Day 7
Po
lish
ed
Po
lish
ed –
30
0 e
V
Po
lish
ed –
70
0 e
V
Po
lish
ed –
11
00
eV
FIGURE 8 - ETCHED TITANIUM SUBSTRATE EVALUATION CALCEIN AM STAINING, X10 (SUBSTRATES Y, E, F, G SHOWN IN FIGURE 9)
50µm 50µm 50µm
50µm 50µm 50µm
50µm 50µm 50µm
50µm 50µm 50µm

24
Day 1 Day 4 Day 7
As-
Rec
’d
As-
Rec
’d –
30
0 e
V
As-
Rec
’d –
70
0 e
V
As-
Rec
’d –
11
00
eV
FIGURE 9 - ETCHED TITANIUM SUBSTRATE EVALUATION CALCEIN AM STAINING, X10 (SUBSTRATES X, A, B, C SHOWN IN FIGURE 8)
50µm 50µm 50µm
50µm 50µm 50µm
50µm 50µm 50µm
50µm 50µm 50µm

25
The results from the MTT colorimetric assay are displayed in Figure 10. At Day 1 there appeared to be
similar mitochondrial activity on all substrates. It appeared that the substrates etched at 1100 eV showed
slightly more activity than those etched at the lower energies. This result is surprising given the calcein
AM staining showed that the higher energy substrates appeared to maintain fewer living cells. The trend
observed on Day 1 continued into Day 4. The 300 eV and 700 eV substrates had absorbance values lower
than those of the controls while the 1100 eV substrates were able to top these values. These finding
suggest that the topography created can trigger an increase or decrease in the cellular mitochondrial
activity, depending on the aggressiveness of the etching. Studies have indicated that semi-ordered nano-
topographies, similar to the ones present on the etched substrates, may be responsible for the increase in
activity (26) (27).
FIGURE 10 - ETCHED TITANIUM SUBSTRATE EVALUATION MTT RESULTS
The representative SEM images taken of the substrates are displayed in Figure 11, Figure 12, Figure
14, and Figure 15. Figure 11 and Figure 12 display the images taken over the short term evaluation. Initial
cellular adhesion appeared consistent for all the substrates with the cells maintaining a rounded
morphology. By Day 4, the adhered cells were beginning to exhibit a spread morphology on the surface
and network with adjacent cells. Behavior was similar for all substrates except those etched at 1100 eV,
which seemed to maintain rounded cell morphologies. At the end of the first week cell densities had
0
0.02
0.04
0.06
0.08
0.1
0.12
0.14
Day 1 Day 4
Ab
sorb
ance
A
B
C
D
E
F
G
H

26
increased and the morphology was increasingly spread. It appeared that the substrates processed from a
polished surface created a favored surface as these substrates displayed the most cell spreading and
network formation.

27
Day 1 Day 4 Day 7
Po
lish
ed
Po
lish
ed –
30
0 e
V
Po
lish
ed –
70
0 e
V
Po
lish
ed –
11
00
eV
FIGURE 11 - ETCHED TITANIUM SUBSTRATE EVALUATION SEM SHORT TERM EVALUATION, X500 (SUBSTRATES Y, E, F, G SHOWN IN
FIGURE 12)
10µm 10µm 10µm
10µm 10µm 10µm
10µm 10µm 10µm
10µm 10µm 10µm
28
Day 1 Day 4 Day 7
As-
Rec
’d
As-
Rec
’d 3
00
eV
As
Re
c’d
70
0 e
V
As-
Rec
’d 1
10
0 e
V
FIGURE 12 - ETCHED TITANIUM SUBSTRATE EVALUATION SEM SHORT TERM EVALUATION, X500 (SUBSTRATES X, A, B, C SHOWN
IN FIGURE 11)
10µm 10µm 10µm
10µm 10µm 10µm
10µm 10µm 10µm
10µm 10µm 10µm
29
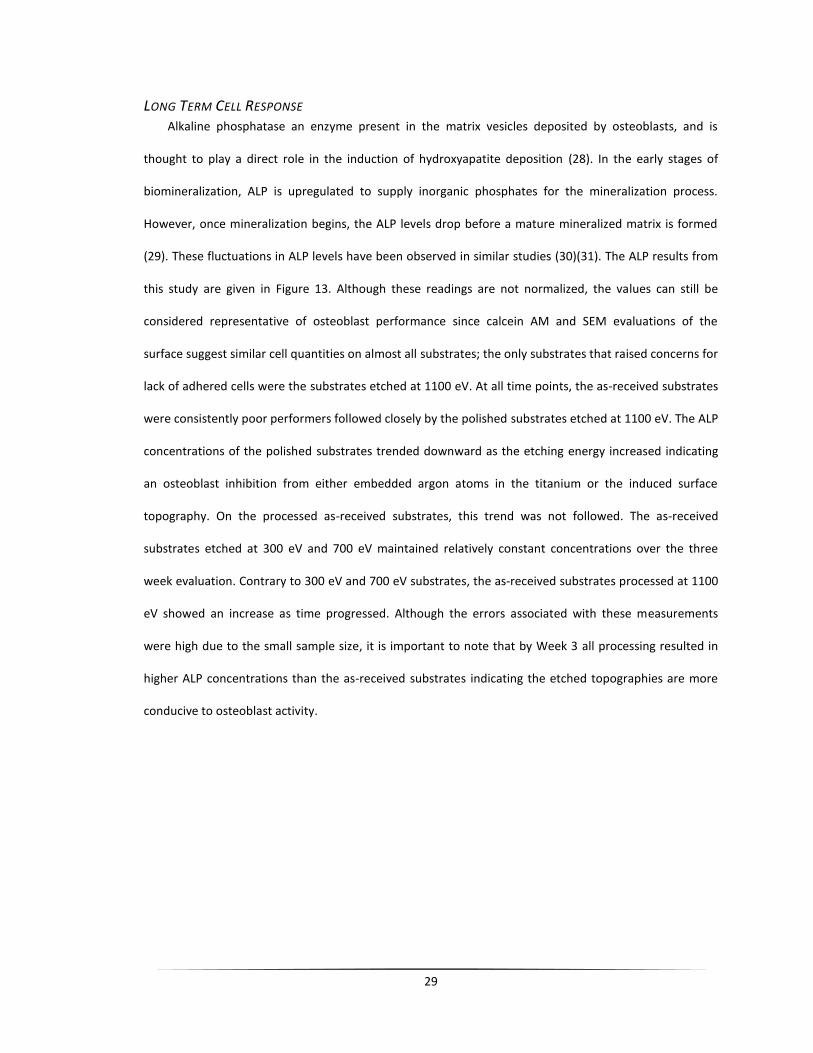
LONG TERM CELL RESPONSE Alkaline phosphatase an enzyme present in the matrix vesicles deposited by osteoblasts, and is
thought to play a direct role in the induction of hydroxyapatite deposition (28). In the early stages of
biomineralization, ALP is upregulated to supply inorganic phosphates for the mineralization process.
However, once mineralization begins, the ALP levels drop before a mature mineralized matrix is formed
(29). These fluctuations in ALP levels have been observed in similar studies (30)(31). The ALP results from
this study are given in Figure 13. Although these readings are not normalized, the values can still be
considered representative of osteoblast performance since calcein AM and SEM evaluations of the
surface suggest similar cell quantities on almost all substrates; the only substrates that raised concerns for
lack of adhered cells were the substrates etched at 1100 eV. At all time points, the as-received substrates
were consistently poor performers followed closely by the polished substrates etched at 1100 eV. The ALP
concentrations of the polished substrates trended downward as the etching energy increased indicating
an osteoblast inhibition from either embedded argon atoms in the titanium or the induced surface
topography. On the processed as-received substrates, this trend was not followed. The as-received
substrates etched at 300 eV and 700 eV maintained relatively constant concentrations over the three
week evaluation. Contrary to 300 eV and 700 eV substrates, the as-received substrates processed at 1100
eV showed an increase as time progressed. Although the errors associated with these measurements
were high due to the small sample size, it is important to note that by Week 3 all processing resulted in
higher ALP concentrations than the as-received substrates indicating the etched topographies are more
conducive to osteoblast activity.

30
FIGURE 13 - ETCHED TITANIUM SUBSTRATE EVALUATION ALP RESULTS (NOT NORMALIZED)
Figure 14 and Figure 15 display the SEM images taken over the long term evaluation (these images
were taken after the addition of differentiation media). The cellular reactions on these surfaces were
similar across the duration of the study but differed between the two pre-treatment groups. The
substrates processed from the polished substrates displayed large groupings of cells that spread across
the surfaces. The only differences between the reactions of the polished group was the 1100 eV etched
substrates appeared to have a lower quantity of cells (which is consistent with the observations made
with the calcein AM staining). The substrates prepared from the as-received surfaces had lower cell
quantities and also appeared to be less networked than the polished pre-treatments. This suggests that
the rougher surface present on the as-received processed group may inhibit growth of osteoblasts. It is
important to note that for the as-received substrates, the argon etching did seem to increase cell density
and improve the cellular reaction to the surface for the 700 eV and 1100 eV substrates.
-2
0
2
4
6
8
10
Week 1 Week 2 Week 3
IU/L
A
B
C
D
E
F
G
H

31
Week 1 Week 2 Week 3
Po
lish
ed
Po
lish
ed –
30
0 e
V
Po
lish
ed –
70
0 e
V
Po
lish
ed –
11
00
eV
FIGURE 14 - ETCHED TITANIUM SUBSTRATE EVALUATION SEM LONG TERM EVALUATION, X500 (SUBSTRATES Y, E, F, G SHOWN IN
FIGURE 15)
10µm 10µm 10µm
10µm 10µm 10µm
10µm 10µm 10µm
10µm 10µm 10µm
32
Week 1 Week 2 Week 3
As-
Rec
’d
As-
Rec
’d –
30
0 e
V
As-
Rec
’d –
70
0 e
V
As-
Rec
’d –
11
00
eV
FIGURE 15 - ETCHED TITANIUM SUBSTRATE EVALUATION SEM LONG TERM EVALUATION, X500 (SUBSTRATES X, A, B, C SHOWN IN
FIGURE 14)
10µm 10µm 10µm
10µm 10µm 10µm
10µm 10µm 10µm
10µm 10µm 10µm

33
DISCUSSION This investigation yielded significant insight into the importance of surface topography on the effect
of mesenchymal stem cell and osteoblast response to titanium surfaces. It was seen that both the
substrate pre-treatment and the etching ion energy influence these responses. In almost all aspects the
substrates created from a polished pretreatment outperformed those prepared from the as-received
condition. This is likely due to the surface roughness of the substrates. The polished substrates allowed
higher cell mobility since there was little interference from physical obstacles. Although MTT and ALP
measurements indicated that the argon etching was slightly detrimental to the polished substrate
performance, calcein AM staining and SEM imaging showed an improvement in cellular response over the
unprocessed polished surface (with the exception of the 1100 eV etch). This improvement in cell
spreading is likely due to the hierarchical texturization the etching created on the surface of the
substrates. The disparity with the 1100 eV etch may have been a result of the aggressiveness of the etch
and the creation of physical barriers which interfered with cell adhesion. The argon etching also had a
positive impact on the cellular interaction on the as-received substrates. The etched substrates did have
lower MTT absorbances than the untreated as-received substrates, but the ALP values were much higher
in all instances. Calcein AM staining and SEM imaging also confirmed that there was an increase in cell
spreading. This is likely due to a combination of the imparted nano-texturization and the erosion of large
physical obstacles by ion bombardment.
It can be concluded that all processing showed an improvement in the performance over the bare as-
received substrates. While the substrates prepared from a polished surface did outperform the substrates
prepared from the as-received condition, the prospect of scaling the polishing process to a commercial
implant would prove difficult. Not only is polishing resource consuming, in both time and materials, but it
would be extremely difficult to transfer the polishing process applied in this study to the complex three
dimensional geometry of an actual implant. Ion etching the as-received surfaces resulted in
improvements very near those of the polished group, and the etching process could easily be
accomplished on a complex geometry provided the part could be rotated to allow line-of-sight to all areas

34
of the implant. It would also be possible to achieve such an etch if the implant were immersed within a
dense plasma and pulsed to negative potentials to draw ions to the surface and sputter etch the surface.
In this regard, ion beam etching directly on an as-received surface offers a simple, effective way to
improve the osteoblast reaction to an implant.
HYDROXYAPATITE SUBSTRATE EVALUATION
This study included the addition of a hydroxyapatite coating to the titanium in an attempt to improve
cellular response to the surface. The sputtering process resulted in a thin film approximately 1200 ± 200
nm thick (as confirmed by profilometry). The three substrate preparations tested are shown in Figure 16.
Although groups J and K are both coated with hydroxyapatite, the micro-structure of the surface remains
nearly identical to the 700 eV etched topography. At the nano-level, the ripple structure formed by the
initial etching is no longer visible on the coated substrates (Figure 17). Instead, the hydroxyapatite film
created a somewhat bubbled layer over the titanium substrate. In an attempt to texturize the
hydroxyapatite coating, some of the substrates were re-etched with the ion beam. Contrary to initial
expectations, the second etching smoothed the surface film, giving it a glass-like appearance (Figure 17 –
Substrate K). It is likely this topography was created because the as-deposited coating was amorphous,
allowing for equal etching and redistribution across the surface. Had the coating been crystalline, or a mix
of crystalline and amorphous, it is likely that the crystalline regions would be less susceptible to erosion
from the ions. This would lead to uneven etching and the creation of a unique topography.
FIGURE 16 - SEM IMAGES OF THE BASE SUBSTRATES, X5000
I J K 10µm 10µm 10µm

35
FIGURE 17 - SEM IMAGES OF THE BASE SUBSTRATES, X50000
ASTM standard D3359-02 was used to test a total of 6 different substrates obtained from two
separate sputtering batches. On all the substrates tested, no delamination or disruption of the calcium
phosphate coating was observed. All coatings tested would be classified 5B in accordance with the ASTM
D3359-02 standard. This indicated that the coatings are consistent and the film to substrate adhesion is
strong enough to resist a mild to moderate destabilizing force.
FIGURE 18 - SUBSTRATE AND TAPE AFTER ASTM D3359-02 TESTING
Chemical characterizations of the coating were performed with energy dispersive spectroscopy (EDS)
and x-ray diffraction (XRD). EDS confirmed that the surface indeed had calcium and phosphorous as the
primary constituents of the coating and these elements were deposited uniformly across the surface of
the substrates. X-ray diffraction was used to examine the surface of the coating to determine crystallinity
(Figure 20). When the substrate was scanned, only peaks matching the titanium substrate were observed.
This indicates that the sputtered hydroxyapatite coating was amorphous or possibly that the coating was
100nm 100nm 100nm I J K

36
not hydroxyapatite, but some other Ca-P compound. Amorphous hydroxyapatite coatings are believed to
favor cell attachment, but in a cell culture environment the dissolving coating can raise the pH of the
culture media and inhibit cell proliferation (32).
FIGURE 19 - EDS SPECTRUM OF PHOSPHOROUS (LEFT) AND CALCIUM (RIGHT)
FIGURE 20 - XRD SCAN OF SPUTTERED COATING AT AN INCIDENT ANGLE OF 0.25 DEGREES (RED LINES INDICATE STANDARD
TITANIUM PEAKS)
Nick Ca+/PO4 Jan 5, 09 [001]
00-044-1294 (*) - Titanium - Ti - Y: 50.00 % - d x by: 1. - WL: 1.5406 - Hexagonal - a 2.95050 - b 2.95050 - c 4.68260 - alpha 90.000 - beta 90.000 - gamma 120.000 - Primitive - P63/mmc (1
Nick Ca+/PO4 Jan 5, 09 [001] - File: Ca-PO4-Ti Jan 05 09_b [001].raw - Type: 2Th alone - Start: 10.000 ° - End: 80.000 ° - Step: 0.020 ° - Step time: 5. s - Temp.: 25 °C (Room) - Time Start
Lin
(C
ou
nts
)
0
100
200
300
2Theta (Degrees)
10 20 30 40 50 60 70 80

37
SHORT TERM CELL RESPONSE When the substrates were seeded, the stem cell populations reacted favorably to all preparations.
The results of the Calcein AM staining are shown in Figure 21. Images indicate initial cell adhesion was
similar on all substrates in terms of cell densities. Some cells on the post-etched hydroxyapatite coatings
had already spread themselves across the surface instead of maintaining the rounded morphologies
typical for Day 1, indicating a high affinity for the coating. By Day 4, all the substrates showed signs of
good cell mobility and clustering. On the hydroxyapatite coated substrates many cells had spread
morphologies, while the cells on the etched titanium surface remained mostly rounded. Day 7 trends
continued to favor the hydroxyapatite thin films. The cells on the etched titanium substrates were
beginning to spread by this time point, but still not nearly to the extent of the hydroxyapatite coated
substrates.
Day 1 Day 4 Day 7
I
J
K
FIGURE 21 - HYDROXYAPATITE SUBSTRATE EVALUATION CALCEIN AM STAINING, X10
50µm 50µm 50µm
50µm 50µm 50µm
50µm 50µm 50µm
38
The results of the MTT assay are shown in Figure 22. On both Day 1 and Day 4, the absorbance values
were similar for all substrates. At both time points, the as-deposited hydroxyapatite held the highest
value, followed closely by the post-deposition etched substrate and finally the bare etched titanium. The
differences in absorbance values between the substrates are not significant. However, this assay
demonstrated that cells remain viable on all substrates, as indicated by the absorbance increase between
Day 1 and Day 4. It is interesting to note that the degree of spreading does not necessarily correlate to the
mitochondrial activity of the cell. If a correlation existed, the as-deposited and post-deposit etched
hydroxyapatite substrates should have displayed a significantly higher absorbance since advanced
spreading was observed on these substrates by Day 4.
FIGURE 22 - HYDROXYAPATITE SUBSTRATE EVALUATION MTT RESULTS
The SEM images taken over the short term evaluation are shown in Figure 23. On Day 1, the cells on
all groups maintained a basic, rounded morphology. By Day 4, the cells on all substrates were beginning to
spread, though most stayed rounded. Images were similar for groups I and J, but group K displayed a lack
of adhered cells. At Day 7, cells were well spread on both the bare etched titanium and the as-sputtered
hydroxyapatite coating. The post-deposition etched hydroxyapatite coating continued to lack sufficient
cells to evaluate.
0
2
4
6
8
10
12
14
16
Day 1 Day 4
Ab
sorb
ance
I
J
K

39
The substrates imaged from group K on Day 4 and Day 7 were sparsely populated with cells. MTT and
calcein AM staining didn’t indicate a disparity in cell populations between the groups, so it is possible
these substrates experienced traumatic events during the fixing process and lost adhered cells. It is
doubtful, given the results from the other evaluation tools, that these images are representative of the
performance of the coating.
Day 1 Day 4 Day 7
E
C
B
FIGURE 23 - HYDROXYAPATITE SUBSTRATE EVALUATION SEM SHORT TERM EVALUATION, X500
LONG TERM CELL RESPONSE
The normalized ALP results are shown in Figure 24. The normalized results represent the ratio of
Alkaline Phosphatase production to the total protein production. At Week 1, the ALP/total protein ratios
of the etched titanium and the post-sputtering etched hydroxyapatite were approximately equal; the
value of the as-sputtered hydroxyapatite coating was about 1.5 times more than the other substrate
preparations. By Week 2, total protein production nearly doubled in all the substrates while ALP
production remained relatively constant. This increase in total protein production and steady ALP
10µm 10µm 10µm
10µm 10µm 10µm
10µm 10µm 10µm

40
production accounts for the lower normalized values seen in Week 2. At Week 3 total protein levels were
similar to Week 2, but group I and K showed an increase in ALP production while group J’s levels remained
approximately the same. This led to significantly higher normalized values for the bare etched substrates
over both the as-deposited hydroxyapatite coatings and the post-deposition etched coatings. There was
also a disparity in normalized values between the hydroxyapatite coatings, as the post-deposition etched
substrates had much higher values.
FIGURE 24 - HYDROXYAPATITE SUBSTRATE EVALUATION NORMALIZED ALP RESULTS
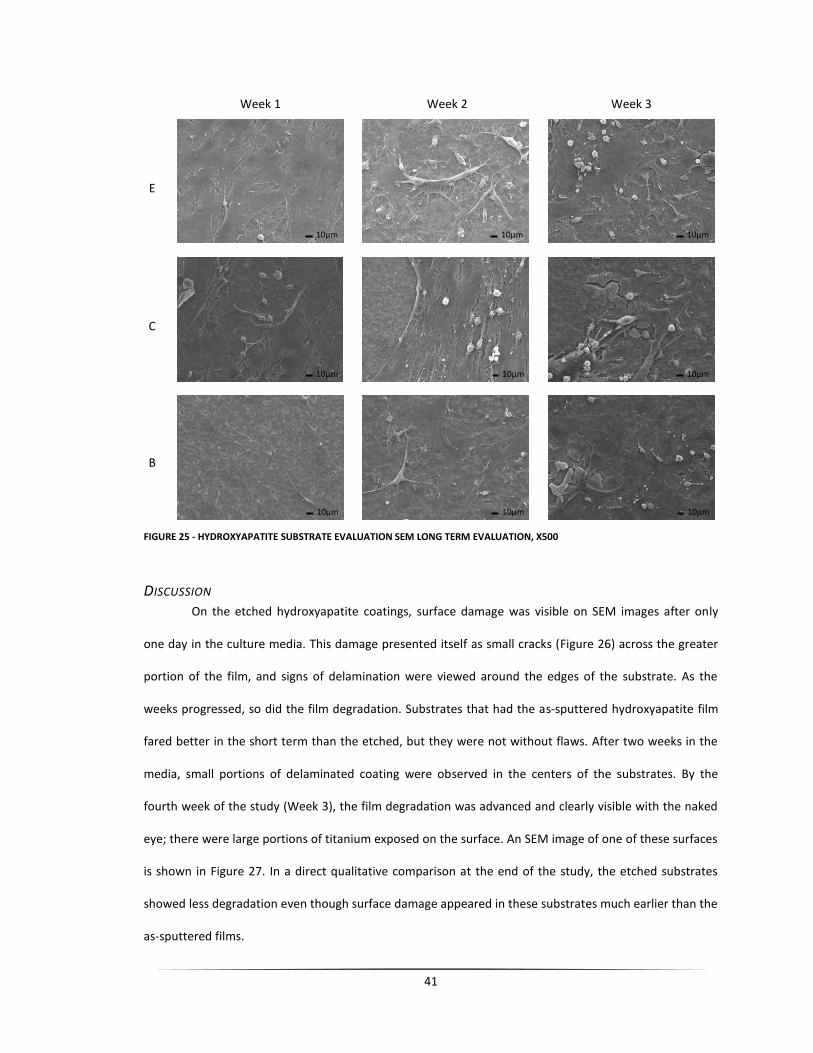
Figure 25 displays the long term SEM evaluations of the substrates. By Week 1 of the study (14 days)
all the substrates were almost completely covered; osteoblasts were spread across almost the entirety of
the surfaces. For all groups (E, C, and B) this trend continued through Week 3 of the study. The
morphologies of the cells remained flattened and spread across the surface, and the cell densities on the
substrates were high. The only visible difference was the hydroxyapatite coatings began to delaminate
from the surface at Week 1, and the damage increased with time leading to a loss of cells on the
hydroxyapatite coated substrates.
0
0.05
0.1
0.15
0.2
0.25
0.3
0.35
Week 1 Week 2 Week 3
I
J
K
41
Week 1 Week 2 Week 3
E
C
B
FIGURE 25 - HYDROXYAPATITE SUBSTRATE EVALUATION SEM LONG TERM EVALUATION, X500
DISCUSSION On the etched hydroxyapatite coatings, surface damage was visible on SEM images after only
one day in the culture media. This damage presented itself as small cracks (Figure 26) across the greater
portion of the film, and signs of delamination were viewed around the edges of the substrate. As the
weeks progressed, so did the film degradation. Substrates that had the as-sputtered hydroxyapatite film
fared better in the short term than the etched, but they were not without flaws. After two weeks in the
media, small portions of delaminated coating were observed in the centers of the substrates. By the
fourth week of the study (Week 3), the film degradation was advanced and clearly visible with the naked
eye; there were large portions of titanium exposed on the surface. An SEM image of one of these surfaces
is shown in Figure 27. In a direct qualitative comparison at the end of the study, the etched substrates
showed less degradation even though surface damage appeared in these substrates much earlier than the
as-sputtered films.
10µm 10µm 10µm
10µm 10µm 10µm
10µm 10µm 10µm

42
FIGURE 26 - ETCHED HYDROXYAPATITE FILM DAMAGE ON DAY 1
FIGURE 27 - DELAMINATION OF HYDROXYAPATITE COATING AT WEEK 3 (28 DAYS INTO STUDY)

43
It is difficult to estimate how much the data from the ALP and BCA assays was skewed due to the
degradation of the hydroxyapatite coatings. Almost certainly, as the hydroxyapatite delaminated from the
surface adhered cells would have detached from the substrate surface. These cells, although viable, would
have been lost through media changes or substrate transfers. Therefore, when the assays were run the
results found (though competitive with the bare etched titanium substrate) would have been from
considerably fewer cells. It is possible that if the coatings could be made more robust, and all the cells stay
with the substrate, these substrates could outperform the bare etched titanium in terms of ALP and total
protein production.
In conclusion, the calcein AM staining indicated that the hydroxyapatite substrates were the
preferred surfaces for cell spreading and cell mobility. SEM images show few differences between cellular
interactions on all of the substrates; cell conformations look similar for all substrates at each time point,
and the progression of cell development over time appears normal. Early ALP and protein production
seem to favor the as-deposited hydroxyapatite substrate. However, by the end of the study the bare
etched titanium substrate seems to be the most productive in this regard. Again, it is unknown how much
these readings were affected by the degradation of the hydroxyapatite coatings. As it stands, short term
performance favors the hydroxyapatite thin films and the long term favors the bare etched titanium
substrate.
ANNEALING STUDY
After the poor performance of the as-sputtered hydroxyapatite, it was deemed necessary to improve
the reaction of the coating to an aqueous environment. In an effort to increase crystallinity, thereby
increasing stability, suitable heat treatments were investigated to anneal the thin films. Literature
provides a range of heat treatments used to anneal hydroxyapatite coatings to increase crystallinity
(33)(34)(35)(36)(37). In the published studies reviewed, heat treatments have temperatures ranging from
500-1200 OC, for durations of 1-4 hours, in environments ranging from open air to an all argon
environment to vacuum. After reviewing the literature, a heat treatment of 600 oC for a period of two
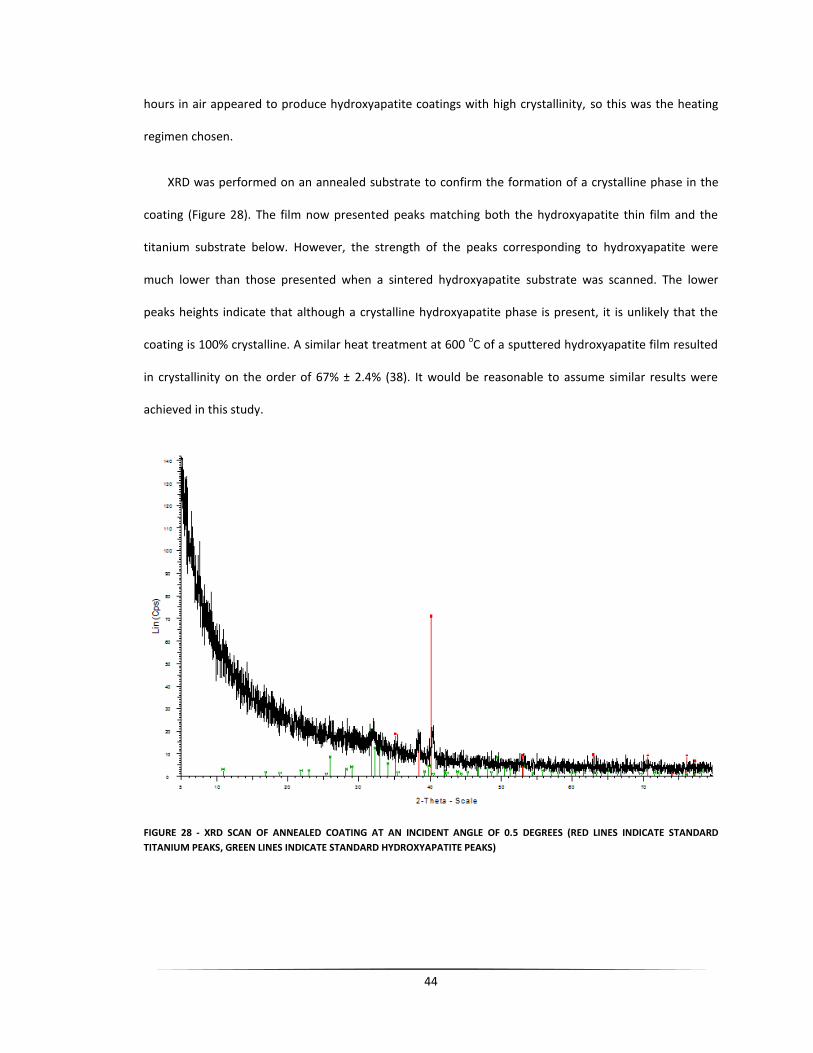
44
hours in air appeared to produce hydroxyapatite coatings with high crystallinity, so this was the heating
regimen chosen.
XRD was performed on an annealed substrate to confirm the formation of a crystalline phase in the
coating (Figure 28). The film now presented peaks matching both the hydroxyapatite thin film and the
titanium substrate below. However, the strength of the peaks corresponding to hydroxyapatite were
much lower than those presented when a sintered hydroxyapatite substrate was scanned. The lower
peaks heights indicate that although a crystalline hydroxyapatite phase is present, it is unlikely that the
coating is 100% crystalline. A similar heat treatment at 600 oC of a sputtered hydroxyapatite film resulted
in crystallinity on the order of 67% ± 2.4% (38). It would be reasonable to assume similar results were
achieved in this study.
FIGURE 28 - XRD SCAN OF ANNEALED COATING AT AN INCIDENT ANGLE OF 0.5 DEGREES (RED LINES INDICATE STANDARD
TITANIUM PEAKS, GREEN LINES INDICATE STANDARD HYDROXYAPATITE PEAKS)

45
It was hypothesized that if the annealed film existed as a mixture of amorphous and crystalline
phases, it may be possible to etch the coating to create a new topography on the surface (as attempted
with Hydroxyapatite Substrate Evaluation – group K). Substrates with as-deposited and annealed
hydroxyapatite coatings were subjected to a series of 700 eV ion beam bombardments; the SEM images
of the resulting surfaces are shown in Figure 30. As expected, the as-deposited coatings displayed the
same topography that was created during the Hydroxyapatite Substrate Evaluation. The annealed films,
however, resulted in a new topography with a series of interconnected valleys.
This new topography wasn’t the result of a mixture of amorphous and crystalline phases, as was
initially expected, but a direct result of the annealing process. When the films were annealed, micro-
cracks formed across the entirety of the surface. This was likely due either to mismatched thermal
expansions between the hydroxyapatite coating and the titanium substrate, or the build-up of residual
stresses from deposition overcoming the strength of the coating at the higher temperatures. Regardless
of cause, when the annealed surface was etched, the micro-cracks were not only etched vertically but
laterally as well. This resulted in the 10-20 μm features that covered the surface (Figure 29).
FIGURE 29 - ANNEALED HYDROXYAPATITE FILM ION ETCHED FOR 90 MINUTES

46
When the substrates were immersed in media for degradation testing, there was surprisingly little
damage observed on the hydroxyapatite films. Even groups M and N, the same preparations observed to
fail in the Hydroxyapatite Substrate Evaluation, remained adhered to the surface for the length of the
study. However, these substrates were not without flaw. By the second week of the study, micro-cracks
had formed across the entirety of the surface in both groups. These cracks were much larger at the fourth
week of the study, indicating that the film was slowly degrading. Thin micro-cracks were also observed
across the film surface on the annealed substrates (groups O, P, Q, and R); however, as time progressed
the cracks did not appear to grow (Figure 31 and Figure 32). There was almost no change in the film
coherence or topography noted on any of the annealed substrates. This indicated that the annealed films
were more resistant to degradation in an aqueous environment.
Weight measurements were taken before and after the substrates were immersed in the culture
media. No substrate had a change in mass over 0.00003 grams. This value was at the edge of the scales
resolution, so it is possible that the change is only a result of the scales error. Although it is likely that
some dissolution is occurring, all hydroxyapatite film preparations remained stable over the course of the
study.
It is interesting to note that the amorphous films (groups M and N) showed little signs of degradation
other than the growth of surface cracks. These same preparations were used in the Hydroxyapatite
Substrate Evaluation resulting in catastrophic delamination of the films. The only differences in conditions
were the presence of cells, multiple media changes, and the thickness of the coating (~1200 nm vs. ~650
nm). It is doubtful that the media changes were violent enough to disrupt the coating, though it may be
possible that changing ion concentration with the addition of fresh media resulted in more ions being
taken from the hydroxyapatite, causing dissolution. It is also possible that the cells themselves were
actively degrading the coating, though this is not likely. The most probable explanation was due to the
disparity in the thickness of the coatings. Since the first films evaluated were nearly twice the thickness of
those evaluated here, there were likely more residual stresses in the thicker film. When the substrates in
the Hydroxyapatite Substrate Evaluation were exposed to the aqueous environment, the coating

47
weakened and the residual stresses were enough to result in a delamination of the film. Since the films in
this study were much thinner, the residual stresses were not enough to overcome the strength of the film,
so the coating remained intact.

48
As-Sputtered Annealed
15min Etch
45min Etch
90min Etch
180min Etch
FIGURE 30 - ANNEALING EFFECTS ON ETCHING, X1000
10µm 10µm
10µm 10µm
10µm 10µm
10µm 10µm

49
FIGURE 31 - DEGRADATION SUBSTRATES AFTER TWO WEEKS IMMERSION, X5000
10µm
10µm 10µm
10µm
L M
O N
P Q
R
10µm
10µm 10µm

50
FIGURE 32 - DEGRADATION SUBSTRATES AFTER FOUR WEEKS IMMERSION, X5000
10µm
10µm
10µm
10µm
10µm 10µm
10µm
L M
O N
P Q
R

51
ANNEALED HYDROXYAPATITE SUBSTRATE EVALUATION
After the Annealing Study confirmed that a crystalline hydroxyapatite film could be created by heat
treatment and this film was stable in an aqueous environment, it was necessary to test the cell response
to the new preparation. This study was a culmination of the research performed to this point. Five
substrate preparations were tested: as-received titanium, 700 eV etched bare titanium, an as-deposited
hydroxyapatite film, an annealed hydroxyapatite film, and a post annealing etched hydroxyapatite film. All
of these substrates had been examined previously with the exception of the annealed films. This allowed
not only a comparison of the annealed films to known characterized substrates, but also served to test
the results and conclusions of the previous studies.
SHORT TERM CELL RESPONSE The substrates were seeded with rat MSCs and cultured for four weeks. Figure 33 shows the
representative images gathered from the calcein AM staining. At Day 1, all substrates were able to adhere
cells. The cells on the hydroxyapatite films already began to cluster together on the surfaces. By Day 4, all
substrates other than the as-received surface exhibited a high occurrence of cell grouping. This indicated
that the cells were well adhered and mobility was not inhibited. The cells on the as-received substrate
remained scattered across the surface of the substrate. At the final evaluation point (Day 7), cells on the
as-received substrate were finally beginning to cluster. The other substrates continued to display cell
grouping. However, the cells on the hydroxyapatite coated substrates exhibited much tighter clustering
than the bare 700eV etched surface.

52
Day 1 Day 4 Day 7
S
T
U
V
W
FIGURE 33 - ANNEALED HYDROXYAPATITE SUBSTRATE EVALUATION CALCIEN AM STAINING, X10
50µm 50µm 50µm
50µm 50µm 50µm
50µm 50µm 50µm
50µm 50µm 50µm
50µm 50µm 50µm

53
The results of the MTT assays are shown in Figure 34. On Day 1 groups T, U, and V had very similar
absorbance values, indicating that mitochondrial activity was similar on these substrates. The as-received
substrate had slightly lower values, while the post-anneal etched hydroxyapatite film had slightly higher
values than the other groups. By Day 4 of the study, all the substrates were performing at the same level
with the exception of group W. Again, the post-anneal etched hydroxyapatite film displayed the highest
absorbance values. It was interesting to note that there was not a large increase in absorbance between
Day 1 and Day 4 although an increase was seen in both previous cell studies. This could indicate that there
was a potential problem with the culture that hindered the proliferation of the cells, or possibly an error
was made in the duration of the assay incubation. Regardless of error, Day 4 still serves as a valid
assessment between the groups since all substrates were subjected to the same conditions.
FIGURE 34 - ANNEALED HYDROXYAPATITE SUBSTRATE EVALUATION MTT RESULTS
The representative SEM images taken over the short term evaluation are shown in Figure 35. At Day 1
of the study, the cells on all substrates maintained a rounded morphology. By Day 4, spread cell
conformations were observed on all preparations. Cell clustering was displayed by all substrates except
the as-received group. Cells on group S remained randomly distributed across the surface. Finally, at Day 7
groups S, V, and W displayed cells that were very flat and well adhered to the surfaces. The cells on
substrates T and U continued to display rounded morphologies, however. This observation was in clear
0
0.1
0.2
0.3
0.4
0.5
0.6
0.7
Day 1 Day 4
Ab
sorb
ance
S
T
U
V
W

54
contradiction to previous findings in the Hydroxyapatite Substrate evaluation, where both preparations
exhibited spread cells by this time point.
Day 1 Day 4 Day 7
S
T
U
V
W
FIGURE 35 - ANNEALED HYDROXYAPATITE SUBSTRATE EVALUATION SEM SHORT TERM EVALUATION, X500
10µm 10µm 10µm
10µm 10µm 10µm
10µm 10µm 10µm
10µm 10µm 10µm
10µm 10µm 10µm
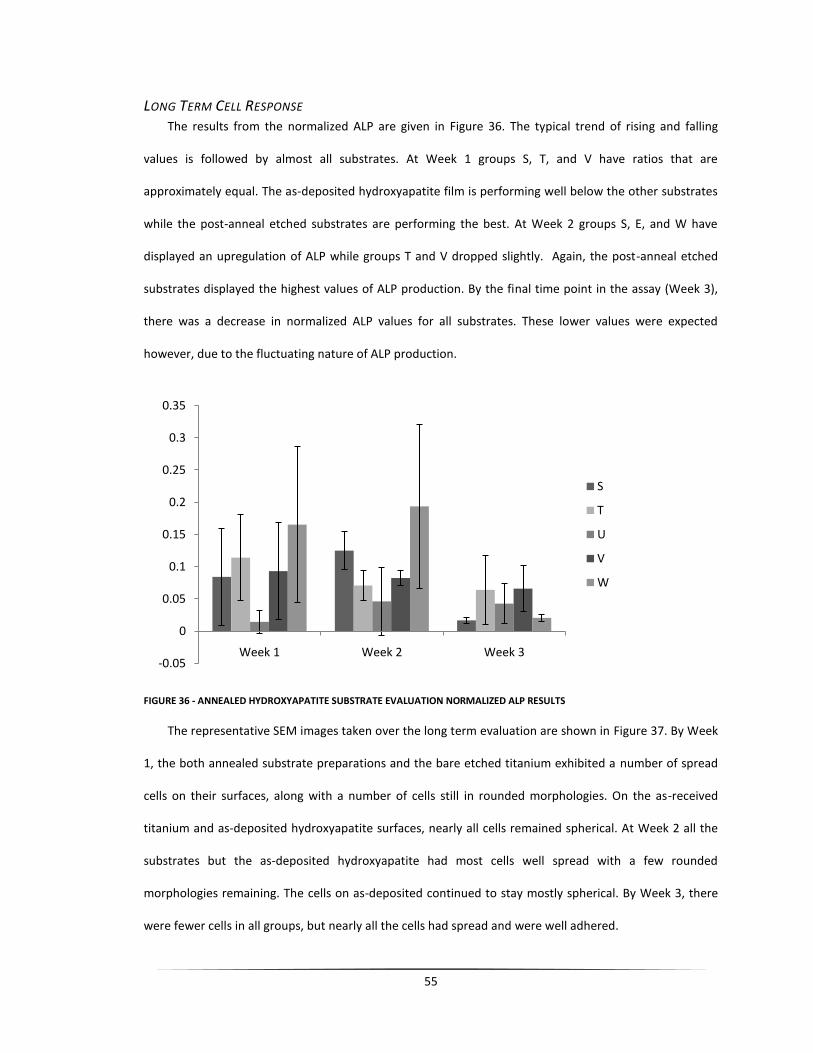
55
LONG TERM CELL RESPONSE The results from the normalized ALP are given in Figure 36. The typical trend of rising and falling
values is followed by almost all substrates. At Week 1 groups S, T, and V have ratios that are
approximately equal. The as-deposited hydroxyapatite film is performing well below the other substrates
while the post-anneal etched substrates are performing the best. At Week 2 groups S, E, and W have
displayed an upregulation of ALP while groups T and V dropped slightly. Again, the post-anneal etched
substrates displayed the highest values of ALP production. By the final time point in the assay (Week 3),
there was a decrease in normalized ALP values for all substrates. These lower values were expected
however, due to the fluctuating nature of ALP production.
FIGURE 36 - ANNEALED HYDROXYAPATITE SUBSTRATE EVALUATION NORMALIZED ALP RESULTS
The representative SEM images taken over the long term evaluation are shown in Figure 37. By Week
1, the both annealed substrate preparations and the bare etched titanium exhibited a number of spread
cells on their surfaces, along with a number of cells still in rounded morphologies. On the as-received
titanium and as-deposited hydroxyapatite surfaces, nearly all cells remained spherical. At Week 2 all the
substrates but the as-deposited hydroxyapatite had most cells well spread with a few rounded
morphologies remaining. The cells on as-deposited continued to stay mostly spherical. By Week 3, there
were fewer cells in all groups, but nearly all the cells had spread and were well adhered.
-0.05
0
0.05
0.1
0.15
0.2
0.25
0.3
0.35
Week 1 Week 2 Week 3
S
T
U
V
W

56
Week 1 Week 2 Week 3
S
T
U
V
W
FIGURE 37 - ANNEALED HYDROXYAPATITE SUBSTRATE EVALUATION SEM LONG TERM EVALUATION, X500
10µm 10µm 10µm
10µm 10µm 10µm
10µm 10µm 10µm
10µm 10µm 10µm
10µm 10µm 10µm
57
Osteocalcin is a noncollagenous protein secreted by osteoblasts, thought to play an important role in
the mineralization of bone. The presence of this protein is indicative of the presence of mature osteoblast
phenotypes (39). The osteocalcin staining at Week 3 is shown in Figure 38. Osteocalcin is clearly visible on
all substrates indicating the presence of osteoblast survivability on all preparations. The highest
concentrations of the proteins appeared on groups S, U, and W; the as-deposited hydroxyapatite coating
performed notably well. Groups T and V still had osteocalcin on their surfaces indicating osteoblast
activity, but to a lesser extent.

58
FIGURE 38 - ANNEALED HYDROXYAPATITE SUBSTRATE EVALUATION OSTEOCALCIN STAINING, X10 (WEEK 3)
S T
U V
W
50µm 50µm
50µm 50µm
50µm

59
DISCUSSION This study was the most comprehensive in terms of analyzing the performance of the hydroxyapatite
thin films. Comparisons could be made between annealed coatings and as-deposited coatings, and the
direct influence of an etched annealed surface was appraised. Short term calcein AM results once again
confirmed that the cellular spreading and mobility was enhanced on the hydroxyapatite coated
substrates. The bare etched titanium surface continued to show an improvement over the as-received
surface, but was still not to the level of the thin films. MTT results were similar for all groups, except the
post-anneal etched group which had slightly higher values. This indicated an increase in cellular activity on
this surface over the other preparations. Short term SEM results favored the annealed hydroxyapatite
films over the other substrates, since these films displayed well adhered cells at the earliest time points
and continued display the most advanced cell morphologies. Long term cell response continued to favor
the post-anneal etched hydroxyapatite. This preparation was the most favorable surface in both
normalized ALP readings and the SEM evaluation. The normalized ALP values were similar for groups S, T,
and V indicating little variation in osteoblast production on these surfaces. The as-deposited
hydroxyapatite was the worst performer however, as the ALP values were significantly below the other
substrates. SEM indicated that for the last three weeks of the study the cell morphologies on all the
substrates were similar at every time point. Osteocalcin staining also showed little variation between the
samples. However, contrary to the other evaluation techniques, the staining indicated that the as-
deposited hydroxyapatite film was the most active surface in terms of osteoblast activity.
This study demonstrated that all the hydroxyapatite coatings produced increased short term mobility
as well as enhanced the quality of cellular conformations to the surface of the substrate. The long term
cellular function is clearly increased by the post-anneal etched substrate, though not significantly affected
by the annealed coating. This shows that the post-anneal etch creates a topography that stimulates
cellular activity. SEM images showed no signs of film degradation indicating that the coating also remains
stable in a celled, aqueous environment.
60
CONCLUSIONS
The Etched Titanium Substrate Evaluation yielded significant insight into the importance of surface
topography on the effect of mesenchymal stem cell and osteoblast response to titanium surfaces. It was
seen that both the substrate pre-treatment and the etching ion energy influence these responses. In
almost all aspects the substrates created from a polished pretreatment outperformed those prepared
from the as-received condition. The argon etching had a positive impact on the cellular interaction of the
as-received substrates, with the 700eV etch appearing to be the optimal etching energy. This
improvement is likely due to the hierarchical texturization the etching imparted on the surface of the
substrates.
When the hydroxyapatite coatings were applied to the etched titanium substrates and evaluated,
these surfaces showed an enhanced short term cellular response over the bare etched titanium. As the
study progressed, these coatings began to degrade. By the end of the substrate evaluations, these
coatings were experiencing catastrophic failures. XRD analysis of the coating indicated the as-deposited
hydroxyapatite films were amorphous. It was likely the amorphous nature of these films, possibly in
combination with the thicker coating (~1200nm), was responsible for the degradation of the
hydroxyapatite coatings.
Annealing the samples at 6000C for two hours appeared to create a crystalline phase of
hydroxyapatite in the deposited films. Medium range order crystallinity was confirmed by XRD evaluation
of the annealed substrates. SEM evaluation of a four week immersion study demonstrated that the
annealed coatings were not visibly degraded in an aqueous environment. Post-anneal etching of the
hydroxyapatite substrates also proved to yield a surface topography.
61
The final evaluation indicated that the hydroxyapatite coatings are an effective way to enhance the
short term cellular response of the titanium substrates. Over the long term evaluation, only the annealed
hydroxyapatite preparations continued to perform at an increased level. When the annealed substrates
were compared, the post-anneal etched surface outperformed the annealed hydroxyapatite surface in
nearly every appraisal. This indicates the topography created in this study is more conducive to cellular
activity than the regular topography achieved by annealing. Regardless of cause, the findings indicate that
this preparation may be an effective way to enhance osseointegration on titanium implants.

62
WORKS CITED
1. Changes in Surgical Loads and Economic Burden of Hip and Knee Replacements in the US: 1997-2004.
Kim, S. 4, 2008, Arthritis & Rheumatism (Arthritis Care & Research), Vol. 59, pp. 481-488.
2. Early Failures in Total Knee Arthroplasty. Fehring, T.K., Odum, S., Griffin, W.L., Mason, J.B., Nadaud, M.
2001, Clinical Orthopaedics and Related Research, pp. 315-318.
3. Fixation of hip prostheses by hydroxyapatite ceramic coatings. Furlong, R.J., Osborn, J.F. 5, 1991, The
Journal of Bone and Joint Surgery, Vols. 73-B, pp. 741-745.
4. A review on calcium phosphate coatings produced using a sputtering process - an alternative to plasma
spraying. Yang, Y., Kim, K.-H., Ong, J.L. 2005, Biomaterials, Vol. 26, pp. 327-337.
5. Hydroxyapatite-coated protheses in total hip and knee arthroplasty. Dumbleton, J., Manley, M.T. 11,
2004, The Journal of Bone and Joint Surgery, Vols. 86-A, pp. 2526-2540.
6. Hydroxyapatite coating improves fixation of pedicle screws. Sanden, B., Olerud, C., Petrn-Mallmin, M.,
Larsson, S. 3, 2002, The Journal of Bone and Joint Surgery (Br), Vols. 84-B, pp. 387-391.
7. Epinette, J.-A., Manley, M.T. Long-term survivorship analysis of hydroxyapatite-coated hips. Fifteen
Years of Clinical Experience with Hydroxyapatite Coatings in Joint Arthroplasty. s.l. : Springer, 2004, pp.
225-234.
8. The effect of hydroxyapatite on the micromotion of total knee prestheses. A prospective, randomized,
double-blind study. Nelissen, R.G.H.H., Valstar, E.R., Rozing, P.M. 1998, The Journal of Bone and Joint
Surgery, Vol. 80, pp. 1665-1672.
9. Hydroxyapatite-coated total hip femoral components in patients less than fifty years old. Clinical and
radiographical results after five to eight years of follow-up. Capello, W.N., D'Antonio, J.A., Feinberg, J.R.,
Manley, M.T. 1997, The Journal of Bone and Joint Surgery, Vol. 79, pp. 1023-1029.
10. Material fundamentals and clinical performance of plasma-sprayed hydroxyapatite coatings: a review.
Sun, L., Berndt, C.C., Gross, K.A., Kucuk, A. 5, 2001, Journal of Biomedical Materials Research, Vol. 58, pp.
570-592.
11. Total hip arthroplasty with hydroxyapatite-coated prostheses. Jaffe, W.L., Scott, D.F. 1996, The
Journal of Bone and Joint Surgery, Vol. 78, pp. 1918-1934.
12. Plasma surface modification of titanium for hard tissue replacements. Liu, X., Poon, R.W.Y, Kwok,
S.C.H., Chu, P.K., Ding, C. 2004, Surface and Coating Technology, Vol. 186, pp. 227-233.
13. Plasma sprayed hydroxy apatite coatings. Patil, D.S., Sreekumar, K.P., Venkataramani, N., Iyer, R.K.,
Prasad, R., Koppikar, R.S., Munim, K.R. 1, Bulletin of Materials Science, Vol. 19, pp. 115-121.

63
14. Ong, J.L, et al. Calcium phosphate coating produced by a sputter deposition process. [book auth.] B.,
Jansen, J.A. Leon. Thin Calcium Phosphate Coatings for Medical Implants. s.l. : Springer New York, 2009,
pp. 175-198.
15. Plasma sprayed hydroxyapatite coatings on titanium substrates Part 1: Mechanical properties and
residual stress levels. Tsui, Y.C., Doyle, C., Clyne, T.W. 1998, Biomaterials, Vol. 19, pp. 2015-2029.
16. Phase, structural and microstructural investigations of plasma sprayed hydroxyapatite coatings. Sun,
L., Berndt, C.C., Grey, C.P. 2003, Materials Science and Engineering A, Vol. 360, pp. 70-84.
17. Amorphous phase formation in plasma-sprayed hydroxyapatite coatings. Gross, K.A., Berndt, C.C.,
Herman, H. 3, 1997, Journal of Materials Research, Vol. 39, pp. 407-414.
18. The advantages of coated titanium implants prepared by radiofrequency sputtering from
hydroxyapatite. Cooley, D.R., Van Dellen, A.F., Burgess, J.O., Windeler, A.S. 1, 1992, The Journal of
Prosthetic Dentistry, Vol. 67, pp. 93-100.
19. Calcium phosphate coatings for medical and dental implants. Lucas, L.C., Lacefield, W.R., Ong, J.L.,
Whitehead, R.Y. 1993, Colloids and Surfaces A: Physicochemical and Engineering Aspects, Vol. 77, pp.
141-147.
20. Study of the surface characteristics of magnetron-sputter calcium phosphate coatings. Wolke, J.G.C,
van Dijk, K., Schaeken, H.G., de Groot, K., Jansen, J.A. 12, 1994, Journal of Biomedical Research, Vol. 28,
pp. 1477-1484.
21. Application of magnetron sputtering for producing ceramic coatings on implant materials. Jansen, J.A.,
Wolke, J.G.C., Swann, S., van der Waerden, J.P.C.M., de Groot, K. 1993, Clinical Oral Implants Research,
Vol. 4, pp. 28-34.
22. Energy dependence of ion-induced sputtering yields. Yamamura, Y., Tawara, H. 1996, Atomic Data and
Nuclear Data Tables, Vol. 62, pp. 149-253.
23. Ething techniques for gold-containing Ag3Sn alloys and amalgams. Malhotra, M.L. 1977,
Metallography, Vol. 10, pp. 337-347.
24. Scaling Laws of the Ripple Morphology on Cu(110). Rusponi, S., Costantini, G., Boragno, C., Valbusa,
U. 19, 1998, Physical Review Letters, Vol. 81, pp. 4184-4187.
25. Ripple Structure on Ag(110) Surface Induced by Ion Sputtering. Rusponi, S., Boragno, C., Valbusa, U.
14, 1997, Physical Review Letters, Vol. 78, pp. 2795-2798.
26. Osteoprogenitor response to semi-ordered and random nanotopographies. Dalby, M.J., McCloy, D.,
Robertson, M., Agheli, H., Sutherland, D., Affrossman, S., Oreffo, R.O.C. 15, 2006, Biomaterials, Vol. 27,
pp. 2980-2987.
27. Enhanced functions of osteoblasts on nanostructured surfaces of carbon and alumina. Price, R.L.,
Haberstroth, K.M., Webster, T.J. 3, 2003, Medical and Biological Engineering and Computing, Vol. 41, pp.
372-375.

64
28. Matrix vesicles and calcification. Anderson, H.C. 2003, Current Rheumatology Reports, Vol. 5, pp. 222-
226.
29. Cell maturation-specific autocrine/paracrine regulation of matrix vesicles. Boyan, B.D., Schwartz, Z.,
Swain, L.D. 1992, Bone and Mineral, Vol. 17, pp. 263-268.
30. Modulation of differentiation and mineralization of marrow stromal cells cultured on biomedical
hydrogels modified with Arg-Gly-Asp containing peptides. Shin, H., Ztgourakis, K., Farach-Carson, M.C.,
Yaszemski, M.J., Mikos, A.G. 3, 2004, Journal of Biomedical Materials Research Part A, Vol. 69A, pp. 535-
543.
31. Fluid flow increases mineralized matrix deposition in 3D perfusion culture of marrow stromal
osteoblasts in a dose-dependent manner. Bancroft, G.N, Sikavitsas, V.I., van den Dolder, J., Sheffield,
T.L., Ambrose, C.G., Jansen, J.A., Mikos, A.G. 20, 2002, Procedings of the National Academy of Sciences of
the United States of America, Vol. 99, pp. 12600-12605.
32. Effects of hydroxylapatite coating crystallinity on biosolubility, cell attachment efficiency and
proliferation in vitro. Chou, L., Marek, B., Wagner, W.R. 1999, Biomaterials, Vol. 20, pp. 977-985.
33. Influence of annealing temperature on RF magnatron sputtered calcium phophate coatings. van Dijk,
K., Schaeken, H.G., Wolke, J.G.C., Jansen, J.A. 1996, Biomaterials, Vol. 17, pp. 405-410.
34. Microstructure and mechanical properties of hydroxyapatite thin films grown by RF magnetron
sputtering. Nelea, V., Morosanu, C., Iliescu, M., Mihailescu, I.N. 2003, Surface and Coatings Technology,
Vol. 173, pp. 315-322.
35. Highly adhesive hydroxyapatite coatings on alumina substrates prepared by ion-beam assisted
deposition. Kim, T.M., Feng, Q.L., Luo, Z.S., Cui, F.Z., Kim, J.O. 1998, Surface and Coatings Technology,
Vol. 99, pp. 20-23.
36. Characterization of plasma sprayed hydroxyapatite by P-MAS-NMR and the effect of subsequent
annealing. Vogel, J., Russel, C., Gunther, G., Hartmann, P., Vizethum, F., Berner, N. 1996, Journal of
Material Science: Materials in Medicine, Vol. 7, pp. 495-499.
37. Comparison in crystallinity between natural hydroxyapatite and synthetic cp-Ti/HA coatings. Molena
de Assis, C., Cristina de Oliveira Vercik, dos Santos, M.L., Fook, M.V.L, Guastaldi, A.C. 2, Materials
Research, Vol. 8, pp. 207-211.
38. Characterization and dissolution behavior of sputtered calcium phosphate coatings after different
postdeposition heat treatment temperatures. Yang, Y., Agrawal, C.M., Kim, K.-H., Martin, H., Schulz, K.,
Bumgardner, J.D., Ong, J.L. 6, 2003, Journal of Oral Implantology, Vol. 29, pp. 270-277.
39. Osteogenic differentiation of mesenchymal stem cells in self-assembled peptide-amphiphile
nanofibers. Hosseinkhani, H., Hosseinkhani, M., Tian, F., Kobayashi, H., Tabata, Y. 2006, Biomaterials,
Vol. 27, pp. 4079-4086.