sqc - california
TRANSCRIPT

7
I f l m a U l TarkDwan$ChrnInw, Vol. 10, pp. 1541-1583, 1991 0130.7268/91 $I.@?+ .W @rd a aha USA. Pwzmon Prtm PIC C o p d m @ 199; SETAC
'0-1980: An his- Annual Review@PI 1981Envi. sns. LA, Apti!
TECHNICAL BASIS FOR ESTABLISHING SEDIMENT quality invat;. and post-BPT, QUALITY CRITERIA FOR NONIONIC ORGANIC
nentd Confn. CHEMICALS USING EQUILIBRIUM PARTITIONING !8, PD. 29-36. ninant residua fi. Res. Board D o m c M. DI TORO*
Environmental Engineering and Science Program, Manhattan College, Bronx, New York 10471, '81. The poilu. HydroQual, Inc., 1 Lethbridge Plaza, Mahwah, New Jersey 07430 achery.poperi
CIBISTOPI~ERS.ZARBA U.S. Environmental Protection .4gcncy Headquarters,
Office of Science and Technologv. Washinnon, DC 20460
DAVIDJ. HANSEN U.S. Environmental Protection Agency Laboratory, Narragansett, Rhode Island 02592
WALTER3. BERRY Science Application International Corporation, Narragansett, Rhode Island 02592
RICHARDC. SWARTZ U.S. Environmental Protection Agency Laboratory, Newport, Oregon 97365
CHRISTINAE. COWAN? BatteUe Pacific Northwest Laboratories, Richland, Washington 99352
SPYROSP. PAVLOU Ebasco Environmental, BeUevue, Washington 98004
HERBERTE.AUBN Department of Civil Engineering, University of Delaware, Newark, Delaware 19716
NELSONA. THOMAS U.S.Environmental Protection Agency Laboratory, Duluth, Minnesota 55804
PAULR. PAQUIN HydroQual, Inc., Mahwah, New Jersey 07430
(Received 18 June 1989; Accepred 26 June 1991)
Abstnn-The purpose of t h ~ s review paper is to presenl the technical basis for es(abiishing srdi- ment quality sntaia using equilibrium partitioning (EqPJ. Equilibrium panitioning IS chosen be-cause it addresses th? two principal technical issues that must be resolred: the varying bioavailability of chemicals in sediments and the choice of rhc appropriate b~ological effects conetooation.
The data that are used to examine the ~uuestion of varying bioavailabili across sediments are from toxicity and bioaccumulation experiments utilizing the same chemical and test organism but different sediments. It has been found that if the different sediments in each ex~eriment are com- pared. there is essentiallv no relationshio betweensedimmt chemical concentrations on a dm weight basis and bioio~ical effkcts. However. if the chemical concentrations in the oore water ofihe &d-. ~ ~ . .~ ~~~~~~~~ ~ ~~~~~~~~~
iment are used :for chemicals that arc not highly hydrophobic) if the scd&enr chemical concen- trations on an organic carbor basis are used, then the biological effects occur a: similar conuentratians (wittun a factor of two) for the differcnr sediments. In add~tion, the ef.~ec~s concen-.
'To whom correspondence may be addressed. The current address of C.E. Cowan is Procter & Gamble, Ivorydale Technical Center, Cincinnati, OH 45217

D. M.Dl TOR0 ET N.
trations are the same as, or they can be predicted from, the effects concentration determined in wm. is the LC51only exposures. of tl The EqP methodology rationaliics these results by assuming that the partitioning of the them. ical between sediment organic carbon and pofe water is at equilibrium. In each of these phases, the expli~ fugacity or activity of the chemical is the same at equilibrium. As a consequence, it is assumed that to decide W the organism receives an equivaient exposure from a water-only exposure or from any equilibratd : mcnt withc .phase; either from pore water via respiration; from sediment carbon via ingestion: or from a mix-ture of the routes. Thus, the pathway of exposure is not significant. The biological effect is pro. suits of tax duced by the chemical activity of the single phase or the equilibrated system. chemical
Sediment quality criteria for nonionic organic chemicald are based on the chemical concenua. able to 0tht tion in sediment organic carbon. For highly hydrophobic chemicals this is necessary because the pore the results water concentration is, for tnOse chemicals, no longer a good estimate of the chemical activity. ~h~ .strongl~ On pore water concentration is the sum of the free chemical concentration, which is bioauailable and 1 pie, Lake 5represents the chemical activity, and the concentration of chemical complexed to dissolved organic carbon, which, as the data presented below illustrate, is not bioavailable. Using the chemical con- source of th centration in sediment organic carbon eliminates this ambiguity. 1 be fruitless t'
Sediment quality criteria also require that a chemical concentration be chosen that is sufficiently teria (WQC: protective of benthic organisms. The final chronic value (FCV)from the U.S. Environmental pro- bioavailabilitection Agency (EPA) water Ctuality criteria is proposed. An analysis of the data Compiled in the water quatity criteria documents demonstrates that benthic species, defined as either epibenthic or : The obse
infaunal species, have a similar sensitivity to water column species. This is the case if the most to the proble sensitive species are compared and if all species are compared. The results of benthic colonization experiments also suppMt the use of the FCV. tion-respon:
Equilibrium partitioning Cannot remove all the variation in the experimentally observed sediment- concern COUIeffects concentration and the concentration predicted from water-only exposures. A variation of approximately a factor of two to three remains. Hence, it is recognized that a quantification of this ment-chemir uncertainty should accompany the sediment quality criteria. ical per gram
The derivation of sediment quality criteria requires (he octanol/water panition coefficient of the ' . (i,e., pore wa chemical. It should be measured with modem experimental techniques, which appear to remove the ical per liter large variation in reponed values. The derivation of the fmal chronic value should also he updated to include the most recent toxicological information. : concentratiol
tially equal tc Keywords-Equilibrium partitioning Sediment quality criteria Organic carbon normalization
lion, which is E ~ Papproac
OVERVIEW iments as a method of evaluation. They provide a chemical-by-chemical specification of what sedi-
This paper presents the technical basis for es- ment concentrations would be protective of benthic ,tablishing sediment quality criteria (SQC) for non- aquatic life. ionic organic chemicals using the equilibrium
major lines of reasoning. The references are cited Establishing SQC requires a determination of in the body of the paper. Sediment gualiiy criteria, the extent of the bioavailability of sedimenl- 1 as used herein, refers to numerical concentrations associated chemicals. It has frequently been a! for individual chemicals that are applicable across served that similar concentrations of a chemical, m the range of sediments encountered in practice. units of mass of chemical per mass of sediment dv ' Sediment quality criteria are intended to be predic- weight (e.g., micrograms chemical per gram sedi- live of biological effects. As a consequence they ment), can exhibit a range in toxicity in different could be used in much the same way as the final sediments. If the purpose of SQC is to establish ;chronic value water quality criteria-as the concen- chemical concentrations that apply to sediments of :
tration of a chemical that is protective of benthic differing types, it is essential that the reasons for this varying bioavailability be understood and be
The specific regulatory uses of SQC have not explicitly included in the criteria. Otherwise the cr'- been established. However, the range of potential teria cannot be presumed to be applicable across applications is quite large as the need for the eval- sediments of differing properties. uation of potentially contaminated sediments arises The importance of this issue cannot be overem- Fig. I . Diagranin many Contexts. Sediment quality criteria are phasized. For example, if 1 pg/g of Keponeis the Equilibrium par.meant to be used with direct toxicity testing of sed- LC50 for an organism in one sediment and 35+g/g tlculate sedimen

1543 Sediment quality criteria using equilibrium partitioning
is the LC50 in another sediment, then unless the cause of this difference can be associated with some explicit sediment properties it is not possible to dectde what would be the LC50 of a third sedi- ment without performing a toxicity test. The re- sults of foxicity tests used to establish the toxicity of chemlcal~ in sediments would not be generaliz- able to other sediments. Imagine the situation if the results of toxicity tests in water depended suondy on the particular water source-for exam-ple, Lake Sup$or versus well water. Until the
j . source of the differences was understood, it would be fruitless to attempt to establirh water quality cri-teria (\?rqC). It is for this reason that the issue of bioavallabiiity is a principal focus of this paper.
The observations that provided the key insight the problem of quantifying the bioavailabiity of
chemicals m sediments were that the concentra- tiOn-resPonse curve for the biological' effect of concern could be correlated, not to the total sedi- ment-chemical concentration (micrograms chem- leal Per gram sediment), but to the interstitial water
Po? water) concentration (micrograms chem- ical Per liter Pore water). In addition, the effects ~"entration found for the pore water iS essen- tiany equal to that found in water-only exposures. Organism mortality, growth rate, and bioaccumu-, lation data are used to demomtrate this correla- tlon, which is a critical part of the logic behind the EQPapproach to developing SQC. For nonionic
idea sedi-nthic
organic chemicals, it is shown that the concentra- tion-response curves correlate equally well with the sediment-chemical concenlration on a sediment- organic carbon basis.
These observations can be rationalized by as- suming that the pore water and sediment carbon are in equilibrium and that the concentrations are related by a partition coeffiaent, KO,,as shown in Figure 1 (right). The name equilibrium partitioning (EqP) describes this assumption of partitioning equilibrium. The rationaLiation for the equality of water-only and sediment-exposure-effects concen- trationson a pore water basis is that the sediment- pore water equilibrium system (right) provides the same exposure as a water-only exposure (left). The reason is that the chemical activity is the same in each system at equilibrium. It should be pointed out that the EqP assumptions are only approxi- mately true, and, therefore, the predictions from the model have an inherent uncertainty. The data presented below illustrate the degree to which EqP can rationalize the observations.
Figure 2 presents mortality data for various chemicals and sediments compared to pore water concentrations when normalkd on a toxic unit ba- sis. Three different sediments are tested for each chemical as indicated. Predicted pore water toxic units are the ratio of the measured pore water con- centration to the LC50 from water-only toxicity tests. The EqP model predicts that the pore water
Water Only Sediment - Pore Water Exposure Exposure
1 of :nt-ob- Biota
in Iry ii-nt
I t *
Carbon.,
Equilibrium Partitioning 1. Diagram of the organism for a ~ ~ t ~ - o n l yexposure (left) and a sediment vlposure (right).
E~uilibrlunlPQrfiiioningrefers to the assumption that an equilibrium &st$ between Ule chemical sorbed to the Par- llcu'ate sediment organic carbon and the pore water, The partition coefficient is KO,.

Pore Water Normalizatian
I I -? I 7
S w
- 80 . Kspons
* 60 s S DOT*.-- - - + - - O * Endrln RI r 40 0 0 Fluoranthens
1 I I 0.01 0.10 1.oo 10.00 100.00
Predicted Pore Water Toxic Units
Fit. 2. Mo~talitvversus oredicted Dare water toxic units for five chemicals and three sediments ner rhrmirnl P~A; .~, ~ ~ ~ ~ . . . ~ ~~~ ~ . ~ .r-. ".",~ m;nt types are indicated by the sin;; hatching (lowen organiccarbon content),cross-hatching(intermediateorganiccarbon content),and filled symbols (highest organic carbon content).See Tables 1 and 2 for data sources. Prcdictcd pore water loxlr units are the ratio of the pore water conccntation to [he water-only LC50 (Eqn. I ) .
LC50 will equal the water-only LC50, which is ob-tained from a separate water-only exposure toxic-ity test. Define:
predicted pore water toxic unit
-- (pore water concentration) (water-only LC501
. (1)
Thereforea toxic unit of one occurs when the pore water concentration equals the water-only LC50, at which point it would be predicted that 50% mor-tality would be observed. The correlation of ob-served mortality to prediPted pore water toxic units in Figure 2 demonstrates (a) the efficacy of using pore water concentrations to remove sediment-to-sediment differences and (b) the applicabilityof the water-only effects concentration and, by implica-tion, the validity of the EqP model. By contrast, as shown below, the mortality versus sediment-chem-ical concentrationon a dry weight basis varies dra-matically from sediment to sediment.
The equality of the effects concentration on a pore water basis suggests that the route of exposure is via pore water. However, the equality of the ef-fects concentration on a sediment-organic carbon basis, which is demonstrated below, suggests that the ingestion of sediment organic carbon is the ~ r i -
mary route of exposure. It is important to realize that if the sediment and pore water are in equilib-rium, then the effectiveexposure concentration is the same regardless of exposureroute. Therefore, it is not possible to determine the primary route of exposure from equilibrated experiments.
Whatever the route of exposure, the correlation to pore water suggests that if it were possible to either measure the pore water chemical concentra-tion or predict it from the total sediment concen-tration and the relevant sediment properties such as the sediment-organic carbon concentratiw, then that concentration could be used to quantify the exposure concentration for an organism. Thus, the partitioning of chemicals between thesolid and the liquid phase in a sediment becomes anecessw component for establishing SQC.
In addition, if it were true that benthic organ-isms are as sensitive as water column organisms-and the evidence to be presented appearsto support this supposition-then SQC could be established using the final chronic value (FCV) from Wac documents as the effects concentrationfor benthic organisms. The apparent equality between the ef-fects concentrationas measured in pore water and in water-only exposures (Fig. 2) supports using an effects concentration derived from water-only exnnenr-r
The c is as fol QJQC fc
- @/kg 31
coefficie and pore
This is t I SQC are,
tence of r i coefficien
Partitioni
The pa to soil and derstood, ; the process quantified efficient, 1 ment is det carbon for
, fat > 0.2Qfo to be the pr The partitic concentrati CJ is given
where K, is Organic cart
( The only a dramatic e: Particle conc
: K, is measur regarding the tide concent planations h, interpretatior pore water p for sediments is presented t
Using Equ from
This equation tion f A r

1545
--.., T,' . . Sediment quality criteria using equilibrium partitioning
m e calculation procedure for establishing SQC ir as follows If FCV (&L) is the fmal chronic WQC for the chemical of interest, then the SQC (pgfigsediment) are computed using the partition ~f define
Kp &/kg sediment) between sediment and pore water:
pons SQC = K, ECV. IT drin
loranthens
16rnlvrn
T~~~ is the fundamental equation from which SQCare generated. its depends on the exis- t w of a methodology fbr quantifying partition coefficients.
as the organic carbon-normalized SQC concentra- tion (microgram chemical per kilogram organic carbon), then
SQC,, =KO,FCV. partitioning of nonionic organic cheinicals
mica). Se&- "ate Organic s.Predicted
t to realize in equijib.
he partitioning of nonbnic organic cheficais to soil and sediment particles is reasonably well un- derstood, . a d a standard model exists for describing be process. The hydrophobicity of the chemical is
by using the odanol/water pattition co- efficient, KO,. The sorption capacity of the sedi- ment is determined by the mass fraction of organic carbon for the sediment, 5.. For sediments with fs > 0.2% by weight, the organic carbon appears to be the predominant phase for chemical sorption. *e partition coefficient, K~(the [atio Of sediment concentration, C,,to pore water concentration,
Hence we arrive at the following important con- clusion: par & specific chemical having a specific ,yOc,the organic carbon-normafized sediment con-cent,t,,ion, SQC.,, is independent of sediment properties,
~ ~ d ~ ~ ~ h ~ b i ~chemicals also tend to partition to co~~oi~al-sizedorganic carbon particles that are cornonly referred to as ~~sso,ve~organiccaroon, or DOC. ~ t h ~ ~ ~ hDOC affects the apparent pore water concentrations of highly hydrophobic them. icds, the DOC-^^^^^ fraction of the chemical ap-pears not to be bioavailable and Equation 7 for SQC,, still
:ntration is Cd) is given by Therefore, we expect that toxicity in sediments Therefore, can be predicted from the water-only effects con.
1s. (3) centration and the KO,of the chemical. The utility of these ideas can be tested with the same mortal-
,nt concen- The only other environmental variable that.has ' toxic units is useful in this regard. These are wm- erties such a d r a d c effect on partitioning appears to be the puted as the ratio of the organic carbon-normal- :entration, particle concentration in the suspension in which ized sediment concentrations, C,/f.,, and the 0 quantify . Kp is measured. There is considerable controversy predicted sediment LC50 using KO,and the water- ism. Thus,
' regarding the mechanism responsible for the par- only LCSO: That is: :solid and ticle concentration effect, and a number of ex- neeessaq planations have been offered. However, all the
interpretations yield the same result for sediment/ "C Organ- pore water partitioning, namely that KO,=: K,Fisms-for sediments. A detailed review of the arguments :O support is presented below. Figure 3 presents the percent mortality versus
centtations in Figure 2. The cadmium data are not
wter and SQC =fo,K,, FCV. (4) included because its partitioning is not determined
using an by sediment organic carbon. The predicted sedi- %is equation is linear in the organic carbon frac- ment toxic units for each chemical follow a simi- ster-only lion, f,,. As a consequence, the relationship can Iar concentration-response m e independent of be expressed as sediment type. These data demonstrate that 50%

D. M. Dt Toao ET AL.
Organic Carbon Normalization
-- @ 8 8 K0p0be
...nrn $ 4 4 Endrlb .
Predicted Sediment ~oxic Units
Fig. 3. Mortality versus predicted sediment toxic units. Predicted sediment toxic units are the ratio of the organic carbon-normalized sediment chemical concentration to the predicted sediment LC50 (Eqn. 8). Sediment types ape indicated by the single hatching (lowest organic carbon content), cross-hatching (intermediate organic carbon con-tent), and filled symbols (highest organic carbon content). See Tables 1 and 2 for data sources. KO,values are com- puted from KO, for DDT (5.84, endrin (4.801,and fluoranthene (5.30)with Equation I I. These are log averages of the reported values in the LogP data base 171). The Xepone K- is the log mean of the ratio of organiccarbon-normalized Kepone concentration to pore water-Kepone concentration from the toxicity data set.
mortality occurs at about one sediment toxic unit. for the most sensitive benthic (epibenthic and in-
and 30 saltwater U.S.Environmental Protection If the assumptions of EqP were exactly true and Agency (EPA) criteria documents. Although there
in the results (also see Table 2 below). This varia- sensitivity. tion reflects inherent variability in these experiments as well as phenomena that have not been accounted BACKGROUND for in the EqP model. This appears to be the limit of the accuracy and precision to be expected. Under the Clean Water Act (CWA), the EPA is
responsible for protecting the chemical, physical, Effects concenrralion and biological integrity of the nation's waters. In
The development of SQC requires an effects keeping with this responsibility, EPA published concentration for benthic organisms. Because ambient WQC in 1980 for 64 of the 65 prioritY POI-many of the organisms used to establish the WQC lutants and pollutant categories listed as toxic are benthic, perhaps the WQC are adequate esti- the CWA. Additional water quality documents that mates of the effects concentrations for benthic or- update criteria for selected consent decree and new ganisms. To examine this possibility, the acute chemicals have been published since 1980. These toxicity data base, which is used to establish the WQC are numerical concentration limits that are WQC, is segregated into benthic and water column protective of human health and aquatic life. Al-species, and the relative sensitivities of each group though these criteria play an important role in as- are compared. Ftgure 4 compares the acute values suring a healthy aquatic environment, they alone
;
F i . 4 . Am a particularuments. See
environmel : Toxic cc
contaminati imolemeut a
As a resu. cies in makit sediment, th and Standar established 2
approaches These and rc conference [I ing SQC 121 discussed [3 scope of nat," '

Sediment quality criteria using equilibrium partitioning
Comparison of Most Sensitive Species
0 Freshwater
con-com-:es of Log$() Benthic LC50 f p g l L ):anic
Fig. 4. A comparison of ihe minimum LC50 for water column versus benthic organisms. Each data point represents lpariicular chemical in either a freshwater or a saltwater exposure. The data are from the WQC or draft criteria doc-metus. See Table 4 for data sources.
in-umn. ater are not sufficient to ensure appropriate levels of O n environmental and human health protection. >ere Toxic contaminants in bottom sediments of the de- nation's lakes, rivers, wetlands, and coastal waters
Its, mate the potential for continued environmental degradation, even where water column contaminant ual levels comply with established WQC. The absence D l defensible SQC makes it difficult to accurately assess the extent of sediment contamination, im- Plement measures to limit or prevent additional
is "tamination from occurring, and identify and
1 , Implement appropriate remediation whenneeded.. In As a result of the need to assist regulatory agen- :d ties in making decisions concerning contaminated )I- anliment, the EPA's Office of Water Regulations in ,"d Standards, Criteria and Standards Division,
Dlablished a research team to review alternative, t . ~PProaches t o assess sediment contamination, .e b e and related problems were the subjectof a e mnference [I]. Alternative approaches to establish- - SQC [2]and their merits and deficiencies were - discussed [3j. Additional effons to identify the
of national sediment contamination [4] and loreview proposed approaches for addressing con-
iaminated sediments [5,6] were undertaken. The EqP method was selected because it appeared to provide the most practical, scientificdl~~ defensible, and effective regulatory tool for addressing indi- vidual chemicals associated with contaminated sed- iments on a national basis [TI.
Rafi0nd5"or selecting Ihe Eqp me*hod ' The principal reasons for the selection of the
EqP method were:
1. i t was likely that the EQP methbd would yield sediment criteria that were predictive of biolog- ical effects in the field and would be defensible when used in a regulatory context. These crite- ria directly address the issue of bioavailability and are founded on the extensive biological ef- fects data b m used to establish national WQC.
2. Sediment criteria could be readily incorporated into existing regulatory operations because a unique numerical sediment-specific criterion can be established for any chemical and compared to field measurements to assess the likelihood of significant adverse effects.
c

3. Sediment criteria could provide a simple and cost-effective means of screening sediment mea- surements to identify areas of concern and could provide regulators with information in a short period of time.
4. The method takes advantage of the large amount of data and expertise that went into the development of the national WQC.
5. The methodology could be used as a regulatory predictive tool to ensure uncontaminated sites would be protected from attaining unacceptable levels of contamination.
Relationship to WQC methodology
Perhaps the first question to be answered is: Why not use the already existing procedure for the development of WQC to develop SQC? A detailed methodology has been developed that presents the supporting logic, establishes the required minimum toxicological data set, and specifies the numerical procedures to be used to calculate the criteria val- ues [8]. Furthermore, WQC developed with this methodology are routinely used in the regulation of effluent discharges. A natural extension would be to apply these methods directly to sediments.
The WQC are based on total chemical concen- tration, and the transition to using dissolved chem- ical concentration for those chemicals that partition to a significant extent would not be difficult. The experience with site-specific modifications of the national WQC has demonstrated that the water- effect ratio- the ratio of chemical concentrations in site water to laboratory water that produces the same effect-has averaged 3.5 [9,101. The implica- tion is that differences of this magnitude due to variations in site-specific water chemistry are not an overwhelming impediment to nationally appli- cable numerical WQC.
The WQC are based on using the total chemi- cal concentration as a measure of bioavailable chemical concentration. However, the use of total sediment chemical concentration as a measure of bioavailable-or even potentially bioavailable- chemical concentration is not supported by the available data [II]. A summary of recent experi- ments is presented in the two sections that follow. The results of these experiments indicate that sed- iments can differ in toxicity by factors of 100 or more for the same total chemical concentration. This is a significant obstacle. Without a quanti- tative estimate of the bioavailable chemical con- centration in a sediment it is impossible to predict a sediment's toxicity on the basis of chemical mea-
!," ,,.. 'OR0 El AL.
surements. This is true regardless of the meth. applications odology used to assess biological impact-be it trations are g laboratory toxicity experiments or field data sets time. C0mpa comprising benthic biological and chemical Sam. ment criteria pling [12-151. ing an early 7
Without a unique relationship between chemi. an early warr cal measurements and biological end points that take correct applies across the range of sediment properties occur. that affect bioavailability, the cause and effect linkage is not supportable. If the same total chem. TOXI(
ical concentration is 100 times more toxic in one OF (
sediment than it is in another, how does one set The obser universal SQC that depend only on the total sedi. the problem ment chemical concentration? Any SQC that are chemicals in ! based on total sediment concentration have a po. response curl tential uncertainty of this order of magnitude. could be c o ~ Thus, it appears that bioavailability must be explic. chemical con itly considered for any sediment evaluation meth- gram dry sed odology that depends on chemical measurements tration (micr, and, in particular, in establishing defensible SQC. 1171. In retro!
sults do not r Applications of SQC primary rout
Sediment quality criteria that are reasonably ac. posure pathv curate in their ability to predict the potential for an equilibri~ biological impacts are likely to be useful in many ' I route of exp activities [16]. Sediment quality criteria are likely theless, this to play a significant role in the identification, mon- in understan itoring, and cleanup of contaminated sediment sediments. sites on a national basis and in ensuring that those sites that are uncontaminated will remain so. In Toxicity expt
some cases sediment criteria alone would be suffi- A substar cient to identify and to establish cleanup levels for bled that adc contaminated sediments. In other cases the sedi- ity and pore ment criteria should be supplemented with biolog- sources and ical sampling and testing before decisions are The data art made. Figures 5 to ;
In many ways sediment criteria developed with or growth ra the EqP methodology are similar to existing WQC. However, their application may be quite different. ;In most cases, contaminants exceeding WQC in the 1 water column need only be controlled at the source to eliminate unacceptable adverse impacts. Con- taminated sediments often have been in place for quite some time, and controlling the source of that Chemical
pollution (if the source still exists) may not be suf- Keponeficient to alleviate the problem. The difficulty is Kepone compounded because the safe removal and treat- Cadmium ment or disposal of contaminated sediments can be Fluoranthene
DDTlaborious and expensive. Endrin Sediment criteria can be used as a means for pre- Cadmium
dicting or identifying the degree and spatial extent Cadmium of contaminated areas such that more informed Cypermethrin regulatory decisions can be made. Sediment crite- Permethrin
Keponeria will be particularly valuable in site-monitoring

1549 Sediment quality criteria using equilibrium partitioning
meth--be it Lta sets 11 sam.
chemi. t S that Perties effect chem-in one <ne set 1 sedi-at are a po-
itude. :xplic-meth-ments SQC.
Iy ac- il for nany !ikely mon-ment :hose J. In :uffi-s for sedi-,log-
are
with QC. 'ent. Ithe urce :on-for
that ruf-y is :at-I be
]re-ent led :te-;ng
applications where sediment contaminant concen- "ations are gradually approaching the criteria over time Comparison of field measurements to sedi- ment criteria will be a reliable method for provid- ing an early warning of potential problems. Such an early warning would provide an opportunity to take corrective action before adverse impacts occur.
TOXICITY AND BIOAVAILABILITY OF CHEMICALS IN SEDUlENTS
The observation that provided a key insight into the problem of quantifying the bioavailability of chemicals in sediments was that the concentration- response curve for the biological effect of concern could be correlated, not to the total sediment chemical concentration (micrograms chemical per gram dry sediment), but to the pore water concen- tration (micrograms chemical per liter pore water) 1171. In retrospect it has become clear that these re- sults do not necessarily imply that pore water is the primary route of exposure. This is because all ex- posure pathways are at equal chemical activity in an equilibrium experiment (see Fig. I), and the route of exposure cannot be determined. Never- theless, this observation was the critical first step in understanding bioavailability of chemicals in sediments.
Toxicity experiments A substantial amount of data has been assem-
bled that addresses the relationship between toxic- ity and pore water concentration. Table 1lists the sources and characteristics of these experiments. The data are presented in a uniform fashion on Figures 5 to 8. The biological response-mortality or growth rate suppression-is plotted versus the
total sediment concentration in the top panel and versus the measured pore water concentration in the bottom panel. Table 2 summarizes the LC50 and EC50 estimates and 95% confidence limits for these data on a total sediment and pore water ba- sis, as well as the water-only values.
The results from Kepone experiments (Fig. 5) are uarticularlv dramatic 117.181. For the low or- . . . ganic carbon iediment (f,, = 0.09%), the 50th percentile total Kepone concentration for both Chironomus fentans mortality (LCSO) and growth rate reduction from a life cycle test (EC50) are < I pg/g. By contrast, the 1.5% organic carbon sedi- ment EC50 and LC50 are approximately 7 and 10 pg/g, respectively. The high organic carbon sedi- ment (12%) exhibits still higher LC50 and EC50 values on a total sediment Kepone concentration basis (35 and 37 &g, respectively). However, as shown in the bottom panels, essentially all the mor-tality data collapse into a single curve and the vari- ation in growth rate data is significantly reduced when the pore water concentrations are used as the correlating concentrations. On a pore water basis, the biological responses as measured by LC50 or EC50 vary by approximately a factor of two, whereas when they are evaluated on a total sedi- ment Kepone basis they exhibit an almost 40-fold range in Kepone toxicity. The comparison between the pore water effects concentrations and the water-only results indicates that they are similar. The pore water LCSOs are 19 to 30 pg/L, and the water-only exposure LC50 is 26 pg/L. The pore water ECSOs are 17 to 49 pg/L, and the water-only EC50 is 16 pg/L (Table 2).
Laboratory experiments have also been per- formed to characterize the toxicity of fluoranthene [I91 and cadmium [20] to the sediment-dwelling
Chemical
KeponeKeponeCadmium Fluoranthene DDT Endrin Cadmium Cadmium
Table 1. Sediment toxicity data and bioaccumulation data
ExposureSediment duration Biological
Organism source (days) end point Reference Figure
C~permethrin Chironornus tentans River and pond Permethrin Chironomus tentans River and pond Kepone Chironomus fenlans Soil
Chironomus tenfans Soil Chironomus tentans Soil Rhepoxynius abronius Yaquina Bay, OR Rhepoxynius abronius Yaquina Bay, OR Hyalella azfeca Soap Creek, Mercer Lake Hyoleh azteca Soap Creek, Mercer Lake Rhepoxynius abronius Yaquina Bay, OR Ampeiisca abdita Long Island Sound
14 Mortality 1171 5 14 Growth 1171 4 Mortality [201 6
10 Mortality [I91 6 10 Mortality [21,22] 7 10 Mortality 121,221 7 4 Mortality 8
10 Mortality [24l 8 1 Body burden [261 9 1 Body burden [26] 9
14 Body burden [17,281 -

D. M. DI TOROET AL.
Table 2. LC50 and EC50 for sediment dry weight and sediment-organic carbon normalization and for pore-water and wateronly exposures
LC50 and EC5O
Chemical f, Total sediment Pore water (end point) (%)
0.09 0.90 (0.73-1.10) 29.9 (25.3-35.6) 1,WO (811-1,220) 26.4 (22.7-30.6) [nl
0.09 0.46 (0.42-0.51) 17.1 (15.7-18.7) 511 (467-567) 16.2 (15.0-17.5) (17)
12.0 37.3 (31.5-44.2) 20.1 (16.7-24.1) 31 1 (262-368) Huoranthene 0.2 3.2 (2.85-3.59) 21.9 (19.6-24.4) 1,600 (1,430-1,800)
(mortality) 0.3 6.4 (5.56-7.27) 30.9 (27.0-35.4) 2,130 (1,850-2,420) 0.5 10.7 (8.34-13.7) 22.2 (17.5-29.3) 2,140 (1,670-2,740)
DDT 3.0 (mortality) 7.2
10.5 DDT 3.O
(mortality) 3.0 11.0
Endrin 3.0 ,' (mortality) 6.1
11.2 Endrin 3.0
(mortality) 11.0 11.0
Cadmium 0.0 (mortality) 0.25
1.0
The LC5Os and EC5Os and the 95% confidence limits in parentheses are computed by the modified Spearman-Karber method [El].
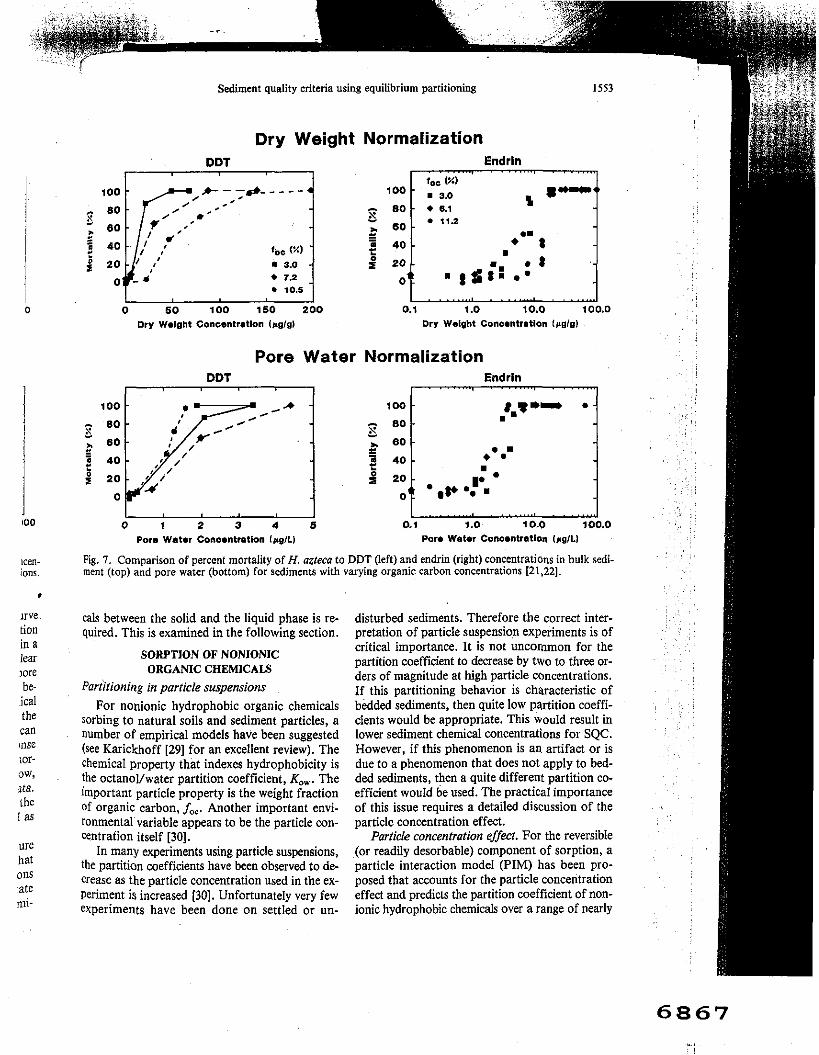
marine amphipod Rhepoxynius abronius. Figure 6 the correlating variable again collapses the data presents the R. abronius mortality data for the flu- into one concentration-response curve. oranthene and cadmium experiments. The results Figure 7 presents mortality data for DDT and of the fluoranthene experiments parallel those for endrin using the freshwater amphipod Hyalello Kepone. The sediment with the lowest organic car- azleca 121,221. The responses for DDT 1211 are bon content (0.2%) exhibits the lowest LC50 on a similar to those observed for Kepone, cadmium, total sediment concentration basis (3.2 @g/gg), and and fluoranthene. On a total sediment concentra- as the organic carbon concentration increases (0.3 tion basis the organism responses differ for the and 0.5%) the LC50 increases (6.4 and 10.7 pg/g). various sediments (LC5Os are 10.3-45 pg/L), but On a pore water basis, the data again collapse to on a pore water basis the responses are again sim- a single concentration-response curve and the ilar (LC50s are 0.74-1.4 g / L ) and comparable to LCSOs differ by less than 50%. the water-only LC5Os of approximately 0.5 pg/L.
The cadmium experiments (201 were done with The DDT data in 1221 are more variable. By con- constant pore water concentrations and a sediment trast, the organism survival for endrin exposures amended with varying quantities of organic car- varies by a factor of almost six among the six sed- bon. The unamended and 0.25% additional or- iments. The LC5Os are 3.4 to 18.9 @g/g.The pore ganic carbon exhibit essentially similar responses. water LC5Os were less variable-1.7 to 3.8 pg/L- However, the 1% amended sediment had a much and comparable to the water-only exposure LC50 different LC50, based on the total sediment con- of approximately 4 @g/L (Table 2). centration. Using the pore water concentrations as Additional cadmium toxicity data are compared
Pon
Fig. 5. Cornparis'"bulk sediment
on Figure 8. Th Ampetisca abdi Posures withou Pore water con, (lower panels) d responses are sir fie concentratic mium concentra It is interesting a b i t similar se aPOSures (0.34 I
R.abroniw-Iment cadmium I Of magnitude (25 the different sedh demonstrate the availability of sec tion, any toxican It has been demo,
1

1551 Sediment quality criteria using lquilibrium partitioning
Dry Weight Normalization Kepone - M o r t a l i t y Kepone - Growth
..I I . . . . . . .I . . . . . . . .I . .
I . . . . . . . . . . . . . . . . . . . . .. . .A I . . . . . . . . . . ..: . . . . . . ..J 0.1 1.o 10.0 100.0 0.1 1.o 10.0 100.0
Dry Welght Concentration Ipglgl Dry Weight Concsntratlon lrglgl
Pore Water Normalization Kepone - M o r t a l i t y Kepone - Growth
4 0
Pore Water Concentration IpglLl Pore Water Concentration ( z~ IL I
Fig. 5. Comparison of percent mortality (left) and growth rate reduction (right) of C. fenfans to Kepone concentration ln bulk sediment (top) and pore water (bottom) for three sediments with varying organic carbon concentrations [17].
data
' and llella ] are ium, ntra-r the ,but sim-
)le to g/L. con-sures : sed-pore /L--C50
on Figure 8. The responses of R. abronius 1231 and Ampelisca abdita (241 to cadmium in seawater ex- posures without sediment and to the measured Pore water concentrations in sediment exDosures (lower panels) demonstrate again that the survival responses are similar with or without the sediment. The concentration-response curves using total cad- mium concentrations are also shown (top panels). It is interesting to note that these two organisms exhibit similar sensitivity to cadmium in water-only exposures (0.34 mg/L for A. abdita and 1.6 mg/L forR. abronius-bottom panels), yet the total sed-Unent cadmium LC5Os differ by almost two orders of magnitude (25 and 2,000 pg/g, respectively) for the different sediments. These dramatic differences demonstrate the need to explicitly consider bio- availability of sediment cadmium and, by implica- tion, any toxicant of concern in developing SQC. It has been demonstrated that the variation in bio-
availability of cadmium and nickel in various freshwater and marine sediments can be related to the acid-volatile sulfide concentration of the sedi- ment 124.251. . . . Bioaccumulation
A direct measure of chemical bioavailability is the amount of chemical retained in ofganism tis- sues. Hence, tissue bioaccumulation data can be used to examine the extent of chemical bioavail- ability. Chironomus tentans was exposed to two synthetic pyrethroids-cypermetbrin and perme- thrin-that were added to three sediments, one of which was laboratory-grade sand [26]. The bioac- cumulation from the sand was approximately an order of magnitude higher than it was from the organic carbon-containing sediments for both cy-permethrin and permethrin (Fig. 9, top panels). On a pore water basis, the bioaccumulation ap-

Dry Weight Normalization Fluoranthene Cadmium
S 0.5
40 IOC (X)
$ 20 .0.0
0.26.1.0
0 5 10 15 20 0 20 40 60 80 ~ r ywelsh: Concantratlon IrgIgI Dry Welght Concenttatlon I w ~ l g t
Pore Water Normalization Fluoranthene Cadmium
I 1 r
Pore Water Concentration IpgILl Pore Water Concantration IpglLI
Fig. 6. Comparison of percent mortality of R. abroniw to fluoranthene[I91 (left)and cadmium [ZO] (right)concen-trations in bulk sediment (top) and pore water (bottom) for sediments with varying organic carbon concentrations.
pears to be approximately linear and independent sediments can be reduced to essentially one curve of sediment type (bottom panels). The mean bio- if pore water is considered as the concentration accumulation factor (BAE)for cypermethrin (and that quantifies exposure-can be interpreted in a permethrin) varies from 6.2 to 0.6 (4.0-0.23) (&g number of ways. However, it has become clear organism/pg/g sediment) as sedimentf, increases that these results do not necessarily imply that pore (Table 3). By contrast the mean BAFs on a pore water is the primary route of exposure. This is be-water basis vary by less than a factor of 2. cause all exposure pathways are at equal chemical
Bioaccumulationwas also measured by Adams activity in an equilibrium experiment. Hence the et a\. [17,27,28)in the C.tentans-Kepone experi- route of exposure cannot be determined. This can ments presented previously (Fig. 3). The body bur- be seen by comparing the concentration-response den variation on a total sediment basis is over two correlations to pore water and organic carbon-nor-orders of magnitude (BAF = 600 to 3.3 pg/g or- malized sediment concentrations. As shown below, ganism/pg/g sediment), whereas the pore water both are equally successfulat correlating the data. bioaccumulation factor is within a factor of 4 This suggests that neither the pore water nor the (5,200-17,600 rg/kg organism/pg/L), with the sediment exposure pathway can be implicated as very low organic carbon sediment exhibiting the the primary exposure route. largest deviation (Table 3). However, in order to relate pore water.expOsure
to sediment carbon exposure, it is necessary thatConclusion the relationship between these two concentrations
These observations-that organism coucentra- be established. Thus, an examination of the state tion response and bioaccumulation from different of the art of predicting the partitioning of cheml-
Fig. 7. ment (tl
cals be1 quired.
Partitio For
sorbing number (see Kal chemica the octa importa of orgal ronment centratic
In m; the patti crease as periment experimc
Sediment quality criteria using equilibrium partitioning 1553
Icen-ions.
, lrve tion in a lear lore be-ical the can tnse lor-OW, 2ta. the
I as
ure hat ons ate mi-
Dry Weight Normalization Endrln
)--&-----
.11.2
L .I
I.3.0 I, .8 7.2 1 tdg. a m 10.5
. . . . . . . . . . . . . . . . . . . .I I I ..m
0 50 100 150 200 0.1 1.O 10.0 100.0 Dry Weight Concentretlon Izglgl Dry Weight Concentration (pgkl
Pore Water Normalization DDT Endrln
I I I ' ' ' """' ' ' """I
POI. Water Concantration frglL1 POT. Water Concentration IpglL1
Fig. 7. Comparison of percent mortality of H. ozfeca to DDT (left) and endrin (right)concentrations in bulk sedi-ment (top) and pore water (bottom) for sediments with varying organic carbon concentrations [21,22].
cals between the solid and the liquid phase is re- disturbed sediments. Therefore the correct inter-wired. This is examined in the following section. ret tat ion of particle suspension experiments is of-
SORPTION OF NONIONIC ORGANIC CHEMICALS
Partitioning in particle suspensions For nonionic hydrophobic organic chemicals
sorbing to natural soils and sediment particles, a number of empirical models have been suggested (see Karickhoff [29] for an excellent review). The chemical property that indexes hydrophobicity is the octanol/water partition coefficient, KO,. The important particle property is the weight fraction of organic carbon, f,,. Another important envi-ronmental variable appears to be the particle wn-centration itself [30].
In many experiments using particle suspensions, the partition coefficients have been observed to de-crease as the particle concentration used in the ex-periment is increased [30]. Unfortunately very few experiments have been done on settled or un-
critical importance. It is not uncommon for the partition coefficient to decrease by two to three or-ders of magnitude at high particle concentrations. If this partitioning behavior is characteristic of bedded sediments, then quite low partition coeffi-cients would be appropriate. This would result in lower sediment chemical concentrations for SQC. However, if this phenomenon is an artifact or is due to a phenomenon that does not apply to bed-ded sediments, then a quite different partition co-efficient would be used. The practical importance of this issue requires a detailed discussion of the particle concentration effect.
Particle concentration effect. For the reversible (or readily desorbahle) component of sorption, a particle interaction model (PIM) has been pro-posed that accounts for the particle concentration effect and predicts the partition coefficient of non-ionic hydrophobic chemicals over a range of nearly

D.M. DI TOR0 8T AL.
Dry Weight Normalization Cadmlum - Ampelisca
lo0 10% lo2 103 lo4 105 Dry Weloht Concentration IpgIgI
Pore Water Normalization
Pore Water Caneantration (mg/L)
seven orders of magnitude with a log,, prediction standard error of 0.38 [311. The reversible compo- nent partition coefficient, K;, is the ratio of re-versibly bound chemical concentration, C, (pg/kg dry weight), to the dissolved chemical concentra-
0.01 Por
f,,=particle oiganic carbon weight fraction (kg organic carbon/kg dry weight)
m = particle concentration in the suspension (kg/L)
ux = 1.4, an empirical constant (unitless). tion, C, (@/L):
C,=K;Cd.
The PIM model for K,' is
The regression of KO,to the octanol/water coeffi- (9) cient, KO,, yields Chemical
(10)
K,'= reversible component partition coeffi- cient (L/kg dry weight)
KO,= particle organic carbon partition coeffi- cient (L/kgorganic carbon)
log,, KO,= 0.00028 + 0.983 log,, KO, (11) C~permethrin
which is essentially KO,approximately equals KO,. F~ggure 10 presents the observed versus predicted re- Pennethrin
versible component partition coefficients using this model 1311. A substantial fraction of the data in the regression is at high particle concentrations Kepone
(mf,,K,, > lo), where the partitioning is deter- mined only by the solids concentration and us. The low particle concentration data (mf,,K, < 1)
'95% confidence li


Reversible Component Partition Coefficient 6
-2 -2 0 2 4 6
Predicted Log10 K'p &/kg)
Fig. LO. Comparison of observed reversible component partition coefficient to calculated partition coefficient us-ing Equation 10 [31].
are presented on Figure 11 for the conventional ad- sorption (left) and reversible component (right) partition coefficient, K,, normalized by f,,, that is, KO, = K,/f,. The relationship KO,= KO, is demonstrated from the agreement between the line of perfect equality and the data. It is important to note that while Equation 10applies only to the re- versible component partition coefficient, K;, the equation K, E foeKO, applies to the conventional adsorption partition coefficient as well (Fig. 11, left).
A number of explanations have been offered for the particle concentration effect. The most popular is to posit the existence of an additional third sorbing phase or complexing component that is associated with the particles but is inadvertently measured as part of the dissolved chemical concen- tration due to experimental limitations. Colloidal particles that remain in solution after particle sep- aration [32,33] and dissolved ligands or macromol- ecules that desorb from the pparficles and remain in solution 134-371 have been suggested. It has also been suggested that increasing particle concentra- tion increases the degree of particle aggregation,
decreasing the surface area and hence the partition coefficient [38]. The effect has also been attributed to kinetic effects [29].
Sorption by nonseparated particles or complex- ing by dissolved organic carbon can produce an apparent decrease in partition coefficient with in- creasing particle concentration if the operational method of measuring dissolved chemical coneen- tration does not properly discriminate the truly dis- solved or free chemical concentration from the complexed or colloidally sorbed w o n . However, the question is not whether improperly measured dissolved concentrations can lead to an apparent decrease in partition coefficient with increasing particle concentrations. The question is whether these third-phase models explain all (or most) Of the observed partition coefficient-particle concen- tration relationships.
An alternate possibility is that the particle Con- centration effect is a distinct phenomena that is a ubiquitous feature of aqueous-phase particle So@- tion. A number of experiments have been designed to explicitly exclude possible third-phase interfer- ences. Both the resuspension experiment for polY-
Fig. 11. Comparis coefficient, K,, 1,. .v7
chlorinated bipl [40,411 in which I duced volume of periment [391 in diluted with supe play particle conc see how third-ph results because tl particles is consta , sediment particle
The model (El sis that particle cc additional desorpt particle interactior actual particle col
. interpretation rel: for desorption an( dent of the chemk that has been exp'
It is not neces mechanisms is res possible interpret: sediment/pore Wal tion models would the particles are s phase models wou complexed) dissol particulate concent

Sediment quality criteria using equilibrium partitioning
Partition Coefficient - mfb, K.,, * 1
Adsorption Reversible Component
Log10 KO, Log10 KO,
Fig. 11. Comparison of the adsorption (1eft)'and reversible component (right) organic carbon-normalized partition coefficient,KO,,to the octanol/water partition coefficient, KO,, for experiments with low solids concentrations: mf..K., < 1. The line represents equality [31].
:ient US-chlorinated biphenyls (PCBs) [39] and metals 140,411 in which particles are resuspended into a re- duced volume of supernatant and the dilution ex- periment [39] in which the particle suspension is
utition diluted with supernatant from a parallel vessel dis- ributed play particle concentration effects. It is difficult to
see how third-phase models can account for these mplex- results because the concentration of the colloidal uce an particles is constant while the concentration of the lith in- , sediment particles varies substantially. 3tional The model (Eqn. 10) is based on the hypothe- oncen- sis that particle concentration effects are due to an ~lydis- additional desorption reaction induced by particle- ,m the Panicle interactions [31]. It has been suggested that wever, actual particle collisions are responsible [42]. This ssured interpretation relates v, to the collision efficiency parent for desorption and demonstrates that it is indepen- zasing dent of the chemical and particle properties, a,fact hether that has been experimentally observed [31,40]. ,st) of It is not necessary to decide which of these ~ncen- mechanisms is responsible for the effect if all the
Possible interpretations yield the same result for e Wn- Sediment/pore water partitioning. Particle interac- at is a tion models would predict that KO,=K,, because sorp the particles are stationary in sediments. Third-
;igned Phase models would also relate the free (i.e., un- erfer- Complexed) dissolved chemical concentration to poly Particulate concentration. via the same equation. As
for kinetic effects, the equilibrium concentration is again given by the relationship KO,= KO,. Thus there is unanimity on the proper partition coeffi- cient to be used in order to relate the free dissolved chemical concentration to the sediment concentra- tion, that is, KO,=KO,.
Organic carbon fraction. The unifying param- eter that permits the development of SQC for non- ionic hydrophobic organic chemicals that are applicable to a broad range of sediment types is the organic carbon content of the sediments. This can be shown as follows: The sediment/pore water par- tition coefficient, Kp is given by
Kp =f"K" =focKow
and the solid-phase concentration is given by
cs =focKoc Cd
where C, is the concentration on sediment parti- cles. An important observation can be made that leads to the idea of organic carbon normalization. Equation 12 indicates that the partition coefficient for any nonionic organic chemical is linear in the organic carbon fraction, f,. The partitioning data examined in Figure 11 can be used to examine the linearity of Kp to f,,. Figure 12 compares K,/K,,
A

D. M. Dr Tono ET N..
Adsorption Reversible component
* mf,,K,, < 1. The line represents perfect agreement 1311.
' iies the ratio c
to f,, for both the adsorption and the reversible Therefore, for a specific chemical with a spkcific the free dissol'
normalization is valid. proportional relationship given by Equation 16,the As a consequence of the linear relationship of concentration of free dissolved chemical can be A recent col
C,and fa,, the relationship between sediment con- centration, C,,and free dissolved concentration,
predicted from the normalized sediment ConWtr* tion and K,. The free concentration is of concern
additional exper 1431. A summar:
Cd,can be expressed as as it is the form that is bioavailable. The evidence six chemicals to is discussed in the next section. ' humic acid (HA
Dissolved organic carbon (DOC) complering nitudes of the p; der: POC > HA
In addition to partitioning to particulate or- on K D ~ ~would If we define ganic carbon (POC) associated with sediment Par-
ticles, hydrophobic chemicals can also partition to POC partition c
the organic carbon in colloidal-sized particles. Be- cause these particles axe too small to be removed by conventional filtration or centrifugation, they Chemicals in
as the organic carbon-normalized sediment con- centration (fig chemical/kg organic carbon), then from Equation 14:
are operationally defined as DOC. Because sep' ment interstitial waters frequently contain og. nificant levels of DOC, it must be considered In
evaluating the phase distribution of chemicals,
three phases: frc POC, and chemi the partitioning a1 Ihe mass balance
A distinction is made between the free dissolved chemical concentration, Cd,and the DOC-com-
1559 Sediment quality criteria using equilibrium partitioning
Chemlcsls
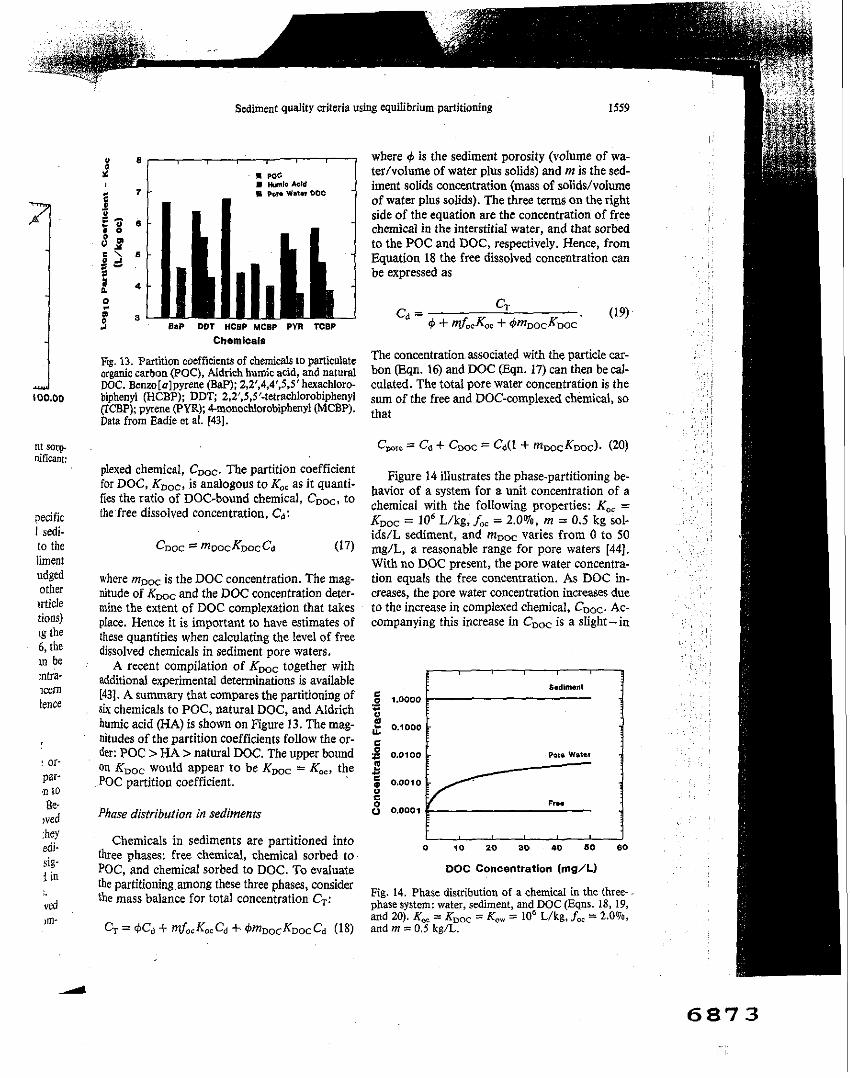
Fig. 13. Partition coefficients of chemicals to particulate organic carbon (POC), Aidrich humicacid, and natural DOC. Benzo[a]pyrene (BaP);2,2',4,4',5,5'hexachloro-biphenyl (HCBP); DDT;2,2',5,5'-tetntchlorobi~hen~I(TCBP); pyrene (PYR);4-monochlorobiphenyl NCBP). Data from Eadie et al. f431.
nt sarp ~ficant:
plexed chemical, CDOC. The partition coefficient for DOC, KDoc, is analogous to KO, as it quanti- fies the ratio of DOC-bound chemical, CDOC, to
?,,ific the free dissolved concentration, Ca: I sedi-to the CDOC ~ D O C K D O C C ~ (I7) liment udged where moot is the DOC concentration. The mag- Other nitude of KDoc and the DOC concentration deter- laicie mine the extent of DOC complexation that takes tions) place. Hence it is important to have estimates of 'g the these quantities when calculating the level of free
the dissolved chemicals in sediment pore waters. ~nbe A recent compilation of KDoc together with
additional experimental determinations is available ~cem 1431. A summary that compares the partitioning of lenCe six chemicals to POC, natural DOC, and Aldrich
humic acid (HA) is shown on Figure 13. The mag- nitudes of the partition coefficients follow the or- der: POC > HA > natural DOC. The upper bound
: OI- on K,,, would appear to be KDoc = KO,, the par- POC partition coefficient. ,n to Be.
wed Phase distribution in sediments
:hey edi- Chemicals in sediments are partitioned into
three phases: free chemical, chemical sorbed to sig POC, and chemical sorbed to DOC. To evaluate iin +the partitioningamong these three phases, consider
the mass balance for total concentration CT:
~ m - CT = $C,j + mfocKo,Cd (18)
where 4 is the sediment porosity (volume of wa- ter/volume of water plus solids) and m is the sed- iment solids concentration (mass of solids/volume of water plus solids). The three terms on the right side of the equation are the concentration of free chemical in the interstitial water, and that sorbed to the POC and DOC, respectively. Hence, from
The concentrationassociated with the particle cat-bon (Eqn. 16)and DOC (Eqn. 17) can then be cal-culated. The total pore water concentration is the sum of the free and DOC-complexed chemical, so that
cpYe = Cd(l + m o o c K ~ o c ) (20) = Cd + CDOC
Figure 14 illustrates the phase-partitioning be. havior of a system for a unit concentration of a chemical with the following properties: = KDoc = lo6L/kg, fOc = 2.0%, m = 0.5 kg sol- ids/L sed~ment, and mDoc varies from 0 to 50 m g / ~ , a reasonable range for pore waters [44]. With no DOC present, the pore water concentra- tion equals the free concentration. As DOC in- creases, the pore water concentration inaeaes due to the increase in complexed chemical, Coo,. Ac-companying this idcrease in CDoc is a slight-in
8 ,,oo, g2 o.rooo .=8 o.oroo
2
0 l o 20 30 40 60 60
DOC Concentration (mg/L)
Fig, 14, Phase distribution of a chemical in the three. ,,
phase system: water, sediment, and DOC (Eqns. 18, 19, and 20). K, = KD, = KO, = LO6 L/kg, f., = 2.090, and m = 0.5 kg/L.

fact, insignificant-decrease in C, (Eqn. 19) and a proportional decrease in C, (Eqn. 16).
It is important to realize that the free chemical concentration, Cd,can be estimated directly from C,,,, the organic carbon-normalized sediment concentration, using Equation 16and that the es-timate is independent of the DOC concentration. However, to estimate Cd from the pore water con-centration requires that the DOC concentration and Kooc be known. The assumption C,, = Cd is clearly not warranted for very hydrophobic chemicals. For these cases C,,,, gives a more direct estimate of the free dissolved bioavailable concen-tration, Cd,than does the porewater concentration.
Bioavailability of DOC-complexed chemicals
The proportion of a chemical in pore water that is complexed to DOC can be substantial (Fig. 14). Hence, the question of bioavailability of DOC-complexed chemical can be important in assessing toxicity 'directly from measured pore water concen-trations. A significant quantity of data indicates that DOC-complexed chemical is not bioavailable. Fish 1451and amphipod [46] uptake of polycyclic aromatic hydrocarbons (F'AHs) are significantlyre-duced by adding DOC. An example is shown in Figure 15 for a freshwater amphipod [46]. For a
Control-- I .DOC T
Chemical
Fig. IS. Average uplake rate of chemicals by Pon-toporeio hoyi with (filled)and w~ihout(hatched)DOC prescnr. Benzolulpyrene(BaP); 2,2',4,4'-te~rarhlorob~. phenyl (TCBP);pyrene; phenanihrene. Data from Lm-drum et al. 1461.
highly hydrophobic chemical such as b e n z ~ [ a ] ~ ~ . rene (BaP)the effect is substantial, whereas for less hydrophobic chemicals (e.g., phenanthrene) there. duction in uptake rate is insignificant.This is the expected result because, for a flied amount of DOC, the quantity of DOC-complexed chemical decreases with decreasing K D O ~(Eqn. 17).
The quantitative demonstration that DOC.com. plexed chemicals are not bioavailable requires an independent determination of the concentration of complexed chemical. Landrum et al. [46] have developed a C18reversed-phase HPLC column technique that separates the complexed and free chemical. Thus it is possible to Compare the mea.
Field obser in sedimeni
There el tory data f c However, P samples are samples are the partiti01 independen ond examin1 trations and
Organic jnlent samp rlaqses after
sured DOC-complexed chemical to the quantity of complexed chemical inferred from the uptake experiments, assuming that all the complexed chemical is not bioavailable 146,471. As shown on Figure 16, although the K ~ o cinferred from up-take suppressionis larger than that inferred from the reversed-phase separation for HA, these data support the assumption that the DOC-complexed fraction, CDoc, is not bioavailable. Hence the bioavailable form of dissolved chemical is C,, the free uncomplexed component. This is an important observation because it is Cd that is in equilibrium with C,,,,, the organic carbon-normalized sedi-ment concentration (Eqn. 15).
were in con equilibrium letting C,(j tion of the j
where f d l each size clas basis this eql
where Cs,oc(,
DOC Partition Coefficient-10000
numls Asld A Pare Wetar *
u' KO, from Reverse Phaae (L/g 06)
Fig. 16. Comparison of the DOC partition coefficient calculated fromthe suppressionof chemical uptake ?Bus the C,,reversed-phase HPLC column estimate. Circles are Aldrich humic acid; triangles are interstitial water DOC. Chemicals are listed in Figure 15 caption (alsoan-thracene and benzofalanthracene).
cates that the concentratior each size cla! for each size ity of both or would be to e across size cl;
Data from prediction. Se stations near I 4, 5 and 7). T sized fraction (>64 pm). TI-rated into a lo the remaining The concentri measured in e
It is import. are not pure cl ticles in the si? sand. The org Figure 17, ran sand-sized fracl density fractio~ nitude and esse~

1561 Sediment quality criteria using equilibrium partitioning
for less the re. s is the unt of .emical
3-cdm-ires an tration il have olumn ~d free :mea-
m up- l from e data plexed ce the h, the ortant brium : sedi-
~t
, ) icient iersus :irclB water ;a a*
observations of partitioning in sediments
There exists an enormous quantity of labora- tory data for partitioning in particle suspensions. However, pore water and sediment data from field
are scarce. Two types of data from field samples are examined. The first is a direct test of [he partitioning equation Cs,o. = Ko,Cd, which is independent of the DOC concentration. The sec-
examines the sediment and pore water wncen- [rations and accounts for the DOC that is present.
Organic carbon normalization. Consider a sed- iment sample that is segregated into various size classes after collection. The particles in each class
Cs( j ) =fw(j)Koccd (21)
where foc ( j ) is the organic carbon fraction for each size class j. On an organic carbon-normalized basis this equation becomes
cs,oc(j)= KacCd (22)
where C,,,,( j ) = C, (j)/foos( j). This result indi- cates that the organic carbon-normalized sediment concentration of a chemical should be equal in each size class because KO,and Cd are the same for each size class. Thus a direct test of the valid- ity of both organic carbon normalization and EqP would be to examine whether C,,o,(j) is constant across size classes in a sediment sample.
Data from Prahl [48] can be used to test this prediction. Sediment cores were collected at three stations near the Washington State coast (Stations 4, 5 and 7). These were sieved into a silt-and-clay- sized fraction ( 4 4 pm) and a sand-sized fraction (>64 ~ m ) . This latter fraction was further sepa- rated into a low density fraction (<1.9 g/cm3) and the remaining higher density sand-sized particles. The concentrations of 13 individual PAHs were measured in each size fraction.
It is important to realize that these size fractions are not pure clay, silt, or sand but are natural par- ticles in the size classes denoted by clay, silt, and sand. The organic carbon fractions, shown on Figure 17, range from 0.2% for the high-density Sand-sized fraction to greater than 30% for the low- density fraction. This exceeds two orders of mag- nitude and essentially spans the range usually found
.
Organic Carbon Fractions
3 -g
Sediment Fraction
from Prahl [48].
in practice. FOIexample, 90% of the estuarine and coastal sediments sampled for the National Status and Trends program exceed 0.2% organic carbon [491.
Figure 18 (top) compares the dry weight-nor- malized clay-silt-sized fraction sediment PAH con- centrations, C,( j ) , to the sand-sized high- and low-density PAH concentrations on a dry weight basis. The dry weight-normalized data have dis- tinctly different concentrations-the low-density high-organic carbon fraction is highly enriched, whereas the sand-sized fraction is substantially be- low the clay-silt fraction concentrations. Figure 18. (bottom) presents the same data but on an organic carbon-normalized basis, C,,,,(j). In contrast to dry weight normalization, the PAH concentrations are essentially the same in each size class, as pre- dicted by Equation 22.
It is concluded from these data that the organic carbon-normalized PAH concentrations are rela- tively independent of particle size class and that or- ganic carbon is the predominant controlling factor in determining the partition coefficient of the dif- ferent sediment size particles in a sediment sample. The organic carbon concentration of the high-den- sity sand-sized fraction (0.2-0.370) suggests that organic carbon normalization is appropriate at these low levels.
Sediment/pore water partitioning. Normally when measurements of sediment chemical concen- tration, C,,and total pore water chemical concen- trations, C,,, are made, the value of the apparent

D. M. DITono e r a .
Dry Weight Normalization Sand vs Clay/Sllt Low Density vs Clay/Siit
PAH l ~ g l g d y wt) PAH lrglg dry wtl
Organic Carbon Normaliiatlon
Low Density vs Clay/Sllt
Fig. 19. Observed pa uct of organic carbon tion coefficient. Th
: partition coefficients
1000 10 PAH i p ~ / g osl PAH irg/g osl
. .
8
7
(23) dissolved concentration will typically be lower than the total dissolved pore water chemical concentra- tion in the presence of significant levels of pore wa- 0,- 4 ter DOC (ex., Fig. 14). As a result, the actual partition coefficient calculated with the free dis-
. (24) solved concentration is higher than the apparent partition coefficient calculated with the total dis- solved pore water concentration.
As DOC increases, the quantity of DOC-corn- ~i~~~~ observations of pore water partition CO-plexed chemical increases and the apparent parti- efficients are restricted to the apparent partition .,,
coefficient, K; (Eqn. 23), because total concentra- tions in the pore water are reported and DOC corn-
Fig. 20. Observed appa~ (25) plexing, is expected to be significant at the DOC lines represent the expec
concentrations found in pore waters. Data re- rrom I531 for PCB cone
C

Sediment quality criteria using equilibrium partitioning
ported by Brownawell and Farrington [50] demon- strate the importance of DOC complexing in pore
ilt water. Figure 19 presents the apparent partition co- efficient, measured for 10PCB congeners at vari- ous depths in a sediment core, versus f,K,,, the calculated partition coefficient. The line corre- sponds to the relationship KO,=KO,, which is the expected result if DOC complexing were not signif- icant. Because DOC concentrations were measured for these data, it is possible to estimate Cd with Equation 20 in the form:
and to compute the actual partition coefficient: It K, = C,/Cd. The data indicate that if K,,, =KO,
is used, the results, shown on Figure 19, agree with the expected partition equation, namely that K, =
. f,,K,,. A similar three-phase model has been pre- Lo910 foe Kow sented by Brownawell and Farrington [Slj.
Fig. 19. Observed partition coefficient versus the prod- Other data with sediment/pore water partition uct of organic carbon fraction and octanol/water parti- coefficients for which the DOC concentrations lion coefficient. The line represents equality. The have not been reported [52,53] are available to as- partition coefficients are computed by using total dis- sess the significance of DOC partitioning on thesolved PCB (squares), and free PCB (circles) which is computed with Equation 26 with K,oc = K,,, Data apparent sediment partition coefficient. Figure 20
100000 from [SO]. presents these apparent organic carbon-normalized
:sordinate panels are 8
7 - DOCmplexed u I concen- I
0 (rn.a/L)
I portion 2 8 1.o le actual lculated -1 The free 0 5 10.0
0wer than 2ncentra-pore wa- 3-
0 4 100.0
e actual m free dis- 0
ipparent 3 otakdis-
;tion co- 2 2 3 4 5 6 7,artition
ncentra- Log10 Kow )Ccorn-le DOC Fig. 20. Observed apparent partition coefficient to organic carbon versus the octanol/water partition coefficient. The
line$ represent the expected relationship for DOC concentrations of 0, 1, 10, and LOO mg/L and K,OC =KO,. Data)ata re- from (531 for PCB congeners and other chemicals and from [52] for phenanthrene, fluoranthene, and perylene.
8

D. M. DI TOROET N.
concentrations. sponse curves for the data presented in Figures 5 to ; 7 are used to compare results on a pore water-nor.
Organic carbon normalization malized and organic carbon-normalized chemical Pore wat,
of biological responses concenvation basis. Figures 21 to 23 present these comparisons for Kepone, DDT, endrin, and flu,-,.
The results discussed above suggest that if a ranthene. The mean and 95% confidence limits of
pore Water Normalization
Organic Carb,
Fig. 22. Comparison o (lop) and in bulk sedim rarbon concentrations 1
Pore Water Concentration IwalLI Pore Water Concentration IPQILI I sponse-pore water co. viously in Figures 5 t
Organic Carbon Normalization present the response vc tion, which is organic grams chemical per 8eneral impression ol 'no reason to prefer po sediment organic cart cases, pore water norr 8anic carbon normaliza
. mortality data (Fig. : sometimes occurs -fo: rate Fig. 21). A more 1
bemade with the LC50,
Organic Carbon Normalirad l~glgocl Organic Carbon Normalized irg/g 001
Fig. 21. Comparison of percent survival (left) and growth rate reduction (right) of C.tentans to Kepone c0ncenfration IW0 to three and is in pore water (top) and in bulk sediment, using organic carbon normalization (bottom) for three sediments with vXylngorganic carbon concentrations [17].
6 8 7 8
'.'1

chemical 'OPerties. "SsO,,, = iissolved rmalized to non-
ause the 'for this
'enfs. TO ttion-re-ures 5 to der-nor. :hemica1 n t these nd fluo- Limits of data are the re-
Sediment quality criteria using equilibrium partitioning 1565
Pore Water Normalization
1 ........P . . . .... . . ., . . . . . L . . . . . . . . . . . . . . .J8
0.01 0.10 1.00 10.00 100.00 0.1 1.o 10.0 100.0 Pore Water Concentration IrglLl Pore Water Concentration I p g l ~ )
Organic Carbon Normalization DDT Endrln
I . . ' . . . . ' . . ....... . . ""-1 I ' - '
I . . . . . . . . . . . . . . . . . . . . . . ....A -1 10 100 1000 10000 1 10 100 1000 10000
Organ10 Carbon Normalized I ~ g l gocl Organic Carbon Normalized lpgh ocl
.-'"I
carbon concentrations [21,221.
sponse-pore water concentration plots shown pre- viously in Figures 5 to 7, while the lower panels present the response versus the sediment concentra- tion, which is organic carbon-normalized (micro- grams chemical per gram organic carbon). The general impression of these data is that there is no reason to prefer pore water normalization over sediment organic carbon normalization. In some Cases, pore water normalization is superior to. or- ganic carbon normalization- for example, Kepone- mortality data (Fig. 21)-whereas the converse sometimes occurs-for example, Kepone-growth rate (Fig. 21). A more quantitative comparison can be made with the LC5Os and EC5Os in Table 2. The variation of organic mbon-normalized LC5Os and ECSOs between sediments is less than a factor of
d o n two to three and is comparable to the variation in varying Pore water LC50s and ECSOs. A more comprehen-
sive comparison has been presented in Figures 2
Fig. 22. Comparison of percent survival of H.azfeca to DDT Oeft) and endrin (right) concentration in pore water (top) and in bulk sediment, using organic carbon normalization (bottom) for three sediments with varying organic
and 3, which also examine the use of the water- only LC50 to predict the pore water and sediment organic carbon LC50s.
Bioaccumulation factors calculated on the ba- sis of organic carbon-normalized chemical concen- trations are listed in Table 3, for permethrin, cypermethrin, and Kepone. Again, the variation of organic carbon-normalized BAFs between sedi- ments is less than a factor of two to three and is comparable to the variation in pore water BAFs.
Bioaccumulation and organic carbon normal- ization. Laboratory and field data also exist for which no pore water or DOC measurements are available but for which sediment concentration, or- ganic carbon fraction, and organism body burden have been determined. These data can be used to test organic carbon normalization for sediments and to examine organism normalization as well. The use of organism lipid fraction for this normal-

40
Pore Water Normalization Fluoranthene
'00 PA)loo r . o t
-0 20 40 60 80
Pore Water Concentration ipglLl
Organic Carbon Normalization Fluorenthene
I I 0 2000 4000 8000 8000 Organic Carbon Norma1lr.d ipglg ocl
Fig. 23. Comparison of percent survival of R. abronius to fluoranthene concentration in pore water (top) and bulk sediment, using organic carbon normalization (bot- tom) for sediments with varying organic carbon concen- trations [19].
ization has become conventional (see references in Chiou [54]). If Cb is the chemical concentration per unit wet weight of the organism, then the par- titioning equation is
where KL= lipid/water partition coefficient (L/kg
lipid) fL = weight fraction of lipid (kg lipid/kg
organism) Cd= free dissolved chemical concentration
The lipid-normalized organism concentration, C ~ . L ,is
TOR0 ET AL.
The lipid-normalized body burden and the organic carbon-normalized sediment concentration can be used to compute a bioaccumulation ratio, which can be termed the BSF [55]:
The second equality results from using the parti. tioning Equations 16 and 28 and the third from the approximation that KO,= KO,.The BSF is the partition coefficient between organism lipid and sediment organic carbon. If the equilibrium as. sumptions are valid for both organisms and sedi. ment particles, the BSF should be independent of both particle and organism properties. In addition, if lipid solubility of a chemical is proportional to its octanol solubility, KLrr KO,, then the lipid nor- malized-organic carbon normalized BSF should be a constant, independent of particles, organisms, and chemical properties [54,56,57]. This result can be tested directly.
The representation of benthic organisms as pas-sive encapsulations of lipid that equilibrate with ex- ternal chemical concentrations is clearly only a first-order approximation. Biomagnification ef- fects, which can occur via ingestion of contami- nated food and the dynamics of internal organic carbon metabolism, can be included in a more comprehensive analysis 1551. Nevertheless it is an appropriate initial assumption because deviations from the first-order representation will point to necessary refinements, and for many purposes this approximation may suffice.
A comprehensive experiment involving four benthic organisms-two species of deposit-feeding marine polychaetes, Nereis and Nephtys, and two species of deposit-feeding marine clams, Yolda'and Macoma-and five sediments has been performed by Rubinstein and co-workers [58]. The uptake of various PCB congeners was monitored until steady- state body burdens were reached. Sediment Orgac carbon and organism lipid content were measured Figures 24 and 25 present thelog mean of the rep licates for the ratio of organism-to-sediment con' centration for all measured congeners versus Kow for each organism. Dry weight normalization both organism and sediment (left panels), organ'c carbon normalization for the sediment (center P8"-el$), and both organic carbon and lipid normabza- tion (right panels) are shown. The results for each sediment are connected by lines and separately identified.
Fig. 24. Plots o geners versus th panels); organic I(right panels) as

sediment quality criteria using equilibrium partitioning
e organic Dry Wslght
Nere/s
Orgsnic Carbon Organlc Carbon, Lipid
0, which
from the L O ~ OKOW L O I ~ OKW
NePhtys:ium as- .nd sedi- Dry Weight org~n ic Carbon Organic Carbon, Lipid
:suit can
i a s p a ~ Log10 Kow h s i o KOW
with ex-only a Fig. 24. Plots of the BSP (ratio of organism-to-sediment concentration) for three sediments for a series of PCB con-
ef- geners versus the l~g,~K,, for that congener. The dry weight normalization for both organism and sediment (left panels); organic carbon normalization for the sediment (middle panels); and organic carbon and lipid normalization
mtami- (right panels) as indicated. The organisms are Nereis (top) and Nephfys(bottom). Data from 1581. organic a more it is an nations The BSFs based on dry weight normalization oint to are quite different for each of the sediments with mses this the low carbon sediment exhibiting the largest val-
ues. Organic carbon normalization markedly re- ~g four , duces the variability in the BSFs from sediment to feeding sediment (center panels). Lipid normalization usu- nd two ally further reduces the variability. Note that the Ida and BSFs are reasonably constant for the polychaetes, 'ormed although some suppression at log,^ K, > 7 is ev- '
ake of ident. The clams, however, exhibit a marked de- steady- dining relationship. )rganic Results of a similar though less extensive exper- tsured. iment using one sediment and oligochaete worms he rep- have been reported [53]. A plot of the organic car- I: con- bon- and lipid-normalized BSF versus KO,from us KO, [his experiment is shown on Figure 26, together on for kith the averaged polychaete data (Fig. 24). There .rganic appears to be a systematic variation with respect to !r pan- t,,, which suggests that the simple lipid equili- laliza- bration model with a constant lipid-octanol solu- r each bity ratio is not descriptive for all chemicals. This ratelY suggests that a more detailed model of benthic or-
tanism uptake is required to describe chemical
body burdens for all nonionic chemicals as a func- tion of KO, [55]. However, for a specific chemical and a specific organism-for example, Nereis and any PCB congener (Fig. 24)-organic carbon nor- malization reduces the effect of the varying sedi- ments. This demonstrates the utility of organic carbon normalization and supports its use in gen- erating SQC.
A further conclusion can be reached from these results. It has been pointed out by Bierman [591 that the fact that the lipid- and carbon-normalized BSF is in the range of 0.1 to 10 (Figs. 24-26) sup-ports the contention that the partition coefficient for sediments is KO,= KO, and that the particle concentration effect does not appear to be affect- ing the free concentration in sediment pore water. The reason is that the lipid- and carbon-normalized BSF is the ratio of the solubilities of the chemical in lipid and in particle carbon (Eqn. 29). Because the solubility of nonionic organic chemicals in var- ious nonpolar solvents is similar 1601, it would be expected that the lipid-organic carbon solubility ratio should be of order one. If this ratio is taken

D.M.Dl Tono KT AL.
Dry Weight Organic Carbon Organic Carbon,. tlp,d
b S ( o cow
Macoma
Organic Carbon Organic Carbon, Lipid
LOP70 Kb,"
Fig. 25. Plots of the BSF (ratio of organism-to-sediment concentration) for three sediments for a series of PCB con.
organic carb neous phase
to be approximately one, then the conclusion from question of the route of exposure. The initial ob- the BSF data is that, indeed, KO,is approximately servations were that biological effects appear to equal to KO, for sediments [59]. correlate to the interstitial water concentration, in-
1 P
A final observation can be made. The data an- dependent of sediment type. This has been inter- where C,,o, alyzed in this section demonstrate that organic preted to mean that exposure is primarily via pore : organic carb carbon normalization accounts for much of the re- water. However, the data correlate equally well . with the sed ported differences in bioavailability of chemicals in with the organic carbon-normalized sediment con- sediments for deposit-feeding polychaetes, oligo- centration (see Figs. 2 and 3). This suggests that the
' chaetes, and clams. The data presented in previous sediment organic carbon is the route of exposure. sections are for amphipods and midges. Hence In fact, neither of these conclusions necessarily fol- The chemicr these data provide important additional support low from these data. The reason is that an alter- ences from e for organic carbon normalization as a determinant nate explanation is available that is independent of . sediment) is of bioavailability for different classes of organisms. the exposure pathway. ment is in e
Consider the hypothesis that the chemical Po- Determination of the route of exposure tential or, as it is sometimes called, the fugacity
route of exp periments c;
The exposure route by which organic chemicals [62J,of a chemical controls its biological activity. routes of ex! are accumulated has been examined in some detail The chemical potential, p,, of tile free concentra- The data for water column organisms (e.g. 1611). It might be tion of chemical in pore water, Cd,is supposed that the toxicity and bioaccumulation. data presented above can be used to examine the = fro + RT WCd)

1569 Sediment quality criteria using equilibrium partitioning
Oligochaete - Polychaete BSF
rig. 26. Plots of the BSF (rario 01 urganism lipid 10 sediment organic csrbon concentration) for a series or PCB con-gners and other chemicals versus log,,K,,. Data for oligochaetes (531 and polychacies (581.
IBwn-:nt (left livltion
a1 ob- ear to >n, in- inter-t pore r well t C O P
at the ,sure. y Sol-alter-:nt of
where p, is the standard state chemical potential and RTis the product of the universal gas constant and absolute temperature [63]. For a chemical dis- solved in organic carbon-assuming that particle organic carbon can be characterized as a homoge- neous phase-its chemical potential is
where C,,,, is the weight fraction of chemical in organic carbon. If the pore water is in equilibrium with the sediment organic carbon, then
Pd = Po.. ( 39
The chemical potential that the organism experi- ences from either route of exposure (pore water or sediment) is the same. Hence, so long as the sedi- ment is in equilibrium with the pore water, the route of exposure is immaterial. Equilibrium ex- periments cannot distinguish between different routes of exposure.
The data analysis presented above, which nor- malizes biological response to either pore water or organic carbon-normalized sediment concentra- tion, suggests that biological effects are propor-
tional to chemical potential or fugacity. The issue with respect to bioavailability becomes: In which phase is p most easily and reliably measured? Pore water concentration is one option. However, it is necessary that the chemical complexed to DOC be a small fraction of the total measured concentra- tion or that the free concentration be directly mea- sured, perhaps by the C,,column technique 1461. Total sediment concentration normalized by sedi- ment organic carbon fraction is a second option. This measurement is not affected by DOC com- plexing. The only requirement is that sediment or- ganic carbon be the only sediment phase that contains significant amounts of the chemical. This appears to be a reasonable assumption for most aquatic sediments. Hence, SQC are based on or- ganic carbon normalization because pore water normalization is complicated by DOC complexing for highly hydrophobic chemicals.
APPLICABILRY OF WQC AS THE EFFECTS LEVELS FOR BENTHIC ORGANISMS
The EqP method for deriving SQC utilizes par- titioning theory to relate the sediment concentra- tion to the equivalent free chemical concentration in pore water and in sediment organic carbon. The

D.M. Dl Ton0 ST AL.
pore water concentration for SQC should be the protection afforded by WQC are appropriate for effects concentration for benthic species. This sec- benthic organisms. This section examines the ,, tion examines the validity of using the EPA WQC sumption of similarity of sensitivity in two ways concentrations to define the effects concentration First, a comparative toxicological examination o) for benthic organisms. This use of WQC assumes the acute sensitivities of benthic and water column that (a) the sensitivities of benthic species and spe- species, using data compiled from the published i The relati cies tested to derive WQC, predominantly water EPA WQC for nonionic organic chemicals as well !; water co~umli column species, are similar and (b) the levels of as metals and ionic organic chemicals, is presented, j for freshwate
' publishedW(I data base re Table 4. Draft or published WQC documents and number of infaunal (habaitats I and 2), j .acute values (
epibenthic (habitats 3 and 41, and water column (habitats 5-81 species tested acutely for each substance because expo / dmilar, and
No. of saltwater species No. ~f freshwater species 1 ,crutinized b: -
Date of Water Water For each of ti Chemical publication Totals Infaunal Epibenthic column Totala lnfaunal Epibenthic column ter, using 20E - : 1,046 tests co. Acenaphthene 9/87b - - - - 10 - 3 7 cies with 30 cAcrolein 9/87O - - - - 12 1 5 7 stage, salinity Aldrin 1980 16 0 I I 12 21 2 10 I5Aluminum 1988 - - - - 15 - 5 11 value, and te Ammonia 1985; 1989 20 2 7 1 6 48 2 17 33 ! flow-through,
p~n t imony( l~~) 9/87b 11 3 6 5 9 1 2 6 ! into a data ba Arsenic(lI1) 1985 12 2 3 8 16 1 6 13 j were consulte~ Cadmium 1985 38 10 18 18 56 13 16 31 Chlordane 1980 8 1 7 7 14 I 4 10 ' and any other Chloride 1988 - - - - 15 3 6 8 of the tested Chlorine 1985 23 2 9 15 33 1 9 . 26 habitat (Table Chlorpyrifos . 1986 I5 2 8 10 18 2 8 11 association wi Chromium(II1) 1985 - - - - 17 3 8 12 cupied more th Chromium(V1) 1985 23 8 9 9 . 33 1 10 21 Copper .I985 25 6 5 18 57 8 15 36 of the appropl Cyanide 1985 9 1 4 5 n 1 6 12 For each c, DDT 1980 17 1 11 12 42 3 15 29 : more than onc Dieldrin 1980 21 1 I5 15 19' 1 9 I2 tested, data wt 2,4,-Dimethylphenol 6/8Sb 9 2 2 6 I2 1 3 7 Endosulfan 1980 12 2 8 8 10 1 4 7 j Step process to Endrin 1980 21 1 14 16 28 3 12 I7 HeptacNor 1980 1 14 13 18 2 8 I2
1980 l9 2 12 1 18Hexachlorocyclohexane 19 14 22 4 Lead 1985 13 2 3 10 14 - 4 I1 Mercury 1985 33 10 7 18 30 1I 8 12 Nickel 1986 23 7 10 9 21 2 7 13 Parathion 1986 - - - - 37 7 14 23 Parathion, Methyl- 10/8gb - - - - 36 1 9 25 Pentachlorophenol 1986 19 7 7 11 41 9 I I 23 Phenanthtene 9/8Tb 10 4 6 4 9 2 1 6 Phenol 5/88" - - - 32 6 9 20 Selenium(1V) 1987 16 1 5 13 23 2 6 19 Selenium(V1) 1987 - - - - 12 1 4 10 Silver 9/87b 21 1 6 16 19 I g 1 3 Thallium 11/8Bb - - - - 8 1 3 3 Toxaphene 1986 15 2 9 11 37 5 13 23 Tdbutyltln 9/87 19 I 8 15 9 1 1 6 1,2,4-Trichlorobenzene 9/8ab 15 7 7 4 14 2 5 7 2,4,5-Trichlorophenol 9/8Tb I I 4 5 5 10 1 2 8 Zinc 1987 33 10 9 17 45 5 I2 30
"The total numbers of tested species may not be the same as the sum of the number of species from each habitat 1% because a species may occupy more than one habitat. their acute value
bDraft aquatic life criteria document, U.S.Environmental Protection Agency, Office of Water Regulations and Stan- higher values we1 dards, Criteria and Standards Division, Washington, DC. of the lower acu

Sediment quality criteria using equilibrium partitioning
lriate for 's the as. "0 ways. lation of column
ublished s as well 'esented.
Lnce-:ies-
Water column-
7 7
+ !t type
Then a comparison of the FCVs and the chronic Sensitivities of benthic saltwater species in a series of sediment colonization experiments is made.
mthod-relative acute sensitivity ,.-The relative acute sensitivities of benthic and
water column species are examined by using LCSOs for freshwater and saltwater species from draft or pblished WQC documents that contain minimum data base requirements for calculation of final acute values (Table 4). These data sets are selected because exposures were via water, durations were similar, and data and test conditions have been scrutinized by reviewing the original references. For each of the 2,887 tests conducted in fresh wa- ter, using 208 species with 40 chemicals, and the 1,046 tests conducted in salt water, using 118 spe- cies with 30 chemicals, the chemical, species, life stage, salinity, hardness, temperature, pH, acute value, and test condition (i.e., static, renewal, flow-through, nominal, or measured) were entered into a data base. If necessary, original references were consulted to determine the tested life stage and any other missing information. Each life stage of the tested species was classified according to habitat (Table 5). Habitats were based on degree of association with sediment. A life stage that oc-cupied more than one habitat was assigned to both of the appropriate habitats.
For each chemical, if a life stage was tested more than once or more than one life stage was tested, data were systematically sorted in a three- step process to arrive at the acute value based on the most experimentally sound testing methodol- ogy and the most sensitive life stages. First, if a life stage for a species was tested more than once, flow-through tests with measured concentrations had precedence, and data from other tests were omitted. When there were no flow-through tests with measured concentrations, all acute values for that life stage were given equal weight. If the re- maining acute values for that life stage differed by greater than a factor of four, the higher values were omitted and the geometric mean of the lower acute values was calculated to derive the acute value for that life stage. Second, life stages were classified as either "benthic" (infaunal species [hab- itats 1 and 21 or infaunal and epibenthic species [habitats 1,2, 3, and 41) or "water column" (hab- itats 5 to 8). Third, if two or more life stages were classified as either benthic or water column and their acute values differed by a factor of four, the higher values were omitted and the geometric mean of the lower acute values was calculated to derive
Table 5. Habitat classification system for life stages of organisms
Habitat type Description
Life stages that usually live in the sediment and whose food consists mostly of sediment or organisms living in the sediment: infaunal tionfilter feeders. Life stages that usually live in the sediment and whose food consists mostly of plankton and/or suspended organic matter filtered from the water column: infaunal filter feeders. Life stages that usually live on the surface of sediment and whose food consists mostly of organic matter in sediments andlor organisms living in or on the sediment: epibenthic bot- tom feeders. Life stages that usually live on the surface of sediment and whose food is mostly from the water column, including suspended detritus, plankton, and larger prey: epibenthic water column feeders. Life stages that usually live in the water col- umn and whose food consists mostly of or- ganisms that live on or in the sediment. Life stages that usually live in, and obtain their food from, the water column but have slight interaction with sediment because they occasionally rest or sit on the sediment and/or occasionally consume organisms that live in or on the sediment. Life stages that live in or on such inorganic substrates as sand, rock, and gravel, but have negligible contact with sediment containing organic carbon. Life stages that have negligible interactions with sediment because they spend essentially all their time in the water column and rarely consume organisms in direct contact with the sediment; that is, fouling organisms on pil- ings, ships, and so on, and zooplankton, pelagic fish, and so on.
the acute value for that life stage of the benthic or water column species. This procedure is similar to that used for WQC [a]. Comparison of the sensitivity of benthic and water column species
Most sensitive species. The relative acute sensi- tivities of the most sensitive benthic and water col- umn species were examined by comparing the lowest acute LC50 concentration for the benthic and water column organisms, using acute values from the 40 freshwater and the 30 saltwater WQC

documents. When benthic species were defined as only infaunal organisms (habitat types 1and 2) and water column species were defined as all others (habitat types 3-8), the water column species were typically the most sensitive. The results are cross-plotted on Figure 27 (left). The line represents per-fect agreement. In most instances where acute values for saltwater benthic and water column spe-cies are identical, it is because penaeid shrimp are most sensitive to insecticides and are classified as both infaunal (benthic) and epibenthic (water column).
Unfortunately data on the sensitivities of ben-thic infaunal species are limited. Of the 40 chemi-cals for which WQC for freshwater organisms are available, two or fewer infaunal species were tested with 28 (70%) of the chemicals, and five or fewer species were tested with 34 (85%) of the chemicals. Of the 30 chemicals for which WQC for saltwater organisms are available, two or fewer infaunal spe-cies were tested with 19 (63%) of the chemicals, pnd five or fewer species were tested with 23 (77%) of the chepicals. Of these chemicals only zinc in salt water has been tested using infaunal species from three or more phyla and eight or more fam-ilies, the minimum acute toxicity data base required for criteria derivation. Therefore, it is probably premature to conclude from the existing data that infaunal species are more tolerant than water col-umn species.
A similar examination of the most sensitive benthic and water column species, where the def. inition of benthic includes both infaunal and epi. benthic species (habitat types 1-4), is based more data and suggests a similarity in sensitivity (Fig. 27, right). In this comparison, the number of acute values for freshwater benthic speciesfor each chemical averaged nine, with a range of 2 to 27; the number of acute values for saltwater benthic species for each chemical substance averaged 11, with a range'of 4 to 26. The variability of these data is high, suggesting that for some chemicals, benthic and water column species may differ in sensitivity, that additional testing would be desir. able, or that this approach to examining species sensitivity is not sufficiently rigorous.
Examination of individual criteria documents in which benthic species were markedly less sensitive than water column species suggests that the major factor for this difference is that benthic species phylogenetically related to sensitive water column species have not been tested. Apparent differences in sensitivity, therefore, may reflect an absence of appropriate data. Data that are available suggest that, on the average, benthic and water column species are similarly sensitive and support the use of WQC to derive SQC for the protection of infau-nal and epibenthic species.
Allspecies. A more general comparison of the species sensitivities can be made if all the LC50
Comparison of Most Sensitive Species
lntaunal Infaunal & Eplbenthlc
7
Freshlater Freshlater
0 3
0,-m 0 -I -1
-13
-3 -3 - 3 - 1 1 3 5 7 -3 -I 1 3 6
Loglo LC50 (pglL1 Loglo LC50 (pglL1
Fig. 27. Comparison of LC50 or ECSO acute values for the most sensitivebeithic (abscissa) and water column (or-dinate) species for chemicals listed in Table 5. Benthic speciesare defined as infaunal species (habitat types 1and 2, left panel) or infaunal and epibenthic species (habitat types 1-4); see Table 6 .
j
data are used. 0 .location of beni .:$nsitivit~distrit freshor salt wat don of benthic si ,pies' LCSOs. I
then t t mong the large1 $jtivitywould be lion of species wi psents the resu The LCSOs are p lhic species are among the most faunaland epibei uted among the
This compar chemical. Howe! more robust, t h ~ water type can be unit log variance
where i indexes t log mean and q i dexes the LC50s
Fig. 28. LCSOSvers identified by the sol sitivity distribution.

7
Sediment quality criteria using equilibrium partitioning
sensitive data are used. One approach examines the relative is the normalized LC50. This places all the LCSOs
the def- iocation of benthic species in the overall species from each set of chemical-water type on the same
1 and epi- positivity distribution. For each chemical in either footing. Thus the data can now be combined and
based on fresh or salt water, one can examine the distribu- the uniformity of representation of benthic species lion of benthic species in a rank-ordering of all the can be examined in the combined data set.
lumberof spEcie~'LC50s.If benthic species were relatively in-- The comparison is made in Figure 29. If the
s for each rnsitive, then they would predominate in ranking sensitivity of benthic species is not unique, then a f 2 to 27; wong the larger LC50 concentrations. Equal sen- constant percentage of benthic species-normalized :r benthic !itivity would be indicated by a uniform distribu- LCSOs, indicated by the dashed line, should be rep- raged 11, eon of species within the overall ranking. Figure 28 resented in each 10-percentile (decile) interval of r of these presents the results for tests of nickel in salt water. data for all species. That is; the 10 rectangles in hemicals, The LCSOs are plotted in rank order, and the ben- each histogram should be identical in height. The differ in lhic species are indicated. Infaunal species are infaunal species (top panel) display a tendency to be desir. among the most tolerant (left panel), whereas in- be underrepresented in the lowest deciles. How-
~g species faunal and epibenthic species are uniformly distrib- ever, the infaunal and epibenthic species (bottom uted among the species (right panel). panels) more closely follow this idealized distribu-
uments in This comparison can be done chemical by tion. Infaunal and epibenthic freshwater species :sensitive chemical. However, in order to make the analysis are nearly uniformly distributed, whereas the salt- Ile major mare robust, the LC50 data for each chemical- water benthic species are somewhat underrepre- c species water type can henormalized to zero log mean and sented in the lowest ranks. r column unit log variance as follows: Given the limitations of these data, they appear fferences to indicate that, except for possibly freshwater in- jsence of faunal species, benthic species are not uniquely e suggest (33) sensitive or insensitive and that SQC derived by :column using the FCV should protect benthic species. .t the use of infau- where i indexes the chemical-n,ater type, pi is the Benthic community colonization experiments
log mean and mi is the log standard deviation, j in- Toxicity tests that determine the effects of ~n of the dexes the LC5Os within the ith class, and LC50..,j chemicals on the colonization of communities of he LC50
Species Sensitivity for Ni in Seawater
lnfaunal Infaunal & Eplbenthic
63 Water Column 63 Water Column
5 0.0 0.2 0.4 0.6 0.8 1.0 0.0 0.2 0.4 0.6 0.8 1.0
iumn (or- ;1 and 2, Rg. 28. LCSOs versus rank for nickel in seawater. Infaunal organisms (left) and infaunal and epibenthic (right) are
. identified by the solid symbols. The plot illustrates the distribution of benthic organisms in the overall species sen- "tivity distributisn.

- -
1574 D. M. DI TORO BT AL.
lnfaunal Saltwater Freshwater
so . . . . . . . . . . -S 40 S 40
' , with the assumpti
i:,ioitially clean sandy : Ybrate with the inflowi concentration as the w h the overlying w: duction of sedimenta bow enough to permi ,consequence the org equilibrium system wi
Thus the assumpt design. In addition,
that the i overlying water is at t
Mean of Percsntlle Range PA) Mean of Percentile Range (%) overlying water. Henc dence between the exp priment and the wate -lnfaunal & Epibenthic
Saltwater Freshwater loo loo7
Mean of Percentile Range PA) Mean of Percentile Range (4)
Fig. 29. Histograms of the proportion of saltwater and freshwater benthic organisms in 10 percentile groups of all normalized LC5Os. If benthic organisms were as equally sensitive as water column organisms, the histograms should be of uniform height as indicated by the dashed line, the overall percentage of benthic species in the data set. Toppanels include only infaunal organisms as benthic. The bottom panel includes infannal and epibenthic as benthic organisms.
benthic saltwater species [64-701 appear to be par- ticularly sensitive a t measuring the impacts of chemicals on benthic organisms. This is probably because the experiment exposes the most sensitive life stages of a wide variety of benthic saltwater species, and they are exposed for a sufficient du- ration to maximize response. The test typically in- cludes three concentrations of a chemical and a control, each with 6 to 20 replicates. The test chemical is added to inflowing ambient seawater containing planktonic larvae and other life stages of marine organisms that can settle onto clean sand in each replicate aquarium. The test typically lasts from two to four months, and the number of spe- cies and individuals in aquaria receiving the chem- ical are enumerated and compared to controls.
If this test is extremely sensitive and if concen- trations in interstitial water, overlying water, and the sediment particles reach equilibrium, then the effect and no-effect concentrations from this test can be compared with the FCV from the saltwater WQC documents to examine the applicability of WQC to protect benthic organisms. An FCV is the concentration, derived from acute and c h r o ~ c tax-icity data, that is predicted to protect organisms from chronic effects of a chemical [8].In addi!iqn, similarities in sensitivities of taxa tested as inhvld- ual species and in the colonization experiment can indicate whether the conclusion of similarity qf sensitivities of benthic and water column SPecles IS
reasonable. The benthic colonization experiment is consis-
WQC are derived, n chemical concentrati comparison.
Water quality criteria versus colonization ex
Comparison of the icals that had the lo! centration (LOEC) at concentration (NOEC with the FCVs either lions of WQC docume
Table
Substance
Pentachlorophenol
Arochlor 1254
Chlorpyrifos
'Six.day exposure to estall

Sediment quality criteria using equilibrium partitioning
with the assumptions used to derive SQC. The bidally clean sandy sediment will rapidly equili- lflte with the inflowing overlying water chemical incentration as the pore water concentrations wh the overlying water concentration. The pro- bction of sedimentary organic matter should be bwenough to permit its equilibration as well. As ,@"sequence the organisms will be exposed to an iuilihrium system with a unique chemical poten- w. Thus the assumption of the EqP is met by this &n. In addition, the experimental design parantees that the interstitial water-sediment- oyerlying water is at the chemical potential of the pverlying water. Hence there is a direct correspon- hce between the exposure in the colonization ex- piment and the water-only exposures from which WQC are derived, namely the overlying water rbemical concentration. This allows a direct
Water quality criteria (WQC)concentrations wsus colonization experiments
comparison of the concentrations of six chem- lrals that had. the lowest-observable-effect con-atration (LOEC) and the no-observable-effect mncentration (NOEC) on benthic colonization with the FCVs either published in saltwater por- dons of WQC documents or estimated from avail-
able toxicity data (Table 6) suggests that the level of protection afforded by WQC to benthic organ- isms is appropriate. The FCV should be lower than the LOEC and larger than the NOEC.
The FCV from the WQC document for penta- chlorophenol of 7.9 pg/L is less than the LOEC for colonization of 16.0 pg/L. The NOEC of 7.0 pg/L is less than the FCV. Although no FCV is available for Aroclor 1254, the lowest concentra- tion causing no effects on the sheepshead minnow (Cyprinodon variegattur) and pink sbrimp (Penaeus duorarum) as cited in the WQC document is about 0.1 pg/L. This concentration is less than the LOEC of 0.6 pg/L and is similar to the NOEC of 0.1 pg/L based on a nominal concentration in a colo- nization experiment. The lowest concentration tested with chlorpyrifos (0.1 fig/L) and fenvalerate (0.01 pg/L) affected colonization of benthic spe- cies. Both values are greater than either the FCV estimated for chlorpyrifos (0.005 pg/L) or theFCV estimated from acute and chronic effects data for fenvalerate (0.002 pg/L). The draft WQC docu- ment for 1,2,4-trichlorobenzene suggests that the FCV should be 50.0 pg/L. This value is slightly above the LOEC from a colonization experiment (40.0 pg/L) suggesting that the criterion might be somewhat underprotective for benthic species. Fi- nally, a colonization experiment with toxaphene
mups of all ams should
:as benthic
if concen- iater, and ,then the n this test saltwater
:ability of :CV is the ,conic tox- ,rganismS
addition'1s individ- iment can
is consis-
Table 6 . Comparison of WQC FCVs and concentrations affecting (LOEC) and not affecting (NOEC) benthic colonization
Substance
~entachlorophenol
~~ochlor1254
C h l o r ~ ~ r i f ~ ~
rcnvalerate
Colonization vs. FCV
Colonization LOEC FCV Colonization NOEC Colonization LOEC Estimated FCV Colonization NOEC Colonization LOEC FCVColonization NOEC Colonization LOEC Estimated FCV Colonization NOEC
Concn. (ag/L)
16.0 7.9 7.0 0.6
-0.1 <0.1
0.1 0.005
, -0.01
-0.002-50 40 -
11.0 0.8 0.2
Sensitive taxa Reference
Molluscs, abundance Molluscs, crustacea, fish -Crustacea
. Crustacea, fish -Crustacea, molluscs, species richness Crustacea -
[681
Crustacea, chordates Crustacea-Crustacea, fish Molluscs, abundance -Crustacea, species richness -Crustacea, fish
1,2,4-~richlorobenzeneaEstimated FCV Colonization LOEC Colonization NOEC Colonization LOEC Colonization NOEC FCV '
?Six-day exposure to established benthic community.

--
provides the only evidence from these tests that the FCV might be overprotective for benthic species; the FCV is 0.2 pg/L versus the NOEC for coloni- zation of 0.8 pg/L.
The taxa most sznsitive to chemicals, as indi- cated by their LC5Os and the results of coloniza- tion experiments, are generally similar, although, as might be expected, differences occur. Both the WQC documents and the colonization experiments suggest that crustacea are most sensitive to Aroclor 1254, chlorpyrifos, fenvalerate, .and toxaphene. Colonization experiments indicated that molluscs are particularly sensitive to three chemicals, an ob- servation noted only for pentachlorophenol in WQC docume~ts. Fish, which are not tested in col- onization experiments, are particularly sensitive to four of the six chemicals.
Conclusions
Comparative toxicological data on the acute &d chronic sensitivities of freshwater and saltwa- ter benthic species in the ambient WQC documents are limited. Acute vdues are available for only 34 freshwater infaunal species from four phyla and only 28 saltwater infaunal species from five phyla. Only seven freshwater infaunal species and 24 freshwater epibcnthic species have been tested with five or more of the 40 WQC chemicals. Similarly, nine saltwater infaunal species and 20 epibenthic species have been tested with five or more of the 30 substances for which saltwater criteria are available.
In spite of the paucity of acute toxicity data on benthic species, available data suggest that benthic species are not uniquely sensitive and that SQC can be derived from WOC. The data sunaest that the most sensitive infaunal species are tvaicdv less sen- .. . sitive than the most sensitive water column (epiben- thic and water column) species. When both infaunal and epibenthic species are classed as benthic, the sensitivities of benthic and water column s~ecies are similar, on average. Frequency distributions of the sensitivities of all species to all chemicals indi- cate that infaunal species may be relatively insen- sitive but that infaunal and epibenthic species appear almost evenly distributed among both sen- sitive and insensitive species overall.
Finally, in experiments to determine the effects of chemicals on colonization of benthic saltwater organisms, concentrations affecting colonization were generally greater, and concentrations not af- fecting colonization were generally lower, than es- timated or actual saltwater WQC FCVs.
GENERATION OF SQC
Parameter values
The equation from which SQC are calculated is
(see Eqns. 2-7 and associated text). Hence, the SQC concentration depends only on these two pa. rameters. The KO, of the chemical is calculated from the KO, of the chemical via the regression Equation I I. The reliability of SQC,, depends di. rectly on the reliability of KO,. For most chemi- cals of interest, the available K,,s (e.g. [71]) are highly variable-a range of two orders of magni. tude is not unusual. Therefore the measurement methods and/or estimation methodologies used to obtain each estimate must be critically evaluated to ensure their validity. The technology for measur- ing KO, has improved in recent years. For exam- ple, the generator column [721 and the slow-stirring 1731 method appear to give comparable results, whereas earlier methods produced more variable results. Hence, it is recommended that literature values for K,,s not be used unless they have been measured by these newer techniques.
The FCV is used as the appropriate end point for the protection of benthic organisms. Similarly, its applicability to benthic species for each chemi- cal should be verified. The analysis presented in the previous section indicated that this is not an unrea- sonable assumption across all the criteria chemi- cals. To test this assumption for a particular chemical, the Kolmogorov-Smirnov test (741, which tests whether two samples came from the same oo~ulation. can be a~olied to rhe distribution of L C ~ &for the wate~~column and benthic species.
The Kolmogorov-Smirnov test is based on the maximum difference between the rwo empirid CUu.
mulative ~rohabilitv distributions. The test will re-ject the hypothesis ;hat the samples come from the same probability distribution if the difference is $0
large, given the number of samples in each of the two distributions, that chance alone cannot a? count for the difference. An example for endrin 1s shown in Figure 30, which presents the ~robabilit~ distributions of the freshwater species' LC5b for the water column and benthic species. The left panel is a log probability plot of the two distribu- tions. It presents the LC5Os on a log scale versus the rank order on a normal probability scale. *he natural way to judge the equality of these distdbu-
Fig. 30. ComparisLognormal probak imum difference u
tions is to compa ability, for exam1 comparison of tl
; The Kolmogc other difference,
same distribution
otliesis that the s
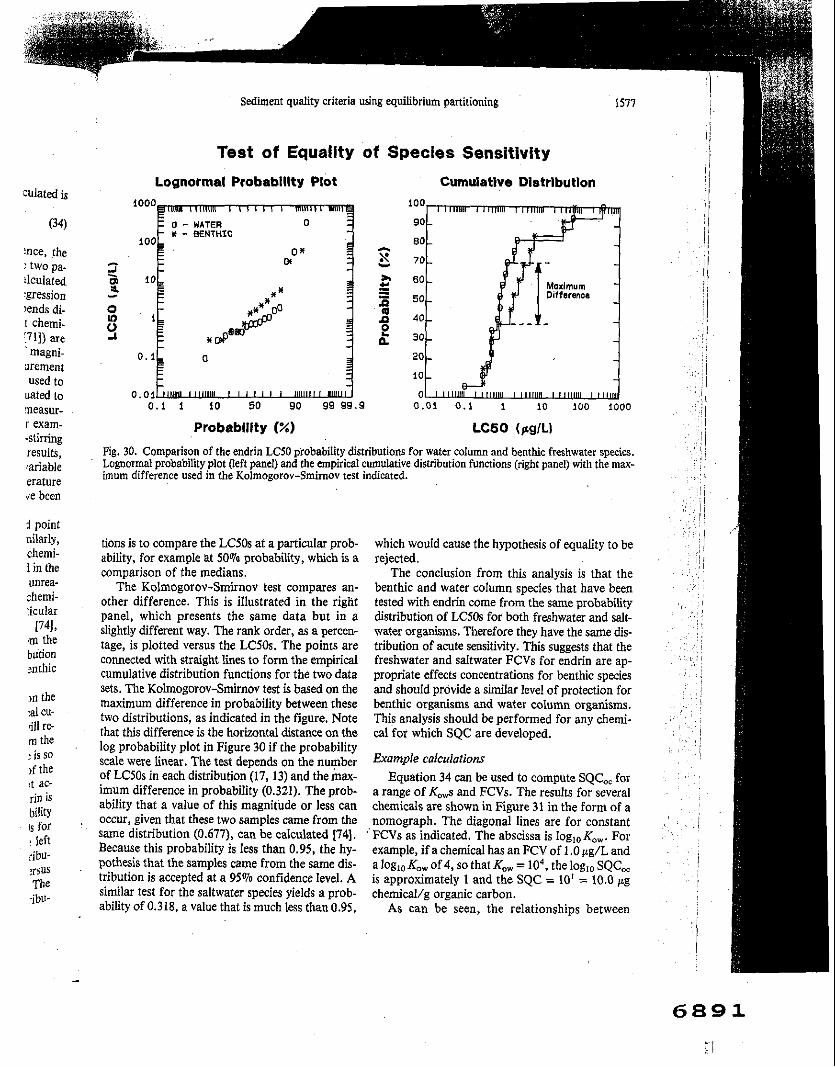
1577 Sediment quality criteria using equilibrium partitioning
Test of Equality of Species Sensitivity
Lognormal Probablllty Plot Cumulative Dlstrlbutlon culated is
1000
(34) 0 - WATER- BENTHIC +!
m e , the :two pa. llculated 10
gression lends di- t chemi. ,711) are 'magni- 0.1 Jrement used to
oated to neasur-r exam- Probablllty (4)-stirring results, F I ~ .30. Comparison of thc endrin LC50probability distributions for water column and benthic freshwater species. rariable Lognormal probability plot (left panel) and the empirical cumulative distribution functions (right panel) with the mw-
imum difference used in the Kolmogorov-Smimov test indicated, erature ie been
i point nilarly, tions is to compare the LC5Os at a particular prob- chemi- ability, for example at 50% probability, which is a l in the comparison of the medians. unrea- The Kolmogorov-Smimov test compares an- :hemi- other difference. This is illustrated in the right :icular panel, which presents the same data but in a
1741, slightly different way. The rank order, as a percen- .rnthe tage, is plotted versus the LC50s. The points are bution connected with straight lines to form the empirical snthic cumulative distribution functions for the two data
sets. The Kolmogorov-Smirnov test is based on the In the maximum difference in probability between these :al cu- two distributions, as indicated in the figure. Note nil1 re- that this difference is the horizontal distance on the rn the log probability plot in Figure 30 if the probability :is SO scale were linear. The test depends on the number )f the of LC5Os in each distribution (17, 13) and themax- )t ac- imum difference in probability (0.321). The prob- rin is bility
ability that a value of this magnitude or less can occur, given that these two samples came from the a for same distribution (0.677), can be calculated 1741.
! left Because this probability is less than 0.95, the hy-
ribu- pothesis that the samples came from the same dis- :ISUS tribution is accepted at a 95% confidence level. AThe -ibU- similar test for the saltwater species yields a prob-
ability of 0.318, a value that is much less than 0.95,
which would cause the hypothesis of equality to be rejected.
The conclusion from this analysis is that the benthic and water column species that have been tested with endrin come from the same probability distribution of LCSOs for both freshwater and salt- water organisms. Therefore they have the same dis- tribution of acute sensitivity. This suggests that the freshwater and saltwater FCVs for endrin are ap- propriate effects concentrations for benthic species and should provide a similar level of protection for benthic organisms and water column organisms. This analysis should be performed for any chemi- cal for which SQC are developed.
Ekample calculations Equation 34 can be used to compute SQC,, for
a range of K,,s and FCVs. The results for several chemicals are shown in Figure 31 in the form of a nomograph. The diagonal lines are for constant
' FCVs as indicated. The abscissa is log,, KO,. For example, if a chemical has an FCV of 1.0 pg/L and a log,, KO,of 4, so that KO, = lo4,the log,, SQC,, is approximately 1and the SQC = 10' = 10.0 pg chemical/g organic carbon.
As can be seen, the relationships between

Sediment Quality Criteria FCV l ~ g i L )
10
Methyl Parathion A Toxaphene 7 Chlordane 4 Parathion
Endoeulfan* Acanaphthene Endrin Phensnthrene* Chlorpyritos Dieldrin
Fig. 31. Log,,SQC versus log,,K,,. The diagonal lines indicated the FCV values. The criteria are computed from Enuation 34. K.. is obtained from K-...with Eauation 11. The svmbols indicate SOC-. for the freshwater(filled)and-.-.~.~ - . . ~ " c .. ~~~ "" . . saltwater (hatched)crileria for the listed chemicals. The rertical line connens syin<ols for the same chemical. Thr FCVs are from the WQC or drafl criteria documents (Table4). The octanol!water partition :ocfficienh arc the lag mean of the values reported in the LogP data base [ll].
SQC,, and the parameters that determine its mag-nitude, KO, and FCV, are essentially linear on a log-log basis. For a constant FCV, a 10-fold in-crease in KO, (one log unit) increases the SQC,, by approximately 10-fold (one log unit) because K,, also increases approximately 10-fold. Thus, chem-icals with similar FCVs will have larger SQC,s if their K,,s are larger.
The chemicals listed in Figure 31 have been cho-sen to illustrate the SQC,, concentrations that re-sult from applying the EqP method. The water quality concentrations are the FCVs (not the final residue values) from draft or published EPA WQC documents (see Table 4). The KWs are the log av-erages of the values reported in the LogP data base [711. These values are used for illustrativepurposes only because final SQC, when published, should reflect the best current information for both FCV and KO,,as discussed above.
The FCVs that are available for nonionic or-
ganic insecticides range from approximately0.01 #g/L to 0.3 #g/L, a factor of 30. The SQC,,s range from approximately 0.01 pg/g organic car-bon to in excess of 10pg/g organic carbon, a fac-tor of over 1,000. This increased range in values occurs because the K,,s of these chemicals span over two orders of magnitude. Hence the most stringent SQC, in this example is for chlordane,a chemical with the lowest KO, among the chemicals with an FCV of approximately 0.01 pg/L.
By contrast, the PAHs included in this example have a range of FCVs and Ko,s of approximatelY one-half order of magnitude. But these values vW' inversely: The chemical with the larger FCV has a smaller K,,. The result is that the SQC,s are aP proximately the same, 200 pg/g organic carbon. Classes of chemicals for which the effects concen-trations decrease logarithmically with increasing Kws, for example, chemicals that are narcotics (751, will have SQC that are more nearly constant.
Sedimentqualit, The SQC me
moc concentratio
to the equivalent A
taintyassociated ,,tmption of equ
of orga modeluncertaint lions used to esti span the range fr ments, and sewag which those data ibrated for a few whereas in nature (emwould have a In addition, there K,, associated wi d is an experimen
It is anticipaiec ated, confidence 1 ufy the uncertain1 method for estima currently under de subsequently. It is analysis of the dat ures 2 and 3. The i~ certainty of a fact(
C
The technical b. use of the EqP met1 presented for nonio of organic carbon using pore water nc counting for varying 21-23). The variati across sediments ca, if organic carbon an (Figs. 24-26). For ments, particle size carbon-normalized Fig. 18). The reasol proper normalizatiot dissolved chemical a Fig. 12).
Using pore water drophobic chemicals Complexing to DOC ( pore water and sed field-collected sedin DOC complexing is

1579 Sediment quality criteria using equilibrium partitioning
d from d) and 31. The the log
r 0.01 >C."S :car-I fac-dues span most ne, a icals
nple ~tely vary as a ap-
,on. :en-sing tics Int.
sediment quality criteria (SQC) uncertainty and 20). However, the complexed chemical appears The SQC methodology relies on an empirical to be bioavailable (Fig. '6).
partitioning model to relate the pore water expo- observations are consistent with the EqP sureconcentration (actually the chemical potential) model, which assumes the equivalence of water- ,,,the equivalent sediment organic carbon exposure Only exposure and the exposure from pore water mucentration. As a consequence there is an unca- and/or sediment organic carbon. Sediment quality rainty associated with the use of the model. The as- criteria are based on organic carbon normalization sumption of equilibrium and. the similarity of all because pore water normalization is complicated sources of organic carbon are reflected in the by DOC complexing for highly hydrophobic model uncertainty. The organic carbon concentra- tions used to estimate the regression coefficients The justification for using the FcV from the span the range from 0.2 to 40% from soils, sedi- WQC to define the effects level for benthic organ- ments, and sewage sludges. The experiments from isms has also been discussed. Water column and which those data were derived were typically equil- benthic organisms appear to have similar sensi- ibrated for a few hours to a few days at most p i ] , tivities for both the most sensitive species tested whereas in nature a sediment-interstitial water sys- (Fig. 27) and all tested species (Fig. 29). Benthic tern would have a much longer equilibration time. colonization experiments also demonstrate that In addition, there is uncertainty with respect to the WQC can be used to predict effects concentrations K,, associated with the specific chemical bwause for benthic organisms. A direct statistical test of it is an experimentally determined quantity. the equality of the distributions can be used to con-
It is anticipated that when final SQC are gener- f im Or refute this assumption for individual chem- ated, confidence limits that are intended.to quan- icals (Fig. 30). tify the uncertainty will also be determined. n e Equilibrium partitioning cannot remove all of method for estimating the range of uncertainty is the observed variation from sediment to sediment. currently under development and will be reported It does reduce the much larger sediment-to-sedi- subsequently. It is likely that it will be based on an merit variation that exists if no corrections for bio- analysis of the data in the form presented in Fig: availability are made (Figs. 5-9). A variation of ures 2 and 3. The initial impressions are that an un- app10ximately a fact01 of two to three remains certainty of a factor of two to three seems likely. (Figs. 2 and 31, which includes measurement vari-
ability. This is not unexpected as EqP is an idedi-CONCLUSIONS zation of the actual situation. Other factors that
are not considered in the model play roles in deter- The technical basis and data that support the mining biological effects. Hence, it is recognized
use of the EqP method to generate SQC have been that a quantification of the uncertainty should ac- presented for nonionic organic chemicals. The use company the SQC that reflect these additional of organic carbon normalization is equivalent to sources of variation. using pore water normalization as a means of ac- counting for varying bioavailability (Figs. 2,3,5-9, ~~~~~~~hneeds 21-23). The variation in organism body burden across sediments can also be significantly reduced The final validation of SQC will come from field if organic carbon and lipid normalization are used studies that are designed to evaluate the extent to (Figs. 24-26). For naturally contaminated sedi- which biological effects can be p~edicted from ments, particle size effects are removed if organic SQC. The colonization experiments (Table 6) are Carbon-normalized concentrations are compared a laboratory simulation of a field validation. Sed- (Fig. 18). The reason is that organic carbon is the iment quality criteria can possibly be validated more Proper normalization for partitioning between free easily than WQC because determining the organ- dissolved chemical and sediment-bound chemical ism exposure is more straightforward. The benthic (Fig. 12). population exposure is quantified by the organic
Using pore water normalization for highly hy- carbon-normalized sediment concentration. drophobic chemicals is complicated by chemical It bas been suggested that the kinetics of PAH complexing to DOC (Fig. 14). Partitioning between desorption from sediments control the chemical Pore water and sediment organic carbon from body burden of a benthic amphipod [76]. The ex- field-collected sediments can be rationalized if tent to which kinetics can be important in field sit- DOC complexing is taken into account (Figs. 19 uations is unknown at present, and field studies

D. M. Dl TOR0 ET AL.
Standards, Crit,
chemicals sorber rium partitionir Purdy, eds., AqlFote: Ninfh Voiu
interstitial and ps infaunal amphipc
However, a site-specific investigation 6%. 1801) ap-their uses. PB85-227049. National Technical Infor- ,,tion Service, springfield, VA, pp. 1-98.
pears to be the only available method for perform- 9. Spehar, R.L. and A.R. Carlson. 1984. Derivation of
REFERENCES
and water. Enviro) 27. Adams, W.J., R.A.Protection Agency, Washington, DC. Aquatic safety asse!

1581 Sediment quality criteria using equilibrium partitioning
for biological effects of sediment-sorbed contami- wine nsnts tested in the National Status and Trends Pro- 1con. gam. NOAA Technical Memorandum NOS OMA ssoci. 52. Office of Oceanography and Marine Assessment,
Seattle, WA. riteria I& O w m , C.E. and C.S. Zarba. June 1987. Regulatory K.L. - applications of sediment quality criteria-Final Re-Fate port. EPA 68-01-6986. U.S. Environmental Pro-
7Ualic tection Agency, Office of Water Regulations and 355- Standards, Criteria and Standards Division, Wash-
ington, DC. scan- 17. Adams, W.J., R.A. Kimede and R.G. Mosher. 1985. re on Aquatic safety assessmmt of chemicals sorbed to zron- sediments. In R.D. Cardwell, R. Purdy and.R.C. pula- Bahner, eds., Aquatic Toxicology and Hazard As- lards sessmenc Seventh Symposium. STP 854. American
alua- Society for Testing and Materials, Philadelphia, PA, pp. 429-453. It 18. Ziegenfuss, P.S., W.J. Rensudette and W.J. Adams. aters
8-01. 1986. Methodology for assessing the acute toxicity of Iffice chemicals sorbed to sediments: Testing the equilib-
and rium partitioning theory. In T.J. Poston and R. Purdy, eds., Aquatic Toxicology andEnvironmenta1
doo Fate: Ninth Volume. STP 921. American Society for EPA Testing and Materials, Philadelphia, PA, pp.
'ncy, 479-1193, ,,ia 19. Swartz, R.C., D.W. Schults, T.H. DeWitt; G.R.
Ditsworth and J.O. Lamberson. 1990. Toxicity of nent fluoranthene in sediment to marine amphipods: A
"cy. test of the equilibrium partitioning approach to sed- iment quality criteria. Environ. Toxicol. Chem. 9::ens 1071-1080.
;en. u). Kemp, P.F. and R.C. Su~artz.1986. Acute toxicity of ide: interstitial and particle-bound cadmium to a marine ,lily infaunal amphipod. Mar. Environ. Res. 26:135-153. and 21. Nebeker, A.V., G.S. Schuylema, W.L. Griffis, J.A. For- Barbitta and L.A. Carey. 1989. Effect of sediment
organic carbon on survival of Hyalella azleca ex-Iof posed to DDT and endrin. Environ. Toxicoi. Chem. tod 8:705-718. . 22. Schuytema, G.S., A.V. Nebeker, W.L. Griffis and
C.E. Mills. 1959. Effectsof freezing on toxicity of ~ r . sediments contaminated with DDT and endrin. En-va- viron. Toxicoi. Chem. 8:883-891. ol, 23. Swartz, R.C., G.R. Dltsworth, D.W. Schults and
J.O. Umberson. 1985. Sediment toxicity to a marine PS- infaunal amphipod: Cadmium and its interaction :d- with sewage sludge. Mar. Environ. Rex 18:133-153.
24. Di Toro, D.M., J.D. Makony, D.J. Hansen, X.J. Scott, M.B. Hlnks, S.M. Mayrand M.S. Redmond.
of 1989. Toxicity of cadmium in sediments: The role of to acid volatile sulfide. Environ. Toxicoi. Chem. !I. 9:1487-1502.
25. Di Toro, D.M., J.D. Mahony, D.J. Hanseu, K.J. 11 Scott, A.R. CarI$on and G.T. Ankley. 1991. Acid
volatile sulfide predicts the acute toxicity of cadmium I. I - and nickel in sediments. Environ. Sci. Technol. (in
press). . 26. Muir, D.C.G., G.P. Rawn, B.E. Townsend, W.L. s Lockhart and R. Greenhalgh. 1985. Bioconcentration
of cypermethrin, deltamethrin, fenvalerate, and per- n methrin by Chironomus tentans larvae in sediment J and water. Envimn. Toxicol. Chem. 451-61.
17. Adams, W.J., R.A. Kimerle and R.G. Mosher. 1983. I Aquatic safety assessment of chemicals sorbedlo sed-
iments. Special Study Report No. ES-EAO-83.1. Monsanlo Company, Environmental Sciences Cen- ter, St. Louis, MO.
28. Adams, W.J. 1987. Bioavailability of neutral lipo- philic organic chemicals contained in sediments: A ieview. In K.L. Dickson, A.W. Maki and W.A. Brungs, eds., Fafe and Effects of Sediment-Bound Chemicals in Aquatic Systems. Pergamon Press, Elmsford, NY, pp. 219-244.
29. Karickhoff, S.W. 1984. Organic pollutant sorption in aquatic systems. .lHydraul. Div. ASCE 110:707-735.
30. O'Connor, DJ. and J. &nnoUy. 1980. Theeffect of concentration of adsorbing solids on the partition co- efficient. Water Resour. 14:1517-1523.
31. Di Toro, D.M. 1985. A panicle interaction model of reversible organic chemical sorption. Chemosphere 14:1503-1538.
32. Benes, P. and V. Majer. 1980. Trace Chemistry of Aqueous Solutions. Elsevier, New York, NY.
33. Gschwend, P.M. and S. Wu. 1985. On the constancy of sediment-water partition coefficients of hydropho- bic organic pollutants. Environ. Sci. Technoi. 19: 90-96.
34. Carter, C.W. and I.H. Suffetl. 1983. Interactions be- tween dissolved humk and fulvic acids and pollutants in aquatic environments. In R.L. Swann and A. Eschenroeder, eds., Fate of Chemicals in the Envi- ronment. ACS Symposium Series 225. American Chemical Society, Washington, DC, pp. 215-230.
35. Voice, T.C., C.P. Rice and W.J. Weber, Jr. 1983. Ef- fect of solids concentration on the sorptive partition- ing of hydrophobic pollutants in aquatic systems. Environ. Sci. Technol. 17:513-518.
36. Curl, R.L. and G.A. Keolelau. 1984. Implicit- adsorbate model for apparent anomalies with organic adsorption o n natural adsorbents. Environ. Sci. Technol. 18:916-922.
37. Nelson, D.M., W.R. Penrose, J.O. Karttunen and Mehlhaff. 1985. Effects of dissolved organic carbon on the adsorption properties of plutonium in natu- ral waters. Environ. Sci. Technol. 19:127-131.
38. Karickhoff, S.W. and K.R. Morris. 1985. Sorption dynamics of hydrophobic pollutants in sediment sus- pensions. Environ. Toxicol. Chem. 4:469-479.
39. DiTorn, D.M. andL. Honempa. 1983. Reversible and resistant component model of bexachlorobi- phenyl adsorption-desorption: Resuspension and di- lution. In D. MacKay, S. Paterson, S.J. Eisenreich and M.S. Simmons, eds., Physical Behavior of PCB's in the Great Luker. Ann Arbor Science, Ann Arbor, MI, pp. 89-114.
40. Di Toro, D.M., J.D. Mahony, P.R. Kirchgraber, , A.L. O'Byrne, L.R. Pasquale and D.C. Piccirilli.
1986. Effects of nonreversibiity, panicle concentra- tion, and ionic strength on heavy metal sorption. En-viron. Sci. Technol. 2055.
41. Mcnroy, L.M., J.V. DePinto, T.C. Young and S.C. Martin. 1986. Partitioning of heavy metals to sus- pended solids in the Flint River, Michigan. Environ. Toxicol. Chem. 5609-623.
42. MacKay, D. and B. Powers. 1987. Sorption of hy- drophobic chemicals from water: A hypothesis for the mechanism of the particle concentration effect. Chemosphere16:745-757.
43. Eadie, B.J., N.R. Morehead and P.G Landrum.

1990. Three-phase partitioning of hydrophobic or- canic comoounds in Great Lakes waters. Chemo- -r..-.- --.- - - - -
44. Thurman, E.M. 1985. Organic geochemistry of nat- ural waters. Maninus Nijhoff/Dr. W. Junk Publ., Dordrecht. The Netherlands.
45. Mecarthy, J.F. and B.D. Jimenez. 1985. Reduction in bioavailability to bluegills of polycyclic aromatic hydrocarbons bound to dissolved humic material. Environ. Toxicol. Chem. 4 5 1 1-521.
46. Landrum, P.F., S.R. Nlhart, B.J. Eadle and L.R. Herehe. 1987. Reduction in bioavailabii of organic contaminants to the amphipod Pontoporeia hoyi by dissolved organic matter of sediment interstitial wa- ters. Environ. Toxicol. Chem. 6:11-20.
47. Landrum, P.F., M.D. Reinhold, S.R. Nihart and B.J. Esdie. 1985. Predicting the bioavailability of organic xenobiotics to Pontoporeia hoyi in the presence of humic and fulvic materials and natural dissolved or- ganic matter. Environ. Toxicol. Chem. 4:459-467.
48. Prahl, F.G. 1982. The geochemistry of polycyclic ar- omatic hydrocarbons in Columbia River and Wasb- ington coastal sediments. Ph.D. thesis. Washington State University, Pullman, WA.
49. National Oceanic and Atmospheric Administration. 1991. Second summary of data on chemical contam- inants in sediments from the National Status and Trends Program. NOAA Technical Memorandum NOS OMA 59. Office of Oceanography and Marine Assessment, Rockville, MD.
50. Brownawell, B.J. and J.W. Fardngton. 1986. Biogeo- chemistry of PCBs in interstitial waters of a coastal marine sediment. Geochim. Cosmochim. Acfa 50: 1<7-160.-. A">.
51. Brownawell, B.J. and J.W. Farrington. 1985. Parti- tioning of PCBs in marine sediments. In A.C. Sigleo and A. Hattori, eds.. Marine and Estuarine Geo- chemistry. Lewis Publishers, Chelsea, MI, pp. 97-119.
52. ~ocha,S.B.and R. Carpenter. 1987. Factors affect- ing pore water hydrocarbon concentrations in Puget Sound sediments. Geochim. Cosmochim. Acta 51: 1237-1284.
53. Oliver, B.G. 1987. Biouptake of chlorinated hydro- carbons from laboratory-spiked and field sediments bv oliaochaete worms. Environ. Sci. Technol. 21: 785-730.
54. Chiou. C.T. 1985. Partition coefficients of oreanic compounds in lipid-water systems and correlaiions with fish bioconcentration factors. Environ. Sci. Technol. 1957-62.
55. Thomam, RV., J.P. Connolly, andT.F. Parkerton. 1991. An equilibrium model of organic chemical ac- cumulation in aquatic foodwebs with sediment inter- action. Environ. Toxicol. Chem. (in press).
56. McFarland, V.A. 1984. Activity-based evaluation of potential bioaccumulation for sediments. In R.L. Montgomery and S.W.Leach, eds., Dredging and Dredged Material Disposal, Vol. 1. American Soci- ety of Civil Engineers, New York, NY, pp. 461-467.
57. Lake, J.L., N. Rubinstein andS. Pavignano. 1987. Predicting bioaccumulation: Development of a sim-ple partitioning model for use as a screening tool for regulating ocean disposal of wastes. In K.L. Dickson, A.W. Maki and W.A. Brungs, eds.,Fateand~fects
of Sediment-Bound Chemicals in Aquatic Systems, Pergamon Press, Elmsford, NY, .pp. 151-166.
58. Rubinstein, N.I., J.L. Lake, R.J. Pruell, H.lee, 11, B. Taplin, J. Heltshe, R. Bowen and S. Pavignano, 1988. Predicting bioaccumulation of sediment. associated organic contaminants: Development o f a regulatory tool for dredged material evaluation. Technical Report D-87-1. U.S. Environmental pro. tenion Agency (Narragansett, RI) for the U.S. ~ r m y Corps of Engineers Waterways Experiment Station, Vicksburg, MS.
59. Bierman, V.J., Jr.'1990. Equilibrium and biomagni. fication partitioning of organic chemicals in benthic animals. Environ. Sci. Technol. 24:1407-1412.
60. Leo, A.J. 1972. Relationships between partitioning solvent systems. In R.F. Gould, ed., Biological car. relations- The Hansch Approach. Advances in Chemistry Series 114. American Chemical Society, Washington, DC,pp. 51-60.
61. Thomann, R.V. and J.P. Co~lnolly. 1984. Modelof PCB in the Lake Michigan lake trout food chain. En- viron. Sci. Technol. 1855-71.
62. Mackay, D. 1979. Finding fugacity feasible. Environ. Sci. Technol. 13:1218.
63. Stumm, W. and J.J. Morgan. 1970. Aquatic Chem. istry. Wiley-Interscience, New York, NY.
64. Hansen, D.J. and M.E. Tagatz. 1980. A laboratory test for assessing the impacts of substances on devel- oping communities of benthic estuarine organisms. In J.G. Eaton, P.R. Pardsh and A.C. Hendricks, eds., Aquatic Toxicology (Third Symposium). STP 707. American Society for Testing and Materials, Philadelphia, PA, pp. 40-57.
65. Tagatz, M.E. 1977. Effects of pentachlorophenol on the development of estuarine communities. J. Tox-icol. Environ. Health 3501-506.
66. Tagatz, M.E., C.H. Deans, G.R. Plaia and J.D. Pool. 1983. Impact on and recovery of experimental macrobenthic communities'exposed to pentachloro- phenol. Northeast Gu(fScience 6:131-136.
67. Haosen, DJ. 1974. Ar.oclor 1254: Effect oe compo- sition of developing estuarine animal communities in the laboratory. Contrib. Mar. Sci. 18:19-33.
68. Tagatz, M.E., N.R. Gregory and G.R. Plsia. 1982. Effects of chlorpyrifos on field- and laboratory-de- veloped estuarine benthic communities. J. Tox&al. Environ. Health 10:411-421.
69. Tagatz, M.E. and J.M. Ivey. 1981. Effects of fewal- erate on field- and laboratory-developed estuarine benthic communities. BUN. Environ. Contam. Tox- icol. 27:256-267.
70. Tagatz, M.E., G.R. Plaia and C.H. Deans. 1985. Ef- fects of 1,2,4-trichlorobenzene on estuarine macro- benlhic communities exposed via water and sedimenr Ecoroxicol. Environ. Saf 10:351-360.
71. Lru. A. and C. Hanach. eds. 1986. Loelf, DarabUe a n d ~ e t a t e d ~nramefe;~. Pomona college, Clare- mont. CA. Woudburn, K.B., Dourelre, W.J. and Andren. A,'\: 1984. Generator column determlnauon of O m -nol/warer panillon coelilc~enrs for sclened polycuo-rinated biphenyl congeners. Environ. Sci. Technol. 18:457-459. De Bruijn, J., F. Busser, W. Seinen, and J. Hemem 1989. Determination of octanol/water partition Co-
"slow-stirdng" me 83499-5 12.
74. Massey, F.J. 1951. deviation between tions. Ann. Mafh.
75. Abemethy, S. and correlations for na Kaiset, ed., QSAR D. Reidel Publishil pp. 1-16.
16. Candrum, P.F. 198! ics of polycyclic a1 sediments for the a viron. Sci. Techno,
77. Swartz, R.C., P.F. Lamberson. 1988. contaminants on t Rhepoxynius abro 7:1013-1020.
1583 Sediment quality criteria using equilibrium partitioning
!terns. "slow-stirring" method. Environ. Toxicol. Chem. >. 8:499-512. ,ee, 11, 14. Mmsey, EJ. 1951. The distribution of the maximum lnano. deviation between two sample cumulative step func- ment. tions. Ann. Math. Sraf. 22:125-128. l to fa 15. Abernethy, S. and D. Mackay. 1987. A discussion of alion. correlations for narcosis in aquatic species. In K.L. 11 Pro. Kaiser, ed., QSAR in Environmental Toxicology II.
76. Landrnm, P.F. 1989. Bioavailability and toxicokinet- nagni. ics of polycyclic aromatic hydrocarbons sorbed to enfhic sediments for the amphipod Ponloporeia hoyi. En- 2. viron. Sci. Technol. 23:588-595. ioning 77. Swartz, R.C., P.F. Kemp, D.W. Schnlts and J.O. I Cor. Lamberson. 1988. Effects of mixtures of sediment :es in contaminants on the marine lnfaunal amphipod, ~ciety, Rhepoxynius abronius. Environ. Toxicol. Chem.
7:1013-1020. del of n. En-
viron.
:hem-
atory ievel. .isms. ricks, STP
~ials,
01 on Tox-
J.D. ental Ioro-
npo-es in
982. t-de-rcol.
~wal-rine rox-
Ef-:ro-ent.
rase Ire-
.W. :ta-l i ~ . !a/.
ns. co-
78. Connolly, J.P. and C.J. Pedersen. 1988. A thermo- dynamic-based evaluation of organic chemical accu- mulationin aquaticorganisms. Environ. Sci. Technol. 2299-103.
79. Cowan, CE. and D.M. Di Toro. 1988. Interim sedi- ment criteria valves for nonpolar hydrophobic com- pounds. U.S. Environmental Protection Agency, Office of Water Regulations and Standards, Criteria and Standards Division, Washington, DC.
80. Connolly, J.P. 1991. Application of a food chain model to polychlorinated biphenyl contamination of thelobster and winter flounder food chains in New Bedford Harbor. Environ. Sci. Technol. 25760-770.
81. Hamilton, M.A., R.C. Russo and R.V. Thurston. 1977. Trimmed Spearman-Karber method of esti- mating median lethal concentrations in toxicity bio- assays. Environ. Sci Technol. 11:714-719. Correction 12:417 (1978).