squirtle squad - weebly
TRANSCRIPT

Picture source: SJRWMD and Nintendo
ENV4514C | Lab Portfolio | April 17, 2016
Squirtle Squad JOSHUA BENJAMIN, GINA CASSULO, KEVIN KIJANKA, JISOO KIM
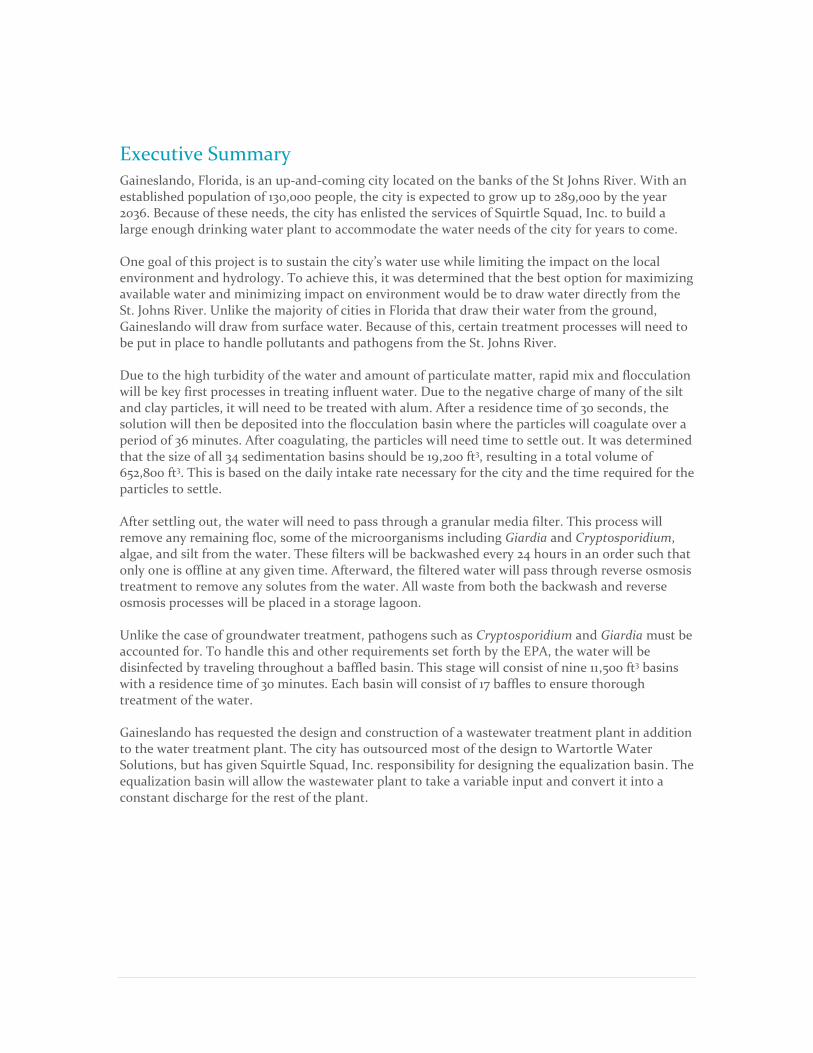
Executive Summary Gaineslando, Florida, is an up-and-coming city located on the banks of the St Johns River. With an established population of 130,000 people, the city is expected to grow up to 289,000 by the year 2036. Because of these needs, the city has enlisted the services of Squirtle Squad, Inc. to build a large enough drinking water plant to accommodate the water needs of the city for years to come. One goal of this project is to sustain the city’s water use while limiting the impact on the local environment and hydrology. To achieve this, it was determined that the best option for maximizing available water and minimizing impact on environment would be to draw water directly from the St. Johns River. Unlike the majority of cities in Florida that draw their water from the ground, Gaineslando will draw from surface water. Because of this, certain treatment processes will need to be put in place to handle pollutants and pathogens from the St. Johns River. Due to the high turbidity of the water and amount of particulate matter, rapid mix and flocculation will be key first processes in treating influent water. Due to the negative charge of many of the silt and clay particles, it will need to be treated with alum. After a residence time of 30 seconds, the solution will then be deposited into the flocculation basin where the particles will coagulate over a period of 36 minutes. After coagulating, the particles will need time to settle out. It was determined that the size of all 34 sedimentation basins should be 19,200 ft3, resulting in a total volume of 652,800 ft3. This is based on the daily intake rate necessary for the city and the time required for the particles to settle. After settling out, the water will need to pass through a granular media filter. This process will remove any remaining floc, some of the microorganisms including Giardia and Cryptosporidium, algae, and silt from the water. These filters will be backwashed every 24 hours in an order such that only one is offline at any given time. Afterward, the filtered water will pass through reverse osmosis treatment to remove any solutes from the water. All waste from both the backwash and reverse osmosis processes will be placed in a storage lagoon. Unlike the case of groundwater treatment, pathogens such as Cryptosporidium and Giardia must be accounted for. To handle this and other requirements set forth by the EPA, the water will be disinfected by traveling throughout a baffled basin. This stage will consist of nine 11,500 ft3 basins with a residence time of 30 minutes. Each basin will consist of 17 baffles to ensure thorough treatment of the water. Gaineslando has requested the design and construction of a wastewater treatment plant in addition to the water treatment plant. The city has outsourced most of the design to Wartortle Water Solutions, but has given Squirtle Squad, Inc. responsibility for designing the equalization basin. The equalization basin will allow the wastewater plant to take a variable input and convert it into a constant discharge for the rest of the plant.

1 | P A G E
Introduction
With a current population of 130,000, the city of Gaineslando has grown at a rate of 39.9% over the
past ten years, similar to its neighboring city of Sanford (Demographics, 2o1o). If this growth rate
persists, the population will reach 289,000 in the next 20 years. Because of this, the city has
contracted Squirtle Squad, Inc. to design a water treatment plant to treat a flow of 28.9 MGD. The
plant will be composed of rapid mix, flocculation, sedimentation, filtration, reverse osmosis, and
disinfection, with waste handling handled through lagooning. This report also includes the
equalization basin design for the wastewater plant that is currently being designed by Wartortle
Water Solutions.
Rapid mix is a system after ozonation and before flocculation crucial for removing suspended
matter in water. A coagulant helps in removing the unnecessary matter. This system offers a quick
dispersion of the coagulant and the coagulants react with the particles in the water to facilitate the
binding of the particles with each other. This step is important to water treatment because it
reduces the alum concentration to about 80% of the original concentration in raw water.
Flocculation is the process that typically occurs after rapid mix. Typically, a flocculation tank is
separated into multiple stages, where the fluid is gradually slowed down in each tank by horizontal
paddle mixers. It is important to water treatment because it is the process by which fine particles
are caused to clump together into a floc.
Sedimentation is a crucial step in the treatment of drinking water. The key to good sedimentation
is time. By allowing the floc containing water to travel slowly through a large basin, the floc is
allowed to settle out. Also, by moving the water slowly through the basin, floc disruption is
minimal.
Filtration is a key process in drinking water treatment. It is a necessary process because it removes
smaller particles from the water that cannot settle out during the sedimentation stage. Because of
this, filtration follows sedimentation in the drinking water treatment process. The suspended
particles that are removed during filtration can consist of floc, microorganisms including Giardia
and Cryptosporidium, algae, and silt.
Reverse osmosis (RO) membrane filtration is meant to separate dissolved solids from water by
forcing water through a semi-permeable membrane. RO involves the forced passage of water
through a semi-permeable membrane against natural osmotic pressure, and is typically used to
remove dissolvable solutes from the water, such as Na+, Cl-, Ca2+, and Mg2+.
Water disinfection is the removal or inactivation of pathogenic microorganisms. It is usually
considered the most important phase of water treatment because the termination of growth and
reproduction of the microorganisms can prevent infection and illness from drinking untreated
water.
The residuals from the water treatment will be treated using lagooning, as it is an accepted method
for dewatering, thickening, and storage of waste sludge. The lagoon uses the process of air drying,
where the waste is spread out in a shallow area and allowed to dewater through evaporation.
An equalization basin is designed to convert a variable input flow rate into a constant discharge. It
is necessary in a wastewater plant because the input that goes into a wastewater plant can come
from a multitude of sources, whose flow rates can vary both temporally and spatially.

2 | P A G E
Lab 1
Raw Water Source
Population Projection
The city of Gaineslando, Florida, with a current population of 130,000, has grown at a rate of 39.9%
over the past ten years, similar to its neighboring city of Sanford (Demographics, 2o1o). If this
growth rate persists, the population will reach 289,000 in the next 20 years. Since the average water
consumption per person per day is 100 gallons, the projected water demand in 20 years will be 28.9
MGD. The Gaineslando water treatment plant will be designed according to this projected flow.
Why the St. Johns River?
Continual population growth and expanding development in Gaineslando and the rest of Central
Florida brings with it an increasing demand for potable water, which in turn creates greater strain
on the groundwater resources currently in use. The primary motivation for selecting the St. Johns
River (SJR) as a raw water source for this water treatment plant is to reduce reliance on the aquifer,
which otherwise might face irreversible saltwater intrusion if overdrawn.
According to a Water Supply Impact Study of the river, as much as 155 MGD could be drawn from
the SJR with little to no ecological impact. The projected volume per day of this plant (28.9 MGD)
falls well below the study’s threshold for moderate impacts, so the operation of this plant would
more than likely have negligible to minor water level and ecological impacts both locally and
downriver, where salinity and discharge effects would only result from a much higher withdrawal
volume (Lowe, 2012).
The main disadvantages, however, to using a surface water like the SJR lie in the variability of the
flow according to season and in case of drought. Concentrations of many constituents can fluctuate
greatly with seasonal or weather-related changes. Furthermore, in the event of very low flow, there
is a possibility that withdrawal from the SJR could have a more noticeable impact on the river
environment.

3 | P A G E
Constituents of Interest in the Raw Source Water
Table 1.1. Summary of raw water characteristics and primary/secondary drinking water treatment
standards
Constituent Level/Concentration (SJR) EPA Drinking
Standard** Standard
Met?
GENERAL
pH 8.10 6.5 - 8.5 Yes
Turbidity (NTU) 4.3 1 No
NUTRIENTS
Ammonia (mg/L as N) 0.028 N/A N/A
Chlorophyll-a (algae) (mg/L) 23.6 0.004 No
Total Nitrate (mg/L as N) 0.15 10 Yes
Nitrite (mg/L as N) < 0.01 1 No
Total Phosphorus (mg/L) 0.08 0.04 No
Dissolved Oxygen (DO) (mg/L) 8.186 5 Yes
ORGANIC
Color (CU) 80 15 No
DOC (mg/L) 16.9 See Turbidity/Color No
INORGANIC
Barium (mg/L) 28 2 No
Bromide (DBP) (mg/L) 0.93 0.01 (Bromate DB) No
Calcium (mg/L) 51 N/A N/A
Chloride (mg/L) 287 250 No
Total Iron (mg/L) 0.179 0.3 Yes
Magnesium (mg/L) 23 N/A N/A
Potassium (mg/L) 7.3 N/A N/A
Silica (mg/L) 4.0 N/A N/A
Sodium (mg/L) 186 250 Yes
Strontium (mg/L) 1.156 N/A N/A
Sulfate (mg/L) 78 250 Yes
Sulfide (mg/L) < 1 N/A N/A
Total Dissolved Solids (mg/L) 735 500 No
**Primary standards are highlighted in red and secondary standards are highlighted in blue.
Constituents to be removed to meet standards: turbidity, chlorophyll-a (algae), nitrite,
phosphorus, color, DOC, barium, bromide, and total dissolved solids.

4 | P A G E
Rapid Mix
Rapid mix is a system after ozonation and before flocculation crucial for removing suspended
matter in water. A coagulant helps in removing the unnecessary matter. This system offers a quick
dispersion of the coagulant and the coagulants react with the particles in the water to facilitate the
binding of the particles with each other. This step is important to water treatment because it
reduces the alum concentration to about 80% of the original concentration in raw water.
For this design, the rapid mix basin is a square and has dual flat-blade impellers and stator baffles.
It is assumed to be under the conditions of 1st order kinetics. The design started off with the
recommended parameters: residence time between 10 and 30 seconds, velocity gradient between
600 and 1000 s-1, and volume of the basin to be less than 26.25 ft3. Since the basin has the length to
width ratio of 1:1, the basin is designed to have the length of 4.92 ft to satisfy the volume limit of
26.25 ft3. With the basin length of 4.92 ft, the liquid depth, the baffle length, and the impeller
diameter can be determined using the recommended parameters.
𝐿𝑖𝑞𝑢𝑖𝑑 𝑑𝑒𝑝𝑡ℎ 𝑓𝑜𝑟 𝑑𝑢𝑎𝑙 𝑖𝑚𝑝𝑒𝑙𝑙𝑒𝑟𝑠 = 4.92 𝑓𝑡 × 1.5 = 7.38 𝑓𝑡
𝐵𝑎𝑓𝑓𝑙𝑒 𝑙𝑒𝑛𝑔𝑡ℎ = 4.92 ft × 10% = 0.492 𝑓𝑡
𝐼𝑚𝑝𝑒𝑙𝑙𝑒𝑟 𝑑𝑖𝑎𝑚𝑒𝑡𝑒𝑟 𝑓𝑜𝑟 𝑑𝑜𝑢𝑏𝑙𝑒 𝑖𝑚𝑝𝑒𝑙𝑙𝑒𝑟 = 4.92 ft × 0.5 = 2.46 𝑓𝑡
𝑉𝑜𝑙𝑢𝑚𝑒 𝑜𝑓 1 𝑏𝑎𝑠𝑖𝑛, 𝑉1 = 𝑙𝑤ℎ = 4.92 ft × 4.92 ft × (7.38 + 1) 𝑓𝑡 = 202.85 𝑓𝑡3
For the volume of one basin, the height is determined by adding the liquid depth and the
freeboard per tank, which is 1ft. The velocity gradient and the residence time are designed to be 700
s-1 and 30 s, respectively. Then, the mixer power requirements and the flow rate per one basin can
be determined. Here, water is assumed to be at 18°C and the dynamic viscosity of the water at the
respective temperature is µ = 0.022 lbf·s/ft2
𝑉𝑒𝑙𝑜𝑐𝑖𝑡𝑦 𝑔𝑟𝑎𝑑𝑖𝑒𝑛𝑡, 𝐺 = √𝑃
𝜇 ∙ 𝑉1
𝑃𝑜𝑤𝑒𝑟 𝑟𝑒𝑞𝑢𝑖𝑟𝑒𝑑, 𝑃 = 𝐺2𝜇𝑉1 = 7002 𝑠−2 × 0.022 𝑙𝑏𝑓 ∙ 𝑠
𝑓𝑡2× 202.85 𝑓𝑡3 = 2186723
𝑓𝑡 ∙ 𝑙𝑏𝑓
𝑠
= 2.18 × 10⁶ 𝑓𝑡 ∙ 𝑙𝑏𝑓
𝑠
To obtain the flow rate of one basin, the following calculation must be done.
𝐹𝑙𝑜𝑤 𝑟𝑎𝑡𝑒 𝑜𝑓 1 𝑏𝑎𝑠𝑖𝑛, 𝑄1 =𝑉1
𝑡=
202.85 𝑓𝑡3
30 𝑠= 6.76
𝑓𝑡3
𝑠
The total flow rate, Q, for the design is 28.9 MGD. The conversion from MGD to m3/s is as follows.
𝑄 =28.9 × 10⁶𝑔𝑎𝑙
1 𝑑𝑎𝑦×
1 𝑑𝑎𝑦
24 ℎ𝑟×
1 ℎ𝑟
60 𝑚𝑖𝑛×
1 𝑚𝑖𝑛
60 𝑠×
0.134 𝑓𝑡3
1 𝑔𝑎𝑙= 44.82
𝑓𝑡3
𝑠
𝑁𝑢𝑚𝑏𝑒𝑟 𝑜𝑓 𝑡𝑎𝑛𝑘𝑠 =𝑄
𝑄1
=44.82
6.76= 6.63 ≈ 7 𝑡𝑎𝑛𝑘𝑠

5 | P A G E
Therefore in total, the rapid mix design requires 7 tanks to satisfy the water required for the
population.
𝐵𝑎𝑓𝑓𝑙𝑒 𝑣𝑜𝑙𝑢𝑚𝑒 = ℎ × 𝑏𝑎𝑓𝑓𝑙𝑒 𝑙𝑒𝑛𝑔𝑡ℎ × 𝑤 = 8.38 × 0.492 × 4.92 𝑓𝑡3 = 20.28 𝑓𝑡3
Table 1.2. Summary of design parameters for rapid mix basins
Parameter Recommended Actual
Total Flow Rate (Q) 44.82 ft3/s
Residence Time (t) Between 10 and 30 seconds 30 s
Velocity Gradient (G) Between 600 – 1000 s-1 700 s-1
Total Volume of basins (V) 1419.74 ft3
Volume per basin Less than 8 m3 202.85 ft3
Number of basins 7
Baffles:
Number of baffles 2 2
Baffle Length Extend 10% of basin width 0.492 ft
Baffle Volume 20.28 ft3
Impellers:
Number of impellers 2 2
Diameter of impellers 0.3 – 0.5 times the basin width 2.46 ft
Volume of impellers 31.08 ft3
Length per basin 4.92 ft
Width per basin 4.92 ft
L:W ratio 1:1 1:1
Height per basin
Liquid depth per tank 1.1 – 1.6 times the basin width 7.38 ft
Freeboard per tank 1 ft 1 ft

6 | P A G E
Figure 1.1. Schematic of rapid mix basin

7 | P A G E
Flocculation
Flocculation is the process that typically occurs after rapid mix. Typically, a flocculation tank is
separated into multiple stages, where the fluid is gradually slowed down in each tank by horizontal
paddle mixers. It is important to water treatment because it is the process by which fine particles are
caused to clump together into a floc. How it works is that it reduces the flow velocity that occurs
after rapid mix, and causes the colloids to stabilize and bind together into flocs. During flocculation,
the chemically treated water is given gentle, slow mixing to build large settleable floc. Once the floc
is formed, the water is moved into the sedimentation basin, where the floc can settle on the bottom
of the basin and be removed from the water.
In this design, the flocculation basin consists of five separate flow lines running in parallel, with each
flow line separated into three basins.
The time was assumed to be 36 seconds due to the ease with which it can be divided into 3, as well
as the increased travel time aiding the flocculation process. Using the time, the volume can be
calculated as:
∀= 𝑡𝑄 = 36𝑚𝑖𝑛 ∗ 28.9𝑀𝑔𝑑 = 96,815 ft3
This gives the total volume for the entire system, which can then be divided by 15 to find the volume
per basin, which is 6,454.3 ft2. Each basin has a corresponding lower value of G, and is designed to
slow the fluid flow and move it using large horizontal paddles. The power requirements and paddle
velocities were calculated based off of the G values, with CD = 1.8, and ρ = 1.936 slugs/ft3. Each basin
contains four sets of paddles, that each have four arms that contain two paddles each. Paddle
dimensions and spacing were determined by consulting the coagulation and flocculation chapter of
“Theory and Practice of Water and Wastewater Treatment” by Ronald L. Droste (Droste, 1994), which
identified the ideal spacing for paddles from the wall as 0.66 ft. and the ideal spacing between paddles
as 0.98 ft.
The reason why the design uses five set separate flow lines is due to the demand for water not being
at peak capacity until year 20, which means that when the plant opens it will not have to run all of
the basins. Furthermore, separate flow lines allows for a degree of redundancy, in that if a line
malfunctions for some reason, the flow will be able to be rerouted to another line while the faulty
line can be replaced.
Note that calculations for design parameters can be found in the sample calculations at the end of
the report.
8 | P A G E
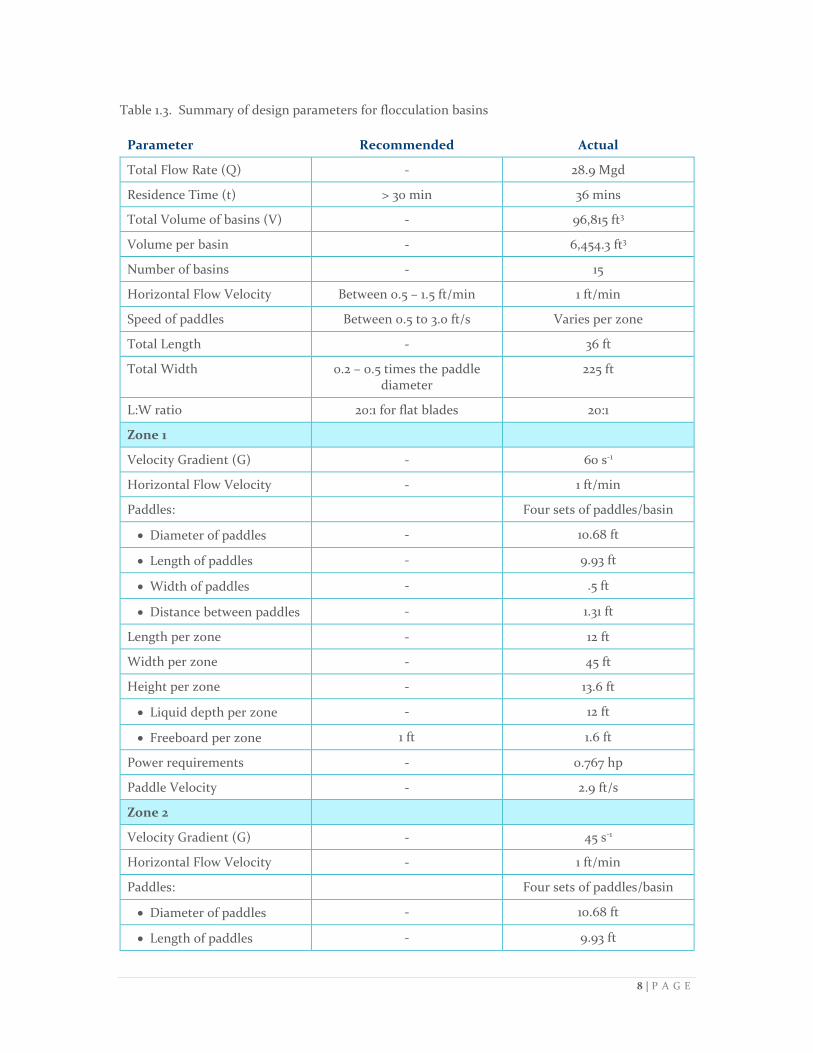
Table 1.3. Summary of design parameters for flocculation basins
Parameter Recommended Actual
Total Flow Rate (Q) - 28.9 Mgd
Residence Time (t) > 30 min 36 mins
Total Volume of basins (V) - 96,815 ft3
Volume per basin - 6,454.3 ft3
Number of basins - 15
Horizontal Flow Velocity Between 0.5 – 1.5 ft/min 1 ft/min
Speed of paddles Between 0.5 to 3.0 ft/s Varies per zone
Total Length - 36 ft
Total Width 0.2 – 0.5 times the paddle diameter
225 ft
L:W ratio 20:1 for flat blades 20:1
Zone 1
Velocity Gradient (G) - 60 s-1
Horizontal Flow Velocity - 1 ft/min
Paddles: Four sets of paddles/basin
Diameter of paddles - 10.68 ft
Length of paddles - 9.93 ft
Width of paddles - .5 ft
Distance between paddles - 1.31 ft
Length per zone - 12 ft
Width per zone - 45 ft
Height per zone - 13.6 ft
Liquid depth per zone - 12 ft
Freeboard per zone 1 ft 1.6 ft
Power requirements - 0.767 hp
Paddle Velocity - 2.9 ft/s
Zone 2
Velocity Gradient (G) - 45 s-1
Horizontal Flow Velocity - 1 ft/min
Paddles: Four sets of paddles/basin
Diameter of paddles - 10.68 ft
Length of paddles - 9.93 ft

9 | P A G E
Width of paddles - .5 ft
Distance between paddles - 1.31 ft
Length per zone - 12 ft
Width per zone - 45 ft
Height per zone - 13.6 ft
Liquid depth per zone - 12 ft
Freeboard per zone 1 ft 1.6 ft
Power requirements - 0.432 hp
Paddle Velocity - 2.39 ft/s
Zone 3
Velocity Gradient (G) - 30 s-1
Horizontal Flow Velocity - 1 ft/min
Paddles: Four sets of paddles/basin
Diameter of paddles - 10.68 ft
Length of paddles - 9.93 ft
Width of paddles - .5 ft
Distance between paddles - 1.31 ft
Length per zone - 12 ft
Width per zone - 45 ft
Height per zone - 13.6 ft
Liquid depth per zone - 12 ft
Freeboard per zone 1 ft 1.6 ft
Power requirements - 0.192 hp
Paddle Velocity 1.83 ft/s

10 | P A G E
Figure 1.2. Schematic of flocculation basin

11 | P A G E
Sedimentation
Sedimentation is a crucial step in the treatment of drinking water. The key to good sedimentation
is time. By allowing the floc containing water to travel slowly through a large basin, the floc is
allowed to settle out. Also, by moving the water slowly through the basin, floc disruption is
minimal.
Particles settle out due to gravity and the time it takes them to settle is based on their settling
velocity. Larger particles will have a greater settling velocity and settle out much quicker than the
smaller particles. By the time the water reaches the end of the basin, many of the large particles will
settle out, leaving a small amount of finer particles which will need to be removed through
filtration processes. Without sedimentation, the floc particles generated during the flocculation
stage would not be removed from the water that is outputted. These floc particles could then
become disrupted and break apart and clog future clarification processes (i.e. filtration).
For the sedimentation basin designs, a rectangular basin was decided upon due to the fact it
minimizes short-circuiting when compared to circular basins. The residence time of each of the
basins was decided to be a total of 4 hours. This value was decided upon because it fell within the
acceptable range. Other values that were decided based on whether or not they fell within the
acceptable range included width, liquid depth, L:W ratio, and freeboard. After deciding that the
width would be 20 feet and L:W would be 6 to 1 it could be determined that the length is 120 feet.
Based on these values the volume of each basin can be determined by multiplying width by height
by depth resulting in 19200 ft3. Once the volume was determined, equation 1 in the sedimentation
section of the sample calculations was used determine the number of basins required based on
values already determined.
Though this number of tanks may appear high, it is necessary based on the other parameters of the
basin. Once the number of basins has been determined, it can be multiplied by the volume of each
basin to determine the total volume of basins.
The surface area can be determined by multiplying the width of each basin by its length. The flow
area can be determined by multiplying the width of a single basin by the height. Once the flow area
has been determined it can be used in the determination of horizontal flow velocity. This is
calculated in equation 2. The overflow velocity can be calculated by using the surface area of a
single sedimentation basin. This is calculated in equation 3. Both the flow velocity and the
overflow velocity fall within the recommended values.
The weir loading was decided to be 20,000 gal/day•ft. Once this was determined, the total weir
length was calculated through the use of equation 4. The resulting value of 42.5 ft for the total weir
length is appropriate even though it fails to result in a finger weir length of 39.6 ft that is 33% of the
total basin length. The total weir loading is far more important than the finger weir length, which is
only 9.4% of the total basin length. Finger weir length can be calculated based on total weir length
and the width of the basin. This is shown in equation 5. In this equation, the number of fingers is
taken to be two because this results in the maximum finger weir length that follows the weir
loading.

12 | P A G E
Table 1.4. Summary of design parameters for sedimentation basins showing both recommended
and actual values.
Parameter Recommended Actual
Total Flow Rate (Q) 28.9 MGD
Residence Time (t) 4 – 8 hrs. 4 hr
Total Volume of basins (V) 652800 ft3
Volume per basin 19200 ft3
Number of basins 34
Length per basin 120 ft
Width per basin 10 – 20 ft 20 ft
L:W ratio 3:1 to 6:1 6 : 1
Height per basin
Liquid depth per tank 7 – 8 ft 8 ft
Freeboard per tank 1 ft 1 ft
Surface area 2400 ft2
Flow area 160ft2
Horizontal Flow Velocity ≤ 0.5 ft/min .49318 ft /min
Overflow Velocity Between 350 – 800 gal/day•ft2 354.166 gal/day*ft2
Weirs:
Number of finger weirs 2
Finger Weir Length 33% of total basin length 11.25 ft
Total Weir Length 42.5 ft
Total Weir Loading 20,000 gal/day•ft 20,000 gal/day*ft

13 | P A G E
Figure 1.3. Schematic of sedimentation basin (side view and top view)

14 | P A G E
Lab 2
Granular Media Filtration
Filtration is a key process in drinking water treatment. It is a necessary process because it removes
smaller particles from the water that cannot settle out during the sedimentation stage. Because of
this, filtration follows sedimentation in the drinking water treatment process. The suspended
particles that are removed during filtration can consist of floc, microorganisms such as Giardia and
Cryptosporidium, algae, and silt.
To remove these particles, overflow from the sedimentation stage is allowed to filter through a
column of granular media. This media generally consists of layered sand and gravel below a top
layer of anthracite coal or a similar substance. The filter media should have a large amount of
surface area relative to its volume. The surface of the media should be course with large pore
openings to retain a large amount of floc and small enough to not let larger particles through. The
depth of the media should be enough to allow for long filter runs. This is because as water passes
through the media, the concentration of useable media decreases and the parts that are useable
become concentrated with particles. As the clean bed depth shrinks, breakthrough can eventually
occur where particles begin to stream into the outflow.
Flow through the filter media is driven by gravity. At the beginning of the filtration process, the
water is able to easily flow through the media. To prevent an excessive flow rate through the media
while the filter is clean, the output velocity is controlled. As the filter media begins to increase in
particle concentration, the resistance in flow increases and the output velocity can be increased
accordingly. Once the filter becomes fully concentrated with particle matter, backwash is
performed to clean the media material.
First, through equation 1, Gaineslando’s flow rate of 28.9 MGD was converted into 20,069.44 gpm.
Assuming a loading rate of 5.97 gpm/ft2 (trial and error calculation showed that this value resulted
in cleaner dimension values), which falls within the recommended range of 3-6 gpm/ft2, the total
necessary filtration surface area was determined to be 3364ft2 by equation 2. This total surface
area was segmented into 16 square-based basins with length and width equaling 14.5 ft.
A common setup of sand topped with anthracite was chosen for the filter media. Having the
anthracite come into contact with the water first allows for greater adsorption of the suspended
particles due to anthracite’s large pore size. This allows fewer particles to reach the sand layer,
which can cause plugs in the filter. The depth of the weir to media was selected to be 3 ft based on
the recommended value and the fact that there should be enough water above the media to keep
the water easily flowing through the media. The depths of sand and anthracite were determined to
be 1 and 2 ft, respectively, based on the recommended values. The depth of the anthracite should be
greater than that of the sand because of its greater pore size and its ability to capture more
particles. It is placed first in the media order to prevent the sand from clogging.

15 | P A G E
Table 2.1. Summary of design parameters for granular-media filtration
Parameter Recommended Actual
Total Flow Rate (Q) 28.9 MGD
Loading Rate 2-10 gpm/ft2; 3-6 gpm/ft2 is common
5.97 gpm/ft2
Total Volume of basins (V) 30276 ft3
Volume per basin 1892.25 ft3
Number of basins 16
L:W ratio 1:1 1:1
Length per basin 14.5 ft
Width per basin 14.5 ft
Height per basin ~10 ft 9 ft
Freeboard per tank ~2 ft 2 ft
Distance from top of media to bottom of weir
~3 ft 3 ft
Depth of underdrain ~1 ft 1 ft
Depth of sand ~1 ft 1 ft
Depth of anthracite coal ~2 ft 2 ft
Figure 2.1. Schematic of Filter Basin (cross-section)

Reverse Osmosis (RO) Membrane Filtration
Reverse osmosis (RO) membrane filtration is meant to separate dissolved solids from water by
forcing water through a semi-permeable membrane. RO involves the forced passage of water
through a semi-permeable membrane against natural osmotic pressure, and is typically used to
remove dissolvable solutes from the water, such as Na+, Cl-, Ca2+, and Mg2+. The dissolved solutes
are then removed from the system and stored as a brine. Next, the brine is sent away for disposal,
which is typically done through either surface water discharge, an evaporation pond, through land
application, deep well injection, sewer discharge, dust control, or for deicing.
RO is important to water treatment because it is the final filtration step before disinfection (the
reason for this is to prevent RO from removing the Cl that is added in the disinfection stage), that
is able to remove solutes. It is important to keep the turbidity below 1 NTU in order to prevent
membrane fouling. If the turbidity is any higher than 1 NTU, too many suspended particles will
settle on the membrane surface, thus blocking feed channels and increasing friction losses across
the system.
For a RO membrane to properly function, the osmotic pressure must be in the range of 350 to 800
psi. The range depends mainly on the solute concentrate of the feed, with higher pressures required
for higher concentrates. The Gaineslando Water Treatment plant will use the Vantage M86 reverse
osmosis and nanofiltration system, Model No. M86R-162. In regard to TDS, the raw water taken
from the St. Johns River has a TDS of 735 ppm. The Vantage M86 is optimized for water chemistries
with 250 ppm ≤ TDS ≤ 2000 ppm, which makes it an ideal solution. This system is a single-pass
filter, which pushes the feed water through a semi-permeable membrane to create a supply of reject
water (brine) and product water. This system has the capacity to remove 97% of TDS and 95% of
naturally occurring organics. The main disadvantage of this system is that it has a high water loss of
20% (assume that the brine is sent to an evaporation pond, where the evaporated water is captured
and sent back into the system for treatment, effectively minimizing the total loss). This is due to
the high pressure that is provided by the pump, which is a 316 SS high pressure pump. The pump
can provide up to 516 psi, which is more than enough for the recommended pressure of 150-300 psi.
In regard to pH, the pH from the St. Johns River is already within the allowable values, at 8.1. For
chlorine, the level that is in the St Johns is 287 ppm. Assuming that the removal rate for TDS
matches the removal rate for chlorine, this gives a final value of 8.43 ppm, which is below the EPA
secondary standard of 250 ppm. This plant will require 21 RO units, which was determined by
dividing the total plant flow (20,069.44 gpm) by the flow per unit (960 gpm) (see Equation 1).

17 | P A G E
Table 2.2. Summary of design parameters for reverse osmosis membrane units
Parameter Recommended Actual
Total Flow Rate (Q) 28.9 MGD
Number of membrane units 21
Operating Pressures 150 – 300 psi (1035 – 2400 kPa) 300 psi
Allowable pH pH 4 – pH 11 8.1
Maximum allowable chlorine 0.1 mg/L 8.43
Maximum allowable turbidity ≤ 1 𝑁𝑇𝑈 1
Water loss percentage 20%
Figure 2.2. Schematic of single reverse osmosis unit

18 | P A G E
Disinfection
Water disinfection is the removal or inactivation of pathogenic microorganisms. It is usually
considered the most important phase of water treatment because the termination of growth and
reproduction of the microorganisms can prevent infection and illness from drinking untreated
water. The disinfection stage includes physical and chemical disinfections. The disinfecting agents
added to water bind or chemically remove the microorganisms and can remain in the water as a
residual to prevent any further growth of the unwanted microorganisms.
Using Equation 1, a total water volume of 80,487 ft3 was determined to be necessary for a
recommended residence time of 30 minutes. This needed water volume can be divided into about 8
10,000 ft3 segments of equal dimensions (100 ft x 10 ft x 10 ft) (Equation 2) before taking into
account baffle volume and freeboard. Each 1oo-foot-long basin will contain 17 baffles (11.5 ft (total
height including freeboard) x 0.5 ft (thickness) x 7 ft (width)), which together take up a
submerged volume of 595 ft3 per basin (Equation 3). The baffles therefore reduce the water
capacity of each basin to 9,405 ft3, which increases the number of total necessary basins to 9
(Equation 4). Adding 1.5 ft of freeboard to the depth each basin structure brings the total volume
per basin to 11,500 ft3.
The EPA requires that surface water be treated to achieve 2-log (99%) removal of Cryptosporidium,
3-log (99.9%) removal of Giardia, and 4-log (99.9%) removal of viruses. Generally, if necessary CT
(chlorine dose x t10 time) is met to achieve 3-log Giardia removal, appropriate removal of
Cryptosporidium and viruses will also be met. Conventionally, 2.5-log removal of Giardia will occur
during filtration, meaning 0.5-log removal is necessary during the disinfection stage. The CT
required for 0.5-log removal of Giardia using free chlorine at a temperature of 20oC and a pH of 8
(raw SJR pH is 8.1) is 14 mg/L*min. The necessary chlorine dose for this plant’s flow can be
determined using this CT value and the t10 time, which is the time it takes for 10% of the water
entering the tank to be discharged. Due to the influence of baffling on the flow, the t10 time must be
determined using a tracer study during peak hourly flow.

19 | P A G E
Table 2.3. Summary of design parameters for disinfection
Parameter Recommended Actual
Total Flow Rate (Q) 28.9 MGD
Residence Time (t) 30 minutes 30 minutes
Total Volume of basins (V) 80,487 ft3
Volume per basin 11,500 ft3 (total)
9,405 ft3 (water)
Number of basins 9
Baffles:
Number of baffles 17
Baffle Length (total, including freeboard)
11.5 ft
Baffle Volume (submerged only)
595 ft3
Length per basin 100 ft
Width per basin 10 ft
L:W ratio 10:1
Height per basin 11.5 ft
Liquid depth per tank 10 ft
Freeboard per tank 1.5 ft
Figure 2.3. Schematic of disinfection basin

20 | P A G E
Water Treatment Residuals/Waste Handling
The water treatment residuals that are present in our system are from sedimentation, granular
media filtration, and reverse osmosis.
The residual that is generated from sedimentation is from colloidal matter removed from the raw
water and chemical flocs that initially pass through this stage. A large component of this waste is
alum, which is the chemical flocculent that was initially injected in the rapid mix phase. The sludge
residuals can be estimated from chemical additions and raw water characteristics, and are
estimated based on Equation 1.
The majority of the sludge solids formed during this stage settle on the bottom of the
sedimentation basin, and the remainder are removed by filtration.
The residual generated by the granular media filtration stage is the filter wash water. This facility’s
filters will be backwashed every 24 hours. They should be backwashed at off-peak hours when the
downtime will not affect the required output flow. Based on information from Hammer and
Hammer, a backwash rate commonly used is 15 gpm/ft2. This backwash rate and the plant’s
filtration surface area of 3364 ft2 would result in a flow of 50,460 gpm (Equation 2). It is generally
recommended that the total amount of water used for backwashing is 2-3% of our total water
output. After 12 minutes, 605,520 gallons would be used to backwash the media which is 2.1% of the
total output (Equation 3). After the filtration media has been properly cleaned, before water
treatment resumes it is important that any water that is filtered through during the first 3-5
minutes be wasted.
Residuals from reverse osmosis are predominately from the brine that is generated from the reject
water. At peak flow rates, the brine can be up to 20% of the feed water, which accounts for
approximately 5.78 MGD.
The residuals from the water treatment will be treated using lagooning, as it is an accepted method
for dewatering, thickening, and storage of waste sludge. The lagoon uses the process of air drying,
where the waste is spread out in a shallow area and allowed to dewater through evaporation. Once
the waste has been properly dewatered, it can then be collected and sent to a dedicated surface
disposal site, with the residuals from the sedimentation basin and granular media filtration sent to
a sludge handling site, and the brine residuals sent up north during the winter to be used for
deicing, or sent to the surface disposal site when deicing is not a viable option.
Table 2.4. Summary of waste handling
Waste Source Volume Handling Method
Sedimentation 99.93 lb/mil gal Lagooning and surface disposal
Granular Media Filtration 0.87 mgd Lagooning and surface disposal
Reverse Osmosis Filtration 5.78 mgd Lagooning and surface disposal, with residuals sent for deicing when appropriate

21 | P A G E
Lab 3
Equalization Basin
An equalization basin is designed to convert a variable input flow rate into a constant discharge. It
is necessary in a wastewater plant because the input that goes into a wastewater plant can come
from a multitude of sources, whose flow rates can vary both temporally and spatially. In a typical
wastewater operation, it is part of the pretreatment phase. It comes after the bar rack and the grit
chamber, and before primary settling. The objective of equalization is to minimize or control
fluctuations in wastewater characteristics in order to provide optimum conditions for subsequent
treatment processes. This system utilizes in-line equalization, as it is an effective method for
leveling out the variations in influent concentration. This is because the entire flow is blended with
the entire contents of the holding tank by the use of diffused air that is pumped into the basin,
which allows for the water to be aerated and begin the wastewater treatment process.
One purpose of an equalization basin is to reduce the mass loading of BOD through mixing and
aeration. Biochemical oxygen demand (BOD) is a parameter that measures how much oxygen
would be consumed by all the bacteria and protozoa if all of the organics were oxidized in a
wastewater sample. It is the quantity of oxygen utilized by a mixed population of microorganisms
in the aerobic oxidation of the organic matter in a sample of wastewater at a temperature of 20 ⁰C ±
1⁰C in an air incubator or water bath. The standard test for BOD is BOD5, which has an incubation
period of 5 days at 20⁰. It is an effective measure to assess the effectiveness of current water
treatment processes, as it provides an empirical measure of the level of degradable organic material
in a body of water. Furthermore, it estimates the relative oxygen consumption of wastewaters,
effluents, and other waters affected by organic pollution.
The design utilizes a trapezoidal shaped basin. This creates a constant source of head, since the input flow is at the top of the basin and the output flow is at the bottom of the basin. This is important, as it allows the basin to properly drain even when there is a power outage. In order to evaluate the impact of equalization on the mass loading of BODs, the flow rate must be converted to volume in:
𝑉𝑜𝑙𝑢𝑚𝑒 𝑖𝑛 = 𝑓𝑙𝑜𝑤 × 𝛥𝑡 ×3600𝑠
1ℎ[=]𝑚3
With the volume in values for the 24 hours, volume out can be calculated by averaging the volume in:
𝑉𝑜𝑙𝑢𝑚𝑒 𝑜𝑢𝑡 =𝛴𝑉𝑜𝑙𝑢𝑚𝑒 𝑖𝑛
24[=]𝑚3
Then the change in storage for each time period is calculated as follows:
𝐶ℎ𝑎𝑛𝑔𝑒 𝑖𝑛 𝑠𝑡𝑜𝑟𝑎𝑔𝑒, 𝛿𝑆 = 𝑉𝑜𝑙𝑢𝑚𝑒 𝑖𝑛 − 𝑉𝑜𝑙𝑢𝑚𝑒 𝑜𝑢𝑡 [=]𝑚3
The cumulative sum is the addition of the change in storage of the previous term and the change in storage of the term:
𝐶𝑢𝑚𝑢𝑙𝑎𝑡𝑖𝑣𝑒 𝑆𝑢𝑚, 𝛴𝛿𝑆 = 𝛴𝛿𝑆𝑡−1 − 𝛿𝑆𝑡[=]𝑚3

22 | P A G E
The mass of BOD and the storage average are determined with the equations below:
𝑀𝑎𝑠𝑠 𝑜𝑓 𝐵𝑂𝐷𝑠, 𝑀𝐵𝑂𝐷−𝑖𝑛 = 𝑉𝑜𝑙𝑢𝑚𝑒 𝑖𝑛 × 𝐵𝑂𝐷 ×1000𝐿
𝑚3×
1𝑔
1000𝑚𝑔×
1𝑘𝑔
1000𝑔[=]𝑘𝑔
𝑆𝑡𝑜𝑟𝑎𝑔𝑒 𝑎𝑣𝑒𝑟𝑎𝑔𝑒, 𝑆𝑎𝑣𝑔 =(𝑉𝑖)(𝑆𝑜) + (𝑉𝑠)(𝑆𝑝𝑟𝑒𝑣)
𝑉𝑖 + 𝑉𝑠
[=]𝑚𝑔
𝐿
Where,
𝑉𝑖= volume inflow during time interval 𝛥𝑡 [=]𝑚3
𝑆𝑜= average BODs concentration during 𝛥𝑡 [=]𝑔
𝑚3
𝑉𝑠= volume of wastewater in basin at the end of the previous time interval [=]𝑚3
𝑆𝑝𝑟𝑒𝑣= previous 𝑆𝑎𝑣𝑔[=]𝑔
𝑚3
𝑀𝑎𝑠𝑠 𝑜𝑓 𝐵𝑂𝐷 𝑜𝑢𝑡, 𝑀𝐵𝑂𝐷−𝑜𝑢𝑡 = 𝑆𝑎𝑣𝑔 × 𝑉𝑜𝑙𝑢𝑚𝑒 𝑜𝑢𝑡 [=]𝑘𝑔
Figure 3.1. Schematic of equalization basin

23 | P A G E
Discussion/Conclusion
The water treatment facilities in Gainesville have been touted as some of the best water treatment
facilities in Florida. These plants are well designed, and as such are ideal candidates for
comparison. Comparisons will be made with the Murphree Water Treatment Plant for the water
treatment component of our design, and the UF Water Reclamation Facility being compared to the
Wastewater component of our design.
There are several similarities and differences between the Gaineslando Water Treatment Plant and
the Murphree Water Treatment Plant. The Murphree Plant currently treats up to 26 MGD with
permits allowing it to treat up to 30 MGD, while our plant is designed to treat 28.9 MGD. The main
difference between the two plants is that the Murphree plant relies on groundwater, while the
Gaineslando plant relies on surface water. The Murphree plant relies heavily on reducing the
hardness and alkalinity that is naturally found in groundwater. Because of this, it has many
processes that are not found in the Gaineslando Plant, such as lime softening and recarbonation.
Meanwhile, since the Gaineslando plant’s main source of water is surface water, it focuses on
removing suspended matter through rapid mix, flocculation, and reverse osmosis. Since
groundwater is a relatively clean source, the Murphree plant does not have to treat specifically for
Cryptosporidium and Giardia. The Murphree plant utilizes fluorination in order to improve the
dental health of the youth of Gainesville. However, the main demographic in Gaineslando is people
over 55, so we have deemed fluorination as an unnecessary process.
The similarities between the two plants are that both plants utilize some form of solute removal,
with the Murphree plant utilizing clarification, and the Gaineslando plant utilizing flocculation and
sedimentation. Both plants practice disinfection and filtration, with the main disinfection process
being chlorination, and the filters from both plants utilizing a combination of anthracite and sand.
In regards to the wastewater plants, the UF Water reclamation facility is a well-designed plant, and
will be a suitable model for the rest of the wastewater plant that is currently being designed by
Wartortle Water Solutions. However, since the equalization basin is provided in this design, it has
been deemed necessary to compare the attributes to the plant. One comparison that can be made is
that while the UF Water Reclamation facility did not have a designated equalization basin, it did
contain a splitter box leading to the anerobic and aerobic basins, which served the purpose of
equalizing the input flow that came after the pretreatment phase.
Appendix I – Lab 1 Sample Calculations
Population Projection:
𝑃𝑡 = 𝑃𝑜𝑒𝑘∆𝑡 = 130,000 𝑝𝑒𝑜𝑝𝑙𝑒 ∗ 𝑒39.9%
10 𝑦𝑒𝑎𝑟𝑠⁄ ∗2(10 𝑦𝑒𝑎𝑟𝑠)= 289,000 𝑝𝑒𝑜𝑝𝑙𝑒
Rapid Mix:
𝐿𝑖𝑞𝑢𝑖𝑑 𝑑𝑒𝑝𝑡ℎ 𝑓𝑜𝑟 𝑑𝑢𝑎𝑙 𝑖𝑚𝑝𝑒𝑙𝑙𝑒𝑟𝑠 = 4.92 𝑓𝑡 × 1.5 = 7.38 𝑓𝑡
𝐵𝑎𝑓𝑓𝑙𝑒 𝑙𝑒𝑛𝑔𝑡ℎ = 4.92 ft × 10% = 0.492 𝑓𝑡

24 | P A G E
𝐼𝑚𝑝𝑒𝑙𝑙𝑒𝑟 𝑑𝑖𝑎𝑚𝑒𝑡𝑒𝑟 𝑓𝑜𝑟 𝑑𝑜𝑢𝑏𝑙𝑒 𝑖𝑚𝑝𝑒𝑙𝑙𝑒𝑟 = 4.92 ft × 0.5 = 2.46 𝑓𝑡
𝑉𝑜𝑙𝑢𝑚𝑒 𝑜𝑓 1 𝑏𝑎𝑠𝑖𝑛, 𝑉1 = 𝑙𝑤ℎ = 4.92 ft × 4.92 ft × (7.38 + 1) 𝑓𝑡 = 202.85 𝑓𝑡3
𝑉𝑒𝑙𝑜𝑐𝑖𝑡𝑦 𝑔𝑟𝑎𝑑𝑖𝑒𝑛𝑡, 𝐺 = √𝑃
𝜇 ∙ 𝑉1
𝑃𝑜𝑤𝑒𝑟 𝑟𝑒𝑞𝑢𝑖𝑟𝑒𝑑, 𝑃 = 𝐺2𝜇𝑉1 = 7002 𝑠−2 × 0.022 𝑙𝑏𝑓 ∙ 𝑠
𝑓𝑡2× 202.85 𝑓𝑡3 = 2186723
𝑓𝑡 ∙ 𝑙𝑏𝑓
𝑠
= 2.18 × 10⁶ 𝑓𝑡 ∙ 𝑙𝑏𝑓
𝑠
𝐹𝑙𝑜𝑤 𝑟𝑎𝑡𝑒 𝑜𝑓 1 𝑏𝑎𝑠𝑖𝑛, 𝑄1 =𝑉1
𝑡=
202.85 𝑓𝑡3
30 𝑠= 6.76
𝑓𝑡3
𝑠
𝑄 =28.9 × 10⁶𝑔𝑎𝑙
1 𝑑𝑎𝑦×
1 𝑑𝑎𝑦
24 ℎ𝑟×
1 ℎ𝑟
60 𝑚𝑖𝑛×
1 𝑚𝑖𝑛
60 𝑠×
0.134 𝑓𝑡3
1 𝑔𝑎𝑙= 44.82
𝑓𝑡3
𝑠
𝑁𝑢𝑚𝑏𝑒𝑟 𝑜𝑓 𝑡𝑎𝑛𝑘𝑠 =𝑄
𝑄1
=44.82
6.76= 6.63 ≈ 7 𝑡𝑎𝑛𝑘𝑠
𝐵𝑎𝑓𝑓𝑙𝑒 𝑣𝑜𝑙𝑢𝑚𝑒 = ℎ × 𝑏𝑎𝑓𝑓𝑙𝑒 𝑙𝑒𝑛𝑔𝑡ℎ × 𝑤 = 8.38 × 0.492 × 4.92 𝑓𝑡3 = 20.28 𝑓𝑡3
Flocculation:
Equation 1:
∀= 𝑡𝑄 = 36𝑚𝑖𝑛 ∗ 28.9𝑀𝑔𝑑 = 96,815 ft2
Equation 2: 𝑊 =
∀
𝐿ℎ=
96,815 ft2
36𝑓𝑡 ∗ 12 𝑓𝑡= 225 𝑓𝑡
Equation 3: 𝐿 = 𝑡𝑉ℎ = 36𝑚𝑖𝑛 ∗ 1
𝑓𝑡𝑠⁄ = 36 𝑓𝑡
Equation 4:
𝑊𝑝𝑎𝑑𝑑𝑙𝑒 =𝐿𝑝𝑎𝑑𝑑𝑙𝑒
20=
9.93𝑓𝑡
20= 0.5 𝑓𝑡
Equation 5: 𝑃 = 𝐺2∀𝜇 = 60 1
𝑠⁄ ∗ 6,454.3𝑓𝑡2 ∗ 0.8701𝐸 − 3𝑃𝑎 ∗ 𝑠 = 0.767ℎ𝑝
Equation 6:
𝑉𝑝 =
√2𝑃
𝐶𝐷 ∗ 𝐴𝑝 ∗ 𝜌
3
0.5=
√2 ∗ 421.85
𝑓𝑡 ∗ 𝑙𝑏𝑠⁄
1.8 ∗ 9.93 ∗ 0.5 ∗ 1.936𝑠𝑙𝑢𝑔𝑠
𝑓𝑡3⁄
3
0.5= 2.90
𝑓𝑡𝑠⁄
Sedimentation:
Equation 1:

25 | P A G E
𝑡 =𝑉( 24)
𝑄𝑥 #𝑏𝑎𝑠𝑖𝑛𝑠
→ 𝑥 =4 ℎ𝑟(28.9 ∗ 106𝑔𝑎𝑙)
19200𝑓𝑡3(𝑑𝑎𝑦)
1𝑑𝑎𝑦
24ℎ𝑟
.133681𝑓𝑡3
1 𝑔𝑎𝑙 = 33.54 = 34 𝑏𝑎𝑠𝑖𝑛𝑠
Equation 2:
𝑣 =𝑄
𝐴=
28.9 ∗ 106 𝑔𝑎𝑙
160𝑓𝑡2 (𝑑𝑎𝑦)
.133681 𝑓𝑡3
1 𝑔𝑎𝑙
1 𝑑𝑎𝑦
1440 𝑚𝑖𝑛
1
34 𝑏𝑎𝑠𝑖𝑛𝑠= .49318
𝑓𝑡
𝑚𝑖𝑛
Equation 3:
𝑣 =𝑄
𝐴=
28.9 ∗ 106 𝑔𝑎𝑙
2400 𝑓𝑡2 (𝑑𝑎𝑦)
1
34 𝑏𝑎𝑠𝑖𝑛𝑠= 354.167
𝑔𝑎𝑙
𝑓𝑡2 (𝑑𝑎𝑦)
Equation 4:
𝑇𝑜𝑡𝑎𝑙 𝑊𝑒𝑖𝑟 𝐿𝑒𝑛𝑔𝑡ℎ =𝑄
𝑊𝑒𝑖𝑟 𝐿𝑜𝑎𝑑𝑖𝑛𝑔=
28.9 ∗ 106 𝑔𝑎𝑙
20,000 𝑔𝑎𝑙
𝑑𝑎𝑦 ∗ 𝑓𝑡∗ 𝑑𝑎𝑦
1
34 𝑏𝑎𝑠𝑖𝑛𝑠= 42.5 𝑓𝑡
Equation 5:
𝐹𝑖𝑛𝑔𝑒𝑟 𝑊𝑒𝑖𝑟 𝐿𝑒𝑛𝑔𝑡ℎ =𝑇𝑜𝑡𝑎𝑙 𝑊𝑒𝑖𝑟 𝐿𝑒𝑛𝑔𝑡ℎ − 𝑊𝑖𝑑𝑡ℎ
𝑁𝑢𝑚𝑏𝑒𝑟 𝑜𝑓 𝐹𝑖𝑛𝑔𝑒𝑟𝑠=
42.5 𝑓𝑡 − 20
2= 11.25 𝑓𝑡
Appendix II – Lab 2 Sample Calculations
Granular Media Filtration:
Equation 1:
28.9 MGD ×1 day
24 hr×
1 hr
60 min= 20,069.44 gpm
Equation 2:
20069.4 gpm ÷ 5.97gpm
ft2= 3364ft2 total surface area
Reverse Osmosis (RO) Membrane Filtration:
Equation 1:
20,069.44 total gpm ÷ 960 gpm per RO unit = 21 RO units

26 | P A G E
Disinfection:
Equation 1:
θ = 30 min
28.9 × 10⁶gal
day×
1 day
1440 min× 30 min = 602,083
gal
30 min
602,083 gal
30 min×
0.133681 ft3
1 gal= 80487.0575
ft3
30 min
Equation 2:
10 ft (width) × 100 ft (length) × 10 ft (depth) = 10,000 ft3
80487.0575 ft3
30 min10,000 ft3
= 8.0487 tanks
Equation 3:
17 × 7 ft × 0.5 ft × 10 ft = 595 ft3
Equation 4:
10,000 ft3 − 595 ft3 = 9405 ft3
80487.057 ft3
9405 ft3= 8.5579 tanks ≅ 9 tanks total
Water Treatment Residuals/Waste Handling:
Equation 1:
𝑇𝑜𝑡𝑎𝑙 𝑠𝑙𝑢𝑑𝑔𝑒 𝑠𝑜𝑙𝑖𝑑𝑠 (𝑙𝑏
𝑚𝑖𝑙 𝑔𝑎𝑙) = 8.34(0.44 × 𝑎𝑙𝑢𝑚 𝑑𝑜𝑠𝑎𝑔𝑒 + 0.74 × 𝑡𝑢𝑟𝑏𝑖𝑑𝑖𝑡𝑦)
8.34 (0.44 × 20𝑚𝑔
𝐿+ 0.74 × 4.3 𝑁𝑇𝑈) = 99.93
𝑙𝑏
𝑚𝑖𝑙 𝑔𝑎𝑙
Equation 2:
15𝑔𝑎𝑙
𝑓𝑡2𝑚𝑖𝑛(3364𝑓𝑡2) = 50,460
𝑔𝑎𝑙
𝑚𝑖𝑛
Equation 3:
12 𝑚𝑖𝑛 (50,460𝑔𝑎𝑙
𝑚𝑖𝑛) = 605,520𝑔𝑎𝑙
605,520𝑔𝑎𝑙
28.9 × 106gal× 100% = 2.1% 𝑜𝑓 𝑑𝑎𝑖𝑙𝑦 𝑓𝑙𝑜𝑤

27 | P A G E
Appendix III – Lab 3 Tables and Calculations Time
(h) Flow
(m^3/s) Volume in
(m^3) Volume out
(m^3) Change in storage (in-
out)
0 0.0481 173.16 203.66 -30.50
100 0.0359 129.24 203.66 -74.42
200 0.0226 81.36 203.66 -122.30
300 0.0187 67.32 203.66 -136.34
400 0.0187 67.32 203.66 -136.34
500 0.0198 71.28 203.66 -132.38
600 0.0226 81.36 203.66 -122.30
700 0.0359 129.24 203.66 -74.42
800 0.0509 183.24 203.66 -20.42
900 0.0631 227.16 203.66 23.51
1000 0.067 241.2 203.66 37.55
1100 0.0682 245.52 203.66 41.87
1200 0.0718 258.48 203.66 54.83
1300 0.0744 267.84 203.66 64.19
1400 0.075 270 203.66 66.35
1500 0.0781 281.16 203.66 77.51
1600 0.0806 290.16 203.66 86.51
1700 0.0843 303.48 203.66 99.83
1800 0.0854 307.44 203.66 103.79
1900 0.0806 290.16 203.66 86.51
2000 0.0781 281.16 203.66 77.51
2100 0.067 241.2 203.66 37.55
2200 0.0583 209.88 203.66 6.23
2300 0.0526 189.36 203.66 -14.30
Cumulative Sum
BOD (mg/L)
Mass of BOD in (kg)
Storage average (mg/L)
Mass loading (kg)
-30.50 110.00 19.05 120.45 24.53
-104.91 81.00 10.47 97.61 19.88
-227.21 53.00 4.31 70.18 14.29
-363.54 35.00 2.36 44.85 9.13
-499.88 32.00 2.15 33.50 6.82
-632.25 40.00 2.85 36.11 7.35
-754.55 66.00 5.37 53.86 10.97
-828.96 92.00 11.89 81.96 16.69
-849.38 125.00 22.91 111.35 22.68
-825.87 140.00 31.80 133.30 27.15
-788.33 150.00 36.18 145.15 29.56

28 | P A G E
-746.46 155.00 38.06 152.52 31.06
-691.64 160.00 41.36 157.56 32.09
-627.45 150.00 40.18 154.91 31.55
-561.11 140.00 37.80 144.98 29.53
-483.60 135.00 37.96 137.45 27.99
-397.10 130.00 37.72 132.46 26.98
-297.27 120.00 36.42 124.89 25.43
-193.48 125.00 38.43 122.52 24.95
-106.98 150.00 43.52 137.14 27.93
-29.47 200.00 56.23 174.61 35.56
8.07 215.00 51.86 206.93 42.14
14.30 170.00 35.68 194.06 39.52
0.00 130.00 24.62 151.03 30.76
Total Input (m3): 4887.72
Total Output (m3/h): 203.655
Volume of Basin: = |smallest difference| + largest positive difference
= |-136.335|+103.785
= 240.12 *1.25 (it is multiplied by 1.25 to handle excess capacity)
= 300.15 𝑚3
Figure 3.2 Graph comparing equalized and un-equalized flow
0
10
20
30
40
50
60
0 1000 2000 3000
BO
D L
oa
din
g
Hour of Day
Equalized and Unequalized Flow
Unequalized
Equalized
29 | P A G E
References
Alturkmani, Abdulrzzak. "Environmental Engineering - Equalization." Environmental Engineering.
Dr. Eng Abdulrzzak Alturkmani, 2010. Web. 17 Apr. 2016.
"Biochemical Oxygen Demand." Sustainable Development Knowledge Platform. United Nations,
2015. Web.
"Liquid Wastewater Processing." Chalfont New Britain Twp Sewage Authority. Chalfont New Britain
Twp Sewage Authority, 2013. Web.
“Demographics.” Sanford, Florida, the Friendly City. City of Sanford, 2010. Web. 14 Feb 2016.
Droste, Ronald L. Theory and Practice of Water and Wastewater Treatment. New York: J. Wiley, 1997. Print.
Hammer, Mark J., and Mark J. Hammer, Jr. Water and Wastewater Technology. Englewood Cliffs,
NJ: Prentice Hall, 2008. Print.
Lowe, Edgar F. et al. “St. Johns River Water Supply Impact Study.” St. Johns River Water
Management District. St. Johns River Water Management District, 2012. Pdf. 14 Feb. 2016.