sri lanka new...introduction‐sri lanka economy at a glance 2013 2014 2015 2016 gdp at market...
TRANSCRIPT

V.D. Nirusha AyoniSocio Economics and Planning Centre
Department of AgriculturePeradeniyaSri Lanka
Export Promotion and Market Access for Agriculture and Food Products in Major Global Markets
Country Report Sri Lanka

Outline
• Introduction • Overview and trend of agri‐food‐product exports • Success stories/ innovative applications on agri‐food‐product exports • Policy and programmatic responses for agri‐food‐product export
promotion • Current rules, procedures and requirements including sanitary and
phyto‐sanitory (SPS) for exporting agri‐food‐products to selected international markets
• Key issues, constraints and challenges including Technical Barriers to Trade (TBT) gaps in knowledge and capacity development needs in relation to agri‐food‐products export

Introduction‐Sri Lanka Economy at a Glance2013 2014 2015 2016
GDP at Market Prices (Rs.Bn.) 6,414 9,785 11,183 11,839
GDP at Market Prices (US$ Bn.) 56.7 74.9 82.3 81.3
Per Capita GDP at Market Prices (Rs.) 310,214 473,261 533,398 558,363
Per Capita GDP at Market Prices (US$) 2,744 3,625 3,925 3,835
GDP (Growth %) 8.0(a) 7.4 4.8 4.4
2013 2014 2015 2016
GDP share (%)
Agriculture 8.5 9.9 9.9 7.1
Industry 26.6 33.8 26.2 26.8
Services 54.6 56.3 56.6 56.6
Taxes 10.2 ‐ 9.3 9.6
Sectoral Growth (%)
Agriculture 7.0(a) 0.3 5.5 ‐4.2
Industry 8.4(a) 11.4 3 6.7
Services 8.0(a) 6.5 5.3 4.2

Introduction Contd…
Industrial exports77%
Tea13%
Rubber0.32%
Spices3%
Sea food2%Coconut
2%
Other3%
Other23%Agricultural
exports 23%
Source: Central Bank, Sri Lanka
Composition of Exports ‐ 2016

Introduction Contd…..
Source: Central Bank, Sri Lanka

Overview of agri‐food‐product exports in Sri LankaRaw materials/ traditional or fresh form
TeaVegetablesFruitsCerealsRiceCoconutsSpicesNatural sweetenersBee honeyMilk
Value added
Value added teaProcessed vegetables & fruits and juices, concentratesProcessed gherkinsSpice based productsRice based productsPreparations of cereals & flourConfectionery & bakery productsSemi cooked/Pre cooked/frozen productsReady to serve foodsAlcoholic and Non alcoholic beveragesDairy productsAnimal feed
Organic products
TeaVegetablesFruitsSpice based productsCoconut based products

Value added productsCa
nned
/bottle
d prod
ucts
• Juices‐Pineapple, passion fruit papaya juices etc
• Juices in light syrup, sliced fruits, pieces, chunks & mixed fruits packed in glass jars/tins
Processed food
s
• Dehydrated fruits & veg
• Processed gherkins & cucumber
• Herbal tea, tomato ketchup
• Prepared foods
• Trends‐organic, gluten free, halal, vegetarian, vegan, health & functional foods
Confectio
nery and
bakery prod
ucts
• Pre cooked bakery products‐frozen dough
• Crackers, sweet/cream/savory biscuits

Value added productsRice & cerea
ls
• Rice flour• Maize starch• Kurakkan flour• Black gram flour
Frozen
vegetab
les
• Okra, drumstick, manioc
• Immature jack fruits
• Manioc in Individual Quick Frozen (IQF) form
Anim
al fe
ed
• Residues of milling industry
• Broken rice, Wheat bran
• Maize• soybean
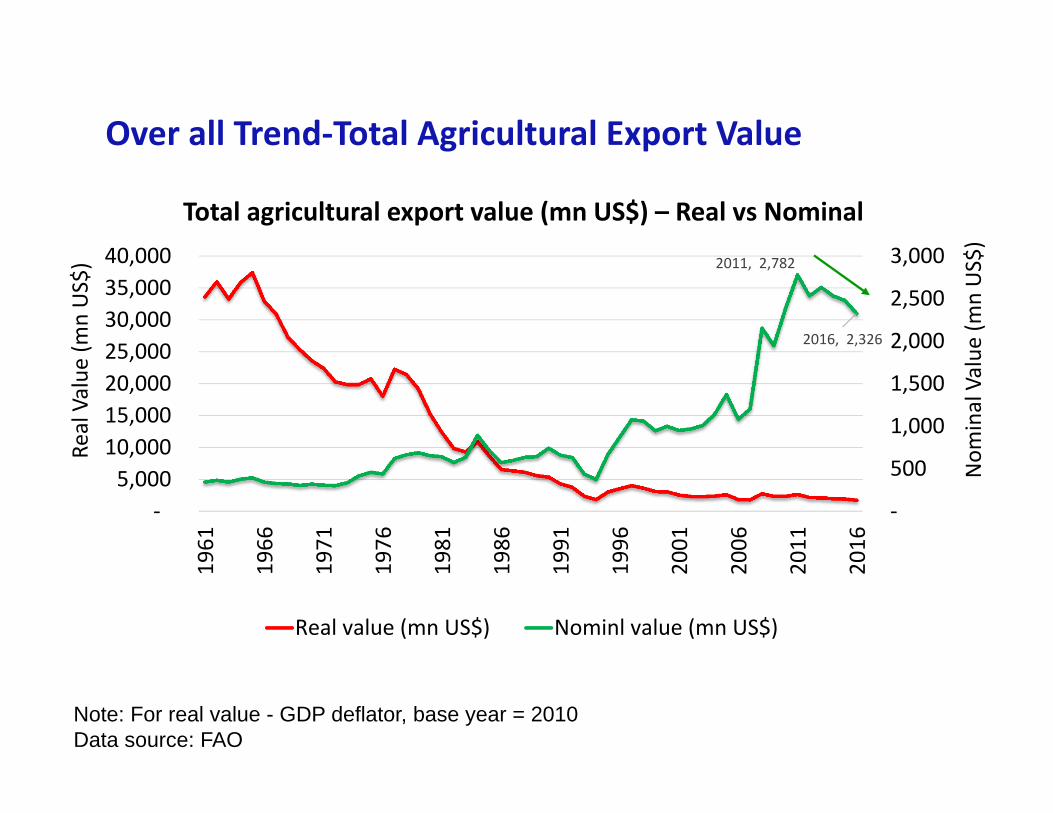
Over all Trend‐Total Agricultural Export Value
2011, 2,782
2016, 2,326
‐
500
1,000
1,500
2,000
2,500
3,000
‐ 5,000
10,000 15,000 20,000 25,000 30,000 35,000 40,000
1961
1966
1971
1976
1981
1986
1991
1996
2001
2006
2011
2016
Nom
inal Value
(mnUS$)
Real Value
(mnUS$)
Total agricultural export value (mn US$) – Real vs Nominal
Real value (mn US$) Nominl value (mn US$)
Note: For real value - GDP deflator, base year = 2010 Data source: FAO

Over all Trend‐Total Agricultural Import Value
‐
500
1,000
1,500
2,000
2,500
3,000
‐
5,000
10,000
15,000
20,000
25,000
1961
1964
1967
1970
1973
1976
1979
1982
1985
1988
1991
1994
1997
2000
2003
2006
2009
2012
Nom
inal Value
(mnUS$)
Real Value
(mnUS$)
Total agricultural export value (mn US$) – Real vs Nominal
Real value (mn US$) Nominl value (mn US$)
Note: For real value - GDP deflator, base year = 2010 Data source: FAO

Over all Trend‐Net Agricultural Export Value
y = ‐390.9x + 16370
y = 1.0796x + 186.95
(600) (400) (200) ‐ 200 400 600 800
(10,000)
‐
10,000
20,000
30,000
1961
1964
1967
1970
1973
1976
1979
1982
1985
1988
1991
1994
1997
2000
2003
2006
2009
2012
Nom
inal Value
(mnUS$)
Real Value
(mnUS$)
Total agricultural export value (mn US$) – Real vs Nominal
NET Exports ‐ Real Value (mn US$) NET Exports ‐ Nomial Values(mn US$)Linear (NET Exports ‐ Real Value (mn US$)) Linear (NET Exports ‐ Nomial Values(mn US$))
Note: For real value - GDP deflator, base year = 2010 Data source: FAO

Main markets for Sri Lankan exports‐Agri‐food sector
11896
7588
United
States
United
Kind
om
German
y
Austrlia
MaldivesVa
lue (‘0
00 US$
)
Processed vegetables, fruits & juices ‐export value (‘000 US$)
42743
26300
UAE
Hong
Kong
Ireland
Saud
iArab
ia
MaldivesVa
lue (‘0
00 US$
)
Processed food–export value (‘000 US$)
Total value 190,223
Total value 24,994
6536
4003
Thailand
Sing
apore
Indo
nesia
Malaysia
Hong
Kong
Value (‘0
00 US$
)
Rice & cereals –export value (‘000 US$)
Total value 30,694
5870
3805
Gha
na
Maldives
UE
India
UKVa
lue (‘0
00 US$
)
Confectionery & bakery products –export value (‘000 US$)
Total value 25,478
Source: Data - Courtesy of EDB, Original source-Sri Lanka Customs

Trends of agri‐food‐product exports in Sri Lanka
05
1015202530354045
2000
2001
2002
2003
2004
2005
2006
2007
2008
2009
2010
2011
2012
2013
2014
2015
2016
Qua
ntity
(mt)
Vegetables and fruits (fresh/dry) export volume (mt)
Vegetables Fruits (fresh/dry)
Source: Central Bank of Sri Lanka, Annual Reports

Trends
0
1000
2000
3000
4000
5000
600020
00
2001
2002
2003
2004
2005
2006
2007
2008
2009
2010
2011
2012
2013
2014
2015
2016
Value (Rsm
n)
Vegetables export value (Rs mn) – Real vs Nominal
Real values Nominal values
Note: For real value - GDP deflator, base year = 2010 Source: Central Bank of Sri Lanka, Annual Reports

Trends
0
1000
2000
3000
4000
5000
6000
700020
00
2001
2002
2003
2004
2005
2006
2007
2008
2009
2010
2011
2012
2013
2014
2015
2016
Value (Rs. m
n)
Fruit export values (Rs mn) – Real vs Nominal
Real values Nominal values
Note: For real value - GDP deflator, base year = 2010 Source: Central Bank of Sri Lanka, Annual Reports

Trends
260270280290300310320330340
2000
2001
2002
2003
2004
2005
2006
2007
2008
2009
2010
2011
2012
2013
2014
2015
2016
Qua
ntity
(mnkg)
Tea export volume (kg mn)
Quantity (mn kg)
Note: GDP deflator base year 2010 used for real value calculationData source: Central Bank of Sri Lanka, Annual Reports

Trends
y = ‐466.51x + 164306
0
50000
100000
150000
200000
250000
2000
2001
2002
2003
2004
2005
2006
2007
2008
2009
2010
2011
2012
2013
2014
2015
2016
Price (Rs. m
n)
Tea export values (Rs mn) – Real vs Nominal
Real values Nominal values Linear (Real values )
Note: For real value - GDP deflator, base year = 2010 Source: Central Bank of Sri Lanka, Annual Reports

Trends
0100200300400500600700800900
2000
2001
2002
2003
2004
2005
2006
2007
2008
2009
2010
2011
2012
2013
2014
2015
2016
Qua
ntity
(mnnu
ts)
Coconut export volume (kg mn)
Quantity (mn nuts)

Trends
y = 505.89x + 8266.4
0
5000
10000
15000
20000
25000
30000
35000
2000
2001
2002
2003
2004
2005
2006
2007
2008
2009
2010
2011
2012
2013
2014
2015
2016
Value (Rs. m
n)
Coconut export values (Rs mn) – Real vs Nominal
Real values Nominal values Linear (Real values )
Note: For real value - GDP deflator, base year = 2010 Data source: Central Bank of Sri Lanka, Annual Reports

Trends
y = 356.53x + 2639.8
0
2000
4000
6000
8000
10000
12000
2005
2006
2007
2008
2009
2010
2011
2012
2013
2014
Value (Rs. m
n)
Preparation of vegetables, fruits, nuts or other parts of plants values (Rs mn) – Real vs Nominal
Real values Nominal valuesLinear (Real values ) Linear (Real values )
Note: For real value - GDP deflator, base year = 2010 Data source: Central Bank of Sri Lanka, Annual Reports

Success stories
TJC mango
Fresh
Dried mango
Mango Nectar
Ellawala Horticulture Pvt. Ltd., Rajarata Farm, Dambewatana, Galkiriyagama, Sri Lanka
‐ Ellawala Horticulture (PVT) Ltd is a subsidiaryof Ellawala Exports (Pvt)Ltd ‐
‐ 60 Hectares Farm in Mahaweli "H" area. Thecompany developed new variety of mangowhich is known as TJC mango.
‐ Global G.A.P certification received in 2011

TJC Mango
6-7 FRUIT PER CARTON NET WT – 4 kg500 kilogram (Min. Order)Supply Ability: 10 Tons per Week

TJC Mango
Organic Dried TJC Mango100 Kilograms (Min. Order)Style: DriedTaste: SweetPackaging: BulkCultivation Type: Open Air, OrganicShelf Life: 1 yearCertification: EU Organic
TJC mango nectar
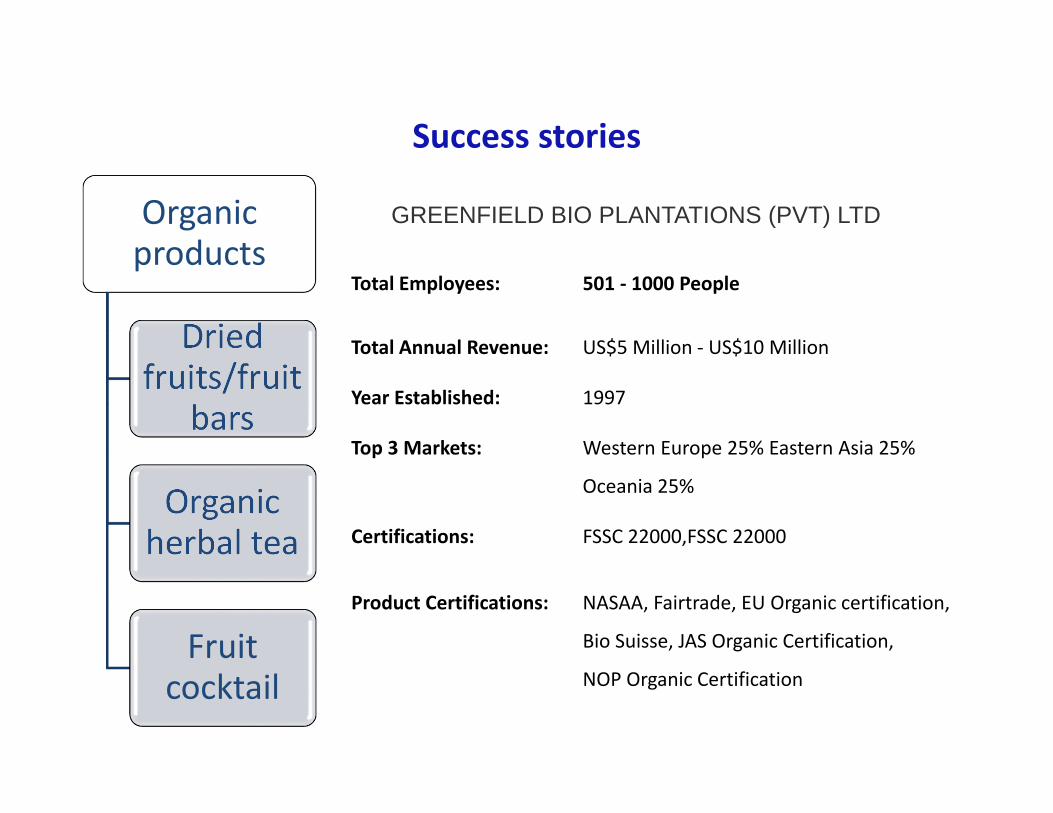
Success stories
Organic products
Dried fruits/fruit
bars
Organic herbal tea
Fruit cocktail
GREENFIELD BIO PLANTATIONS (PVT) LTD
Total Employees: 501 ‐ 1000 People
Total Annual Revenue: US$5 Million ‐ US$10 Million
Year Established: 1997
Top 3 Markets: Western Europe 25% Eastern Asia 25%
Oceania 25%
Certifications: FSSC 22000,FSSC 22000
Product Certifications: NASAA, Fairtrade, EU Organic certification,
Bio Suisse, JAS Organic Certification,
NOP Organic Certification

Organic products

Success stories
Organic products
Organic Ceylon TeaFruit
powder/ Fruit bars
Coconut products
Spices and herbs
E-SILK ROUTE VENTURES (PVT) LTD.
Business Type: Manufacturer, Trading Company, Distributor/Wholesaler
Location: Rajagiriya, Sri LankaMain Products: Spices,Herbs,Coconut Products,Tea,Fruits &
VegetablesTotal Employees: 11 ‐ 50 PeopleTotal Annual Revenue: US$1 Million ‐ US$2.5 Million
Year Established: 2014Top 3 Markets: North America 33.94% Oceania 25.33%
Western Europe 15.37%
Product Certifications: Organic Certification

Organic Products
Organic Avocado PowderFOB Reference Price: US $9-16 / Kilogram | 10Supply Ability: 50 mt per Year

Innovative applications – Dehydrated fruits using Microwave assisted vacuum drying
• First time in Sri Lanka• Funded by the SAARC Development Fund(SDF)
• 5 machines has been installed in ProcessingCentres constructed at 5 locations
• Machine cost 4.9 Rs.mn• Ownership : Farmer Organizations (FOs) atMullaitivu/Dambulla/Matale/Peradeniya/Gampaha
• Quality: Better colour and texture (soft)
Machine installed at Food Research institute, Department of Agriculture, Gannoruwa

Policy and programmatic responses for agri‐food‐product export promotion
• Government major initiatives1. National Export Strategy – Vision: “An export HUB driven by innovation &
investment” – The strategy is driven by EDB with technical support of International
Trade Centre (ITC)– Focused on emerging areas– Identified trade support functions‐ Trade info and promotions,
innovation & R & D, logistics, infrastructure2. Broader trade policy reforms3. Adoption of new National Trade Policy
‐ Competitiveness through domestic policy reforms‐ Market access & trade facilitation‐ Macro economic balance, policy & institutional coherence‐ Trade adjustment for firms & people

Policy and programmatic responses Contd….
4. Ratification of the WTO Trade Facilitation Agreement‐ A National Trade Facilitation Committee has begun initiating an
identified set of reforms for Sri Lanka 5. Establishing new Export Processing Zones with private sector engagement
• BOI offers incentives for investors• R & D by government institutes
– Global trend – healthy food consumption– DoA has focused on organic products
• GAP • Use of biological control measures / IPM• Pesticide residual monitoring program

Good Agriculture Practices (GAP)
Strategies• Assistance to convert conventional farms into GAP farms
• Provide District mini laboratories, rapid test kits to diagnose MRLs
• Strengthening of SL‐GAP Certification Division
• Promote export of GAP certified products

GAP farms and certificate issue

33
Good Agriculture Practice
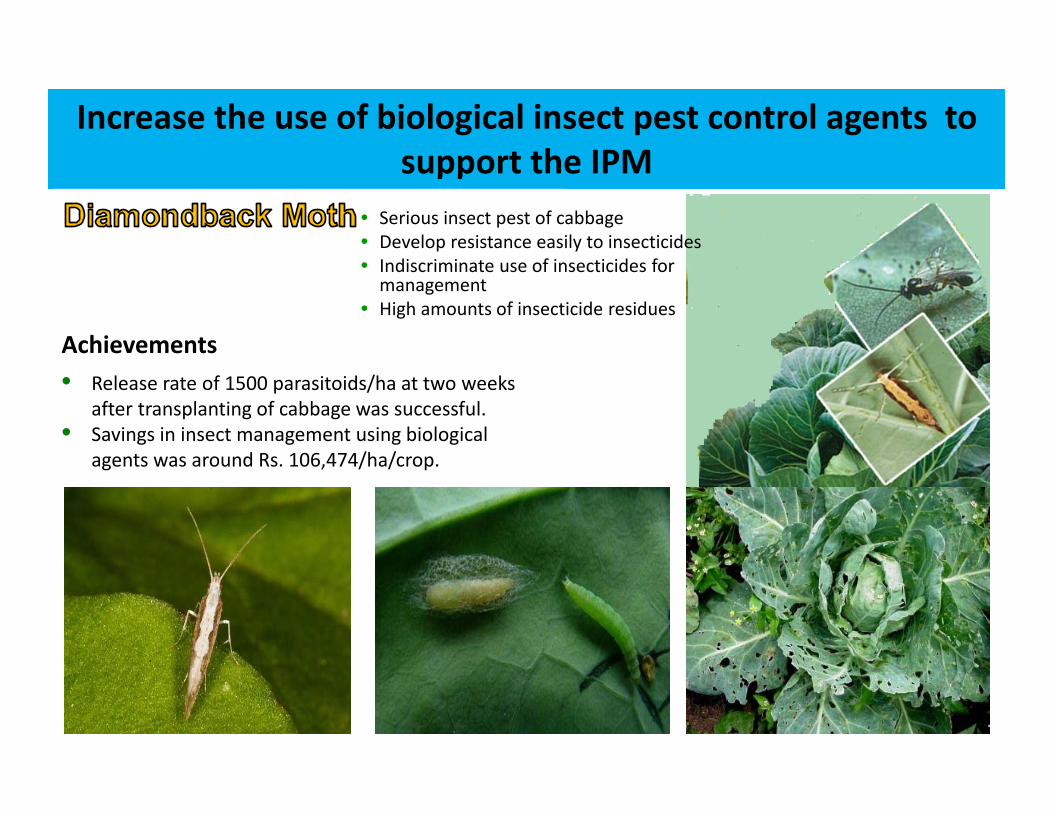
Increase the use of biological insect pest control agents to support the IPM
Achievements
• Serious insect pest of cabbage• Develop resistance easily to insecticides• Indiscriminate use of insecticides for management
• High amounts of insecticide residues
• Release rate of 1500 parasitoids/ha at two weeks after transplanting of cabbage was successful.
• Savings in insect management using biological agents was around Rs. 106,474/ha/crop.

Pesticide residue monitoring & regulating
• Pesticide residual checking ‐ compatible for EU MRL on pesticide residues
• Maintenance of ISO/IEC 17025 for pesticide residue analysis

EU warning

Current rules, procedures and requirements exporting agri‐food‐products to selected international markets
• European Union (EU)• India• Gulf Cooperation Council (GCC)• United States of America (USA)• Canada
Major Export Markets for Sri Lankan Food Products

Agri‐Food Exports to EUfrom Sri Lanka‐2016
48
32
10
73 21
Value (US$ mn)Processed Food Edible FishProcessed Vegetables, Fruits & Juices Fruit & VegetableConfectionary & Bakery Products Rice & CerealsBeverages Animal FeedCourtesy of EDB
Meeting EU Requirements
General Food Safety Measures• GAP, GMP, HACCPSpecific Food Hygienic Requirements• Contaminants – Heavy metals (Cd, Hg, Sn) and
foreign matter• Maximum Residual Levels (MRLs)• Use of Food Additives, enzymes & flavourings• Food irradiation• Radioactivity• Novel Foods – Authorization of use of novel
food• Food allergens & Food ingredientsLabellingTraceability
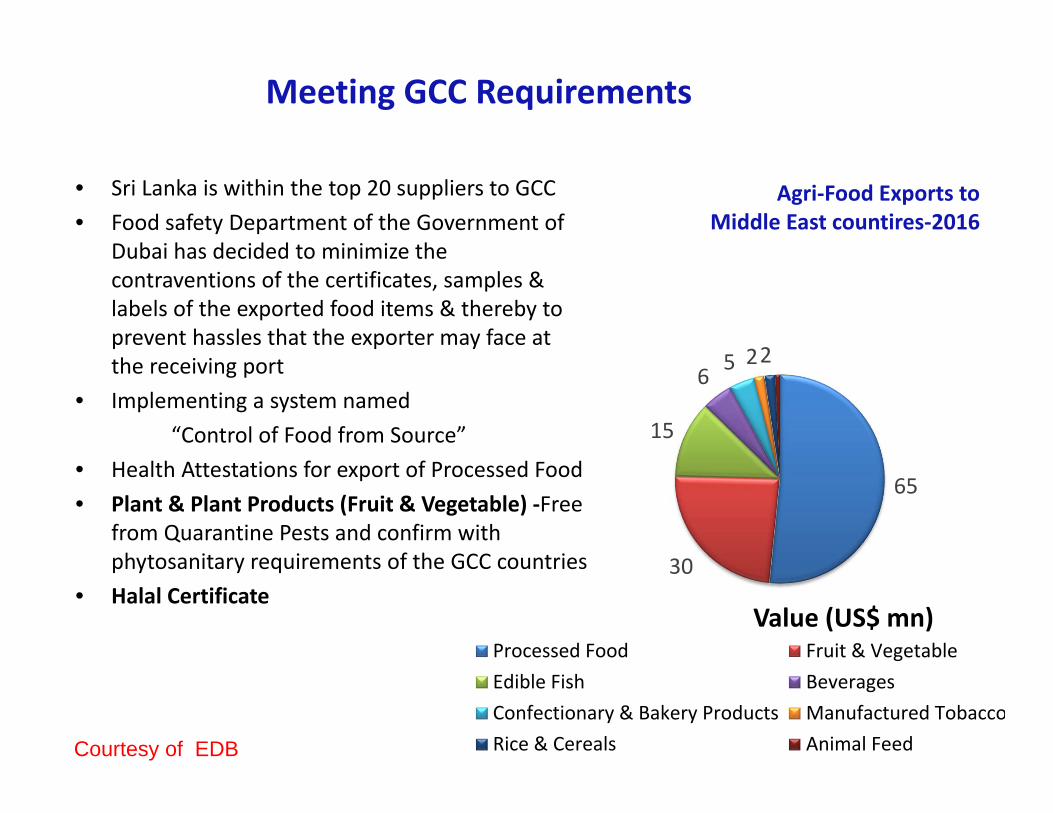
Agri‐Food Exports to Middle East countires‐2016
65
30
15
6 5 22
Value (US$ mn)Processed Food Fruit & VegetableEdible Fish BeveragesConfectionary & Bakery Products Manufactured TobaccoRice & Cereals Animal FeedCourtesy of EDB
Meeting GCC Requirements
• Sri Lanka is within the top 20 suppliers to GCC • Food safety Department of the Government of
Dubai has decided to minimize the contraventions of the certificates, samples & labels of the exported food items & thereby to prevent hassles that the exporter may face at the receiving port
• Implementing a system named “Control of Food from Source”
• Health Attestations for export of Processed Food• Plant & Plant Products (Fruit & Vegetable) ‐Free
from Quarantine Pests and confirm with phytosanitary requirements of the GCC countries
• Halal Certificate

Sanitary and phyto‐sanitory (SPS) measures• Food Act No. 26 of 1980 and their subsequent amendments in 2009 and
2011 govern the SPS regulation in Sri Lanka.
• Sri Lanka as a member of Codex Alimentarius Commission, the WorldOrganization for Animal Health (OIE) and International Plant ProtectionConvention (IPPC) follows their continuous guidelines to assure foodsafety and address related issues.
• Sri Lanka has notified 50 trade related technical regulations and 39 SPSnotifications to the WTO as of July 2016.
• Ministry of Health is the National Focal Point for all SPS related matters
• Sri Lanka Standards Institution (SLSI) ‐ The National Focal Point for theformulation of National Standards giving due consideration to equivalentstandards established by other countries & international organizations.
Source: Trade policy review by Sri Lanka for WTO

Sanitary and phyto‐sanitory (SPS) measuresTea • Phytosanitary and health
certificates• ISO standards for black/green teas (Ex: ISO3720 basic standard for black tea.
• Minimum residue levels for pesticides‐EU & Japan their own limits
• Heavy metals• Microbiological requirements
• At the point of imports‐unrealistic limits on moisture
• Factories‐ HACCP, ISO22000, GMP
• Fumigation• Labelling‐Traceability
Coconu
t • Microbiological and physic‐chemical testing for both kernel and non‐kernel products
• Virgin Coconut Oil ‐ISO 22000 certificate
• Desiccated Coconut ‐Quality certificate ‐SLSI standards.
• Physical Quality Certificate and SulphurDioxide Certificate
• Product standards‐ levels of aflatoxin, limits on Polycyclic aromatic hydrocarbons (PAHs)
• EU: virgin coconut oil and desiccated coconut‐ inner plastic liner
Spices
• Cinnamon and pepper for consumption –SLSI standards
• Factory‐HACCP standards
• fumigation requirements ‐Lack of harmonization in the fumigation requirements across countries

Sanitary and phyto‐sanitory (SPS) measuresFruits and
vegetab
les • Quality certificate ‐SLSI
standards.• ISO, HACCP, and EU Standards
• PhytosanitoryCertificate (PSC)
Organ
ic produ
cts • Global GAP certification• Quality certificate ‐SLSI standards
• Organic standards required by importing countries
• ISO, HACCP, and EU Standards
• Traceability

Phyto‐sanitory (SPS) measures• Exporting plant & plant products at the entry point of
Seaport and Cargo ExportsNecessary Documents:
o Application for a phytosanitary certificateo Packing List/Commodity List with correct botanical nameso Treatment certificates if needed ex: Fumigation reports, chemical treatment
reports etc.o No Objection letters from relevant Institutes ex: Forest permits etc.o Test Reports issued by National Plant Quarantine Service ex: Additional
Declarationso Other relevant documents ex: GAP certification for EU countries

Key issues, constraints and challenges including Technical Barriers to Trade (TBT) gaps in knowledge and capacity
development needs for agri‐food‐products export
• Issue: Most of the services carries out in fragmented manner bydifferent institutions coming under the purview of differentministries.
• Remedial Measure :Coordination of all the work related to SPS andTBT by one national level institution
• Issue: Sri Lanka 's export basket is concentrated on a few productsand a few markets due to lack of innovations
• Remedial Measure : Need more diversification• Issue : Low e‐commerce sales due to underdeveloped e‐platforms,
insufficient band‐with, and lack of compliance/security• Remedial measure : Promoting Digital payment companies

Key issues and remedial measures contd.
• Issue: Significant gaps in the existing laws and procedures for testing, inspection, and monitoring of standards and regulations
• Remedial Measure : Review the current system of standards and regulations and introduce appropriate measures for the gaps and issues related to enforcement
• Issue: Numerous non‐tariff barriers (NTBs) in foreign countries and therefore, Sri Lanka has not been able to benefit fully from FTAs
‐ lengthy inspection and testing procedures, delays in releasing goods, warehouse
• Remedial Measure: Mutual Recognition Agreements (MRAs)

Key issues and remedial measures contd.
• Issue: Lack of export‐oriented Foreign Direct Investment.‐ Foreign investment augments domestic capital for all uses,including for exports & trade infrastructure, transfers,management know‐how and technology, new products forexports, increases productivity, and enhances capacity topenetrate markets abroad
• Remedial Measures : Liberal and transparent import regime forimported inputs, feasible process for approval of investments,establishment of special export‐processing/investment zones,negotiation of bilateral agreements and freedom to invest across awide array of sectors

Key issues and remedial measures contd.
• Issue: Performance in trade agreements are not optimalAgreements in force
‐ISFTA – Indo‐Sri Lanka Free Trade Agreement‐ PSFTA – the Pakistan‐Sri Lanka Free Trade‐ SAFTA‐ APTA‐ Asia Pacific Trade Agreement
• Remedial Measures:Relax Non‐tariff barriers, address logistical and infrastructureconstraints, removal of stringent rules of origin, Measures toovercome lack of supply capacity of Sri Lankan exporters andprovision of information about the concessions offered underthese trade pacts among the business community

Way Forward
• International Market is diversifying and becoming more stringent in food quality control measures
• Sri Lankan food exports need to comply with the standards such as Global GAP, GMP, HACCP, ISO, BRC, FDA,ORGANIC
• Comply with standards on packaging, labeling, environment & ingredients
• Keen attention on fertilizer and pesticide residual levels & contamination with heavy metals
• Establishment of traceability & record keeping systems

Thank you for your kind attention