sri lanka science, technology & innovation statistical handbook · 2017-11-09 · foreword sri...
TRANSCRIPT


Sri Lanka Science, Technology & InnovationStatistical Handbook
2014
National Science Foundation47/5, Maitland Place
Colombo 07Sri Lanka
www.nsf.gov.lk

HeadScience and Technology Policy Research DivisionNational Science Foundation47/5, Maitland PlaceColombo 07Sri Lanka
Tel/Fax : 011 2675841E-mail : [email protected] : www.mis.nsf.gov.lk
Copyright National Science Foundation, Sri Lanka. All rights reserved. ISBN 978-955-590-125-3, Price : SL Rs. 300.00 (Sri Lankans), US $ 10.00 (Foreign nationals)
For a copy of the Publication or suggestions for improvements, please write to:

FOREWORD
Sri Lanka Science, Technology & Innovation Statistical Handbook 2014, is a compilation of key findings of the National Research & Development (R&D) Survey carried out by the NSF during 2016-2017 to provide the nationally and internationally comparable statistical indicators on Science, Technology and Innovation. The definitions and classifications used in the National R&D Survey 2014 are based on the International Standardization of Statistics on Science and Technology (UNESCO, 2010) and the Frascati Manual (OECD, 2002).
The indicators presented in the first three chapters cover the input measures such as expenditure on research and development; available human resources; and the output measures such as patents, publications etc., respectively. The fourth chapter of this book presents the basic innovation indicators that were developed using the data collected through the National R&D Survey 2014, and hence the readers will have an idea on how Sri Lanka performed in the year 2014 in the area of innovation. The last chapter presents some useful indicators relevant to broader areas such as economic and development activities in the country along with the indicators relevant to education, health and natural resources in Sri Lanka.
For easy reference of the users, Sri Lanka Science, Technology & Innovation Statistical Handbook 2014 also includes the highlights of the Survey and the general definitions used for the purpose.
Prof. Sirimali FernandoChairpersonNational Science FoundationColombo, Sri Lanka
May 2017
i

PREFACE
Sri Lanka Science, Technology and Innovation Statistical Handbook 2014, comprises the findings of the National Research, Development and Innovation Survey 2014 conducted by the National Science Foundation (NSF), Sri Lanka. The data collection reports the status of Science, Technology (S&T) and Innovations occurred during the period of 1st January 2014- 31st December 2014. This Handbook mainly focuses on the policy authorities, scientists, researchers, donors, and other stakeholders who are interested in having a broad picture of the status of S&T sector in the country during the year 2014.The statistical indicators presented in the book have been developed according to definitions and guidelines of UNESCO, 2010 and the Frascati Manual 2002 (OECD, 2015) for international comparability.
The data presented in the Handbook also gives a qualitative analysis of the different aspects of the S&T sector of the country representing, all the higher education institution; R&D Institutions; S&T institutions (S&T management, administration and services); Industries; and the national & international non-governmental institutions. In most cases, the data given in this Handbook is relevant to the surveyed year of 2014 depicting different perspectives of the S&T sector of the country under many different indicators which allows international comparisons.
Sri Lanka Science and Technology Statistical Handbook 2014 has been prepared by the Science and Technology Policy Research Division (STPRD) of the National Science Foundation, Sri Lanka.
Dr P.R.M.P. Dilrukshi Ranathunge Head Science and Technology Policy Research Division (STPRD) National Science Foundation Sri Lanka
May 2017
ii

TECHNICAL NOTES
The research and development (R&D) and innovation consist of people, institutions, processes, infrastructure, linkages and collaborations that involved in the generation, diffusion and absorption of scientific and technological knowledge. The capability and performance of Sri Lanka’s Science, Technology and Innovation (STI) system is crucial to advancing the future economic prosperity, social development and quality of life of people.
This Survey covered four major S&T sectors in the country such as:a. Higher Education sector (State and Private) - full coverage b. State S&T sector that included Research Institutions, S&T service providing Institutions – full coverage c. Business Enterprises – 250 institutions were selected for the survey considering the size of the establishment, degree
of their R&D activity and proportion of their contribution to national economy. All the major industries that conduct a substantial amount of R&D were included in the sample as per the guidance of the Dept. of Census and Statistics.
d. Private Non Profit Institutions – all the institutions that are involved in the activities related to S&T were covered in the survey
The data, presented in this book are in line with the standards and methodologies laid down by the UNESCO and OECD. International standard classifications relevant to Science, Technology and Innovation were followed in questionnaire development, indicators development and presentation.
iii

iviv
HIGHLIGHTS-2014
• TotalinvestmentforR&DfromGrossDomesticProduct(GDP)is0.1%andthisistheleastrecordin the country after independence.
• BusinesssectorcontributionforoverallR&Dinvestmenthasbeenincreasinggraduallyfrom0.6%in2004to41.24%in2014.
• WhenconsideredtheR&DperformanceofdifferentsectorsbasedontheirR&DexpenditurethehighestperformancewasrecordedinBusinessEnterprisesector(40.88%)followedbyGovernmentInstitution(38.82%)andHigherEducationsectorinstitutions(20.02%).
• The highest propotion of funds for R&Dwas devoted for applied research (57.37%) followed byexperimentaldevelopmentresearch(27.38%)andbasicresearch(15.25%).
• Most of the research conducted in year 2014 came under the discipline ofAgricultural Sciences(39.4%)followedbyNaturalSciences(25.76%),EngineeringTechnology(23.65%),SocialSciences&Humanities(5.83%)andMedicalSciences(3.59%).
• Sri Lanka recorded 261 Researchers (Head Count) per million population and 100 Full TimeEquavalant (RTE) Researchers per million population.

v
Abbreviations
FTE Full Time Equivalent GDP Gross Domestic Product GERD Gross Expenditure on R&D IPR Intellectual Property Rights IT Information Technology MIS Management Information System na not available NA Not Applicable NARESA Natural Resources, Energy & Science Authority nes not elsewhere specified
nm not mentionedNSF National Science Foundation o/w of which OECD Organization for Economic Co-operation and Development PCT Patent Cooperation Treaty PNP Private Non Profit PPP Perchasing Power Parity R&D Research and Development S&T Science and Technology SCI Science Citation Index STI Science, Technology and Innovation STP Science and Technology Personnel STPRD Science & Technology Policy Research Division UGC University Grants Commission UIS UNESCO Institute of Statistics

CONTENTS
Foreword i Preface iiTechnical Notes iiiHighlights iv
Abbreviations v
1. Financial Resources for Research and Development (2-18)
1.1 : Gross Expenditure on R&D (GERD) in Sri Lanka 1966-20141.2 : Gross expenditure on R&D (GERD) in Selected Countries 1.3 : National Gross Investment on R&D (GERD) by Source of Funding 20141.4 : Trends in National Investment on R&D by Source of Funding 2004-20141.5 : Trends in Gross Expenditure on R&D (GERD) by Source of Funding as a Percentage of GDP 2004-20141.6 : National R&D Expenditure on R&D (GERD) by Sector of Performance 2014 1.7 : Trends in National Expenditure by Sectors of Performance 2004-20141.8 : Percentage Gross Expenditure on R&D (GERD) by Source of Funding in Selected Countries 1.9 : National R&D Expenditure by Nature of Research Activity 20141.10: National R&D Expenditure by Nature of Research Activity 2010-2014 1.11: Percentage GERD by the Type of R& D Activity in Selected Countries 1.12: National R&D Expenditure of Different Sectors by Discipline 20141.13: National R&D Expenditure by Discipline 2004-20141.14: Percentage GERD by Discipline in Selected Countries in 2014
vi

2. Human Resources in Science and Technology (20-34)
2.1: Distribution of R&D Scientists (Head Count) by Sector 2013-2014 2.2: Number of R&D Scientists (Head Count) by Discipline and Gender2.3: Educational Qualifications of R&D Scientists -2014 2.4: Distribution of R&D Scientists (FTE) by Sector 20142.5: Distribution of R&D Scientists of Full Time Equivalent (FTE) by Discipline-2014 2.6: Educational Qualifications of Full Time Equivalent (FTE) Scientists -20142.7: Number of R&D Scientists (Headcounts) by Age and Sex 20132.8 : Number of R&D Scientists in Selected Countries 2.9 : World Statistics of Researchers by Formal Qualification & Sex (HC) 2.10 : Science and Technology Personnel (STP) by Category 20142.11 : Distribution of S&T Personnel (STP) by Sector -2010-20142.12 : Distribution of Science and Technology Scientists Technologists (R&D and S&T Service) by
Discipline 2014
3. Performance Indicators for Science and Technology (36 - 50)
3.1 : Number of Patents Awarded Locally During 2000-2014 3.2 : Number of Industrial Design Awarded Locally During the Period of 2000-2014 Sector 3.3 : Distribution of Patents According to Classification 2013-2014
vii

3.4 : Patent Applications in Selected Countries 2012-2014 3 5 : Main Fields of Sri Lanka Publications in the SCI Journals 2012,2013 and 20143.6 : Knowledge Disseminations During 20143.7 : Sri Lanka S&T Postgraduate Output 2012-2014 3.8 : World Statistics of Researchers by Formal Qualification & Sex (HC)
4. Innovation Indicators (52 - 62)
4.1 : R&D Expenditure of Different Industrial Categaries 20144.2 : Percentage of Total Revenue that came from the Sale of Products/Service by
Industry Involved in R&D in 2010- 20144.3 : Number of Innovation carried out by the Industrial Sector (R&D) Institutions in 2014
4.4 : Number of Innovation carried out by the Government Sector (R&D) Institutions in 20144.5 : Number of Innovation carried out by the Higher Education Sector in 20144.6 : High-technology exports (current US$) in selected countries 2012-20144.7 : Involvement of Industrial Sector with other Institutions in Conducting R&D and Innovation Activities
2006-20144.8 : Institution/countries Industries Bought Technologies/ Patent/Knowledge Relevant to their R&D and
Innovation activities4.9: MethodologiesusedbytheIndustries(%)oftheSampletoProtectitsIntellectualPropertyRight(IPR)
during 2008-2014
viii

5. Key Socio - Economic Indicators - General (64 - 78)
5.1: Demographic Indicators of Sri Lanka (2013-2014)5.2: Demographic Indicators: SAARC countries5.3: Social Indicators: SAARC Countries5.4: Economic Indicators: National Output and Expenditure 5.5: Composition of Exports 2013-20145.6: Composition of Imports 2013 & 20145.7: Realised investments in the Board of Investment (BOI) Enterprises (a) 2013-20145.8: Education Indicators: General Education5.9: Education Indicators: Tertiary and Vocational Education and Training5.10: Global Innovation Indicators in 2014 (By Rank) in Selected Countries(Out of 143)5.11: Education Indicators: University Education5.12: Health Service Indicators-Public sector5.13: Key indicators in Infrastructure development-Communication 2012-20145.14: Power Sector Performance 5.15: Deforestation and Pollution
Definitions 79Survey Team 82


FINANCIAL RESOURCES FOR
RESEARCH AND DEVELOPMENT

2Financial Resources for Research & Development
Year GDP current prices
Rs.million
GERD Rs. million
(US$ million)
GERD as percentage
of GDP
Total population
million
GERD per million
population Rs. million
1966 7,529 19.8 (4.1) 0.30 11.5 1.7
1975 11,100 45.1 (6.4) 0.40 13.5 3.3
1984 142,700 257.0 (9.7) 0.18 15.6 16.5
1996 769,900 1,410.0 (23) 0.18 18.3 77.0
2000 1,258,000 1,810.0 (22.9) 0.14* 18.4 98.4
2004 1,800,750 3,807.5 (40.9) 0.21 19.4 196.2
2006 2,939,000 5,119.19 (47.9) 0.17 19.8 258.52008 4,410,682 5,047.73 (46.1) 0.11 20.2 249.92010 5,605,104 8,778.16 (69.4) 0.16 20.7 424.12013 8,674,230 9,670.00 (73.3) 0.11 20.5 471.7
2014 10,448479 10,350.07 (79.0) 0.10 20.7 500.00
1.1 : Gross Expenditure on R&D (GERD) in Sri Lanka 1966-2014
*EstimatesSource: National R&D Surveys, Sri Lanka 1996 (NARESA), 2000, 2004, 2006, 2008, 2010, 2013 & 2014 (NSF)

3Financial Resources for Research & Development
Figure 1 : Trends in Gross Expenditure on R&D (GERD) in Sri Lanka
2000
1966 1975 1984 1996 2000 2004 2006 2008 2010 2013 2014 0 0
0.05
0.1
0.15
0.2
0.25
0.3
0.35
0.4
0.45
0.30
0.40
0.18 0.180.14
0.21
0.17
0.11
0.16
0.110.10
4000
6000
8000
10,000
12,000Ex
pend
iture
(Rs.
Mill
ion)
GER
D a
s Per
cent
age
of G
DP
GERD
GERD as Percent of GDP

Country Year (Data available)
GERD in Constant PPP$
GERD as a % of GDP
GERD per Capita (in PPP$)
Australia 2013 18,241,431 2.19 944.9
Brazil 2013 34,219,206 1.23 194.4
China 2014 313,139,232 2.05 269.2
France 2014 46,393,079 2.6 904.9
Germany 2014 85,859,232 2.86 1317.8
India 2011 42,794,911 0.82 38.5
Indonesia 2013 1,837,356 0.08 8.5
Iraq 2014 174,514 0.04 4.6
Japan 2014 130,648,702 3.6 1309.1
Malaysia 2014 8,222,356 1.29 323.7
New Zealand 2013 1,406,183 1.17 409.5
Pakistan 2013 2,115,220 0.29 13.5
Philippines 2013 567,736 0.13 9.1
Republic of Korea 2014 69,008,660 4.29 1484.7
Saudi Arabia 2009 775,163 0.07 30.7
Singapore 2014 8,405,181 2.19 1796.9
South Africa 2012 4,219,650 0.73 91.3
Sri Lanka 2014 197,301 0.10 9.5
Thailand 2014 4,371,020 0.48 75.9
United Kingdom 2014 39,353,362 1.7 678.1
United States of America 2013 393,844,620 2.72 1440.9
1.2 : Gross expenditure on R&D (GERD) in Selected Countries
Source: Adopted from UNESCO Statistics 2014* National R&D Survey, Sri Lanka 2014 - Current Price (Rs)
4Financial Resources for Research & Development
*

5Financial Resources for Research & Development
1.3 National Gross Investment on R&D (GERD) by Source of Funding 2014
Source of Funding
Recurrent Capital Total GERD (as a per-
centage of GDP)
Government4,660.79 1,152.43 5,813.22 0.06
(45.3%) (11.1%) (56.2%)
Business Enterprise
3,956.73 311.68 4,268.41 0.04
(38.2%) (3.0%) (41.2%)
Foreign 201.34 19.47 220.81 0.00
(2.0%) (0.2%) (2.1%)
Other32.18 15.45 47.63 0.00
(0.3%) (0.2%) (0.5%)
Total8,851.04 1,499.03 10,350.07 0.10
(85.5%) (14.5%) (100.0%)
Rs.million
Figure 2 : National investment on R&D by
different sectors
Source: National R&D Surveys Sri Lanka 2014 (NSF)
Foreign2.13%
Other0.46%
Government56.17%
Business Enterprises41.24%

6Financial Resources for Research & Development
1.4: Trends in National Investment on R&D by Source of Funding 2004-2014
*Other: funds generated by the institution itself by providing services etc. and funds received from Private Non Profit Sector Source: National R&D Surveys Sri Lanka, 2006, 2008, 2010 , 2013 & 2014 (NSF)
Source of Funding 2004 2008 2010 2013 2014
Government2571.3 3,624.41 4,907.16 5,209.97 5,813.22
(67.5%) (71.8%) (55.9%) (53.9%) (56.2%)
Business Enterprise 21.9 1,004.01 3,592.58 3,934.04 4,268.41
(0.6%) (19.9%) (40.9%) (40.7%) (41.2%)
Foreign 861.8 215.59 239.13 486.17 220.82
(22.6%) (4.3%) (2.7%) (5.0%) (2.1%)
Other*352.5 203.74 39.29 39.83 47.63
(9.3%) (4.0%) (0.5%) (0.4%) (0.5%)
Total3807.5 5,047.73 8,778.16 9,670.00 10,350.07
(100.0%) (100.0%) (100.0%) (100.0%) (100.0%)

7Financial Resources for Research & Development
0% 20% 40% 60% 80% 100%
2014
2013
2010
2008
2004
Expenditure (%)
Year
Government
Business Enterprise
Foreign
Other
Figure 3 : National R&D investment by sectors during 2004-2014

1.5: Trends in Gross Expenditure on R&D (GERD) by Source of Funding as a Percentage of GDP 2004-2014
Source of Funding 2004 2006 2008 2010 2013 2014Government 0.14 0.11 0.08 0.09 0.06 0.06Business Enterprise 0.00 0.03 0.02 0.07 0.05 0.04Foreign 0.05 0.01 0.00 0.00 0.00 0.00Other* 0.01 0.01 0.01 0.00 0.00 0.00Total 0.21 0.17 0.11 0.16 0.11 0.10
*Other: funds generated by the institution itself by providing services etc and funds received from Private Non Profit Sector. Source: National R&D Surveys Sri Lanka 1996 (NARESA), 2004 to 2006, 2008, 2010, 2013 & 2014 (NSF)
%GDP
Business Enterprise
8Financial Resources for Research & Development
Government
Foreign
Other
0.14
0.16
0.12
0.08
0.1
0.06
0.04
0.02
0 20062004 2008 2010 2013 2014 Year
GE
RD
Figure 4 : Gross R&D expenditure by different sectors during 2004-2014

9Financial Resources for Research & Development
1.6 : National R&D Expenditure on R&D (GERD) by Sector of Performance 2014
Source: National R&D Surveys Sri Lanka, 2014 (NSF)
Sector Recurrent Capital Total % Government 2,866.46 1,151.63 4,018.09 38.82Higher Education 2,032.02 40.57 2,072.60 20.02Business Enterprise 3,924.15 306.72 4,230.87 40.88Private Non Profit 28.40 0.11 28.51 0.28Total 8,851.04 1,499.03 10,350.07 100.00
Expenditure (Rs. million)
Expe
nditu
re (R
s. m
illio
n)
Sect
or
Sector
Private Non Profit
Private Non Profit
Business Enterprise
Business Enterprise
Higher Education
Higher Education
Government
Government
Recurrent Capital Recurrent Capital
Rs. Million
0% 20% 40% 60% 80% 100%
4500
4000
3500
3000
25002000
1500
1000
500
0
Figure 5 : Gross R&D expenditure by sector of performance

10Financial Resources for Research & Development1.7 : Trends in National Expenditure by Sectors of Performance 2004-2014
SectorYear
2004 2008 2010 2013 2014
Government2321.1 1,250.67 3,927.90 3,365.95 4,018.09(61.0%) (24.8%) (44.8%) (34.8%) (38.8%)
Higher education1277.6 2,872.56 1,008.34 1,931.12 2,072.60(33.5%) (56.9%) (11.5%) (20.0%) (20.0%)
Business enterprise208.8 924.50 3,840.36 4,339.60 4,230.87 (5.5%) (18.3%) (43.8%) (44.9%) (40.9%)
Private non profitna na 1.56 33.33 28.51
(0.0%) (0.3%) (0.2%)
Total3,807.5 5,047.73 8,778.16 9,670.00 10,350.07
(100.0%) (100.0%) (100.0%) (100.0%) (100.0%)na: Not AvailableSource: National R&D Surveys Sri Lanka 2008, 2010 , 2013 & 2014 (NSF)
Rs.million

11Financial Resources for Research & Development
1.8 : Percentage Gross Expenditure on R&D (GERD) by Source of Funding in Selected Countries Country Percentage Contribution to GERD by different sector
Year Business enterprise Government Higher education Private non-profitAustralia 2013 56.3 11.2 29.6 2.8
China 2014 77.3 15.8 6.9 na
Colombia 2014 25.8 4.9 42.3 26.9
France 2014 64.8 13.1 20.6 1.5
Germany 2014 68.1 14.7 17.1
India 2011 35.5 60.5 4.1 na
Indonesia 2013 25.7 39.4 34.9 na
Iraq 2014 2.6 59.4 38.0
Japan 2014 77.8 8.3 12.6 1.3
Malaysia 2014 45.7 8.2 46.1 na
New Zealand 2013 46.4 23.2 30.4 na
Pakistan 2013 - 67.1 32.9 na
Philippines 2013 35.7 29.7 33.7 0.8
Republic of Korea 2014 78.2 11.2 9.0 1.5
Singapore 2013 59.4 11.3 29.2 na
South Africa 2012 44.3 22.9 30.7 2.1
Sri Lanka 2014 40.9 38.8 20.0 0.3
United Kingdom 2014 64.4 7.8 26.1 1.7
United States of America 2013 70.6 11.2 14.2 4.1*National R&D Survey, Sri Lanka 2014 (NSF) Source: adoped from UNESCO statistics 2014, http://www.uis.unesco.org/ScienceTechnology
*

12Financial Resources for Research & Development
Nature of research Govern-ment
Higher Education
Industry PNI Total %
Basic 473.83 115.69 982.41 6.55 1,578.47 15.2Applied 3,191.62 1,535.27 1,189.30 21.86 5,938.05 57.4Experimental Development 352.65 421.64 2,059.17 0.11 2,833.56 27.4Total 4,018.10 2,072.60 4,230.87 28.51 10,350.08 100.0
1.9 National R&D Expenditure by Nature of Research Activity 2014Rs.million
Higher Education
Higher Education
Government
Government
Industry
Industry
PNI
PNI
Sect
or
Sector
Basic research Basic researchApplied research Applied researchExperimental development
Experimental development
Expenditure (%)Ex
pend
iture
Source : National R&D Survey, Sri Lanka 2014 (NSF)
0% 20% 40% 60% 80% 100%
Figure 6 : National R&D expenditure by Nature of Research Activity 2014
3500
3000
2500
2000
1500
1000
500
0

13Financial Resources for Research & Development
Nature of Research 2010 2013 2014Amount % Amount % Amount %
Basic Research 956.78 11.00 959.29 10.00 1,578.47 15.2Applied Research 4,302.20 49.00 5,518.65 57.00 5,938.05 57.4Experimental Development 3,519.18 40.00 3,192.07 33.00 2,833.56 27.4Total 8,778.16 100.00 9,670.00 100.00 10,350.08 100.0
1.10: National R&D Expenditure by Nature of Research Activity 2010-2014
Source: National R&D Surveys Sri Lanka, 2010, 2013 & 2014 (NSF)
Rs.million
Experimental Development
Experimental Development
Expenditure (%)
Exp
endi
ture
Year
Year
Applied Research Applied ResearchBasic Research Basic Research
0% 20% 40% 60% 80% 100%
2010
2010
2013
2013
2014
2014
Figure 7 : National R&D expenditure by Nature of Research Activity 2010-2014
7000
6000
5000
4000
3000
2000
1000
0

14Financial Resources for Research & Development
Country % of GERD
Year Basic Research
Applied Research
Experimental Development
Not Specified
China 2014 4.7 10.7 84.5 naFrance 2013 24.2 37.9 34.5 3.4Japan 2014 12.3 19.9 63.4 4.4Malaysia 2014 16.9 75.5 7.5 naNew Zealand 2013 25.2 39.1 35.8 na
Republic of Korea 2014 17.6 18.9 63.4 naSingapore 2013 20.5 33.2 46.4 naSouth Africa 2012 25.3 46.3 28.4 naSri Lanka* 2014 15.3 57.4 27.4 naThailand 2014 21.7 28.5 35.4 14.3United Kingdom 2013 15.6 46.2 37.5 naUnited States of America 2013 17.6 19.9 62.5 na
1.11 Percentage GERD by the Type of R&D Activity in Selected Countries
na - not available*National R&D Surveys, Sri Lanka 2014 (NSF) Source: http://www.uis.unesco.org/ScienceTechnology

15Financial Resources for Research & Development
1.12: National R&D Expenditure of Different Sectors by Discipline 2014
Source: National R&D Surveys Sri Lanka 2006, 2008, 2010, 2013 & 2014 (NSF)
Discipline Higher Education
State Sector
Industry PNI Total
Natural Sciences 545.72 973.44 1,120.85 26.18 2,666.19Engineering & Technology 327.09 399.09 1,721.27 0.11 2,447.56Medical Sciences 346.67 23.23 1.94 0.00 371.84Agricultural Sciences 501.70 2,211.25 1,364.82 0.00 4,077.77Social Sciences and Humanities 207.48 394.14 - 2.22 603.84
other 143.94 16.94 21.99 0.00 182.87Total 2,072.60 4,018.09 4,230.87 28.51 10,350.07

1.13 National R&D Expenditure by Discipline 2004-2014
Source: National R&D Surveys Sri Lanka 2004, 2006, 2008, 2010, 2013 & 2014 (NSF)
DisciplineYear
2004 2006 2008 2010 2013 2014Natural Sciences
627.6 1,148.7 645.0 1,064.11 2,376.55 2,666.19(16.5%) (22.4%) (12.8%) (12.1%) (24.6%) (25.8%)
Engineering & Technology
614.0 1,096.5 1,490.2 1,771.38 3,195.32 2,447.55(16.1%) (21.4%) (29.5%) (20.2%) (33.1%) (23.5%)
Medical Sciences
531.4 726.7 875.1 498.62 904.37 371.84(14.0%) (14.2%) (17.3%) (5.7%) (9.4%) (3.7%)
Agricultural Sciences
1002.5 1,258.9 1,669.6 2,925.99 2,693.05 4,077.77(26.3%) (24.6%) (33.1%) (33.3%) (27.8%) (39.4%)
Social Sciences and Humanities
999.5 393.9 367.8 577.80 475.77 603.85(26.3%) (7.7%) (7.3%) (6.6%) (4.9%) (5.8%)
Other23.4 494.7 0.0 1,940.25 24.08 182.87
(0.9%) (9.7%) (0.0%) (22.1%) (0.2%) (1.8%)
Total3,807.5 5,119.2 5,047.7 8,778.16 9,670.00 10,350.07
(100.0%) (100.0%) (100.0%) (100.0%) (100.0%) (100.0%)
16Financial Resources for Research & Development

17Financial Resources for Research & Development
2010
2008
2006
2004
2013
2014
0% 20% 40% 60% 80% 100%
Medical Sciences
Other
Engineering & Technology
Social Sciences and Humanities
Natural Sciences
Agricultural Sciences
Expenditure (%)
Year
Figure 8 : National R&D expenditure by discipline from 2004-2014

18Financial Resources for Research & Development
1.14 Percentage GERD by Discipline in Selected Countries in 2014
CountryGERD %
Natural Sciences
Engineering & technology
Medical Sciences
Agricultural Sciences
Social Sciences & Humanities
Other
Colombia 14.30 14.60 10.00 12.80 13.00 35.30Malaysia 47.20 31.10 5.90 7.60 8.20 0.00Oman 9.60 32.50 2.60 48.90 6.40 0.00Republic of Korea 13.80 68.60 11.80 2.20 3.60 0.00Russian Federation 18.30 72.90 3.10 1.60 4.10 0.00Sri Lanka 25.80 23.50 3.70 39.40 5.80 1.80Turkey 10.70 54.60 15.00 4.40 15.30 0.00
Source:http://www.uis.unesco.org/ScienceTechnology

HUMAN RESOURCES IN
SCIENCE AND TECHNOLOGY

2.1: Distribution of R&D Scientists (Head Count) by Sector 2013-2014
Sector
2013 2014No. of
ScientistsNo. of
TechniciansNo. of Tech-
nicians per Scientists
No. of Scientists
No. of Technicians
No. of Tech-nicians per
ScientistsGovernment 1,819 1,278 0.70 1,614 1,607 1.00
Higher Education 2,668 543 0.20 2,657 391 0.15
Business Enterprise 1,204 1,366 1.13 1,141 720 0.63
Private Non Profit (PNP) 14 13 0.93 12 13 1.08
Total 5,705 3,200 0.56 5,424 2,731 0.50
Source: R&D Survey National Science Foundation Sri Lanka, 2013 & 2014
Cumulative %
Business enterprisePrivate non profit
GovernmentHigher education
20Human Resources in Science and Technology
0% 20% 40% 60% 80% 100%
Technicians
Scientists
Scientists
Technicians
2013
2014
Figure 9 : R&D headcount in different sectors

2.2: Number of R&D Scientists (Head Count) by Discipline and Gender
Discipline
Headcount of R&D scientists (2013)
Headcount of R&D scientists(2014)
Male Female Total Male Female TotalNo % No % No % No % No % No %
Natural Sciences 870 25 529 24 1,399 25 891 30 738 30 1,629 30
Agricultural Sciences
657 19 407 18 1,064 19 651 22 638 26 1,289 23
Engineering and Technology
819 24 339 15 1,158 20 713 24 334 13 1,047 19
Medical Sciences 493 14 483 22 976 17 360 12 434 18 794 15
Social Sciences and Humanities
424 12 283 13 707 12 233 8 175 7 408 8
Other 217 6 184 8 401 7 97 3 160 6 257 5
TOTAL 3,480 100 2,225 100 5,705 100 2,945 100 2,479 100 5,424 100Source: R&D Survey National Science Foundation Sri Lanka, 2013 & 2014
21Human Resources in Science and Technology

R &
D S
cien
tists
Year
Natural sciencesEngineering & technologies
Medical sciencesAgricultural sciencesSocial sciences & humanities
Other
20040
200
400
600
800
1000
1200
1400
1600
1800
2000
2006 2008 2010 2013 2014
22Human Resources in Science and Technology
Figure 10 : Distribution of R&D Scientists in Different Disciplines 2004-2014

2.3: Educational Qualifications of R&D Scientists -2014
QualificationMale Female Total
No % No % No %Ph.D. 570 19 329 13 899 17M.Phil. 132 4 105 4 237 4MD/MS 113 4 106 4 219 4M.Sc. 314 11 330 13 644 12B.Sc+P.Dip. 719 25 646 27 1,365 25B.Sc. (sp) 622 21 387 16 1,009 19B.Sc.(gen) 384 13 551 22 936 17Other 91 3 25 1 116 2Total 2,945 100 2,479 100 5,424 100
Qualifications
23Human Resources in Science and Technology
Source: National R&D Survey, Sri Lanka 2014 (NSF)
Figure 11 : Distribution of R&D Scientists as per education and gender
800
Num
ber
of R
&D
Sci
entis
ts
MaleFemale
B.Sc. (gen)B.Sc. (sp)B.Sc. + P.Dip.
M.Sc.MD/MSM.philPhD
100
300
400
500
600
700
0
200

2.4 Distribution of R&D Scientists (FTE) by Sector 2014
Sector Full Time Equivalent of R&D scientists
Male Female Total % of Female
Government 566 497 1063 47Higher Education 296 236 532 44Industry 241 215 456 47PNP 3 3 6 50Total 1106 951 2057 56
24Human Resources in Science and Technology
Source: National R&D Survey, Sri Lanka 2014 (NSF)
Higher education Government
Business enterprisePrivate Non Profit
R & D Scientists (FTE) (%)
R &
D S
cien
tists
(FT
E)
Figure 12 : Trends in R&D Scientists (FTE) distribution by sector 2006-2014
Year
Year
2006
20060
200
400
600
800
1000
1200
2008
2008
2010
2010
2013
2013
2014
2014
0% 20% 40% 60% 80% 100%

2.5: Distribution of R&D Scientists of Full Time Equivalent (FTE) by discipline-2014
Discipline 2014
Male Female Total
Natural Sciences 326 278 604Agricultural Sciences 335 343 678Engineering & Technology 251 105 356Medical Sciences 82 102 184Social Sciences and Humanities 88 61 149
Other 24 62 86Total 1,106 951 2,057
25Human Resources in Science and Technology
Source: National R&D Survey, Sri Lanka 2014 (NSF)
Figure 13 : Trends in Distribution of R&D Scientists (FTE) in Different Disciplines
Natural Sciences
R &
D S
cien
tists
(FTE
) (%
)
Discipline0
50
100
150
200
250
300
350
400
MaleFemale
Engineering & Technologies
Medical Sciences
Agricultural Sciences
Social Sciences and Humanities
Other

2.6: Educational Qualifications of Full Time Equivalent (FTE) Scientists -2014
QualificationMale Female Total
No No NoPhD 382 347 729M.Phil. 207 195 404MD/MS 84 47 131M.Sc. 47 49 96B.Sc+P.Dip 206 183 389B.Sc. (sp) 96 122 218B.Sc.(gen) 82 8 90Total 1106 951 2057
26Human Resources in Science and Technology
Source: National R&D Survey, Sri Lanka 2014 (NSF)
B.Sc (gen)
B.Sc (sp)
B.Sc + P.Dip
M.Sc.
MD/MS
M.Phil
PhD
Qua
lifica
tion
R&D Scientists FTE (%)
Male
Female
0% 20% 40% 60% 80% 100%
Figure 14 : Educational qualifications of R&D Scientists (FTE) - 2014

27Human Resources in Science and Technology
2.7: Number of R&D Scientists (Headcounts) by Age and Sex 2014
Age groupHeadcount of R&D scientists Headcount of Fulltime (FTE)
scientists Male Female Total Male Female Total
21-30 425 312 737 191 126 31731-40 548 559 1,107 209 209 41841-50 655 514 1,170 234 191 42551-60 361 245 606 133 85 218Above 60 108 55 163 29 16 45Not mentioned 848 793 1,641 310 324 634Total 2,945 2,479 5,424 1,106 951 2,057
above 6051-6041-50 31-4021-30
Male
R&
D S
cien
tists
(F
TE
)
Female
Male
Female
R&
D S
cien
tists
Source: National R&D Survey, Sri Lanka 2014 (NSF)
0% 20% 40% 60% 80% 100%
Figure 15 : Age distribution of R&D scientists engaged in research in 2014

28Human Resources in Science and Technology2.8 : Number of R&D Scientists in Selected Countries
Country Year(Data avail-able)
Researchers(HC) per million population
Researcher(FTE) per million population
Belgium 2013 8,966 4,156Brazil 2010 2,404 698China 2014 3,907 1,113France 2013 8,989 4,170Germany 2013 10,693 4,388Iraq 2014 190 68Ireland 2014 8,932 3,793Japan 2012 8,930 5,386Kuwait 2013 1,364 129New Zealand 2013 9,600 3,978Pakistan 2013 780 167Republic of Korea 2014 12,112 69,010Singapore 2013 8,592 6,665Sri Lanka 2014 261 100
* National R&D Survey, Sri Lanka 2014 (NSF)Source:Adopted from UNESCO Statistics 2014
*
29Human Resources in Science and Technology
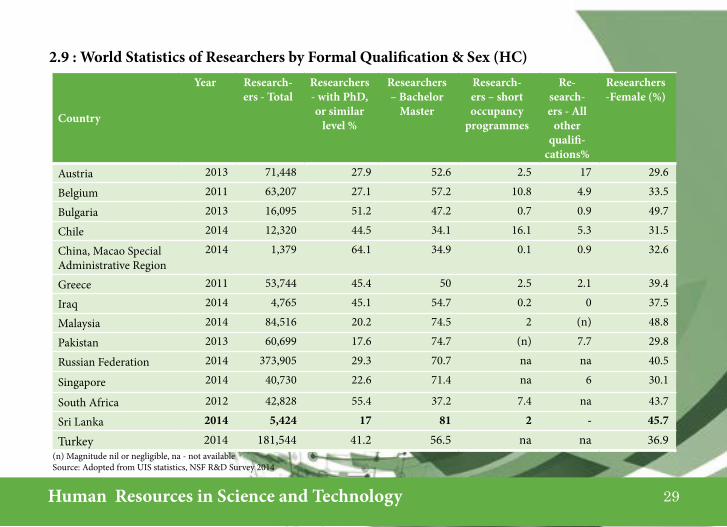
2.9 : World Statistics of Researchers by Formal Qualification & Sex (HC)
(n) Magnitude nil or negligible, na - not availableSource: Adopted from UIS statistics, NSF R&D Survey 2014
Country
Year Research-ers - Total
Researchers - with PhD, or similar
level %
Researchers – Bachelor
Master
Research-ers – short occupancy
programmes
Re-search-ers - All
other qualifi-
cations%
Researchers -Female (%)
Austria 2013 71,448 27.9 52.6 2.5 17 29.6
Belgium 2011 63,207 27.1 57.2 10.8 4.9 33.5
Bulgaria 2013 16,095 51.2 47.2 0.7 0.9 49.7
Chile 2014 12,320 44.5 34.1 16.1 5.3 31.5
China, Macao Special Administrative Region
2014 1,379 64.1 34.9 0.1 0.9 32.6
Greece 2011 53,744 45.4 50 2.5 2.1 39.4
Iraq 2014 4,765 45.1 54.7 0.2 0 37.5
Malaysia 2014 84,516 20.2 74.5 2 (n) 48.8
Pakistan 2013 60,699 17.6 74.7 (n) 7.7 29.8
Russian Federation 2014 373,905 29.3 70.7 na na 40.5
Singapore 2014 40,730 22.6 71.4 na 6 30.1
South Africa 2012 42,828 55.4 37.2 7.4 na 43.7
Sri Lanka 2014 5,424 17 81 2 - 45.7
Turkey 2014 181,544 41.2 56.5 na na 36.9

30Human Resources in Science and Technology 2.10 : Science and Technology Personnel (STP) by Category 2014
Category Male Female Total Per million population
S&T Scientists 5,538 4,415 9,953 480.82
Technicians 7,470 3,375 10,845 523.91
Other Supporting staff 42,856 24,038 66,894 3,231.59
STP 55,864 31,828 87,692 4,236.32Source: R&D Survey National Science Foundation Sri Lanka, 2004, 2006, 2008, 2010,2013 & 2014
S&T ScientistsTechniciansSupporting staff
S & T personal (%)
S &
T p
erso
nal
2013
2013
2010
2010
2014
2014
Year
Year
Figure 16 : Trends in Science and Technology Personnel (STP) distribution 2010-2014
0% 20% 0
10,000
20,000
30,00040,000
50,000
60,000
70,000
80,000
90,000
100,000
40% 60% 80% 100%

31Human Resources in Science and Technology
2.11 : Distribution of S&T Personnel (STP) by Sector -2010-2014
Sector2010 2013 2014
STP Percent STP Percent STP PercentGovernment 28,247 23.38 18,992 16.74 21,986 25.07Higher Education 4,609 3.82 3,873 3.42 6,140 7.00Industry 87,909 72.77 90,546 79.81 59,509 67.86PNP 32 0.03 36 0.03 57 0.07Total 120,797 100.00 113,447 100.00 87,692 100.00
Source: R&D Survey National Science Foundation Sri Lanka, 2008, 2010, 2013 & 2014 (NSF) NOTE: Total STP includes all Researchers, other Scientists in the Service sector Institutions, Technicians and Supporting Staff
2014
2014
2013
2013
2010
2010
Figure 17 : Trends in S&T Personnel (STP) across different sector, 2010-2014
Business enterprise
Government
Year
YearS&T Personal (%)
S&T
Pers
onal
Higher education
0% 20% 40% 60% 80% 100%
Private Non Profit
0
10,000
20,000
30,000
40,000
50,000
60,000
70,00080,000
90,000
100,000

32Human Resources in Science and Technology
2.12 : Distribution of Science and Technology Scientists Technologists (R&D and S&T Service) by discipline 2014
STP Male Female Total % Female
of TotalNatural Sciences 1,605 1,387 2,992 53.6Agricultural Sciences 1,084 943 2,027 45.6Engineering & Technologies 1,641 794 2,435 32.6Medical Sciences 631 636 1,267 50.2Social Sciences and Humanities 406 558 964 57.9Other /Not specified 171 97 268 39.2Total 5,538 4,415 9,953 44.4
Natural Sciences
Natural Sciences
Figure 18 : Distribution of Scientists and Technologists in different disciplines
Source: National R&D Surveys, Sri Lanka 2006, 2008, 2010, 2013 & 2014 (NSF)
Engineering & Technologies
Engineering & Technologies
Medical Sciences
Medical Sciences
Social Sciences and Humanities
Social Sciences and Humanities
Other
Agricultural Sciences
Agricultural Sciences
Dis
cipl
ine
DisciplineS & T Personal (%)
S &
T P
erso
nal
Female
Male
0% 20% 40% 60% 80% 100%0
200
400
600
800
1000
12001400
1600
1800

33Human Resources in Science and Technology
STP Scientists
STP Scientists
R & D Scientists (FTE)
R & D Scientists (FTE)
R & D Scientists
R & D Scientists
0%
0%
20%
20%
40%
40%
60%
60%
80%
80%
100%
100%
Female
Male
Natural Sciences
Medical Sciences
Agricultural Sciences
Social Sciences & Humanities
Other
Engineering & Technologies
Figure 19 : Distribution of Scientists by Gender 2014
Figure 20 :Distribution of Scientists by Disipline 2014

34Human Resources in Science and Technology
2004 2006 2008 2010 2012 20140
2000
4000
6000
8000
10000
12000
14000
Year
Num
ber
of S
cien
tists
STP Scientists
R&D Scientists
R&D Scientists (FTE)
Figure 21 : Distribution of Scientists 2004-2014

PERFORMANCE INDICATORS FOR
SCIENCE AND TECHNOLOGY

3.1 : Number of Patents Awarded Locally During 2000-2014
Source: National Intellectual property Office (NIPO) , Sri Lanka (http://www.nipo.gov.lk/satistic.htm)
36Performance Indicators for Science and Technology
YearApplications Registration
Resident Non- resident
Total Resident Non-resident
Total
2000 71 250 321 59 169 2282001 120 236 356 71 104 1752002 123 202 325 59 54 1132003 95 189 284 63 52 1152004 120 195 315 103 85 1882005 149 211 360 64 116 1802006 153 270 423 68 69 1372007 151 279 430 54 37 912008 209 241 450 89 70 1592009 202 200 402 11 254 2652010 225 235 460 220 284 504
2011 194 235 429 45 227 2722012 242 297 539 37 89 1262013 328 188 516 71 165 2362014 314 222 536 43 220 263

37Performance Indicators for Science and Technology
3.2 : Number of Industrial Design Awarded Locally During the Period of 2000-2014 by Sector
Source: National Intellectual property Office (NIPO) , Sri Lanka (http://www.nipo.gov.lk/satistic.htm)
YearApplications Registration
Resident Non- resident
Total Resident Non-resident
Total
2000 187 10 197 179 6 1852001 520 26 546 482 11 4932002 345 40 385 253 13 2662003 385 42 427 365 23 3882004 254 50 304 224 40 2642005 257 47 304 269 88 3572006 477 39 516 422 45 4672007 328 24 352 8 6 142008 333 56 389 85 4 892009 273 40 313 238 36 2742010 233 51 284 228 37 265
2011 387 56 443 88 21 1092012 365 29 394 60 28 882013 260 99 359 100 30 1302014 245 47 292 471 58 529

38Performance Indicators for Science and Technology3.3 : Distribution of Patents According to Classification 2013-2014
Source: National Intellectual property office(NIPO),Sri Lanka
Patent Categories 2013 2014Agriculture related developments 12 12Construction technology and materials developments 7 7Drugs , cosmetics & other related product developments 30 26Dryers/ dehydration technology 1 4Energy saving / generating devices 16 16Food and beverage process technology and related findings 8 5Development of domestic appliances/utilities 10 8IT and telecommunication & electronic and related 16 20Packaging and packing materials 0 0Process technology 33 31Process technology - Manufacturing sector 5 4
Rubber production and processing technology 2 1Chemicals productions and related findings 73 78Textile technology and related inventions 4 12Automobile and related inventions 8 12Other 11 14Total 236 250

39Performance Indicators for Science and Technology
0% 20% 40% 60% 80% 100%
2014
2010
2004
Year
Number of Patents (%)
Agriculture related develop-ments
Construction technology and materials developments
Dryers/ dehydration technology
Energy saving / generating devices
Food and beverage process tech-nology and related findings
Packaging and packing materials
Process technology
Process technology - Manu-facturing sector
Rubber production and processing technology
Figure 22 : Trends in patents licentine across different disciplines

40Performance Indicators for Science and Technology3.4 : Patent Applications in Selected Countries 2012-2014
Source : World Bank Data, http://data.worldbank.org/indicator/
CountryResident Non-resident
2012 2013 2014 2012 2013 2014Australia 2,627 3,061 1,988 23,731 26,656 23,968Bangladesh 67 60 44 287 243 249Switzerland 1,480 1,525 1,480 1,508 631 568China 535,313 704,936 801,135 117,464 120,200 127,042United Kingdom 15,370 14,972 15,196 7,865 7,966 7,844Ireland 492 333 263 63 57 58Italy 8439 8,307 8,601 871 905 781Japan 287,013 271,731 265,959 55,783 56,705 60,030Malaysia 1,114 1,199 1,353 5,826 6,006 6,267New Zealand 1,425 1,614 1,636 5,674 5,167 6,092Philippines 162 220 334 2,832 3,065 3,255
Thailand 1,020 1,572 1,006 5,726 5,832 6,924Sri Lanka 242 328 314 539 516 536United States of America 268,782 287,831 285,096 274,033 283,781 293,706

41Performance Indicators for Science and Technology
3.5 : Main Fields of Sri Lanka Publications in the SCI Journals 2012, 2013 and 2014
Source : World Bank Data, http://data.worldbank.org/indicator/
Field2012 2013 2014
Total number
% With foreign Co-authorship
Total number
% With foreign Co-authorship
Total number
% With foreign Co-authorship
Agriculture 29 86.2 37 73.0 36 83.3
Biological science 20 90.0 20 85.0 19 84.2
Molecular biology & biotechnology
37 94.6 39 79.5 28 85.7
Chemical science 20 70.0 22 81.8 24 75.0
Earth Sciences 18 88.9 18 72.2 17 82.3
Engineering & Technologies 4 50.0 13 69.2 11 72.7
Environmental Science 27 81.5 36 88.9 29 89.6
fisheries, Aquaculture 2 100.0 6 100.0 9 100.0
food science 19 84.2 17 88.2 23 95.6
Forestry 19 100.0 12 100.0 15 100.0
Health science 114 80.7 122 72.1 118 70.3
Mathematics 2 50.0 5 80.0 4 100
Nanotechnology 32 90.6 14 92.9 12 91.7
Physics 11 54.5 17 47.1 16 50
Veterinary 6 100.0 2 100.0 3 100
Social Sciences 6 16.7 11 54.5 9 55.5
Total 366 83.1 391 77.0 373 79.3
Source: Adopted from from the SCI database, SCI science Citation Indeo

42Performance Indicators for Science and Technology
Num
ber
of p
ublic
atio
ns in
the
SCI j
ourn
als
Total
With foreign co-authors
02004 2005 2006 2007 2008 2009 2011 2012 2013 20142010
50
100
150
200
250
300
350
Year
400
Figure 23 : Publication Trends in the SCI Journals by Sri Lankan Scientists 2004-2014

43Performance Indicators for Science and Technology
AgricultureHealth Science
Social Sciences
Veterinary
Physics
Nanotechnology
Mathematics
ForestryFood Science
Fisheries, Aquaculture
Environmental Science
Engineering & Technologies
Earth Sciences
Chemical Science
Molecular Biology & Biotechnology
Biological Science
2013
2012
2014
Figure 24 : Publication Trends in Different Subject Areas 2013-2014 with the publications of health sciences
020406080
100120140

44Performance Indicators for Science and TechnologyAgriculture
Veterinary
Social Sciences
PhysicsChemical Science
Molecular Biology & Biotechnology
Biological Science
Nanotechnology
Mathematics
Forestry
Fisheries, Aquaculture Food Science
Engineering & Technologies
Earth Sciences
Environmental Science
0
10
20
30
40
50
2012
2013
2014
Figure 25 : Publication Trends in Different Subject Areas 2012-2014 (without Health Sciences)Note : The publications done in health sector not included to give clear distribution of other publication.

45Performance Indicators for Science and Technology
0
50
100
150
200
250
300
350
400
450
2004 2006 2008 2010 2013 20140
2000
4000
6000
8000
10000
12000N
o. o
f pub
licat
ions
in S
CI J
ourn
als
Num
ber o
f Sci
entis
ts
Expe
nditu
re o
n R
& D
(Rs.
Mill
ion)
Number of R & D Scientists Expenditure on R & DPublications in SCI JournalsYear
Figure 26 : Trends in Scientific publications based on R&D expenditure and human resources available during 2004-2014

46Performance Indicators for Science and Technology
Natural Sciences
Medical Sciences
Engineering & Technology
Agricultural Sciences
Social Sciences and Humanities
Others
%ofPublicationsinSCI Journals
%of Expenditure on R & D
%ofHuman Resources
Figure 27 : Trends in Scientific publications based on R&D expenditure and human resources (by percentage)
0
10
20
30
40
50

47Performance Indicators for Science and Technology
3.6 : Knowledge Disseminations During 2014
Publication/ ActivityState Sector Higher
Education Toal % Higher
EducationLocal Int Local Int Local Int Local Int
Books and Book Chapters 92 8 457 109 549 117 83.24 93.16Journal articles (peer reviewed) 75 74 54 787 129 861 41.86 91.41Journal articles (other) 94 37 541 301 635 338 85.20 89.05Newspaper articles 132 10 196 45 328 55 59.76 81.82Abstracts 119 127 914 614 1,033 741 88.48 82.86Newsletters, handbooks, manuals etc. that aim general public
91 0 nm nm 91 0
Presentations/ Resource Person in seminars/conference *
671 109 2,378 893 3,049 1,002 77.99 89.12
* only aim at general publicInt. - Internationalnm=not mentioned Source : National Science Foundation 2014

48Performance Indicators for Science and Technology
Degree Year Medical Agricul-ture Science/IT Engineering Total
PG. Dip.
2012 164 00 140 09 3132013 310 11 156 02 4792014 230 18 229 06 483
M.Sc./M.Eng. 2012 68 176 284 101 6292013 47 170 591 210 1,0182014 93 241 470 205 1,009
M.Phil.2012 04 24 38 05 712013 04 23 43 12 822014 05 18 34 09 66
MS/MD 2012 00 00 00 00 00
2013 251 00 00 00 2512014 265 00 00 00 265
Ph.D. 2012 229 07 08 04 2482013 02 07 16 02 272014 08 05 18 02 33
Total
2012 465 207 470 119 1,2612013 614 211 806 226 1,857
2014 601 282 751 222 1,856
3.7 : Sri Lanka S&T Postgraduate Output 2012-2014
* MS/MD were included under PhD during 2002 Source: UGC Statistics 2014,
*
*

49Performance Indicators for Science and Technology
Ph.D. Engineering
MS/MDScience/
IT M.Phil.
Agricul-ture M.Sc./
M.Eng.Medical PG.
Dip.0% 0%20% 20%40% 40%60% 60%80% 80%100%
100%Female FemaleMale Male
Figure 28 : Distribution of postgraduate output across gender
Figure 29 : Distribution of postgraduate across diffent disipline
Qua
lifica
tion
S & T Postgraduates (%) S & T Postgraduates (%)
Dis
iplin
e

50Performance Indicators for Science and Technology
Country Year Research-ers - Total
Research-ers - with PhD, or similar level %
Research-ers –
Bachelor Master
Research-ers – short occupancy
pro-grammes
Research-ers - All other qualifica-tions%
Research-ers -Fe-male (%)
Austria 2013 71,448 27.9 52.6 2.5 17 29.6
Belgium 2011 63207 27.1 57.2 10.8 4.9 33.5
Bulgaria 2013 16095 51.2 47.2 0.7 0.9 49.7
Chile 2014 12320 44.5 34.1 16.1 5.3 31.5
China, Macao Special Administrative Region
2014 1379 64.1 34.9 0.1 0.9 32.6
Greece 2011 53744 45.4 50 2.5 2.1 39.4
Iraq 2014 4765 45.1 54.7 0.2 0 37.5
Malaysia 2014 84516 20.2 74.5 2 (n) 48.8
Pakistan 2013 60699 17.6 74.7 (n) 7.7 29.8
Russian Federation 2014 373905 29.3 70.7 40.5
Singapore 2014 40730 22.6 71.4 6 30.1
South Africa 2012 42828 55.4 37.2 7.4 43.7
Sri Lanka 2013 5424 21 77 2
Turkey 2014 181544 41.2 56.5 36.9
3.8 : World Statistics of Researchers by Formal Qualification & Sex (HC)
(n) Magnitude nil or negligibleSource: Adopted from UIS statistics

INNOVATION INDICATORS

52Innovation Indicators4.1 : R&D Expenditure of Different Industrial Categaries 2014
Category 2014
Capital Recurrent Total Agriculture , Fishery and Forestry 20.59 263.40 283.99Mining and Quarrying 2.83 36.17 39.00Manufacturing 270.22 3,457.19 3,727.41Electricity 9.79 125.31 135.10Construction 0.04 0.48 0.52Trade and Service 3.25 41.60 44.85Total 306.72 3,924.15 4,230.87
Rs.million
Source : National R&D Survey, Sri Lanka 2014(NSF)
0% 10% 20% 30% 40% 50% 60% 70% 80% 90% 100%
2014
2010
2008
Expenditure (Rs)
Year
Manufacturing Trade and ServiceConstructionElectricity Mining and quarrying
Agriculture , Fishery and Forestry
Figure 30 : Trends in R&D expenditure of different R&D categories 2008-2014

4.2 : Percentage of Total Revenue that came from the Sale of Products/Service by Industry Involved in R&D in 2010- 2014
Category 2010 2013 2014Local Market 66.1 66.1 68.8Asia Pacific Countries 8.8 8.8 6.6European Countries 14.8 14.8 10.8United States 7.9 7.9 5.8Middle East Countries 0.7 0.7 3.2Africans Countries 0.7 0.7 3.8Rest of the World 1.0 1.0 1.0Total 100% 100% 100%
2010 2013 2014
53Innovation Indicators
Figure 31 : Trends in revenue generations by industries within the period 2006 - 2014
Year
Source : National R&D Surveys, Sri Lanka 2006, 2008 & 2010 (NSF);
Tota
l re
venu
e (%
)
0
10
2006 2008
15
20
25
Asia Pacific countries
European Countries United States
Middle east countries
Africans countries
Rest of the world

54Innovation Indicators4.3 : Number of Innovation carried out by the Industrial Sector (R&D)Institutions in 2014
Innovation TypeNumber
Developed Transferred Commercialized/ publicized
Development of new product/services/ processes
91 16 57
Existing products/services significantly improved
69 17 54
Existing processes significantly improved 10 5 5New plant varieties/hybrids developed 9 1 4Substitute developed for imports 10 4 1Designs/ Prototypes developed 536 0 298
0% 20% 40% 60% 80% 100%
Designs/ Prototypes developed
Imported substitute developed
New plant varieties/hybrids developed
Existing processes significantly improved
Existing products/services significantly improved
Development of new product/services/ processes
Inno
vatio
n Ty
pe
Number (%)
Developed
Transferred
Commercialized/ publicized
Source : National R&D Surveys, Sri Lanka, 2014
Figure 32 : Difeent innovations types carried out by industrial sector during 2014

55Innovation Indicators
4.4 : Number of Innovation carried out by the Government Sector (R&D)Institutions in 2014
Innovation TypeNumber
Developed Transferred Commercialized/ publicized
Development of new product/services/pro-cesses
39 20 14
Existing products/services significantly improved
12 4 4
Existing processes significantly improved 5 0 0New plant varieties/hybrids developed 27 2 12Substitute developed for imports 0 0 0Designs/ Prototypes developed 18 4 1
Designs/ Prototypes developed
New plant varieties/hybrids developed
Existing processes significantly improved
Existing products/services significantly improved
Development of new product/services/processes
Inno
vatio
n Ty
pe
0% 60% 100%Number (%)
Developed
Transferred
Commercialized/ publicized
Source : National R&D Surveys, Sri Lanka, 2014
Figure 33 : Different innovation types carried out of Government Sector institutions in 2014

56Innovation Indicators4.5 : Number of Innovation carried out by the Higher Education Sector in 2014
Innovation TypeNumber
Developed Transferred Commercialized/publicized
Development of new product/services/processes
73 15 na
Existing products/services/ processes significantly improved
28 8 na
New plant varieties/hybrids /Micro organism based products developed
0 0 na
Development of substitute for imports 5 3 naDesigns/ Prototypes developed 20 0 naOther 8 0 na
Source : National R&D Surveys, Sri Lanka, 2014
Other
Designs/ Prototypes developed
Development of substitute for imports
Existing products/services/ processes significantly improved
Development of new product/services/processes
0% 20% 40% 60% 80% 100%
Inno
vatio
n Ty
pe
Number (%)
Developed
Transferred
Figure 34 : Different innovation types carried out by higher education sector in 2014

57Innovation Indicators
4.6 : High-Technology Exports (current US$ per million) in Selected Countries 2012-2014
Country 2012 2013 2014Australia 4,761 4,565 4,691Canada 29,087 29,026 31,535China 505,646 560,058 558,606Germany 187,016 193,799 199,718France 108,586 113,251 114,697United Kingdom 67,787 69,224 70,653India 12,434 16,693 17,316Japan 123,393 105,076 100,955Sri lanka 58 69 68New Zealand 709 723 645Thailand 33,768 33,901 34,992United States 148,331 148,531 155,641Republic of Korea 121,313 130,460 133,447Malaysia 61,229 60,378 63,376Philippines 20,795 21,810 23,839Pakistan 309 349 259Singapore 128,239 135,602 137,369Vietnam 16,259 27,819 30,864
Source: World Bank Data, (http://data.worldbank.org/indicator/)

58Innovation Indicators
Implimenting new information and communication technologies
Comply with environment standards and regulations
Active involvement in developing new industry-wide standards
Promotion domestic markets
Promotion export markets
Developing niche or specialized markets
Satisfying existing clients
Seeking new markets
Research & Development
High Moderate Minor Not applicable
Figure 35 : Rate of importance given by the enterprises for their activities during 2014
Number of Enterprises%0% 40%20% 60% 100%80%

59Innovation Indicators
4.7 : Involvement of Industrial Sector with other Institutions in Conducting R&D and Innovation Activities 2006-2014
Institution % Institutional involvement in R&D
2006 2008 2010 2014
Own company alone 48.6 52.7 52.2 60.0With Parent Company 25.8 20.7 18.1 13.8Collaboration with other institution 16.4 19.0 21.3 18.5Out sourcing 9.2 7.6 8.5 7.7
Total 100 100 100 100
2008
2006
2010
2014
Year
Own company alone
Collaboration with other institutions
With parent company
Outsourcing
Figure 36 : The degree of engagment with other institutions for R&D by industries during 2006-2014
Institutional involvement in R&D (%)
Source : National R&D Surveys, Sri Lanka 2006, 2008 & 2010 (NSF)
0% 40%20% 60% 100%80%

60Innovation Indicators4.8: Institution/countries Industries Bought Technologies/ Patent/Knowledge Relevant to
their R&D and Innovation activities Locality Country 2008 2010 2014Local Government 13 12 12
Private 02 16 19Foreign Individual 01 - -
Australia - 01 01Belgian 03 06 01China 01 01 04Denmark - 01 -Dubai - - 01France 01 01 -Germany 03 11 05India 07 15 12Italy 02 - -Hong Kong - - 02Japan 01 03 02South Korea - 01 1Switzerland - - 01Spain - - 01Pakistan - 02 01Taiwan - 01 01Thailand 01 - -UK 01 03 01USA 04 05 01
Source: R&D Survey National Science Foundation Sri Lanka, 2008,2010 & 2014

61Innovation Indicators
4.9: Methodologies used by the Industries (%) of the Sample to Protect its Intellectual Property Right (IPR) during 2008-2014
Methodologies 2008 2010 2014Formal :
Patents 23.1 23.3 8.0Trademarks 65.1 74.1 85.0Copyrights 14.8 20.6 28.1
Strategic Methods: Secrecy 64.5 67.2 70.0Complexity of design 37.3 31.2 30.3Other 2.4 1.05 0.0
60504030
20100
70
80
90
Met
hods
em
ploy
ed f
or IP
R
Prot
ectio
n (%
)
2006 2008 2010 2014
Patents
Copyrights
Trademarks
SecrecyComplexity of design
Other
Figure 37 : Type of Intellectual Property Rights employed by industries to protect their innovations during 2008-2014 Year
Source: R&D Survey National Science Foundation Sri Lanka, 2008,2010 & 2014

62Innovation Indicators
Other
Risk related to feasability of the final outcomes
Inadequate ICT facilities and knowledge
Inadequate knoweldge to conducting R&D activities
Inability to devote staff to innovate or R&D activites
Shortage of qualified personnel to work in the R&D projects
Inadequate funding opportunities for private sector R&D activities
Inadequate funds to conduct R&D
High Medium Low Not relevant
Figure 38 : Factors that affected to abondon the R&D work initiated by industries before their successful completion in 2014
0% 40%20% 60% 100%80%

KEY SOCIO-ECONOMIC INDICATORS

64Key Socio - Economic Indicators - General
Item 2013(a) 2014(a)Mid-Year population, ‘000 (b) 20,579 20,7710-14 Years, ‘000 5,187 5235
15-54 Years, ‘000 11,768 11,879
55 Years and over, ‘000 3,624 3,657
Growthofpopulation,% 0.8 0.9
Crude birth rate, per 1,000 population 17.9 16.9Crude death rate, per 1,000 population 6.2 6.2
Rate of natural increase, per 1,000 population 11.7 10.7Net migration rate, per 1,000 population -2.3 -2.2Infant mortality rate, per 1,000 live births 8.2 n.aDensity of population, persons per Sq.Km. 328 331
5.1: Demographic Indicators of Sri Lanka(2013-2014)
(a) Provisional (b) Until 2011, mid-year population estimates were prepared based on the Census of Population and Housing-2001Mid-Year population estimates 2012 onwards were prepared based on the final report of the Census of Population and Housing-2012 n.a. – Not available Sources : Registrar General’s Department Department of Census and Statistics 2010-2013

65Key Socio - Economic Indicators - General
Indicator Ref. Year
Sri Lanka
Afghan-istan
Bangla-desh
Bhu-tan
India Mal-dives
Ne-pal
Paki-stan
Mid-Year population, Mn. 2013 20.6 27.5 154.7 0.7 1,228.80 0.4 27.3 181.7
Populationgrowth,% 2013 0.8 1.9 1.4 1.7 1.3 3.5 1.4 0.6
Land area, '000 Sq.km. 2003 65.6 na 130.2 na 2,973.20 0.3 143 770.9
Density of population [Persons per Sq. km.] (a) 2013 328 42 1,048.00 19.00 374 2,645.00 185 227
0-14 Years 2013* 25.2 46.6 30 28.1 29.1 28.7 34.7 33.8
15-64 Years 2013* 66.9 51 65.2 67.1 65.6 66.3 60.2 61.8
65 Years & above 2013* 7.9 2.3 4.8 4.8 5.3 4.9 5.1 4.4
Urbanpopulation,% 2013 18.3 (a) 22.9 25.9 (b) 33.7 (c) 30.5 40.5 (d) 17 (b) 33.7
Crude birth rate, Per 1,000 2012 17.5 35.3 20.3 19.9 20.7 22.2 21.6 25.7
Crude death rate, Per 1,000 2012 6 8.1 5.7 6.5 7.9 3.4 6.7 7
Total Fertility Rate [Births per Women] 2012 2.3 5.1 2.2 2.3 2.5 2.3 2.4 3.3
Infant mortality rate [per 1,000 live births] 2012 8 71 33 36 44 9 34 69
Maternal mortality rate [per 100,000 live births] 2010 35 460 240 180 200 60 170 260
Expectation of life at birth, Years 2013 74.3 60.9 70.7 68.3 66.4 77.9 68.4 66.6
Infant mortality rate [per 1,000 live births] 2009 8.5(b) 134 41 52 50 11 39 71
Maternal mortality rate [per 100,000 live births] 2008 39 1,400 340 200 230 37 380 260
Expectation of life at birth, Years 2010 74.7 48.3 68.6 66.9 65.1 76.6 68.4 65.2
5.2: Demographic Indicators: SAARC countries
(a) Revised data based on the final report of the census of population and housing - 2012, (b) 2011, (c) 2012, (d) 2010 na – Not available Sources : Key Indicators for Asia and the Pacific 2012 & 2014, ADB FAOSTAT Database Access website (www.faostat.fao.org)Human Development Report 2015, UNDP ,Central Bank of Sri Lanka

66Key Socio - Economic Indicators - General
Indicator Ref.Year
Sri Lanka
Afgani-stan
Bangla-desh
Bhu-tan
India Mal-dives
Nepal Paki-stan
Human Development Index (a)(Max.:1,000; Min.: 0.000)
2013 0.75 0.468 0.558 0.584 0.586 0.698 0.54 0.537
LiteracyRate,%(15Yearsandover)
2012 96.8 45.4(b) 62.5 na 75.2 ( c ) 98.4 ( c ) 71.1(l) 67(l) Male
Female 2012 94.6 17.6(b) 55.1 na 50.8 ( c ) 98.4 ( c ) 46.7(b) 42(b)
Physicians per 10,000 people 2012 6.8 (d) 2.3 (b) 3.6 (b) 2.6 7 14.2 (d) na 8.3(d)
Hospital Beds per 10,000 people 2012 36 5 6 18 7 (g) 43 (h) 50.0 (c) 60
Daily News Papers per 1,000 Persons 2007 26 na na na 71 na na 50
Television Sets per 1,000 Persons 2007 142 3 7 45 34 109 27 30
Radios per 1,000 Persons 2004 215 na 49 na 120 na 39 105
Per Capita Electricity Consumption (kWh) 2011 490 38(i) 259 977 (g) 684 521 106 449
Internet Subscriptions, per 100 people (j) 2013 2 0 0.6 2.7 1.20 5.8 0.8 0.6
Telephones per 1,000 Persons (Main Lines) 2013 127 3 7 35 23 65 31 35
Telephones per 1,000 Persons (Mobile Phones)
2013 955 700 671 722 708 1,812 715 701
LabourForceParticipationRate,% Male
2012 75 79.7 84.1 76.9 80.9 77.1 63.2 82.9
Female 2012 32.9 15.7 57.3 66.4 28.8 55.9 54.3 24.4
UnemploymentRate,% 2013 4.4 na 4.5 (d) 2.9 2.8 (b) 11.7 (d) 2.7 (e) 6.2
5.3: Social Indicators: SAARC Countries
(a) A composite index of life expectancy, education and income. (b) 2011 (c) 2006 (d) 2010 (e) 2008 (f) National poverty line, (g) 2005 (h) 2009 (i) 2012 (j) Fixed Broadband Internet, na – Not available Sources : Key Indicators for Asia and the Pacific 2012 & 2014, ADB/ Human Development Report 2015, 2011 UNDP Department of Census and Statistics

67Key Socio - Economic Indicators - General
Economic ActivityValue (Rs.million) As a share of GDP(%) Rate of Change(%)
2013 (a) 2014(b) 2013 (a) 2014(b) 2013 (a) 2014(b)
AGRICULTURE 352,583 353,799 10.8 10.1 4.7 0.3
Agriculture, Livestock and Forestry 309,134 308,403 9.5 8.8 4.5 -0.2
Fishing 43,449 45,397 1.3 1.3 6.2 4.5
INDUSTRY 1,016,886 1,132,892 31.1 32.3 9.9 11.4
Mining and Quarrying 94,388 104,797 2.9 3.0 11.5 11.0
Manufacturing 229,843 604,677 17.1 17.2 7.5 8.0
Electricity, Gas & Water 79,913 83,542 2.4 2.4 10.3 4.5
Construction 282,742 339,906 8.7 9.7 14.4 20.2
SERVICES 1,896,572 2,019,973 58.1 57.6 6.4 6.5
Wholesale and Retail Trade 739,826 798,837 22.7 22.8 5.5 8.0
Hotels and Restaurants 25,715 28,676 0.8 0.8 22.3 11.5
Transport and Communication 476,721 511,296 14.6 14.6 9.4 7.3
Banking, Insurance and Real Estate tec. 285,750 304,478 8.7 8.7 5.9 6.6
Ownership of Dwellings 79,175 80,178 2.4 2.3 2.9 1.3
Government Services 213,439 216,477 6.5 6.2 2.8 1.4
Private Services 75,946 80,030 2.3 2.3 7.3 5.4
GROSS DOMESTIC PRODUCT 3,266,041 3,506,664 100.0 100.0 7.2 7.4
GROSS NATIONAL PRODUCT 3,180,915 3,420,629 6.6 7.5
5.4: Economic Indicators: National Output and Expenditure
(a) Revised, (b) Provisional Sources : Central Bank of Sri Lanka, Annual Report 2013,2014,2015

68Key Socio - Economic Indicators - General
Category 2013 2014 (a) Change in value
Y-O-Y (b)change %
Contribution to change % Value Share % Value Share %
Rubber 71.3 0.7 45.3 0.4 -26.0 -36.5 -3.5
Coconut 204.6 2.0 356.4 3.2 151.7 74.2 20.6
Other Agricultural Products © 762.9 7.3 763.9 14.2 0.9 93.3 0.2
Industrial Exports 7749.4 74.6 8262.0 74.2 512.6 6.6 69.7
Textiles and Garments 4508.3 43.4 4929.9 44.3 421.6 9.4 57.3
Rubber products 887.8 8.5 889.8 8.0 2.0 0.2 0.3
Petroleum products 427.7 4.1 338.0 3.0 -89.8 -21.0 -12.2
Gem, Diamond and Jewellery 445.5 4.3 393.6 3.5 -51.9 -11.7 -7.1
Food,Beverages and Tobacco 235.2 2.3 289.3 2.6 54.0 23.0 7.3
Machinery and Mechanical Appliances
312.3 3.0 342.9 3.1 30.7 9.8 4.2
Printing Industry Products 36.3 0.3 52.4 0.5 16.1 44.5 2.2
Transport Equipment 146.3 1.4 151.8 1.4 5.4 3.7 0.7
Leather, Travel Goods and Footwear
76.8 0.7 138.9 1.2 62.1 80.8 8.4
Ceramic Products 40.4 0.4 41.3 0.4 0.9 2.2 0.1
Other Industrial Exports 632.7 6.1 694.1 6.2 61.5 9.7 8.4
Mineral Exports 51.6 0.5 59.5 0.5 7.9 15.3 1.1
Unclassified Exports 12.2 0.1 14.7 0.1 2.5 20.7 0.3
Total Exports (d)(e) 10349.3 100.0 11130.1 100.0 735.8 7.1 100.0
5.5: Composition of Exports 2013-2014
(a) Provisional, (b) Year over year (c)Includes spices, vegetables, unmanufactured tobacco, minor agricultural products and seafood, (d)Adjusted, (e)Excludes re-exports Sources : Annual Report 2014 ,Central Bank of Sri Lanka.
US Dollars million

69Key Socio - Economic Indicators - General
5.6: Composition of Imports 2013 & 2014
(a) Provisional, (b) Adjusted ( c) Year over Year, (d) Adjusted Sources : Annual Report 2015 ,Central Bank of Sri Lanka.
Category 2013 2014 (a) Change in Value
Y-O-Y (c )change %
Contribution to change %Value Share % Value Share %
Consumer Goods 3,182.5 17.7 3,852.5 19.8 670 21.1 47.4
Food and Beverages 1,368.1 7.6 1633.7 8.4 265.7 19.4 18.8
Non-Food Consumer goods 1,814.4 10.1 2218.8 11.4 404.4 22.3 28.6Intermediate Goods 10,553.7 58.6 11,397.7 58.7 843.9 8 59.7
Fuel 4,308.2 23.9 4,597.3 23.7 289.2 6.7 20.4
Textiles and Textile Articles 2,045.8 11.4 2,327.6 12 281.7 13.8 19.9Diamonds and Precious stones and Metals 482.9 2.7 175.4 0.9 -307.4 -63.7 -21.7
Chemical Products 734.3 4.1 808.2 4.2 73.9 10.1 5.2Wheat and Maize 323.2 1.8 404.7 2.1 81.5 25.2 5.8Fertilizer 238.7 1.3 272.4 1.4 33.8 14.1 2.4
Other Intermediate Goods 2,420.8 13.4 2812 14.5 391.2 16.2 27.7
Investment Goods 4,252.7 23.6 4,152.2 21.4 -100.5 -2.4 -7.1
Machinery and Equipment 2,221.9 12.3 2131 11 -90.9 -4.1 -6.4
Transport Equipment 667.8 3.7 707.3 3.6 39.5 5.9 2.8
Building Materials 1,357.2 7.5 1,308.9 6.7 -48.3 -3.6 -3.4
Other Investment Goods 5.8 - 4.9 - -0.9 -15 -0.1
Unclassified Imports 13.9 0.1 14.4 0.1 0.6 4.1 -
Total Imports(b) (c ) 18,002.8 100 19,416.8 100 1,414 7.9 100
US Dollars million

70Key Socio - Economic Indicators - General
CategoryNumber of Projects Foreign Investment
(Rs. Million)Total Investment Poten-
tial (Rs. Million)2013 2014 2013 2014 2013 2014
Food, beverages and tobacco products 132 131 35,858 40,374 63,238 72,409Textiles, wearing apparel and leather products
341 320 70,862 79,070 111,911 128,828
Wood and wood products 26 26 9,212 9,149 10,871 10,731Paper products, publishing and print-ing
28 30 5,170 9,306 6,624 11,719
Chemical, petroleum, coal, rubber and plastic products
128 132 61,305 69,581 78,977 92,381
Non-metallic mineral products 76 80 20,294 23,443 43,814 46,948Basic metal products _ _ _ _ _ _Fabricated metal products, machinery and transport equipment
87 88 20,691 21,283 29,367 30,201
Manufactures products(n.e.s.) 152 151 23,790 26,719 33,726 37,286Services 1027 993 711,776 854,080 1,133,493 1,325,199
5.7 Realised investments in the Board of Investment (BOI) Enterprises (a) 2013-2014
(a) Cumulative figures as at end of the year (b) Provisional n.e.s. not elsewhere specified Source: Annual Report 2013, Central Bank of Sri Lanka(17_Appendix)

71Key Socio - Economic Indicators - General
Item 2013 2014 (a)Total Schools (No.) 10,849 10,971
Government Schools 10,012 10,121Private & Special Schools (b) 103 103Pirivenas 734 747
Total Students (No.) 4,307,625 4,354,011Government Schools 4,037,095 4,078,798Private & Special Schools (b) 130,344 131,397Pirivenas 66,116 62,897
New Admissions (No.) (c) 342,451 348,288Total Teachers (No.) 243,332 253,649
Government Teachers 223,752 232,990Other (Private Schools and Pirivenas) 12,379 12,932
Student/Teacher Ratio (Government Schools) 18 18Expenditure on Education (Rs. Mn.) (d) 151,801 190,150Expenditure as a % of Total Govt. Expenditure 9.1 10.6Expenditure as a % of GDP(e) 1.58 1.82
5.8 Education Indicators: General Education
(a) Provisional. (b) Private Schools approved by the government and schools for children with special needs (This figure excludes international schools which are registered under the Companies Act). (c) Government Schools only, (d) Government expenditure on General and Higher Education. (e) Data based on GDP estimates compiled by the Department of Census and Statistics Source : Sri Lanka Socio-Economic Data 2014, Central Bank of Sri Lanka

72Key Socio - Economic Indicators - General
Item 2013 2014Number of Registered TVET Institutions 1081 1191
Public 519 531Private and Non-Governmental Organiza-tions 562 660
Total Number of Accredited Courses 1601 2277Public 1175 1754Private and Non-Governmental Organiza-tions 426 523
Number of Issued NVQ Cetificates 22855 28535DTET 2932 3481NAITA 6085 6185VTA 6262 7711NYCS 656 720Private 6920 10438
Training Performance of Registered Public Sector Institutions
Number Recruited 68554 86989Number Completed 31392 45552
5.9 Education Indicators: Tertiary and Vocational Education and Training
(a) ProvisionalSource: Central Bank of Sri Lanka(Socio_Econ_Data_2013) Tertiary and Vocational Education Commission

73Key Socio - Economic Indicators - General
Country Global Innova-tion Index
Innova-tion Output Sub-Index
Inno-vation Input sub-Index
Inno-vation Effi-ciency Ratio
Insti-tut-tions
Human Capital & Research
Infra-struc-ture
Market Sophis-tication
Busi-ness Sophis-tication
Knowl-edge & Tech-nology outputs
Cre-ative outputs
Astralia 17 22 10 82 11 7 7 10 26 31 12
China 29 16 45 2 114 32 39 54 32 2 59
France 22 26 20 64 25 15 19 24 16 20 23
India 76 65 93 31 106 96 87 50 93 50 82
Japan 21 27 15 88 18 17 11 13 17 12 46
New Zealand 18 18 13 66 2 16 24 8 33 17 17
Republic of Korea 16 15 16 54 32 3 5 14 30 6 37
Singapore 7 25 1 110 6 2 2 4 1 13 33
South Africa 53 63 47 93 44 70 84 18 68 62 70
Sri Lanka 105 81 125 17 134 115 69 124 132 75 91
Thailand 48 49 52 62 94 31 71 34 55 47 60
United King-dom 2 4 3 29 13 10 6 2 14 5 7
USA 6 7 4 57 17 11 14 1 10 4 20
5.10 Global Innovation Indicators in 2014 (By Rank) in Selected Countries(Out of 143)
Source: The Global Innovation Index 2014

74Key Socio - Economic Indicators - General
Item 2012 2013 2014(a)
Universities(No.) 15 15 15Students(No.) (b) 70,222 77,126 81,153Lecturers(no.) 5176 5,457 5,809Number of Graduated (c) 11,614 20,839 24,559
Arts & Oriental Studies 2321 5985 5602 Commerce and Management Studies 984 3876 3096Law 225 265 64Science 1251 2471 1934Engineering 591 1321 1284Medicine 1031 547 1144Dental Science 20 73 68Agriculture 724 816 857Veterinary Science 54 59 57Architecture and Quantity Surveying 228 201 214
Computer Science 402 454 722
5.11 Education Indicators: University Education
(a)Provisional, (b) Excluding external degree courses, (c) Including external degrees and Open University Sources: Annual Report 2014 ,Central Bank of Sri Lanka, University Statistics 2014,University Grants Commission

75Key Socio - Economic Indicators - General
Item 2012 2013 2014
Hospitals (Practicing Western Medicine) (No.) 593 603 601Beds (No.) 73437 74636 76,918Primary Health Care Units 480 481 484Doctors (No.) 17,129 17,553 17,903Asst. Medical Practitioners 1,061 1,057 1,055Nurses (No.) 30,136 30,928 31,964Attendants (No.) 8,403 8,091 8,215
In-Patients (No.’000) 5840 5926 n.aOut-Patients (No.’000) 50631 53861 54,970Ayurvedic Physicians (No.) (a) 20,712 21,060 22,422Total Health Expenditure (Rs. million) 99,101 119,530 138,403Current Expenditure 81,946 99,609 116,151Capital Expenditure 17,155 19,920 22,252TotalHealthExpenditureasa%ofGDP(b) 1.13 1.25 1.32
5.12 Health Service Indicators-Public sector
(a) Registered with the Department of Ayurvedic Commissioner(b) Based on GDP estimates compiled by the Department of Census and StatisticsSources: Ministry of Healthcare and NutritionDepartment of AyurvedaMinistry of Finance and Planning, Central Bank of Sri Lanka
76Key Socio - Economic Indicators - General
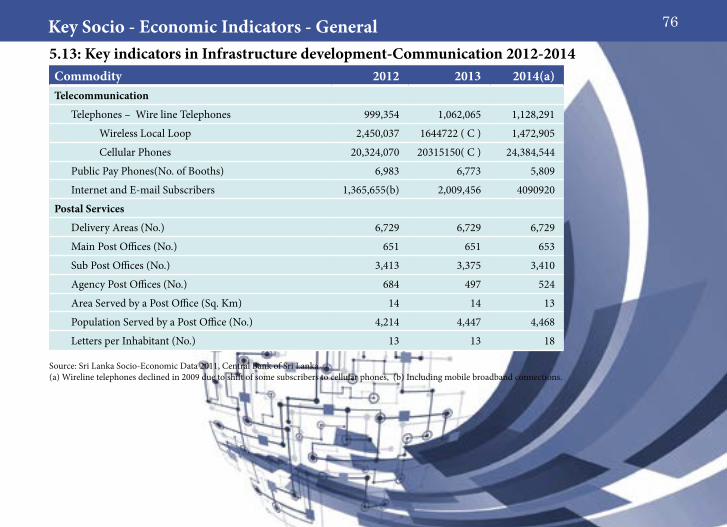
Commodity 2012 2013 2014(a)Telecommunication
Telephones – Wire line Telephones 999,354 1,062,065 1,128,291
Wireless Local Loop 2,450,037 1644722 ( C ) 1,472,905
Cellular Phones 20,324,070 20315150( C ) 24,384,544
Public Pay Phones(No. of Booths) 6,983 6,773 5,809
Internet and E-mail Subscribers 1,365,655(b) 2,009,456 4090920
Postal Services
Delivery Areas (No.) 6,729 6,729 6,729
Main Post Offices (No.) 651 651 653
Sub Post Offices (No.) 3,413 3,375 3,410
Agency Post Offices (No.) 684 497 524
Area Served by a Post Office (Sq. Km) 14 14 13
Population Served by a Post Office (No.) 4,214 4,447 4,468
Letters per Inhabitant (No.) 13 13 18
5.13: Key indicators in Infrastructure development-Communication 2012-2014
Source: Sri Lanka Socio-Economic Data 2011, Central Bank of Sri Lanka (a) Wireline telephones declined in 2009 due to shift of some subscribers to cellular phones, (b) Including mobile broadband connections.

77Key Socio - Economic Indicators - General
Item 2013 2014(a)Growth Rate (%)2013 2014(a)
Installed Capacity (MW) 3,362 3,939 1.5 17.2Hydro(b) 1,361 1,377 0.3 1.2Fuel Oil ( c ) 1,335 1,215 -0.2 -9Coal 300 900 0 200NCRE(d) 366 447 15.5 22.1
Units Generated (GWh) 11,898 12,357 0.8 3.9Hydro(b) 5,990 3,632 119.6 -39.4Fuel Oil(c ) 3,260 4,305 -53 32.1Coal 1,469 3,202 4.6 118NCRE(d) 1179 1217 60.4 3.3
Total Sales by CEB (GWh) 10,621 11,063 1.4 4.2Total Sales LECO (GWh) 1,283 1,271 5.5 -0.9OverallTransmissionandDistributionLossofCEB(%) 10.7 10.5 -4.2 -2.4Number of Consumers (‘000) (f) 5,717 5,929 4.4 3.7o/w Domestic and Religious 5,050 5,235 4.3 3.7
Industrial 56 58 3.7 3.6General Purpose and Hotel (e) 607 633 5.4 4.3
5.14 Power Sector Performance
(a) Provisional, (b) Excluding mini hydro power plants, (c) Inclusive of independent Power Producers(IPPs) (d)Refers to Non-Conventional Renewable Energy including mini hydro, (e)Inclusive of sales to government category, (f)Inclusive of LECO consumers Sources : Central Bank of Sri Lanka Annual Report 2014

78Key Socio - Economic Indicators - General
Country
Deforestation Rate( a)(average % change)
Nitrous oxide emissions (thousand metric tons of
CO2 equivalent)
Methane emissions in energy sector (thousand metric tons
of CO2 equivalent)2012 2013 2014 2010 2011 2012 1990 2000 2008
Australia 16.12 16.16 16.20 51,462 52,855 54,247 24,676 31,775 39,063Bangladesh 11.04 11.02 11.00 26,160 26,421 26,683 5,770 7,928 11,284China 21.70 21.86 22.03 550,297 568,731 587,166 353,529 377,354 738,367India 23.59 23.65 23.71 234,136 236,946 239,755 67,311 82,274 104,339Japan 68.47 68.47 68.46 25,762 25,599 24,911 6,885 4,500 3,375Indonesia 51.37 50.99 50.62 91,313 92,226 93,139 37,767 45,889 57,736Korea, Rep. 63.76 63.60 63.52 14,686 14,832 14,979 8,750 5,905 7,014Malaysia 67.42 67.47 67.51 15,010 15,160 15,310 9,079 17,841 23,251Nepal 25.36 25.36 25.36 4,508 4,553 4,598 1,297 1,405 1,459Pakistan 2.08 2.02 1.97 30,050 30,351 30,651 15,372 24,641 37,956Singapore 23.16 23.13 23.06 1,871 1,890 1,909 401 887 1,385Sri Lanka 33.32 33.22 33.11 2,132 2,153 2,174 592 641 583Thailand 31.92 31.98 32.04 30,228 30,531 30,833 14,543 16,496 21,639United Kingdom 12.78 12.85 12.93 26,536 25,878 25,335 32,842 21,935 13,833United States 33.81 33.84 33.87 304,082 296,744 288,878 252,382 235,275 219,505Vietnam 46.40 46.81 47.23 33,818 34,156 34,494 6,575 14,451 36,938
5.15: Deforestation and Pollution
(a) A negative value indicates that deforestation rate is decreasing (i.e., reforestation) Source: The World Bank Data (http://databank.worldbank.org/data)

DEFINITIONS
The definitions and classifications used in the National R&D Survey 2010 and in this Handbook are based on the International Standardization of Statistics on Science and Technology (UNESCO, 2010) and the Frascati Manual (OECD, 2002).
1. Research and Experimental Development (R&D)
Comprises creative work undertaken on a systematic basis in order to increase the stock knowledge including the knowledge of humanity, culture and society, and the use of this stock knowledge to device new applications. The term R&D covers three activities: basic research, applied research and experimental development work.
a. Basic research : the experimental or theoretical work undertaken primarily to acquire new knowledge of the underlying foundations phenomena and observed facts, without any particular application or use in view.
b. Applied research: the original investigations undertaken in order to acquire new knowledge. It is, however, directed primarily towards a specific practical aim or objective.
c. Experimental development : the systematic work, drawing on existing knowledge gained from research and practical experience that is directed to producing new materials, products and devices; to installing new processes, systems and services; or to improving substantially those already produced or installed.
2. Sectors
Government sector : includes all departments, offices and other bodies, which furnish but normally do not sell to the community, those common services.
Higher Education sector : includes all universities, colleges of technology and other institutions providing tertiary education, whatever their sources of funds or legal status.
79

Private sector : includes all firms, organizations and institutions whose primary activity is the market production of the goods or services (other than higher education) for sale to the general public at an economically significant price and to the private non profit institutions mainly serving them. 3. R&D Expenditures
R&D Expenditures : all expenditures for R&D performed within a sector of the economy, including both: a. Current cost (labour cost, non capital purchases of materials, supplies of R&D equipments, water, fuel, gas, electricity, library
materials etc.).b. Capital expenditure (reported in full for the period when they took place and should not register as element of depreciation).
4. Source of R&D expenditure (Investment) The sectors/ institutions who invest (put money) for R&D work
5. Human Resources in Research and Development
Science and Technology Personnel (STP) : It is defined according to the Canberra Manual (OECD) as persons fulfilling one of the following conditions:• Successfully completed education at the tertiary level in a S&T field of study (seven broad S&T fields of study are Natural
Sciences, Engineering and Technology, Medical Sciences, Agriculture Sciences, Social Sciences, Humanities and other fields).
• Not formally qualified as above but employed in an occupation where the above qualifications are normally required. • Working in the above fields providing technical services or supporting services.
R&D Personnel : all persons employed directly on R&D, as well as those providing direct services such as R&D managers, administrators, and clerical staff excluding persons providing an indirect service such as canteen and security.
80

Researchers : professionals engaged in the conception or creation of new knowledge, products, processes, methods and systems and also in the management of the projects concerned. Postgraduate students at the Ph.D. level engaged in R&D are also considered as researchers.
Technicians and equivalent staff : persons whose main tasks require technical knowledge and experience in one or more fields of engineering, physical and life sciences (technicians) or social sciences and humanities (equivalent staff). They participate in R&D by performing scientific and technical tasks involving the application of concepts and operational methods normally under the supervision of researchers.
Other supporting staff : includes skilled and unskilled craftsmen, secretarial and clerical staff participating in R&D projects or directly associated with (or providing services to researchers involved in) such projects.
Headcount : reflects the total number of persons employed in R&D, independently from their dedication. These data allow links to be made with other data series, such as education and employment data or the results of population censuses. They are also used for calculating indicators, analyzing the characteristics of the R&D workforce, with respect to age, gender or national origin.
OneFull-timeequivalent:oneperson-year.(e.g.ifapersonnormallyspends30%ofhis/hertimeonR&Dandtherestonotheractivities such as teaching , administration and counseling, the FTE is then counted as 0.3). Similarly, if a full time R&D worker is employed at an R&D unit for only a six month period, the FTE is calculated as 0.5.
Innovation : the use of new or significantly improved production process, distribution method, or support activity for goods or services.
81

Survey Team - Science & Technology Policy Research Division (STPRD)
• Dr P.R.M.P Dilrukshi (Head) Overall coordination of the survey including questionnaire preparation, data analysis, indicator development and preparation of the handbook
• Mrs Upuli Rathnayake, Mrs Chamika Dharmasena, Mrs Dilushi Munasinghe, (Scientific Officers) Coordination of data collection
• Mr Y.S. Lakmal Silva, Mr Thanuja Senevirathne, Mrs N.B.W.I. Udeshika, Mrs Ayesha Gunasekara, Mrs Y.S.L Kumaranayake, Ms B.G.A.R.L. Batheegama, Ms M.K.U.L. Mirihana and Mr M.W.H. Gayan (Research Assistants) Assisting data collection, data analysis, data compilation and preparation of the handbook
• Ms Ayomi Palihawadana, Confidential Secretary and Mrs Ajantha Kanthi (Management Assistant) Maintaining correspondence with institutions and data entry
• Mrs Chandima Samarasinghe (Management Assistant) Data entry and designing of the handbook and typesetting
82
