srm group1 sec_a_ppt
TRANSCRIPT
SUBMITTED BY: GROUP 1UM14004 Abinash MallickUM14001 Abhijeet DashUM14024 Esha EpsitaUM14025 Tarakshewar RaoUM14029 Krishna KumariUM14032 Kundan MohapatraUM14036 Nitika BaraliaUM14038 Padmalaya MallickUM14037 Goutam Prasad RaoUM14056 Sukanya Dash
Employee Satisfaction
OBJECTIVE
OBJECTIVE
To gather information on employee satisfaction in an organization.
This survey focuses on how employees feel about their job description, position
within the company, relationships with colleagues and superiors, advancement
opportunities and overall satisfaction.
METHODOLOGY
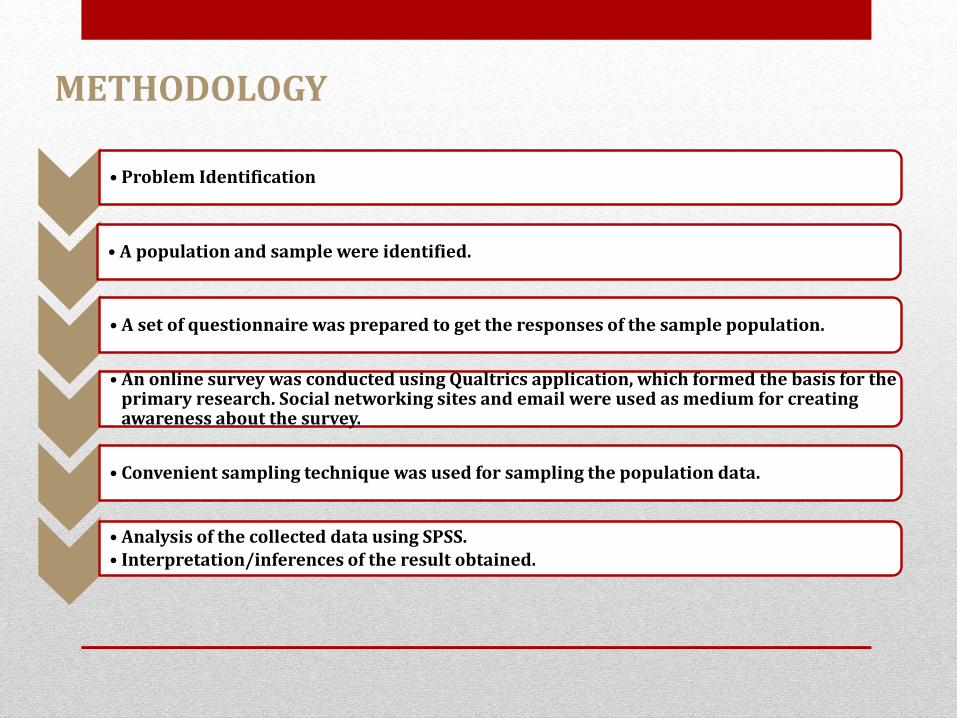
• Problem Identification
• A population and sample were identified.
• A set of questionnaire was prepared to get the responses of the sample population.
• An online survey was conducted using Qualtrics application, which formed the basis for the primary research. Social networking sites and email were used as medium for creating awareness about the survey.
• Convenient sampling technique was used for sampling the population data.
• Analysis of the collected data using SPSS.• Interpretation/inferences of the result obtained.
A priori Reasoning
An employee’s job satisfaction quotient depends on factors
such as job description, position within the company,
relationships with colleagues and superiors, future
prospects and overall satisfaction.
All these variables which contribute to the overall
satisfaction of an employee can define one particular
construct.
HYPOTHESIS
Ho: Income level and employee satisfaction are not
dependent
H1: Income level and employee satisfaction are dependent
ANALYSIS
The following analysis was carried out on the data collected using SPSS package.
Univariate Analysis on the demographic variables
Bivariate Analysis – Linear Regression
Multivariate AnalysisMultiple RegressionFactor Analysis of the Likert Scale dataCluster Analysis of the demographic variables
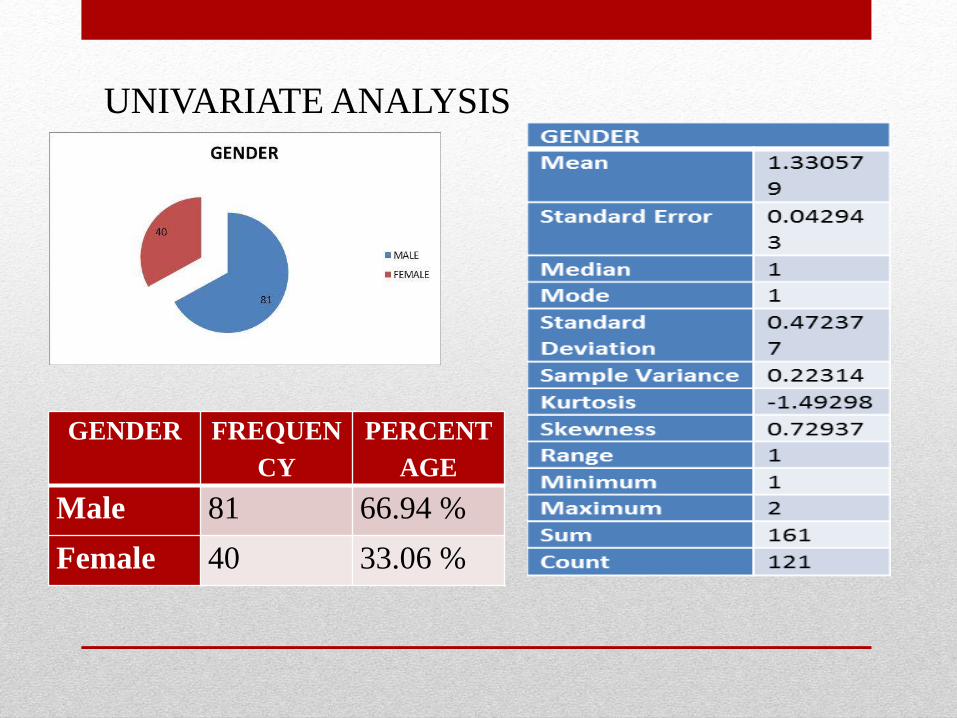
UNIVARIATE ANALYSIS
GENDER FREQUEN
CY
PERCENT
AGE
Male 81 66.94 %
Female 40 33.06 %
44
77
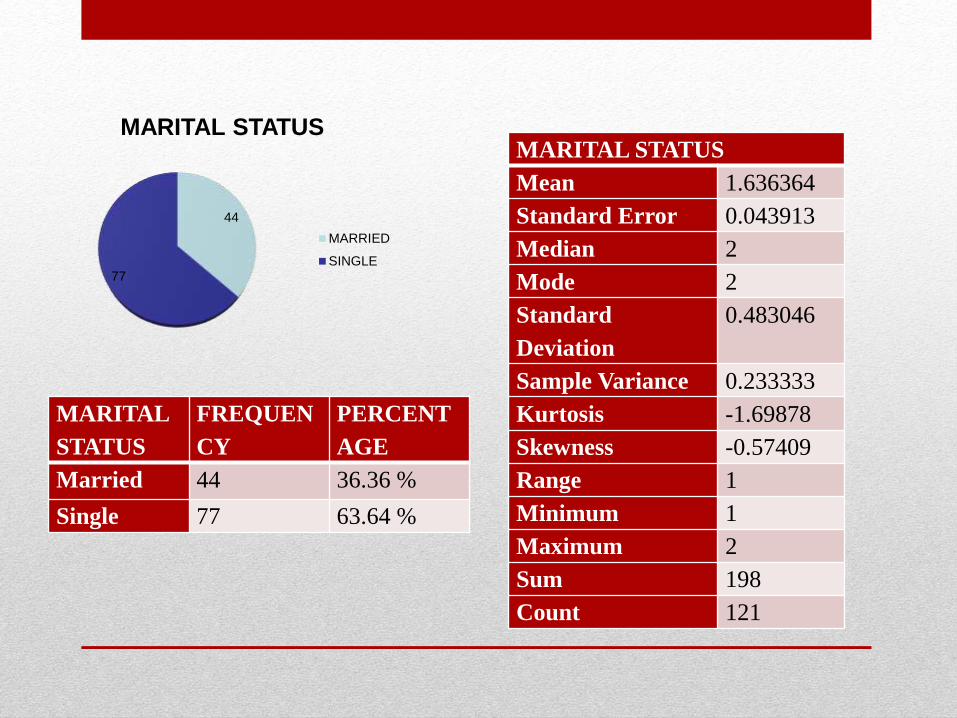
MARITAL STATUS
MARRIED
SINGLE
MARITAL
STATUS
FREQUEN
CY
PERCENT
AGE
Married 44 36.36 %
Single 77 63.64 %
MARITAL STATUS
Mean 1.636364
Standard Error 0.043913
Median 2
Mode 2
Standard
Deviation
0.483046
Sample Variance 0.233333
Kurtosis -1.69878
Skewness -0.57409
Range 1
Minimum 1
Maximum 2
Sum 198
Count 121
85
21
105
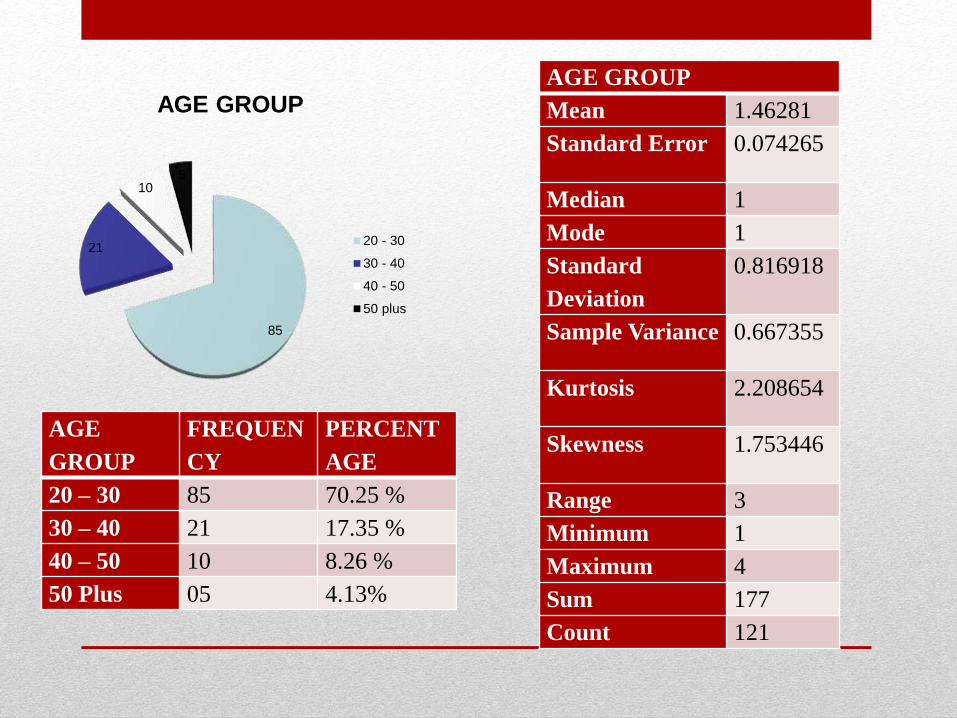
AGE GROUP
20 - 30
30 - 40
40 - 50
50 plus
AGE
GROUP
FREQUEN
CY
PERCENT
AGE
20 – 30 85 70.25 %
30 – 40 21 17.35 %
40 – 50 10 8.26 %
50 Plus 05 4.13%
AGE GROUP
Mean 1.46281
Standard Error 0.074265
Median 1
Mode 1
Standard
Deviation
0.816918
Sample Variance 0.667355
Kurtosis 2.208654
Skewness 1.753446
Range 3
Minimum 1
Maximum 4
Sum 177
Count 121
31
45
28
107
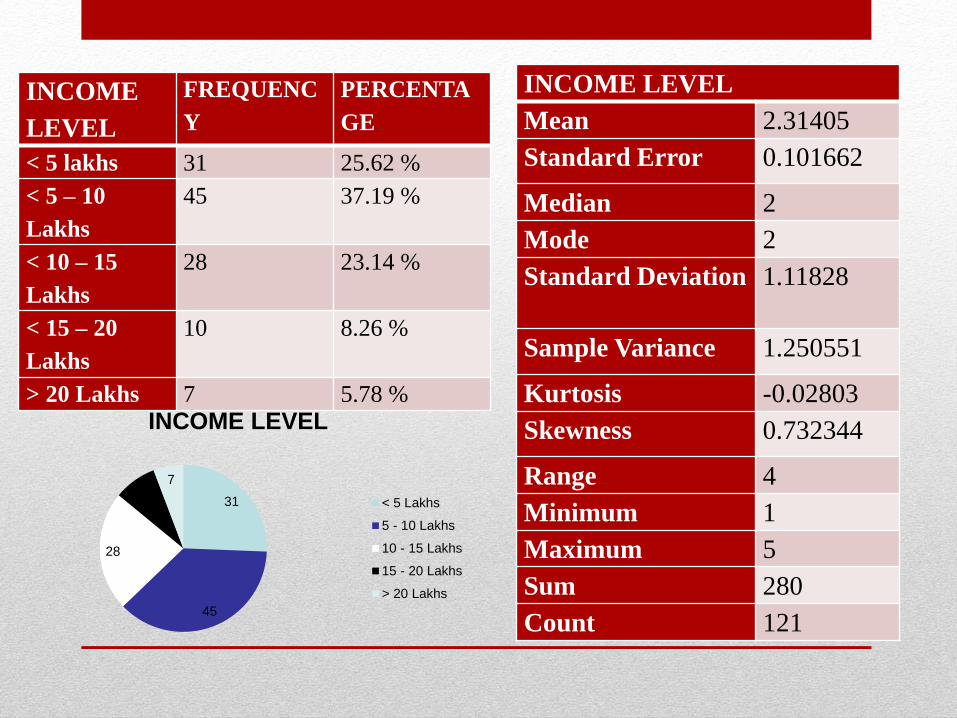
INCOME LEVEL
< 5 Lakhs
5 - 10 Lakhs
10 - 15 Lakhs
15 - 20 Lakhs
> 20 Lakhs
INCOME
LEVEL
FREQUENC
Y
PERCENTA
GE
< 5 lakhs 31 25.62 %
< 5 – 10
Lakhs
45 37.19 %
< 10 – 15
Lakhs
28 23.14 %
< 15 – 20
Lakhs
10 8.26 %
> 20 Lakhs 7 5.78 %
INCOME LEVEL
Mean 2.31405
Standard Error 0.101662
Median 2
Mode 2
Standard Deviation 1.11828
Sample Variance 1.250551
Kurtosis -0.02803
Skewness 0.732344
Range 4
Minimum 1
Maximum 5
Sum 280
Count 121
5
23
3715
18
14
9
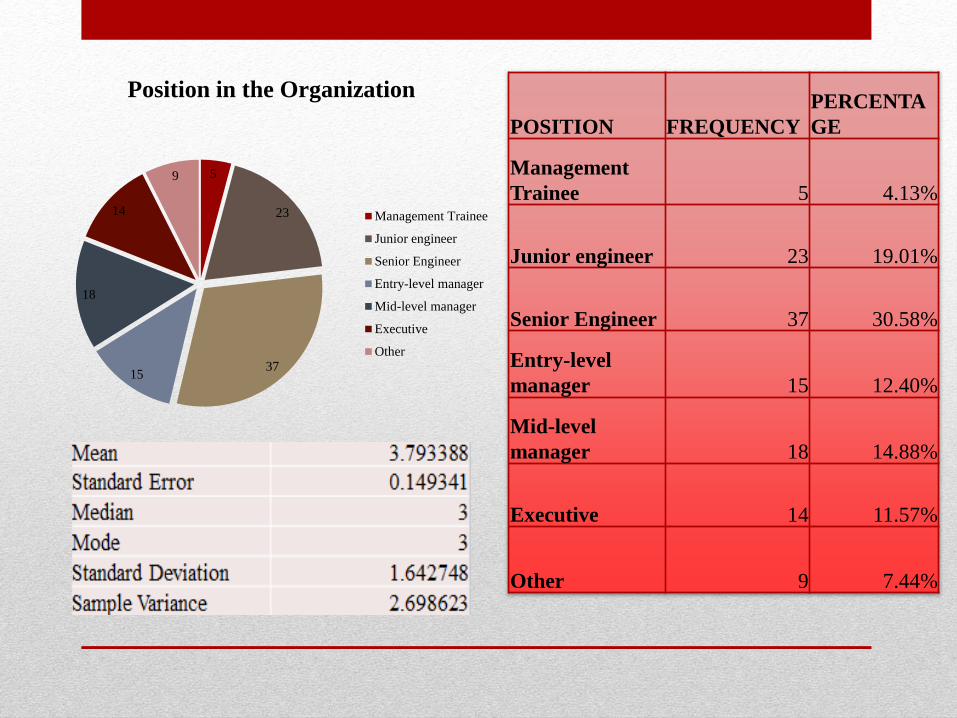
Position in the Organization
Management Trainee
Junior engineer
Senior Engineer
Entry-level manager
Mid-level manager
Executive
Other
POSITION FREQUENCY
PERCENTA
GE
Management
Trainee 5 4.13%
Junior engineer 23 19.01%
Senior Engineer 37 30.58%
Entry-level
manager 15 12.40%
Mid-level
manager 18 14.88%
Executive 14 11.57%
Other 9 7.44%
29
14
3
786
54
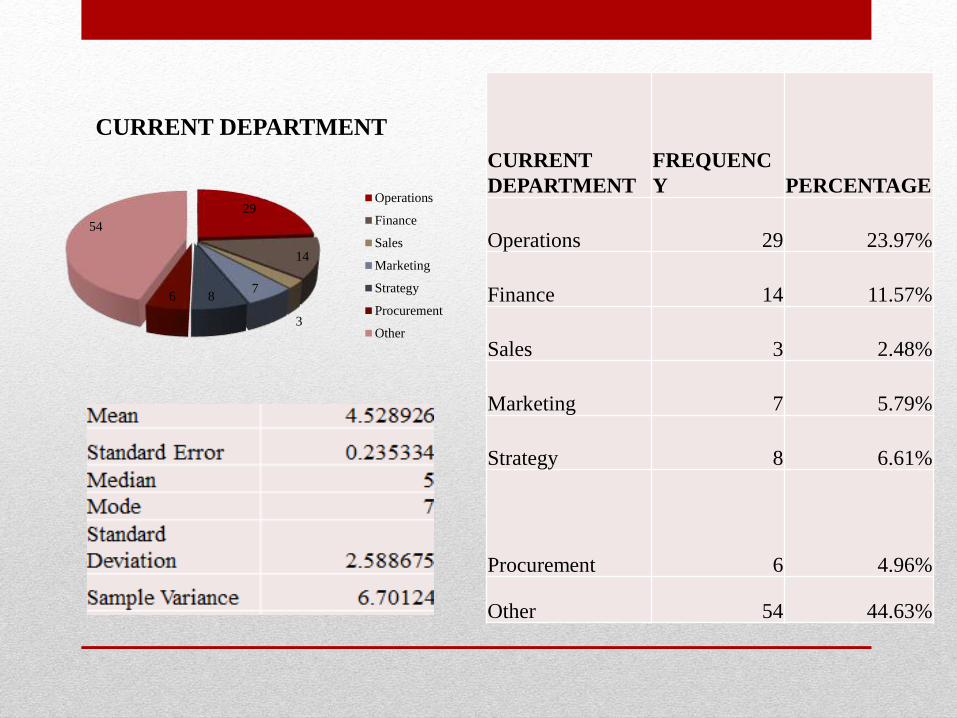
CURRENT DEPARTMENT
Operations
Finance
Sales
Marketing
Strategy
Procurement
Other
CURRENT
DEPARTMENT
FREQUENC
Y PERCENTAGE
Operations 29 23.97%
Finance 14 11.57%
Sales 3 2.48%
Marketing 7 5.79%
Strategy 8 6.61%
Procurement 6 4.96%
Other 54 44.63%
0
5
10
15
20
25
30
35
40
45
50
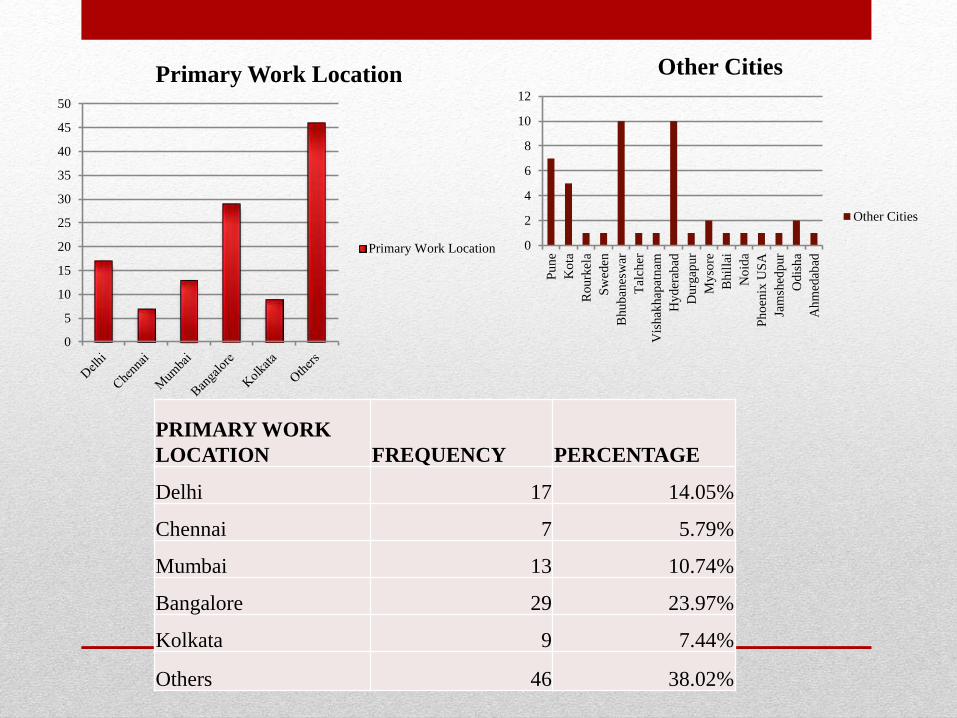
Primary Work Location
Primary Work Location 0
2
4
6
8
10
12
Pu
ne
Ko
ta
Rou
rkel
a
Sw
eden
Bhu
ban
esw
ar
Tal
cher
Vis
hak
hap
atnam
Hy
der
abad
Du
rgap
ur
My
sore
Bhil
lai
No
ida
Ph
oen
ix U
SA
Jam
shed
pur
Od
ish
a
Ah
med
abad
Other Cities
Other Cities
PRIMARY WORK
LOCATION FREQUENCY PERCENTAGE
Delhi 17 14.05%
Chennai 7 5.79%
Mumbai 13 10.74%
Bangalore 29 23.97%
Kolkata 9 7.44%
Others 46 38.02%
16
64
24
17
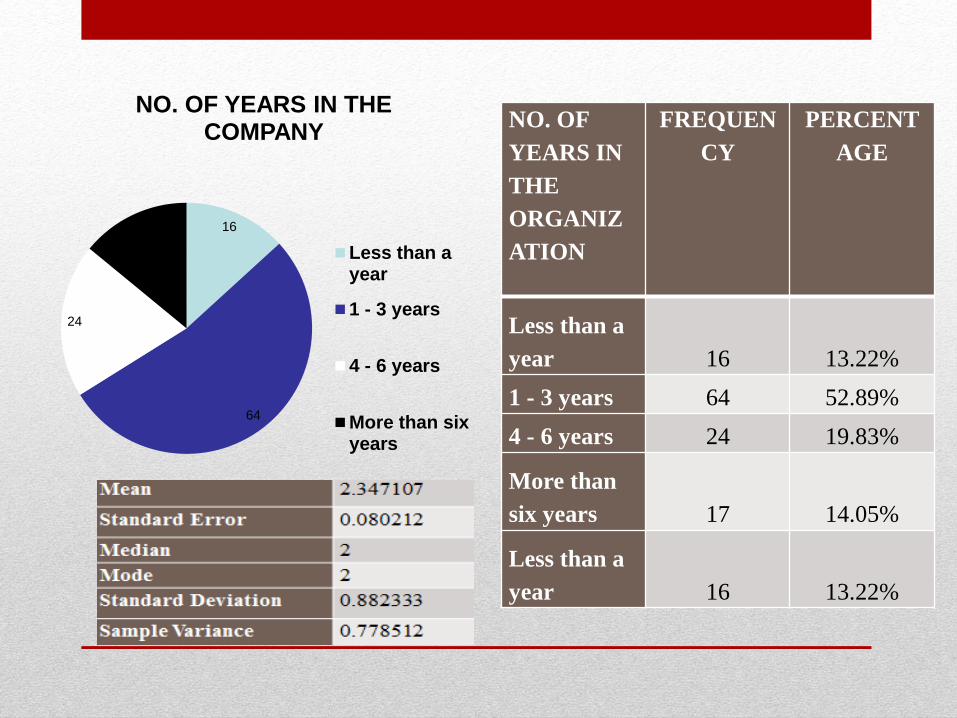
NO. OF YEARS IN THE COMPANY
Less than ayear
1 - 3 years
4 - 6 years
More than sixyears
NO. OF
YEARS IN
THE
ORGANIZ
ATION
FREQUEN
CY
PERCENT
AGE
Less than a
year 16 13.22%
1 - 3 years 64 52.89%
4 - 6 years 24 19.83%
More than
six years 17 14.05%
Less than a
year 16 13.22%
11
24
2147
18
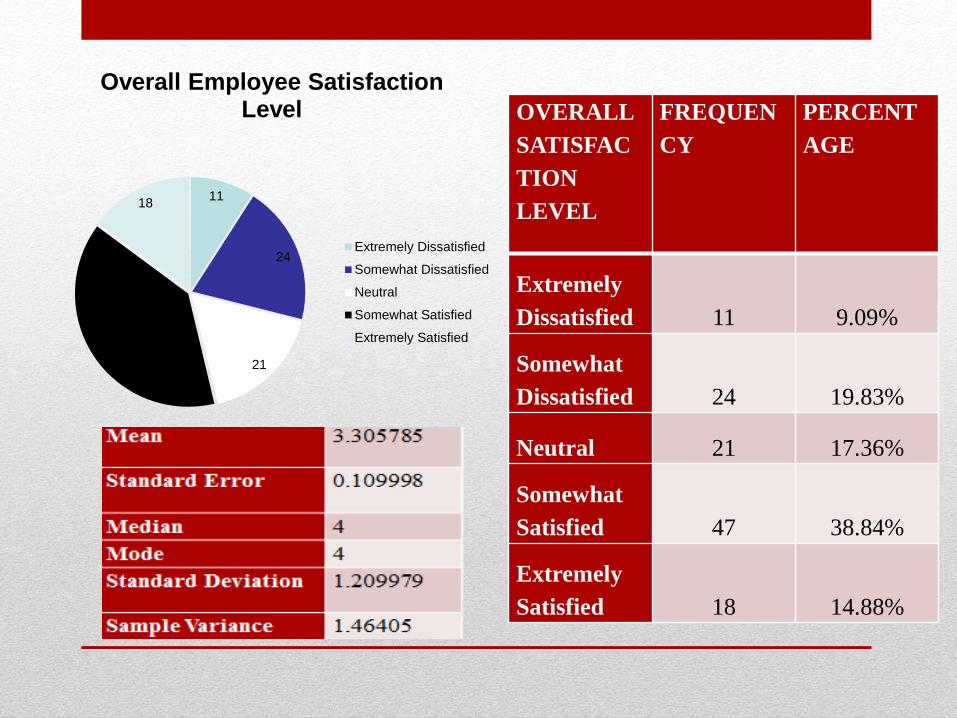
Overall Employee Satisfaction Level
Extremely Dissatisfied
Somewhat Dissatisfied
Neutral
Somewhat Satisfied
Extremely Satisfied
OVERALL
SATISFAC
TION
LEVEL
FREQUEN
CY
PERCENT
AGE
Extremely
Dissatisfied 11 9.09%
Somewhat
Dissatisfied 24 19.83%
Neutral 21 17.36%
Somewhat
Satisfied 47 38.84%
Extremely
Satisfied 18 14.88%
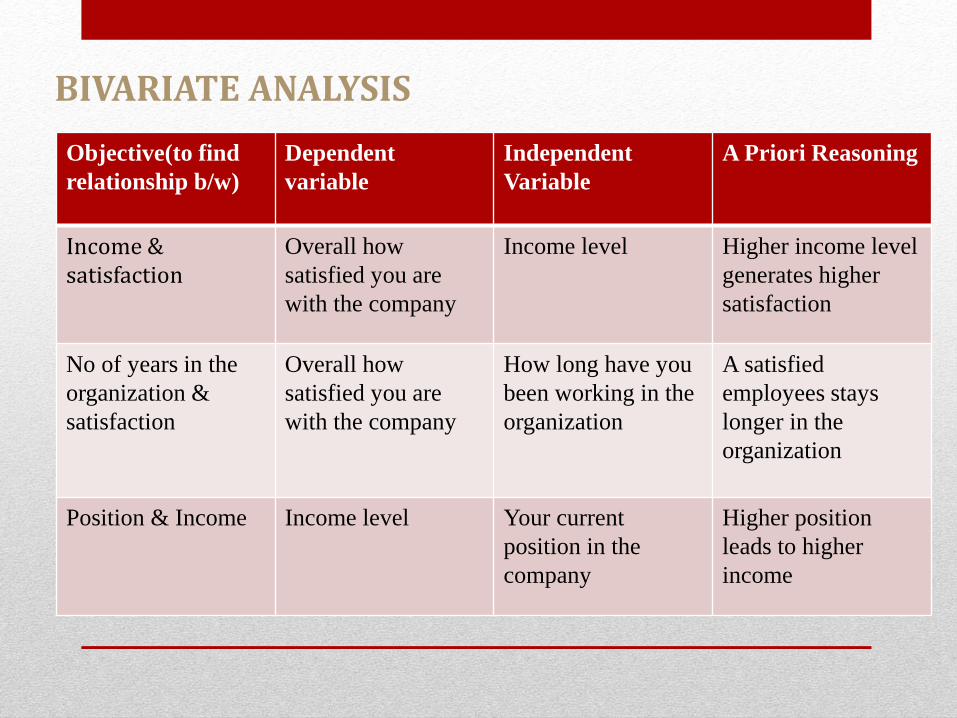
BIVARIATE ANALYSIS
Objective(to find
relationship b/w)
Dependent
variable
Independent
Variable
A Priori Reasoning
Income & satisfaction
Overall how
satisfied you are
with the company
Income level Higher income level
generates higher
satisfaction
No of years in the
organization &
satisfaction
Overall how
satisfied you are
with the company
How long have you
been working in the
organization
A satisfied
employees stays
longer in the
organization
Position & Income Income level Your current
position in the
company
Higher position
leads to higher
income

BIVARIATE ANALYSIS
HYPOTHESIS
Null Hypothesis: There is no relationship between income level and satisfaction.
Alternative Hypothesis: There is a relationship between income level and satisfaction.
Income & satisfaction
BIVARIATE ANALYSIS
HYPOTHESIS
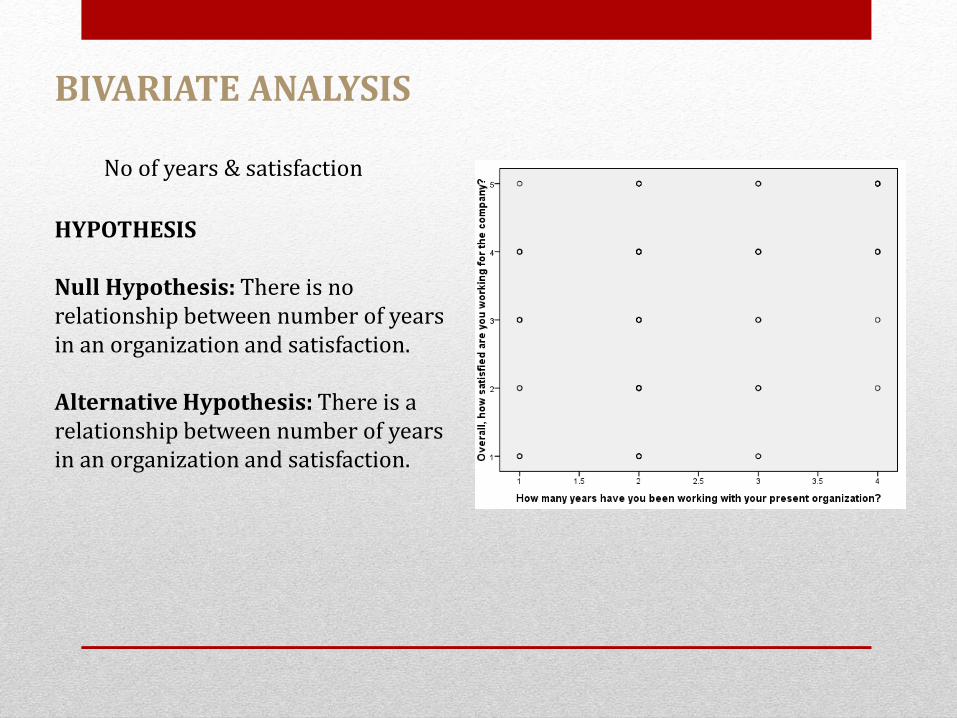
Null Hypothesis: There is no relationship between number of years in an organization and satisfaction.
Alternative Hypothesis: There is a relationship between number of years in an organization and satisfaction.
No of years & satisfaction

BIVARIATE ANALYSIS
HYPOTHESIS
Null Hypothesis: There is no relationship between income level and position.
Alternative Hypothesis: There is a relationship between income level and position.
Income & position
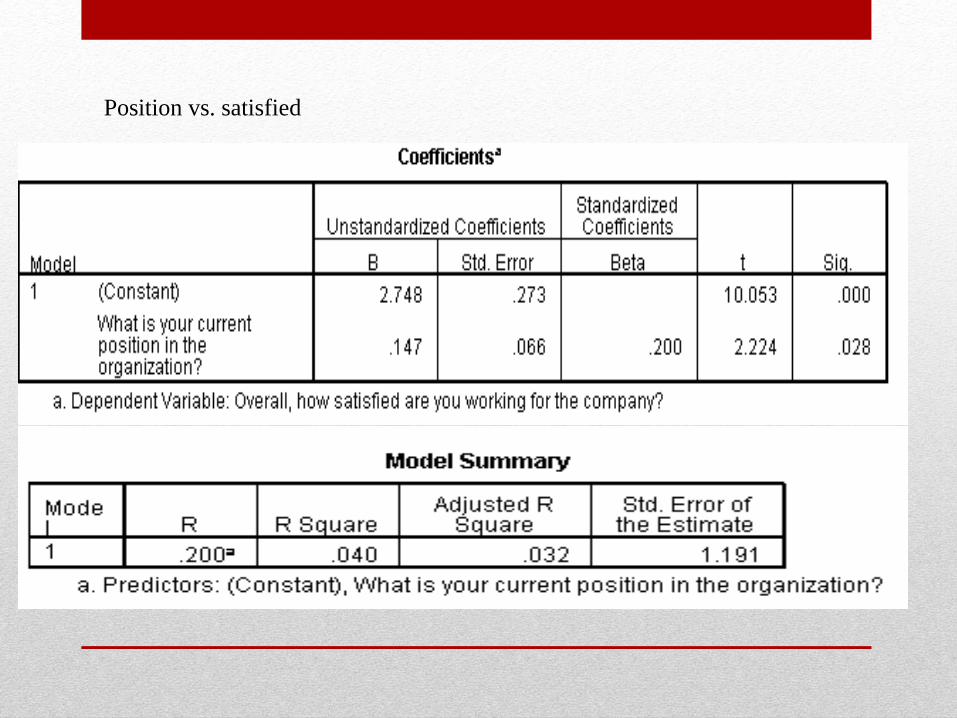
Position vs. satisfied
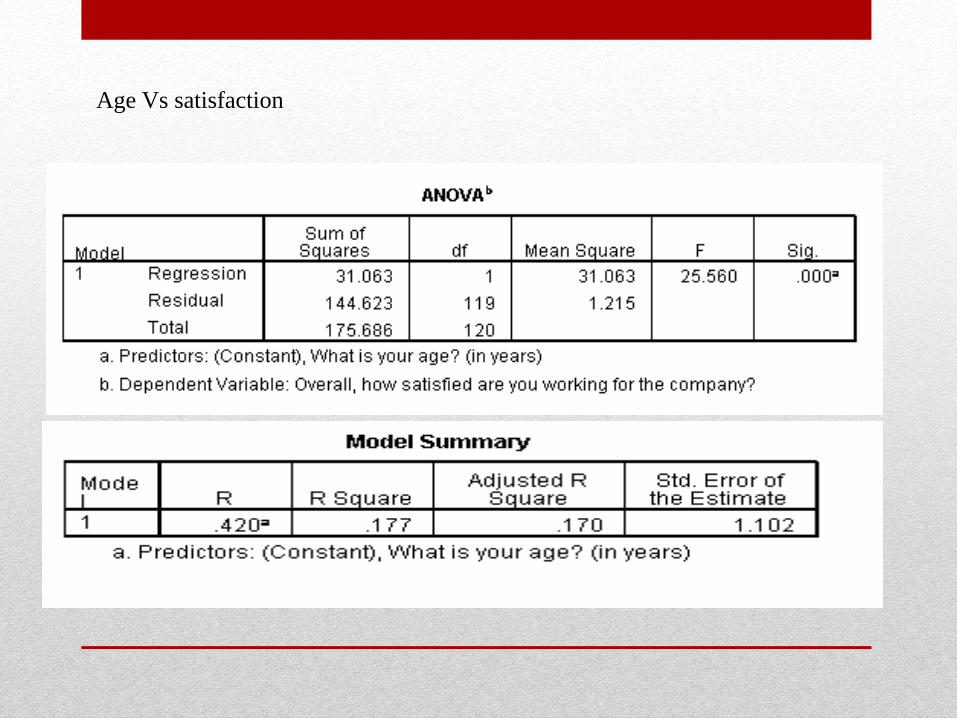
Age Vs satisfaction
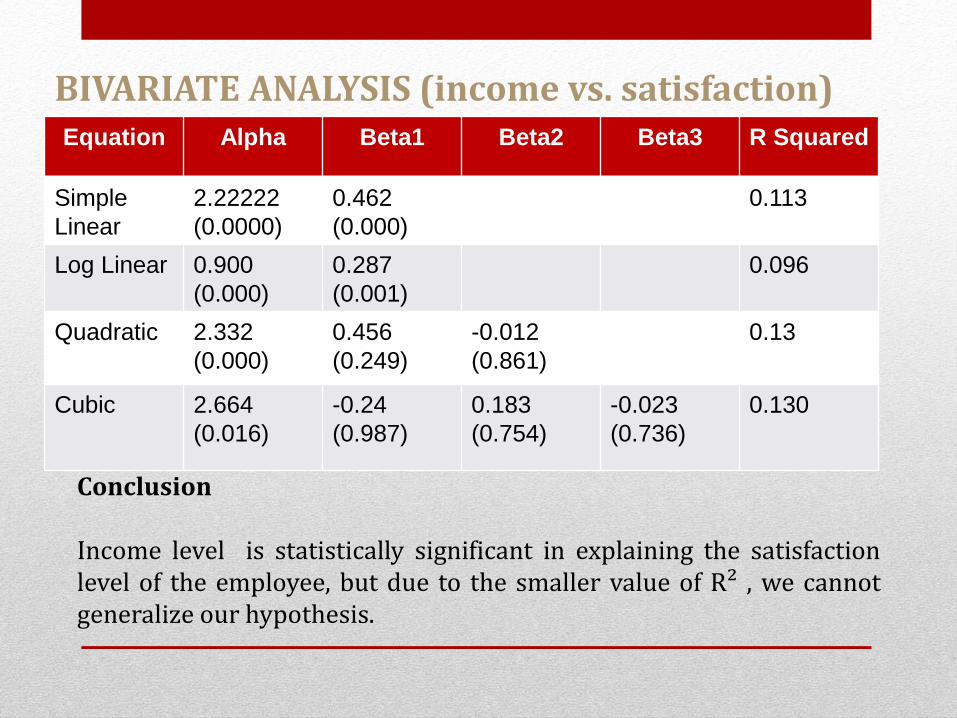
BIVARIATE ANALYSIS (income vs. satisfaction)
Conclusion
Income level is statistically significant in explaining the satisfactionlevel of the employee, but due to the smaller value of R² , we cannotgeneralize our hypothesis.
Equation Alpha Beta1 Beta2 Beta3 R Squared
Simple
Linear
2.22222
(0.0000)
0.462
(0.000)
0.113
Log Linear 0.900
(0.000)
0.287
(0.001)
0.096
Quadratic 2.332
(0.000)
0.456
(0.249)
-0.012
(0.861)
0.13
Cubic 2.664
(0.016)
-0.24
(0.987)
0.183
(0.754)
-0.023
(0.736)
0.130
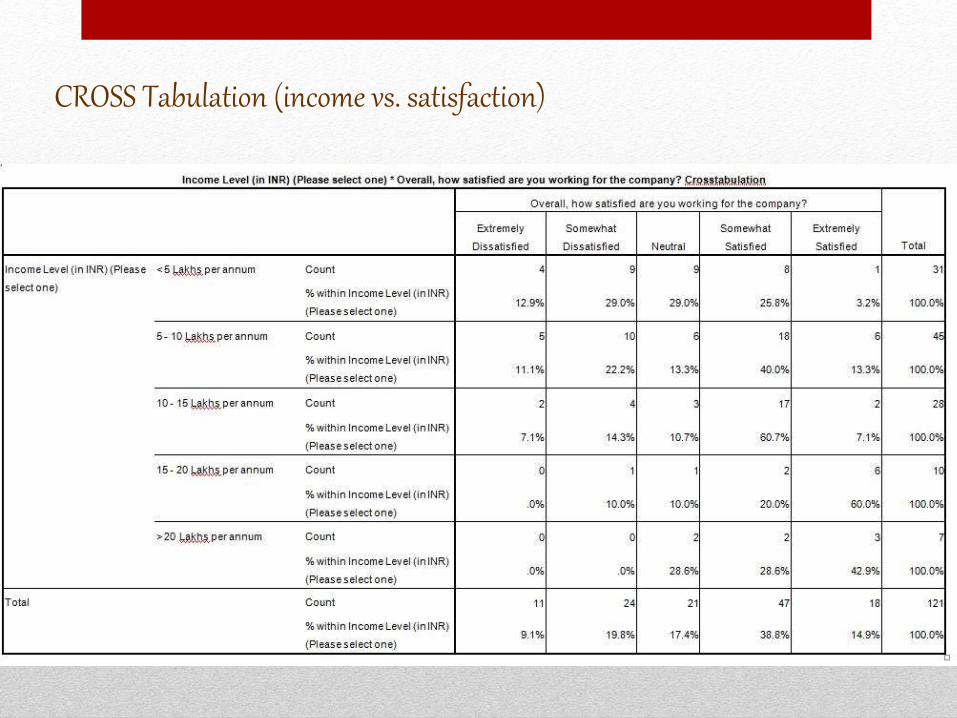
CROSS Tabulation (income vs. satisfaction)
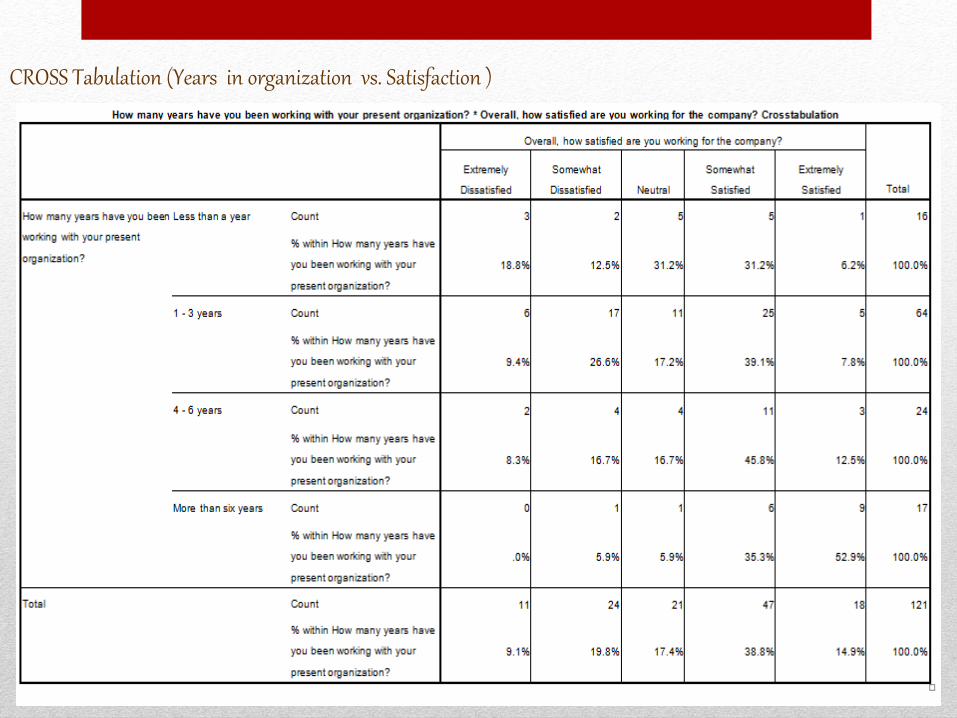
CROSS Tabulation (Years in organization vs. Satisfaction )
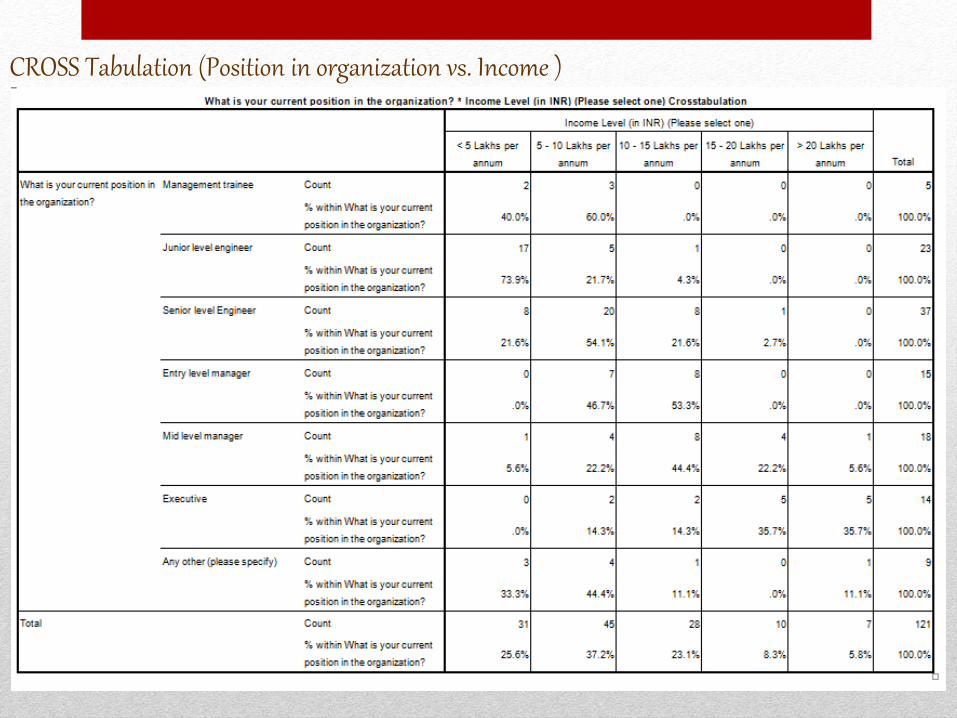
CROSS Tabulation (Position in organization vs. Income )
MULTIPLE REGRESSION
OBJECTIVE
To find a relationship of the overall employee satisfaction with gender, age group, income level, no. of years working in the organization, appraisal process involvement, and degree of freedom
A PRIORI REASONING
•As income level increases ,employee satisfaction level increases.•People working for more number of years in an organization having transparent appraisal process and when given optimum degree of freedom, tend to be more satisfied.
MULTIPLE REGRESSION
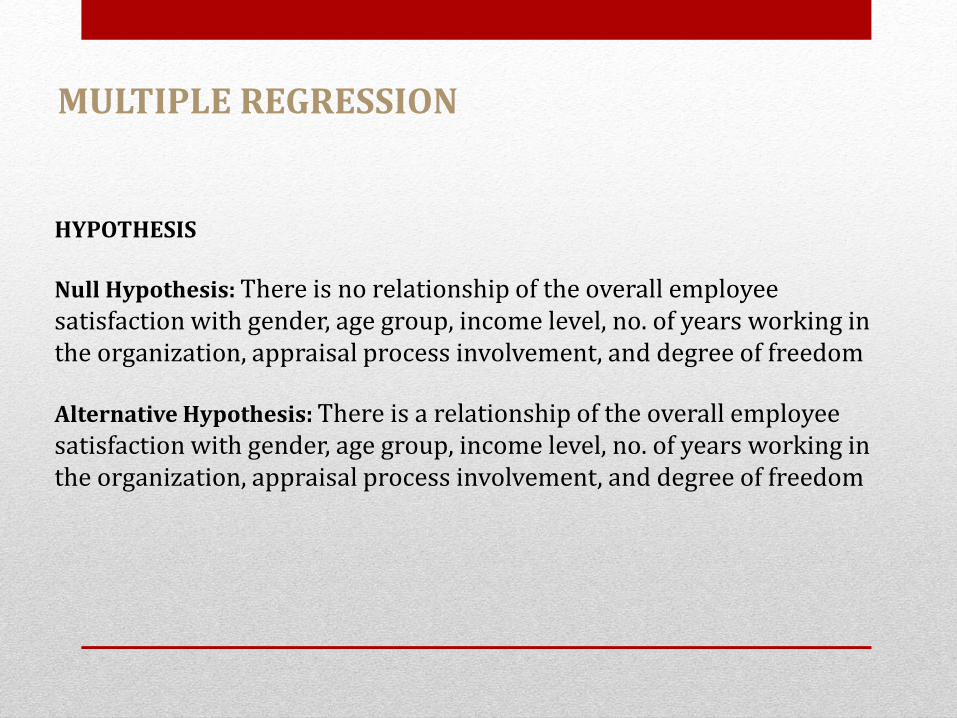
HYPOTHESIS
Null Hypothesis: There is no relationship of the overall employee satisfaction with gender, age group, income level, no. of years working in the organization, appraisal process involvement, and degree of freedom
Alternative Hypothesis: There is a relationship of the overall employee satisfaction with gender, age group, income level, no. of years working in the organization, appraisal process involvement, and degree of freedom
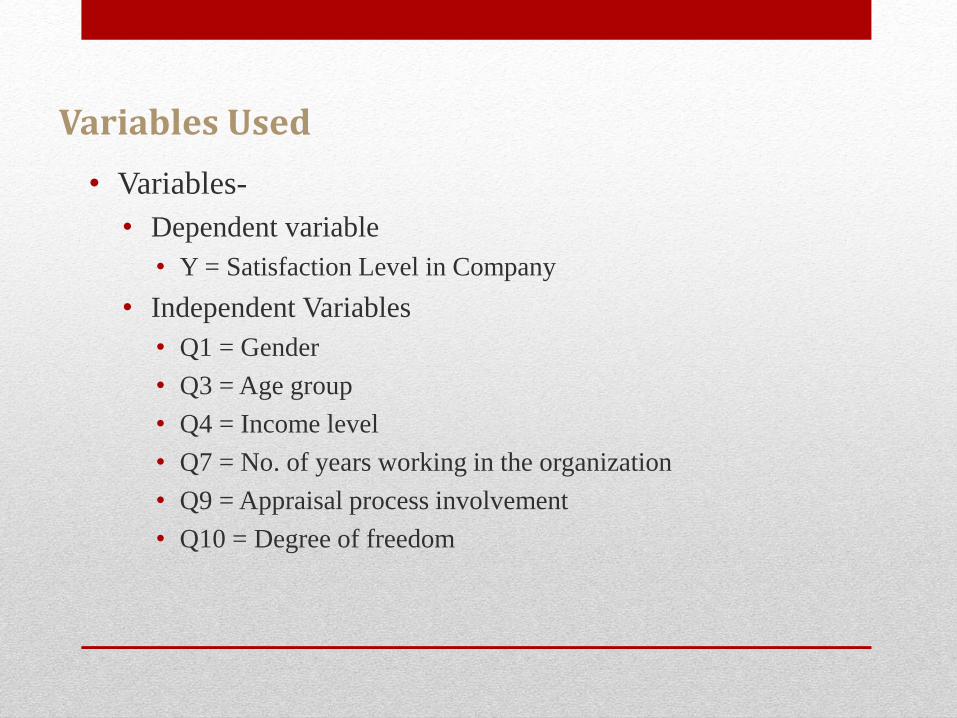
Variables Used
• Variables-
• Dependent variable
• Y = Satisfaction Level in Company
• Independent Variables
• Q1 = Gender
• Q3 = Age group
• Q4 = Income level
• Q7 = No. of years working in the organization
• Q9 = Appraisal process involvement
• Q10 = Degree of freedom
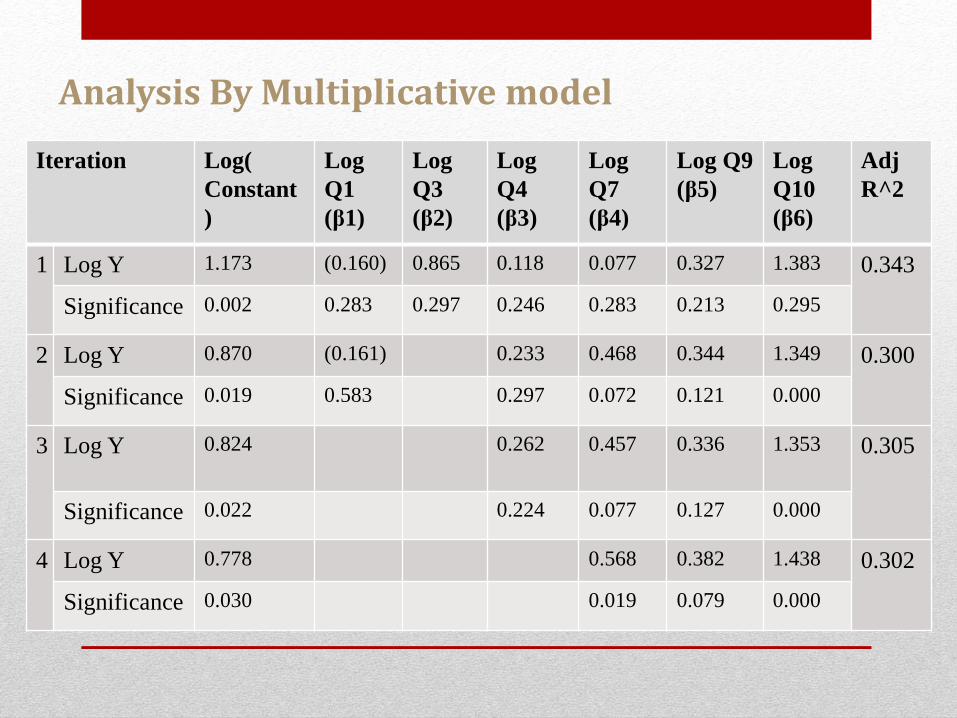
Analysis By Multiplicative model
Iteration Log(
Constant
)
Log
Q1
(β1)
Log
Q3
(β2)
Log
Q4
(β3)
Log
Q7
(β4)
Log Q9
(β5)
Log
Q10
(β6)
Adj
R^2
1 Log Y 1.173 (0.160) 0.865 0.118 0.077 0.327 1.383 0.343
Significance 0.002 0.283 0.297 0.246 0.283 0.213 0.295
2 Log Y 0.870 (0.161) 0.233 0.468 0.344 1.349 0.300
Significance 0.019 0.583 0.297 0.072 0.121 0.000
3 Log Y 0.824 0.262 0.457 0.336 1.353 0.305
Significance 0.022 0.224 0.077 0.127 0.000
4 Log Y 0.778 0.568 0.382 1.438 0.302
Significance 0.030 0.019 0.079 0.000
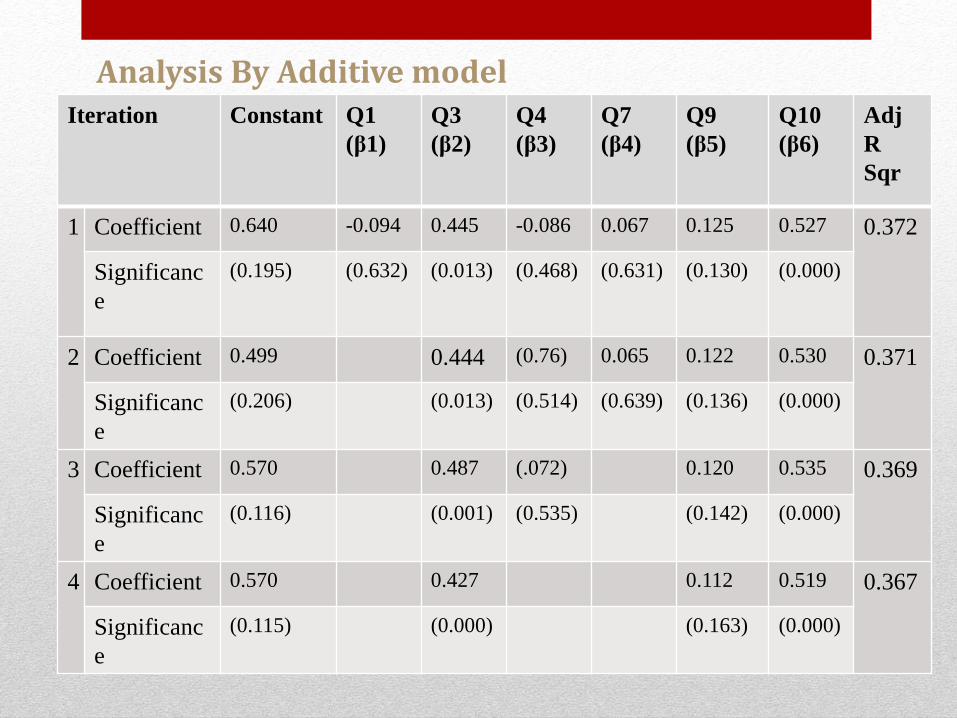
Analysis By Additive modelIteration Constant Q1
(β1)
Q3
(β2)
Q4
(β3)
Q7
(β4)
Q9
(β5)
Q10
(β6)
Adj
R
Sqr
1 Coefficient 0.640 -0.094 0.445 -0.086 0.067 0.125 0.527 0.372
Significanc
e
(0.195) (0.632) (0.013) (0.468) (0.631) (0.130) (0.000)
2 Coefficient 0.499 0.444 (0.76) 0.065 0.122 0.530 0.371
Significanc
e
(0.206) (0.013) (0.514) (0.639) (0.136) (0.000)
3 Coefficient 0.570 0.487 (.072) 0.120 0.535 0.369
Significanc
e
(0.116) (0.001) (0.535) (0.142) (0.000)
4 Coefficient 0.570 0.427 0.112 0.519 0.367
Significanc
e
(0.115) (0.000) (0.163) (0.000)
MULTIPLE REGRESSION
CONCLUSION
Income level and degree of freedom provided by superiors in idea generation are statistically significant in explaining the overall satisfaction level of employees.
However, since the R2 value is not that high there are various other factors which help in explaining the overall satisfaction level of employees.
FACTOR ANALYSIS
• To analyze the different factors that influence the
satisfaction level of an employee in an organization
• To use the factor analysis as a data reduction technique to
group the different manifest variables into constructs and
thus find out the “Factors responsible for satisfaction
level of an employee working in an organization ”
A PRIORI REASONING
• Factor analysis is used to measure various latent variables
that can be measured by multiple observable variables
• The observable variables are
• Proper communication in the company
• Opportunities in the job
• Relations with the supervisor
• Overall facilities available in the company
• These variables are used to measure the overall
satisfaction of the employee
DATA COLLECTION
• Data was collected with the help of a questionnaire where
the responses from the respondents were recorded in a
likert scale (from 1-5)
• Total of 120 responses collected have been tabulated in
excel along with their coded values.
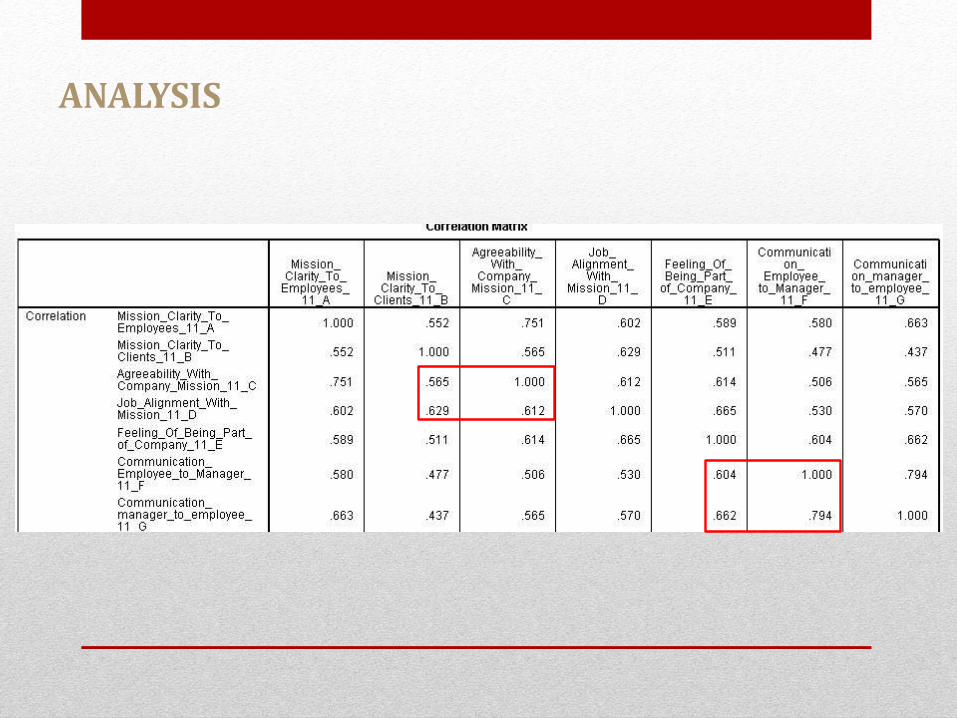
ANALYSIS
• All factor analysis techniques try to clump subgroups of variables together based upon their
correlations and often you can get a feel for what factors are going just by looking at the correlation
matrix and spotting clusters of high correlations between groups of variables
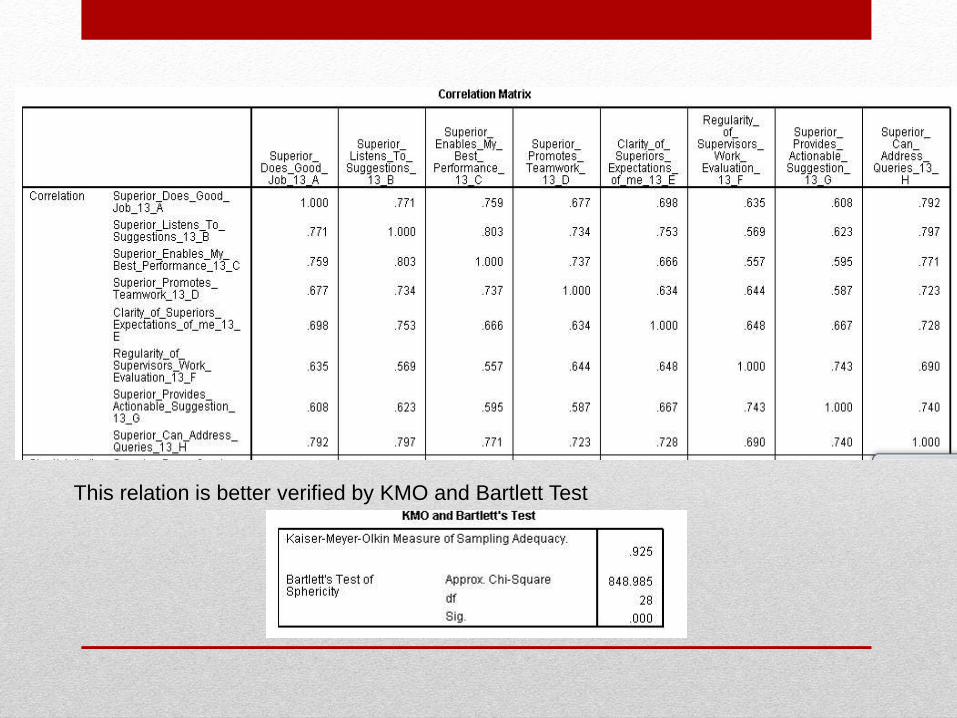
• Here we have four likert table data
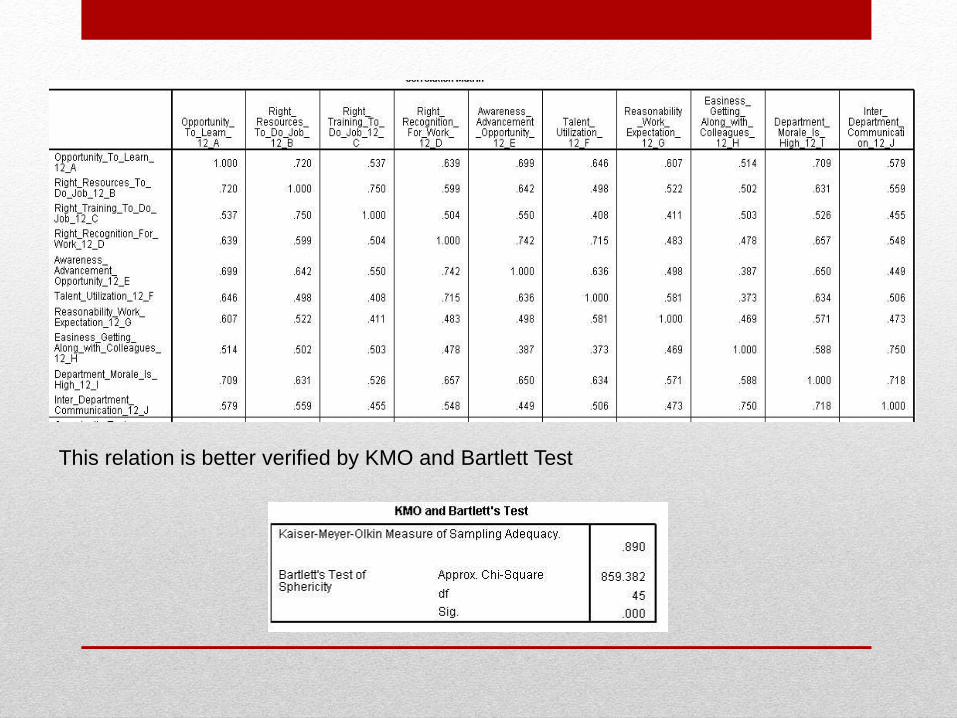
• In the first case we have the latent variable of proper communication in the company
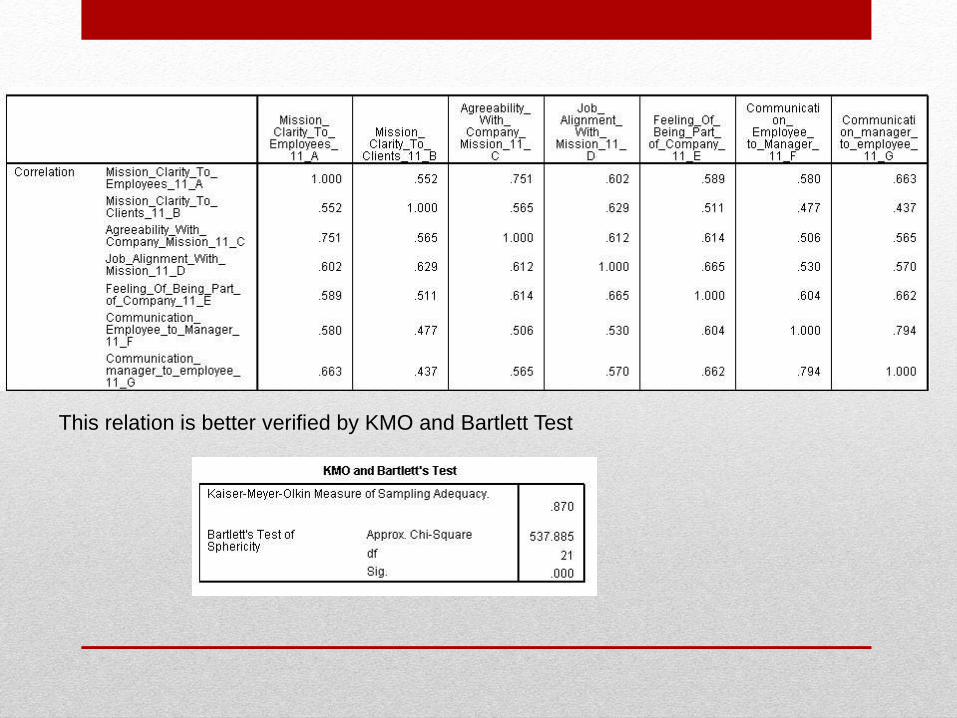
This relation is better verified by KMO and Bartlett Test
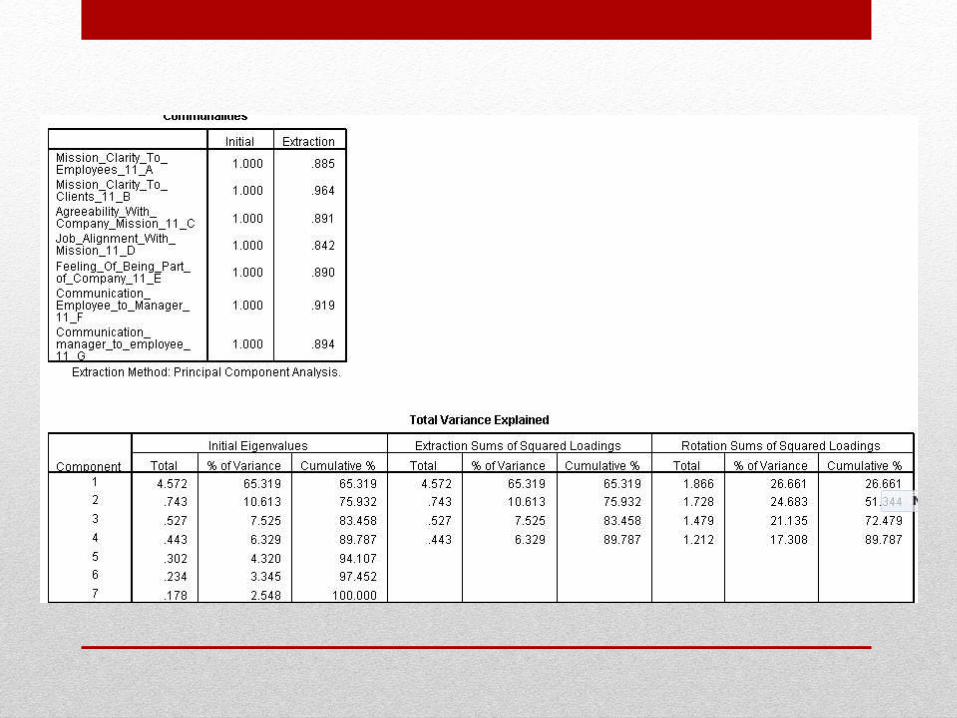
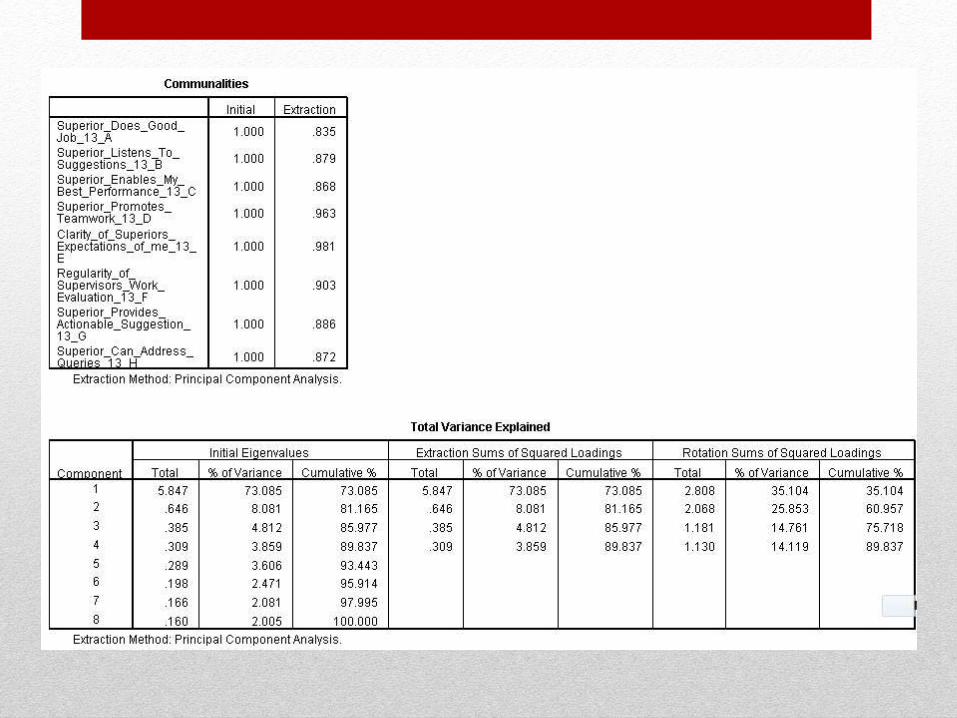
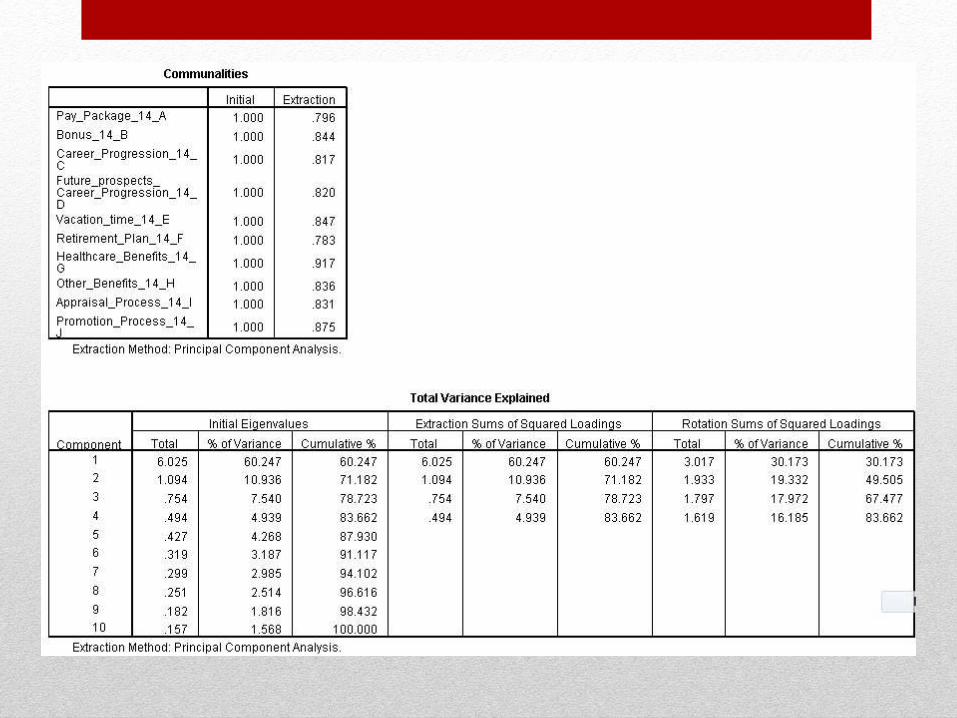
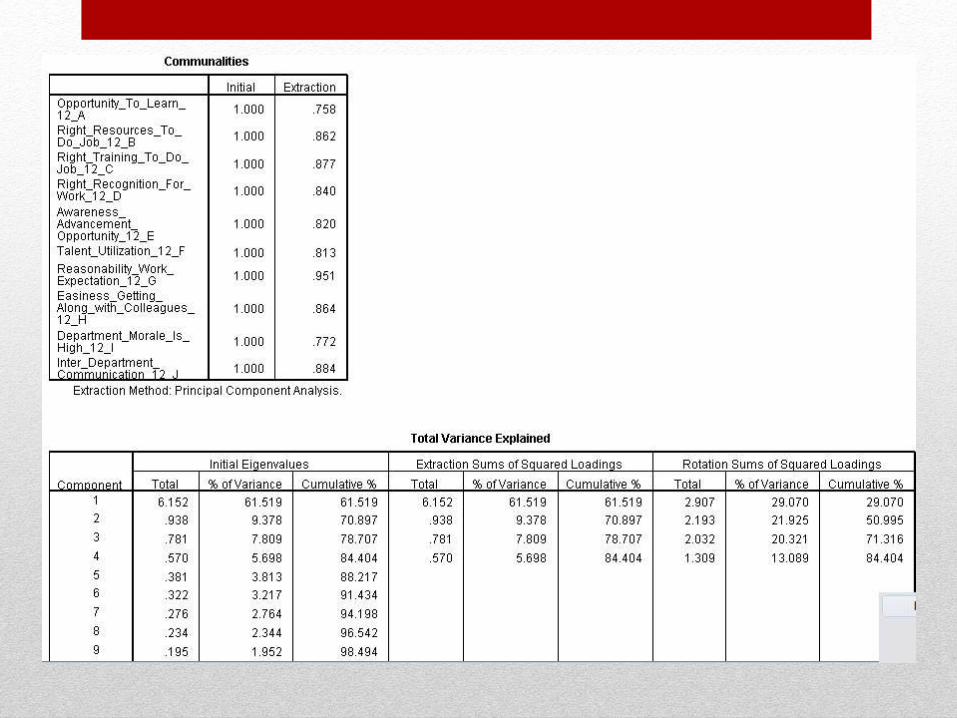
• Factor loading, communalities and total variance explained
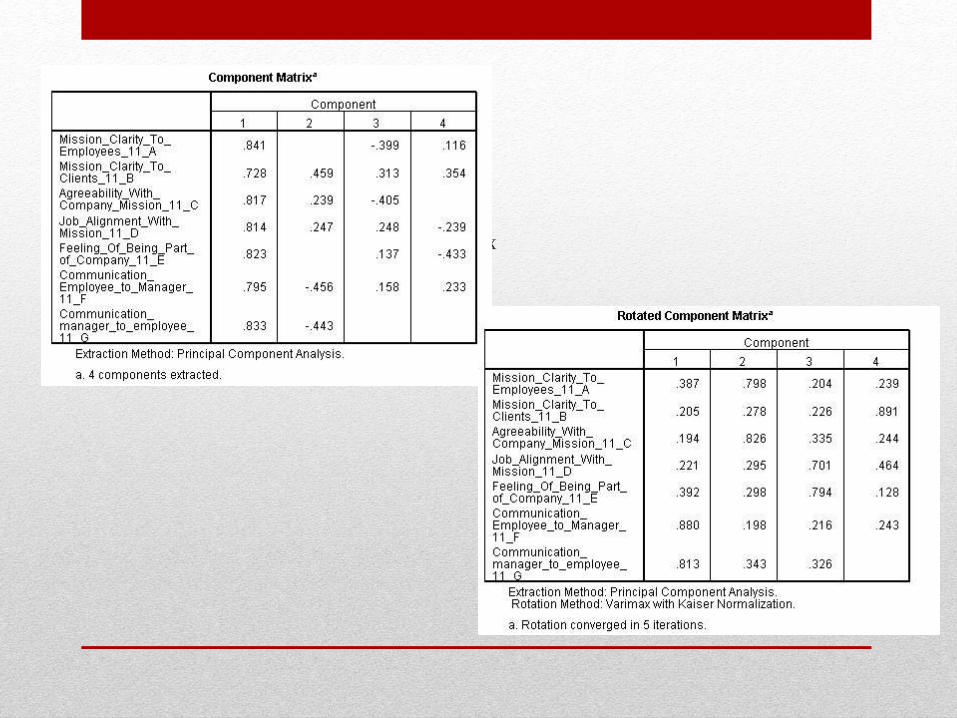
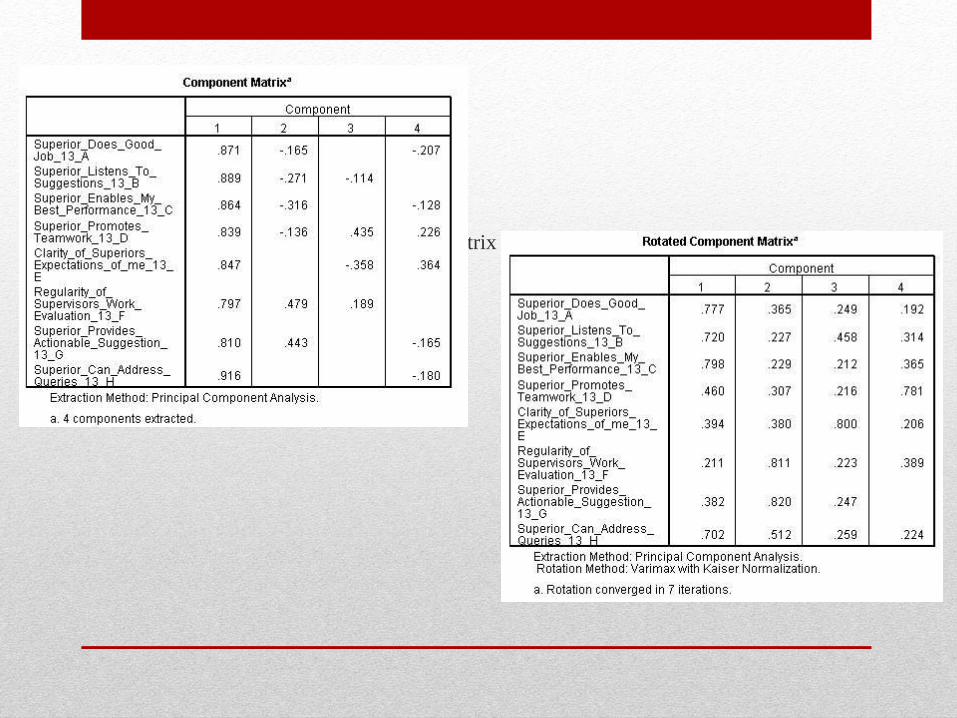
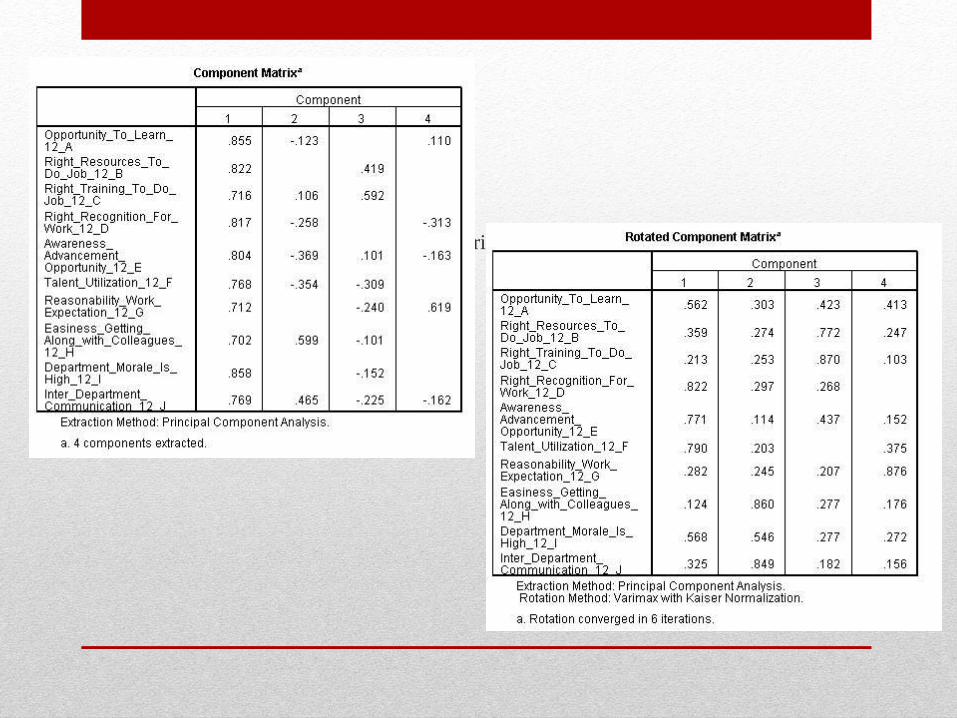
Component Matrix and Rotated Component Matrix
• Here we have four likert table data
• In the second case we have the latent variable of relations with the supervisor
This relation is better verified by KMO and Bartlett Test
• Factor loading, communalities and total variance explained
Component Matrix and Rotated Component Matrix
• Here we have four likert table data
• In the third case we have the latent variable of overall facilities available in the company
This relation is better verified by KMO and Bartlett Test
• Factor loading, communalities and total variance explained

Component Matrix and Rotated Component Matrix
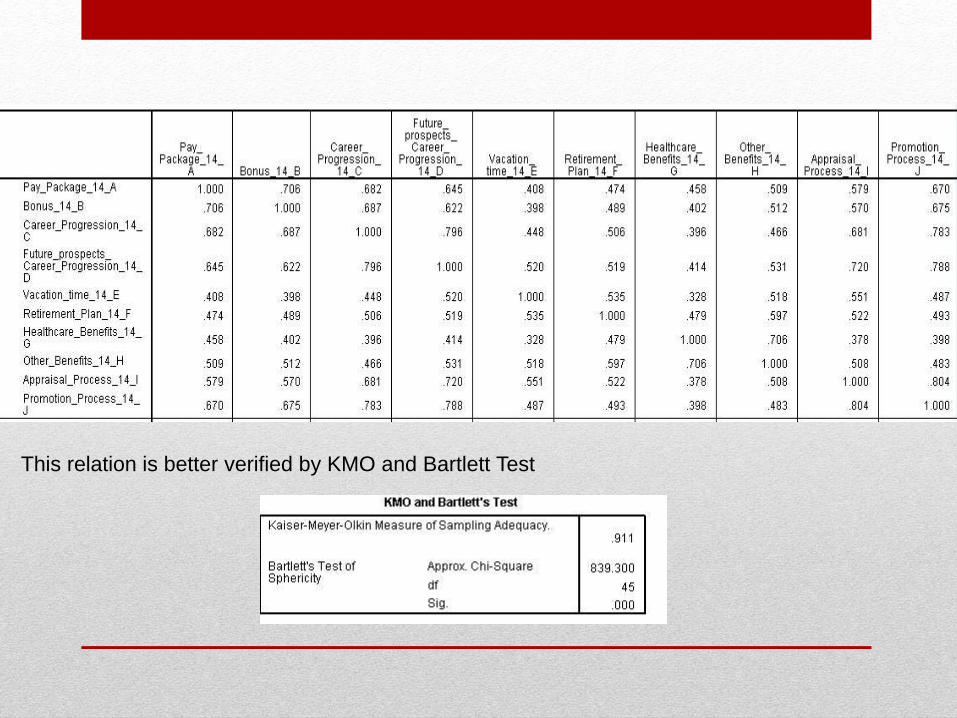
• Here we have four likert table data
• In the fourth case we have the latent variable of opportunities in the job
This relation is better verified by KMO and Bartlett Test
• Factor loading, communalities and total variance explained
Component Matrix and Rotated Component Matrix
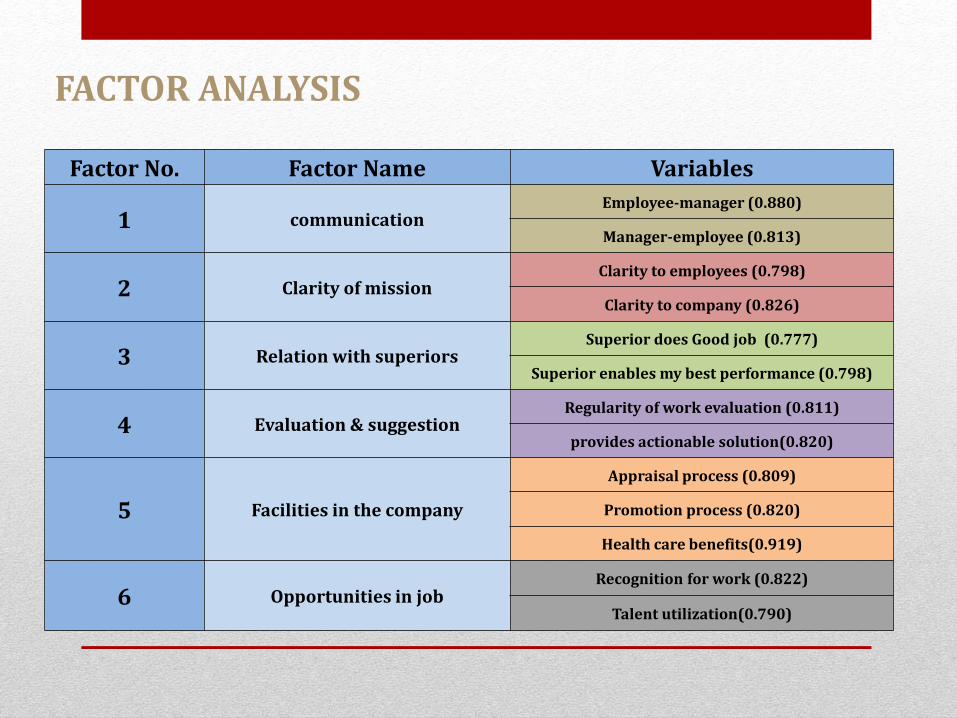
FACTOR ANALYSIS
Factor No. Factor Name Variables
1 communicationEmployee-manager (0.880)
Manager-employee (0.813)
2 Clarity of missionClarity to employees (0.798)
Clarity to company (0.826)
3 Relation with superiorsSuperior does Good job (0.777)
Superior enables my best performance (0.798)
4 Evaluation & suggestionRegularity of work evaluation (0.811)
provides actionable solution(0.820)
5 Facilities in the company
Appraisal process (0.809)
Promotion process (0.820)
Health care benefits(0.919)
6 Opportunities in jobRecognition for work (0.822)
Talent utilization(0.790)
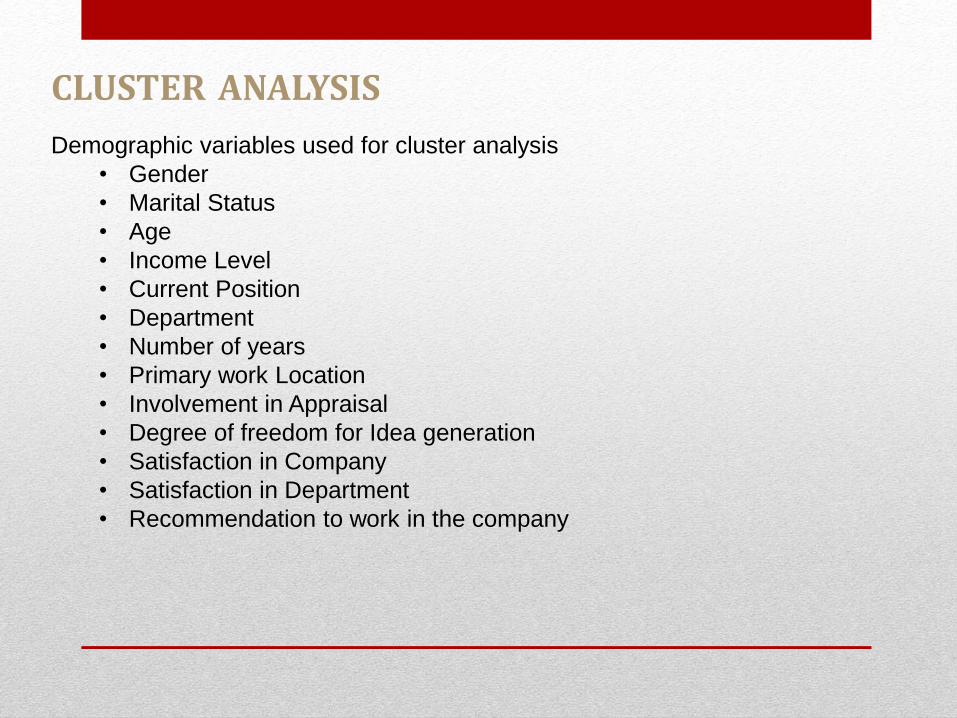
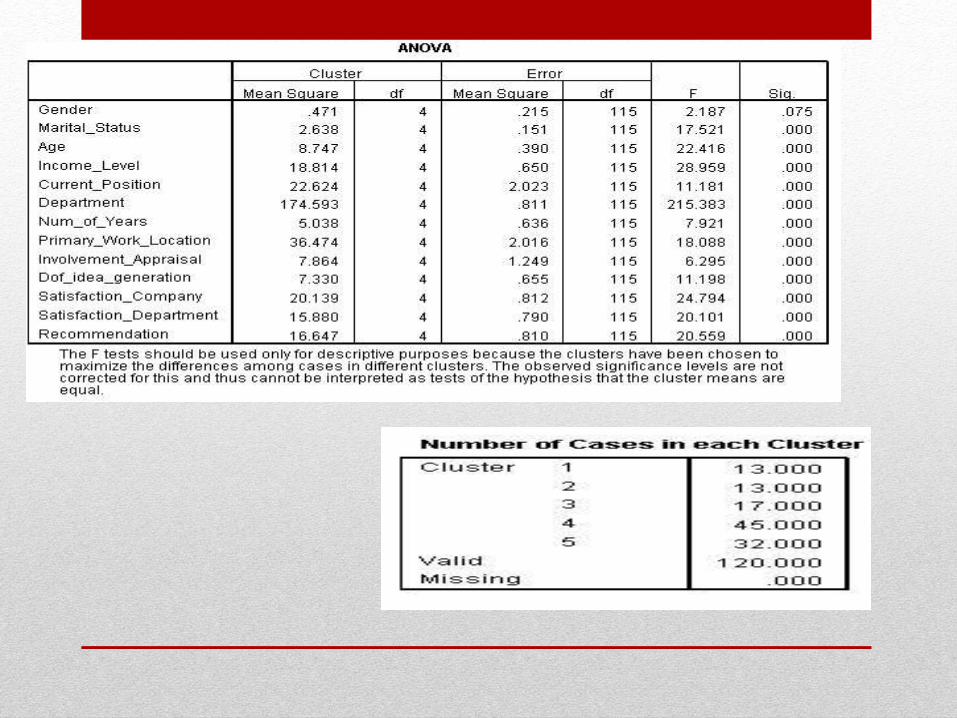
CLUSTER ANALYSIS
Demographic variables used for cluster analysis
• Gender
• Marital Status
• Age
• Income Level
• Current Position
• Department
• Number of years
• Primary work Location
• Involvement in Appraisal
• Degree of freedom for Idea generation
• Satisfaction in Company
• Satisfaction in Department
• Recommendation to work in the company

Cluster Centers
CONCLUSION
As observed from different analysis, the satisfaction level of employees changes is very much influenced by their income and degree of freedom provided for idea generation. Apart from that age group, position, the function they perform also play a vital role.

THANK YOU