srs%20walking%20curriculumoptimized
DESCRIPTION
http://walkboston.org/sites/default/files/SRS%20Walking%20CurriculumOPTIMIZED.pdfTRANSCRIPT

T S O C OO O
www.erg.comwalkBoston
Walking for Health & theE n v i ro n m e n t
C u r r i c u l u m
SatisfiesMassachusettsCurriculumFrameworks s t a n d a rd s
K–5 lessons in Health, Math,Social Studies &S c i e n c e /Te c h n o l o g y
Teaches children to connect walking,health and the environment
15 hands-on print & Internetlesson plans
www.walkboston.org


Safe Routes to SchoolsWalking for Health & theEnvironment Curriculum
for Massachusetts Elementary School Te a c h e r s
walkBostonwww.walkboston.org www.erg.com

D I S C LA I M E RThe information in this document has been funded by the U.S. Environmental ProtectionAgency under Grant #97112401 to WalkBoston. The document may not necessarilyreflect the views of the Agency and no official endorsement should be inferred.
©2005 Wa l k B o s t o n

Acknowledgmentsiii
This curriculum was developed by WalkBoston and Eastern Research Group, Inc. (ERG) through a Healthy Communitiesgrant from the U.S. Environmental Protection Agency Region 1.
WalkBoston is a nonprofit advocacy organization whose mission is to raise public awareness about the benefits of walk-ing for transportation, health, recreation, and vital communities. Since 2000, when WalkBoston introduced the first com-prehensive Safe Routes to Schools (SRS) program in New England, the organization has offered SRS programs in themetro Boston area. WalkBoston advocates for statewide Massachusetts Safe Routes to Schools programs.
Eastern Research Group is a national consulting firm that specializes in environmental communications and services.ERG creates enriching educational programs for schoolchildren and adults and develops publications, presentations,websites, and scientific and economic analyses on a wide range of environmental and public health topics.
This curriculum was developed by:
Don Eunson, SRS Program Manager Linda Stein, Curriculum DeveloperWendy Landman, Executive Director Eastern Research Group, Inc.Wa l k B o s t o n 110 Hartwell Av e n u eOld City Hall Lexington, MA 0242145 School StreetBoston, MA 02108
Many thanks to the busy school teachers who reviewed and strengthened this curriculum: Jane Cox (Scituate), MartyFarlow (Brookline), Jenny Helmick (Beverly Farms), and Joellyn Nevins (Littleton). Thanks also to Ian Todreas of EasternResearch Group for helping us launch this project.
Acknowledgments


Table of Contentsv
Teachers’ Guide . . . . . . . . . . . . . . . . . . . . . . . . . . . . . . . . . . . . . . . . . . . . . . . . . . . . . . . . . . . . . . . . . . . . . 1Alignment with MA Curriculum Frameworks . . . . . . . . . . . . . . . . . . . . . . . . . . . . . . . . . . . . . . . . . . . . . . . . . . . . . . . . . . . 3
Lesson Plans: Grades K-2Now You See It, Now You Don’t . . . . . . . . . . . . . . . . . . . . . . . . . . . . . . . . . . . . . . . . . . . . . . . . . . . . . . . . . . . . . . . . . . . . 9
Particle Pollution: How Dirty Is the Air We Breathe? . . . . . . . . . . . . . . . . . . . . . . . . . . . . . . . . . . . . . . . . . . . . . . . . . . . 1 5
Milkweed Polka Dots . . . . . . . . . . . . . . . . . . . . . . . . . . . . . . . . . . . . . . . . . . . . . . . . . . . . . . . . . . . . . . . . . . . . . . . . . . . . 1 9
What Color is My Air To d a y ? . . . . . . . . . . . . . . . . . . . . . . . . . . . . . . . . . . . . . . . . . . . . . . . . . . . . . . . . . . . . . . . . . . . . . . 2 3
Smog City (for Grades K-2) . . . . . . . . . . . . . . . . . . . . . . . . . . . . . . . . . . . . . . . . . . . . . . . . . . . . . . . . . . . . . . . . . . . . . . . . 3 3
Lesson Plans: Grades 3-5Breathing and Exercise . . . . . . . . . . . . . . . . . . . . . . . . . . . . . . . . . . . . . . . . . . . . . . . . . . . . . . . . . . . . . . . . . . . . . . . . . . . 4 3
Heart Rate and Exercise . . . . . . . . . . . . . . . . . . . . . . . . . . . . . . . . . . . . . . . . . . . . . . . . . . . . . . . . . . . . . . . . . . . . . . . . . . 4 9
Is the Air Good Where I Live? . . . . . . . . . . . . . . . . . . . . . . . . . . . . . . . . . . . . . . . . . . . . . . . . . . . . . . . . . . . . . . . . . . . . . . 5 5
Smog City (for Grades 3-5) . . . . . . . . . . . . . . . . . . . . . . . . . . . . . . . . . . . . . . . . . . . . . . . . . . . . . . . . . . . . . . . . . . . . . . . . 6 1
Traffic Ta l l y . . . . . . . . . . . . . . . . . . . . . . . . . . . . . . . . . . . . . . . . . . . . . . . . . . . . . . . . . . . . . . . . . . . . . . . . . . . . . . . . . . . 6 9
Too Many Blankets - #1. . . . . . . . . . . . . . . . . . . . . . . . . . . . . . . . . . . . . . . . . . . . . . . . . . . . . . . . . . . . . . . . . . . . . . . . . . . 8 3
Too Many Blankets - #2. . . . . . . . . . . . . . . . . . . . . . . . . . . . . . . . . . . . . . . . . . . . . . . . . . . . . . . . . . . . . . . . . . . . . . . . . . . 8 9
How Far Do You Walk At School? . . . . . . . . . . . . . . . . . . . . . . . . . . . . . . . . . . . . . . . . . . . . . . . . . . . . . . . . . . . . . . . . . . 9 5
How Much Pollution is that Car Producin’? . . . . . . . . . . . . . . . . . . . . . . . . . . . . . . . . . . . . . . . . . . . . . . . . . . . . . . . . . . 1 0 3
Walk Across Massachusetts. . . . . . . . . . . . . . . . . . . . . . . . . . . . . . . . . . . . . . . . . . . . . . . . . . . . . . . . . . . . . . . . . . . . . . 1 0 9
B i b l i o g r a p h y . . . . . . . . . . . . . . . . . . . . . . . . . . . . . . . . . . . . . . . . . . . . . . . . . . . . . . . . . . . . . . . . . . . . . . 1 1 7
= Internet activity
Table of Contents


1 Teachers’ Guide
Teachers’ Guide
To d a y, most children in the United States arrive at school by school bus or in their parents’ cars. But it wasn’talways this way, and children are not necessarily benefiting from these “easy” rides:
• The number of children walking or bicycling to school has dwindled in the last 30 years – walking has plummetedfrom 66 to 13 percent, and cycling has dropped 63 percent (Centers for Disease Control, 2000).
• Various sources estimate that as much as 20 to 30 percent of morning peak traffic volumes are caused by parentsdropping their children off at school.
• A major form of physical activity for children has all but disappeared. The percentage of children 6 to 11 who areoverweight has more than tripled in the last 30 years, and doubled for adolescents and preschoolers (Institute ofMedicine, 2004).
One way to reverse these trends is through Safe Routes to Schools (SRS) programs. Walking and bicycling to schoolcan help address the growing public health concern of obesity and result in better overall health. Walking and bicy-cling to school also help reduce traffic congestion, fuel consumption, and air pollution, with resulting public healthbenefits, as well as enhance vital community life. Finally, when students regularly walk or bicycle to school, theylearn about their communities, develop increased responsibility and independence, and arrive at school more alertand ready to learn.
PURPOSE OF THIS CURRICULU MThis curriculum was created for Massachusetts teachers who want to help children learn about the connectionsbetween walking, health, and environmental quality, whether or not their school is operating a walk-to-school pro-gram. The curriculum consists of fifteen hands-on, easy-to-implement lesson plans for Grades K-5. Each lessonmeets Massachusetts Curriculum Frameworks standards. The lessons typically meet several CurriculumFrameworks standards concurrently, such as Science, Math, Social Science, and Comprehensive Health.
The lessons encourage students to think about ways in which they, their families, and their communities can helpreduce traffic and associated air pollution through walking, bicycling, and using public transportation. The lessonshelp students see that walking is a fun and easy form of daily exercise that is good for their overall health.
The curriculum includes both classroom and out-of-class field activities, such as mapping routes from students’homes to their schools, creating a simple air pollution tester, and measuring breathing and heart rates before andafter physical activity. Many of the lessons are ideal for collaborative efforts among classroom teachers, physicaleducation teachers, and computer lab instructors. The curriculum includes ten lessons for Grades 3-5 and five les-sons for Grades K-2. These lessons have been reviewed by Massachusetts teachers and tested in classrooms – withoutstanding results! (See Teacher Comments on page 6.)
The table on pages 3-5 lists the lesson plans and the Massachusetts Curriculum Frameworks that each lessonmeets. Many of the lessons address several different curriculum areas. Specific Curriculum Frameworks learningstandards met are listed at the end of each lesson.

2Walking for Health & the Environment Curriculum
USING THIS CURRICULU MEach lesson plan in this curriculum contains the following lesson activity sections:
• Grade Level• Learning Objectives• Estimated Ti m e• S u m m a r y• Key Questions• B a c k g r o u n d
• M a t e r i a l s• S t e p s• A d a p t a t i o n• For Further Explanation• R e s o u r c e s / A c k n o w l e d g m e n t s• Massachusetts Curriculum Frameworks Standards
Background sections. The B a c k g r o u n d sections in each lesson provide teachers with key background informationneeded for conducting the lessons. These sections are written at a level that assists teachers in communicating rel-atively complex environmental and health concepts to students in easy-to-understand language.
Internet activities. Some of the lessons involve Internet access; these are identified as internet activities in the Ta b l eof Contents and in the M a t e r i a l s section of the lesson plans. We included Internet activities because many good les-son plans are now available on the Web, and because we anticipate that many schools and classrooms (or computerlabs) now have Internet access. In some cases, we included printed copies of key materials found on the Web whenthis might be helpful.
It may appear that some overlap exists within this curriculum, particularly regarding air pollution. However, each ofthe lessons has a different emphasis. For example, Is the Air Quality Good Where I Live? focuses on ozone formationand locations, while Smog City focuses on weather and human causes of smog/ozone. Milkweed Polka Dotsdescribes ozone damage to plants. Particle Pollution: How Dirty is the Air We Breathe? focuses on particle pollution(rather than ozone), while Now You See It, Now You Don’t highlights states of matter (gases, liquids, solids).
Recognizing that individual lessons may be photocopied and shared, each lesson plan also includes the followingstatement of purpose:
This curriculum teaches children about the benefits of walking to school and about how our health and environmentare connected to our transportation choices. Understanding these issues will help children make informed, positivechoices that are good for them, their communities, and our planet. We hope you and your students find this curricu-lum useful and fun.
We welcome feedback from you at any time for our future efforts. Please write: Safe Routes to Schools ProgramM a n a g e r, WalkBoston, Old City Hall, 45 School Street, Boston, MA 02108.
This Safe Routes to Schools Curriculum has two purposes: To teach elementary school students—in ways that are stimulating and relevant to their lives—how walking is good for their bodies and good for the environment, while alsohelping teachers satisfy the requirements of the Massachusetts Curriculum Frameworks.

3 Teachers’ Guide
Lessons and Their Alignment withMassachusetts Curriculum Frameworks*
Massachusetts Curriculum Frameworks
Comprehensive HealthScience and
Technology/ Engineering M a t h e m a t i c s
L e s s o n s :
Grades K-2:Now You See It, Now Yo uD o n ' t
• Personal and CommunityH e a l t h
• Earth and Space Science –Earth's Materials; We a t h e r
• Life Science – Characteristicsof Living Things; LivingThings and Their Environment
• Physical Sciences – States ofM a t t e r
• Appendix V: Historical andSocial Context
Particle Pollution: HowDirty Is the Air We Breathe?
• Personal and CommunityH e a l t h
• Earth and Space Science –Earth's Materials; We a t h e r
• Life Science – Characteristicsof Living Things; LivingThings and Their Environment
• Physical Sciences – States ofM a t t e r
• Te c h n o l o g y / E n g i n e e r i n g• Appendix V: Historical and
Social Context
Milkweed Polka Dots • Personal and CommunityH e a l t h
• Life Science – Characteristicsof Living Things; LivingThings and Their Environment
• Physical Sciences – States ofM a t t e r
• Appendix V: Historical andSocial Context
What Color Is My AirTo d a y ?
• Personal and CommunityH e a l t h
• Life Science – Characteristicsof Living Things; LivingThings and Their Environment
• Appendix V: Historical andSocial Context
• Number Sense andO p e r a t i o n s
• Patterns, Relations, andA l g e b r a
• Data Analysis, Statistics, andP r o b a b i l i t y
Smog City (K–2) • Personal and CommunityH e a l t h
• Earth and Space Science –Earth's Materials; We a t h e r
• Life Science – Characteristicsof Living Things; LivingThings and Their Environment
• Appendix V: Historical andSocial Context
*Note: Individual lessons list specific learning standards met.

Lessons and Their Alignment withMassachusetts Curriculum Frameworks* (Cont.)
4Walking for Health & the Environment Curriculum
Massachusetts Curriculum Frameworks
Comprehensive HealthScience and
Technology/ Engineering M a t h e m a t i c s
L e s s o n s :
Grades 3-5:Breathing and Exercise • Physical Health
• Personal and CommunityH e a l t h
Heart Rate and Exercise • Physical Health• Personal and Community
H e a l t h
Is the Air Good Where IL i v e ?
• Personal and CommunityH e a l t h
• Earth and Space Science –We a t h e r
• Life Science – Adaptations ofLiving Things
• Te c h n o l o g y /E n g i n e e r i n g
• Appendix V: Historical andSocial Context
• Patterns, Relations, andA l g e b r a
Smog City (3–5) • Personal and CommunityH e a l t h
• Earth and Space Science –We a t h e r
• Life Science – Adaptations ofLiving Things
Too Many Blankets – #1 • Personal and CommunityH e a l t h
• Earth and Space Science –We a t h e r
• Life Science – Adaptations ofLiving Things
• Te c h n o l o g y /E n g i n e e r i n g
• M e a s u r e m e n t
Too Many Blankets – #2 • Personal and CommunityH e a l t h
• Earth and Space Science –We a t h e r
• Life Science – Adaptations ofLiving Things
• Physical Sciences – LightE n e r g y
• Te c h n o l o g y /E n g i n e e r i n g
• Appendix V: Historical andSocial Context
How Far Do You Walk atS c h o o l ?
• Number Sense and Operation• M e a s u r e m e n t

5 Teachers’ Guide
Massachusetts Curriculum Frameworks
C o m p r e h e n s i v eH e a l t h
Science andTe c h n o l o g y /E n g i n e e r i n g M a t h e m a t i c s
History andSocial Science
L e s s o n s :
Grades 3-5:How Much PollutionIs That Car Producin'?
• Personal andCommunity Health
• Appendix V: Historicaland Social Context
• Number Sense andO p e r a t i o n
• MA and Its Cities andTo w n s
Traffic Ta l l y • Personal andCommunity Health
• Te c h n o l o g y /E n g i n e e r i n g
• Appendix V: Historicaland Social Context
• Number Sense andO p e r a t i o n s
• Patterns, Relations,and Algebra
• M e a s u r e m e n t• Data Analysis,
Statistics, andP r o b a b i l i t y
Walk AcrossM a s s a c h u s e t t s
• Personal andCommunity Health
• Life Science –Adaptations of LivingT h i n g s
• Appendix V: Historicaland Social Context
• Number Sense andO p e r a t i o n s
• Patterns, Relations,and Algebra
• MA and Its Cities andTo w n s
*Note: Individual lessons list specific learning standards met.
Lessons and Their Alignment withMassachusetts Curriculum Frameworks* (Cont.)

6Walking for Health & the Environment Curriculum
TEACHER CO M M E N TSThe comments below reflect some of the experiences of teachers who have reviewed or used the lessons in this c u r r i c u l u m .
What Color is My Air To d a y ?
“The lesson fits perfectly into the curriculum requirements…The lesson is teacher- and student-friendly. Learningabout air quality and the Air Quality Index was a big hit with the students. They want to check the paper daily to seewhat the index says about the quality of the air. ”
How Dirty Is the Air We Breathe?
“This lesson fits into standard curriculum requirements. The lesson is written in an easy way for teachers to under-stand…it was straightforward and organized…Due to high interest and enthusiasm on the part of my students, Iwould like to do it with all my future classes.”
How Far Do You Walk At School?
“The students enjoyed walking each Friday and revealing how far they walked using the pedometers…I would cer-tainly continue this project in the future.”

Lesson PlansGrades K-2


9 Now You See It, Now You Don’t
Now You See It, Now You Don’t GRADES
K-2
Students will:
! Observe differences between gases/solutions and particles, in thecontext of air pollution.
! Classify common atmospheric gaseous and particle pollutants in thea i r.
30 minutes
In this lesson, students will observe the differences between gaseousair pollution, represented by a solution of milk in water, and particle airpollution, represented by suspended particles of pepper in water.Students will then classify common atmospheric gases and particlesthat can contribute to air pollution.
! What is the water supposed to represent? (A n s w e r : A i r, or air in thea t m o s p h e r e )
There are different kinds of air pollution: some are particles, such as dirtor other small pieces of solid materials, and others are gases, such asozone, which is made up of three oxygen atoms. The cars that we drivecan send both particle pollution and gaseous pollution into the air. Ifmore people walked to more places instead of driving to them, fewercars would be on the road, and this would reduce air pollution.
! Two clear glass bowls (if teacher demonstrates) or large clear plasticcups (if students perform activity)*
! One tablespoon of milk for each bowl or cup! One teaspoon of pepper for each bowl or cup! One plastic spoon for each bowl or cup! Wa t e r! Student Worksheet (included) ! Teacher Answer sheet (included)
*Note to Te a c h e r s : If the teacher does this as a demonstration withthe clear glass bowl, it helps to have a light or white paper behind thepepper so it is easier to observe. Alternatively, students can do this insmall groups using clear disposable cups instead of the glass bowl.
E STI M ATED TI M E
S U M M A RY
KEY QUESTION
B AC KG ROUND
M ATE R I A L S
LEA RNING OBJ E C TI V E S
This Safe Routes to Schools Curriculum has two purposes: To teach elementary school students—in ways that are stimulating and relevant to their lives—how walking is good for their bodies and good for the environment, while alsohelping teachers satisfy the requirements of the Massachusetts Curriculum Frameworks.

10Walking for Health & the Environment Curriculum
1 .Review vocabulary, pour water, and explain that the waterrepresents the air.
Review as needed relevant vocabulary, such as gases, particles, pol-lution, mixture, and atmosphere. Divide the class into small groups (ifteacher not conducting activity for the entire class). Fill clear glassbowl or clear disposable cups half full with water. Remind the stu-dents that the water represents air in the atmosphere. Tell studentsto carefully observe what happens as you add things to the water.
2 .Add milk to the clear container of water; ask what kind of airpollutant the milk acted like.
First add one tablespoon of milk to the water and stir to mix. Thenask: What happened to the milk when it was added to the water?(A n s w e r : It mixed with the water, or a similar answer.) Then ask:What kind of pollutant(s) did the milk act like in the water? (A n s w e r :A gas, or gaseous air pollution.)
3 .Add pepper to another bowl or cup of water; ask the classwhat kind of air pollutant the pepper acted like.
First, add one teaspoon of pepper to the water and stir. Then ask:What happened to the pepper when it was added to the water?(A n s w e r : It did not mix with the water, or a similar answer.) Then ask:What kind of pollutant(s) did the pepper act like in the water?(A n s w e r : Particles, or particle pollution.)
4 .A s k : Would it be easier to get the milk or the pepper out of thewater?
If the containers were left on a shelf all day, which would “settle” outof the water, the pepper or milk? (A n s w e r : Pepper)
5 .A s k : Would it be easier to remove gases or particles out of theair?
(Answer: Particles)
6 .R e v i e w : What does the pepper represent? What does the milkr e p r e s e n t ?
Review: What does the pepper represent? (A n s w e r : Particle air pollu-tion). What does the milk represent? (A n s w e r : Gaseous air pollution).
7 .Use Student Worksheet.
Use the Student Worksheet, first for word recognition, then have stu-dents fill out the Worksheet as follows:
STE P S

11 Now You See It, Now You Don’t
(a) Begin this step as a word recognition task: For older students whocan read (e.g., Grade 2), tell students to highlight or circle some of the(easier) words they recognize (with some assistance) on the StudentWorksheet; suggested words include: ash, car exhaust, cigarettesmoke, cow burps, dirt, dust, forest fires, lead, lightning, ozone,pollen, rotting leaves, soot, street sanding, swamp gases. Foryounger students, you can count down the list with them to wordsthey understand the meaning of and read them aloud.
(b) Next, tell students to fill out the Worksheet for the highlighted orcircled items. Tell them to check off whether they think the pollutantlisted in the left-hand column is a particle, a gas, or both. (N o t e : T h eTeacher Answer Sheet provides the correct answers.)
Students could receive a star or sticker for answering correctly, or forfilling out additional items.
For older students (Grades 3-5), have them fill out the entire Wo r k s h e e t .Also, introduce the concepts of solutions (i.e., milk and water) and sus-pensions (i.e., pepper and water) in scientific terms. Also, see the les-son plan, “Parts Per Million,” on the Rutgers University website listedb e l o w.
Have the students research some of the types of air pollution listed onthe Student Wo r k s h e e t .
Suspended Particulates Lab Lesson Plan. Rutgers Engineering. URL: www. e n g i n e e r i n g p l a n e t . r u t g e r s . e d u
Grades K-2
Science and Technology/Engineering Curriculum
Earth and Space Science – Earth’s Materials
! Understand that air is a mixture of gases that is all aroundu s …(Learning Standard 2)
Life Science (Biology) – Living Things and Their Environment
! Recognize that people and other animals interact with the environ-m e n t …(Learning Standard 6)
Physical Sciences (Chemistry and Physics) – States of Matter
! Identify objects and materials as solid, liquid, or gas…( L e a r n i n gStandard )
A DA P TATI O N
FOR FU RT H E REX PLO R ATI O N
R E S O U RC E S ,AC K NOW LE D G M E N TS
MA CURRICULU MFR A M E WORKS STA N DA R D S

12Walking for Health & the Environment Curriculum
Appendix V: Historical and Social Context for Science andTechnology/Engineering
! How government, industry, and/or individuals may be responsible fornegative effects; damage to the environment or ecosystems…; somesources of damage or pollution ( I V. Unintended negative effects…)
Comprehensive Health Curriculum
! Describe types of natural resources and their connection with health(Learning Standard 13.1)
! Identify ways the physical environment is related to individual andcommunity health (Learning Standard 14.2)

13 Now You See It, Now You Don’t
Student Worksheet: Now You See It, Now You Don’t
Student Name: _ _ _ _ _ _ _ _ _ _ _ _ _ _ _ _ _ _ _ _ _ _ _ _ _ _ _ _ _ _ _ _ _ _ _ _ _ _ _ _ _ _ _ _ _ _ _ _ _ _ _ _ _ _ _ _ _ _ _ _ _ _ _ _ _ _ _ _ _ _ _ _ _ _ _
Type of Pollutant P a r t i c l e s G a s e s B o t h
Agricultural burning
A s h
Car exhaust
Carbon dioxide (CO2)
Carbon monoxide (CO)
Cigarette smoke
Cow burps
D i r t
D u s t
Fireplace smoke
Forest fires
H a z e
Industrial emissions
L e a d
L i g h t n i n g
Nitrogen oxides (NOX)
O z o n e
P o l l e n
Power plants
Rice field gases
Rotting leaves
Sewer gases
S o o t
Street sanding
Sulfer dioxide (SO2)
Swamp gases
Volcanic ash

14Walking for Health & the Environment Curriculum
Teacher Answer Sheet: Now You See It, Now You Don’t
Student Name: _ _ _ _ _ _ _ _ _ _ _ _ _ _ _ _ _ _ _ _ _ _ _ _ _ _ _ _ _ _ _ _ _ _ _ _ _ _ _ _ _ _ _ _ _ _ _ _ _ _ _ _ _ _ _ _ _ _ _ _ _ _ _ _ _ _ _ _ _ _ _ _ _ _ _
Type of Pollutant P a r t i c l e s G a s e s B o t h
Agricultural burning
A s h
Car exhaust
Carbon dioxide (CO2)
Carbon monoxide (CO)
Cigarette smoke
Cow burps
D i r t
D u s t
Fireplace smoke
Forest fires
H a z e
Industrial emissions
L e a d
L i g h t n i n g
Nitrogen oxides (NOX)
O z o n e
P o l l e n
Power plants
Rice field gases
Rotting leaves
Sewer gases
S o o t
Street sanding
Sulfer dioxide (SO2)
Swamp gases
Volcanic ash
"
"
"
"
"
"
"
"
"
"
"
"
"
""
"
"
"
"
"
"
"
"
"
"
"
"

15 How Dirty Is the Air We Breathe?
Particle Pollution:How Dirty Is the Air We Breathe?
G R A D E S
K-2
Students will:
! Make a simple particle pollution tester.! Collect and observe particle pollution from the air and record findings.
30 minutes (indoors)30 minutes (outdoors)
In this activity, students will collect samples of particle pollution out-doors on plastic squares coated with petroleum jelly, and discuss thecauses and impacts of particle air pollution.
! In what types of places might the most air pollution occur? ( P o s s i b l ea n s w e r s : Near busy roads with lots of traffic; near factories or powerp l a n t s )
! Do you think that people’s health can be affected by breathing in airpollution? How? ( A n s w e r s : Difficulty breathing, asthma, other breath-ing/lung problems, heart disease)
! How might we help keep the air clean? (Possible answers: By walkingplaces instead of driving to them, with an adult, when it’s safe to dos o . )
The Earth’s atmosphere is made up mostly of invisible gases. Most airpollution also is invisible. Some air pollutants are gases, while othersare liquids or solid particles. Sometimes you can see air pollution, whenlarge amounts of certain kinds of pollution are in one place (such as acity). One type of air pollutant is called particle pollution. Particle pollu-tion is made up of tiny solid particles, like specks of dirt, and droplets ofliquid. A lot of particle pollution comes from things that people do, likedriving cars and trucks that burn gasoline and put pollutants into the airfrom the vehicles’ tailpipes. The smokestacks of factories also put pollu-tants into the air; these pollutants are caused by the burning of oil andcoal in the factories to run the machines used to make things. Somethings in nature also create particle pollution, such as forest fires andvolcanic ash. Wind can blow air pollution from where it was created toother places far away. Sometimes air pollution makes it hard to see dis-tant objects, like mountains or the city skyline.
E STI M ATED TI M E
S U M M A RY
KEY QUESTI O NS
B AC KG RO U N D
LEA RNING OBJ E C TI V E S
This Safe Routes to Schools Curriculum has two purposes: To teach elementary school students—in ways that are stimulating and relevant to their lives—how walking is good for their bodies and good for the environment, while alsohelping teachers satisfy the requirements of the Massachusetts Curriculum Frameworks.

16Walking for Health & the Environment Curriculum
! Plastic squares (5 cm by 5 cm or 2 inch by 2 inch) ! Petroleum jelly ! Masking tape ! Blocks of wood ! White paper for each child or each group of children ! Adult assistants for outdoor placement of wood blocks
1 .Tell students they will make a particle air pollution tester.
Introduce the class to different kinds of pollution – gaseous and parti-cles – as described in the B a c k g r o u n d. Tell students: As we look out-side, we often see a clear blue sky. Where is air pollution? We aregoing to make a simple tester for particle air pollution so we can seei t .
2 .Have students make the testers.
Divide the class into groups and give them their materials. Withmasking tape, have each group fasten their plastic square to thewooden block. Then have them apply a thin, even coat of petroleumjelly to the plastic square.
3 .Place the blocks outside.
With the class and adult assistants, place the blocks outdoors onposts, fences, walls, and/or window sills in various locations. If youcan, place some blocks near a road and some in a protected locationaway from roads. Try to pick places where the blocks won’t beknocked over by pets or children’s play. Leave the blocks for 24 hours.
4 .Collect the testers.
The next day, collect the wooden blocks and keep a record of whereeach block was placed. Remove the plastic squares from the blocksand lay the squares on white paper.
5 .Examine the pollution collected on the testers.
Let the students examine the pollution that collected on the petrole-um jelly.
6 .Discuss the findings.
Have the groups discuss (and record, if age-appropriate) the findingsof their testers.
Have groups share their findings with the class. A s k : Did your testercollect any particles? How does your square compare to those of theother groups? In what places does the air seem to be the dirtiest?(Possible answers: Near busy roads, near factories.) Why do you thinkthose areas might have the most particle pollution? ( P o s s i b l ea n s w e r s : Because cars and factories make pollution.)
STE P S
M ATE R I A L S

17 How Dirty Is the Air We Breathe?
7 .Discuss possible health effects of breathing air pollution.
S a y : We have seen particle pollution where we first didn’t see any.Clean air is important for us to breathe to be healthy. Breathing inparticle pollution (dirty air) can make us sick – it can cause people tohave difficulty breathing, asthma, other breathing/lung problems, orheart disease.
8 .Discuss what people can do to reduce air pollution.
A s k : What can we do to keep the air clean? (Possible answers:People could drive less and walk more, such as to school. We canturn off lights, TVs, and computers when we’re not using them.Factories could reduce their pollution.)
For Grades 3-5, have students write a paper explaining the differencesthey observed among the plastic squares. Ask students to leave thetester outside for a week, a month (sheltered from precipitation); stu-dents can keep a journal of its progress each day and report to theclass. Have students compile data on their findings and write the mayoror a municipal board about their samples.
For Grades K-2, to simplify testing, place pieces of double-sided mask-ing tape (instead of petroleum jelly on wood blocks) on trees in variouslocations and compare the results.
Have students take their tester home (along with instructions forparental assistance) to test for pollution for 24 hours. Students will thenreport their findings to the class the next day.
Holt Science 6th. Holt, Rinehart, and Winston Publishers, New York. p.257.
Texas Natural Resource Conservation Commission (TNRCC). URL: http://www. t n r c c . s t a t e . t x . u s / a i r / m o n o p s / l e s s o n s / p a r t l e s s o n 4 . h t m l
Grades K-2
Science and Technology/Engineering Curriculum
Earth and Space Science – Earth’s Materials
! Understand that air is a mixture of gases that is all around us andthat wind is moving air (Learning Standard 2)
Life Science (Biology) – Living Things and Their Environment
! Recognize that people and other animals interact with the environ-m e n t …(Learning Standard 6)
A DA P TATI O N
FOR FU RT H E REX PLO R ATI O N
R E S O U RC E S ,AC K NOW LE D G M E N TS
MA CURRICULU MFR A M E WORKS STA N DA R D S
18Walking for Health & the Environment Curriculum
Physical Sciences (Chemistry and Physics) – States of Matter
! Identify objects and materials as solid, liquid, or gas…( L e a r n i n gStandard )
Technology/Engineering
! Identify and describe the safe and proper use of tools and materials…to construct simple structures (Learning Standard 1.3)
Appendix V: Historical and Social Context for Science andTe c h n o l o g y / E n g i n e e r i n g
! How government, industry, and/or individuals may be responsible fornegative effects…; damage to the environment or ecosystems… ;some sources of damage or pollution ( I V. Unintended negativee f f e c t … )
Comprehensive Health Curriculum
! Describe types of natural resources and their connection with health(Learning Standard 13.1)
! Identify ways the physical environment is related to individual andcommunity health (Learning Standard 14.2)
Grades 3-5 (for “Adaptation” section)
Science and Te c h n o l o g y / E n g i n e e r i n g
Life Science (Biology) – Adaptations of Living Things
! Give examples of how organisms can cause changes in their environ-ment…explain how these changes may affect the ecosystem(Learning Standard 10)
Physical Sciences (Chemistry and Physics) – States of Matter
! Compare and contrast solids, liquids, and gases based on the basicproperties of each of these states of matter (Learning Standard 2)
Te c h n o l o g y / E n g i n e e r i n g
! Identify materials used to accomplish a design task based on a specif-ic property…(Learning Standard 1.3)

19 Milkweed Polka Dots
Milkweed Polka DotsGRADES
K-2
Students will:
! Understand that air pollution can damage plants.! Use observational skills to identify damage to plants caused by ozone
rather by than other causes.
40 minutes
In this Internet activity, students will learn that plants can be damagedby air pollution. Students will examine photos of milkweed leaves,which typically display black dots on their top leaf surfaces whenstressed by large amounts of ground-level ozone. Students will compareozone damage to other types of damage.
! What things do you think might cause air pollution? ( P o s s i b l eanswers: Cars that we drive, factories that make things we use.)
! What can people do to reduce air pollution? (Possible answers: Wa l k ,bicycle, or take a train or bus instead of driving places. Buy cars thatuse less gasoline.)
When too much dirt or chemicals get into our air, the air is dirty, or pol-luted. Some types of air pollution can injure plants. One type of air pol-lution called ozone pollution can injure milkweed plants. Lots of otherthings can also cause damage to milkweed, like too much hot weather,not enough plant food, or caterpillars eating the leaves, so not all dam-age to milkweed is caused by air pollution. The damage that ozonecauses to milkweed looks like small black dots on the top surfaces ofthe leaves. If the dots are brown, red, purple, or another color, or are onthe bottom of the leaf, it’s not ozone damage. Also, ozone doesn’t dam-age the veins of the leaf; other things would cause that type of damage.Ozone damage won’t rub off or wash off. Many leaves have more thanone type of damage.
N o t e : You might want to explain briefly to students that ozone, which isthe topic of this lesson, is created when chemicals from cars are mixedwith certain other chemicals from factories and products like paint, andthis mixture is heated by the sun. See full description of ozone in the I sThe Air Good Where I Live? l e s s o n .
E STI M ATED TI M E
S U M M A RY
KEY QUESTI O NS
B AC KG RO U N D
LEA RNING OBJ E C TI V E S
This Safe Routes to Schools Curriculum has two purposes: To teach elementary school students—in ways that are stimulating and relevant to their lives—how walking is good for their bodies and good for the environment, while alsohelping teachers satisfy the requirements of the Massachusetts Curriculum Frameworks.

20Walking for Health & the Environment Curriculum
! Internet access! If possible, milkweed plant leaves (preferably both healthy leaves and
leaves with ozone damage, as described under the B a c k g r o u n d a b o v e )
1 . Introduce students to milkweed on the “EnvironmentalEducation for Kids” website.
You can introduce students to both milkweed and monarch butterflieson the following Internet website:URL: http://www. d n r. s t a t e . w i . u s / o r g / c a e r / c e / e e k / v e g / p l a n t s /m i l k w e e d . h t mMilkweeds are common wild plants in Massachusetts (as well as inWisconsin, where this website was created). Monarchs need milk-weed to survive. The butterfly lays its eggs on milkweed plants andthe caterpillars eat the leaves.
After showing students a healthy millkweed, go to the followingInternet web page which shows milkweed ozone damage:URL: http://www. d n r. s t a t e . w i . u s / o r g / c a e r / c e / e e k / e a r t h / f i e l d / m i l k-w e e d / s l i d e s h o w i n d e x . h t m(Since the URLs for these websites are so long (!), you may want tofirst save them to your “Favorites” list for easy access.)
2 .Have students view (and possibly draw) an ozone-damagedleaf; review the symptoms of ozone damage with them.
If time permits, you may want to have students draw and predictwhat a milkweed leaf that is damaged by ozone looks like (or, you candraw one for them), based on the description in the B a c k g r o u n dabove. Have students study the photo of the ozone-damaged leaf.Review the symptoms of milkweed damage from ozone pollution(from the B a c k g r o u n d) with students: small black dots on the top (notbottom) of the leaves; damage to the leaf, not the veins; damagew o n ’t rub off or wash off.
3 .View and discuss slides of damaged milkweed leaves withstudents.
On this same Internet page, click on “See the list of slides.” Based ontime availability, either have students pick a few of these slides tocompare with the ozone-damaged leaf photo, or allow them to viewthe entire slide show. Share with students the information providedon each slide regarding how the damage shown differs from ozonedamage to milkweed leaves.
4 .Discuss milkweed damage shown on slides.
Discuss the different types of milkweed damage observed on some ofthe slides and their causes.
STE P S
M ATE R I A L S

21 Milkweed Polka Dots
5 .Ask students what they and other people can do to reduce airpollution.
Ask students what people can do to reduce air pollution, and whatthey themselves can do.
For older students, have them examine the Data Tables at the InternetURL: http://www. d n r. s t a t e . w i . u s / o r g / c a e r / c e / e e k / e a r t h / f i e l d / m i l k-w e e d / d a t a t a b l e . h t m
Then have students make comparisons across the data, such as compar-ing results for the different schools listed for the years 2000 – 2004 forthe categories “Highest Level of Ozone Injury Found” and “Average %of Ozone Injured Leaves Per Plant.”
Conduct a milkweed monitoring field trip; see the following Internetwebsite for procedures:URL: www. e a s y b r e a t h e r s . o r g / p d f / e n g a g e / m i l k w e e d . p d f
EEK! Teachers Pages – Milkweed Monitoring ProjectURL: www. d n r. s t a t e . w i . u s / o r g / c a e r / c e / e e k / t e a c h e r / m i l k w e e d m o n i t o r-i n g . h t m
Grades K-2
Science and Technology/Engineering Curriculum
Life Science (Biology)
! Characteristics of Living Things - Recognize that animals (includinghumans) and plants are living things that grow, reproduce, and needfood, air, and water (Learning Standard 1).
! Living Things and Their Environment – Recognize that people andother animals interact with the environment through their senses ofsight, hearing, touch, smell, and taste (Learning Standard 6).
Physical Sciences (Chemistry and Physics)
! Sort objects by observable properties such as size, shape, color,weight, and texture (Learning Standard 1).
Appendix V: Historical and Social Context for Science andTe c h n o l o g y / E n g i n e e r i n g
! How government, industry, and/or individuals may be responsible fornegative effects…; damage to the environment or ecosystems…;some sources of damage or pollution ( I V. Unintended negative effectsfrom uses of science and technology/engineering).
A DA P TATI O N
FOR FU RT H E REX PLO R ATI O N
R E S O U RC E S ,AC K NOW LE D G M E N TS
MA CURRICULU MFR A M E WORKS STA N DA R D S

22Walking for Health & the Environment Curriculum
Comprehensive Health Curriculum
! Describe types of natural resources and their connection with health(Learning Standard 13.1).
! Identify ways the physical environment is related to individual andcommunity (Learning Standard 14.2).
MA CURRICULU MFR A M E WORKS STA N DA R D S( CO N T. )

23 What Color Is My Air Today?
What Color Is My Air Today?GRADES
K-2
Students will:
! Understand how breathing the air can affect people’s bodies andh e a l t h .
! Describe how colors and numbers can represent different classifica-tions of something, such as levels of air quality.
! Understand that air pollution, driving, and health are connected.
30 minutes
In this lesson, the class will discuss air quality and how walking,instead of driving cars, helps improve air quality. Using the EPA’s onlineAir Quality Index color game, students will learn that air quality can beclassified according to different levels of pollution and that these levelscan be represented by colors and/or numbers. They will also learn thatthey can find out what the air quality index is on any given day andunderstand what it means for people’s outdoor activities.
! What is air pollution?! What is the Air Quality Index?! How can you and your family help reduce air pollution?
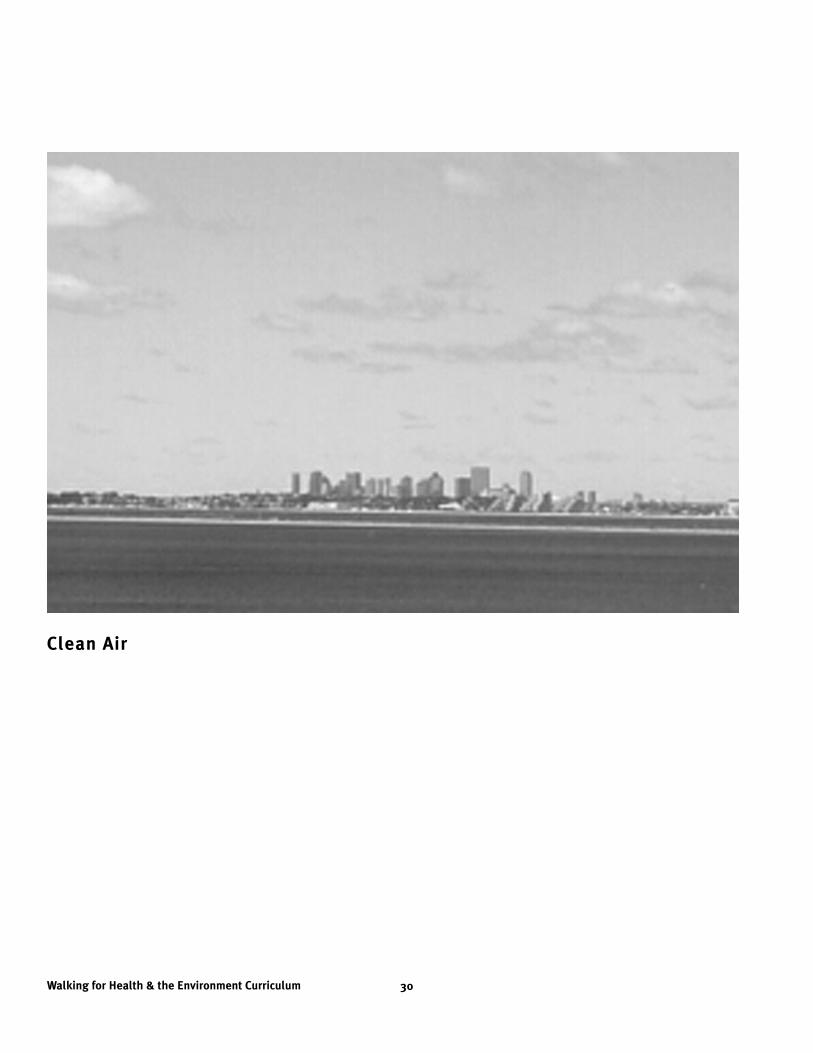
When you walk to school or other places, on a clear, breezy day, the airsmells fresh and clean. Clean air is air that has no harmful levels of pol-lutants (such as dirt and chemicals) in it. Clean air is good for people tobreathe. However, on a hot day with no wind—especially in somecities—the air can feel heavy and may have a bad smell. Sometimes,the air can even make your chest feel tight, or make you cough. Whentoo much dirt or chemicals get into the air, the air is dirty, or polluted(see photos on pages 30-31). Polluted air is not good for people tobreathe. Gasoline-burning cars contribute to air pollution. To reduce airpollution, students and their families can walk more, ride their bikes, orcarpool. (Carpooling is when people who are not related to each othershare a ride somewhere.) People can also take the bus, train, or subwayto reduce air pollution instead of driving in their cars.
E STI M ATED TI M E
S U M M A RY
KEY QUESTI O NS
B AC KG RO U N D
LEA RNING OBJ E C TI V E S
This Safe Routes to Schools Curriculum has two purposes: To teach elementary school students—in ways that are stimulating and relevant to their lives—how walking is good for their bodies and good for the environment, while alsohelping teachers satisfy the requirements of the Massachusetts Curriculum Frameworks.

24Walking for Health & the Environment Curriculum
The government measures pollution in the air across the country. Thenthey use something called the Air Quality Index, or AQI for short, to tellpeople how clean or dirty the air is each day in different places. TheAQI uses colors, words, and numbers to tell you about the air.
! Internet access (black and white copies of the AQI Color Game a n dAnswer Sheet are included at the end of this lesson for reference, butusing the online color version is preferred)
! Computer printer (preferably color, if not conducting activity online)! P e n c i l s
1 .Access the Air Quality Index Color Game online or distributeprinted copies.
Have the class play the AQI Color Game online, or print out and handout copies of the game (easy version) from the EPA AIRNow websiteURL: http://airnow. g o v / i n d e x . c f m ? a c t i o n = a q i k i d s . g a m e s(This lesson is based on the game version that “can be printed outand completed” found towards the bottom of the Internet page. Yo ucan also [or instead] play the animated online version.)
Note to Te a c h e r s : It may take a minute for the color chart to loadonto your computer. Also, the AQI Game is available online at differ-ent levels: easy, medium, and hard. First have students play the“easy” game, which discusses AQI colors only. Then add a discussionof the AQI numbers, as discussed in the Steps below. The mediumand hard versions of the game are appropriate for students in Grades3-5.
If printing, also print out the answer key for the teacher. It is best ifthe student game can be printed in color.
2 .Discuss the AQI colors and their meaning with students.
Tell students that each day, the AQI is one of these colors. The colorstell you how healthy the air is to breathe that day. The colors go fromGreen to Yellow to Orange to Red to Purple, with each color tellingyou that the air is less clean than the color before. (Note: If studentsask, you can tell them that the last AQI color, Maroon, which repre-sents the worst air quality, is usually not included with the other AQIcolors because air quality in the U.S has not been Maroon in manyyears. This is probably because people have been working hard toclean up the air.)
STE P S
M ATE R I A L S

25 What Color Is My Air Today?
3 .Tell students to look at their AQI Color Game sheet.
Tell them to draw a line from the AQI words on the left side to thecorrect color on the right side. For younger students (e.g., kinder-garten), the teacher can read the words and ask students whichwords go with which colors. For older students (e.g, Grade 2), theteacher may need to assist students in reading and understandingsome of the key words, as discussed in the table above.
4 .Discuss the correct answers using the teacher answer sheet.
5 .Add a discussion of the AQI numbering system.
An index uses numbers to tell people how good or bad something is.For example, you might say your school lunch is a 1 (very good) or a 5(yucky). The Air Quality Index uses numbers from 0 to 500. Thesenumbers are used to decide the AQI color for a particular day. On daysmeasuring less than 100, the air is clean. If the air is dirtier, the num-bers get bigger. On days measuring more than 100, the air can be badfor you to breathe.
Here is how the AQI numbers match up with the AQI colors:
If Color is… This Means…G r e e n The air is good and healthy to breathe.
Ye l l o w The air is "moderate" - it's fine for most people, includ-ing children like you. However, if you know you areextra sensitive to pollution, you might want to limit thetime you spend playing outside when the AQI is yellow.
O r a n g e The air is unhealthy for sensitive groups. People withlung problems, such as asthma, and active kids andgrown-ups should limit how long or how hard they playactively outside. If you don't feel so great, take it a littleeasier when the AQI is orange.
R e d The air is unhealthy. People with lung problems, suchas asthma, and active kids and grown-ups should notspend a long time playing actively outdoors. Everybodyelse should limit how long they are active outside.
P u r p l e The air is very unhealthy. People with lung problems,such as asthma, and active kids and grown-ups shouldnot spend any time playing or being active outdoors.Everyone else should limit outdoor activities.
AQI Numbers AQI Colors0 to 50 G r e e n
51 to 100 Ye l l o w
101 to 150 O r a n g e
151 to 200 R e d
201 to 300 P u r p l e

A DA P TATI O N
FOR FU RT H E REX PLO R ATI O N
R E S O U RC E S ,AC K NOW LE D G M E N TS
MA CURRICULU MFR A M E WORKS STA N DA R D S
26Walking for Health & the Environment Curriculum
6 .Have students view the AQI posters.
Next, have students view the six AQI color posters online, or print outseveral sets of the posters and pass them around the class, availablefrom the EPA AIRNow website at:URL: http://www. e p a . g o v / a i r n o w / / a q i k i d s / p d f f i l e s / p o s t e r s . p d fIt is best if these posters can be printed out in color.
7 .Discuss the six posters in sequence.
Discuss the six posters in sequence (from Green to Purple), which willreinforce the lesson thus far, including both AQI colors and numbers.
8 .Remind students how they can help reduce air pollution.
Remind students that to reduce air pollution, they and their familiesand friends can walk more, ride their bikes, carpool, and take the bus,train, or subway instead of driving in their cars.
For older students (Grades 3-5), play the Medium and/or Hard versionsof the AQI Color Game. Add more in-depth discussion from the EPAwebsite at:U R L : h t t p : / / w w w. e p a . g o v / a i r n o w / / a q i k i d s / p d f f i l e s / a q i r e f e r. p d f
If using the Internet, go to http://www. a i r n o w.gov and click on “To d a y ’sForecast” then click on a city located nearby. Ask students what the airquality is for today and expected to be tomorrow.
Have students try to find and cut out the Air Quality Index in the news-paper and bring it in to class to discuss; the AQI can often be found onthe weather page in newspapers.
U.S. EPA. Air Quality Index Kids Page. URL: http://airnow. g o v / i n d e x . c f m ? a c t i o n = a q i k i d s . i n d e x
Grades K-2
Comprehensive Health Curriculum
! Describe types of natural resources and their connection with health(Learning Standard 13.1).
! Identify ways the physical environment is related to individual andcommunity health (Learning Standard 14.2).
Science and Technology/Engineering Curriculum
Life Science (Biology) – Living Things and Their Environment
! Recognize that people and other animals interact with the environ-ment through their senses of sight, hearing, touch, smell, and taste(Learning Standard 6).

Appendix V: Historical and Social Context for Science andTe c h n o l o g y / E n g i n e e r i n g
! How government, industry, and/or individuals may be responsible fornegative effects…; damage to the environment or ecosystems…;some sources of damage or pollution ( I V. Unintended negative effectsfrom uses of science and technology/engineering).
Mathematics Curriculum
Number Sense and Operations
! Identify positions of objects in sequences (e.g., first, second) up tofifth (Learning Standard K.N.3)
! Name and write (in numerals) whole numbers to 1000, identify theplace values of the digits, and order the numbers (Learning Standard2 . N . 1 ) .
Patterns, Relations, and Algebra
! Identify the attributes of objects as a foundation for sorting and classifying (Learning Standard K.P. 1 ) .
! Sort and classify objects by color, shape, size, number, and otherproperties (Learning Standard K.P. 2 ).
! I d e n t i f y, reproduce, describe, extend, and create simple rhythmic,shape, size, number, color, and letter repeating patterns ( L e a r n i n gStandard 2.P.1).
Data Analysis, Statistics, and Probability
! Collect, sort, organize, and draw conclusions about data using con-crete objects, pictures, numbers, and graphs (Learning StandardK . D . 1 ) .
! Organize, classify, represent, and interpret data using tallies, charts,tables, bar graphs, pictographs, and Venn diagrams; interpret the rep-resentations (Learning Standard 2.D.2).
27 What Color Is My Air Today?

28Walking for Health & the Environment Curriculum

29 What Color Is My Air Today?
30Walking for Health & the Environment Curriculum
Clean Air

31 What Color Is My Air Today?
D i rty Air


33 Smog City K-2
Smog City K-2 GRADES
K-2
This Safe Routes to Schools Curriculum has two purposes: To teach elementary school students—in ways that are stimulating and relevant to their lives—how walking is good for their bodies and good for the environment, while alsohelping teachers satisfy the requirements of the Massachusetts Curriculum Frameworks.
Students will:
! Learn what weather conditions and human activities can affect airp o l l u t i o n .
! Make and test hypotheses.! Learn how changes in air quality can affect people’s health.
30 minutes
In this activity, the class will briefly discuss how changing things suchas automobile emissions and weather can affect ground-level ozone, acomponent of smog. The teacher then leads students through an inter-active website called Smog City to show how raising automobile emis-sions can increase air pollution and how this can affect people’s health.The website will help students make the connection between weather,human activities (such as driving and factory production), air pollution,and people’s health.
! How can cars affect air quality? ( A n s w e r : Emissions from car exhaustcan release chemicals into the air that cause pollution.)
! How can wind affect air pollution? ( A n s w e r : Wind can blow air pollu-tion away from some places and into other places. Lack of wind cankeep air pollution in one place.)
! How could we reduce air pollution from cars? ( A n s w e r : We coulddrive less, and walk more.)
The word “smog” was first used in London, England, about the year1900 to describe a combination of “smoke” and “fog” in the air.Thousands of people who lived in London died of diseases similar topneumonia because of the poisonous smog in the air. Smog can causehealth problems such as difficult breathing, asthma, eye irritation, morelung infections, and colds. Smog can also make it harder to see thingsfar away.
To d a y, smog includes an air pollutant called ozone. In addition to thehealth problems already mentioned, the ozone in smog can damage
E STI M ATED TI M E
S U M M A RY
KEY QUESTI O NS
B AC KG ROUND
LEA RNING OBJ E C TI V E S

34Walking for Health & the Environment Curriculum
plants and trees. Ozone is created when certain chemicals that pollutethe air are baked by heat and sunlight and combine together to form adifferent substance (this is called a chemical reaction). The chemicalpollutants that form ozone come from many things, including exhaust(also called emissions) released from the tailpipes of automobiles, fromsmokestacks of factories, and from gases released from certain chemi-cals in household products, such as paints.
Weather conditions can affect smog. For example, wind can blow airpollution away from some places and into other places. When there isno wind, smog may stay over a particular place for quite a while.Serious smog problems occur in many major cities and sometimes out-side of cities.
! Internet access! Writing paper
1 .Review new vocabulary with students.
Review new vocabulary with the students:
! E m i s s i o n s – Releases into the air that may contain pollution (suchas exhaust from tailpipes of vehicles, which often contains severalair pollutants, or releases from factory smokestacks).
! (Ground-level) Ozone – Formed from a combination of chemicalswhen baked by strong sunlight and high outdoor temperatures.
2 .Demonstrate activity to students.
Demonstrate this activity first to the class prior to performing it withthem, either on a computer or a projection screen. You can access theSmog City program on the Internet at: http://www. s m o g c i t y. c o m
3 .Read about the program to students and start the program.
With students watching, click on the “Help” menu, and read to themsome of the information under the heading “Here’s how you control aday in Smog City” to help them understand the meaning of the“knobs” in the program. (Or, you can use “screen captures” at the endof this lesson to help explain the “Smog City” control knobs to stu-dents.) To start the program, click on “Run Smog City” on the left sideof the toolbar.
4 .Explain the key items.
STE P S
M ATE R I A L S

35 Smog City K-2
Tell students that several things in the picture can affect whether ornot smog occurs. Point out each item shown, using the computer/pro-jection screen and the printed versions of portions of the Smog Citywebsite included with this lesson:
Weather conditions ! Te m p e r a t u r e! [Skip “inversion layer” for Grades K-2]! Wind speed! Whether it’s a sunny or cloudy day
Population level( Tell students: Both population levels and emission levels are thingsthat are within the control of people, while weather conditions aren o t . )
Emissions levels - f r o m :! Cars and trucks! Off-road vehicles! I n d u s t r y! Consumer products
Ozone levels – Tell students that the colors shown to the right ofthe words “Ozone Levels” tell whether the air is clean or dirty.Green means the air is clean. Yellow means the air is mediumclean, or moderate. Orange means the air is unhealthy for sensitivegroups. Red means the air is unhealthy for all people. Purple meansthe air is dirty, or very unhealthy.
Health Effects at Peak Ozone Level – Tell students that the colorhere corresponds to one of the colors of the ozone-levels chartabove it, and indicates the highest, or peak, ozone level for a partic-ular day. Below this color is a section that tells the health warnings,if any, for this amount of ozone in the air.
5 .Ask a predictive question about emissions, then discussr e s u l t s .
Ask the students what they think would happen if you raised theemissions levels a lot from cars and trucks?
6 .Raise the emission levels from cars and trucks.
Raise the emission levels as high as possible from cars and truckso n l y, then click “Start.” ( N o t e : If you try to make more than onechange at a time, the results may not be accurate.)
7 .Discuss results.

36Walking for Health & the Environment Curriculum
Ask the class: Did the change they predicted happen when you raisedthe emissions levels? What happened? Did the “ozone level” (green,y e l l o w, orange, red, purple) change when you raised the emission lev-els for cars and trucks? (See the Smog City d i s p l a y. )
8 .Discuss any health warnings.
Read to the class any health warnings associated with the ozonelevel in the “Health Effects at Peak Ozone Level” section. (See theSmog City d i s p l a y. )
For older students (Grade 3-5), see the Smog City lesson plan in thiscurriculum prepared for that age group.
Encourage students to continue exploring Smog City, either in class iftime allows and/or at home, to learn more about the relationshipsbetween weather, human activities, and ozone pollution. (Note: If stu-dents will be changing additional items in the program, they will needto press “Restart” to go back to the original conditions, then make o n echange at a time, then press “Start.”)
Smog City was developed under a U.S. Environmental ProtectionAgency grant and is a copyright of the Sacramento Metropolitan AirQuality Management District. Smog City is authorized for use as an edu-cational and demonstration tool and may be downloaded for non-profituse by the general public, other agencies, associations, and educationalinstitutions. Smog City: Copyright 1999 Sacramento Metropolitan AirQuality Management District.
Grades K-2
Science and Technology/Engineering Curriculum
Earth and Space Science
! E a r t h ’s Materials – Understand that air is a mixture of gases that isall around us and that wind is moving air (Learning Standard 2)
! Weather – Describe the weather changes from day to day and overthe seasons (Learning Standard 3)
Life Science (Biology)
! Living Things and Their Environment - Recognize that people andother animals interact with the environment…(Learning Standard 6)
Appendix V: Historical and Social Context for Science and
A DA P TATI O N
FOR FU RT H E REX PLO R ATI O N
R E S O U RC E S ,AC K NOW LE D G M E N TS
MA CURRICULU MFR A M E WORKS STA N DA R D S

37 Smog City K-2
Technology/Engineering
! How government, industry, and/or individuals may be responsible fornegative effects…; damage to the environment or ecosystems…;some sources of damage or pollution ( I V. Unintended negative effectsfrom uses of science and technology/engineering)
Comprehensive Health Curriculum
! Describe types of natural resources and their connection with health(Learning Standard 13.1)
! Identify ways the physical environment is related to individual andc o m m u n i t y (Learning Standard 14.2)

38Walking for Health & the Environment Curriculum
from SmogCity. c o m

39 Smog City K-2
from SmogCity. c o m

40Walking for Health & the Environment Curriculum
from SmogCity. c o m

Lesson PlansGrades 3-5


43 Breathing and Exercise
Breathing and Exercise GRADES
3-5
Students will:
! Observe and record how breathing changes with physical activity.! Understand the benefits of walking and other physical activity.
30 minutes
In small teams, students will count their breaths per minute at rest andthen again after vigorously jumping up and down. The class will com-pare and discuss their findings.
! Does a person breathe more or less during exercise than when sittingstill? How much more or less (Twice as much? More? Less?)
! How can faster breathing improve our health? (Possible answer: I tbrings more oxygen to our lungs and cells.)
! Who might need to be careful about breathing faster? ( P o s s i b l ea n s w e r : People with asthma or other lung conditions)
Air is essential to life. People and other animals use the oxygen webreathe along with the food we eat to produce energy. Increased physi-cal activity like walking, bicycling, and other exercise raises the body’senergy demand for oxygen and nutrients. When we exercise, we noticean increase in our breathing rate. This is how our respiratory systemhelps bring more oxygen to our cells. More oxygen reaching our lungsand cells can contribute to better health. And more walking and bicy-cling can reduce air pollution by reducing the number of cars on theroad, because cars produce air pollution.
! Stopwatch, watch, clock, or timer for each team (if using the class-room clock, the teacher or a student can be the timer for the wholeclass, if there are not enough watches for each group)
! Student Worksheet (included)
E STI M ATED TI M E
S U M M A RY
KEY QUESTI O NS
B AC KG ROUND
M ATE R I A L S
LEA RNING OBJ E C TI V E S
This Safe Routes to Schools Curriculum has two purposes: To teach elementary school students—in ways that are stimulating and relevant to their lives—how walking is good for their bodies and good for the environment, while alsohelping teachers satisfy the requirements of the Massachusetts Curriculum Frameworks.

44Walking for Health & the Environment Curriculum
1 .Have students form research teams, with each student servinga different role.
Have students form research teams of 2-3 persons. In the 2-persongroups, one student will time and record data while the other studentwill be the research subject. In the 3 person groups, one student willtime, one will record data, and the last will be the research subject. Iftime permits, each team member can take a turn as the research sub-ject.
2 .Hand out the Student Worksheet and stopwatches (if usingthem) to each team, and have students answer the predictionquestion, “Does a person breathe more or less during exer-c i s e ? ”
If not using stopwatches, make sure the person acting as the time-keeper is ready. Each team will write their prediction on theWo r k s h e e t .
3 .Teams will time the research subjects’ at-rest breathing rates.
First, explain breathing at rest. The subject is sitting down. The time-keeper/recorder will give the subject the following instructions.“When I say start, begin counting your breaths. Breathe normally. ”The timekeeper tells the subject to start. After 1 minute, the time-keeper asks the subject how many breaths he or she has taken. Therecorder writes the number on the Worksheet under the subject’sn a m e .
4 .Teams will time the research subjects’ breathing rates afterjumping in place.
Explain breathing after exercise, and tell students that if they countthe number of breaths for 15 seconds and then multiply by four, theycan determine their breaths per minute. The timer/recorder tells thesubject, “When I say start, begin jumping up and down. After 1minute, I will say stop. Stop jumping and immediately start countingyour breaths.” The timekeeper tells the subject to start. After 1minute, the timekeeper tells the subject to stop jumping and startcounting breaths. After 15 seconds more the timekeeper asks for abreath count. The recorder writes the number of breaths on the work-sheet and multiplies it by 4 (or by whatever method students can dothis computation). The timekeeper asks the subject, “Were yourbreaths quicker after you exercised?” (Quicker means more breathsper minute.) The recorder writes down the answer.
STE P S

45 Breathing and Exercise
(Note to Te a c h e r s : If you feel that your classroom does not haveenough room for jumping, or that it might be too disruptive, studentscan instead stand up and sit down repeatedly for one minute. If anystudents are not feeling well or have a health condition that preventsexercising, they can observe or assist with timing.)
5 .Repeat Steps 3 and 4 until each team member has been thesubject.
If time allows for switching roles, repeat Steps 3 and 4.
6 .Teams present and compare results.
Have each team make a chart showing the results of their research.Have one member of the team present their prediction and results tothe class. Ask students what they notice about the results. Discusshow the results are the same, and how this shows that breathing isfaster when exercising. Also discuss how this is good for our healthbecause it brings more oxygen to our lungs. Then discuss the varietyof results. What factors could cause widely varying results? (P o s s i b l ea n s w e r s : Physical condition, respiratory conditions such as asthma.)How could the results for the whole class be shown?
Have students play a quick game of basketball or walk quickly up anddown a flight of stairs a few times rather than jumping up and down inp l a c e .
For Grades K-2, have the teacher test and record three students’ breath-ing rates at rest and after exercise as examples, rather than dividingstudents into teams. Also have the teacher be the timekeeper ratherthan the students. For the last step (Step 6, Comparing Results), havethe teacher (rather than the students) draw a chart of the results.
Expand the discussion to include the relationship between breathing,exercise, and air pollution. On days with poor air quality (such as highlevels of ground-level ozone), an increased breathing rate may make usmore vulnerable to the unhealthy impacts of air pollution. On such days,public health officials may advise people to reduce vigorous outdooractivities (such as running) and may suggest less strenuous activitiesinstead (such as walking).
Adapted from the California Air Resources Board, The KnowZone. URL: http://www. a r b . c a . g o v / k n o w z o n e / k n o w z o n e . h t m
Also see: U.S. Environmental Protection Agency’s AQI (Air Quality Index).URL: http://www. a i r n o w. g o v(click on “Kids” on left)
A DA P TATI O N
FOR FU RT H E REX PLO R ATI O N
R E S O U RC E S ,AC K NOW LE D G M E N TS

46Walking for Health & the Environment Curriculum
Grades 3-5
Comprehensive Health Curriculum
! Identify behaviors and environmental factors that influence function-ing of body systems (Learning Standard 1.2)
! Identify physical and psychological changes that result from participa-tion in a variety of physical activities (Learning Standard 2.4)
! Explain the benefits of physical fitness to good health and increasedactive lifestyle (Learning Standard 2.5)
“For Further Explanation” relates to the following Health CurriculumFrameworks standards:
! Describe types of natural resources and their connection with health(Learning Standard 13.1)
! Identify ways the physical environment is related to individual andcommunity health (Learning Standard 14.2)
! List practices and products that make living safer (Learning Standard 14.3 )
MA CURRICULU MFR A M E WORKS STA N DA R D S

47 Breathing and Exercise
Student Worksheet: Breathing and Exercise
1 . Prediction: Does a person breathe more or less during and after exercise such as jumping up and down compared towhen not exercising?
How much more or less? ________________
2 . Student A: ________________________________________________________________ (name)
At Rest: Breaths in one minute ________
After Exercise: Breaths in 15 seconds ________ x 4 = _________ breaths per minute
Is the breathing faster after exercising? ___________________
3 . Student B: ________________________________________________________________ (name)
At Rest: Breaths in one minute ________
After Exercise: Breaths in 15 seconds ________ x 4 = _________ breaths per minute
Is the breathing faster after exercising? ___________________
4 . Student C: ________________________________________________________________ (name)
At Rest: Breaths in one minute ________
After Exercise: Breaths in 15 seconds ________ x 4 = _________ breaths per minute
Is the breathing faster after exercising? ___________________
5 . Present your results as a chart.


49 Heart Rate and Exercise
Heart Rate and Exercise GRADES
3-5
Students will:
! Observe and measure how and why heart rate changes with physicala c t i v i t y.
! Understand the benefits of physical activity.
45 minutes – 1 hour
In this lesson, students will take pulse rates and count heart beats atrest, and again after a few minutes of dancing vigorously. The class willcompare and discuss their observations.
! Have you ever felt changes in your heart beat? Why do you think yourheart beat changes?
! What is the “pulse” (described below in Step #2)? ! Does a person’s heart rate change during exercise compared to when
sitting still? Why? ! Who might need to be careful about a faster heart rate? ( P o s s i b l e
a n s w e r : People with heart conditions, although some exercise isprobably good for them, under a doctor’s supervision.)
Exercise is good for our hearts. Exercise reduces the chances of us get-ting heart disease and diabetes, helps keep us from becoming over-weight, may increase how long we live, makes us feel better, and isoften fun. And walking, bicycling, or doing other exercise instead ofdriving places can help reduce air pollution by reducing the number ofcars on the road, because cars produce air pollution.
Our heart is a muscle. It becomes stronger if we exercise, which helps itpump more oxygen-rich blood to the rest of our bodies with each heart-beat. During exercise, such as walking or biking to school, our heartshelp give the other muscles in our body the extra energy that exerciserequires of us.
! Stethoscope (optional)! Toilet paper rolls for each team of students (to be used as stetho-
s c o p e s )! Stopwatch, watch, clock, or timer for each team (if there are not
E STI M ATED TI M E
S U M M A RY
KEY QUESTI O NS
B AC KG ROUND
M ATE R I A L S
LEA RNING OBJ E C TI V E S
This Safe Routes to Schools Curriculum has two purposes: To teach elementary school students—in ways that are stimulating and relevant to their lives—how walking is good for their bodies and good for the environment, while alsohelping teachers satisfy the requirements of the Massachusetts Curriculum Frameworks.

50Walking for Health & the Environment Curriculum
enough watches for each group, use the classroom clock as a timerfor the whole class)
! Tape or CD player (for dancing or other form of physical activity), ifavailable
! Student Worksheet (included)
1 .Have students form 2-person teams, then hand out materials.
Hand out the watches (if used), toilet paper rolls, and StudentWorksheets to each team.
2 .Demonstrate stethoscope and explain “pulse.”
Hold up the stethoscope and ask students if they have seen theobject before. Explain that medical personnel use a stethoscope tolisten to a patient’s heart. Explain to the students that a p u l s e can befound on parts of the body where arteries lie close to the surface. Apulse beats at the same rate as the heart. Inform students that theywill find their pulse and listen to each other’s heart beat during thisa c t i v i t y.
3 .Students count their own pulses and their partner’s heartbeats at rest.
Explain heart rate at rest. Help students locate their pulse on theirwrists, using their pointer finger and middle finger (not their thumbs).Explain to students that if they count the number of beats for 15 sec-onds and then multiply by 4, they can determine their heart rate perm i n u t e . Instruct each student to time his/her pulse for 15 seconds,then determine the number of beats per minute. Tell the students torecord their results on the Student Wo r k s h e e t .
Next, have students listen to their team member’s heart beat throughtheir “stethoscopes” (toilet paper rolls), again counting the beats for15 seconds, multiplying by 4, then recording the results on theirWorksheet.
4 .After a few minutes of dancing, students again count pulsesand heart beats.
Explain heart rate after exercise. Tell students that soon they willdance (or, select another physical activity) to music and then measuretheir heart rates after this exercise. Tell students to make room foreach other and not to bump into each other while dancing. (You maywant to move desks aside.) (If no CD or tape player is available, havestudents do jumping jacks or other exercise in place.)
STE P S

51 Heart Rate and Exercise
(Note to Te a c h e r s : If any students are not feeling well or have ahealth condition that prevents exercising, they can observe or assistwith timing. If you feel that your classroom does not have enoughroom for dancing, or that it might be too disruptive, students caninstead stand up and sit down repeatedly for five minutes.)
5 .Have students dance (or do other exercise). Record results.
Tell the students to start dancing when the music starts, that you willtell them when to stop, and that they should time their pulse againfor 15 seconds and then multiply it by 4, as before, as soon as theystop dancing. Tell them that they will record the results on theirWorksheets.
Begin playing the music tape or CD, stop the music after five minutes,and tell the students to stop dancing and count their pulses for 15seconds. Tell them to record the results.
6 .Compare results.
Tell students to compare their own and their partner’s heart ratebefore and after exercise on the student worksheet. Write some ofthe results on the board and discuss them as a class. Revisit some ofthe initial “Key Questions” above and additional questions, such as:
! Does a person’s heart rate change during exercise compared towhen sitting still? Why? ( A n s w e r : To bring more oxygen to the body.Our heart has to work harder and faster when we exercise so that itcan bring oxygen and nutrients to other parts of our body.)
! Besides exercise, what other times might your heart rate increase?(Possible answers: Stress, fear, and excitement; fever; even aftereating, to send more blood to the digestive system.)
Also discuss how increased heart rate is good for our health becauseit brings more oxygen to our muscles. Then discuss the variety ofresults. What factors could cause widely varying results? ( A n s w e r :Physical condition, heart conditions.) How could the results for thewhole class be shown? (Possible answer: On a graph or chart.)
For Grades K-2, the teacher can test and record three students’ heartrates at rest and after exercise as examples, rather than having theentire class do this. For the last step (Step 6, Compare Results), havethe teacher (rather than the students) record the results.
! Explain heart disease (e.g., cholesterol, HDL and LDL levels, highblood pressure, coronary artery disease) and diabetes (e.g., insulin) inmore detail, using previous classroom learning and/or additionalavailable information, e.g., websites (such as:
A DA P TATI O N
FOR FU RT H E REX PLO R ATI O N

52Walking for Health & the Environment Curriculum
http://adam.about.com/reports/00029_2.htm - see “Exercise”). Invitethe school nurse into the classroom to give students an overview ofthe heart and its functions and how exercise affects the heart.
! Expand the discussion to include the relationship between heart rate,exercise, and air pollution. Carbon monoxide pollution, which comesmostly from cars, can enter the blood and can prevent it from carryingoxygen to other parts of the body. Another type of pollution, calledparticle pollution, comes from burning wood, windblown dust, andcertain engines and factories, and can worsen certain heart-relateddiseases. On days with poor air quality, such as increased levels ofparticle pollution, an increased heart rate may make us more vulnera-ble to the unhealthy impacts of air pollution. On such days, publichealth officials may advise people to reduce vigorous outdoor activi-ties (such as running) and may suggest less strenuous activitiesinstead (such as walking).
! Conduct a field trip to a health club to examine different cardio-exer-cise equipment.
! Have students access the WebMD website on the Internet andresearch information on the heart and the importance of physicala c t i v i t y.
! Have students write a paragraph – from their heart’s point of view –explaining why it is important to exercise and take good care of theh e a r t .
Heart Rate and Physical Activity. The Educator’s Reference Desk. URL: http://www. e d u r e f . o r g /
U.S. Environmental Protection Agency’s AQI (Air Quality Index).URL: http://www. a i r n o w. g o v(click on “Kids” on left)
R E S O U RC E S ,AC K NOW LE D G M E N TS

53 Heart Rate and Exercise
Grades 3-5
Comprehensive Health Curriculum
! Identify behaviors and environmental factors that influence function-ing of body systems (Learning Standard 1.2)
! Identify physical and psychological changes that result from participa-tion in a variety of physical activities (Learning Standard 2.4)
! Explain the benefits of physical fitness to good health and increasedactive lifestyle (Learning Standard 2.5)
“For Further Explanation” relates to the following CurriculumFrameworks standards:
! Describe types of natural resources and their connection with health(Learning Standard 13.1)
! Identify ways the physical environment is related to individual andcommunity health (Learning Standard 14.2)
! List practices and products that make living safer (Learning Standard1 4 . 3 )
MA CURRICULU MFR A M E WORKS STA N DA R D S

54Walking for Health & the Environment Curriculum
Student Worksheet: Heart Rate and Exercise
Record your own and your partner's heart rates on this sheet.
A . Student A: ________________________________________________________________ (name)
At Rest: Pulse in 15 seconds ________ x 4 = _________ heart rate per minute
After Exercise: Pulse in 15 seconds ________ x 4 = _________ heart rate per minute
Is the heart rate faster or slower after exercise? ___________________
B . Student B: ________________________________________________________________ (name)
At Rest: Pulse in 15 seconds ________ x 4 = _________ heart rate per minute
After Exercise: Pulse in 15 seconds ________ x 4 = _________ heart rate per minute
Is the heart rate faster or slower after exercise? ___________________
C . Present your results as a chart.

55 Is the Air Good Where I Live?
Is the Air Good Where I Live? GRADES
3-5
Students will:
! Discover that ground-level ozone occurs in many areas of the country.! Discover that ground-level ozone problems are often associated with
human activities in population centers.
30 minutes
This Internet activity allows students to explore the different amountsof ground-level ozone in various areas of the country and develop anunderstanding of why more ground-level ozone may occur in certaina r e a s .
! Do people contribute to ground-level ozone pollution when they drivecars? (Answer: Yes) When they ride bicycles? ( A n s w e r : No) Whenthey walk? ( A n s w e r : N o )
! In what parts of the country do you think ozone pollution might be theworst? Why? (Possible answers: In cities; in places where the windhas blown the ozone pollution; in places with a lot of cars and/or fac-tories)
Ozone is a gas consisting of three oxygen atoms. There are two types ofozone: one kind is always good. This “good” ozone occurs naturally inthe stratosphere approximately 10 to 30 miles above the earth’s surface.This good ozone forms a layer that protects life on earth from the sun’sharmful ultraviolet rays.
The other kind of ozone is bad for people and for plants if there is a lotof it. Ozone at “ground-level” – that is, in the earth’s lower atmosphere– is bad if there’s too much of it because it is harmful to humans, ani-mals and plants. Ground-level ozone is a key ingredient in smog, whichis a mixture of air pollutants, including gases and fine particles, that canoften be seen as a brownish-yellow haze in the air. Ozone pollution cancause people to have breathing problems and can make plants weaker.Ground-level ozone comes mostly from motor vehicles that we drive,factories that make products we use, and power plants that produce oure l e c t r i c i t y. Ozone pollution is not produced directly from these sources.R a t h e r, heat and sunlight “bake” certain chemicals (nitrogen oxides, or
E STI M ATED TI M E
S U M M A RY
KEY QUESTI O NS
B AC KG ROUND
LEA RNING OBJ E C TI V E S
This Safe Routes to Schools Curriculum has two purposes: To teach elementary school students—in ways that are stimulating and relevant to their lives—how walking is good for their bodies and good for the environment, while alsohelping teachers satisfy the requirements of the Massachusetts Curriculum Frameworks.

56Walking for Health & the Environment Curriculum
N OX, from vehicles and power plants; and volatile organic compounds,or VOCs, from gasoline-powered cars, factories, and products such aspaints), which causes a chemical reaction and produces ozone. We a t h e ris an important factor in ozone formation – the most ground-level ozoneusually is formed in summertime. Also, wind can transport ozone“downwind” to other areas far from where it was formed, and pollutethose areas.
An easy way to remember the two types of ozone is: “good up high, badn e a r b y.”
! Internet access! If possible, printed color copies for students of the Air Quality Guide
for Ozone (from the website below; otherwise, students can workfrom the Internet)
! Student Worksheets (included)
1 .Hand out copies of the Air Quality Guide for Ozone.
If you have been able to print color copies of the Air Quality Guide forO z o n e , hand them out to the class.
2 .Visit the ozone project’s web site.
Have the class access the following Internet web site:h t t p : / / w w w. k 1 2 s c i e n c e . o r g / c u r r i c u l u m / a i r p r o j / l e s s o n s c o r e 1 . h t m l
3 .Explain what the Air Quality Index (AQI) is.
Tell students that the Air Quality Index, or AQI, is an index for report-ing daily air quality. It uses a simple color-coded scale to tell you howclean or polluted the air in a particular location is, and how you canprotect your health at different levels of pollution. There is an AQI forozone, and one for particle pollution. In this lesson, we are exploringthe AQI for ozone only. The AQI is like a yardstick that runs from 0 to500. The higher the AQI value, the greater the level of air pollutionand the greater the health concern. For example, an AQI value of 50represents good air quality with little potential to affect public health,while an AQI value over 300 represents hazardous air quality. ( N o t e :More information on the AQI is available at www. a i r n o w. g o v )
4 .View the Ozone Map and have students complete the StudentWorksheet.
On the ozone project website, have students open the page for theOzone Map and answer the questions on the attached StudentWorksheet. ( N o t e : In this curriculum we include a modified version ofthe website’s Student Worksheet to help students interpret what theair quality colors mean.)
STE P S
M ATE R I A L S

57 Is the Air Good Where I Live?
For Grades K-2, simplify the explanation of ground-level ozone in thesecond paragraph above under B a c k g r o u n d by omitting “Ozone pollutionis not produced directly from these sources. Rather, heat and sunlight“bake” certain other chemicals (nitrogen oxides, or NOX, and volatileorganic compounds, or VOCs…), which causes a chemical reaction andproduces ozone.” Also for Grades K-2, on the attached StudentWorksheet, you may want to assist the class in verbally (rather than inwriting) answering questions 7-9.
! Have students explore more information about ground-level ozonefrom the “Links” section of the website used for this activity.
! Have students explore “nitrogen oxides” and “volatile organic com-pounds” (or VOCs) on the Internet.
! Obtain and have the class watch the videotape Ozone DoubleTr o u b l e;this video discusses two ozone problems — the formation of toomuch ground-level ozone, and the deterioration of the protectiveu p p e r-level ozone layer. While watching the video, students can com-plete a “3-2-1 Sheet” – 3 things they learned; 2 things they want toknow more about; and 1 idea they want to write about. Contact infor-mation for Ozone DoubleTr o u b l e video: U.S. EPA Office of Air QualityPlanning and Standards (OAQPS), Education and Outreach Group at:URL: http://www.epa.gov/air/oaqps/eog/contact.html
Air Pollution: What’s the Solution? project, developed by the U.S. EPA ,the Northeast States for Coordinated Air Use Management, and theCenter for Innovation in Engineering & Science Education.URL: http://www. k 1 2 s c i e n c e . o r g / c u r r i c u l u m / a i r p r o j /
Also see US Environmental Protection Agency’s AIRNow website atURL: http://www. a i r n o w. g o v
Grades 3-5
Science and Technology/Engineering Curriculum
Earth and Space Science – We a t h e r
! Explain how air temperature, moisture, wind speed and direction, andprecipitation make up the weather in a particular place and time(Learning Standard 6)
! Differentiate between weather and climate (Learning Standard 9)
Life Science (Biology) – Adaptations of Living Things
! Give examples of how organisms can cause changes in their environ-ment…explain how these changes may affect the ecosystem(Learning Standard 10)
A DA P TATI O N
FOR FU RT H E REX PLO R ATI O N
R E S O U RC E S ,AC K NOW LE D G M E N TS
MA CURRICULU MFR A M E WORKS STA N DA R D S

58Walking for Health & the Environment Curriculum
Technology/Engineering
! Identify materials used to accomplish a design task based on a specific property…(Learning Standard 1.3)
Appendix V:Historical and Social Context for Science andTechnology/Engineering Study
! How government, industry, and/or individuals may be responsible fornegative effects; damage to the environment or ecosystems…; somesources of damage or pollution ( I V. Unintended negative effect…)
Mathematics Curriculum
Patterns, Relations, and Algebra
! Use pictures, models, tables, charts, graphs, words, number sen-tences, and mathematical notations to interpret mathematical rela-tionships (Learning Standard 4.P. 4 )
Comprehensive Health Curriculum
! Describe types of natural resources and their connection with health(Learning Standard 13.1)
! Identify ways the physical environment is related to individual andcommunity health (Learning Standard 14.2)
MA CURRICULU MFR A M E WORKS STA N DA R D S( CO N T. )

59 Is the Air Good Where I Live?
Student Worksheet: Is the Air Good Where I Live?
N a m e :_ _ _ _ _ _ _ _ _ _ _ _ _ _ _ _ _ _ _ _ _ _ _ _ _ _ _ _ _ _ _ _ _G r o u p :_ _ _ _ _ _ _ _ _ _ _ _ _ _ _ _ _ _ _ _ _ _ _ _ _ _ _ _ _ _ _ _ _ _ _ _ _ _ _ _ _ _ _ _
Ozone Map
Look at the “Air Quality Guide for Ozone,” then look at the “Ozone Map” on the website:h t t p : / / w w w. k 1 2 s c i e n c e . o r g / c u r r i c u l u m / a i r p r o j / l e s s o n s c o r e 1 . h t m l
Then answer the following questions:
1 . Next to each Air Quality category listed below, write the name of the color that is used on the map for thatcategory:
2 . Find Los Angeles, CA on the map. What is the air quality in Los Angeles? Circle:
G o o d M o d e r a t e Unhealthy for U n h e a l t h y Ve r ySensitive Groups U n h e a l t h y
3. Find another city on the map that has the same air quality as Los Angeles. Write the city and state below.
4. Find two cities on the map where the air quality is “unhealthy for sensitive groups.” Write the city names andstates below.
5. From information on the “Air Quality Guide for Ozone,” list three “sensitive groups.”
Air Quality Category Color Used
G o o d
Very Unhealthy
Unhealthy for Sensitive Groups
M o d e r a t e
U n h e a l t h y

60Walking for Health & the Environment Curriculum
N a m e :_ _ _ _ _ _ _ _ _ _ _ _ _ _ _ _ _ _ _ _ _ _ _ _ _ _ _ _ _ _ _ _ _G r o u p :_ _ _ _ _ _ _ _ _ _ _ _ _ _ _ _ _ _ _ _ _ _ _ _ _ _ _ _ _ _ _ _ _ _ _ _ _ _ _ _ _ _ _ _
6 . Are there any cities on the map with good air quality? If so, list three.
7 . Where are most of the red and orange areas on the map, near or far away from cities?
8 . Write a sentence that compares the kinds of places where air quality is good with the kinds of areas where airquality is unhealthy.
9 . What are the cautions, or health concerns, for orange areas, where the air is unhealthy for sensitive groups?How do you think someone from a sensitive group might be affected if they lived in one of those areas?
Student Worksheet: Is the Air Good Where I Live? (Cont.)

61 Smog City 3-5
Smog City 3-5 GRADES
3-5
Students will:
! Learn which weather conditions and human activities can affect airp o l l u t i o n .
! Make and test hypotheses.! Learn how changes in air quality can affect people’s health.
30 – 45 minutes
In this activity, the class will briefly discuss the impacts of differentvariables – such as emissions, temperature, and wind – on ground-levelozone. Then students will use an interactive website called Smog Cityto simulate different conditions and observe their impacts on ozone andhuman health. The website will help students make the connectionbetween weather, human activities (such as driving and factory produc-tion), air pollution, and people’s health.
! Do you think automobiles affect air quality? ( A n s w e r : Ye s .Automobiles release emissions (chemicals from their tailpipes) intothe air that cause pollution. Generally, the more cars there are on theroad, the more emissions there are, and the more air pollution.)
! Do you think wind affects air pollution? ( A n s w e r : Yes. Wind can blowair pollution away from some places and into other places. Lack ofwind can keep air pollution in one place.)
! Do you think air temperature affects air pollution? ( A n s w e r : Ye s .Increased air temperature can increase certain kinds of air pollution,which can cause health problems if people breathe it in.)
! How could we reduce air emissions from cars? ( A n s w e r : We coulddrive less, and walk more. We could drive hybrid cars.)
! How do you think we might reduce the effects of air pollution on ourhealth? ( A n s w e r : We can limit the time we are active outdoors oncertain days when air pollution is bad.)
The expression “smog” was first used in “Turn-of-the-Century” Londonaround 1900 to describe a combination of “smoke” and “fog.”Thousands of Londoners died of pneumonia-like diseases due to the
E STI M ATED TI M E
S U M M A RY
KEY QUESTI O NS
B AC KG ROUND
LEA RNING OBJ E C TI V E S
This Safe Routes to Schools Curriculum has two purposes: To teach elementary school students—in ways that are stimulating and relevant to their lives—how walking is good for their bodies and good for the environment, while alsohelping teachers satisfy the requirements of the Massachusetts Curriculum Frameworks.

62Walking for Health & the Environment Curriculum
poisonous air. Smog can cause health problems such as difficultybreathing, asthma, reduced resistance to lung infections, colds, and eyeirritation. The haze that accompanies smog reduces how far we can seeinto the distance (called visibility). This reduced visibility is particularlynoticeable at mountains and other beautiful vistas such as nationalp a r k s .
To d a y, smog usually contains a pollutant called ozone, among otherthings. Ozone is formed when certain chemicals that pollute the air arebaked by the sun and undergo chemical reactions. The chemicals thatform ozone come from many sources, including automobile exhaust(also called emissions), factory and power plant smokestacks, andfumes from chemical solvents in some household products, such aspaints. In addition to the health problems already mentioned, the ozonein smog also can damage plants and trees.
Weather conditions can affect smog. For example, wind can blow airpollution away from some places and into other places. A lack of windor a thermal inversion (discussed in Step 4 below) can cause smog to betrapped over a particular area. Serious smog and ozone pollution occursin many major cities and sometimes in rural areas.
! Internet access! Writing paper
1 .Review new vocabulary with the students.
Review new terms as needed, such as:
! Temperature inversion (or thermal inversion or inversion layer) – Alayer of warm air in the Earth’s atmosphere that traps cooler air andpollution, including ground-level ozone, below it. (See diagram of atemperature inversion at the end of this lesson, also at:h t t p : / / w w w. p a r t n e r s i n a i r. o r g / e n / c u r r i c u l u m _ u n i t 1 b _ b k g d 1 . h t m l . )
! E m i s s i o n s – Exhaust from tailpipes of vehicles that often containsseveral major air pollutants, including carbon monoxide (CO), hydro-carbons (HC), and nitrogen oxides (NOx); some releases from indus-try smokestacks and consumer products are also emissions.
! Ground-level ozone – Ground-level ozone is formed from a combina-tion of volatile organic compounds (VOCs) and oxides of nitrogen(NOx) in the presence of strong sunlight and high temperatures.
2 .Demonstrate activity to students.
You may want to demonstrate this activity first to the class, either ata computer or on a projection screen, prior to students performing itthemselves. Tell students in advance not to click on anything in the
STE P S
M ATERIALS

63 Smog City 3-5
program until you tell them to. Then have students access the SmogCity program on the Internet at: http://www. s m o g c i t y. c o m
3 .Have students read about and start the program.
Have students click on the “Help” menu and read the informationunder the heading “Here’s how you control a day in Smog City” tohelp them understand the meaning of the “knobs” in the program. Tostart the program, click on “Run Smog City” on the left side of thet o o l b a r.
4 .Explain the key factors.
Remind students not to click on anything just yet (it’s very tempting!).Tell students that several things in the picture can affect whether ornot smog occurs. Mention each item shown:
Weather conditions ! Te m p e r a t u r e! Whether there is an inversion layer. (Explain to the class what an
inversion layer is: An inversion layer occurs when the usual temper-ature arrangement in the atmosphere – which is warm air belowcold air – is reversed, trapping pollutants along with the cooler airbelow the layer of warm air.) ! Wind speed! Whether it’s a sunny or cloudy day
Population level( Tell Students: Both population levels and emission levels are thingsthat are within the control of people, while weather conditions aren o t . )
Emissions levels - from:! Cars and trucks! Off-road vehicles! I n d u s t r y! Consumer products
Ozone levels – Tell students that the colors shown to the right ofthe words “Ozone Levels” tell whether the air is clean or polluted.Green means the air is clean. Yellow means the air is mediumclean, or moderate. Orange means the air is unhealthy for sensitivegroups. Red means the air is unhealthy for all people. Purple meansthe air is very unhealthy.
Health Effects at Peak Ozone Level – Tell students that the colorhere corresponds to one of the colors of the ozone-levels chartabove it and indicates the highest, or peak, ozone level for a partic-ular day. Below this color is a section that tells the health warnings,if any, for this amount of ozone in the air.

FOR FU RT H E REX PLO R ATI O N
64Walking for Health & the Environment Curriculum
5 .Ask students to hypothesize, then have them raise the emis-sion levels from cars and trucks.
Ask the students what they think would happen if they raised theemission levels a lot from cars and trucks. Then tell students to goahead and raise the emission levels significantly from cars and trucks,click “Start,” and record the results. You can choose to do this eitherwith the class as a whole, or students can work individually. Discuss:Did the change they expected to occur happen when they raised theemissions levels?
6 .Discuss results.
Ask the class: Did the “ozone level” (green, yellow, orange, red)change when they raised the emission levels from cars and trucks?(See Smog City d i s p l a y. )
7 .Discuss any health warnings.
Then ask the class: Are there any health warnings associated withthis ozone level? (See the Smog City d i s p l a y.) Read and discuss thehealth warnings in the “Health Effects at Peak Ozone Level” section.
8 .Have students change other factors.
As time allows, repeat this exercise for the other items in Smog City,such as weather (e.g., air temperature, wind speed), population level,and/or other emission levels (e.g., off-road vehicles, industry, con-sumer products). Each time, before students make a change, ask themwhat impact they expect the change will have on ozone levels. Thenhave students make dramatic changes so that differences in ozonelevels are more likely to occur.
N o t e : Students will need to press “Restart” to go back to the originalconditions, then make one change, then press “Start.” (If they try tomake more than one change at a time, the results may not be accu-rate.) Ask students to observe and comment on whether theirhypotheses were correct, and what resulted after these changes weremade.
For younger students (K-2), see the Smog City lesson plan in this cur-riculum prepared for that age group.
Encourage students to continue exploring Smog City, either in classand/or at home, to learn more about the relationships between weath-e r, human activities, ozone pollution, and health. In particular, havethem open “What You’ll Learn” on the homepage toolbar and performthe experiments there.
A DA P TATI O N

65 Smog City 3-5
Smog City was developed under a U.S. Environmental ProtectionAgency grant and is a copyright of the Sacramento Metropolitan AirQuality Management District. Smog City is authorized for use as an edu-cational and demonstration tool and may be downloaded for non-profituse by the general public, other agencies, associations, and educationalinstitutions. Smog City: Copyright 1999 Sacramento Metropolitan AirQuality Management District.
Grades 3-5
Science and Technology/Engineering Curriculum
Earth and Space Science – We a t h e r
! Explain how air temperature, moisture, wind speed and direction, andprecipitation make up the weather in a particular place and time(Learning Standard 6)
! Differentiate between weather and climate (Learning Standard 9)
Life Science (Biology) – Adaptations of Living Things
! Give examples of how organisms can cause changes in their environ-ment…explain how these changes may affect the ecosystem(Learning Standard 10)
Appendix V:Historical and Social Context for Science andTechnology/Engineering Study
! How government, industry, and/or individuals may be responsible fornegative effects; damage to the environment or ecosystems…; somesources of damage or pollution ( I V. Unintended negative effect…)
Comprehensive Health Curriculum
! Describe types of natural resources and their connection with health(Learning Standard 13.1)
! Identify ways the physical environment is related to individual andcommunity health (Learning Standard 14.2)
R E S O U RC E S ,AC K NOW LE D G M E N TS
MA CURRICULU MFR A M E WORKS STA N DA R D S

66Walking for Health & the Environment Curriculum

67 Smog City 3-5


69 Traffic Tally
Traffic Tally GRADES
3-5
Students will:
! Design and conduct a traffic survey to explore traffic volumes on keylocal roads.
! Collect, analyze, and present observational data.! Understand the connection between vehicle traffic, air pollution, and
h e a l t h .
Approximately 1.5 – 2 hours (2-3 sessions)
This activity is a mini-field trip that provides students with hands-onexperience in conducting a traffic survey in their own community, ana-lyzing their data, and presenting it in a graphic form that shows trafficvolumes.
! Do you think there is too much traffic along the main (2-lane) roads inyour community? If so, how many vehicles do you think travel alongthese roads during morning rush-hour traffic? How many people doyou think are typically in each vehicle?
! How might the amount of traffic be reduced? (Possible answers: M o r epeople walking, bicycling, carpooling, and taking subways, trains, andb u s e s )
! How might the amount of air pollution from this traffic be reduced?(Possible answers: Having fewer vehicles on the road; driving smalleror hybrid cars; more people walking, bicycling, carpooling, and takingsubways, trains, and buses)
! What might be some of the benefits of reducing traffic and air pollu-tion from vehicles? (Possible answers: Fewer traffic jams; saferstreets to walk and bike on; fewer health problems from air pollution,such as breathing problems [e.g., asthma], and heart disease; andpossibly healthier people because more people might be walking andgetting exercise)
! What things might affect the accuracy of a traffic survey’s results?(Possible answers: Bad weather; if the day was a holiday; if differentgroups started counting traffic at different times; if some peoplemissed counting some vehicles; if some people put some vehicles intothe wrong categories; if some people “double-counted” some vehi-c l e s )
E STI M ATED TI M E
S U M M A RY
KEY QUESTI O NS
LEA RNING OBJ E C TI V E S
This Safe Routes to Schools Curriculum has two purposes: To teach elementary school students—in ways that are stimulating and relevant to their lives—how walking is good for their bodies and good for the environment, while alsohelping teachers satisfy the requirements of the Massachusetts Curriculum Frameworks.

70Walking for Health & the Environment Curriculum
! What vehicles produce the most pollution per person? ( P o s s i b l eanswer: Trucks, with just one person in them.) What vehicles producethe least pollution per person? (Possible answer: B i c y c l e s )
Increased traffic is a chronic problem in many local communities. It is aconcern because often the increase in traffic increases accidents andsafety problems, decreases quality of life, and lengthens the time ittakes to get places. Increased traffic is also a health and environmentalconcern, because more vehicles on the road means more air pollution,since gasoline-powered vehicles release pollutants such as carbon diox-ide and nitrogen oxides into the air. And more air pollution can makepeople have breathing and heart problems. Also, driving more, insteadof walking or bicycling, means we get less exercise, which can makepeople gain weight, which sometimes contributes to health problemssuch as heart problems and diabetes. Traffic is an environmental andeconomic concern for another reason as well: more cars on the roadmeans more gasoline is used to run those cars. Gasoline is made fromoil, of which there is a limited amount in the world.
! Pencils and erasers! Watches with minute/second hands, stopwatches, or clicker counters! Clipboards (if available)! Additional staff support (classroom assistants or parent volunteers)! Signed parental consent forms (if taking students off of school prem-
i s e s )! Student Worksheets (included)
1 .Preparation. Determine ahead of time:
! Make important arrangements, such as obtaining parental per-mission slips to go to off-school locations, and getting commit-ments from adult classroom assistants and/or parent volunteers toaccompany the class groups. (Note: If going offsite is problematic,you can instead conduct the traffic survey on school premises, nearthe driveway to the school.)
! Choose the roads on which the class will survey traffic vol-ume and vehicle types. Choose a minimum of two roads, forcomparison purposes. Choose roads that are within easy walkingdistance of the school, and are busy 2-lane (one travel lane eachdirection) roadways. Select a time of day when the roads havemoderately busy traffic, such as morning rush hour. The number ofroads chosen will depend on how many groups you want to dividethe class into (which in turn will depend in part on how many adultassistants/volunteers you have, and the size of your class). ( N o t e :
STE P S
B AC KG ROUND
M ATE R I A L S

71 Traffic Tally
The class will not be surveying major 4-lane or larger highways; thepurpose is to determine local/community traffic impacts.)
! Give students an overview of the traffic survey. Inform stu-dents that the class will conduct a traffic survey to explore trafficvolumes on key local roads, and the connection between vehicletraffic and air pollution. Discuss the “Key Questions” above withthe class. Tell the class that they will divide up into groups of atleast 6 students per group, stand safely by the sides of differentbusy roads, and count the number of vehicles driving by for a fif-teen-minute period (e.g., during morning rush hour). They will alsoidentify the type of each vehicle (e.g., car, truck, etc.) and the num-ber of people in each vehicle.
! Explain a tally chart. Tell students that to conduct the survey,they will make tally charts that keep track of the number and typesof vehicles and the number of people in each vehicle, and that theclass is first going to practice making these charts. On the chalk-board, illustrate tally marks:
2 .Practice a traffic tally in class.
Tell students to use the back of their Student Worksheets to practicerecording the number and types of vehicles that you will list for them.Then call out the names of the vehicle types listed below; do it quick-ly to simulate rapid traffic flow so that students can practice perform-ing quick tallys, which they will need to do by the roadside. For sim-p l i c i t y, tell students to consider SUVs and vans as “cars” and toignore motorcycles.
Tell students to swap tally sheets and check for correct answers foreach type of vehicle as you read aloud the totals listed below.
Totals: Bicycle = 7 Car = 41 Truck = 18 Bus = 4
C a r C a r C a r Tr u c k B i c y c l e Tr u c k C a r Tr u c k C a r Tr u c k
C a r C a r Tr u c k B u s Tr u c k B i c y c l e C a r C a r C a r C a r
C a r C a r B i c y c l e Tr u c k C a r C a r Car B i c y c l e Tr u c k C a r
Tr u c k C a r C a r C a r Tr u c k C a r C a r B i c y c l e Tr u c k Tr u c k
C a r C a r C a r C a r Tr u c k Tr u c k B u s B u s C a r C a r
C a r Tr u c k C a r B i c y c l e Tr u c k C a r C a r C a r C a r Tr u c k
B u s C a r Tr u c k B i c y c l e C a r C a r C a r C a r C a r C a r

72Walking for Health & the Environment Curriculum
3 .Explain roles.
Explain to students that they will conduct the survey in four pairs:
1st Pair: One person will call out loud to their partner each time avehicle passes in one direction (one side of the street) thetype of the vehicle (e.g., “car,” “truck”), while the otherpartner will record the data on the Tally StudentWorksheet #1.
2nd Pair: One person will call out vehicles passing in the otherd i r e c t i o n (on the other side of the street), while the otherpartner records the data.
3rd Pair: One person will call out the number of people in eachvehicle in one direction, while the other partner willrecord the number of persons per vehicle. For buses, havethe students determine an estimate of the number ofpeople they will use (e.g., average of 15 people per bus)and make sure all students are using the same number.
4th Pair: One person will call out the number of people in eachvehicle in the other direction, while the other partner willrecord the number of persons per vehicle. For buses, usethe same estimated average number of people as dis-cussed in “3rd Pair” above, and make sure all students areusing the same number.
4 .Explain methodology.
Also explain to the class that in order for the survey to be accurate, itis important that each group and each pair of students do thingsexactly the same way. For example, each group must start the surveyat the same time, and each group must conduct the survey for exactly15 minutes – not longer and not shorter.
5 .Assign roles.
Assign the students to survey groups and assign an adult assistant toeach group. Have students in each group divide up into pairs; helpthem decide who will be an “announcer” (calling out the type of eachvehicle that passes, or the number of people in each vehicle) and whowill be the “recorder” in each pair. Assign one person (perhaps theadult assistant) to be the timekeeper, who will tell students when tobegin and end the survey and will record the exact starting and end-ing times.
6 .Conduct the traffic survey.
Conduct the traffic survey at the designated locations, using StudentWorksheet #1. If possible, don’t have students cross any streets. Be

73 Traffic Tally
sure to remind students to practice safety: stand back from the road-way; if crossing a street is necessary, do so carefully when the adultassistant says it is safe to do so. Make sure students are standing ina way that allows other pedestrian to pass easily, and that they arepolite to people.
7. Discuss and analyze survey results in class.
! Calculate totals. Back in the classroom (on the same day oranother day), have each group add up the totals for their group,including the total number of vehicles, and the total number of eachtype of vehicle, using Student Worksheet #2. Also have each groupadd up the total number of people traveling in these vehicles. Ask aspokesperson from each group to read aloud the totals for theirgroup, write these on the chalkboard, and add up the totals for theentire class.
! Discuss results. Compare and contrast the different categories foreach group. Which roadway had the most traffic? Why does theclass think this is so?
! Calculate different vehicle types. Of the total traffic, have theclass calculate the portion of each vehicle type (e.g., cars, trucks,buses, bicycles). For younger students, this might be calculated asfractions. For older students, this might be calculated as fractionsand percentages.
! Discuss the accuracy of the methodology and results. I d e n t i f yany potential problems regarding the data collection methods: Didone group collect data for 20 minutes instead of 15? Did some peo-ple miss counting some vehicles (e.g., because they weren’t payingattention, because they sneezed, etc.)? Did some people “double-count” one or more vehicles? Could students really see the numberof passengers inside vehicles? Did some people put certain types ofvehicles in the wrong categories? Did one group start earlier orlater than another group? Did the weather suddenly change duringthe tally? Inform the class that any of these or other factors canaffect the accuracy of the survey results. Ask the class if they haveany ideas about how the survey could have been done more accu-r a t e l y.
8 .Discuss the relationship between traffic volume, number ofpeople in vehicles, and air pollution.
Ask: If the number of vehicles on the road were reduced, might thisreduce air pollution? (Correct answer: Yes). Why? (Correct answer:Because gasoline-powered vehicles emit air pollutants, and fewervehicles would mean less pollution.) What are some benefits fromreducing air pollution? (Correct answer: Fewer breathing problems,

74Walking for Health & the Environment Curriculum
like asthma, less heart disease, and more people might get exerciseby walking or bicycling instead of driving. Healthier trees and plants.Also reducing some sources [vehicles] of global warming.). Also dis-cuss how fewer vehicles, ones that have higher miles-per-gallon, car-pooling, and using public transportation would use less gasoline andthus produce less pollution.
9 .Have students present the survey results.
Either the same session or on another day, tell the class that they willnow prepare a presentation of the traffic survey data. Depending ontime available, either assign how the class should present the data,o r, if more time is available, have the class discuss different ways ofpresenting the data and determine the best way to present the infor-mation (e.g., line graph, pie chart, pictogram, and/or bar graph). Iftime permits, you may want to have different groups present theirdata results in different ways.
Building on prior classroom experience with the different presentationformats, explain to the class how to develop the type of presentationformat you choose. Decide what units, scales, colors, symbols, spac-ing, etc. to use, as appropriate. If computers are available, considerhaving students check the Internet or use relevant software to createcharts or graphs.
10. Class display.
Have the students create a class display of the survey results.
11. Discuss presentation methods.
Discuss which type(s) of chart or graph conveys the information mosteffectively and why.
For Grades K-2, conduct the traffic survey as a whole class instead ofdividing up into groups (with enough adult classroom assistants). Havethe teacher and adult assistants, rather than the students, count thenumber of cars and people in the cars. Back in class, the teacher cancall out the totals for the students to record. For presentation purposes,help the students develop pictograms and/or pie charts (instead of morecomplex bar graphs, etc.).
Have students explore the mean and range of the different groups’ datasets and of the grand totals. Have students develop a database, com-puterized if possible, of the data collected.
If your school is near a busy village business district where there is a lotof foot traffic, students can tally the numbers of pedestrians (in additionto vehicles) along a road. This exercise, and the accompanying four pho-
FOR FU RT H E REX PLO R ATI O N
A DA P TATI O N

75 Traffic Tally
tographs at the end of this lesson, can show students how much lessspace is taken up by people on foot or bicycles than by people in cars. Itcan also prompt a discussion about polluting versus non-polluting modesof travel. Perform this pedestrian traffic tally at a time of day that’s busyfor shops and stores, such as lunchtime. Assign a fifth pair of students tocount pedestrians – one student for each sidewalk along the road.
UK Department for Transport Primary School Teaching Resource –Numeracy: Local Traffic Survey. URL: www. d a t a b a s e s . d f t / g o v. u k /p r i m a r y / s i t e i n d e x
The Beacon School Interactive Website – Geography Department.URL: www. b e a c o n s c h o o l . c o . u k / g e o g r a p h y / f i e l d w o r k / h o m e 2 0 0 4 /t r a f f i c i n f o . h t m
The Tampa Tribune – “Packing Pavement,” 7/18/99, by Jim Beamguard,w r i t e r, and Phil Sheffield, photographer. Photos used with permission.Complete article can be viewed online at URL: www. s w t . o r g / s h a r e /b g u a r d . h t m l
Grades 3-5
Mathematics Curriculum
Number Sense and Operations
! Add and subtract (up to four-digit numbers) and multiply (up to two-digit numbers by a one-digit number) accurately and efficiently(Learning Standard 3.N.10)
! Select and use appropriate operations (addition, subtraction, multipli-cation, and division) to solve problems…(Learning Standards 3.N.8and 4.N.10)
! Add and subtract (up to five-digit numbers) and multiply (up to threedigits by two digits) accurately and efficiently (Learning Standard4 . N . 1 2 )
! Accurately and efficiently add and subtract whole numbers and posi-tive decimals. Multiply and divide (using double-digit divisors) wholen u m b e r s …(Learning Standard 5.9.12)
Patterns, Relations, and Algebra
! Use pictures, models, tables, charts, graphs, words, number sen-tences, and mathematical notations to interpret mathematical rela-tionships (Learning Standard 4.P.4).
! Represent real situations and mathematical relationships with con-crete models, tables, graphs, and rules in words and with symbols,e.g., input-output tables (Learning Standards 5.P. 4 )
R E S O U RC E S ,AC K NOW LE D G M E N TS
MA CURRICULU MFR A M E WORKS STA N DA R D S

76Walking for Health & the Environment Curriculum
M e a s u r e m e n t
! Identify time to the minute on analog and digital clocks using a.m.and p.m. Compute elapsed time, using a clock for times less than onehour (i.e., minutes since)…(Learning Standards 3.M.3 and 4.M.3)
Data Analysis, Statistics, and Probability
! Collect and organize data using observations, measurements, surveys,or experiments, and identify appropriate ways to display the data(Learning Standards 3.D.1 and 4.D.1)
! Match representations of a data set in the forms of tables, line plots,pictographs, tallies, or bar graphs with the actual data set ( L e a r n i n gStandard 3.D.2)
! Construct and draw conclusions from representations of data sets inthe forms of tables, line plots, pictographs, tallies, and bar graphs(Learning Standard 3.D.3)
! Match a representation of a data set such as lists, tables, or graphs(including circle graphs) with the actual set of data ( L e a r n i n gStandard 4.D.2)
! Construct, draw conclusions, and make predictions from various rep-resentations of data sets, including tables, bar graphs, pictographs,line graphs, line plots, and tallies (Learning Standard 4.D.3)
! Given a set of data, find the median, mean, mode, maximum, mini-mum, and range, and apply to solutions of problems ( L e a r n i n gStandard 5.D.1)
! Construct and interpret line plots, line graphs, and bar graphs.Interpret and label circle graphs (Learning Standard 5.D.2)
Science and Technology/Engineering Curriculum
Technology/Engineering Learning Standards
! Describe different ways in which a problem can be represented, e.g.,sketches, diagrams, graphic organizers, and lists (Standard 2.3)
Appendix V: Historical and Social Context for Science andTechnology/Engineering: Topics for Study
! How government, industry, and/or individuals may be responsible fornegative effects. Some sources of damage or pollution ( I V. Unintendednegative effects from uses of science and technology/engineering)
Comprehensive Health Curriculum
! Describe types of natural resources and their connection with health(Learning Standard 13.1)
! Identify ways the physical environment is related to individual andcommunity health (Learning Standard 14.2)
! List practices and products that make living safer (Learning Standard14.3 (Public Health)

77 Traffic Tally
Student Worksheet #1: Traffic Tally
Tally Sheet for Traffic Survey
Location (name of road, and main intersection if appropriate): _______________________________
Fill out while conducting the traffic survey:
Number of Each Vehicle Ty p e
Number of People in Each Ve h i c l e
Tally Totals
Cars
Trucks
Buses
Bicycles
C a r s Tr u c k s B i c y c l e s B u s e s( e s t i m a t e )

78Walking for Health & the Environment Curriculum
Student Worksheet #2: Traffic Tally
Survey Analysis and Presentation
Location (name of road, and main intersection if appropriate): _______________________________
Fill out in classroom after conducting survey:
Total number of cars: _ _ _ _ _ _ _ _ _ _ _ _ _ _ _ _ _ _ _ _ _ _ _ _ _
Total number of trucks: _ _ _ _ _ _ _ _ _ _ _ _ _ _ _ _ _ _ _ _ _ _ _ _
Total number of buses: _ _ _ _ _ _ _ _ _ _ _ _ _ _ _ _ _ _ _ _ _ _ _ _
Total number of bicycles: _ _ _ _ _ _ _ _ _ _ _ _ _ _ _ _ _ _ _ _ _ _
Total number of all types of vehicles: _ _ _ _ _ _ _ _ _ _ _ _ _
Present your survey results (as a line graph, pie chart, bar graph, and/or pictogram, as your teacher instructs you).
Total number of people in cars: _ _ _ _ _ _ _ _ _ _ _ _ _ _ _ _ _ _ _
Total number of people in trucks: _ _ _ _ _ _ _ _ _ _ _ _ _ _ _ _ _ _
Estimated total people in buses:_ _ _ _ _ _ _ _ _ _ _ _ _ _ _ _ _ _ _
Total number of people on bicycles: _ _ _ _ _ _ _ _ _ _ _ _ _ _ _ _
Total number of people, all vehicles types: _ _ _ _ _ _ _ _ _ _ _

79 Traffic Tally

80Walking for Health & the Environment Curriculum

81 Traffic Tally

82Walking for Health & the Environment Curriculum

83 Too Many Blankets - #1
Too Many Blankets - #1 GRADES
3-5
Students will:
! Read thermometers andcompare differenttemperatures overt i m e .
! Observe how anincrease in heat inthe air raises theair temperature.
! Understand that thetanks are like the Earthand the lamps are like the sun.
! Understand that the Earthwill grow warmer ifmore greenhousegases are releasedinto the air.
! Understand thatsome sources ofpollution arecaused by people,and that pollution canhave an effect on the air andthe Earth.
1fi hours
In this activity, students will set up two aquarium tanks with lamps tosimulate the earth and the sun—one tank with no cover as the normalatmosphere, and one with a plastic or glass cover to simulate the “blan-keting” effect of increased greenhouse gases. Students will observeand record how air temperature in the tank with the cover heats upmore—just as greenhouse gases trap heat in the air around the Earth,causing the atmosphere and Earth to get warmer. (“Too Many Blankets -Lesson #2” extends this activity by exploring the effects of global warm-ing, focusing on the melting of icecaps and glaciers.)
E STI M ATED TI M E
S U M M A RY
LEA RNING OBJ E C TI V E S
This Safe Routes to Schools Curriculum has two purposes: To teach elementary school students—in ways that are stimulating and relevant to their lives—how walking is good for their bodies and good for the environment, while alsohelping teachers satisfy the requirements of the Massachusetts Curriculum Frameworks.

84Walking for Health & the Environment Curriculum
! Ask students if they think that turning the lamps on will make any-thing happen in the tanks - you can give them a hint that it mighthave something to do with temperature. ( A n s w e r : The heat from thelamps will make the air in the tank and most things in the tankw a r m e r. )
! Explain to students that one tank will have a cover on it and the othertank will not. Then ask: Do you think one of the tanks will heat upmore than the other tank? Which one? ( A n s w e r : The tank with thecover will heat up more.) Why? ( A n s w e r : The cover traps heat in thetank.)
The air around us acts like a blanket to keep the Earth warm enoughfrom the heat of the sun for us to live on it. But when certain gases arein the air, they might make the air and the Earth too warm. These gasesare called “greenhouse gases.” They trap heat in the air around theEarth, and the Earth heats up – like a glass greenhouse that peoplegrow plants in: inside the greenhouse it is much warmer than outside ofit. Having greenhouse gases in the air is kind of like adding blankets toyour bed at night. The more blankets you add, the warmer you become.The more heat-trapping gases there are in the air, the more of the sun’sheat is trapped, and the warmer the Earth becomes. This warming ofthe Earth is called global warming.
N o t e : If possible, set up both tanks simultaneously so that students cancompare the two systems at the same time. Especially for younger stu-dents, such comparisons will provide concrete representation andobservation of the abstract concept of global warming.
! Two small aquarium tanks! Glass cover for one of the tanks (or, plastic cover or plastic food-wrap)! Modeling compound (water- r e s i s t a n t )! Rocks and pebbles! Small houses! Small people figures and vehicles! Two clamp lamps with 60-watt bulbs! Two student thermometers! Ta p e! R u l e r s! C l o c k! P e n c i l s! Grease pencil or marker
KEY QUESTI O NS
B AC KG ROUND
M ATE R I A L S

85 Too Many Blankets - #1
STE P S 1 .Create small worlds inside the two aquariums tanks.
Create small worlds inside the two aquariums using the modelingcompound, rocks, pebbles, houses, figures, and vehicles. The createdworld should cover about half of the area inside each aquarium. Havestudents help: for example, ask them to place the houses where theywould most like to live. Include some desirable beachfront areasalong the coasts, and some potential building sites at higher eleva-tions, as shown in the figure.
2 .Position thermometer, cover, and lamps. Explain that the coverrepresents an increase of greenhouse gases.
Tape a thermometer to the inside center of the front of each of thetanks so that students can read them through the glass. Leave the topof Tank 1 uncovered. Cover the top of Tank 2 with the glass cover orplastic wrap. If using plastic wrap, be sure to leave enough space forthe lamp in the center of the tank. Explain to the students that theyshould think of the tank cover or plastic wrap as part of the sky or air,and that it represents an increase of greenhouse gases.
Clamp a lamp on the center of each of the tanks. If using plastic wrapas the cover for Tank 2, place the wrap around the lamp but not underit or touching it; otherwise the plastic could catch fire.
3 .Record initial tank temperatures.
Record the temperature in each tank before turning on the lamp.Using a grease pencil or marker, mark the thermometer level at thebeginning of the experiment. Have students observe the initial tem-peratures.
4 .Turn on lamps, and periodically measure temperatures.
Turn on the lamps. Record and discuss the temperatures at 1, 5, and30-minute intervals.
5 .Discuss results.
Have students view the final temperature readings, and share theresults of all the temperature readings with the class. Discuss the dif-ferences in temperatures in each tank. A s k :
! What was the temperature at the beginning of the experiment inTank 1?
! What was the final temperature at the end of the experiment inTank 1?
! What was the temperature at the beginning of the experiment inTank 2?

86Walking for Health & the Environment Curriculum
! What was the final temperature at the end of the experiment inTank 2?
! Which tank had the highest final temperature?! Why do you think the tank with the cover on top got warmer?
(Answer: The cover trapped heat inside the tank and made the airand things in it warmer.)
! How is this experiment like the Earth and greenhouse gases?( A n s w e r : Greenhouse gases trap heat in the air, and the air and theEarth get warmer.)
6 .Link discussion to human activities.
Tell students that some of the things people do, like driving cars andmaking things in factories, release pollution into the air that increasesthe amount of greenhouse gases in the air. If people walked moreinstead of driving to places like school or the grocery store or otherplaces, there would probably be less air pollution and less green-house gases, and the Earth wouldn’t get as warm.
7 .Link discussion to future trends.
What might life on Earth be like in 200 years if temperatures continueto increase? (Possible answers: The Earth and air may be very hot.Some regions may experience droughts. There may be less water onE a r t h . )
For older students, have the students record the temperatures. Provide a more detailed explanation of greenhouse gases and globalwarming.
Record the length of time it takes for each tank to reach room tempera-ture after the lamps are turned off, and have students compare theresults between the two tanks.
Read to students portions of the following books:
Johnson, Rebecca L. 1990. The Greenhouse Effect: Life on a Wa r m e rP l a n e t . Minneapolis, MN: Lerner Publications Co.
Stille, Darlene. R. 1990. A New True Book: The Greenhouse Effect.Chicago, IL: Childrens Press.
Also see Internet sites:w w w. s t r a t e g i e s . o r gh t t p : / / t e a c h e a r t h . c o m
A DA P TATI O N
FOR FU RT H E REX PLO R ATI O N

87 Too Many Blankets - #1
R E S O U RC E S ,AC K NOW LE D G M E N TS
MA CURRICULU MFR A M E WORKS STA N DA R D S
Institute for Global Environmental Strategies. The PotentialConsequences of Climate Variability and Change. Arlington, VA .Sponsored by the National Aeronautics and Space Administration(NASA) and the U. S. Environmental Protection Agency (EPA). See URL:h t t p : / / w w w. s t r a t e g i e s . o r g / c l i m a t e / B l a n k e t s _ M a y 0 2 . p d f
Grades 3-5
Science and Te c h n o l o g y / E n g i n e e r i n g
Earth and Space Science – We a t h e r
! Explain how air temperature…makes up the weather in a particularplace and time (Learning Standard 6)
! Describe how global patterns…influence local weather in measura-ble terms such as temperature (Learning Standard 8)
! Differentiate between weather and climate (Learning Standard 9)
Life Science (Biology) – Adaptations of Living Things
! Give examples of how organisms can cause changes in their environ-ment…explain how these changes may affect the ecosystem(Learning Standard 10)
Physical Sciences (Chemistry and Physics) – Light Energy
! Recognize that light travels in a straight line until it strikes anobject…and that light can be…absorbed (Learning Standard 12)
Technology/Engineering
! Identify and explain the appropriate materials and tools…to constructa prototype safely (Learning Standard 1.4)
Appendix V: Historical and Social Context for Science andTechnology/Engineering: Topics for Study
! How government, industry, and/or individuals may be responsible fornegative effects; damage to the environment or ecosystems in thiscountry and elsewhere; some sources of damage or pollution ( I V.Unintended negative effects from uses of science andt e c h n o l o g y / e n g i n e e r i n g )
Comprehensive Health Curriculum
! Describe types of natural resources and their connection with health(Learning Standard 13.1)
! Identify ways the physical environment is related to individual andcommunity (Learning Standard 14.2)


89 Too Many Blankets - #2
Too Many Blankets - #2 GRADES
3-5
Students will:
! Observe that water levels rise as ice melts.! Measure water levels in the tanks.! Observe that the more temperature rises, the faster ice melts.! Understand that the tanks are like the Earth and the lamps are like
the sun.! Understand that as the Earth gets warmer as more greenhouse gases
are released into the atmosphere, this may cause melting of icecapsand glaciers, which in turn may result in a rise in sea levels and flood-i n g .
! Understand that some sources of pollution are caused by people, andthat pollution can have an effect on the air and the Earth.
1 hour
This activity builds on “Too Many Blankets - #1.” Students will addfrozen blocks of ice to the water in both aquarium tanks set up in “To oMany Blankets - #1.” The ice in the tanks represents icebergs, icecaps,and glaciers in the environment. Students will observe how higher airtemperature causes ice to melt faster. The class will discuss causes andimplications of global warming.
E STI M ATED TI M E
S U M M A RY
LEA RNING OBJ E C TI V E S
This Safe Routes to Schools Curriculum has two purposes: To teach elementary school students—in ways that are stimulating and relevant to their lives—how walking is good for their bodies and good for the environment, while alsohelping teachers satisfy the requirements of the Massachusetts Curriculum Frameworks.
Tank 2 withwater and ice added

90Walking for Health & the Environment Curriculum
! Once the tanks are set up, ask: Do you think anything will happen tothe ice in the tanks? What? ( A n s w e r : The ice will melt.)
! After explaining to students that one tank will be covered and theother tank will not, ask: Do you think the ice in one of the tanks willmelt faster than in the other tank? If so, in which tank do you thinkthe ice might melt faster? ( A n s w e r : The ice will melt faster in thetank with the cover.) Why? ( A n s w e r : The cover traps heat in the tank,which makes the temperature in the tank warmer. The warmer tem-perature melts the ice faster than in the other tank.)
The air around us acts like a blanket to capture the sun’s heat and makethe Earth warm enough for us to live on it. But when “greenhousegases” are added to the air, they trap more heat in the air around theEarth – like adding blankets to your bed at night – and make the Earthtoo warm. This warming of the Earth is called global warming.
When icecaps and glaciers melt due to higher temperatures associatedwith global warming, sea levels may rise, and flooding might increasein coastal areas. Another change that might occur when the Earth’stemperature rises is drought in some areas that get really hot.
N o t e : If possible, set up both tanks simultaneously so that students cancompare the systems at the same time. Especially for younger students,such comparisons will provide concrete representation and observationof the abstract concept of global warming.
! Two small aquarium tanks set up as in “Too Many Blankets - #1”(including lamps, thermometers, cover, and small worlds created int a n k s )
! Wa t e r! Blue food coloring (optional)! “Icebergs” and “glaciers” (freeze water in paper cups or milk cartons;
peel off paper)! Rulers ! C l o c k! P e n c i l s! Grease pencil or marker
1 .Set up tanks, add food coloring and water.
Set up Tanks 1 and 2 as in “Too Many Blankets - #1.” Add blue foodcoloring (optional) to water, and carefully pour the water into bothtanks, as shown in the figure.
STE P S
KEY QUESTI O NS
B AC KG ROUND
M ATE R I A L S

91 Too Many Blankets - #2
2 .Place icebergs and glaciers in tanks and measure tempera-ture and water levels.
Place one or more icebergs and glaciers into the tanks (see figure).Take a baseline temperature in each tank. Tape a ruler to the front ofeach tank and measure and mark the water level on the tank glasswith a grease pencil or marker. Record the data. Have studentsobserve the baseline temperatures and water levels.
3 .Position lamps and tank cover; inform class that the coverrepresents increased greenhouse gases in the atmosphere.
Tape a thermometer to the inside center of the front of each of thetanks so that students can read them through the glass. Leave the topof Tank 1 uncovered. Cover the top of Tank 2 with the glass cover orplastic wrap. If using plastic wrap, be sure to leave enough space forthe lamp in the center of the tank. Explain to the students that theyshould think of the tank cover or plastic wrap as part of the sky or air,and that it represents an increase of greenhouse gases.
Clamp a lamp on the center of each of the tanks. If using plastic wrapas the cover for Tank 2, place the wrap around the lamp but not underit or touching it; otherwise the plastic could catch fire.
4 .Periodically measure temperature and water level changes.
Record the temperature and water level changes in the tanks at 1, 5,and 30-minute intervals.
5 .Discuss results.
Have the students observe the final temperatures and water levels,and share the results of all the temperature and water readings withthe class. Discuss the differences in temperatures and water levels ineach tank. A s k :
! What was the temperature at the beginning of the experiment inTank 1? At the end of the experiment?
! What was the water level at the beginning of the experiment inTank 1? At the end?
! What was the temperature at the beginning of the experiment inTank 2? At the end?
! What was the water level at the beginning of the experiment inTank 2? At the end?
! Which tank had the highest temperature at the end of the experi-m e n t ?

92Walking for Health & the Environment Curriculum
! Which tank had the highest water level at the end of the experi-m e n t ?
! Why do you think the water level was higher in the tank with thec o v e r ? ( A n s w e r : Because the cover trapped heat in the air. Thewarmer air melted the ice faster, which made the water level risemore.)
! Did anything happen to the land and buildings along the shoreline?(Possible answer: Some areas became covered by water. )
! How is this experiment like the Earth and greenhouse gases?( A n s w e r : More greenhouse gases trap heat in the Earth’s atmos-phere and make the Earth warmer. Polar icecaps and glaciers meltand shrink as the earth’s average temperature increases.)
6 .Link discussion to human activities.
Tell students that some of the things people do, like driving cars andmaking things in factories, release pollution into the air that increasesthe amount of greenhouse gases in the air. If people walked moreinstead of driving to places like school or the grocery store or otherplaces, there would probably be less air pollution and less green-house gases, and the Earth wouldn’t get as warm. There also mightbe less flooding, droughts, or other changes in the Earth’s climate.
7 .Link discussion to future trends.
What might life be like on Earth in 200 years if temperatures continueto increase and more icecaps and glaciers melt? ( A n s w e r : The meltedicecaps and glaciers could cause sea levels to rise and could causefloods and droughts. Some lands near the ocean might become flood-ed and covered by water. )
For older students, have the students record the temperatures andwater levels. Provide a more detailed explanation of greenhouse gasesand global warming.
Research and discuss icecaps and glaciers with the class.
Read to/with students portions of the following books:
M i l l e r, Christina and Louise Berry. 1996. Air Alert: Rescuing the Earth’sA t m o s p h e r e . New York: Athenaeum Books for Young Readers.
Pringle, Laurence. 1990. Global Warming: Assessing the GreenhouseT h r e a t . New York: Arcade Publishing.
Also see the Internet site: www. k t c a . o r g / n e w t o n s / 1 5 / g r e e n h o u s e . h t m l
A DA P TATI O N
FOR FU RT H E REX PLO R ATI O N

93 Too Many Blankets - #2
Institute for Global Environmental Strategies. The PotentialConsequences of Climate Variability and Change. Arlington, VA .Sponsored by the National Aeronautics and Space Administration(NASA) and the U. S. Environmental Protection Agency (EPA). See URL:h t t p : / / w w w. s t r a t e g i e s . o r g / c l i m a t e / B l a n k e t s _ M a y 0 2 . p d f
Grades 3-5
Science and Te c h n o l o g y / E n g i n e e r i n g
Earth and Space Science – We a t h e r
! Explain how air temperature…makes up the weather in a particularplace and time (Learning Standard 6)
! Describe how global patterns…influence local weather in measura-ble terms such as temperature (Learning Standard 8)
! Differentiate between weather and climate (Learning Standard 9)
Life Science (Biology) – Adaptations of Living Things
! Give examples of how organisms can cause changes in their environ-ment…explain how these changes may affect the ecosystem(Learning Standard 10)
Physical Sciences (Chemistry and Physics) – Light Energy
! Recognize that light travels in a straight line until it strikes anobject…and that light can be…absorbed (Learning Standard 12)
Technology/Engineering
! Identify and explain the appropriate materials and tools…to constructa prototype safely (Learning Standard 1.4)
Appendix V: Historical and Social Context for Science andTechnology/Engineering: Topics for Study
! How government, industry, and/or individuals may be responsible fornegative effects; damage to the environment or ecosystems in thiscountry and elsewhere; some sources of damage or pollution ( I V.Unintended negative effects from uses of science andt e c h n o l o g y / e n g i n e e r i n g )
Comprehensive Health Curriculum
! Describe types of natural resources and their connection with health(Learning Standard 13.1)
! Identify ways the physical environment is related to individual andcommunity (Learning Standard 14.2)
R E S O U RC E S ,AC K NOW LE D G M E N TS
MA CURRICULU MFR A M E WORKS STA N DA R D S


95 How Far Do You Walk at School?
How Far Do You Walk at School? GRADES
3-5
Students will:
! Learn how to use and read pedometers. ! Learn to estimate and calculate how far they walk at school during
typical activities using their pedometers.
Estimated Time: 2 hours
Students will learn how to wear and read p e d o m e t e r s , which countthe number of steps that a person walks. They will use the pedometersto count how many steps they each walk in supervised walks in theschool (or in overnight take-home exercises, if suitable for your school).Each student will calculate his or her “steps per mile” and then calcu-late the distance (in miles) from the number of steps that the pedometercounted. Finally, students estimate how far they might walk at school ina week.
(Note to Te a c h e r s : This activity works well as a collaboration betweenclassroom teachers and physical education teachers.)
! How far do you think you walk during a school day?! How far do you think you walk in a typical 24-hour day? ! How do you think walking helps keep us healthy?
Walking is an easy way to get exercise every day. Walking helps keeppeople strong and healthy. Walking can improve people’s health byhelping them lose weight, increasing their heart rate and breathingrate,* and reducing the risk of diabetes. In addition, walking instead ofdriving can decrease traffic congestion in a community and thus helpreduce air pollution.
You might walk more than you think you do. Using a pedometer is a funway to measure how far you walk. Pedometers count the number ofsteps you take. Using that information, you can then figure out how faryou’ve walked.
E STI M ATED TI M E
S U M M A RY
KEY QUESTI O NS
LEA RNING OBJ E C TI V E S
This Safe Routes to Schools Curriculum has two purposes: To teach elementary school students—in ways that are stimulating and relevant to their lives—how walking is good for their bodies and good for the environment, while alsohelping teachers satisfy the requirements of the Massachusetts Curriculum Frameworks.
* Note: See lesson plans on “Heart Rate” and “Breathing Rate” in this curriculum.
B AC KG ROUND

96Walking for Health & the Environment Curriculum
! Pedometers ( N o t e : For this activity, the school/class will have to havemade prior arrangements for obtaining pedometers)
! Adult assistants (if possible) for each student group! Student Worksheets (included; may be modified to suit
student/teacher needs)! Sidewalk chalk! Pencil and paper! 20-foot tape measure! Calculators (optional)
1 .Describe the overall lesson.
Tell students that pedometers count how many steps a person walks.Then describe the activity as above in Summary.
2 .Students estimate the number of steps to various school loca-tions.
Ask students how many steps they think it takes to walk from theclassroom to selected areas of the school and back again; chooseareas such as:
- the gym - the cafeteria- the closest bathroom - the playground
Tell students to write their answers on the Student Wo r k s h e e t(Question #1).
3 .Distribute pedometers.
Divide the class into groups of about 4 to 6 children per adult. Distributepedometers to students, making whatever arrangements you prefer fortracking the return of the pedometers if you expect them back.
4 . Instruct the class in how to r e a d a pedometer.
Following the instructions that come with the pedometers you’reusing, instruct the class in how to read the pedometers.
Dial-face pedometers typically look like a clock, except with 10 divi-sions instead of 12. The long hand indicates hundreds and the shorthand indicates thousands.
Digital pedometers are somewhat easier to read because they simplydisplay the number of steps walked. However, many digital pedome-ters can also display miles, kilometers, calories or even a clock. Makesure that students can set the digital pedometer so it displays s t e p s .
(If using dial-face pedometers, you may want to display photocopyenlargements of different pedometer readings and ask students to tell
STE P S
M ATE R I A L S

97 How Far Do You Walk at School?
you how many steps they represent. Also be aware that dial-facepedometers can only count to 10,000 steps and then start over again.)
Whatever type of pedometer you are using, tell students to alwaysreset their pedometer to its “zero” or starting point before beginning.(On the dial-face pedometers, this is with both hands pointing straightup to “10.”)
5 . Instruct students in how to w e a r a pedometer.
Show students how to wear the pedometers on their waists, posi-tioned directly above the knee. Have the students put on the pedome-ters and walk around with them a bit to see how they move. ( N o t e :In order to count steps accurately, pedometers must be worn tight onthe waist to record hipbone movements. Pedometers placed on pock-ets or clipped elsewhere on the body will not read accurately. Yo umay want to suggest that girls wear pants; or have on hand a fewc h i l d r e n ’s belts that girls can cinch around their waists over theird r e s s e s . )
6 .Students practice wearing and reading the pedometers.
Tell students to walk around the gym or classroom. Check that theyare wearing the pedometers correctly and can read the pedometers. Ifyou have the students walk a fixed number of steps—such as 30 or50 steps—the pedometers can be checked for accuracy, and any thatare malfunctioning can be replaced.
7 .Students walk to the chosen school locations and back, andrecord results.
Tell students that it is important that they walk at a normal speed andwith normal steps for the results to be accurate – this is not a race.
Students at Boston’s Hurley Schoolenthusiastically display the dial-face
pedometers that they have used withphysical education teacher Jim Nearhos.

98Walking for Health & the Environment Curriculum
Wearing their pedometers, have the student groups (with adult assis-tants) walk to one of the chosen school locations (e.g., gym, cafeteria,bathroom, playground) and back. Upon returning to the classroom,have the students record the number of steps walked on theirWorksheets (Question #2). Have them do this each time they returnfrom each of the school destinations. After all trips are finished, havestudents add up their own totals and write this number at the end ofQuestion #2 on their Worksheets.
8 .Review pedometer readings and compare to estimates.
Have students compare their original estimates to the actual stepsthey took. Have students record the differences on their Wo r k s h e e t s(Question #3). Discuss as a class how accurate students’ estimatesw e r e .
9 . Instruct students in how to calculate d i s t a n c e from “stepswalked.”
Students have recorded how many steps they walked. Explain thatthey will now use the number of s t e p s they walked to calculate thed i s t a n c e they have walked in a standard unit of distance—such asm i l e s.
First, students will need to know how many steps they walk in a mile.People walk different numbers of steps in a mile because our legs aredifferent lengths: Small children with short legs will walk many moresteps in a mile than bigger children with longer legs.
(Note to teachers: Pedometers that give readings in miles, kilometers,etc. are based on an average length of an a d u l t ’s step or stride, andthus the numbers will not be accurate for children, who generally takesmaller steps than adults.)
Ask students how they can figure out how many steps they each walkin a mile. (Possible answers: Walk a mile and count the number ofsteps. Count the number of steps in part of a mile and then multiply. )Students will now do the latter.
(a) Measure and mark off a 20-foot distance. The teacher and/orassistant measures a 20-foot distance and marks it off with chalk.
(b) Have students walk to the 20-foot mark. Have students line up(in small groups, if more manageable than the entire class at once) atthe chalk line. Again, tell students that it is important that they walkat a normal speed for the results to be accurate: this is not a race.Tell each student to begin walking normally, and to be sure to countthe number of steps they walk until they reach the 20-foot line.

99 How Far Do You Walk at School?
(c) Have students record the number of steps they walked in 20f e e t . Ask each student to record the number of steps he or shewalked in 20 feet on their Worksheets (Question #4). (You can double-check that pedometer readings are within the right range.)
10. Demonstrate how to calculate “steps per mile.”
Tell students that now they will calculate how many steps they walkin a mile. Give them the information that there are 5,280 feet in 1(one) mile. Draw a long line on a blackboard and label it as shown inthe graphic below. Remind students that they have just counted howmany steps they each walked in 20 feet. Draw a very short line on theblackboard and label it as shown.
Now ask students if they know how to calculate how many s t e p s t h e yeach walk in a m i l e.
(Give students a hint: First they can calculate how many times 20 feetgoes into 5,280 feet.)
5,280 ft ÷ 20 ft = 264
(Correct answer: 5,280 feet [which is one mile] divided by 20 feet[which is the distance the students walked to measure their steps]equals 264. So, in order to find out the number of steps that studentswalk in a mile, they need to multiply the number of steps they took by264.)
Example Calculation:Share an example calculation with the students before they proceedwith their own calculations:
If a student named Ellen walked 14 steps in the 20-foot area, then:
14 steps x 264 = 3,696 steps per mile
11. Students calculate their own steps per mile.
Tell students to go ahead and multiply the number of steps he or shetook in the 20-foot area by 264 to calculate their steps per mile, andto record this number of their Worksheets (Question #5). The teacherand/or assistants should also perform some of the calculations tocheck the math accuracy of the students.
_ _ _ _ _ _ _ _ _ _ _ _ _ _ _ _ _ _ _ _ _ _ _ _ _ _ _ _ _ _ _ _ _ _ _ _ _ _ _ _ _ _ _ _ _ _ _ _ _ _ _ _ _1 mile = 5,280 feetHow many of y o u r steps = 1 mile?
_ _ _ _ _ _20 feetYou already know how many of y o u r steps are in 20 feet

100Walking for Health & the Environment Curriculum
12. Explain the “miles walked in school” concept.
Tell students to now look again at the total number of steps they tookto and from their classroom to the different places in school that theyrecorded earlier on Question #2 of their Student Worksheet. Tell themthey will now calculate how far (in miles) they walked to theseplaces, and soon they will estimate how far they might walk during atypical week at school.
Example Calculation (continued):Assist students by continuing the previous example calculation beforethey proceed with their own calculations:
For example, let’s say our example student Ellen’s pedometer said shewalked 900 steps to and from class just now to all of the locationsthe students went to. How would the class suggest that we figure outhow many miles Ellen might walk in school during a typical week?
(Correct answer for example calculation): 900 steps x 5 (school weekdays) = 4,500 steps walked per week ÷3,696 steps per mile* = 1.22 miles (rounded to two decimal places)
*[from Step 10 calculation]
So, 1.22 miles is the number of miles that Ellen walked each weekduring these school activities.
Tell students that Ellen walks almost one and one-quarter miles eachweek just getting around school. (Ask: If Ellen had walked exactly oneand one-quarter miles, what would this number look like, expressedusing two decimal points? Correct answer: 1.25 miles)
13. Students estimate how far they walk in school in a week.
Now have the students calculate how many miles they each walkedto all of the various school locations, and estimate how many milesthey might walk each week doing these activities.
Calculation for students:
______ steps student walked today during this activity x 5 (schooldays) = ______ estimated steps walked per week ÷ ______ stepsper mile from Worksheet Question #5 = ______ estimated mileswalked each week
Have students record the approximate number of miles they walkeach week during these school activities on their Wo r k s h e e t s(Question #6).
Congratulations! Look how far you walk during school!

101 How Far Do You Walk at School?
14. Discuss other opportunities for walking.
A s k : Can you think of ways you walk, or could walk, even more, bothin school and outside of school? (Possible answers: walking in gymclass, walking to and from the bus, walking from home to school,from home to a store, etc.).
For younger students, omit the last phase of this activity (Steps 10 tothe end: measuring distance of steps in miles), and instead give themestimates to use, such as: 600 steps = ⁄ mile, 1200 steps = fi mile, 1800steps = fl miles, or 2400 steps = one mile.
Coordinate pedometer readings and calculations with the PhysicalEducation teacher.
If your school allows students to bring pedometers home, extend thisactivity to tracking and calculating students’ walking distance over a 24-hour period.
PE Central URL: www. p e c e n t r a l . o r g
Grades 3-5
Mathematics Curriculum
Number Sense and Operations
! Add and subtract (up to four-digit numbers) and multiply (up to two-digit numbers by a one-digit number) accurately and efficiently(Learning Standard 3.N.10)
! Select and use appropriate operations (addition, subtraction, multipli-cation, and division) to solve problems… (Learning Standards 3.N.8and 4.N.10)
! Add and subtract (up to five-digit numbers) and multiply (up to threedigits by two digits) accurately and efficiently (Learning Standard4 . N . 1 2 )
! Accurately and efficiently add and subtract whole numbers and posi-tive decimals. Multiply and divide (using double-digit divisors) wholen u m b e r s . . .(Learning Standard 5.9.12)
M e a s u r e m e n t
! Carry out simple unit conversions within a system of measurement,e.g., hours to minutes, cents to dollars, yards to feet or inches, etc.(Learning Standards 3.M.2 and 4.M.2)
FOR FU RT H E REX PLO R ATI O N
R E S O U RC E S ,AC K NOW LE D G M E N TS
MA CURRICULU MFR A M E WORKS STA N DA R D S
A DA P TATI O N

102Walking for Health & the Environment Curriculum
Student Worksheet: How Far Do You Walk at School?
1 . Estimate how many steps it takes you to walk from the classroom to the following areas (or to other locationsgiven by your teacher) and back again to the classroom:
_____ (# of steps) to the gym ____ (# of steps) to the cafeteria_____ (# of steps) to the closest bathroom ____ (# of steps) to the playground
2 . N o w, record the actual number of steps it took you to walk to these places, using your pedometers.
_____ (# of steps) to the gym ____ (# of steps) to the cafeteria_____ (# of steps) to the closest bathroom ____ (# of steps) to the playground
T O TAL number of steps it took me to walk to all of these places and back: ________
3 . What was the different between your estimated number of steps (Question #1) and your actual number of steps(Question #2)?
The difference between estimated and actual number of steps was:
_____ (# of steps) to the gym ____ (# of steps) to the cafeteria_____ (# of steps) to the closest bathroom ____ (# of steps) to the playground
4 . Record the number of steps you walked in 20 feet.
Number of steps I walked in 20 feet was ____________ steps.
5 . Record the number of steps you would walk in a mile.
Calculate this by:
__________ of steps I took in 20 feet x 264 = ______ steps in a mile
6 . Estimate the number of miles you walk each week during these school activities.
Calculate this by:
______ steps student walked today during this activity x 5 (school days) = ______ estimated steps walked perweek ÷ ______ steps per mile from Worksheet Question #5 = ______ estimated miles walked each week
Congratulations! Look how far you walk during school!

103 How Much Pollution is that Car Producin’?
How Much Pollution is that Car Producin’?
GRADES
3-5
Students will:
! Understand the connections between science (air pollution), math,and social science.
! Identify specific locations/places in the community (on maps) andlocal human interaction with the environment.
! Use map skills to determine distances.! Perform calculations to determine the amount of pollution produced
by car trips to school and understand how reducing car trips canreduce pollution.
45 minutes
This activity will help students visualize the estimated amount of pollu-tion produced by their families’ cars during typical trips to and fromschool, and understand how walking or bicycling can help reduce pollu-tion. Students begin by measuring the distance between home andschool on maps and then calculate the corresponding amount of pollu-tion using the formula: 2.3 pounds of vehicle air pollutants produced perm i l e .1 F i n a l l y, students measure out dry beans to visualize the amount ofpollution.
[Note: Teachers may want to combine this activity with the “Wa l kAcross Massachusetts” activity in this curriculum, since the initial steps(i.e., measuring the distance between students’ homes and the school)are the same for both activities.]
! How much air pollution (in pounds) do you think your car produces ona round trip to school?
! How could the air pollution your car produces be reduced? ( P o s s i b l ea n s w e r s : Walking or bicycling to school; taking the bus, train, orsubway; driving a smaller or hybrid car)
E STI M ATED TI M E
S U M M A RY
KEY QUESTI O NS
LEA RNING OBJ E C TI V E S
This Safe Routes to Schools Curriculum has two purposes: To teach elementary school students—in ways that are stimulating and relevant to their lives—how walking is good for their bodies and good for the environment, while alsohelping teachers satisfy the requirements of the Massachusetts Curriculum Frameworks.
1 This amount of air pollution was calculated from figures obtained from Environmental Defense's" Tailpipe Ta l l y."

104Walking for Health & the Environment Curriculum
Gasoline-powered vehicles, including cars and trucks, are one of thebiggest sources of air pollution. Air pollution is frequently measured inpounds. But since air pollution is often invisible, how can we “see” thepounds of air pollution that cars produce?
For every mile the average car is driven, about 2.3 pounds of air pollu-tion are produced. This is equivalent to about 55 pencils or 4 medium-sized hamsters! Because there are more cars now on the road than inthe past, and because people drive more miles than previously—evenfor short trips—more air pollution is produced. People rely an awful loton cars for getting places rather than on other forms of transportation:about 80% of trips made by people in the U.S. are made in their owncars; they carpool about 9 percent of their trips; take public transporta-tion (such as buses and trains) about 4 percent of the time; and bicycleor walk 6.5 percent of their trips.
! Copies for each student of a detailed local map of the town (if small)or school district (for larger municipalities), with a map scale, prefer-ably with the school at the relative center. ( N o t e : Local maps canoften be easily obtained from the Internet or from municipal planningagencies.)
! Bin of dry beans! A container to measure beans into! Several pieces of string (for each or most students, cut to the 1-mile
scale on the map)! A weighing scale that measures pounds and ounces ! Small bags to put the beans in! Colored markers! Student Worksheets (included)
1 .Divide students into teams and distribute materials.
Separate students into several teams, and have each team collect theneeded materials (maps, beans, containers, one piece of string, andsmall bags).
2 .Have students find and mark their homes on the maps.
Have students find their homes (on their individual copies of the maps– tell them it doesn’t have to be exact) and mark them with a colored“ H . ”
3 .Have teams find and mark the school on the maps.
As a team, have students find the location of the school and mark itwith a colored “S” on their maps.
STE P S
M ATE R I A L S
B AC KG ROUND

105 How Much Pollution is that Car Producin’?
4 .Have students measure and record the distance from home toschool.
Tell students that the lengths of string represent 1 mile on the map’sscale. Have students use the string, or tell them that they can useanother method to measure the approximate distance from theirhouse to the school (tell them it does not have to be exact). Have thestudents record this distance on their Student Worksheet. Check stu-dents’ calculations for relative accuracy.
5 .Have students calculate the amount of pollution produced ona car ride from home to school.
Using the formula: “1 mile = 2.3 lbs of air pollution,” ask students tocalculate the estimated amount of pollution produced on a car ridefrom their house to school. Students should calculate: “distance frommy house to school x 2.3 lbs = __ lbs of air pollution.” Have studentswrite this answer on their Student Wo r k s h e e t .
Tell students to calculate the air pollution produced by a round tripfrom their house to school by multiplying the above answer by 2. Te l lthem to write this number on their Wo r k s h e e t s .
6 .Ask students how much pollution they produce by walking orbicycling to school.
Tell students to answer the next question on their Student Wo r k s h e e t :“When I walk or bicycle to school, I produce ___ pounds (or ounces)of air pollution… (Note: The correct answer to this portion of thequestion for all students is “0” pounds of air pollution. For the nextpart: “…and I reduce air pollution by ____ pounds” the correctanswer is the same as their answer to the previous question on theirWorksheet: “A round trip from my house to and from school produces_____ pounds of air pollution” – since walking/bicycling reduces allof the pollution produced by the car trip.)
7 .Have students weigh out beans to visualize pollution fromtheir car trip.
On the weighing scale, using the container, have one member fromeach team scoop some beans into the container and measure theweight on the scale. Have these students add or remove beans untilthe weight matches the air pollution total for their round trip fromhome to school.
Have the students who measured their beans put the beans intosmall bags. Tell them they can keep the bags.
As time permits, have other students weigh out beans.

106Walking for Health & the Environment Curriculum
8 .Compare pollution generated per trip.
Write the weights of air pollution produced per vehicle round trip forone member from each team on the board, as comparisons.
9 .Discuss results.
Use one or two student’s Worksheets as examples to initiate a dis-cussion of the results. A s k : How much would air pollution be reducedif this person walked to school instead of being driven? (Use roundtrip answer. )
Then ask: How much would air pollution be reduced if everyone inthe class walked or bicycled instead of drove to school? If time per-mits, have students add up the total. Or, to save time, the teacher canadd up the round-trip numbers for the whole class, write this numberon the board, and tell the students that this is the answer to the lastquestion on their Student Worksheet (“If everyone in my class walkedor bicycled to school, we would reduce air pollution by _____p o u n d s . ” )
For younger students, round the numbers—tell them that about 2pounds of air pollution are produced for every mile their car is driven.Use one large copy of the local map for the entire class (rather thanindividual student maps) and measure out as averages for the wholeclass the distances for a few students from their home to school. Yo umight want to have a few additional students come up to the large mapand try to identify their houses and use the map scale to measure thedistances to school. Also have one student (or a few) weigh out theirbeans, which provides a visual indication for younger students of airpollution produced by a car and reduced by walking to school.
Have students collect new car and truck advertisements, read them, andbring a few into class. Do the ads say anything about how many “milesper gallon” the vehicles get? Do they say anything about reducing airpollution? Do they talk about “hybrid” cars?
See iwalk International.URL: www. i w a l k t o s c h o o l . o r g / r e s o u r c e . h t m l
Easy Breathers.URL: www. e a s y b r e a t h e r s . o r g / t e a c h e r /
Environmental Defense. URL: www. E n v i r o n m e n t a l d e f e n s e . o r g / Ta i l p i p e Ta l l y /
A DA P TATI O N
FOR FU RT H E REX PLO R ATI O N
R E S O U RC E S ,AC K NOW LE D G M E N TS

107 How Much Pollution is that Car Producin’?
MA CURRICULU MFR A M E WORKS STA N DA R D S
Grades 3-5
History and Social Science Curriculum(Note: “G” means Geography)
! Use cardinal directions, map scales, legends, and titles to locateplaces on contemporary maps of New England, Massachusetts, andthe local community (History and Geography 4, Gr3) ( G ) .
! On a map of Massachusetts, locate the class’s home town or city andits local geographic features and landmarks (Cities and Towns ofMassachusetts 3.8) ( G ) .
! Interpret a map using information from its title, compass rose, scale,and legend (History and Geography 2, Gr4) ( G ) .
Mathematics Curriculum
Number Sense and Operations
! Select and use appropriate operations (addition, subtraction, multipli-cation, and division) to solve problems… (Learning Standard 3.N.8and 4.N.10).
M e a s u r e m e n t
! Accurately and efficiently add and subtract whole numbers and posi-tive decimals. Multiply and divide (using double-digit divisors) wholenumbers. Multiply positive decimals with whole numbers ( L e a r n i n gStandard 5.N.12).
Science and Technology/Engineering Curriculum
Appendix V:Historical and Social Context for Science andTechnology/Engineering Study
! How government, industry, and/or individuals may be responsible fornegative effects; damage to the environment or ecosystems…; somesources of damage or pollution ( I V. Unintended negative effects of sci -ence and technology/engineering)
! Examples of products and systems that address negative effects ( V.How science and technology address negative effects from uses ofscience and technology/engineering).
Comprehensive Health Curriculum
! Describe types of natural resources and their connection with health(Learning Standard 13.1)
! Identify ways the physical environment is related to individual andcommunity health (Learning Standard 14.2)
! List practices and products that make living safer (Learning Standard1 4 . 3 )

108Walking for Health & the Environment Curriculum
Student Worksheet: How Much Pollution is that Car Producin’?
From my house to school is: _______ miles.
Driving from my house to school produces ______ pounds of air pollution.(Hint: Using the estimate that 1 mile = 2.3 lbs of air pollution will help you figure this out.)
A round trip by car from my house to and from school produces _____ pounds of air pollution.
When I walk or bicycle to school instead of taking a round trip in a car, I produce ____ pounds of air pollution (good for me!), and I reduce air pollution by ____ pounds.
If everyone in my class walked or bicycled to school, we would reduce air pollution by _____ pounds.

109 Walk Across Massachusetts
Walk Across Massachusetts GRADES
3-5
Students will:
! Understand the basic concept of energy and how it relates to our get-ting places.
! Locate key areas on a map and measure distances that relate to theirown lives and communities.
! Determine the cumulative distance traveled from taking short, localtrips by foot or bicycle.
! Identify the benefits (personal, environmental, societal) of traveling inways other than single occupancy vehicles.
45 minutes (first session)Homework (up to one hour over a week)1.5 hour (second session)Additional 45 minute sessions (until students have “walked across”M a s s a c h u s e t t s )
Notes to Te a c h e r s : This activity is most effective during warmer- w e a t h-er months. Also, consider doing this activity after How Much Pollution isthat Car Producin’? which helps students understand auto emissions.The initial steps for both activities are the same (i.e., measuring the dis-tance between students’ homes and the school).
This activity helps students understand that even short local walkingtrips can add up to a lot of miles and a big reduction in auto emissions.In class on a local map, students measure the distances between theirhomes and the school and a few other sample destinations, such as thetown library or a local store. Then, for a week-long homework assign-ment, each student keeps a record of the distances walked to schooland elsewhere. Any mode of travel “with their own feet” counts: bicy-cling, skate boarding, scooters, as well as walking. At the end of theweek, students bring their worksheet/travel diaries in to school andtotal up the distances they walked. Then on a large map ofMassachusetts, they plot the total distance walked by the class, start-ing at the eastern edge of the state. Week by week, they plot thec l a s s ’s total miles walked as they make their way westward across thestate, a total of 246 miles (by road from Provincetown to Richmond).
E STI M ATED TI M E
S U M M A RY
LEA RNING OBJ E C TI V E S
This Safe Routes to Schools Curriculum has two purposes: To teach elementary school students—in ways that are stimulating and relevant to their lives—how walking is good for their bodies and good for the environment, while alsohelping teachers satisfy the requirements of the Massachusetts Curriculum Frameworks.

110Walking for Health & the Environment Curriculum
(Note to teachers: This lesson gives students “credit” for carpooling andusing public transit, but the focus is on physical activity. )
! Which way of traveling that we’ve discussed (see B a c k g r o u n d ) u s e sthe most energy? ( A n s w e r : A car with one person in it) The least?(Answers: Walking, bicycling)
! What are some of the good things about getting places by walking orbicycling instead of by car? ( A n s w e r s : Exercise, reducing energy use,reducing air pollution)
! What are some ways that you and your family might reduce energyuse and air pollution by changing how you get places? ( P o s s i b l ea n s w e r s : Walk or bike to school or a friend’s house instead of driving;carpool to soccer games; buy hybrid fuel cars instead of ones thatonly use gasoline; buy smaller cars that use less gas)
Going places—whether by walking, bicycling, or riding in a car—requires energy. Energy is the ability to do work. When we go places byc a r, we burn gasoline, which is a non-renewable form of energy knownas a fossil fuel that can cause pollution. When we walk or bicycle, we“burn” calories, which is also a form of energy use, but one that causesno pollution. When we walk or bike instead of drive somewhere, weuse less gasoline in our cars, and we save energy. Carpooling1 or ridinga bus, subway, or train uses less energy than getting places in cars withjust one or two people in them.
The different ways we travel and use energy can affect us, and some-times many other people, in a number of ways:
! When we walk or bike, we get exercise, which is good for our health. ! We also reduce air pollution when we walk or bicycle instead of drive
places. Reducing air pollution is important because air pollution canmake us sick and can harm the environment. Carpooling or riding as u b w a y, train, or bus generally creates less air pollution than drivingin cars.
! Walking and biking also reduce car trips, and traffic jams!
You may be surprised at how far we can travel without driving. Thisexercise will show you how you can walk or bicycle acrossM a s s a c h u s e t t s !
KEY QUESTI O NS
B AC KG ROUND
1 You might want to define carpooling as two or more families who share driving; large families arenot a carpool, and a carpool must eliminate at least one car trip.

111 Walk Across Massachusetts
STE P S
! Large map of the Commonwealth of Massachusetts (with scale) topost in classroom
! Copies (8 fi x 11-size) for each student of a local map of the town (ifsmall) or school district (for larger municipalities), with school at rela-tive center, many streets identified, and a clear, easy-to-use mapscale ( N o t e : Local maps can often be obtained from the Internet ormunicipal planning departments)
! (Optional) Large map of the local map distributed to students(described above) to post in classroom
! Colored string/yarn! Push pins! Colored markers ! Student Worksheet (included)
1 .Display the map(s) and explain the project.
Post the map of Massachusetts in a prominent place in the room.Explain the activity as described above in S u m m a r y.
2 .Have students mark their homes and school on individualmaps.
Pass out the 8 fi x 11 copies of the local map to students and, if youchoose to, post the large local map. Ask students to identify approxi-mately where they live on the map, mark their home with a colored“H”, and draw a colored line from their house to the school, whichthey should mark with an “S”. Ask one or two students to demon-strate on the large local map.
3 .Have students measure the distances from home to school.
Next, using the map scale on their individual local maps, have thestudents measure the distance in miles that they just markedbetween their homes and the school. Have the students record thedistance on the Student Worksheet. Then ask students to name acouple of other places in town that they might walk or bicycle to. Te l lstudents to record these distances on their Worksheets. Ask one ortwo students to mark their destinations on the large local map andmeasure the distances.
(Note to teacher: Students may need teacher assistance in using mapscales. Make sure that students can measure and record map dis-tances on their own because they will need to do this in the nextS t e p . H o w e v e r, if time is limited, you can instead show the class howthis is done, and select an “average” distance from home to schoolthat the students can use.)
M ATE R I A L S

112Walking for Health & the Environment Curriculum
4 .For a week, have students measure and record the distancesthey travel “with their own feet.”
Tell the students to bring their maps and worksheets home and torecord on the worksheets some of the places to which they walk andbicycle (with their parents’ permission, of course, and probably oftenaccompanied by an adult). Remind them that any mode of travel “withtheir own feet” counts, including walking to and from a bus or train.Instruct them to calculate and record on their worksheets the distanceof each of these trips, as best as they can (they don’t have to beexact), using the scale on their local maps. Suggest that students asktheir families if they need help using the map scales.
Tell students to try to include more than one destination for each day.( You may want to give students two or three copies of the worksheetso they have room to record several trips each day). Remind studentsto only include travel by walking and bicycling (and other travel “withtheir own feet”) unless they go by carpool or public transit. Explainthat because traveling by carpool or bus, train, or subway reducesgasoline use and air pollution compared to riding in individual cars,they will get a bonus mile added for every trip they make in thesew a y s .
Tell students that in a week they will use the distances they record to“ Walk Across Massachusetts” on the state map that is posted in theclassroom.
5 . In class have students total up their miles traveled.
At this point the class needs to calculate the total miles traveled b yall the students’ walking or bicycling during the week. (You may wantto break the class into small groups to calculate subtotals before cal-culating a grand total on the blackboard. Do whatever works best foryour size class.)
To give students credit for carpooling and using public transit, havethem total up the number of t r i p s (not miles) made by carpool or pub-lic transit in the “Trips” column on their Worksheets. Then, add onebonus mile for each carpool/transit trip to class’s total miles walkedand bicycled.
6 .Plot how far the class traveled on the map of Massachusetts.
Using the map scale on the large map of Massachusetts, cut the col-ored string to the length of the total miles the class traveled thatweek (as calculated in Step 5). Discuss proportional map scales withthe class, comparing the scale on the students’ small local maps tothe scale on the large map of Massachusetts.

113 Walk Across Massachusetts
Pin one end of the string to Provincetown and extend the string as faras it will go towards the western end of the state. Pin the other endof the string in place. (Alternatively, you can use a map measurer anda colored marker instead of string.) Show the students how far theytraveled, allowing them to examine the map as time allows.
7 .Discuss how going places “with our own feet” saves energyand reduces pollution.
Discuss with the class all the different places they traveled “withtheir own feet.” Ask students what they liked about walking or bicy-cling. Ask them which ways of traveling around town reduce energyuse and reduce air pollution.
8 .Repeat each week, until the class has “walked acrossMassachusetts.”
As time permits, repeat steps 4 through 6 during the following weeks.I d e a l l y, repeat these steps until the students have “walked acrossMassachusetts,” which is a total of 246 miles (east to west by roadfrom Provincetown to Richmond).
For younger students (Grades K-2), instead of having them take mapshome to record trips, pick two or three trips they are likely to make dur-ing the week, such as from home to school and from home to the super-market. Ask students to keep a list of how many trips to each of theseplaces they make during a particular week, and how they got there(walked, bicycled, rode in a car, took a bus, etc.). Estimate reasonabledistances for these trips (e.g., one-half mile from home to school, onemile from home to the grocery store, etc.) and use these assumed dis-tances as miles for the “Walk Across Massachusetts” map (rather thanactual miles traveled).
This activity adapts readily to children using pedometers to track dailymiles walked. See How Far Do I Walk at School? for conducting apedometer activity.
If a teacher wants to make this activity last longer and cover more terri-tory—or if an entire grade or even an entire school will participate—then “Walk Across America” or “Walk the Appalachian Trail” may besuitable and may offer richer History and Geography material.
! For “Walk Across America” see R e s o u r c e s b e l o w.! For “Walk the Appalachian Trail”—a 2,174-mile footpath—see the
National Park Service website to download a map:h t t p : / / w w w. n p s . g o v / a p p a / p p h t m l / m a p s . h t m l #
A DA P TATI O N
FOR FU RT H E REX PLO R ATI O N

114Walking for Health & the Environment Curriculum
Tally each individual student’s mileage, and award a prize to the studentwho traveled the farthest without car trips. Emphasize that the prize isfor getting a lot of exercise, saving energy (by using less gas for cartrips), and reducing pollution (by sending less pollution into the air fromcar exhaust).
Instead of taking the most direct route to “Walk Across America,” stu-dents can choose to visit a particular place each week that their accu-mulated miles can take them. The class can then do research to find outsomething interesting (e.g., historical) about that location.
Walk and Bike Across America. Way to Go Program, British Columbia.URL: www. w a y t o g o . i c b c . b c . c a
Walk and Bike Across America, an online educational activity for grades4-12. Marin County, CA, Safe Routes to School program.U R L : h t t p : / / w w w. s a f e r o u t e s t o s c h o o l s . o r g / w a l k /
Going Places, Making Choices: Transportation and the Environment cur-riculum. National 4-H Council.U R L : h t t p : / / w w w. 4 h g p m c . c o m
Grades 3-5
History and Social Science (note: G = Geography)
Massachusetts and its Cities and Towns: Geography and History
! Use cardinal directions, map scales, legends, and titles to locateplaces on contemporary maps of New England, Massachusetts, andthe local community (G, Gr 3, Concepts and Skills - History andGeography 4).
! On a map of Massachusetts, locate the class’s home town or city andits local geographic features and landmarks (G, Gr 3, LearningStandards – Cities and Towns of Massachusetts 3).
! Interpret a map using information from its title, compass rose, scale,and legend (G, Gr 4, North American Geography.Concepts and Skills –History and Geography 2).
Mathematics Curriculum
Number Sense and Operations
! Add and subtract (up to four-digit numbers) and multiply (up to two-digit numbers by a one-digit number) accurately and efficiently(Learning Standard 3.N.10)
! Select and use appropriate operations (addition, subtraction, multipli-cation, and division) to solve problems…(Learning Standards 3.N.8and 4.N.10)
R E S O U RC E S ,AC K NOW LE D G M E N TS
MA CURRICULU MFR A M E WORKS STA N DA R D S

115 Walk Across Massachusetts
! Add and subtract (up to five-digit numbers) and multiply (up to threedigits by two digits) accurately and efficiently (Learning Standard4 . N . 1 2 )
! Accurately and efficiently add and subtract whole numbers and posi-tive decimals. Multiply and divide (using double-digit divisors) wholen u m b e r s …(Learning Standard 5.9.12)
Patterns, Relations and Algebra
! Solve problems involving proportional relationships, including… mapinterpretation (Learning Standard 4.P. 5 )
Science and Technology/Engineering Curriculum
Life Science (Biology) – Adaptations of Living Things
! Give examples of how organisms can cause changes in their environ-ment…explain how these changes may affect the ecosystem(Learning Standard 10)
Appendix V: Historical and Social Context for Science andTechnology/Engineering: Topics for Study
! How government, industry, and/or individuals may be responsible fornegative effects…damage to the environment or ecosystems in thiscountry and elsewhere; some sources of damage or pollution ( I V.Unintended negative effects from uses of science andt e c h n o l o g y / e n g i n e e r i n g )
! Examples of products and systems that address negative effects ( V.How science and technology address negative effects from uses ofscience and technology/engineering)
Comprehensive Health Curriculum
! Describe types of natural resources and their connection with health(Learning Standard 13.1)
! Identify ways the physical environment is related to individual andcommunity (Learning Standard 14.2)

116Walking for Health & the Environment Curriculum
Student Worksheet: How I Travel With My Own Feet Name: ______________________
Distance (in miles) from my house to school ____________________________________Distance to _____________________: _________________ milesDistance to _____________________: _________________ miles
D a y Tr a v e l e d Tr a v e l e d D i s t a n c e Tr i p sf r o m … t o … b y … (miles, approx.)
M o n d a y _ _ _ _ _ _ _ _ _ _ _ _ _ _ _ _ _ _ _ _ _ _ _ _ _ _ _ _ _ _ _ _ _ _ _ _ _ _ _ _ _ _ _ _ _ _ _ _ _ __ _ _ _ _ _ _ _ _ _ _ _ _ _ _ _ _ _ _ _ _ _ _ _ _ _ _ _ _ _ _ _ _ _ _ _ _ _ _ _ _ _ _ _ _ _ _ _ _ __ _ _ _ _ _ _ _ _ _ _ _ _ _ _ _ _ _ _ _ _ _ _ _ _ _ _ _ _ _ _ _ _ _ _ _ _ _ _ _ _ _ _ _ _ _ _ _ _ _
Tu e s d a y _ _ _ _ _ _ _ _ _ _ _ _ _ _ _ _ _ _ _ _ _ _ _ _ _ _ _ _ _ _ _ _ _ _ _ _ _ _ _ _ _ _ _ _ _ _ _ _ _ __ _ _ _ _ _ _ _ _ _ _ _ _ _ _ _ _ _ _ _ _ _ _ _ _ _ _ _ _ _ _ _ _ _ _ _ _ _ _ _ _ _ _ _ _ _ _ _ _ __ _ _ _ _ _ _ _ _ _ _ _ _ _ _ _ _ _ _ _ _ _ _ _ _ _ _ _ _ _ _ _ _ _ _ _ _ _ _ _ _ _ _ _ _ _ _ _ _ _
We d n e s d a y _ _ _ _ _ _ _ _ _ _ _ _ _ _ _ _ _ _ _ _ _ _ _ _ _ _ _ _ _ _ _ _ _ _ _ _ _ _ _ _ _ _ _ _ _ _ _ _ _ __ _ _ _ _ _ _ _ _ _ _ _ _ _ _ _ _ _ _ _ _ _ _ _ _ _ _ _ _ _ _ _ _ _ _ _ _ _ _ _ _ _ _ _ _ _ _ _ _ __ _ _ _ _ _ _ _ _ _ _ _ _ _ _ _ _ _ _ _ _ _ _ _ _ _ _ _ _ _ _ _ _ _ _ _ _ _ _ _ _ _ _ _ _ _ _ _ _ _
T h u r s d a y _ _ _ _ _ _ _ _ _ _ _ _ _ _ _ _ _ _ _ _ _ _ _ _ _ _ _ _ _ _ _ _ _ _ _ _ _ _ _ _ _ _ _ _ _ _ _ _ _ __ _ _ _ _ _ _ _ _ _ _ _ _ _ _ _ _ _ _ _ _ _ _ _ _ _ _ _ _ _ _ _ _ _ _ _ _ _ _ _ _ _ _ _ _ _ _ _ _ __ _ _ _ _ _ _ _ _ _ _ _ _ _ _ _ _ _ _ _ _ _ _ _ _ _ _ _ _ _ _ _ _ _ _ _ _ _ _ _ _ _ _ _ _ _ _ _ _ _
F r i d a y _ _ _ _ _ _ _ _ _ _ _ _ _ _ _ _ _ _ _ _ _ _ _ _ _ _ _ _ _ _ _ _ _ _ _ _ _ _ _ _ _ _ _ _ _ _ _ _ _ __ _ _ _ _ _ _ _ _ _ _ _ _ _ _ _ _ _ _ _ _ _ _ _ _ _ _ _ _ _ _ _ _ _ _ _ _ _ _ _ _ _ _ _ _ _ _ _ _ __ _ _ _ _ _ _ _ _ _ _ _ _ _ _ _ _ _ _ _ _ _ _ _ _ _ _ _ _ _ _ _ _ _ _ _ _ _ _ _ _ _ _ _ _ _ _ _ _ _
S a t u r d a y _ _ _ _ _ _ _ _ _ _ _ _ _ _ _ _ _ _ _ _ _ _ _ _ _ _ _ _ _ _ _ _ _ _ _ _ _ _ _ _ _ _ _ _ _ _ _ _ _ __ _ _ _ _ _ _ _ _ _ _ _ _ _ _ _ _ _ _ _ _ _ _ _ _ _ _ _ _ _ _ _ _ _ _ _ _ _ _ _ _ _ _ _ _ _ _ _ _ __ _ _ _ _ _ _ _ _ _ _ _ _ _ _ _ _ _ _ _ _ _ _ _ _ _ _ _ _ _ _ _ _ _ _ _ _ _ _ _ _ _ _ _ _ _ _ _ _ _
S a t u r d a y _ _ _ _ _ _ _ _ _ _ _ _ _ _ _ _ _ _ _ _ _ _ _ _ _ _ _ _ _ _ _ _ _ _ _ _ _ _ _ _ _ _ _ _ _ _ _ _ _ __ _ _ _ _ _ _ _ _ _ _ _ _ _ _ _ _ _ _ _ _ _ _ _ _ _ _ _ _ _ _ _ _ _ _ _ _ _ _ _ _ _ _ _ _ _ _ _ _ __ _ _ _ _ _ _ _ _ _ _ _ _ _ _ _ _ _ _ _ _ _ _ _ _ _ _ _ _ _ _ _ _ _ _ _ _ _ _ _ _ _ _ _ _ _ _ _ _ _
Total (to be done in next class):Number of miles traveled by walking and biking: _ _ _ _ _ _ _ _ _ _ _ _ _ _ _ _ _ _ _ _ _ _ _ _ _ _ _ _ _Number of trips taken by carpool, bus, subway, and train: _ _ _ _ _ _ _ _ _ _ _ _ _ _ _ _ _ _ _ _ _ _ _
E x a m p l eD a y Tr a v e l e d Tr a v e l e d D i s t a n c e Tr i p s
f r o m … t o … b y … (miles, approx.)
M o n d a y : home to friend’s house b i k e 1.0 milesTu e s d a y : home to school w a l k 0.5 milesWe d n e s d a y : home to football game b u s 1F r i d a y : home to the movies walk (part) 3.0 miles
subway (part) 1

117 Bibliography
CO M P R E H E NSIVE HEA LT HActive & Safe Routes to School, Walk to School Day, links and resources for Teachers — iwalk International.Includes classroom activities that link to the Ontario Curriculum (Canada). Website URL: www. i w a l k t o s c h o o l . o r g /r e s o u r c e . h t m l
Centers for Disease Control — Prevalence of Obesity and Overweight Among Adults: United States 1999-2000.Data from National Health and Nutrition Examination Survey 1999-2000. National Center for Health Statistics. URL: www. c d c . g o v /
Eat Well & Keep Moving — Harvard School of Public Health. Curriculum that covers healthy eating andhealth/physical education activities, including walking. Contact: Human Kinetics, 800-747-4457 or Website URL: www. h u m a n k i n e t i c s . c o m / p r o d u c t s / s h o w p r o d u c t . c f m ? i s b n = 0 7 3 6 0 3 0 9 6 4
The Great Body Shop — Children’s Health Market. Research-based health curriculum program for pre-K throughmiddle school. Website URL: www. t h e g r e a t b o d y s h o p . n e t /
Health information websites, such as — Website URL: http://adam.about.com/ (e.g., search on “heart disease,”“diabetes,” and “exercise”)
Institute of Medicine of the National Academies — Childhood Obesity in the United States: Facts and Figures.2004. URL: www. i o m . e d u /
Kids Wa l k - t o - S c h o o l — Centers for Disease Control (CDC). A community-based program developed by CDC’sNutrition and Physical Activity Program. Website URL: www. c d c . g o v / n c c d p h p / d n p a / k i d s w a l k /
PE Central — Provides current information on developmentally appropriate physical education programs for chil-dren and youth. Website URL: www. p e c e n t r a l . o r g
Safe Routes to Schools, Teachers Resource Pack — Sustrans Routes for People. Activities for primary andsecondary levels in England. Links to several curricula. Also includes transportation facts, figures, and question-naires. Website URL: www. s a f e r o u t e s t o s c h o o l s . o r g . u k /
Safe Routes to Schools Tool Kit Manual — Wa l k B o s t o n . Includes background information on safe routes toschools programs, a case study, step-by-step discussion of how to organize a program in your community, classroomactivities, and sample forms and surveys. Website URL: www. w a l k b o s t o n . o r g
H I STO RY AND SOCIAL S C I E N C EGoing Places, Making Choices — National 4-H Council. High school curriculum that raises awareness abouttransportation, personal mobility choices, and the environment; interdependency between economic, environmental,social, and political concerns; natural resources and energy use; global climate change; land use; and personalchoices and community action. Website URL: www. 4 h g p m c . c o m /
National Highway Transportation and Safety Administration — Building Safe Communities - Safe Routes toSchools. 2001. Vol. 5 No. 1. URL: www. n h t s a . d o t . g o v
Bibliography

118Walking for Health & the Environment
Traffic Survey — The Beacon Geography Department. Website URL: w w w. b e a c o n s c h o o l . c o . u k / g e o g r a p h y / f i e l d w o r k / h o m e 2 0 0 4 / t r a f f i c i n f o . h t m
Walk and Bike Across America — Way to Go Program, British Columbia. Website URL: w w w. w a y t o g o . i c b c . b c . c a
Walk and Bike Across America — Marin County, CA, Safe Routes to School program. Website URL:h t t p : / / w w w. s a f e r o u t e s t o s c h o o l s . o r g / w a l k /
M AT H E M ATI CSPrimary and Secondary School Teaching Resource — UK Department for Tr a n s p o r t . Teaching resources forprimary and secondary school teachers on road safety-related topics. www. d a t a b a s e s . d f t . g o v. u k / l e s s o n p l a n s /
Pedometer Lesson Plan — Website URL: www. t h e p e d o m e t e r c o m p a n y. c o m / b o o k s . h t m l
SCIENCE AND TE C H NO LOGY / E N G I N E E R I N GAir Curriculum Resources, Teacher Center — U.S. Environmental Protection Agency (EPA ) . Lists and describesseveral curriculum-related sites, including the SunWise Schools Program, several listed below (Project A.I.R.E.; EasyBreathers; and Air Pollution, What’s the Solution?), and others. Website URL: www. e p a . g o v / t e a c h e r s / c u r r i c - a i r. h t m
A I R N o w — A multi-agency government website that provides the public with easy access to national and local airquality information. Includes Kids and Teachers sections. Website URL: www. a i r n o w. g o v
Air Pollution, What’s the Solution — U.S. EPA . Curriculum unit on ground-level ozone for grades 6-12. We b s i t eURL: www. k 1 2 s c i e n c e . o r g / c u r r i c u l u m / a i r p r o j /
Air Quality Lesson Plans and Data — Texas Natural Resource Conservation Commission (TNRCC). Numerous airquality-related lesson plans for grades 1-12. Website URL: www. t n r c c . s t a t e . t x . u s / a i r / l e s s o n _ p l a n s . h t m l
Easy Breathers — Wisconsin Department of Natural Resources. Covers pollution emissions from transportationsources, including topics such as global warming, climate and greenhouse gases, average vehicles occupancy inyour community, and air issues: a community survey. References relevant primary national (U.S.) academic stan-dards. Website URL: www. e a s y b r e a t h e r s . o r g / t e a c h e r /
The Educator’s Reference Desk — Information Institute of Syracuse. Numerous lesson plans (e.g., Heart Rate,Breathing), links to resources, and answers to education questions. Website URL: www. e d u r e f . o r g /
Engineering Planet — Rutgers Engineering. Lessons developed by middle school teachers and university facultyon current science and technology (including pollution and environmental) issues. Website URL: www. e n g i n e e r i n g-p l a n e t . r u t g e r s . e d u
E PA Student Center, Air — U.S. EPA . Covers a variety of topics such as global warming, acid rain, ozone, and UVradiation. Website URL: www. e p a . g o v / s t u d e n t s / a i r. h t m
Environmental Education for Kids — Wisconsin Department of Natural Resources. Electronic magazine forGrades 4-8 that includes teaching activities and educational resources. Website URL: www. d n r. s t a t e . w i . u s /o r g / c a e r / c e / e e k /

119 Bibliography
The KnowZone — California Air Resources Board. Provides teaching materials and information on air quality andenvironmental issues. Website URL: http://www. a r b . c a . g o v / k n o w z o n e / k n o w z o n e . h t m
Polar Bear Fan Club — URL: www. p o l a r b e a r. o r g . u k /
The Potential Consequences of Climate Variability and Change — Institute for Global EnvironmentalS t r a t e g i e s . For grades 1-12, age-appropriate activities covering greenhouse gases and their effect on agriculture,coastal areas, forests, human health, and water. Website URL: www. u s g c r p . g o v / u s g c r p / n a c c / d e f a u l t . h t m
Project A.I.R.E. — U.S. EPA New England. Large set of student activities, exercises, and background readingmaterials for teachers and students in grades K-12. Topics include air quality, rainforests, radon, environmental laws,the greenhouse effect, and ozone. Website URL: www. e p a . g o v / r e g i o n 0 1 / s t u d e n t s / t e a c h e r / a i r e . h t m l
Science To p i c s — Eisenhower National Clearinghouse for Mathematics and Science Education (ENC), a K-12math and science teacher center, allows online searches by key word to find a variety of science web sites with les-son plans and activities. Website URL: www. e n c . o r g /
Smog City — Sacramento Metropolitan Air Quality Management District. An interactive air pollution simulatorgame that shows how people’s choices, environmental factors, and land use contribute to air pollution. Website URL: www. s m o g c i t y. c o m / w e l c o m e . h t m
Tailpipe Ta l l y — Environmental Defense. Interactive tool that calculates consumption, fuel cost, and vehicle emis-sions for different vehicle models. Website URL: www. E n v i r o n m e n t a l d e f e n s e . o r g / Ta i l p i p e Ta l l y /


walkBostonwww.walkboston.org www.erg.com
This Safe Routes to SchoolsCurriculum teaches students,through stimulating and rele-vant lessons, how walking isgood for their bodies and thee n v i ro n m e n t . For teachers, itsatisfies the MassachusettsCurriculum Frameworksrequirements.
REDUCE TRAFFIC | CREATE WALKABLE COMMUNITIES| PROTECT THE ENVIRONMENT | PROMOTE EXERCISEF O STER IND EP END ENCE | AWA K EN ST UD EN TS ’ MIND S
T S O C OO O