ssd sensitivity on boron - logistic distribution 1...
TRANSCRIPT
These are usually censored data values - refer to original dataConcentration values that are missing indicate studies that were not used
These are usually censored data values - refer to original dataConcentration values that are missing indicate studies that were not used
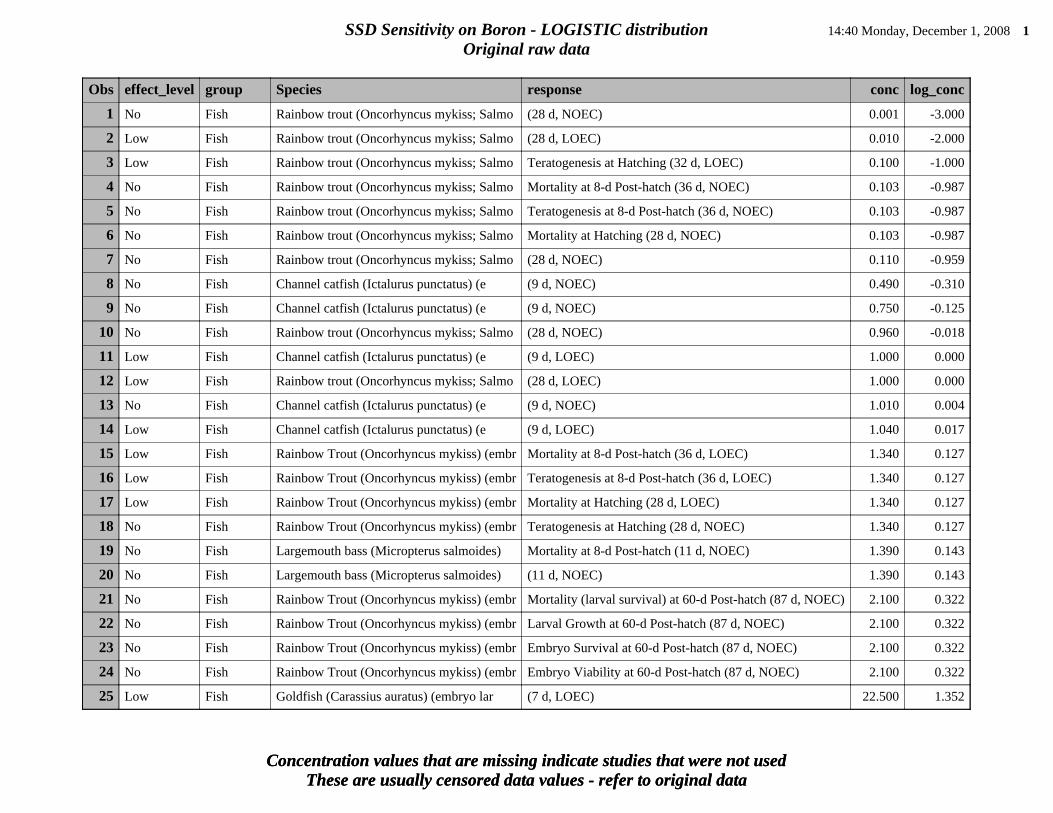
SSD Sensitivity on Boron - LOGISTIC distribution 14:40 Monday, December 1, 2008 1
Original raw data
Obs effect_level group Species response conc log_conc
1 No Fish Rainbow trout (Oncorhyncus mykiss; Salmo (28 d, NOEC) 0.001 -3.000
2 Low Fish Rainbow trout (Oncorhyncus mykiss; Salmo (28 d, LOEC) 0.010 -2.000
3 Low Fish Rainbow trout (Oncorhyncus mykiss; Salmo Teratogenesis at Hatching (32 d, LOEC) 0.100 -1.000
4 No Fish Rainbow trout (Oncorhyncus mykiss; Salmo Mortality at 8-d Post-hatch (36 d, NOEC) 0.103 -0.987
5 No Fish Rainbow trout (Oncorhyncus mykiss; Salmo Teratogenesis at 8-d Post-hatch (36 d, NOEC) 0.103 -0.987
6 No Fish Rainbow trout (Oncorhyncus mykiss; Salmo Mortality at Hatching (28 d, NOEC) 0.103 -0.987
7 No Fish Rainbow trout (Oncorhyncus mykiss; Salmo (28 d, NOEC) 0.110 -0.959
8 No Fish Channel catfish (Ictalurus punctatus) (e (9 d, NOEC) 0.490 -0.310
9 No Fish Channel catfish (Ictalurus punctatus) (e (9 d, NOEC) 0.750 -0.125
10 No Fish Rainbow trout (Oncorhyncus mykiss; Salmo (28 d, NOEC) 0.960 -0.018
11 Low Fish Channel catfish (Ictalurus punctatus) (e (9 d, LOEC) 1.000 0.000
12 Low Fish Rainbow trout (Oncorhyncus mykiss; Salmo (28 d, LOEC) 1.000 0.000
13 No Fish Channel catfish (Ictalurus punctatus) (e (9 d, NOEC) 1.010 0.004
14 Low Fish Channel catfish (Ictalurus punctatus) (e (9 d, LOEC) 1.040 0.017
15 Low Fish Rainbow Trout (Oncorhyncus mykiss) (embr Mortality at 8-d Post-hatch (36 d, LOEC) 1.340 0.127
16 Low Fish Rainbow Trout (Oncorhyncus mykiss) (embr Teratogenesis at 8-d Post-hatch (36 d, LOEC) 1.340 0.127
17 Low Fish Rainbow Trout (Oncorhyncus mykiss) (embr Mortality at Hatching (28 d, LOEC) 1.340 0.127
18 No Fish Rainbow Trout (Oncorhyncus mykiss) (embr Teratogenesis at Hatching (28 d, NOEC) 1.340 0.127
19 No Fish Largemouth bass (Micropterus salmoides) Mortality at 8-d Post-hatch (11 d, NOEC) 1.390 0.143
20 No Fish Largemouth bass (Micropterus salmoides) (11 d, NOEC) 1.390 0.143
21 No Fish Rainbow Trout (Oncorhyncus mykiss) (embr Mortality (larval survival) at 60-d Post-hatch (87 d, NOEC) 2.100 0.322
22 No Fish Rainbow Trout (Oncorhyncus mykiss) (embr Larval Growth at 60-d Post-hatch (87 d, NOEC) 2.100 0.322
23 No Fish Rainbow Trout (Oncorhyncus mykiss) (embr Embryo Survival at 60-d Post-hatch (87 d, NOEC) 2.100 0.322
24 No Fish Rainbow Trout (Oncorhyncus mykiss) (embr Embryo Viability at 60-d Post-hatch (87 d, NOEC) 2.100 0.322
25 Low Fish Goldfish (Carassius auratus) (embryo lar (7 d, LOEC) 22.500 1.352

These are usually censored data values - refer to original dataConcentration values that are missing indicate studies that were not used
SSD Sensitivity on Boron - LOGISTIC distribution 14:40 Monday, December 1, 2008 2
Original raw data
Obs effect_level group Species response conc log_conc
26 Low Fish Channel catfish (Ictalurus punctatus) (e (9 d, LOEC) 25.900 1.413
27 No Fish Goldfish (Carassius auratus) (embryo lar (7 d, NOEC) 26.500 1.423
28 Low Fish Goldfish (Carassius auratus) (embryo lar (7 d, LOEC) 27.330 1.437
29 Low Fish Goldfish (Carassius auratus) (embryo lar (7 d, LOEC) 48.750 1.688
30 Low Fish Rainbow trout (Oncorhyncus mykiss; Salmo (28 d, LOEC) 49.700 1.696
31 Low Fish Rainbow trout (Oncorhynchus mykiss) (emb Embryonic Mortality (6 wk, LOEC, 85 to 95% mortality) 108.000 2.033
32 No Fish Rainbow Trout (Oncorhyncus mykiss) (20 d Larval Growth at 60-d Post-hatch (67 d, NOEC) 18.000 1.255
33 No Fish Rainbow Trout (Oncorhyncus mykiss) (20 d Embryo Survival at 60-d Post-hatch (67 d, NOEC) 18.000 1.255
34 No Fish Rainbow Trout (Oncorhyncus mykiss) (20 d Larval Survival at 60-d Post-hatch (67 d, NOEC) 18.000 1.255
35 Low Fish Channel catfish (Ictalurus punctatus) (e (9 d, LOEC) 5.420 0.734
36 No Fish Goldfish (Carassius auratus) (embryo lar (7 d, NOEC) 6.800 0.833
37 Low Fish Goldfish (Carassius auratus) (embryo lar (7 d, LOEC) 8.330 0.921
38 No Fish Goldfish (Carassius auratus) (embryo lar (7 d, NOEC) 8.530 0.931
39 No Fish Channel catfish (Ictalurus punctatus) (e (9 d, NOEC) 9.000 0.954
40 No Fish Goldfish (Carassius auratus) (embryo lar (7 d, NOEC) 9.200 0.964
41 No Fish Rainbow trout (Oncorhyncus mykiss; Salmo (28 d, NOEC) 9.630 0.984
42 Low Fish Rainbow trout (Oncorhyncus mykiss; Salmo (28 d, LOEC) 9.700 0.987
43 Low Fish Rainbow Trout (Oncorhyncus mykiss) (embr Teratogenesis at Hatching (28 d, LOEC) 11.460 1.059
44 Low Fish Largemouth bass (Micropterus salmoides) Mortality at 8-d Post-hatch (11 d, LOEC) 12.170 1.085
45 No Fish Zebrafish (Brachydanio rerio) mortality, growth, condition (34-d MATC) 10.000 1.000
46 No Amphibian Fowler's toad (Bufo fowleri) (embryo-lar (7 d, NOEC) 22.300 1.348
47 No Amphibian Leopard Frog (Rana pipiens) (embryo-larv (7 d NOEC) 7.040 0.848
48 No Amphibian Leopard Frog (Rana pipiens) (embryo-larv (7 d NOEC) 7.040 0.848
49 Low Amphibian Leopard Frog (Rana pipiens) (embryo-larv (7 d, LOEC) 9.600 0.982
50 Low Amphibian Leopard Frog (Rana pipiens) (embryo-larv (7 d, LOEC) 10.500 1.021
These are usually censored data values - refer to original dataConcentration values that are missing indicate studies that were not used
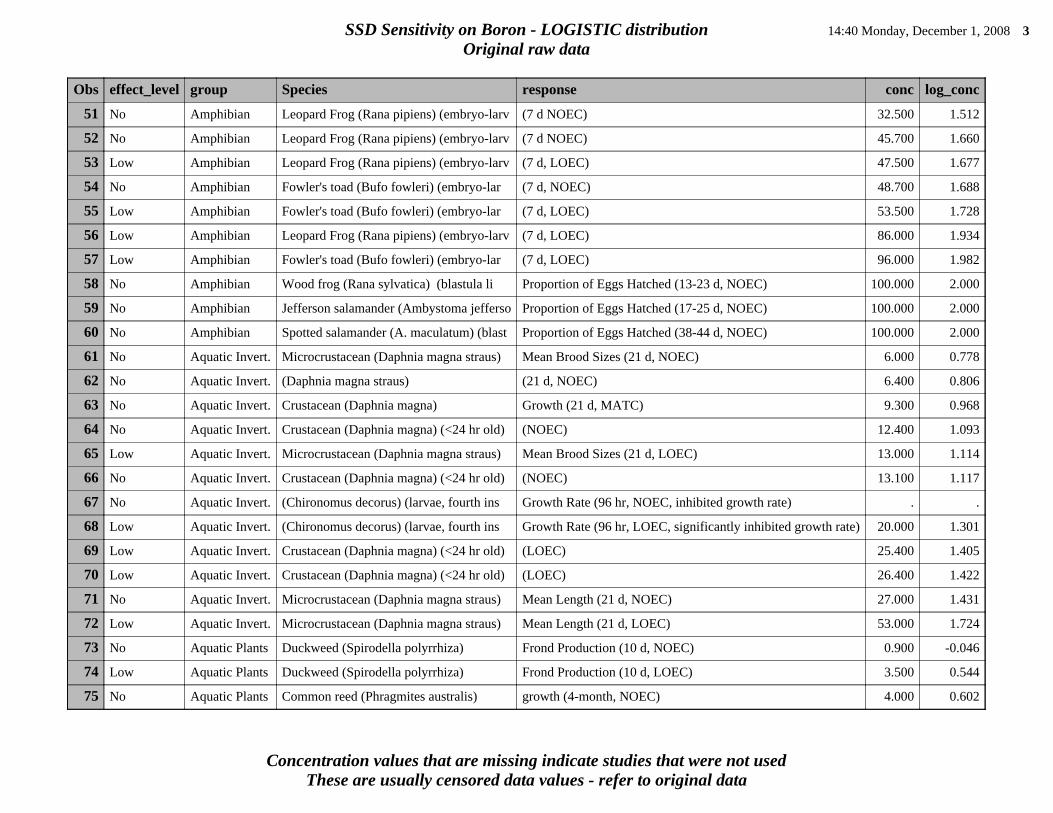
SSD Sensitivity on Boron - LOGISTIC distribution 14:40 Monday, December 1, 2008 3
Original raw data
Obs effect_level group Species response conc log_conc
51 No Amphibian Leopard Frog (Rana pipiens) (embryo-larv (7 d NOEC) 32.500 1.512
52 No Amphibian Leopard Frog (Rana pipiens) (embryo-larv (7 d NOEC) 45.700 1.660
53 Low Amphibian Leopard Frog (Rana pipiens) (embryo-larv (7 d, LOEC) 47.500 1.677
54 No Amphibian Fowler's toad (Bufo fowleri) (embryo-lar (7 d, NOEC) 48.700 1.688
55 Low Amphibian Fowler's toad (Bufo fowleri) (embryo-lar (7 d, LOEC) 53.500 1.728
56 Low Amphibian Leopard Frog (Rana pipiens) (embryo-larv (7 d, LOEC) 86.000 1.934
57 Low Amphibian Fowler's toad (Bufo fowleri) (embryo-lar (7 d, LOEC) 96.000 1.982
58 No Amphibian Wood frog (Rana sylvatica) (blastula li Proportion of Eggs Hatched (13-23 d, NOEC) 100.000 2.000
59 No Amphibian Jefferson salamander (Ambystoma jefferso Proportion of Eggs Hatched (17-25 d, NOEC) 100.000 2.000
60 No Amphibian Spotted salamander (A. maculatum) (blast Proportion of Eggs Hatched (38-44 d, NOEC) 100.000 2.000
61 No Aquatic Invert. Microcrustacean (Daphnia magna straus) Mean Brood Sizes (21 d, NOEC) 6.000 0.778
62 No Aquatic Invert. (Daphnia magna straus) (21 d, NOEC) 6.400 0.806
63 No Aquatic Invert. Crustacean (Daphnia magna) Growth (21 d, MATC) 9.300 0.968
64 No Aquatic Invert. Crustacean (Daphnia magna) (<24 hr old) (NOEC) 12.400 1.093
65 Low Aquatic Invert. Microcrustacean (Daphnia magna straus) Mean Brood Sizes (21 d, LOEC) 13.000 1.114
66 No Aquatic Invert. Crustacean (Daphnia magna) (<24 hr old) (NOEC) 13.100 1.117
67 No Aquatic Invert. (Chironomus decorus) (larvae, fourth ins Growth Rate (96 hr, NOEC, inhibited growth rate) . .
68 Low Aquatic Invert. (Chironomus decorus) (larvae, fourth ins Growth Rate (96 hr, LOEC, significantly inhibited growth rate) 20.000 1.301
69 Low Aquatic Invert. Crustacean (Daphnia magna) (<24 hr old) (LOEC) 25.400 1.405
70 Low Aquatic Invert. Crustacean (Daphnia magna) (<24 hr old) (LOEC) 26.400 1.422
71 No Aquatic Invert. Microcrustacean (Daphnia magna straus) Mean Length (21 d, NOEC) 27.000 1.431
72 Low Aquatic Invert. Microcrustacean (Daphnia magna straus) Mean Length (21 d, LOEC) 53.000 1.724
73 No Aquatic Plants Duckweed (Spirodella polyrrhiza) Frond Production (10 d, NOEC) 0.900 -0.046
74 Low Aquatic Plants Duckweed (Spirodella polyrrhiza) Frond Production (10 d, LOEC) 3.500 0.544
75 No Aquatic Plants Common reed (Phragmites australis) growth (4-month, NOEC) 4.000 0.602
These are usually censored data values - refer to original dataConcentration values that are missing indicate studies that were not used
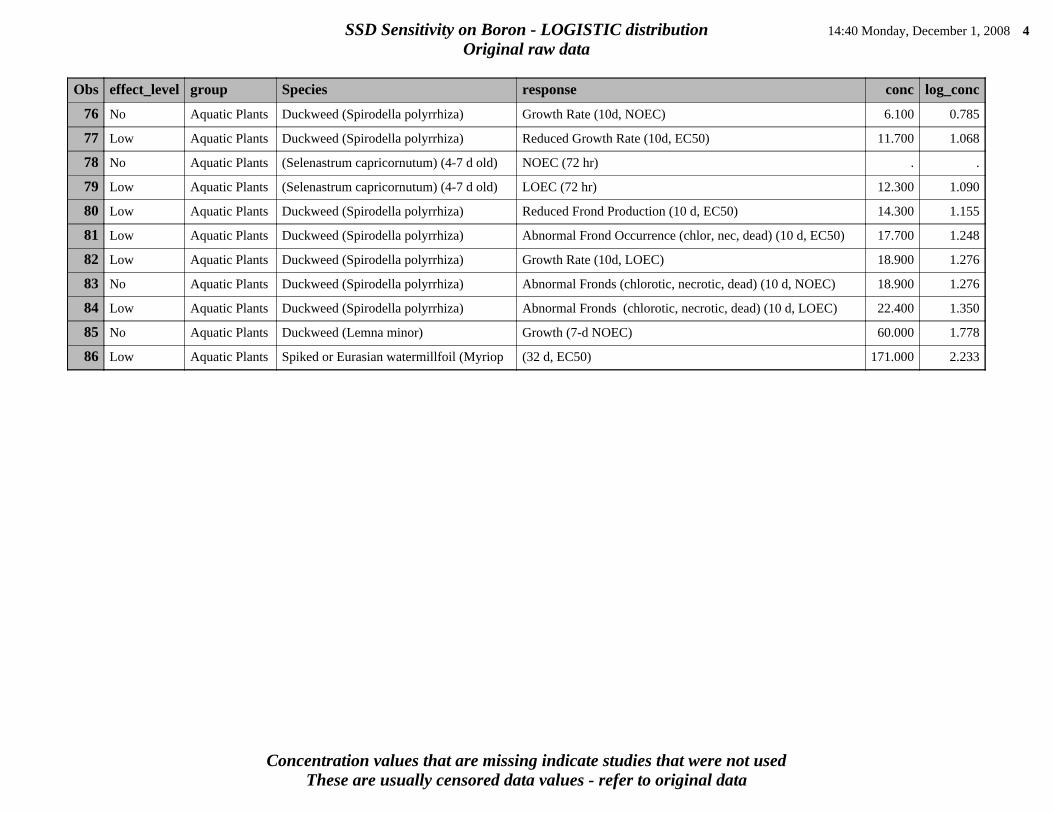
SSD Sensitivity on Boron - LOGISTIC distribution 14:40 Monday, December 1, 2008 4
Original raw data
Obs effect_level group Species response conc log_conc
76 No Aquatic Plants Duckweed (Spirodella polyrrhiza) Growth Rate (10d, NOEC) 6.100 0.785
77 Low Aquatic Plants Duckweed (Spirodella polyrrhiza) Reduced Growth Rate (10d, EC50) 11.700 1.068
78 No Aquatic Plants (Selenastrum capricornutum) (4-7 d old) NOEC (72 hr) . .
79 Low Aquatic Plants (Selenastrum capricornutum) (4-7 d old) LOEC (72 hr) 12.300 1.090
80 Low Aquatic Plants Duckweed (Spirodella polyrrhiza) Reduced Frond Production (10 d, EC50) 14.300 1.155
81 Low Aquatic Plants Duckweed (Spirodella polyrrhiza) Abnormal Frond Occurrence (chlor, nec, dead) (10 d, EC50) 17.700 1.248
82 Low Aquatic Plants Duckweed (Spirodella polyrrhiza) Growth Rate (10d, LOEC) 18.900 1.276
83 No Aquatic Plants Duckweed (Spirodella polyrrhiza) Abnormal Fronds (chlorotic, necrotic, dead) (10 d, NOEC) 18.900 1.276
84 Low Aquatic Plants Duckweed (Spirodella polyrrhiza) Abnormal Fronds (chlorotic, necrotic, dead) (10 d, LOEC) 22.400 1.350
85 No Aquatic Plants Duckweed (Lemna minor) Growth (7-d NOEC) 60.000 1.778
86 Low Aquatic Plants Spiked or Eurasian watermillfoil (Myriop (32 d, EC50) 171.000 2.233
These are usually censored data values - refer to original dataConcentration values that are missing indicate studies that were not used
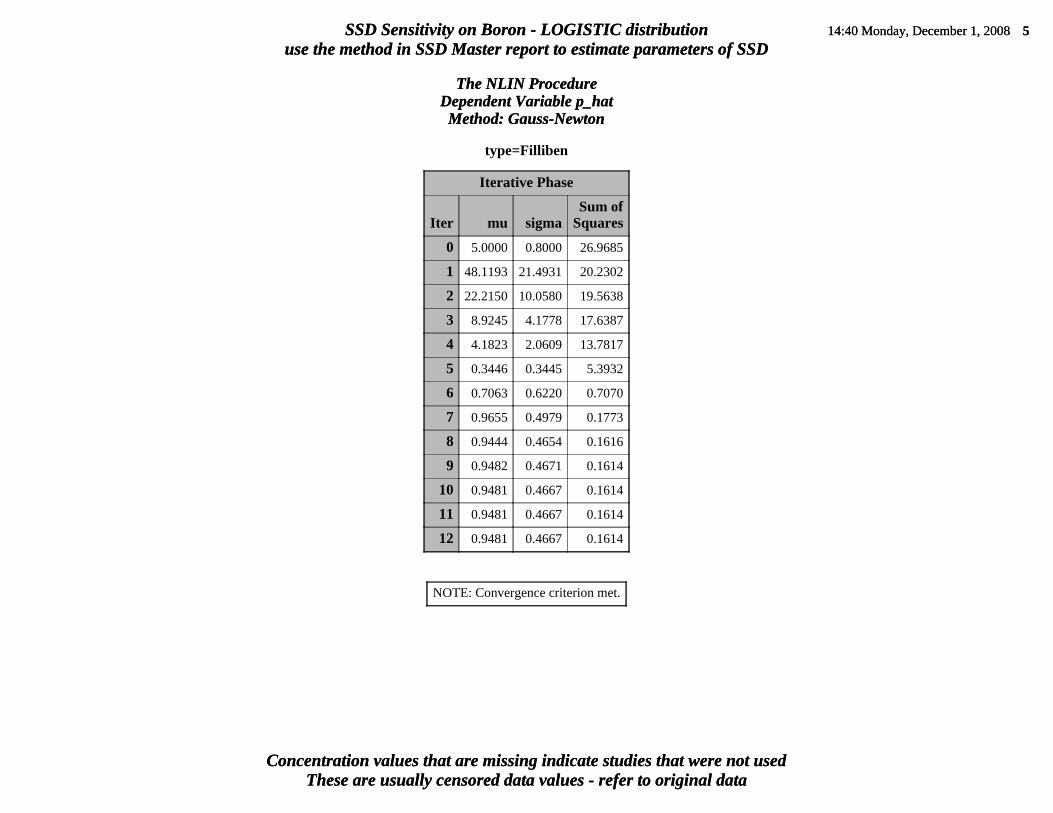
SSD Sensitivity on Boron - LOGISTIC distribution 14:40 Monday, December 1, 2008 5
use the method in SSD Master report to estimate parameters of SSD
The NLIN ProcedureDependent Variable p_hatMethod: Gauss-Newton
These are usually censored data values - refer to original dataConcentration values that are missing indicate studies that were not used
SSD Sensitivity on Boron - LOGISTIC distribution 14:40 Monday, December 1, 2008 5
use the method in SSD Master report to estimate parameters of SSD
The NLIN ProcedureDependent Variable p_hatMethod: Gauss-Newton
type=Filliben
Iterative Phase
Iter mu sigmaSum of
Squares
0 5.0000 0.8000 26.9685
1 48.1193 21.4931 20.2302
2 22.2150 10.0580 19.5638
3 8.9245 4.1778 17.6387
4 4.1823 2.0609 13.7817
5 0.3446 0.3445 5.3932
6 0.7063 0.6220 0.7070
7 0.9655 0.4979 0.1773
8 0.9444 0.4654 0.1616
9 0.9482 0.4671 0.1614
10 0.9481 0.4667 0.1614
11 0.9481 0.4667 0.1614
12 0.9481 0.4667 0.1614
NOTE: Convergence criterion met.

These are usually censored data values - refer to original dataConcentration values that are missing indicate studies that were not used
SSD Sensitivity on Boron - LOGISTIC distribution 14:40 Monday, December 1, 2008 6
use the method in SSD Master report to estimate parameters of SSD
The NLIN Procedure
type=Filliben
Estimation Summary
Method Gauss-Newton
Iterations 12
Subiterations 9
Average Subiterations 0.75
R 5.424E-6
PPC(sigma) 9.928E-7
RPC(sigma) 0.000011
Object 1.694E-9
Objective 0.161423
Observations Read 84
Observations Used 84
Observations Missing 0
Note: An intercept was not specified for this model.
Source DFSum of
SquaresMean
Square F ValueApprox
Pr > F
Model 2 27.7744 13.8872 7054.43 <.0001
Error 82 0.1614 0.00197
Uncorrected Total 84 27.9358

These are usually censored data values - refer to original dataConcentration values that are missing indicate studies that were not used
These are usually censored data values - refer to original dataConcentration values that are missing indicate studies that were not used
SSD Sensitivity on Boron - LOGISTIC distribution 14:40 Monday, December 1, 2008 7
use the method in SSD Master report to estimate parameters of SSD
The NLIN Procedure
type=Filliben
Parameter EstimateApprox
Std Error
Approximate95%
ConfidenceLimits
mu 0.9481 0.0126 0.9231 0.9731
sigma 0.4667 0.0143 0.4382 0.4952
Approximate CorrelationMatrix
mu sigma
mu 1.0000000 -0.1980750
sigma -0.1980750 1.0000000

These are usually censored data values - refer to original dataConcentration values that are missing indicate studies that were not used
SSD Sensitivity on Boron - LOGISTIC distribution 14:40 Monday, December 1, 2008 8
use the method in SSD Master report to estimate parameters of SSD
The NLIN ProcedureDependent Variable p_hatMethod: Gauss-Newton
type=Hazen
Iterative Phase
Iter mu sigmaSum of
Squares
0 5.0000 0.8000 27.0279
1 47.7270 21.4122 20.2276
2 22.2195 10.1013 19.5674
3 8.9016 4.1822 17.6384
4 4.1683 2.0593 13.7796
5 0.3388 0.3367 5.5800
6 0.6989 0.6198 0.7424
7 0.9670 0.4963 0.1800
8 0.9447 0.4617 0.1623
9 0.9488 0.4636 0.1621
10 0.9487 0.4632 0.1621
11 0.9487 0.4632 0.1621
12 0.9487 0.4632 0.1621
NOTE: Convergence criterion met.
These are usually censored data values - refer to original dataConcentration values that are missing indicate studies that were not used
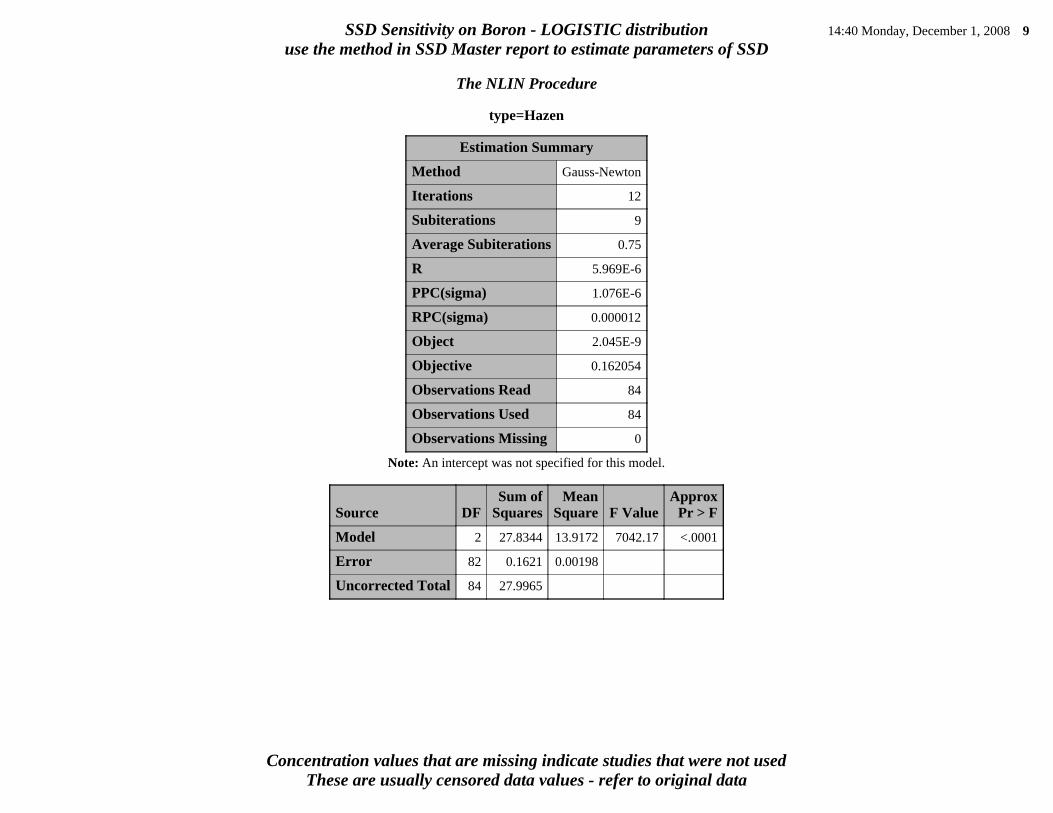
SSD Sensitivity on Boron - LOGISTIC distribution 14:40 Monday, December 1, 2008 9
use the method in SSD Master report to estimate parameters of SSD
The NLIN Procedure
type=Hazen
Estimation Summary
Method Gauss-Newton
Iterations 12
Subiterations 9
Average Subiterations 0.75
R 5.969E-6
PPC(sigma) 1.076E-6
RPC(sigma) 0.000012
Object 2.045E-9
Objective 0.162054
Observations Read 84
Observations Used 84
Observations Missing 0
Note: An intercept was not specified for this model.
Source DFSum of
SquaresMean
Square F ValueApprox
Pr > F
Model 2 27.8344 13.9172 7042.17 <.0001
Error 82 0.1621 0.00198
Uncorrected Total 84 27.9965
These are usually censored data values - refer to original dataConcentration values that are missing indicate studies that were not used
These are usually censored data values - refer to original dataConcentration values that are missing indicate studies that were not used
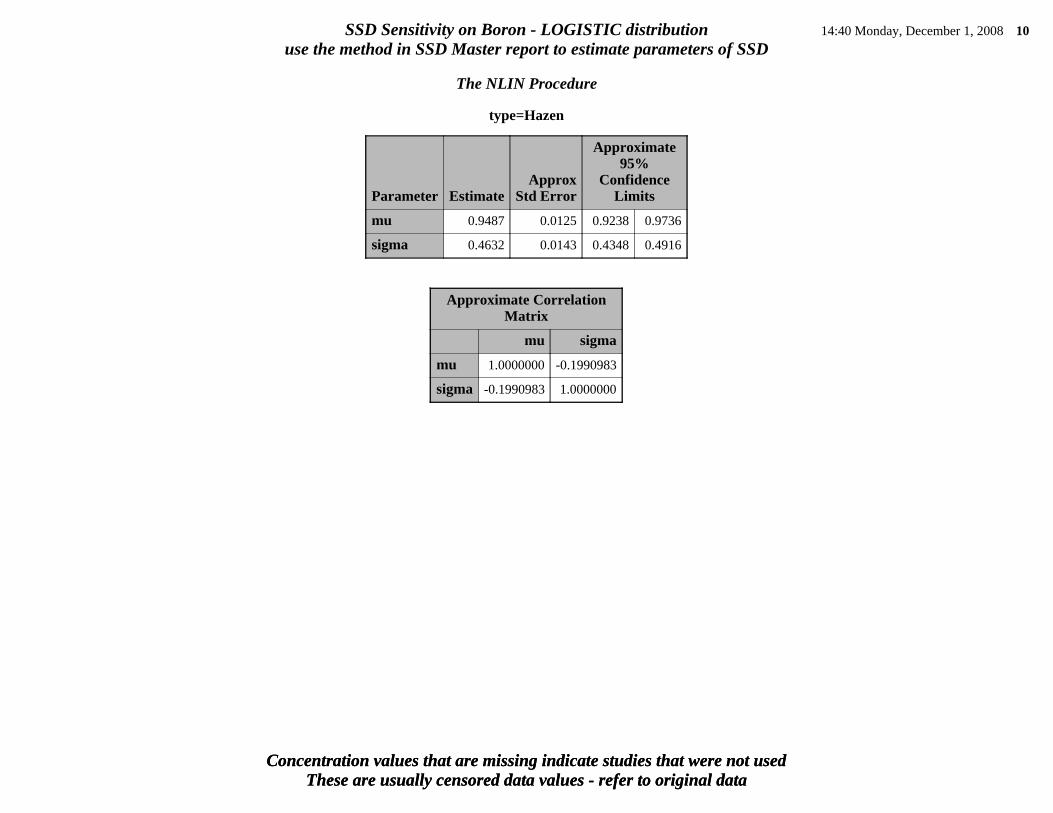
SSD Sensitivity on Boron - LOGISTIC distribution 14:40 Monday, December 1, 2008 10
use the method in SSD Master report to estimate parameters of SSD
The NLIN Procedure
type=Hazen
Parameter EstimateApprox
Std Error
Approximate95%
ConfidenceLimits
mu 0.9487 0.0125 0.9238 0.9736
sigma 0.4632 0.0143 0.4348 0.4916
Approximate CorrelationMatrix
mu sigma
mu 1.0000000 -0.1990983
sigma -0.1990983 1.0000000

probability plottype=Filliben
These are usually censored data values - refer to original dataConcentration values that are missing indicate studies that were not used
Proportion of species affected
0.0
0.1
0.2
0.3
0.4
0.5
0.6
0.7
0.8
0.9
1.0
Log10 (Concentration)
-3 -2 -1 0 1 2 3
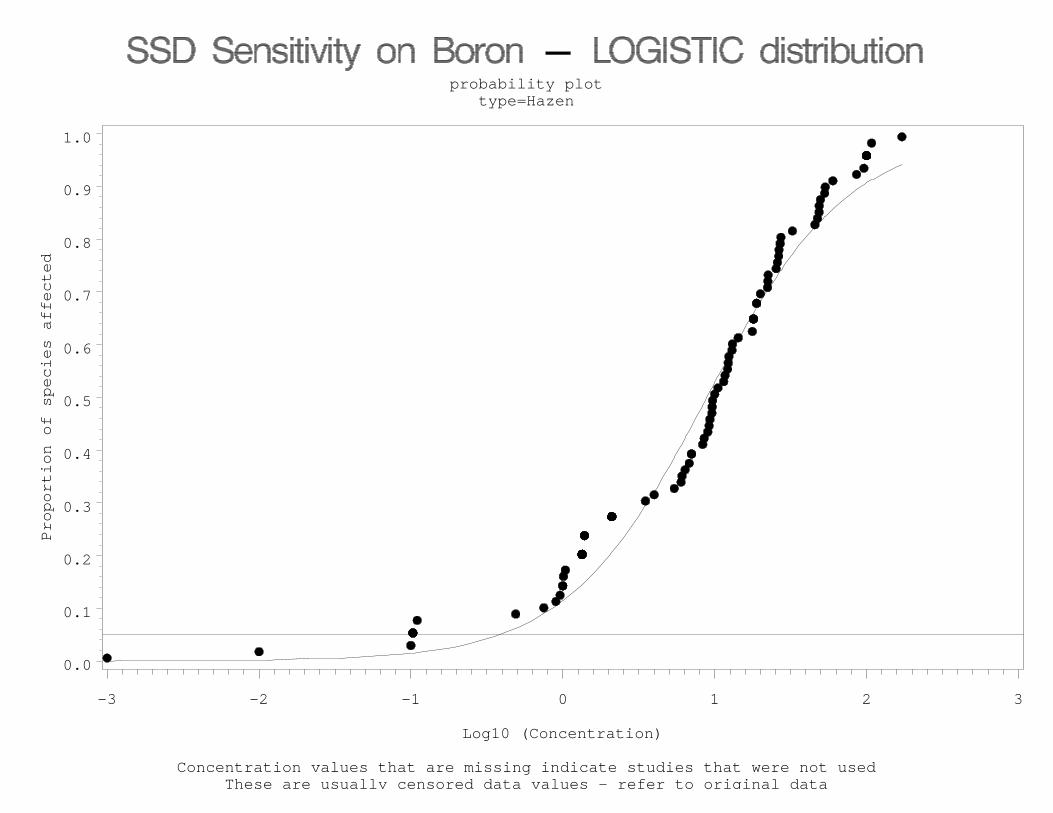
probability plottype=Hazen
These are usually censored data values - refer to original dataConcentration values that are missing indicate studies that were not used
Proportion of species affected
0.0
0.1
0.2
0.3
0.4
0.5
0.6
0.7
0.8
0.9
1.0
Log10 (Concentration)
-3 -2 -1 0 1 2 3
These are usually censored data values - refer to original dataConcentration values that are missing indicate studies that were not used
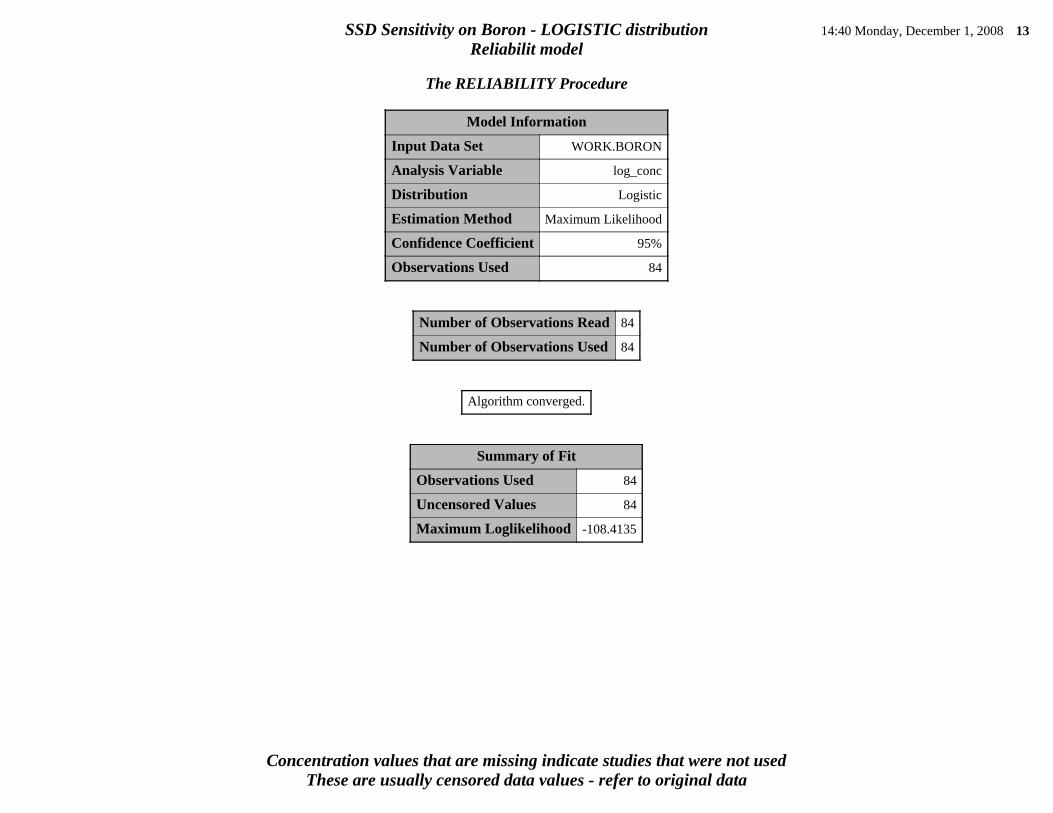
SSD Sensitivity on Boron - LOGISTIC distribution 14:40 Monday, December 1, 2008 13
Reliabilit model
The RELIABILITY Procedure
Model Information
Input Data Set WORK.BORON
Analysis Variable log_conc
Distribution Logistic
Estimation Method Maximum Likelihood
Confidence Coefficient 95%
Observations Used 84
Number of Observations Read 84
Number of Observations Used 84
Algorithm converged.
Summary of Fit
Observations Used 84
Uncensored Values 84
Maximum Loglikelihood -108.4135
These are usually censored data values - refer to original dataConcentration values that are missing indicate studies that were not used
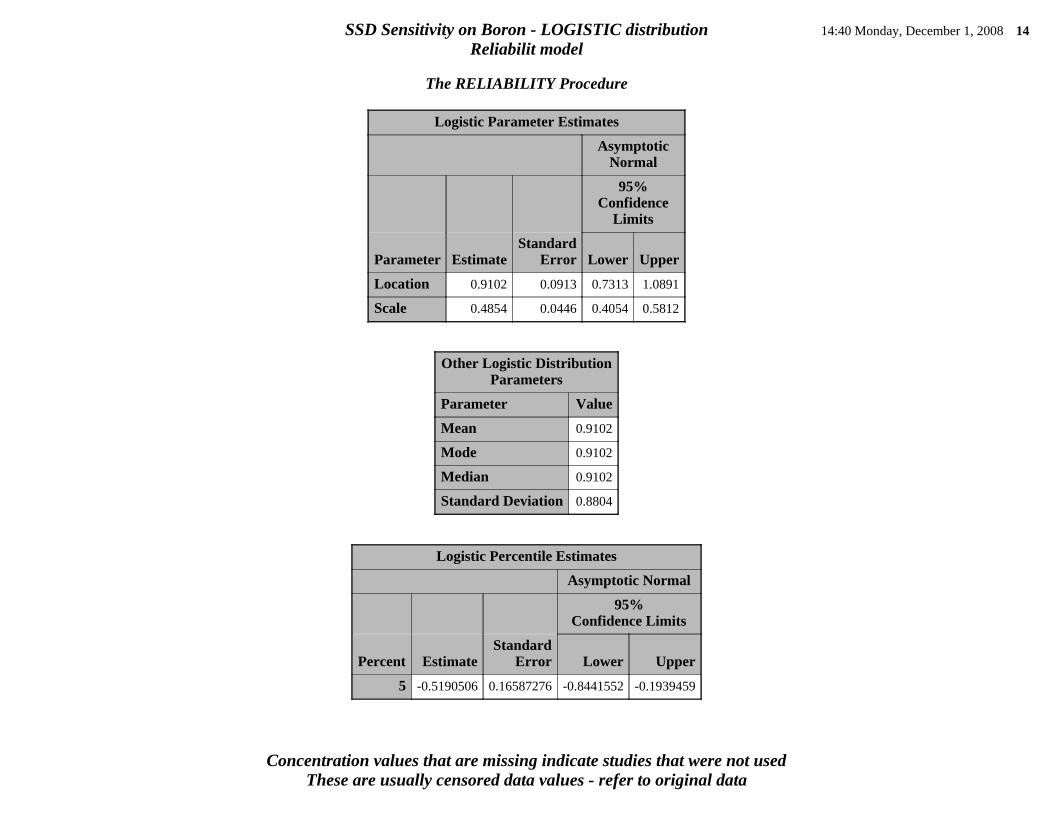
SSD Sensitivity on Boron - LOGISTIC distribution 14:40 Monday, December 1, 2008 14
Reliabilit model
The RELIABILITY Procedure
Logistic Parameter Estimates
AsymptoticNormal
95%Confidence
Limits
Parameter EstimateStandard
Error Lower Upper
Location 0.9102 0.0913 0.7313 1.0891
Scale 0.4854 0.0446 0.4054 0.5812
Other Logistic DistributionParameters
Parameter Value
Mean 0.9102
Mode 0.9102
Median 0.9102
Standard Deviation 0.8804
Logistic Percentile Estimates
Asymptotic Normal
95%Confidence Limits
Percent EstimateStandard
Error Lower Upper
5 -0.5190506 0.16587276 -0.8441552 -0.1939459
These are usually censored data values - refer to original dataConcentration values that are missing indicate studies that were not used
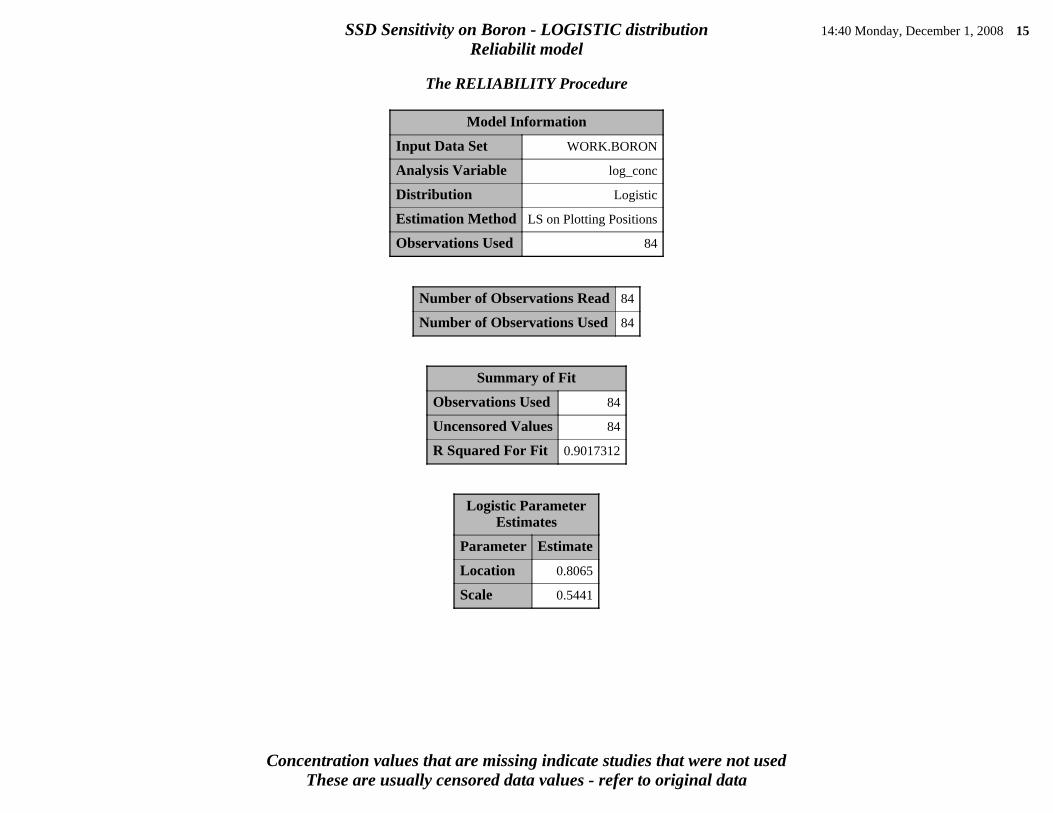
SSD Sensitivity on Boron - LOGISTIC distribution 14:40 Monday, December 1, 2008 15
Reliabilit model
The RELIABILITY Procedure
Model Information
Input Data Set WORK.BORON
Analysis Variable log_conc
Distribution Logistic
Estimation Method LS on Plotting Positions
Observations Used 84
Number of Observations Read 84
Number of Observations Used 84
Summary of Fit
Observations Used 84
Uncensored Values 84
R Squared For Fit 0.9017312
Logistic ParameterEstimates
Parameter Estimate
Location 0.8065
Scale 0.5441

These are usually censored data values - refer to original dataConcentration values that are missing indicate studies that were not used
SSD Sensitivity on Boron - LOGISTIC distribution 14:40 Monday, December 1, 2008 16
Reliabilit model
The RELIABILITY Procedure
Other Logistic DistributionParameters
Parameter Value
Mean 0.8065
Mode 0.8065
Median 0.8065
Standard Deviation 0.9868
Logistic PercentileEstimates
Percent Estimate
0.1 -2.9512878
0.2 -2.573624
0.5 -2.073462
1 -1.6936022
2 -1.3109597
5 -0.7955203
10 -0.3889851
20 0.05221569
30 0.34546621
40 0.58585308
50 0.80645349
60 1.0270539
70 1.26744077
80 1.56069129
These are usually censored data values - refer to original dataConcentration values that are missing indicate studies that were not used
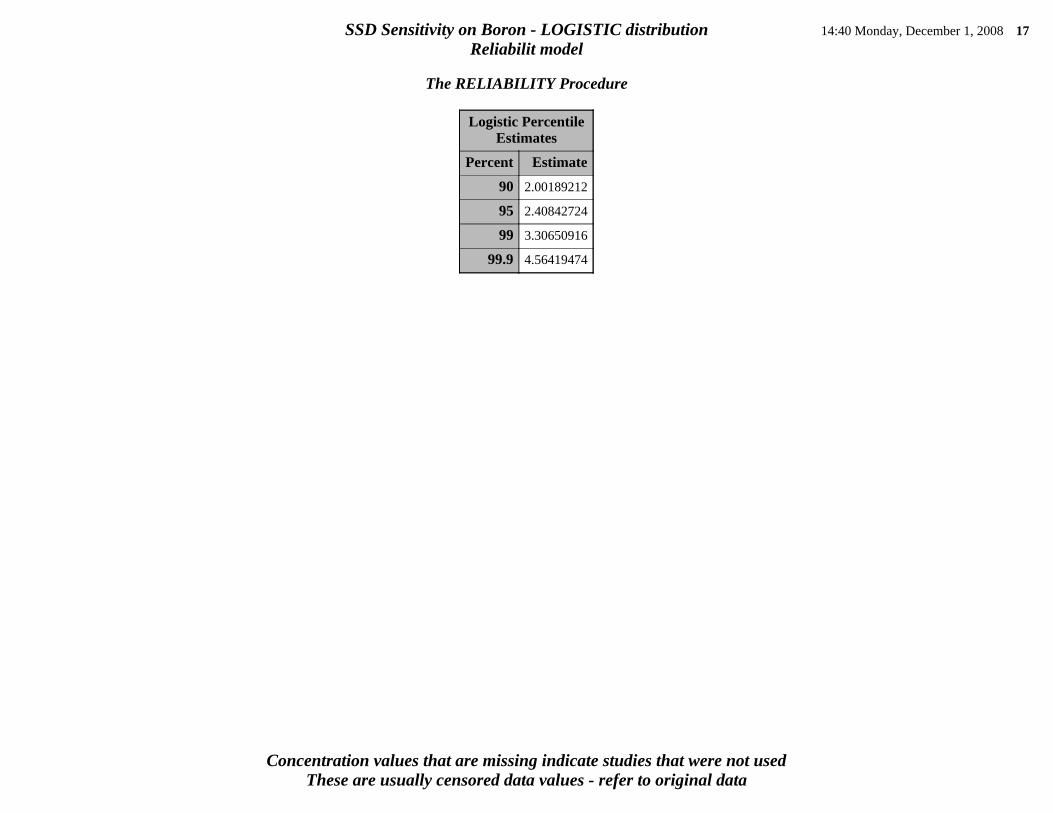
SSD Sensitivity on Boron - LOGISTIC distribution 14:40 Monday, December 1, 2008 17
Reliabilit model
The RELIABILITY Procedure
Logistic PercentileEstimates
Percent Estimate
90 2.00189212
95 2.40842724
99 3.30650916
99.9 4.56419474

Reliabilit model
These are usually censored data values - refer to original dataConcentration values that are missing indicate studies that were not used
Logistic Plot For log_conc
Percent
-3 -2 -1 0 1 2 3
.2
.5
1
2
5
10
2030
50
7080
90
95
99
99.9
99.99Location 0.806
Scale 0.544
Uncensored 84
R Squared 0.902
Fit LSYX

These are usually censored data values - refer to original dataConcentration values that are missing indicate studies that were not used
SSD Sensitivity on Boron - LOGISTIC distribution 14:40 Monday, December 1, 2008 19
Reliability model
The RELIABILITY Procedure
Model Information
Input Data Set WORK.BORON
Analysis Variable log_conc
Distribution Logistic
Estimation Method Maximum Likelihood
Confidence Coefficient 95%
Observations Used 84
Number of Observations Read 84
Number of Observations Used 84
Algorithm converged.
Summary of Fit
Observations Used 84
Uncensored Values 84
Maximum Loglikelihood -108.4135
These are usually censored data values - refer to original dataConcentration values that are missing indicate studies that were not used
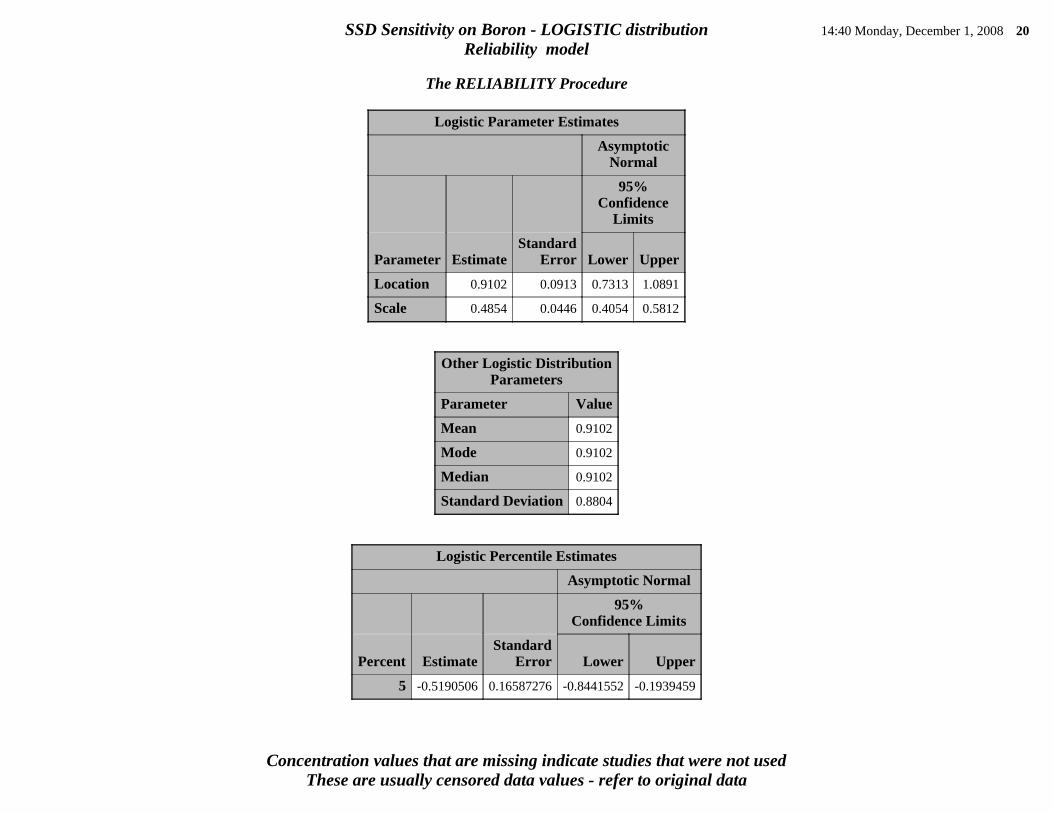
SSD Sensitivity on Boron - LOGISTIC distribution 14:40 Monday, December 1, 2008 20
Reliability model
The RELIABILITY Procedure
Logistic Parameter Estimates
AsymptoticNormal
95%Confidence
Limits
Parameter EstimateStandard
Error Lower Upper
Location 0.9102 0.0913 0.7313 1.0891
Scale 0.4854 0.0446 0.4054 0.5812
Other Logistic DistributionParameters
Parameter Value
Mean 0.9102
Mode 0.9102
Median 0.9102
Standard Deviation 0.8804
Logistic Percentile Estimates
Asymptotic Normal
95%Confidence Limits
Percent EstimateStandard
Error Lower Upper
5 -0.5190506 0.16587276 -0.8441552 -0.1939459
These are usually censored data values - refer to original dataConcentration values that are missing indicate studies that were not used
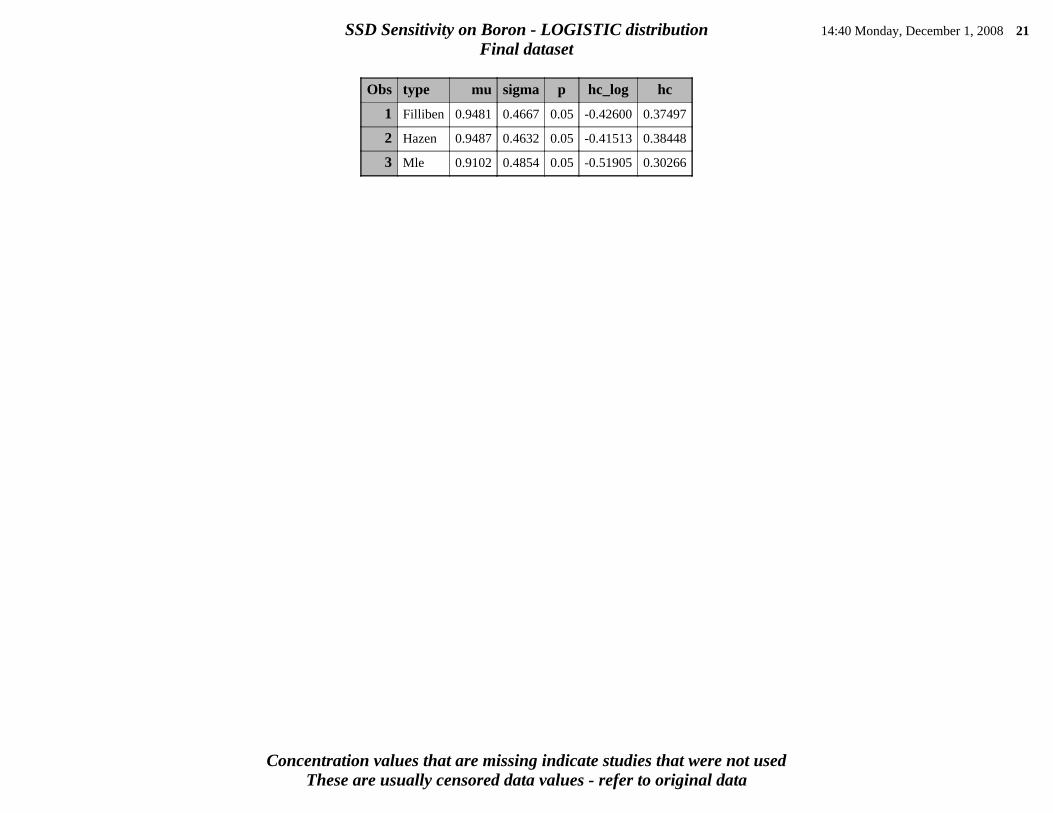
SSD Sensitivity on Boron - LOGISTIC distribution 14:40 Monday, December 1, 2008 21
Final dataset
Obs type mu sigma p hc_log hc
1 Filliben 0.9481 0.4667 0.05 -0.42600 0.37497
2 Hazen 0.9487 0.4632 0.05 -0.41513 0.38448
3 Mle 0.9102 0.4854 0.05 -0.51905 0.30266