sson infographic: what do delays in order-to-cash mean for you?
TRANSCRIPT
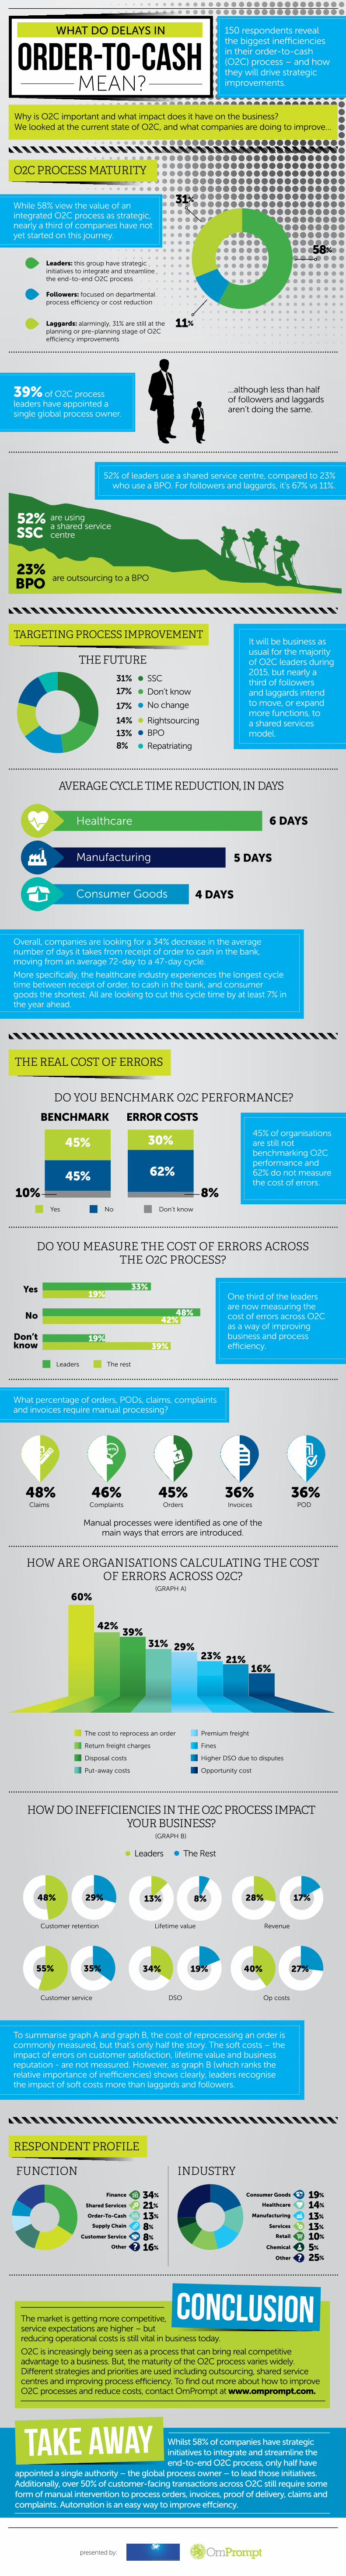
MEAN?
WHAT DO DELAYS IN
ORDER-TO-CASH150 respondents reveal the biggest inefficiencies in their order-to-cash (O2C) process – and how they will drive strategic improvements.
Why is O2C important and what impact does it have on the business? We looked at the current state of O2C, and what companies are doing to improve…
HOW DO INEFFICIENCIES IN THE O2C PROCESS IMPACT YOUR BUSINESS?
Customer retention Lifetime value Revenue
DSO Op costsCustomer service
48% 29% 28% 17%
34% 19%55% 35% 40% 27%
13% 8%
Whilst 58% of companies have strategic initiatives to integrate and streamline the end-to-end O2C process, only half have
appointed a single authority – the global process owner – to lead those initiatives. Additionally, over 50% of customer-facing transactions across O2C still require some form of manual intervention to process orders, invoices, proof of delivery, claims and complaints. Automation is an easy way to improve effciency.
The market is getting more competitive, service expectations are higher – but reducing operational costs is still vital in business today.
O2C is increasingly being seen as a process that can bring real competitive advantage to a business. But, the maturity of the O2C process varies widely. Different strategies and priorities are used including outsourcing, shared service centres and improving process efficiency. To find out more about how to improve O2C processes and reduce costs, contact OmPrompt at www.omprompt.com.
Leaders The Rest
presented by:
Claims Complaints Orders
(GRAPH A)
(GRAPH B)
Invoices POD
What percentage of orders, PODs, claims, complaints and invoices require manual processing?
48% 46% 45% 36% 36%
TAKE AWAY
CONCLUSION
O2C PROCESS MATURITY
Leaders: this group have strategic initiatives to integrate and streamline the end-to-end O2C process
Followers: focused on departmental process efficiency or cost reduction
Laggards: alarmingly, 31% are still at the planning or pre-planning stage of O2C efficiency improvements
39% of O2C process leaders have appointed a single global process owner.
...although less than half of followers and laggards aren’t doing the same.
52% of leaders use a shared service centre, compared to 23% who use a BPO. For followers and laggards, it’s 67% vs 11%.
While 58% view the value of an integrated O2C process as strategic, nearly a third of companies have not yet started on this journey.
31%
11%
58%
are using a shared service centre
are outsourcing to a BPO
52%
23%
SSC
BPO
TARGETING PROCESS IMPROVEMENTIt will be business as usual for the majority of O2C leaders during 2015, but nearly a third of followers and laggards intend to move, or expand more functions, to a shared services model.
SSC31%
13%
17%
14%
BPO
No change
Rightsourcing
THE FUTURE
AVERAGE CYCLE TIME REDUCTION, IN DAYS
Healthcare 6 DAYS
5 DAYS
4 DAYS
Manufacturing
Consumer Goods
Overall, companies are looking for a 34% decrease in the average number of days it takes from receipt of order to cash in the bank, moving from an average 72-day to a 47-day cycle.
More specifically, the healthcare industry experiences the longest cycle time between receipt of order, to cash in the bank, and consumer goods the shortest. All are looking to cut this cycle time by at least 7% in the year ahead.
THE REAL COST OF ERRORS
45% of organisations are still not benchmarking O2C performance and 62% do not measure the cost of errors.
One third of the leaders are now measuring the cost of errors across O2C as a way of improving business and process efficiency.
BENCHMARK ERROR COSTS
The rest
Yes
No
Don’t know
Leaders
DO YOU BENCHMARK O2C PERFORMANCE?
DO YOU MEASURE THE COST OF ERRORS ACROSS THE O2C PROCESS?
Yes No Don’t know
33%
48%
19%39%
42%
19%
45% 30%
45%10%
62%
8%
60%
42%39%
31% 29%23% 21%
16%
The cost to reprocess an order Premium freight
Return freight charges Fines
Disposal costs Higher DSO due to disputes
Put-away costs Opportunity cost
HOW ARE ORGANISATIONS CALCULATING THE COST OF ERRORS ACROSS O2C?
RESPONDENT PROFILE
INDUSTRY
Services
Chemical
FUNCTION
Finance
Shared Services
Customer Service
Other
Order-To-Cash
Supply Chain
34%
21%
13%
8%
8%
16%
13%
5%
Manual processes were identified as one of the main ways that errors are introduced.
Consumer Goods 19%
Healthcare 14%
Retail 10%
Manufacturing 13%
Other 25%
To summarise graph A and graph B, the cost of reprocessing an order is commonly measured, but that’s only half the story. The soft costs – the impact of errors on customer satisfaction, lifetime value and business reputation - are not measured. However, as graph B (which ranks the relative importance of inefficiencies) shows clearly, leaders recognise the impact of soft costs more than laggards and followers.
17% Don’t know
8% Repatriating