ssrn-id1013997 global upward trend in the profit share
TRANSCRIPT
8/7/2019 SSRN-id1013997 Global Upward Trend in the profit share
http://slidepdf.com/reader/full/ssrn-id1013997-global-upward-trend-in-the-profit-share 1/29
BIS Working PapersNo 231
The global upward trend inthe profit shareBy Luci Ellis and Kathr yn Smith
Monetary and Economic Department
July 2007
JEL Classification Numbers: E25, L51Keywords: profit share, technological progress, vintage capital

8/7/2019 SSRN-id1013997 Global Upward Trend in the profit share
http://slidepdf.com/reader/full/ssrn-id1013997-global-upward-trend-in-the-profit-share 2/29
BIS Working Papers are written by members of the Monetary and Economic Department ofthe Bank for International Settlements, and from time to time by other economists, and arepublished by the Bank. The views expressed in them are those of their authors and notnecessarily the views of the BIS.
Copies of publications are available from:
Bank for International SettlementsPress & CommunicationsCH-4002 Basel, Switzerland
E-mail: [email protected]
Fax: +41 61 280 9100 and +41 61 280 8100
This publication is available on the BIS website (www.bis.org).
© Bank for International Settlements 2007. All rights reserved. Limited extracts may bereproduced or translated provided the source is stated.
ISSN 1020-0959 (print)
ISSN 1682-7678 (online)
8/7/2019 SSRN-id1013997 Global Upward Trend in the profit share
http://slidepdf.com/reader/full/ssrn-id1013997-global-upward-trend-in-the-profit-share 3/29
The global upward trend in the profit share iii
Abstract
Profits growth has been strong in many developed economies in recent years, and the profit
share – the share of factor income going to capital – has been high compared with historicalexperience. This paper shows that, rather than being a recent phenomenon, profit shareshave trended upwards since about the mid 1980s in most developed economies for whichcomparable data are available. There are a number of possible explanations for this, but notall of them are consistent with a global trend over two decades, nor do they fit cross-countrydifferences in the trend in the profit share.
The preferred explanation advanced in this paper is that ongoing technological progress hasincreased the rate of obsolescence of capital goods. This induces a greater rate of churn inboth capital and jobs, which puts firms in a stronger bargaining position relative to a labourforce that now faces more frequent job losses on average. Firms can therefore reap a largerfraction of the economic surplus created by market frictions, which raises the measured profit
share. This effect is stronger where labour market institutions are more rigid, consistent withthe cross-country pattern in the trends in the profit share. There is also a positive relationshipbetween the size of the trend in the profit share, and the extent of product market regulation.This suggests a role for competition and innovation in driving down high profit margins.These explanations appear to fit the data better than alternatives raised in the literature.

8/7/2019 SSRN-id1013997 Global Upward Trend in the profit share
http://slidepdf.com/reader/full/ssrn-id1013997-global-upward-trend-in-the-profit-share 4/29

8/7/2019 SSRN-id1013997 Global Upward Trend in the profit share
http://slidepdf.com/reader/full/ssrn-id1013997-global-upward-trend-in-the-profit-share 5/29
The global upward trend in the profit share v
Contents
Abstract................................................................................................................................. ...iii
1. Introduction......................................................................................................................1
2. Are profits genuinely high?..............................................................................................2
3. Possible causes of high profit shares..............................................................................4
3.1 Technological developments..................................................................................4
3.2. Additional factors....................................................................................................9
Expansion in the global (low-wage) labour supply ...............................................10
Exogenous shifts in bargaining power .................................................................10
Relative price changes.........................................................................................12
Shorter-run macroeconomic factors.....................................................................13
4. Econometric results.......................................................................................................14
5. Implications of the model for future developments in factor shares ..............................16
6. Conclusion.....................................................................................................................18
Appendix.................................................................................................................................19
A. Data corrections and sources ..............................................................................19
References .............................................................................................................................21

8/7/2019 SSRN-id1013997 Global Upward Trend in the profit share
http://slidepdf.com/reader/full/ssrn-id1013997-global-upward-trend-in-the-profit-share 6/29
8/7/2019 SSRN-id1013997 Global Upward Trend in the profit share
http://slidepdf.com/reader/full/ssrn-id1013997-global-upward-trend-in-the-profit-share 7/29
The global upward trend in the profit share 1
The global upward trend in the profit share1
Luci Ellis and Kathryn Smith2
1. Introduction
Strong profit growth has been observed across a range of developed economies in recentyears, and it is perceived that the share of factor income going to profits – the return oncapital – is particularly high.3 It is not immediately clear if this might be the result of a changein fundamentals in the goods market, or a sign of some underlying inefficiency, with firmsbeing able to extract increasing economic rents. Such shifts in factor shares could haveimportant macroeconomic implications. For example, future investment might be stronger, if
firms seek to take advantage of currently high returns on capital. A reversal of the factorshare trends through higher wage growth could be interpreted as adding to inflationpressures, rightly or wrongly. On the other hand, if the rising profit share was the result ofwidening margins, this could also add to inflation pressures.
This paper presents data that suggest that the profit share is unusually high at present (andthe wage share unusually low). In fact, the extent and cross-country scope of this outcomehas no precedent over the past 45 years. This has not simply been driven by recent strongglobal growth. Rather, it appears to be the result of a two-decade upward trend commonacross a number of countries. We test one likely explanation, namely the increasing use ofIT-based capital goods, which have faster rates of obsolescence than other kinds of capital.Hornstein, Krusell and Violante (2002, 2003) show that if capital goods installed at different
times embed different technological levels (so-called ‘vintage capital’), faster innovation rateswill increase churn in the labour market as well. Where there are search frictions in thelabour market, this increases firms’ bargaining power over the economic surplus, therebyshifting income in favour of profits. The effect is stronger where firms themselves face lesscompetitive pressure, and where certain kinds of labour market rigidities amplify the effect ofthese changes on equilibrium unemployment rates.
Some of the other factors proposed in the literature seem to be less plausible asexplanations of these trends, because they are not global in scope, or their timing does notmatch the data. Our preferred technology-based explanation has the advantage that it canaccount for cross-country pattern in the data as well as the common timing. Although a directempirical test for this mechanism is not feasible with available data, we show that the trend
persists after controlling for a number of these alternative explanations. This implies that they
1The original version of this paper was written in 2005, while the first author was on a staff exchange visit to theEuropean Central Bank’s External Developments Division. We would like to thank the staff at the ECB for theirhospitality and helpful comments, especially Filippo di Mauro, Marie Diron, Gabe de Bondt, Petra Köhler-Ulbrich and Aidan Meyler. Ana Lima (ECB) provided excellent research assistance. We are also grateful to ourcolleagues, especially Jacqui Dwyer, Andy Filardo and Marion Kohler, for their helpful suggestions. The viewsexpressed in this paper are those of the authors, and do not represent the views of the BIS, the ECB or of anyother current or previous employer. Any remaining errors are the sole responsibil ity of the authors.
2Respectively, Senior Economist, Monetary and Economic Department, Bank for International Settlements, andLondon School of Economics.
3 For example, a non-technical presentation of this fact was published in the Economist , 10 February 2005.
8/7/2019 SSRN-id1013997 Global Upward Trend in the profit share
http://slidepdf.com/reader/full/ssrn-id1013997-global-upward-trend-in-the-profit-share 8/29
2 The global upward trend in the profit share
are unlikely to be the explanation for this particular stylised fact about developments in factorshares, although they may be important influences over shorter time periods or a sub-set ofcountries. The paper concludes with a brief discussion of the implications of this preferredtechnology-based explanation for future developments in factor shares.
2. Are profits genuinely high?
The first question to address is whether the perception of high profitability is supported by thedata. A broad definition of the economy-wide profit share is needed, to avoid being misled bydevelopments specific to a particular sector or to listed companies. National accountsmeasures of profits meet this test, if both corporations and unincorporated businesses areincluded, along with public-sector business enterprises. Otherwise, the data would bedistorted by the shifts in the share of unincorporated business in the economy, and by firmsswitching between the public and private sectors when they are privatised or nationalised.4 The unincorporated business component of profits must also be adjusted to exclude the
fraction representing the labour income of business owners and the self-employed.
5
Theseunincorporated wages can be inferred by assuming a fixed ratio between average wages andthe unobserved average labour income of the self-employed. The wage share can then begrossed up in line with the share of self-employment in total employment, and the profit sharereduced accordingly. This is the approach adopted in the European Commission’s AMECO(Annual Macroeconomic) database used in this paper and by Meyler (2001), and it is fairlyrobust to different assumptions about the relative wage.6 The calculation is shown inEquation (1); UE refers to unincorporated enterprises.
sharewage1taxesindirectnetGDP
wagesincomesurplusoperatingGross shareProfit UEUE
−=
−
−+≡ (1)
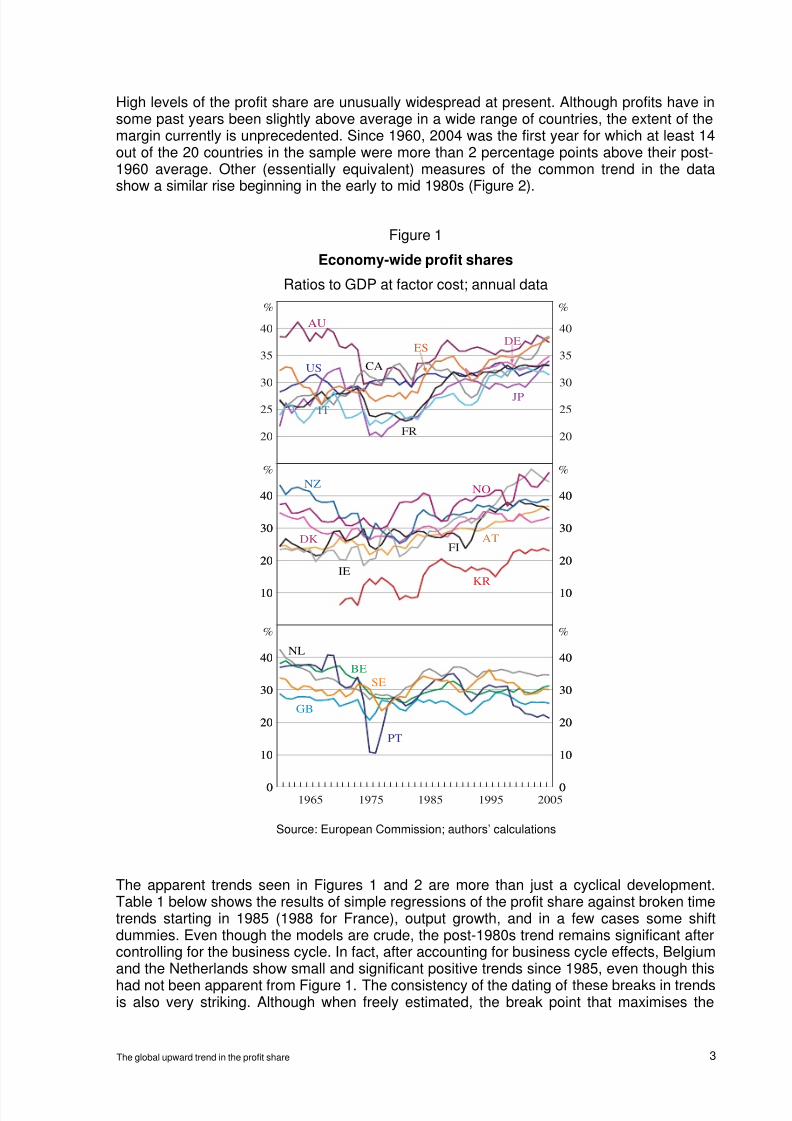
The resulting adjusted profit shares are shown in Figure 1. Profits currently account for a
higher share of value added than in the previous couple of decades in a diverse range ofcountries, including most continental European countries, Japan, Australia, Canada and theUnited States. All of these countries also show higher profit shares in recent years than in the1960s, except for Australia and New Zealand. However, as discussed in Appendix A, thesetwo countries’ data appear distorted, so it cannot be ruled out that the true profit share ishigher than it was in the 1960s in those countries as well. There are only a few countrieswhere the profit share seems to have lacked an upward trend: Belgium, the Netherlands,Portugal, Sweden and the United Kingdom (bottom panel of Figure 1).
4Harvey (2003) and ECB (2004) discuss these measurement issues in more detail. It would also make sense toexclude the surplus attributed to household ownership of dwellings, but these data are not available for allcountries. However, available national data suggest that this component is relatively stable as a share of GDP.Hence not excluding it does not change assessments of whether profits have risen or fallen.
5A decline in the share of self-employment, and thus of unincorporated profits in total income, has been afeature in most developed economies over the past half-century, as agricultural sectors’ shares of output havefallen and, in some cases, tax systems have created incentives for small businesses and large partnerships toincorporate. Incidentally, the investment needs of small business imply that households tend to save more outof business income than labour income. Thus shifts of unincorporated enterprises to the corporate sectorshould reduce the measured household saving ratio, all other things equal.
6An alternative and long-standing rule of thumb involves allocating two-thirds of unincorporated business profitsto wages (Johnson (1954); Krueger (1999); Guscina (2006)). This approach has the disadvantage that itimplicitly assumes a constant capital-labour ratio through time, which may not be realistic if the sector’sindustrial composition is changing or if there is technological progress. See Gollin (2002) for more information.
8/7/2019 SSRN-id1013997 Global Upward Trend in the profit share
http://slidepdf.com/reader/full/ssrn-id1013997-global-upward-trend-in-the-profit-share 9/29
The global upward trend in the profit share 3
High levels of the profit share are unusually widespread at present. Although profits have insome past years been slightly above average in a wide range of countries, the extent of themargin currently is unprecedented. Since 1960, 2004 was the first year for which at least 14out of the 20 countries in the sample were more than 2 percentage points above their post-1960 average. Other (essentially equivalent) measures of the common trend in the datashow a similar rise beginning in the early to mid 1980s (Figure 2).
Figure 1
Economy-wide profit shares
Ratios to GDP at factor cost; annual data
0
10
20
30
40
0
10
20
30
40
0
10
20
30
40
0
10
20
30
40
2005
10
20
30
40
10
20
30
40
10
20
30
40
10
20
30
40
20
25
30
35
40
20
25
30
35
40AU
JP
CA
DE
FR
IT
ES
US
ATDK
IE
NO
FI
KR
NZ
GB
BE
NL
PT
SE
1995198519751965
% %
% %
% %
Source: European Commission; authors’ calculations
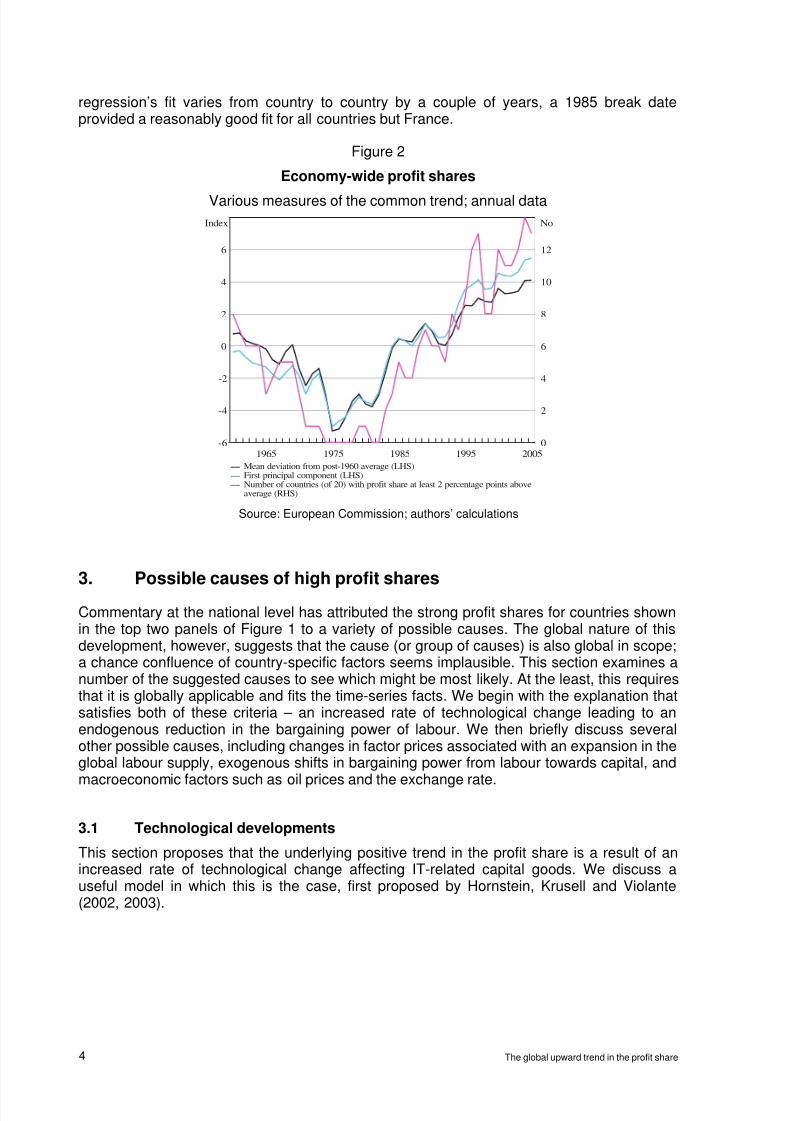
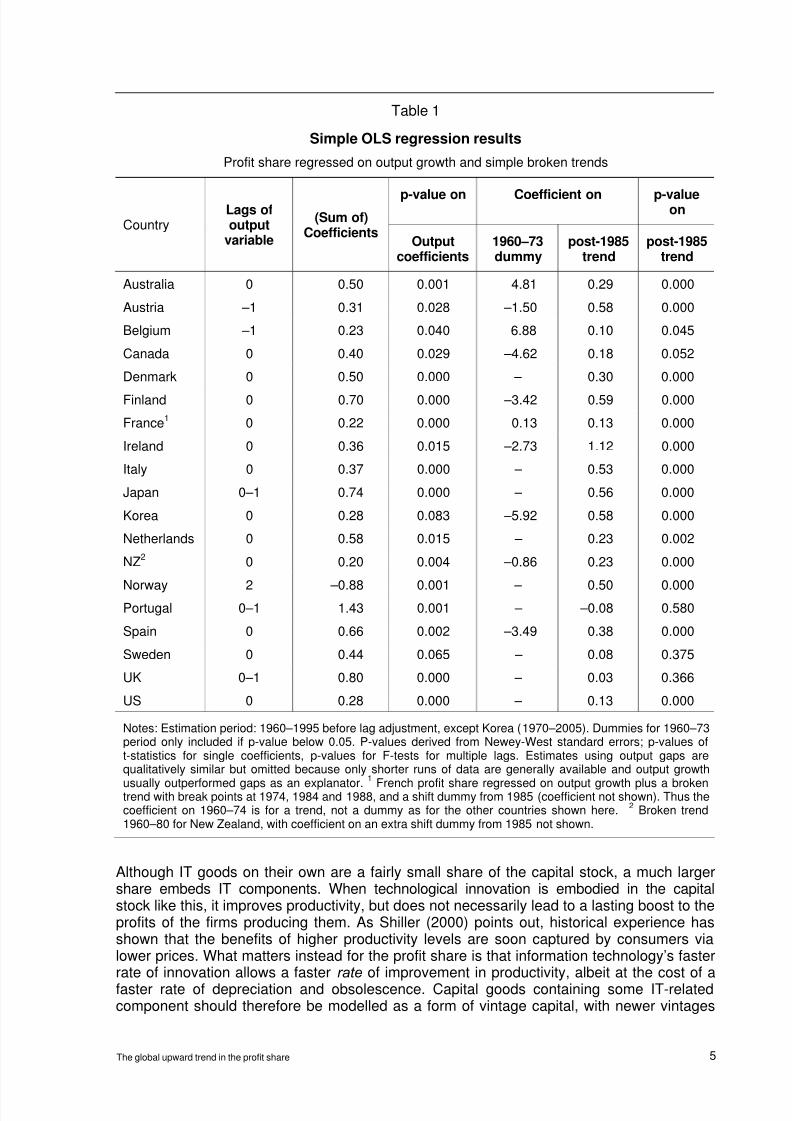
The apparent trends seen in Figures 1 and 2 are more than just a cyclical development.Table 1 below shows the results of simple regressions of the profit share against broken timetrends starting in 1985 (1988 for France), output growth, and in a few cases some shiftdummies. Even though the models are crude, the post-1980s trend remains significant aftercontrolling for the business cycle. In fact, after accounting for business cycle effects, Belgiumand the Netherlands show small and significant positive trends since 1985, even though this
had not been apparent from Figure 1. The consistency of the dating of these breaks in trendsis also very striking. Although when freely estimated, the break point that maximises the
8/7/2019 SSRN-id1013997 Global Upward Trend in the profit share
http://slidepdf.com/reader/full/ssrn-id1013997-global-upward-trend-in-the-profit-share 10/29
4 The global upward trend in the profit share
regression’s fit varies from country to country by a couple of years, a 1985 break dateprovided a reasonably good fit for all countries but France.
Figure 2
Economy-wide profit shares
Various measures of the common trend; annual data
-6
-4
-2
0
2
4
6
0
2
4
6
8
10
12
–– Mean deviation from post-1960 average (LHS)–– First principal component (LHS)–– Number of countries (of 20) with profit share at least 2 percentage points above
average (RHS)
2005
Index No
1995198519751965
Source: European Commission; authors’ calculations
3. Possible causes of high profit shares
Commentary at the national level has attributed the strong profit shares for countries shownin the top two panels of Figure 1 to a variety of possible causes. The global nature of thisdevelopment, however, suggests that the cause (or group of causes) is also global in scope;a chance confluence of country-specific factors seems implausible. This section examines anumber of the suggested causes to see which might be most likely. At the least, this requiresthat it is globally applicable and fits the time-series facts. We begin with the explanation thatsatisfies both of these criteria – an increased rate of technological change leading to anendogenous reduction in the bargaining power of labour. We then briefly discuss severalother possible causes, including changes in factor prices associated with an expansion in theglobal labour supply, exogenous shifts in bargaining power from labour towards capital, and
macroeconomic factors such as oil prices and the exchange rate.
3.1 Technological developments
This section proposes that the underlying positive trend in the profit share is a result of anincreased rate of technological change affecting IT-related capital goods. We discuss auseful model in which this is the case, first proposed by Hornstein, Krusell and Violante(2002, 2003).
8/7/2019 SSRN-id1013997 Global Upward Trend in the profit share
http://slidepdf.com/reader/full/ssrn-id1013997-global-upward-trend-in-the-profit-share 11/29
The global upward trend in the profit share 5
Table 1
Simple OLS regression results
Profit share regressed on output growth and simple broken trends
p-value on Coefficient on p-valueon
CountryLags ofoutput
variable
(Sum of)Coefficients
Outputcoefficients
1960–73dummy
post-1985trend
post-1985trend
Australia 0 0.50 0.001 4.81 0.29 0.000
Austria –1 0.31 0.028 –1.50 0.58 0.000
Belgium –1 0.23 0.040 6.88 0.10 0.045
Canada 0 0.40 0.029 –4.62 0.18 0.052
Denmark 0 0.50 0.000 – 0.30 0.000
Finland 0 0.70 0.000 –3.42 0.59 0.000
France1 0 0.22 0.000 0.13 0.13 0.000
Ireland 0 0.36 0.015 –2.73 1.12 0.000
Italy 0 0.37 0.000 – 0.53 0.000
Japan 0–1 0.74 0.000 – 0.56 0.000
Korea 0 0.28 0.083 –5.92 0.58 0.000
Netherlands 0 0.58 0.015 – 0.23 0.002
NZ2
0 0.20 0.004 –0.86 0.23 0.000
Norway 2 –0.88 0.001 – 0.50 0.000Portugal 0–1 1.43 0.001 – –0.08 0.580
Spain 0 0.66 0.002 –3.49 0.38 0.000
Sweden 0 0.44 0.065 – 0.08 0.375
UK 0–1 0.80 0.000 – 0.03 0.366
US 0 0.28 0.000 – 0.13 0.000
Notes: Estimation period: 1960–1995 before lag adjustment, except Korea (1970–2005). Dummies for 1960–73period only included if p-value below 0.05. P-values derived from Newey-West standard errors; p-values oft-statistics for single coefficients, p-values for F-tests for multiple lags. Estimates using output gaps arequalitatively similar but omitted because only shorter runs of data are generally available and output growth
usually outperformed gaps as an explanator.1
French profit share regressed on output growth plus a brokentrend with break points at 1974, 1984 and 1988, and a shift dummy from 1985 (coefficient not shown). Thus thecoefficient on 1960–74 is for a trend, not a dummy as for the other countries shown here.
2Broken trend
1960–80 for New Zealand, with coefficient on an extra shift dummy from 1985 not shown.
Although IT goods on their own are a fairly small share of the capital stock, a much largershare embeds IT components. When technological innovation is embodied in the capitalstock like this, it improves productivity, but does not necessarily lead to a lasting boost to theprofits of the firms producing them. As Shiller (2000) points out, historical experience hasshown that the benefits of higher productivity levels are soon captured by consumers vialower prices. What matters instead for the profit share is that information technology’s fasterrate of innovation allows a faster rate of improvement in productivity, albeit at the cost of afaster rate of depreciation and obsolescence. Capital goods containing some IT-relatedcomponent should therefore be modelled as a form of vintage capital, with newer vintages

8/7/2019 SSRN-id1013997 Global Upward Trend in the profit share
http://slidepdf.com/reader/full/ssrn-id1013997-global-upward-trend-in-the-profit-share 12/29
6 The global upward trend in the profit share
being qualitatively different from older ones. If they do not optimally combine with otherfactors of production in the same way as older vintages, we have the ‘putty-clay’ specificationof capital of Solow (1962) and many others.7
Hornstein, Krusell and Violante (2002, 2003) show that a faster rate of innovation andobsolescence of putty-clay capital can raise the profit share if there are search frictions in the
labour market. The faster rate of innovation makes new capital goods more attractive to firmsrelative to their existing capital, and so they want to change their capital and productionprocesses more often than before. But with putty-clay capital, this means more frequentchanges in their employment levels to make best use of the new technology. Therefore thereis more employment churn ex ante, which would reduce the rate of matching between firmsand workers. Workers are therefore more likely to lose their jobs and experience a period ofunemployment when they do. This increases firms’ bargaining power endogenously , so theycan reap a larger share of the rents that resulted from these search frictions in the first place.A simplified exposition of the Hornstein et al model follows.
Production takes place by matching machines (capital) with workers; the underlyingproduction function for a single production unit has Leontief form. Unemployed workers and
idle capital are not guaranteed to meet every period. Instead, they are matched togetherusing a standard, constant returns to scale matching function; that is, the rate at whichworkers meet firms is proportional to the ratio of total vacancies to unemployment. (The rateat which firms meet workers is of course inversely proportional to this ratio.) Workers cannotobserve the vintage of capital used by the firm before they are hired, so they cannot directtheir search to the firms using the most productive capital and therefore paying the highestwages. Once matched, the worker and firm bargain bilaterally over the proceeds ofproduction. The employment relation is subject to both a firing tax and a hiring subsidy, ofequal size, while unemployed workers receive a welfare benefit that provides an outside-option floor to wage bargaining outcomes.
Machines are costly to install, with newer more productive machines relatively more so thanolder, more obsolete vintages; the cost of installing new vintages is assumed to grow at rateγ . To compensate for this installation cost (I ), firms retain the machines until they reach someendogenously determined terminal age ( a ), at which point the machine is scrapped and theworker is laid off. At this point, the workers have become too expensive, given the lowproductivity of the older capital they are working with, for it to be worth them staying with thatfirm. Their outside option – unemployment with the possibility of finding a better job after aperiod of search – has become more attractive. Free entry implies that the return to capitalover the life of the machine just offsets this installation cost. Firms and workers also partcompany randomly for other reasons at rate δ .
The end result is a pair of static equilibrium conditions, one describing firms’ decision toscrap machines (and lay off the associated worker), and one describing the arbitragecondition equalising installation costs with machines’ lifetime profits, given free entry. These
‘job destruction’ and ‘job creation’ conditions are defined over two endogenous variables – the lifespan of the machine a and the rate at which firms meet workers λf . Hornstein et al
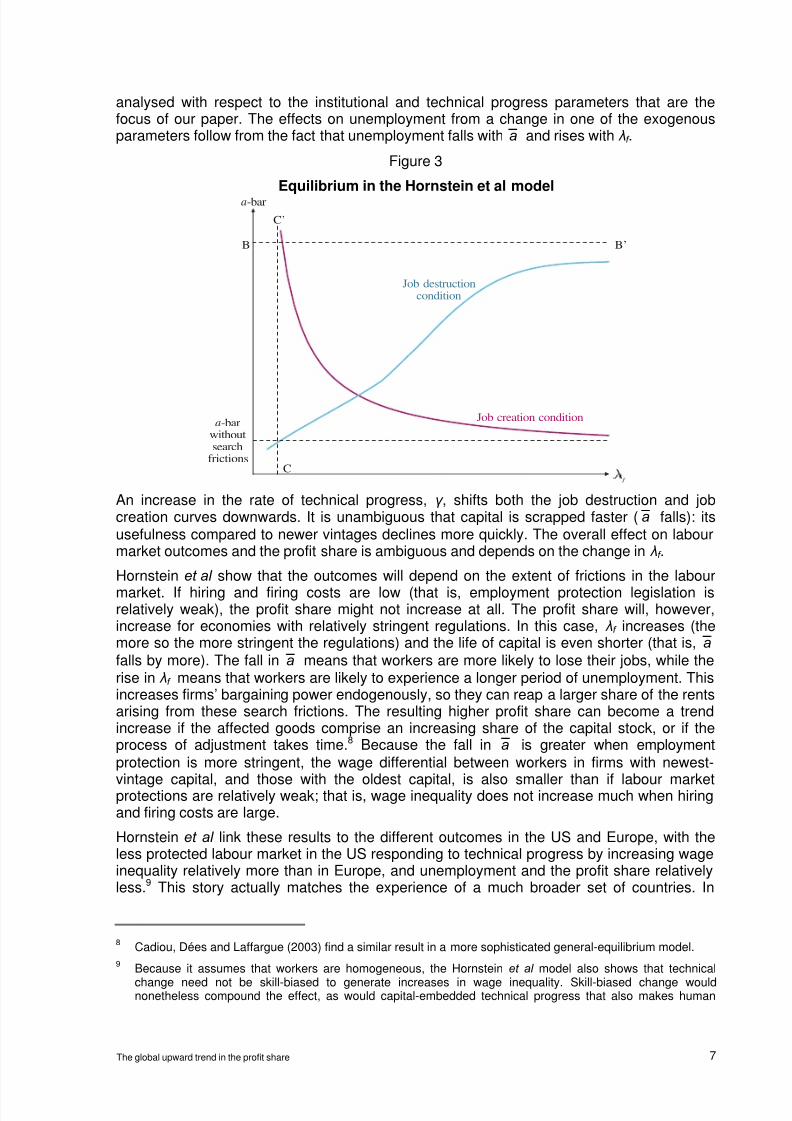
show that these two equilibrium conditions can be represented graphically in ( a , λf ) space,as shown in Figure 3, reproduced from their paper. The equilibrium outcome can be
7Putty-clay (as opposed to putty-putty) models involve multiple types of capital that cannot be compareddirectly; once installed, they can only combine with other productive factors such as labour in fixed proportion.Therefore only the incremental addition to the capital stock can respond to a change in relative factor prices.These models have been in use since at least the 1960s (for example Solow (1962)), and have been labelledas putty-clay since at least the 1970s (for example Gapinski (1973)). Vintage capital models are putty-claymodels where the relevant distinction between different types of capital is the date on which the capital wasinstalled.
8/7/2019 SSRN-id1013997 Global Upward Trend in the profit share
http://slidepdf.com/reader/full/ssrn-id1013997-global-upward-trend-in-the-profit-share 13/29
The global upward trend in the profit share 7
analysed with respect to the institutional and technical progress parameters that are thefocus of our paper. The effects on unemployment from a change in one of the exogenousparameters follow from the fact that unemployment falls with a and rises with λf .
Figure 3
Equilibrium in the Hornstein et al model
Job destructioncondition
Job creation conditiona-bar
withoutsearch
frictionsC
B’
C’
B
a-bar
An increase in the rate of technical progress, γ , shifts both the job destruction and jobcreation curves downwards. It is unambiguous that capital is scrapped faster ( a falls): itsusefulness compared to newer vintages declines more quickly. The overall effect on labourmarket outcomes and the profit share is ambiguous and depends on the change in λf .
Hornstein et al show that the outcomes will depend on the extent of frictions in the labour
market. If hiring and firing costs are low (that is, employment protection legislation isrelatively weak), the profit share might not increase at all. The profit share will, however,increase for economies with relatively stringent regulations. In this case, λf increases (themore so the more stringent the regulations) and the life of capital is even shorter (that is, a falls by more). The fall in a means that workers are more likely to lose their jobs, while therise in λf means that workers are likely to experience a longer period of unemployment. Thisincreases firms’ bargaining power endogenously, so they can reap a larger share of the rentsarising from these search frictions. The resulting higher profit share can become a trendincrease if the affected goods comprise an increasing share of the capital stock, or if theprocess of adjustment takes time.8 Because the fall in a is greater when employmentprotection is more stringent, the wage differential between workers in firms with newest-
vintage capital, and those with the oldest capital, is also smaller than if labour marketprotections are relatively weak; that is, wage inequality does not increase much when hiringand firing costs are large.
Hornstein et al link these results to the different outcomes in the US and Europe, with theless protected labour market in the US responding to technical progress by increasing wageinequality relatively more than in Europe, and unemployment and the profit share relativelyless.9 This story actually matches the experience of a much broader set of countries. In
8Cadiou, Dées and Laffargue (2003) find a similar result in a more sophisticated general-equilibrium model.
9Because it assumes that workers are homogeneous, the Hornstein et al model also shows that technical
change need not be skill-biased to generate increases in wage inequality. Skill-biased change wouldnonetheless compound the effect, as would capital-embedded technical progress that also makes human
8/7/2019 SSRN-id1013997 Global Upward Trend in the profit share
http://slidepdf.com/reader/full/ssrn-id1013997-global-upward-trend-in-the-profit-share 14/29
8 The global upward trend in the profit share
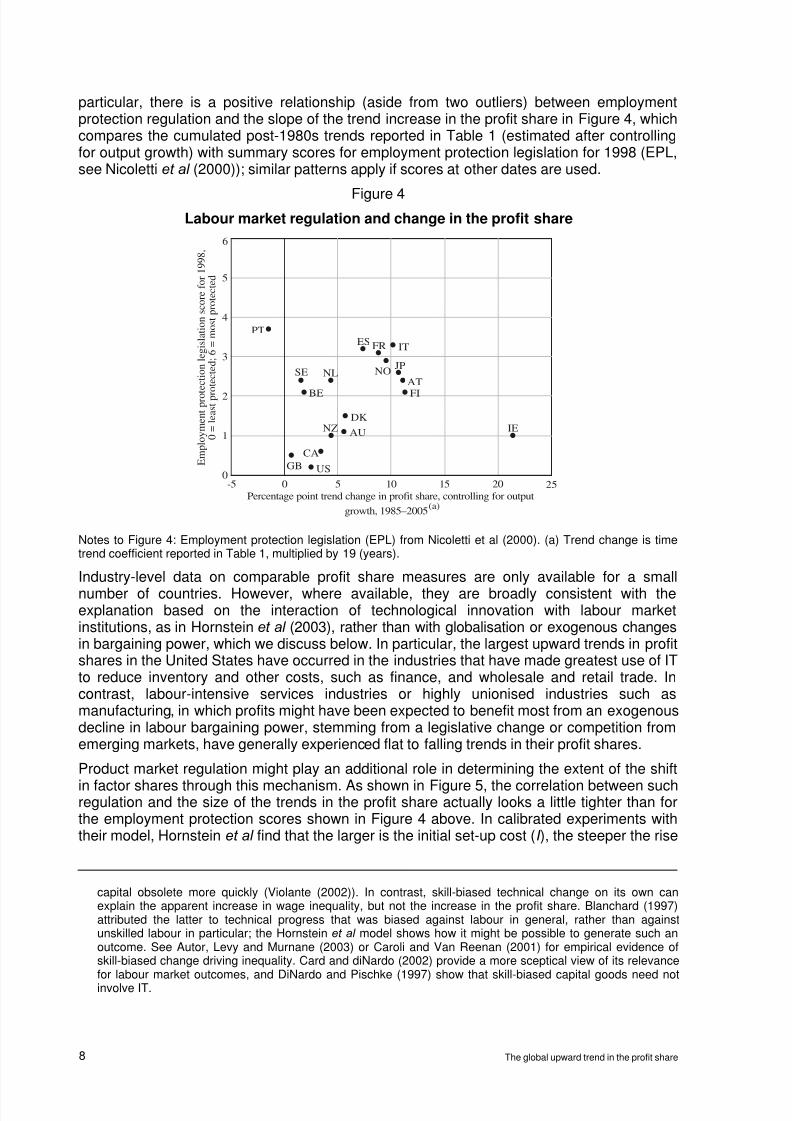
particular, there is a positive relationship (aside from two outliers) between employmentprotection regulation and the slope of the trend increase in the profit share in Figure 4, whichcompares the cumulated post-1980s trends reported in Table 1 (estimated after controllingfor output growth) with summary scores for employment protection legislation for 1998 (EPL,see Nicoletti et al (2000)); similar patterns apply if scores at other dates are used.
Figure 4Labour market regulation and change in the profit share
●
●
●
●●
●
●●
● ●
●
●
●
●●
●
●
●
0
1
2
3
4
5
-5 0 5 10 15 20
E m p l o y m e n t p r o t
e c t i o n l e g i s l a t i o n s c o r e f o r 1 9 9 8 ,
0 = l e a s t p r o t e c t e d ; 6 = m o s t p r o t e c t e d
PT
Percentage point trend change in profit share, controlling for output
growth, 1985–2005(a)
SE
BE
NL
NZ
CA
AU
GB US
DK
FI
AT
JP
ITES FR
NO
IE
25
6
Notes to Figure 4: Employment protection legislation (EPL) from Nicoletti et al (2000). (a) Trend change is timetrend coefficient reported in Table 1, multiplied by 19 (years).
Industry-level data on comparable profit share measures are only available for a small
number of countries. However, where available, they are broadly consistent with theexplanation based on the interaction of technological innovation with labour marketinstitutions, as in Hornstein et al (2003), rather than with globalisation or exogenous changesin bargaining power, which we discuss below. In particular, the largest upward trends in profitshares in the United States have occurred in the industries that have made greatest use of ITto reduce inventory and other costs, such as finance, and wholesale and retail trade. Incontrast, labour-intensive services industries or highly unionised industries such asmanufacturing, in which profits might have been expected to benefit most from an exogenousdecline in labour bargaining power, stemming from a legislative change or competition fromemerging markets, have generally experienced flat to falling trends in their profit shares.
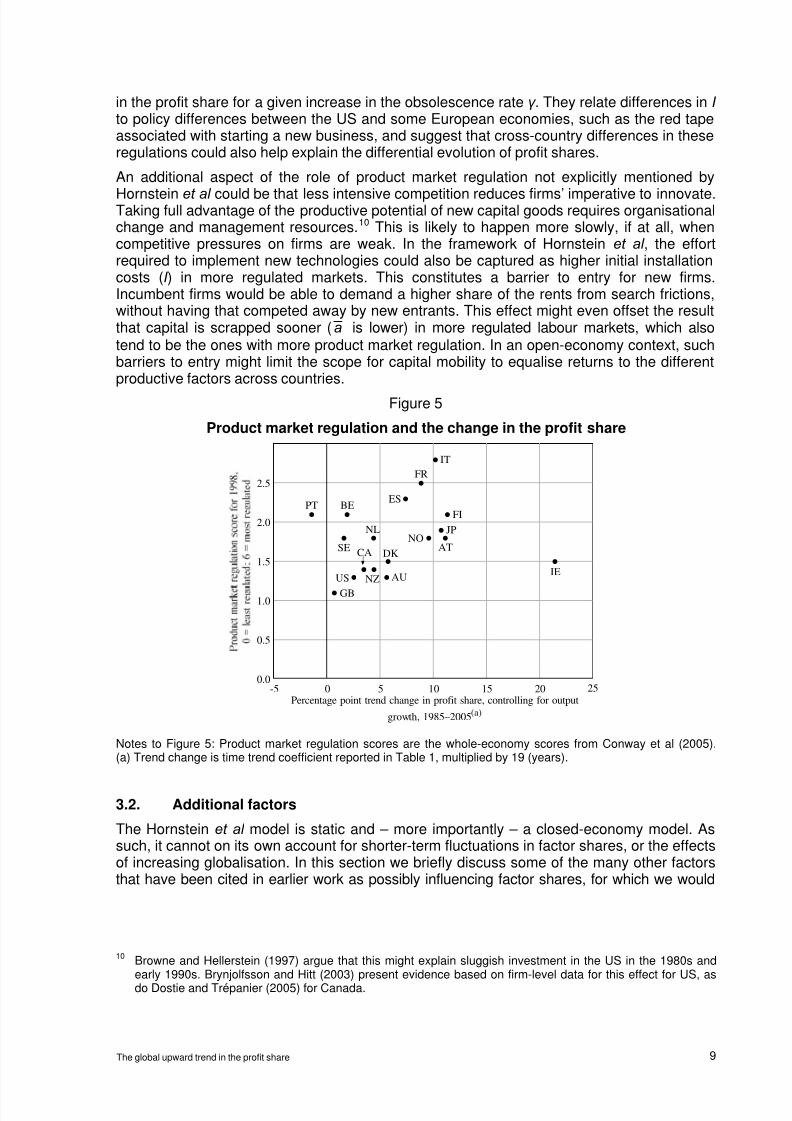
Product market regulation might play an additional role in determining the extent of the shift
in factor shares through this mechanism. As shown in Figure 5, the correlation between suchregulation and the size of the trends in the profit share actually looks a little tighter than forthe employment protection scores shown in Figure 4 above. In calibrated experiments withtheir model, Hornstein et al find that the larger is the initial set-up cost (I ), the steeper the rise
capital obsolete more quickly (Violante (2002)). In contrast, skill-biased technical change on its own canexplain the apparent increase in wage inequality, but not the increase in the profit share. Blanchard (1997)attributed the latter to technical progress that was biased against labour in general, rather than againstunskilled labour in particular; the Hornstein et al model shows how it might be possible to generate such anoutcome. See Autor, Levy and Murnane (2003) or Caroli and Van Reenan (2001) for empirical evidence ofskill-biased change driving inequality. Card and diNardo (2002) provide a more sceptical view of its relevancefor labour market outcomes, and DiNardo and Pischke (1997) show that skill-biased capital goods need notinvolve IT.
8/7/2019 SSRN-id1013997 Global Upward Trend in the profit share
http://slidepdf.com/reader/full/ssrn-id1013997-global-upward-trend-in-the-profit-share 15/29
The global upward trend in the profit share 9
in the profit share for a given increase in the obsolescence rate γ . They relate differences in I to policy differences between the US and some European economies, such as the red tapeassociated with starting a new business, and suggest that cross-country differences in theseregulations could also help explain the differential evolution of profit shares.
An additional aspect of the role of product market regulation not explicitly mentioned by
Hornstein et al could be that less intensive competition reduces firms’ imperative to innovate.Taking full advantage of the productive potential of new capital goods requires organisationalchange and management resources.10 This is likely to happen more slowly, if at all, whencompetitive pressures on firms are weak. In the framework of Hornstein et al , the effortrequired to implement new technologies could also be captured as higher initial installationcosts (I ) in more regulated markets. This constitutes a barrier to entry for new firms.Incumbent firms would be able to demand a higher share of the rents from search frictions,without having that competed away by new entrants. This effect might even offset the resultthat capital is scrapped sooner (a is lower) in more regulated labour markets, which alsotend to be the ones with more product market regulation. In an open-economy context, suchbarriers to entry might limit the scope for capital mobility to equalise returns to the differentproductive factors across countries.
Figure 5
Product market regulation and the change in the profit share
0.0
0.5
1.0
1.5
2.0
2.5
-5 0 5 10 15 20
PT
Percentage point trend change in profit share, controlling for output
growth, 1985–2005(a)
SE
BE
NL
NZ
CA
AU
GB
US
DK
FI
AT
JP
IT
ES
FR
NO
IE
25
Notes to Figure 5: Product market regulation scores are the whole-economy scores from Conway et al (2005).(a) Trend change is time trend coefficient reported in Table 1, multiplied by 19 (years).
3.2. Additional factors
The Hornstein et al model is static and – more importantly – a closed-economy model. Assuch, it cannot on its own account for shorter-term fluctuations in factor shares, or the effectsof increasing globalisation. In this section we briefly discuss some of the many other factorsthat have been cited in earlier work as possibly influencing factor shares, for which we would
10Browne and Hellerstein (1997) argue that this might explain sluggish investment in the US in the 1980s andearly 1990s. Brynjolfsson and Hitt (2003) present evidence based on firm-level data for this effect for US, asdo Dostie and Trépanier (2005) for Canada.
8/7/2019 SSRN-id1013997 Global Upward Trend in the profit share
http://slidepdf.com/reader/full/ssrn-id1013997-global-upward-trend-in-the-profit-share 16/29
10 The global upward trend in the profit share
want to control as part of any empirical test of the implications of the Hornstein et al model.These factors form the basis of the other explanators included in our regression results.
Expansion in the global (low-wage) labour supply
One often-cited possible cause of the moderation in wages and strength in profits has been
the influence of globalisation on trade and production. In particular, the entry of China andEastern Europe into the global market economy has increased the global supply of low-wage, low-skilled labour, without an equivalent stock of capital for this labour to work with(Phelps (2006)). This may reduce the return to labour in already developed economies, atleast until the global capital stock has adjusted to its new equilibrium level. If the fall in therelative price of labour is not fully offset by substitution towards labour, the share of factorincome going to labour would fall. This requires the elasticity of substitution betweenproduction factors to be below 1, which is the conclusion of the empirical literature(Andersen, Klau and Yndgaard (1999)). The effect could be reinforced if workers inindustrialised economies moderate their wage claims for fear that production will berelocated to these emerging centres.
While this is intuitively plausible, there are several ways in which this explanation isinconsistent with the data. First, the entry of these economies into the global market post-dates the start of the uptrend in profit shares in the mid 1980s. Second, it is not clear that thecapital-labour ratio is lower in these nations once the labour inputs are measured inefficiency units.11 Third, if the profit share rose because capital goods had become relativelyscarce compared with labour, the relative price of investment goods should rise, but in fact ithas fallen markedly over this period, as discussed below. A pure global labour-supply effectalso does not explain the cross-country differences in profit share trends, so it cannot be theonly factor at work.
In addition, since the extra global labour supply has mainly affected the manufacturingindustry, this argument implies that the reduction in wages and increase in developed
countries’ profit shares should be concentrated in manufacturing. In fact, the limited industry-level data on profit shares suggests that the reverse is true. In the United States, the profitshare in manufacturing has trended down over this period, while Australian data since 1990suggest a flat trend for this industry.12 The timing and industry patterns are also inconsistentwith firms in developed economies shifting production to new manufacturing centres in Asiaand Eastern Europe to boost profit margins. If this had driven the rise in the profit share, itwould have been concentrated in industries most involved in this offshoring – that is,manufacturing and more recently business services – but the data do not support this.13
Exogenous shifts in bargaining power
Conventional microeconomic models generally predict that factor shares are determined by
the underlying production technology. For example, if production functions take the well-
11
If it is, it is difficult to reconcile this with the tendency for some of these nations to export capital over the pasthalf-decade or so.
12These results are available from the first author on request.
13The practice of offshoring underlines the importance of using economy-wide national accounts measures ofprofits rather than focusing on listed companies or particular firms. If production is sent offshore, both thelabour and profit components of value added should cross borders. This would have no implications for thedomestic profit share, unless the firms involved were previously less profitable than average. Companies withforeign operations would still report their profits to the share market on a whole-of-business basis, but therepatriated income is a net income flow affecting the current account balance, which is excluded from nationalaccounts measures of profits.
8/7/2019 SSRN-id1013997 Global Upward Trend in the profit share
http://slidepdf.com/reader/full/ssrn-id1013997-global-upward-trend-in-the-profit-share 17/29
The global upward trend in the profit share 11
known Cobb-Douglas form, profit maximisation with perfect competition implies that factorshares are in fixed proportion, regardless of the per-unit rates of return. However, if there aremarket imperfections such as externalities or monopoly power, there may also be somesuper-normal profits (economic rents). Shifts in bargaining power could result in areallocation of these rents between the production factors. The Hornstein et al modeldiscussed in section 3.1 is an example of a redistribution of the economic surpluses arisingfrom search frictions, in that case brought about by faster technological change. Here wediscuss two more possible causes of shifts in bargaining power: changes in labour marketinstitutions, and policy changes that increase the attractiveness of income from capitalrelative to labour income.
The relative bargaining power of capital over labour is directly affected by the institutionsgoverning the employer–employee relationship. Changes in these could have reduced therelative bargaining power of labour and induced lower wage outcomes than would haveotherwise have occurred. Giammarioli et al (2002) suggest that the decline in the labourshare (increase in the profit share) in continental Europe since the mid 1980s has been aresult of labour market deregulation and decline in union membership; growth in labour costshas been particularly restrained in the larger euro area economies in recent years. However,
this story is difficult to reconcile with the smaller or absent declines in labour share incountries such as Australia and the UK, which experienced more extensive labour marketderegulation over this period (Nicoletti, Scarpetta and Boylaud (2000)). The data in countriesthat have deregulated most are also inconsistent with Giammarioli et al ’s alternativescenario, of an initial fall in the labour share being reversed once firms respond to theincreased attractiveness of labour by increasing employment.
In a similar vein, Caballero and Hammour (1998) argue that a wage push by organisedlabour can lead firms to respond by substituting labour with capital. This is intuitivelyplausible, and the putty-clay specification for capital in their model could explain why theincrease in the profit share is not competed away. Although their results do a reasonable jobof matching the experience of their country of interest, France, it does less well in explaining
global trends. Profit shares have risen the most where such wage pushes did not occur at all,such as Austria, Finland and Norway. In fact, Figure 1 above shows that in some countrieswhere profits spiked down in the 1970s in the face of wage pushes, such as Australia or theUK, the subsequent upswings in the profit share were fairly small or even absent.
It turns out that the correlation between regulation of the labour market and the trend in theprofit share works the other way. This can be seen from Figure 4 above, or from looking atthe change in the regulation measure shown there. Notwithstanding a couple of obviousoutliers, it appears that more regulated labour markets are associated with stronger upwardtrends in the profit share. This is not consistent with the predictions of Cabellero andHammour (1998) or Giammarioli et al (2002). It might be that lack of flexibility in the labourmarket allows firms to capture part of the available rents.
Suppose for a moment that labour market deregulation had in fact allowed firms to capture agreater share of factor income, why were such enhanced profit margins not competed awayover the medium term (which surely includes the two-decade period examined here)? Onereason might be that countries which experienced the largest increase in profit shares alsohad relatively stringent product market regulations (Figure 5), which enabled margins toremain high. In fact, the relationship between the OECD’s measure of overall product marketregulation and the estimated profit share trend is stronger and more visually obvious than theone shown in Figure 4 for labour market regulation.
Bargaining outcomes could also be affected by policy changes affecting taxation or financialregulation that increase the attractiveness of income from capital relative to labour income.
8/7/2019 SSRN-id1013997 Global Upward Trend in the profit share
http://slidepdf.com/reader/full/ssrn-id1013997-global-upward-trend-in-the-profit-share 18/29
12 The global upward trend in the profit share
While rising income inequality and a higher profit share need not go hand in hand, theseredistributive policies could potentially raise both.14 Income inequality would rise becausecapital income disproportionately goes to higher income earners. And by raising the relativepayoff to firms from bargaining effort, the policy changes might encourage re-allocation ofincome to profits. Higher relative CEO compensation might also indirectly boost themeasured profit share.15
These redistributive policies may have been relevant for some countries at particular times,such as in the US in recent years. However, it seems unlikely that they could be the maincause of a global trend in the profit share. Not all countries have experienced the sameincreases in income inequality and relative CEO compensation as has been observed in theUS (Abowd and Bognanno (1995); Murphy (1999)), and those that did may not have allstarted to do so in the mid 1980s. Also, to the extent that the redistribution takes place viachanges to the tax system, changes in redistributive policies in favour of profits are morelikely to affect post-tax profits, rather than the pre-tax measure studied here.
Relative price changes
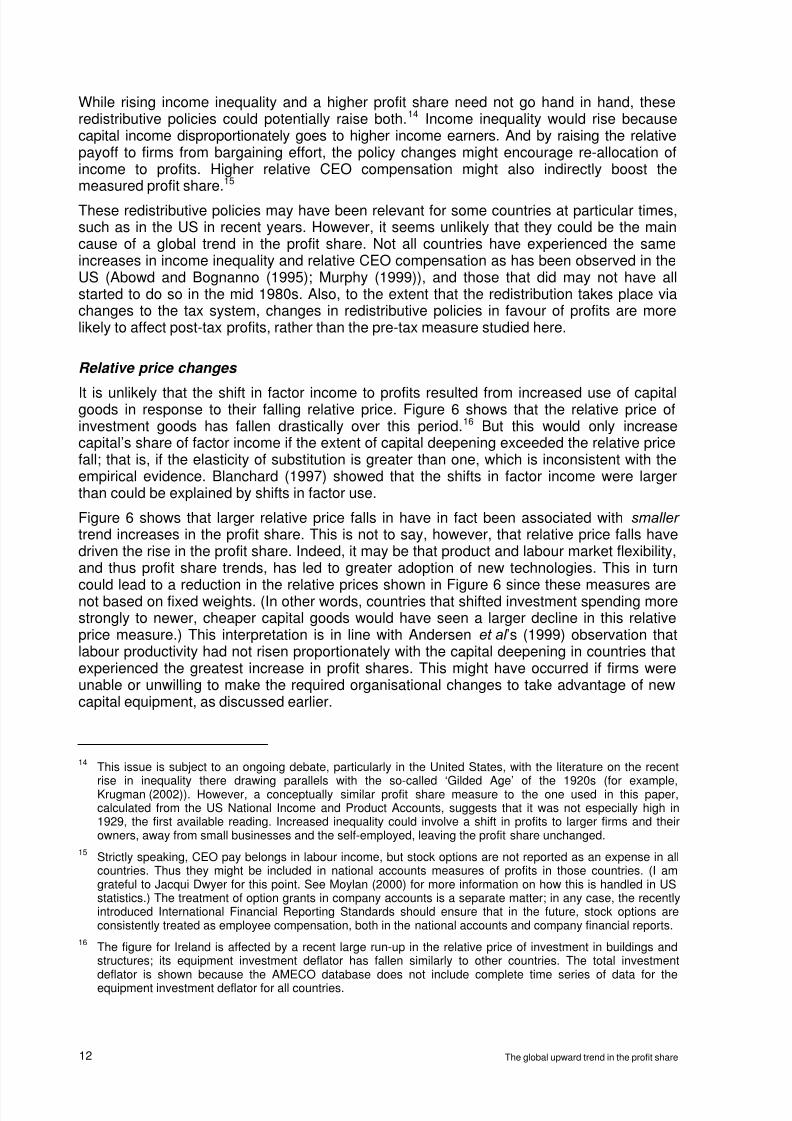
It is unlikely that the shift in factor income to profits resulted from increased use of capitalgoods in response to their falling relative price. Figure 6 shows that the relative price ofinvestment goods has fallen drastically over this period.16 But this would only increasecapital’s share of factor income if the extent of capital deepening exceeded the relative pricefall; that is, if the elasticity of substitution is greater than one, which is inconsistent with theempirical evidence. Blanchard (1997) showed that the shifts in factor income were largerthan could be explained by shifts in factor use.
Figure 6 shows that larger relative price falls in have in fact been associated with smaller trend increases in the profit share. This is not to say, however, that relative price falls havedriven the rise in the profit share. Indeed, it may be that product and labour market flexibility,and thus profit share trends, has led to greater adoption of new technologies. This in turn
could lead to a reduction in the relative prices shown in Figure 6 since these measures arenot based on fixed weights. (In other words, countries that shifted investment spending morestrongly to newer, cheaper capital goods would have seen a larger decline in this relativeprice measure.) This interpretation is in line with Andersen et al ’s (1999) observation thatlabour productivity had not risen proportionately with the capital deepening in countries thatexperienced the greatest increase in profit shares. This might have occurred if firms wereunable or unwilling to make the required organisational changes to take advantage of newcapital equipment, as discussed earlier.
14This issue is subject to an ongoing debate, particularly in the United States, with the literature on the recent
rise in inequality there drawing parallels with the so-called ‘Gilded Age’ of the 1920s (for example,Krugman (2002)). However, a conceptually similar profit share measure to the one used in this paper,calculated from the US National Income and Product Accounts, suggests that it was not especially high in1929, the first available reading. Increased inequality could involve a shift in profits to larger firms and theirowners, away from small businesses and the self-employed, leaving the profit share unchanged.
15Strictly speaking, CEO pay belongs in labour income, but stock options are not reported as an expense in allcountries. Thus they might be included in national accounts measures of profits in those countries. (I amgrateful to Jacqui Dwyer for this point. See Moylan (2000) for more information on how this is handled in USstatistics.) The treatment of option grants in company accounts is a separate matter; in any case, the recentlyintroduced International Financial Reporting Standards should ensure that in the future, stock options areconsistently treated as employee compensation, both in the national accounts and company financial reports.
16The figure for Ireland is affected by a recent large run-up in the relative price of investment in buildings andstructures; its equipment investment deflator has fallen similarly to other countries. The total investmentdeflator is shown because the AMECO database does not include complete time series of data for theequipment investment deflator for all countries.
8/7/2019 SSRN-id1013997 Global Upward Trend in the profit share
http://slidepdf.com/reader/full/ssrn-id1013997-global-upward-trend-in-the-profit-share 19/29
The global upward trend in the profit share 13
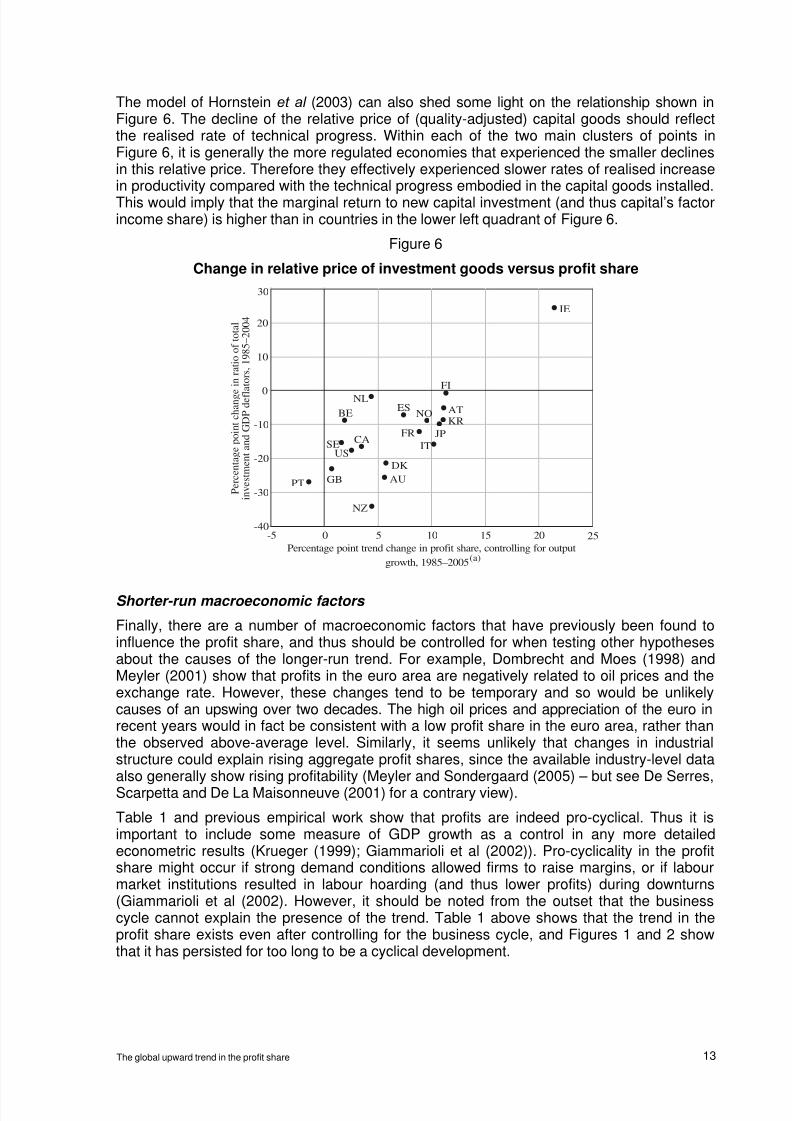
The model of Hornstein et al (2003) can also shed some light on the relationship shown inFigure 6. The decline of the relative price of (quality-adjusted) capital goods should reflectthe realised rate of technical progress. Within each of the two main clusters of points inFigure 6, it is generally the more regulated economies that experienced the smaller declinesin this relative price. Therefore they effectively experienced slower rates of realised increasein productivity compared with the technical progress embodied in the capital goods installed.This would imply that the marginal return to new capital investment (and thus capital’s factorincome share) is higher than in countries in the lower left quadrant of Figure 6.
Figure 6
Change in relative price of investment goods versus profit share
●
●
●
●
●
●
●
●
●
●
●
●
●
●
●
●
●
●
●
-40
-30
-20
-10
0
10
20
-5 0 5 10 15 20
P e r c e n t a g e p o i n t c h a n g e
i n r a t i o o f t o t a l
i n v e s t m e n t a n d G D P d e f l a t o r s , 1 9 8 5 – 2 0 0 4
PT
Percentage point trend change in profit share, controlling for output
growth, 1985–2005(a)
SE
BE
NL
NZ
CA
AUGB
US
DK
FI
AT
JP
IT
ES
FR
NO
IE
25
KR
30
Shorter-run macroeconomic factors
Finally, there are a number of macroeconomic factors that have previously been found toinfluence the profit share, and thus should be controlled for when testing other hypothesesabout the causes of the longer-run trend. For example, Dombrecht and Moes (1998) andMeyler (2001) show that profits in the euro area are negatively related to oil prices and theexchange rate. However, these changes tend to be temporary and so would be unlikelycauses of an upswing over two decades. The high oil prices and appreciation of the euro inrecent years would in fact be consistent with a low profit share in the euro area, rather thanthe observed above-average level. Similarly, it seems unlikely that changes in industrialstructure could explain rising aggregate profit shares, since the available industry-level dataalso generally show rising profitability (Meyler and Sondergaard (2005) – but see De Serres,Scarpetta and De La Maisonneuve (2001) for a contrary view).
Table 1 and previous empirical work show that profits are indeed pro-cyclical. Thus it isimportant to include some measure of GDP growth as a control in any more detailedeconometric results (Krueger (1999); Giammarioli et al (2002)). Pro-cyclicality in the profitshare might occur if strong demand conditions allowed firms to raise margins, or if labourmarket institutions resulted in labour hoarding (and thus lower profits) during downturns(Giammarioli et al (2002). However, it should be noted from the outset that the businesscycle cannot explain the presence of the trend. Table 1 above shows that the trend in theprofit share exists even after controlling for the business cycle, and Figures 1 and 2 showthat it has persisted for too long to be a cyclical development.

8/7/2019 SSRN-id1013997 Global Upward Trend in the profit share
http://slidepdf.com/reader/full/ssrn-id1013997-global-upward-trend-in-the-profit-share 20/29
14 The global upward trend in the profit share
4. Econometric results
We examine various panel-data regressions which control for, among other things, thefollowing explanators: GDP growth; oil prices; exchange rates; and the level of the regulationmeasures through time.17 We also include a measure of the share of exports from the newlyemerging manufacturing economies in total world exports, using IMF data. We believe thatthis is a better proxy for the effects of globalisation on world labour supply, than theopenness to trade of the various existing industrialised countries, as used by Guscina (2006).It is the entry of these countries to the global trading system (along with the threat ofoutsourcing to them) that is supposed to be reducing the wage share, rather than anintensification of trade amongst countries with similar income levels. In the results below, weshow coefficients for the total export share of key emerging markets – China, India and nineof the formerly communist countries in Eastern Europe that have since joined the EU. Theresulting series is essentially flat until the late 1990s and rises exponentially thereafter. Thisis driven by China’s exports: coefficients for other variables are not affected if the exportseries used only covers China, or China plus either India or Eastern Europe but not both.
Data series proxying for our main candidate explanation, the rate of technological progress,
are unfortunately not available. The data series that do attempt to capture the effects oftechnological progress on the capital stock relate to the realised rate of progress, which isendogenous, and are generally also narrowly focussed on IT goods. Our contention is thatthe range of capital goods affected by this change is much larger than those typicallyidentified as information technology. Therefore instead of measuring this phenomenondirectly, we pursue a more indirect method of including a linear trend starting in the mid-1980s, as was the case in the regressions reported in Table 1. If one of the other factorsincluded in the regression were the true cause of the upward trend in the profit share overthis period, it would knock out the simple linear trend. If instead the trend stays significantwhen these other variables are included, they cannot be the cause of the trend. Thisapproach cannot on its own prove the link to technological progress. However, theelimination of other candidate explanations, together with the ability of the Hornstein et al model to match the cross-country pattern and other developments in the labour market,should be seen as at least indicative.
The trade share and regulation variables are all very smooth but with trends that emerge atvarious start dates. Introducing so many trending variables to explain another trend is fraughtwith collinearity problems. In country-by-country regressions on annual data, it would be hardto know if the results are not spurious. Some sort of pooling across countries is thereforenecessary, but a standard panel regression is not strictly appropriate. As would be expectedfrom the variation in trends and other coefficients shown in Table 1, the individual countryresponses are very heterogeneous. Tests for coefficient homogeneity across countries failcomprehensively for every coefficient in every model we tried. For this reason, the panelresults in Table 2 should be interpreted as the averages of a set of heterogeneous individual-
country responses, rather than a common coefficient as is normal in panel models.
The first column (a) of Table 2 shows that the positive trend in the profit share since 1985 isstill significant after controlling for the business cycle, the real effective exchange rate, oilprices, and the extent of product and labour market regulations. The exchange rate is laggedto avoid endogeneity, but using the contemporaneous value does not alter the results. Ourproxy for globalisation, the emerging-economy share of world exports, looks a lot like a trendstarting in the late 1990s. Thus it should not be expected to be able to explain a trend in theprofit share starting in the 1980s. Indeed, column (b) shows that the time trend remains
17We use Blanchard and Wolfers’ (1999) method to backcast the EPL scores. See the Appendix for moredetails. New Zealand is excluded from the estimation because of a lack of the necessary data.
8/7/2019 SSRN-id1013997 Global Upward Trend in the profit share
http://slidepdf.com/reader/full/ssrn-id1013997-global-upward-trend-in-the-profit-share 21/29
The global upward trend in the profit share 15
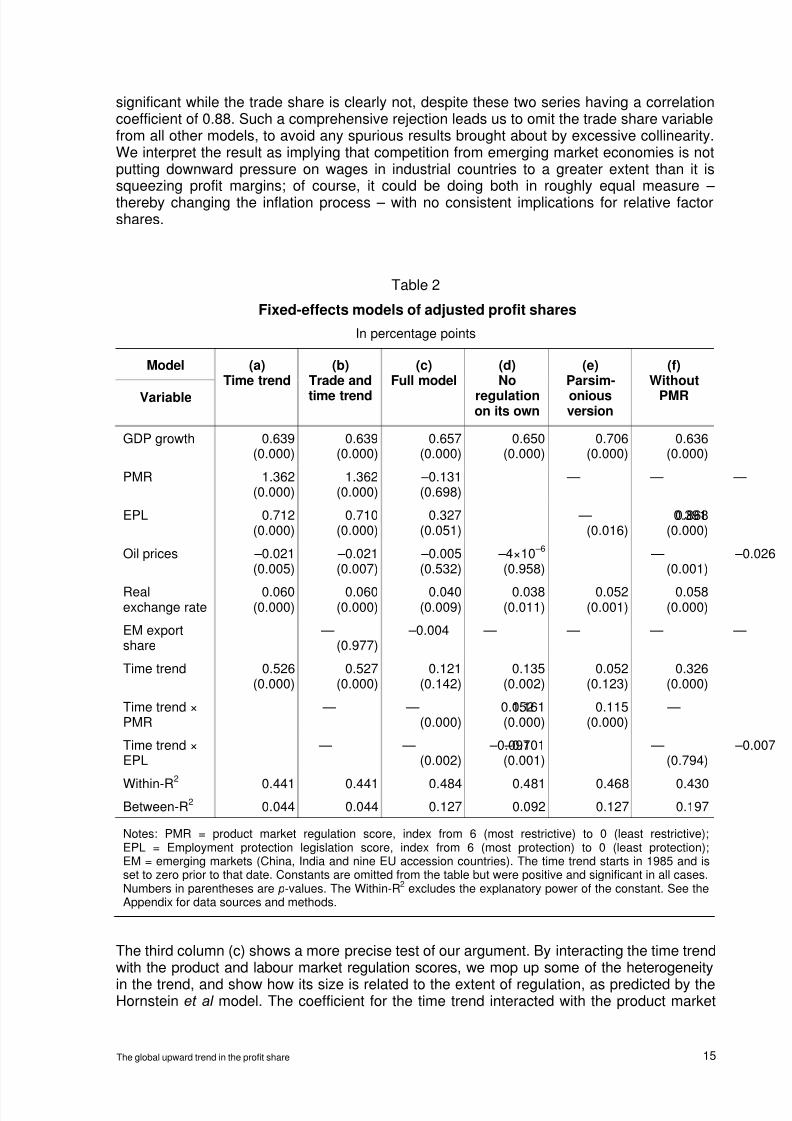
significant while the trade share is clearly not, despite these two series having a correlationcoefficient of 0.88. Such a comprehensive rejection leads us to omit the trade share variablefrom all other models, to avoid any spurious results brought about by excessive collinearity.We interpret the result as implying that competition from emerging market economies is notputting downward pressure on wages in industrial countries to a greater extent than it issqueezing profit margins; of course, it could be doing both in roughly equal measure – thereby changing the inflation process – with no consistent implications for relative factorshares.
Table 2
Fixed-effects models of adjusted profit shares
In percentage points
Model
Variable
(a)Time trend
(b)Trade and
time trend
(c)Full model
(d)No
regulationon its own
(e)Parsim-
oniousversion
(f)Without
PMR
GDP growth 0.639(0.000)
0.639(0.000)
0.657(0.000)
0.650(0.000)
0.706(0.000)
0.636(0.000)
PMR 1.362(0.000)
1.362(0.000)
–0.131(0.698)
— — —
EPL 0.712(0.000)
0.710(0.000)
0.327(0.051)
— 0.391(0.016)
0.868(0.000)
Oil prices –0.021(0.005)
–0.021(0.007)
–0.005(0.532)
–4×10 –6
(0.958) — –0.026
(0.001)
Realexchange rate
0.060(0.000)
0.060(0.000)
0.040(0.009)
0.038(0.011)
0.052(0.001)
0.058(0.000)
EM exportshare
— –0.004(0.977)
— — — —
Time trend 0.526(0.000)
0.527(0.000)
0.121(0.142)
0.135(0.002)
0.052(0.123)
0.326(0.000)
Time trend ×PMR
— — 0.152(0.000)
0.161(0.000)
0.115(0.000)
—
Time trend ×EPL
— — –0.097(0.002)
–0.101(0.001)
— –0.007(0.794)
Within-R2
0.441 0.441 0.484 0.481 0.468 0.430Between-R2 0.044 0.044 0.127 0.092 0.127 0.197
Notes: PMR = product market regulation score, index from 6 (most restrictive) to 0 (least restrictive);EPL = Employment protection legislation score, index from 6 (most protection) to 0 (least protection);EM = emerging markets (China, India and nine EU accession countries). The time trend starts in 1985 and isset to zero prior to that date. Constants are omitted from the table but were positive and significant in all cases.Numbers in parentheses are p-values. The Within-R
2excludes the explanatory power of the constant. See the
Appendix for data sources and methods.
The third column (c) shows a more precise test of our argument. By interacting the time trendwith the product and labour market regulation scores, we mop up some of the heterogeneity
in the trend, and show how its size is related to the extent of regulation, as predicted by theHornstein et al model. The coefficient for the time trend interacted with the product market

8/7/2019 SSRN-id1013997 Global Upward Trend in the profit share
http://slidepdf.com/reader/full/ssrn-id1013997-global-upward-trend-in-the-profit-share 22/29
16 The global upward trend in the profit share
regulation score is positive and significant, as would be expected given Figure 5 and thediscussion above. The simple time trend is positive but insignificant, while the trendinteracted with the labour market regulation score is negative. Because the regulation scoresare defined to range between 0 and 6, these terms taken together imply positive net trendsfor most of the countries; the time trend on its own is just capturing the trend that would occurif both regulation scores had the minimum value of zero. This is consistent with the patternshown in Figure 5, and the theoretical results of Hornstein et al . The higher between-R2 andthe pattern of residuals suggest that this specification is indeed accounting for some of thesample’s heterogeneity. Incidentally, including these interacted terms makes the coefficienton oil prices insignificant.
We do not interpret the negative coefficient on the labour market regulation (EPL) interactionterm as a rejection of the overall validity of an explanation of the trends in factor sharesbased on the model of Hornstein et al , although it does suggest that the product marketregulation part of the story is the more important. The level of this variable has a significant,positive coefficient, although it is lower than when the interaction terms are not included.Given that regulation scores fell for most countries in the sample, it could be that theeconometric procedure is having difficulty distinguishing between so many smooth, trending
variables. Although the scores have been interpreted as cardinal not ordinal (OECD 2004),the effects of hiring and firing costs described in the model might not be proportional to thescores. Taken literally, these results imply that firms might actually gain when greatersecurity of tenure is provided to employees, perhaps from more moderate wage demands.
Columns (d)–(f) in Table 2 underline the robustness of the estimated positive trend for theeconomies with more regulated product markets, as shown in Figure 5. Omitting differentcombinations of regulation scores and their interacted counterparts does not change theresult of positive net time trends in profit shares, at least where there are some frictions in theproduct market, as captured by the regulation variables.
The overall message from these results is consistent with our hypothesis as summarised byFigures 4 and 5: many variables influence factor income shares of particular countries at
particular times, but even controlling for these, there is on average an upward trend in theprofit share since the mid 1980s, which seems to have been stronger where market frictionsare greater. This is broadly in line with the Hornstein et al model in the presence of technicalprogress which has increased the rate of obsolescence of capital goods. The resulting higherex ante rate of churn in employment has endogenously strengthened firms’ bargainingpower, especially where they themselves face less competitive pressure because of productmarket regulations, which limit competitive pressures. Over time, they have therefore beenable to increase their share of the production surplus. This increase might be larger than theamount required to fund the higher rate of gross investment that is required to keep thecapital–labour ratio constant in the face of a higher effective depreciation rate.
A final point from the results of all these models is that, although the positive time trend
survives after controlling for the business cycle, the latter is very important over the shorterterm. The current interest in factor shares has largely been sparked by the latest upswing,which has a substantial cyclical component. The fact remains, though, that there is a longer-term rising trend in the profit share.
5. Implications of the model for future developments in factor shares
The empirical work reported above identified a two-decade upward trend in the profit share(and by definition, a downward trend in the wage share), the size of which seems to bepositively related to the degree of regulation in each country. The preferred explanation
advanced in this paper for this is that an increase in the rate of technical progress hasincreased firms’ bargaining power and allowed them to extract more economic rents. The
8/7/2019 SSRN-id1013997 Global Upward Trend in the profit share
http://slidepdf.com/reader/full/ssrn-id1013997-global-upward-trend-in-the-profit-share 23/29
The global upward trend in the profit share 17
Hornstein et al model on which this explanation is based predicts that this increase in therate of obsolescence of the capital stock will lead to a permanent upward level shift in theprofit share. The rising trend actually observed should therefore probably be interpreted as atransition path to this new level. The increased rate of technological innovation underlying thefaster rate of obsolescence reflects the incorporation of a general-purpose technology – information technology – into a wider range of capital goods than those normally consideredas IT products. This should be expected to take some time. At some point, the profit shareshould be expected to stabilise at a new, higher level that depends on the extent of productand labour market regulation. There is no particular reason to assume that the diffusion ofthese faster-depreciating technologies through the capital stock is already complete, so thisstabilisation might be some way off.
The increase and anticipated stabilisation in the profit share go hand-in-hand with anincrease in the overall rate of depreciation of the capital stock. However, it should not beconcluded from this that the profit share will stabilise at a level that enables gross investmentto increase by just enough to keep the net investment rate constant (even assuming thatdepreciation and thus net profits and investment were correctly measured in the nationalaccounts).18 The increase in the profit share is a pure reallocation of economic rents, if our
explanation is correct, not compensation for extra depreciation. Indeed, gross investment hasbeen relatively weak relative to profits in a number of countries in recent years. Thissuggests that the increase in the profit share was not a necessary shift to fund extra grossinvestment.
If current trends continue, the profit share should be expected to stabilise eventually. Thereare, however, several factors suggested by the model that could drive a future reversal of thecurrent upward trend, perhaps back to levels below those seen at present. The first of thesewould be a reversal of the increase in the rate of technological innovation. Although capitalgoods with some IT component have to date become obsolete faster than their purelymechanical predecessors, this need not be true forever. Second, since the ultimate level ofthe profit share depends on the degree of product and labour market regulation, future
changes in these could alter a country’s long-run stable factor shares, even reversing thecurrent trend. In particular, further deregulation of labour and especially product marketscould reduce the relatively larger trends seen in parts of continental Europe and Japan.Reforms that reduce the barriers to entry for new firms (I in the Hornstein et al model) or theunderlying search frictions in the labour market might be particularly effective in shifting thesetrends.
Finally, in the shorter term, the cyclical nature of the profit share implies that amacroeconomic downturn would lead to a reasonably large, if temporary, fall in the profitshare. Although the underlying upward trend might still persist through such a downswing, itmight be difficult to discern for a period, given the size of the cyclical effect identified in ourempirical results. The direction of this cyclical relationship implies that such a fall in the profit
share, and counterpart increase in the wage share, should not be interpreted as necessarilybeing inflationary.
18Although ideally, net profits and investment would capture the effect of increased technical progress, qualitychange and depreciation are both inferred using a variety of assumptions, which might not keep up with theresulting changes in the rate of obsolescence. For example, Browne and Hellerstein (1997) present anexample of the very different inferences that could be made depending on the technical assumptions aboutdepreciation adopted by statistical agencies. Similarly, Whelan (2000) shows that different assessments of therole of IT in productivity growth are implied by different methodologies for estimating the computer capitalstock. Tevlin and Whelan (2000) argue that this increased rate of depreciation explains the US investmentboom of the 1990s, which was largely restricted to IT-related equipment.

8/7/2019 SSRN-id1013997 Global Upward Trend in the profit share
http://slidepdf.com/reader/full/ssrn-id1013997-global-upward-trend-in-the-profit-share 24/29
18 The global upward trend in the profit share
6. Conclusion
In this paper, we have presented both graphical and econometric evidence of one particularstylised fact describing factor income shares in industrialised countries – an upward trend inthe profit share that started in the mid-1980s, or equivalently a downward trend in the wageshare. This trend is clearly apparent even after controlling for a number of factors that mightpreviously have been thought to have been its cause, including the business cycle, labourmarket deregulation, and the entry of China and other emerging market economies into theglobal trading system.
The combination of this trend’s timing and its cross-country pattern is consistent with atechnological cause: faster innovation increasing the rate of obsolescence in capital goodsand the ex ante rate of churn in the labour market. This greater churn strengthens firms’bargaining positions and allows them to capture a larger share of factor income. Theincrease is therefore in essence a reallocation of economic rents – a new equilibrium, but notnecessarily an optimum. It could easily be above or below that necessary to offset the fasterrate of economic depreciation, while maintaining a constant level of the effective capital-labour ratio.
Ideally, we would want to show that this trend can be explained by some measure of the useof faster-depreciating technologies in capital goods, or the depreciation rates themselves.Unfortunately all the standard measures in this field, such as those from the OECD, relate toinformation technology and communications goods specifically. Thus they do not adequatelycapture the fact that IT components are increasingly being embedded in a broader class ofcapital goods that would not be thought of as IT products, and thereby increasing their rate ofobsolescence as well. Nonetheless, the common timing of the trend, its cross-countrypattern, and its correlation with other stylised facts about the labour market are all consistentwith the Hornstein et al model – particularly as it relates to product market regulation – beingthe most likely explanation of the trend, out of all the possibilities considered here. The cross-country pattern in the magnitudes of these trends has not been well explained in the
literature before.
This technological explanation implies that the recent upswing is not part of a cycle. It is notinherently likely to reverse, nor was itself the necessary reversal of an earlier – perhapsunsustainable – shift up in the labour share brought about by a change in workers’bargaining power. Indeed, if our preferred explanation is correct, then the observed shifts infactor shares were simply a redistribution of existing economic rents, which could continuefor some time before stabilising, only reversing if the underlying drivers do.
8/7/2019 SSRN-id1013997 Global Upward Trend in the profit share
http://slidepdf.com/reader/full/ssrn-id1013997-global-upward-trend-in-the-profit-share 25/29
The global upward trend in the profit share 19
Appendix
A. Data corrections and sources19
A.1 Profit share data
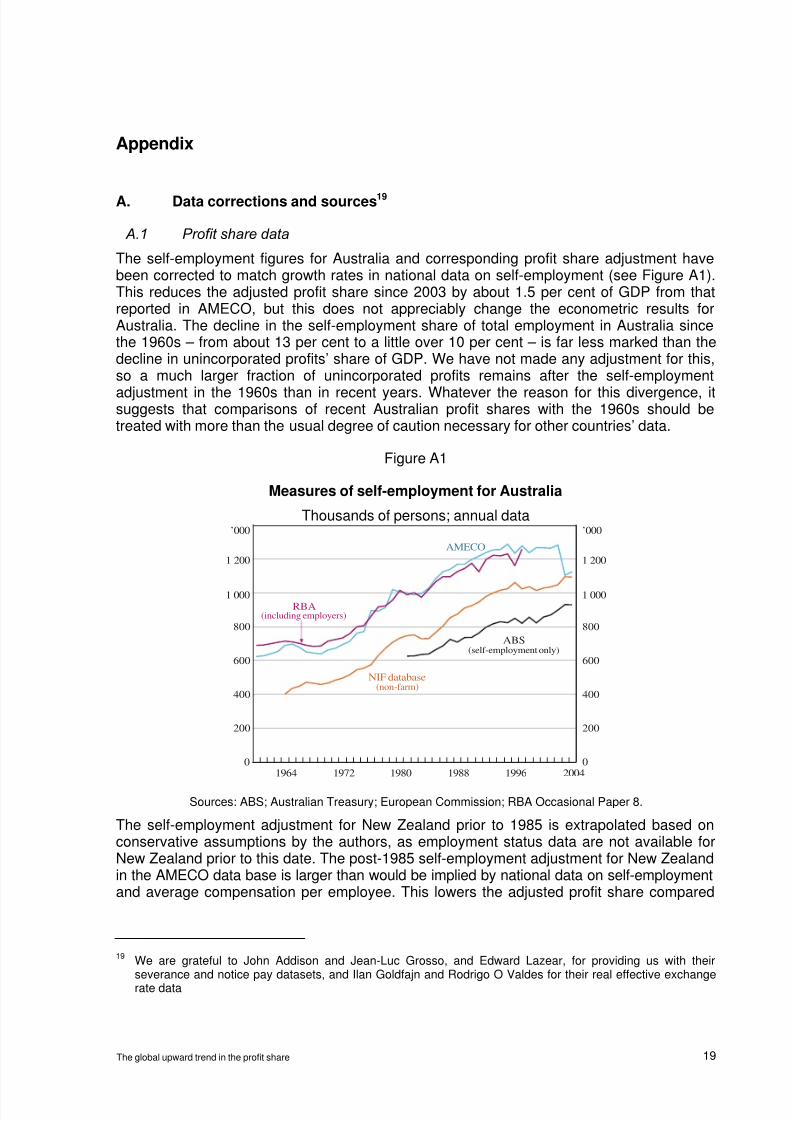
The self-employment figures for Australia and corresponding profit share adjustment havebeen corrected to match growth rates in national data on self-employment (see Figure A1).This reduces the adjusted profit share since 2003 by about 1.5 per cent of GDP from thatreported in AMECO, but this does not appreciably change the econometric results forAustralia. The decline in the self-employment share of total employment in Australia sincethe 1960s – from about 13 per cent to a little over 10 per cent – is far less marked than thedecline in unincorporated profits’ share of GDP. We have not made any adjustment for this,so a much larger fraction of unincorporated profits remains after the self-employment
adjustment in the 1960s than in recent years. Whatever the reason for this divergence, itsuggests that comparisons of recent Australian profit shares with the 1960s should betreated with more than the usual degree of caution necessary for other countries’ data.
Figure A1
Measures of self-employment for Australia
Thousands of persons; annual data
0
200
400
600
800
0
200
400
600
800
RBA(including employers)
2004
1 000
1 200
1 000
1 200
’000
ABS(self-employment only)
NIF database(non-farm)
AMECO
19961988198019721964
’000
Sources: ABS; Australian Treasury; European Commission; RBA Occasional Paper 8.
The self-employment adjustment for New Zealand prior to 1985 is extrapolated based onconservative assumptions by the authors, as employment status data are not available forNew Zealand prior to this date. The post-1985 self-employment adjustment for New Zealandin the AMECO data base is larger than would be implied by national data on self-employmentand average compensation per employee. This lowers the adjusted profit share compared
19We are grateful to John Addison and Jean-Luc Grosso, and Edward Lazear, for providing us with theirseverance and notice pay datasets, and Ilan Goldfajn and Rodrigo O Valdes for their real effective exchangerate data
8/7/2019 SSRN-id1013997 Global Upward Trend in the profit share
http://slidepdf.com/reader/full/ssrn-id1013997-global-upward-trend-in-the-profit-share 26/29
20 The global upward trend in the profit share
with the results that would obtain if the average labour income method used for othercountries were applied to New Zealand. We do not correct the AMECO data for this.
Adjusted profits data for Canada are only available on the AMECO database with a lag. Wetherefore estimated the last two data points for Canada using the growth rates for nationalaccounts total profits, as reported on Statistics Canada’s web site.
A.2 Product market regulation
In Figures 4 and 5, we used the economy-wide indicators from Nicoletti et al (2000). As theseare only available for 1998 and 2003, the results in Tables 2 and 3 use the annual timeseries of regulation in seven non-manufacturing industries described in Conway andNicoletti (2006). Its authors note that, as this index is highly correlated with the economy-wide measure of product market regulation for the years where the two overlap, it is arguablya useful time-series proxy for the stance of economy-wide regulation. Data are held constantat their starting and last observed values for the periods 1961–1974 and 2004–2005respectively.
A.3 Extended employment protection legislation index
We follow Blanchard and Wolfers’ (1999) method of backcasting the Employment ProtectionLegislation (EPL) index to create a long time series for this indicator, but we use slightlydifferent underlying data. In particular, we use the EPL measure and weights from the 2004rather than the 1999 OECD Employment Outlook as the base data. After their last observedvalues (2003), we hold the score levels constant. We also use Addison and Grosso’s (1996)corrected and updated version of Lazear’s (1990) dataset on severance and notice pay asproxy data in the backcasting, which has been used in a number of papers by its authors andothers. Unlike Blanchard and Wolfers, we start the backcasting from 1984 rather than 1979.We set the pre-1985 values for Denmark and the US to zero; the figures implied by theOutlook data for the late 1980s would be constant at a positive level. There are a few missingvalues in Addison and Grosso’s updated dataset but we do not attempt to fill them.
A.4 Oil price
This is calculated as annual averages of quarterly data on US dollar prices of West TexasIntermediate crude oil deflated by the US headline consumer price index.
A.5 Trade shares
These are annual exports data sourced from IMF Balance of Payments statistics. Thecountries included are China, the Czech Republic, Estonia, Hungary, India, Latvia, Lithuania,Poland, Romania, Slovakia and Slovenia. Bulgaria and pre-separation Czechoslovakia hadmissing data in the middle of the series and were therefore excluded.
A.6 Real effective exchange rate
From 1974 onwards (1978 for some countries), the annual real effective exchange rate is anaverage of monthly IMF real effective exchange rates. These are trade-weighted averages ofreal bilateral rates. The trade weights are fixed (prior to 1990, weights are from trade dataover 1980–82; after 1990 weights use trade data covering 1988–90) and incorporatecompetition from third countries. Nominal bilateral rates are deflated by the headlineconsumer price index. For 1961–1974 (or 1961–1978, depending on the country), the IMFrates are backcast using the growth in the real effective exchanges rates from Goldfajn andValdes (1999) over that period. In these series, the nominal bilateral weights are deflated bywholesale or consumer price indices and trade weights (based on trading partnersencompassing more than four per cent of trade) are fixed in 1985.
8/7/2019 SSRN-id1013997 Global Upward Trend in the profit share
http://slidepdf.com/reader/full/ssrn-id1013997-global-upward-trend-in-the-profit-share 27/29
The global upward trend in the profit share 21
References
Abowd, J and M Bognanno (1995): “International differences in executive and managerial
compensation”, in R Freeman and L Katz (eds): Differences and Changes in WageStructures, University of Chicago Press, Chicago, pp 67–103.
Addison, J T and J Grosso (1996): “Job security provisions and employment: Revisedestimates”, Industrial Relations, vol 35, no 4, pp 585–603.
Andersen, P S, M Klau and E Yndgaard (1999): “Higher profits and lower capital prices: Isfactor allocation optimal?”, BIS Working Paper no 65.
Autor, D H, F Levy and R J Murnane (2003): “The skill content of recent technologicalchange: An empirical exploration”, Quarterly Journal of Economics, vol 118, no 4,pp 1279–1333.
Blanchard, O J (1997): “The medium run”, Brookings Papers of Economic Activity, 1997 (2),
pp 89–158.
Blanchard, O and J Wolfers (1999): “The role of shocks and institutions in the rise ofEuropean unemployment: the aggregate evidence”, NBER Working Paper Series No. 7282.
Browne, L E and R Hellerstein (1997): “Are we investing too little?”, New England Economic Review , November/December 1997, pp 29–50.
Brynjolfsson, E and L M Hitt (2003): “Computing productivity: Firm-level evidence”, Review of Economics and Statistics, vol 85, no 4, pp 793–808.
Caballero, R J and M L Hammour (1998): “Jobless growth: Appropriability, factor substitution,and unemployment”, Carnegie-Rochester Conference Series on Public Policy, vol 48, no 1,pp 51–94.
Cadiou, L, S Dées and J-P Laffargue (2003): “A computational general equilibrium modelwith vintage capital”, Journal of Economic Dynamics and Control , vol 27, no 11–12,pp 1961–1991.
Card, D and J E DiNardo (2002): “Skill-biased technological change and rising wageinequality: some problems and puzzles”, Journal of Labor Economics, vol 20, no 4,pp 733–783.
Caroli, E and J Van Reenen (2001): “Skill-biased organizational change? Evidence from apanel of British and French establishments”, Quarterly Journal of Economics, vol 116, no 4,pp 1449–1492.
Conway, P and G Nicoletti (2006): “Product market regulation in the non-manufacturingsectors of OECD countries: Measurement and Highlights”, OECD Economics DepartmentWorking Paper no 530.
———, V Janod and G Nicoletti (2005): “Product market regulation in OECD countries: 1998to 2003”, OECD Economics Department Working Paper no 419.
De Serres A, S Scarpetta and C De La Maisonneuve (2001): “Falling Wage Shares inEurope and the United States: How Important is Aggregation Bias?”, Empirica, vol 28, no 4,pp 375–401.
DiNardo, J E and J-S Pischke (1997): “The returns to computer use revisited: Have pencilschanged the wage structure too?”, Quarterly Journal of Economics, vol 112, no 1,pp 291–303.
Dombrecht, M and P Moes (1998): “Inflation and unemployment in an open economy”,Economic and Financial Modelling , vol 5, no 2, pp 53–94.
8/7/2019 SSRN-id1013997 Global Upward Trend in the profit share
http://slidepdf.com/reader/full/ssrn-id1013997-global-upward-trend-in-the-profit-share 28/29
22 The global upward trend in the profit share
Dostie, B and M Trépanier (2005): “Returns to computer use and organizational practices ofthe firm”, IZA Discussion Paper no 1541.
European Central Bank (2004): “Measuring and analysing profit developments in the euroarea”, ECB Monthly Bulletin, January 2004, pp 63–73.
Gapinski, J H (1973): “Putty-clay capital and small-sample properties of neoclassicalestimators”, Journal of Political Economy , vol 81, no 1, pp 145–157.
Giammarioli, N, J Messina, T Steinberger and C Strozzi (2002): “European labour sharedynamics: An institutional perspective”, European University Institute Working Paper ECO2002/13.
Goldfajn, I and R Valdes (1999): “The aftermath of appreciations”, Quarterly Journal of Economics, vol 114, no 1, pp 229–262.
Gollin, D, (2002): “Getting income shares right”, Journal of Political Economy , vol 110, no 2,pp 458-474.
Guscina, A (2006): “Effect of globalization on labor’s share in national income”, IMF WorkingPaper 06/294.
Harvey, R (2003): “Comparability of saving and profit ratios”, OECD Statistics DirectoratePaper STD/NAES(2003)18.
Hornstein, A, P Krusell and G L Violante (2002): “Vintage capital as an origin of inequalities”,CEPR Discussion Paper 3596.
——— (2003): “Vintage capital as an origin of inequalities”, mimeo, available at<http://rincewind.iies.su.se/~krusell/wp/hkv_may03.pdf>.
Johnson, D G (1954): “The functional distribution of income in the United States, 1850– 1952”, Review of Economics and Statistics, vol 35, no 2, pp 175–182.
Krueger, A B (1999): “Measuring labor’s share”, American Economic Association Papers and
Proceedings, vol 89, no 2, pp 45–51.
Krugman, P (2002): “For richer”, New York Times Magazine, 20 October 2002.
Lazear, E P (1990): “Job security provisions and employment”, Quarterly Journal of Economics, vol 105, pp 669–726.
Meyler, A (2001): “Profit margins in the Euro Area: A macroeconomic perspective”, mimeo,Central Bank of Ireland.
——— and L Sondergaard (2005): “Profit developments in the Euro Area industrial sector”,mimeo, European Central Bank.
Moylan, C (2000): “Treatment of employee stock options in the U.S. national economic
accounts”, Paper presented at the OECD Meeting of National Accounts Experts, September26–29, 2000, available at: <http://www.bea.gov/papers/pdf/empstop.pdf>.
Murphy, K J (1999): “Executive compensation”, in O Ashenfelter and D Card (eds):Handbook of Labor Economics, vol 3B, Elsevier, Amsterdam, pp 2485–2563.
Nicoletti, G, S Scarpetta and O Boylaud (2000): “Summary indicators of product marketregulation with an extension to employment protection legislation”, OECD EconomicsDepartment Working Paper no 226.
Nicoletti, G and S Scarpetta (2005): “Product market reforms and employment in OECDcountries”, OECD Economics Department Working Paper no 472.
OECD (1999): OECD Employment Outlook 1999, OECD, Paris.
——— (2004): OECD Employment Outlook 2004, OECD, Paris.

8/7/2019 SSRN-id1013997 Global Upward Trend in the profit share
http://slidepdf.com/reader/full/ssrn-id1013997-global-upward-trend-in-the-profit-share 29/29
Phelps, E S (2006): “Some costs of globalization”, paper presented at ASSA 2006Conference, January 7.
Shiller, R (2000): Irrational Exuberance, Princeton University Press.
Solow, R M (1962): “Substitutions and fixed proportions in the theory of capital”, Review of Economic Studies, vol 29, pp 207–218.
Tevlin, S and K Whelan (2000): “Explaining the investment boom of the 1990s”, FederalReserve Board of Governors Finance and Economics Discussion Series 2000-11.
Violante, G L (2002): “Technological acceleration, skill transferability and the rise in residualinequality”, Quarterly Journal of Economics, vol 117, no 1, pp 297–337.
Whelan, K (2000): “Computers, obsolescence and productivity”, Federal Reserve Board ofGovernors Finance and Economics Discussion Series 2000-06.