ssroc liveability benchmark report
TRANSCRIPT

SSROCLiveabilityBenchmarkReport.docx
LiveabilityBenchmarksforCentralandSouthernSydneyFinalReportSouthernSydneyRegionalOrganisationofCouncilsNovember2015

SSROCLiveabilityBenchmarkReport.docx
ThisreporthasbeenpreparedforSouthernSydneyRegionalOrganisationofCouncils.SGSEconomicsandPlanninghastakenallduecareinthepreparationofthisreport.However,SGSanditsassociatedconsultantsarenotliabletoanypersonorentityforanydamageorlossthathasoccurred,ormayoccur,inrelationtothatpersonorentitytakingornottakingactioninrespectofanyrepresentation,statement,opinionoradvicereferredtoherein.SGSEconomicsandPlanningPtyLtdACN007437729www.sgsep.com.auOfficesinCanberra,Hobart,MelbourneandSydney
forCentralandSouthernSydney
TABLEOFCONTENTS
EXECUTIVESUMMARY 1
1 INTRODUCTION 41.1 Backgroundandaim 41.2 Approachestobenchmarking 41.3 Benchmarking,dimensionsandindicators 51.4 LiveabilityandintensificationinCentral/SouthernSydney 5
2 LIVEABILITYOUTCOMESANDBESTPRACTICEMEASUREMENT 72.1 Dimensionsofliveability 72.2 Districtopenspaceandrecreation 72.3 Housingaffordability 102.4 Accessibilitytocentresandemployment 122.5 Parking 142.6 Schoolsandothereducationfacilities 162.7 Hospitalsandotherhealthfacilities 182.8 Communityandculturalfacilities,includingchildcare 202.9 Precinctsustainability 232.10 Localemploymentandeconomicdevelopment 252.11 Utilitiesandstormwater 27
3 BENCHMARKS 293.1 Overviewofpotentialbenchmarksandindicators 293.2 Implementation 293.3 Benchmarks 30
4 PROOFOFCONCEPTTESTING 324.1 Testingbenchmarksinanintensificationarea 324.2 Green‘Circle’UrbanrenewalArea 324.3 Proofofconcepttesting(theoretical) 344.4 Performanceagainstallindicators 37
5 CONCLUSION 385.1 ActiveOpenSpaceandRecreation 385.2 HousingAffordability 385.3 Accesstocentresandemployment 385.4 Parking 395.5 SchoolsandOtherEducationFacilities 395.6 HospitalsandHealthfacilities 395.7 Communityandculturalfacilities,includingchildcare 395.8 Precinctsustainability 405.9 Localemploymentandeconomicdevelopment 40

forCentralandSouthernSydney
5.10 Utilitiesandstormwater 40
APPENDIX:LITERATUREREVIEW 41OpenSpace 41AffordableHousing 43Accessibility 44Parking 45Schoolsandothereducationfacilities 45Hospitalsandotherhealthfacilities 46Communityandculturalfacilitiesincludingchildcare 47References 48
forCentralandSouthernSydney1
EXECUTIVESUMMARY
SouthernSydneyRegionalOrganisationofCouncils(SSROC)wanttoensurethatprocessofurbanintensificationdeliversbenefitstolocalcommunitiesintermsofamenity,liveabilityandaccesstoemploymentandservices.Inparticular,SSROCisinterestedinmechanismsthatcanbeusedtoensurestateagenciesandlocalgovernmentsareaccountableforthedeliveryofadditionalservicesandinfrastructuresneededinareasthataresubjecttosignificantintensificationandchange.SGShasbeencommissionedtoidentifyliveabilitybenchmarksthatmightbeusedtoinfluencefutureplanning,investmentandinfrastructuredeliveryinestablishedurbanareas.Inthisreportthetermliveabilityincludesarangeofissuesthatrelatetothewellbeingofacommunity(e.g.accessibility,amenity,qualityoflife,sustainability,etc.)thatcouldbesubjecttochangeasaresultofurbanintensification.Theconceptofabenchmarkreferstothestandardorpointofreferenceagainstwhichanalternativeorfuturesituationwouldbecomparedorjudged.Thebenchmarksapplytodifferentdimensions(orthemes)ofliveabilitysuchasopenspaceorhousingaffordability.Theactualmeasuresofperformancetowardsachievingabenchmarkaretermedindicators.Thefollowingbenchmarksandindicators(tablebelow)weretestedusingahypotheticalcasestudyandobservationsweremadeontheirusefulnessasmeasuresforperformanceofurbanintensificationprecinctsandforwiderdistricts.Severalimportantobservationsmadeintheanalysisare:
• Theexpectationsofnewversusexistingresidentsvaryonwhatrepresents‘good’liveability–thisnecessitatesaneedsbasedassessment.
• Whilesomeindicatorsarescalablebetweenprecinctanddistrict–manyoffermorerelevantresultsatasinglescale.
• Someindicators(especiallythoserelatingtotransportaccessibility)arenotsensitivetolocalchangesbutareveryimportantatadistrictscaleoverthelongterm–addressingsuchindicatorsrequiresthetimeandresourcesofanintegrateddistrictplanningstrategy–ratherthanrespondingtoasingleindicator.
• Itisimportanttodeterminewhetheravailablecapacityispresentinexistingfacilitiesbeforeapplyingnewmetricsforfutureprovision.
• Combiningliveabilitymeasurestoformanindexwouldnotbeusefuluntiladatabaseofcomparablecasestudiesenablesmeaningfulcomparison.

forCentralandSouthernSydney2
Theme Outcome/ssought Benchmark/s Indicators/s
Districtopenspaceandrecreation Nonetlossintheareaofavailableactiverecreationalspace(includingplayingfields)intheSouthandCentralDistricts
Existinglevelsofplayingfieldprovisionandusagerepresenttheminimumbenchmarkduetocounciladvicethatusageisalreadyatcapacityacrossthedistrict.
Areaandnumberofplayingfieldsavailableinthedistrict(bysport)(annually)
Increasedavailabilityandutilisationofplayingfieldassets;− uptotheutilisation
maximuminhoursofusefornaturalgrasssurfaces
− withtheprovisionofsuitablelightingandmaintenance
− assetusagemeteredtospreadthepeakdemand
Existinglevelsofavailabilityandprogrammedusagerepresenttheminimumbenchmark.Existinglevelofavailableplayingfieldhoursforeachplayerforeachsportrepresentstheminimumbenchmark
Numberofdaysfieldsclosed/unavailableforuse(annually).Availableplayingfieldhourspersportperparticipant
Increasedrangeofactiverecreationalopportunities
Tobedeterminedbasedonaneedsassessmentofexistingandnewresidents
Completionandadoptionoftherecreationalneedsassessment–includingthediversificationofplayingfieldtype/needs
Housingaffordability Increaseinsupplyofaffordablerentalaccommodationforlowincomehouseholds
30percentofrenewalstocktobeaffordablerentalhousing.1
Affordablehousingtomakeupanincreaseshareoftotaldwellingstock.
Accesstocentresandemployment Increaseinaverageaccessibilitytodistrictcentresandemployment
AveragedprivateANDpublictraveltimestodistrictcentrenottoexceed30minutesfromnewrenewalprojectsites
ProjectcatchmentstobedeterminedbyTraveltimematricesonJourneytoWorkandsocialtripspatterns
Localcentresocialinfrastructuretobeaccessiblewithin20minutesofactivetransportmodestocreatea’20minutecity’urbantopography.2
Averagetraveltimetokeycommunityinfrastructurenottoexceed20minutesbyactivetransportmodes
ProjectcatchmentstobedeterminedbyTraveltimematricesonsocialtripspatternsandnetworkanalysis
Parking Assessmentofcurrentparkingprovisionacrossadistrict
Abaselineassessmentofcurrentparkingdemandandsupplyandthefinancialmodeloftheparkingitem
Documentationofthelocationandquantityofpublicparkinganditsmanagementandmaintenanceregime(annualreview)inaTransportManagementandAccessibilityPlan(TMAP)
Justifiedadditionstoparkingsupply.Supplythatdoesnotgenerateunnecessarytraveldemand,yetprovidesasufficientlevelofparkingtosupportthefunctionsofthelocation
Provisionofadequateandjustifiedparkingsupplyinlinewithforecastdemandfromrenewalproject
ProvisionofparkinginaccordancewiththeTMAPstandards.
Schoolsandothereducationfacilities Provisionoflocalprimaryschools(andclassroomspace)tomeetdemand(andexpectations)createdbypopulationgrowthandchangingdemographicsatthelocallevel.3
Achievingthenominalprovisionrates(e.g.ratiosofpopulationperschool)butalsoconsiderationof:− Localaccessibility–local
schoolcatchmentstoadheretothe‘20minutecity’model
− Needsbasedassessmentreferringtoexistingand
MeasureofschoolpopulationbyaccessiblecatchmentpopulationSchoolcatchmentstobedeterminedbyTraveltimematricesandnetworkanalysis
1Provisionofaffordablehousingshouldnotcreateconcentrationsofaffordablesocialhousingoraffordableadditionalneedshousingtolevelswhereitcreatesnegativesocialenvironments.
2This’20minuteCity’modelwouldincludetheambitionofincreasedaccessibilitytodistrictcentresandemploymentoftripsnolongerthan20minutes(averageofbothcarandpublictransportmodes)
3Independentschoolsandotherprivateinfrastructureareconsideredtooperateoutsideofbenchmarkingoutcomes
Parkingbenchmarksareimpracticalduetothevastrangeofparkingneeds
andareaddressedvialocalgovernmentcodesandcontrols.

forCentralandSouthernSydney3
Theme Outcome/ssought Benchmark/s Indicators/s
newpopulationexpectations
Optimiseefficiencyofuseandmaintenancestructureforschoolinfrastructure(betweenschools).
Usabilityandavailabilityofopportunitiesforshareduseofexternalfacilitiesforconfinedschools(e.g.openspace,planningfields,halls,libraries/resourcecentres)
Sharedfacilitiesaudittoassesscomparableaccesstofacilitiesbetweendifferentschoolmodels(acknowledgingthelimitationsofmaximumusablehoursfornaturalsurfaces).
Hospitalsandotherhealthfacilities Provisionofhospitalbedsandotherhealthfacilitiestomeetdemandcreatedbypopulationgrowthandchange.4
Theavailabilityofsuitablyzonedandservicedspaceforsupportinghealthfacilities/enterprisesassociatedwithmajorhospitalsandhealthcentres
Auditoflandsupplyinparallelwithhealthandalliedindustryneedsassessment
Loweraveragetraveltimestokeyhealthfacilitiesbypublictransportandwalking
Improvedaccessibilityofkeyhealthfacilitiesbypublictransportandwalkingtothestandardsofthe’20minutecity’
CatchmentstobedeterminedbyTraveltimematricesandnetworkanalysis
Communityandculturalfacilities,includingchildcare
Responsetoaneedsbasedassessmentfortypesofcommunityandculturalfacilitiestargetingnewandexistingresidents(withreferencetoavailablecapacity)
Improvingexistingratiosofpopulationpercommunityand/orculturalfacilityforthosefacilitiesatcapacity
Preparationandimplementationofaneedsassessment
Improvingpopulationaccesstocommunityfacilities–usingthe‘20minutecity’modelandtransitconnectivityasameasureforaccessibilityofcommunityandculturalfacilitiesThosecouncilswhoprovidepublicchildcareplacesseektoprovide1spaceforbetweenevery2-7childrenaged1-5yo.
Ensuringaccesstothefullrangeofcommunityfacilitieswithin20minutesbypublictransport(the’20minutecity’model)
ProjectcatchmentstobedeterminedbyTraveltimematricesonsocialtripspatternsandnetworkanalysis
Precinctsustainability Environmentalcoststobeminimisedandtheenvironmentalperformanceofaprecincttobeimprovedoverallasaresultofnewdevelopmentandgrowth.
Establishprecinctspecificenvironmentaltargetsforenergy,CO2,water,runoff(WSUD),waste,localaccess,heatstressandbiodiversity
Applymostrelevantprecinctsustainabilitymeasurementinstrument(i.e.PRECINX,GreenStar),shadedpublicspaces
4Accesstolocalcommercialfloorspace(forsupportivecommercialandlocaldispersedactivities)isneededforthesupportofprimaryhealthservices
forCentralandSouthernSydney4
1 INTRODUCTION
1.1 Backgroundandaim
SGShasbeencommissionedbytheSouthernSydneyRegionalOrganisationofCouncils(SSROC)toundertakeanalysisofliveabilitybenchmarksandopportunitiestoincorporatetheseintotheplanningprocesstoensurethaturbanintensificationdeliversmeasurablebenefitstolocalcommunitiesintermsofimprovedamenity,liveabilityandjobprospects.Theseinclude:− increasingtheshareofsocialandaffordabledwellings,− reducingtheaveragetraveltimetoemployment,− increasingtheshareoftripsmadebyactivetransportmodes,− increasingtheratioofpubliceducationplacestoschoolagechildren,− increasingtheareaofactiveopenspaceassets,and− increasingthelengthofpubliclyaccessibleharbourforeshore.SSROCmayorsareseekingameansofmakingstateagenciesmoreaccountableforthefundinganddeliveryofnewinfrastructureneededtoimproveareasundergoingrapidchange.Thisinfrastructureincludescommunityfacilitiessuchasopenspaceandplayingfields,affordablehousingaswellastransportandotherphysicalinfrastructure.SGSfacilitatedaworkshopwithSSROCcouncilplannerstodiscusstheliveabilityissueswhichareimportanttoeachcouncilandexistingandpotentialmeasures.Theoutcomesofthisworkshophavebeenincorporatedwithinthisreport.
1.2 Approachestobenchmarking
Twobroadapproachescanbeappliedtobenchmarkingdistrictsandprecinctwithincities.Oneapproachistocomparemetricsfromonelocationtothoseofabenchmarklocation.Thisapproachassesseshowthecomparatorlocationis‘performing’relativetothebenchmarklocation.Analternativeandmorecomplexapproachistocomparethelocationtowhatisdeemedtobeanoptimalquantityorrequirement,e.g.therequirednumberofschoolsperheadofpopulation;ortheoptimalamountoflocalopenspacepercapita.Theadvantageoftheformerapproachisthatthe‘burdenofproof’isderivedfromsimplecomparisonsbetweenlocations.IfDistrictAhaslessopenspacepercapitathanthebenchmarklocation(DistrictB)wemightconcludethatDistrictAisdisadvantaged.However,ifDistrictBhastoomuchopenspace–suchthatitcannotbeadequatelymaintainedoritsmaintenancedivertsfundsfromotherfacilitiesorprograms–thenDistrictAmightinfactbethebetterofthetwo.Usingthesecondapproachandcomparinglocationstonormativebenchmarksovercomesthisproblem,butsuchnormativebenchmarkscanbedifficulttoobjectively‘prove’andcanthereforebecontested.
forCentralandSouthernSydney5
1.3 Benchmarking,dimensionsandindicators
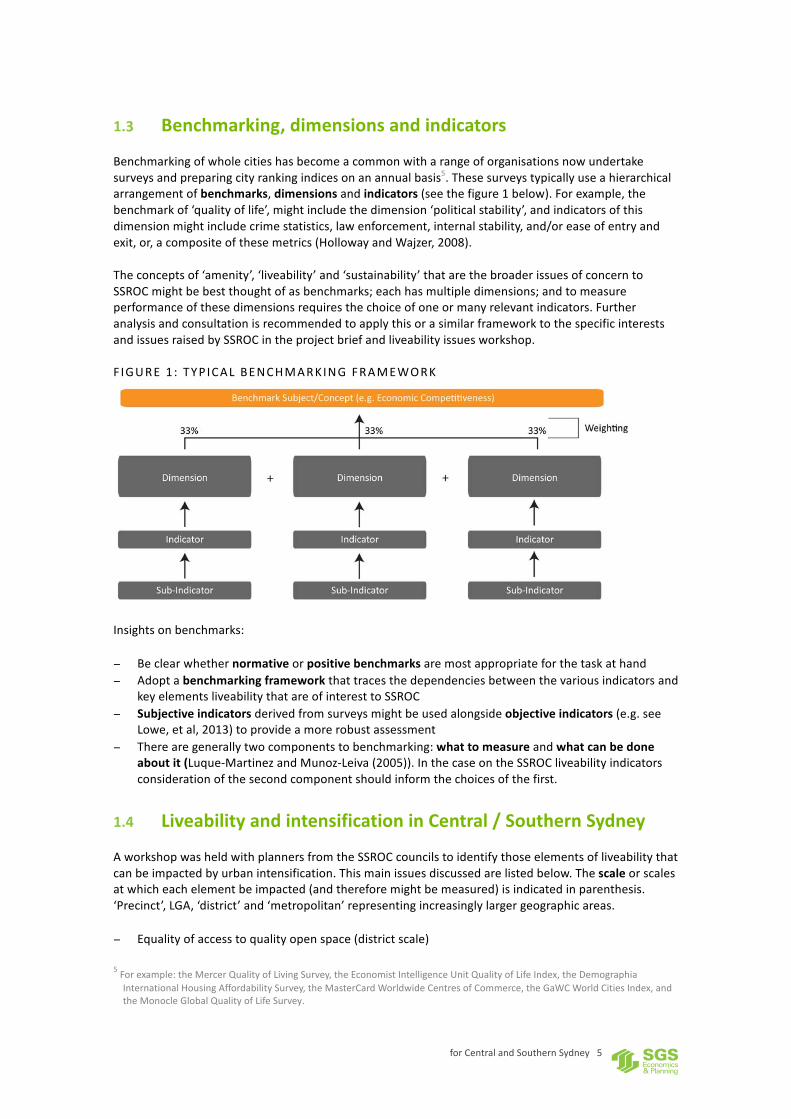
Benchmarkingofwholecitieshasbecomeacommonwitharangeoforganisationsnowundertakesurveysandpreparingcityrankingindicesonanannualbasis5.Thesesurveystypicallyuseahierarchicalarrangementofbenchmarks,dimensionsandindicators(seethefigure1below).Forexample,thebenchmarkof‘qualityoflife’,mightincludethedimension‘politicalstability’,andindicatorsofthisdimensionmightincludecrimestatistics,lawenforcement,internalstability,and/oreaseofentryandexit,or,acompositeofthesemetrics(HollowayandWajzer,2008).Theconceptsof‘amenity’,‘liveability’and‘sustainability’thatarethebroaderissuesofconcerntoSSROCmightbebestthoughtofasbenchmarks;eachhasmultipledimensions;andtomeasureperformanceofthesedimensionsrequiresthechoiceofoneormanyrelevantindicators.FurtheranalysisandconsultationisrecommendedtoapplythisorasimilarframeworktothespecificinterestsandissuesraisedbySSROCintheprojectbriefandliveabilityissuesworkshop.
F IGURE1 : TYP ICAL BENCHMARKINGFRAMEWORK
Insightsonbenchmarks:− Beclearwhethernormativeorpositivebenchmarksaremostappropriateforthetaskathand− Adoptabenchmarkingframeworkthattracesthedependenciesbetweenthevariousindicatorsand
keyelementsliveabilitythatareofinteresttoSSROC− Subjectiveindicatorsderivedfromsurveysmightbeusedalongsideobjectiveindicators(e.g.see
Lowe,etal,2013)toprovideamorerobustassessment− Therearegenerallytwocomponentstobenchmarking:whattomeasureandwhatcanbedone
aboutit(Luque-MartinezandMunoz-Leiva(2005)).InthecaseontheSSROCliveabilityindicatorsconsiderationofthesecondcomponentshouldinformthechoicesofthefirst.
1.4 LiveabilityandintensificationinCentral/SouthernSydney
AworkshopwasheldwithplannersfromtheSSROCcouncilstoidentifythoseelementsofliveabilitythatcanbeimpactedbyurbanintensification.Thismainissuesdiscussedarelistedbelow.Thescaleorscalesatwhicheachelementbeimpacted(andthereforemightbemeasured)isindicatedinparenthesis.‘Precinct’,LGA,‘district’and‘metropolitan’representingincreasinglylargergeographicareas.− Equalityofaccesstoqualityopenspace(districtscale)
5Forexample:theMercerQualityofLivingSurvey,theEconomistIntelligenceUnitQualityofLifeIndex,theDemographiaInternationalHousingAffordabilitySurvey,theMasterCardWorldwideCentresofCommerce,theGaWCWorldCitiesIndex,andtheMonocleGlobalQualityofLifeSurvey.

forCentralandSouthernSydney6
− Provisionofaffordablehousing(precinct,LGAordistrict)− Accessibilitytoemploymentandkeycommunityfacilities(precinct,LGAordistrict)− Adequateschoolsandothereducationfacilities(LGAordistrict)− Adequatehospitalandhealthcare(LGAordistrict)− Communityandculturalfacilities,particularlychildcare(precinctorLGA)− ‘Precinctsustainability’(precinct)− Retentionoflocalemployment(district)− Increasedriskoffloodingorpollution(precinctorLGA)Otherissuesthatmightbeworthyofconsiderationinthedevelopmentifliveabilityindicatorscouldincludesocialandculturaldimensions,physicalhealth,walkabilityandplacequality(i.e.urbandesign).Asecondworkshopwasheldtoconsiderthevalidityofbenchmarksandindicatorsontheabovethemes.ThesebenchmarksandindicatorswerethentestedusingahypotheticalcasestudybasedonGreenSquare.

forCentralandSouthernSydney7
2 LIVEABILITYOUTCOMESANDBESTPRACTICEMEASUREMENT
2.1 Dimensionsofliveability
Thefollowingsectionheadingsrepresenttendimensionsofliveabilitythatcouldbeinfluencedbyurbanintensification.TheywereidentifiedbySSROCofficersintheRegionalStrategicAnalysisworkshops6.Liveabilitycanbebroadlydefinedasthewell-beingofacommunityandrepresentsthecharacteristicsthatmakeaplacewherepeoplewanttolivenowandinthefuture7.Itisthesumoftheaspectsthatadduptothequalityoflifeofaplace,includingitseconomy,amenity,environmentalsustainability,healthandwellbeing,equity,educationandlearning,andleadership8.
2.2 Districtopenspaceandrecreation
OutcomesAnincreaseinthepopulationofSouthernandCentralSydney,includingspecificprojectssuchasF6Motorway,willplacepressureonexistingdistrictopenspaceandrecreationfacilities.Therearelimitedopportunitiestopurchaselargeareasofnewland,particularlyforrecreationpurposes,intermsofbothcostandavailabilityoflandparcelsoverseveralhectares.Asignificantissueraisedduringtheworkshopwithcouncilplannerswasequalityofaccessandensuringthatallgroupswithinthecommunityhaveaccesstoqualityopenspace.Intermsofquality,usabilitywasraisedasanissueparticularlyfloodpronelandandimpactofheavyrainfall.Thishighlightsanopportunitytothinkmorewidelyatactiveopenspacetoincludeindoorspaceaswell(e.g.basketballcourtsandotherindoorfacilities).Feedbackfromthecouncilofficerworkshopindicatedthatgrassedactiverecreationspace–especiallyplayingfieldsarecloseoratcapacityinCentralandSouthernSydney.Theoverarchinggoalistheadequateprovisionofopenspace(activeandpassive)intermsofquantityandqualityincludingaccessibilityandfitforpurpose.However,giventhedifficultyinsecuringnewlargescalefacilitiesandthechangingrecreationalneedsoffuturecommunities,reasonableoutcomesinthefaceofurbanintensificationwouldbetoensure:− Thereisnonetlossintheareaofavailableactiverecreationalspace(includingplayingfields)in
theSouthandCentralDistricts
6SGS(2015)SSROCRegionalStrategicAnalysis7http://www.highdensityliveability.org.au/about130_liveablility_research.php8http://livable.org.au/index.php?id=12
forCentralandSouthernSydney8
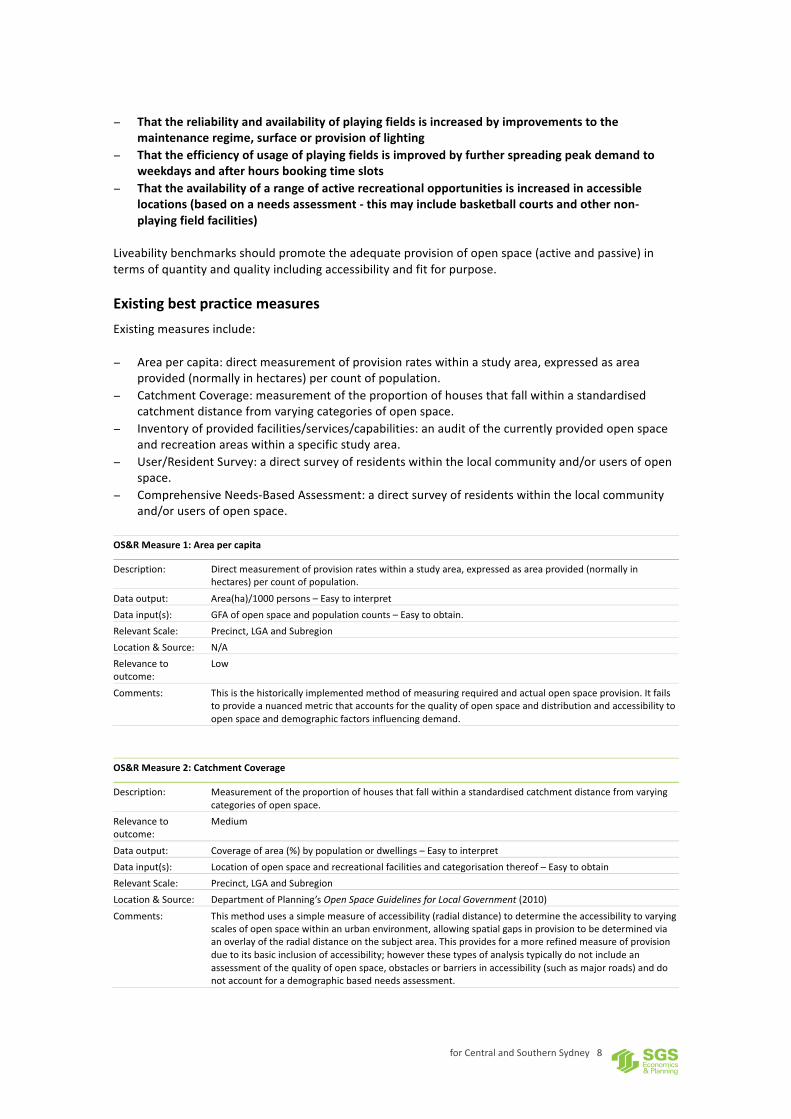
− Thatthereliabilityandavailabilityofplayingfieldsisincreasedbyimprovementstothemaintenanceregime,surfaceorprovisionoflighting
− Thattheefficiencyofusageofplayingfieldsisimprovedbyfurtherspreadingpeakdemandtoweekdaysandafterhoursbookingtimeslots
− Thattheavailabilityofarangeofactiverecreationalopportunitiesisincreasedinaccessiblelocations(basedonaneedsassessment-thismayincludebasketballcourtsandothernon-playingfieldfacilities)
Liveabilitybenchmarksshouldpromotetheadequateprovisionofopenspace(activeandpassive)intermsofquantityandqualityincludingaccessibilityandfitforpurpose.
ExistingbestpracticemeasuresExistingmeasuresinclude:− Areapercapita:directmeasurementofprovisionrateswithinastudyarea,expressedasarea
provided(normallyinhectares)percountofpopulation.− CatchmentCoverage:measurementoftheproportionofhousesthatfallwithinastandardised
catchmentdistancefromvaryingcategoriesofopenspace.− Inventoryofprovidedfacilities/services/capabilities:anauditofthecurrentlyprovidedopenspace
andrecreationareaswithinaspecificstudyarea.− User/ResidentSurvey:adirectsurveyofresidentswithinthelocalcommunityand/orusersofopen
space.− ComprehensiveNeeds-BasedAssessment:adirectsurveyofresidentswithinthelocalcommunity
and/orusersofopenspace.OS&RMeasure1:Areapercapita
Description: Directmeasurementofprovisionrateswithinastudyarea,expressedasareaprovided(normallyinhectares)percountofpopulation.
Dataoutput: Area(ha)/1000persons–EasytointerpretDatainput(s): GFAofopenspaceandpopulationcounts–Easytoobtain.RelevantScale: Precinct,LGAandSubregionLocation&Source: N/ARelevancetooutcome:
Low
Comments: Thisisthehistoricallyimplementedmethodofmeasuringrequiredandactualopenspaceprovision.Itfailstoprovideanuancedmetricthataccountsforthequalityofopenspaceanddistributionandaccessibilitytoopenspaceanddemographicfactorsinfluencingdemand.
OS&RMeasure2:CatchmentCoverage
Description: Measurementoftheproportionofhousesthatfallwithinastandardisedcatchmentdistancefromvaryingcategoriesofopenspace.
Relevancetooutcome:
Medium
Dataoutput: Coverageofarea(%)bypopulationordwellings–EasytointerpretDatainput(s): Locationofopenspaceandrecreationalfacilitiesandcategorisationthereof–EasytoobtainRelevantScale: Precinct,LGAandSubregionLocation&Source: DepartmentofPlanning’sOpenSpaceGuidelinesforLocalGovernment(2010)Comments: Thismethodusesasimplemeasureofaccessibility(radialdistance)todeterminetheaccessibilitytovarying
scalesofopenspacewithinanurbanenvironment,allowingspatialgapsinprovisiontobedeterminedviaanoverlayoftheradialdistanceonthesubjectarea.Thisprovidesforamorerefinedmeasureofprovisionduetoitsbasicinclusionofaccessibility;howeverthesetypesofanalysistypicallydonotincludeanassessmentofthequalityofopenspace,obstaclesorbarriersinaccessibility(suchasmajorroads)anddonotaccountforademographicbasedneedsassessment.
forCentralandSouthernSydney9
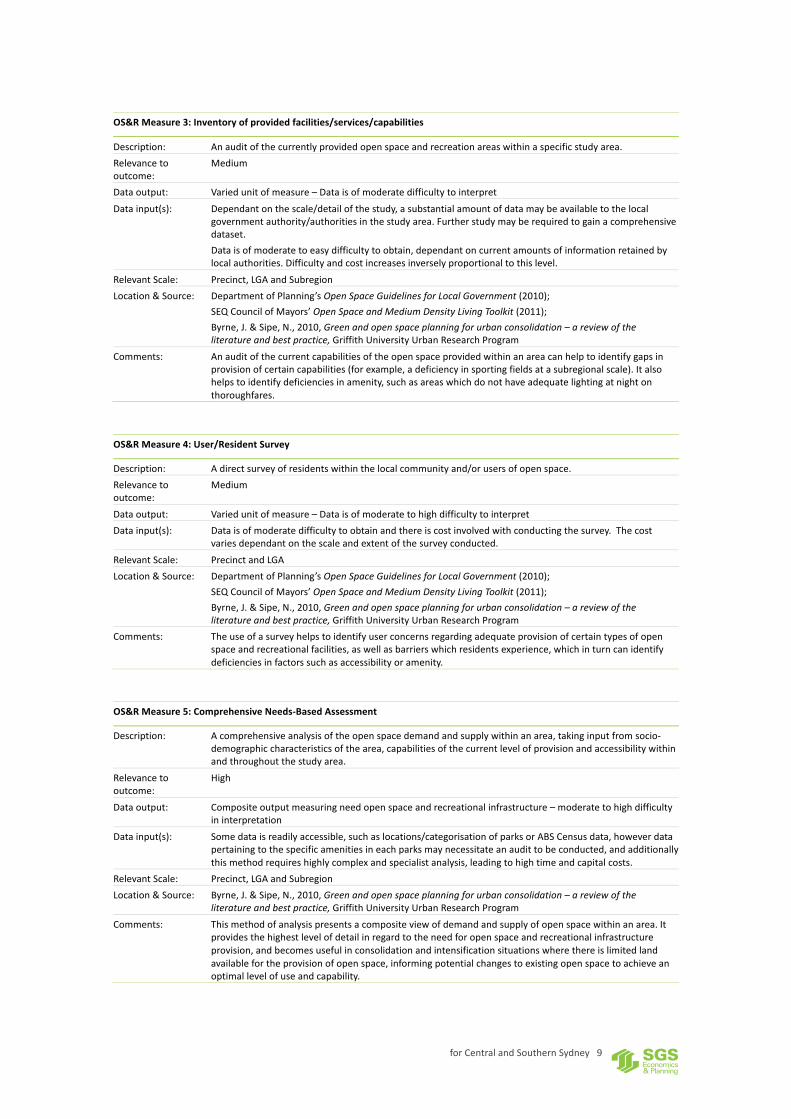
OS&RMeasure3:Inventoryofprovidedfacilities/services/capabilities
Description: Anauditofthecurrentlyprovidedopenspaceandrecreationareaswithinaspecificstudyarea.Relevancetooutcome:
Medium
Dataoutput: Variedunitofmeasure–DataisofmoderatedifficultytointerpretDatainput(s): Dependantonthescale/detailofthestudy,asubstantialamountofdatamaybeavailabletothelocal
governmentauthority/authoritiesinthestudyarea.Furtherstudymayberequiredtogainacomprehensivedataset.Dataisofmoderatetoeasydifficultytoobtain,dependantoncurrentamountsofinformationretainedbylocalauthorities.Difficultyandcostincreasesinverselyproportionaltothislevel.
RelevantScale: Precinct,LGAandSubregionLocation&Source: DepartmentofPlanning’sOpenSpaceGuidelinesforLocalGovernment(2010);
SEQCouncilofMayors’OpenSpaceandMediumDensityLivingToolkit(2011);Byrne,J.&Sipe,N.,2010,Greenandopenspaceplanningforurbanconsolidation–areviewoftheliteratureandbestpractice,GriffithUniversityUrbanResearchProgram
Comments: Anauditofthecurrentcapabilitiesoftheopenspaceprovidedwithinanareacanhelptoidentifygapsinprovisionofcertaincapabilities(forexample,adeficiencyinsportingfieldsatasubregionalscale).Italsohelpstoidentifydeficienciesinamenity,suchasareaswhichdonothaveadequatelightingatnightonthoroughfares.
OS&RMeasure4:User/ResidentSurvey
Description: Adirectsurveyofresidentswithinthelocalcommunityand/orusersofopenspace.Relevancetooutcome:
Medium
Dataoutput: Variedunitofmeasure–DataisofmoderatetohighdifficultytointerpretDatainput(s): Dataisofmoderatedifficultytoobtainandthereiscostinvolvedwithconductingthesurvey.Thecost
variesdependantonthescaleandextentofthesurveyconducted.RelevantScale: PrecinctandLGALocation&Source: DepartmentofPlanning’sOpenSpaceGuidelinesforLocalGovernment(2010);
SEQCouncilofMayors’OpenSpaceandMediumDensityLivingToolkit(2011);Byrne,J.&Sipe,N.,2010,Greenandopenspaceplanningforurbanconsolidation–areviewoftheliteratureandbestpractice,GriffithUniversityUrbanResearchProgram
Comments: Theuseofasurveyhelpstoidentifyuserconcernsregardingadequateprovisionofcertaintypesofopenspaceandrecreationalfacilities,aswellasbarrierswhichresidentsexperience,whichinturncanidentifydeficienciesinfactorssuchasaccessibilityoramenity.
OS&RMeasure5:ComprehensiveNeeds-BasedAssessment
Description: Acomprehensiveanalysisoftheopenspacedemandandsupplywithinanarea,takinginputfromsocio-demographiccharacteristicsofthearea,capabilitiesofthecurrentlevelofprovisionandaccessibilitywithinandthroughoutthestudyarea.
Relevancetooutcome:
High
Dataoutput: Compositeoutputmeasuringneedopenspaceandrecreationalinfrastructure–moderatetohighdifficultyininterpretation
Datainput(s): Somedataisreadilyaccessible,suchaslocations/categorisationofparksorABSCensusdata,howeverdatapertainingtothespecificamenitiesineachparksmaynecessitateanaudittobeconducted,andadditionallythismethodrequireshighlycomplexandspecialistanalysis,leadingtohightimeandcapitalcosts.
RelevantScale: Precinct,LGAandSubregionLocation&Source: Byrne,J.&Sipe,N.,2010,Greenandopenspaceplanningforurbanconsolidation–areviewofthe
literatureandbestpractice,GriffithUniversityUrbanResearchProgramComments: Thismethodofanalysispresentsacompositeviewofdemandandsupplyofopenspacewithinanarea.It
providesthehighestlevelofdetailinregardtotheneedforopenspaceandrecreationalinfrastructureprovision,andbecomesusefulinconsolidationandintensificationsituationswherethereislimitedlandavailablefortheprovisionofopenspace,informingpotentialchangestoexistingopenspacetoachieveanoptimallevelofuseandcapability.

forCentralandSouthernSydney10
2.3 Housingaffordability
OutcomesTheintensificationofhousingactuallyimprovesaffordabilityatacitywidescaleandoverthelongtermbytheincreaseinoverallstock-andespeciallywherenewstockrespondstomarketneedforhousingsupplyinaccessiblelocationsthatenableresidentstoreducetransportandotherlivingcosts9.However,thebenefitsarenotspreadevenly,thereare‘losers’intheshort/mediumterminintensifiedlocalareaswherelowcoststockhasbeenlostandespeciallyforrenterswhodonotexperiencecapitalgain.Intheimmediateareathereislikelytobealowerproportiondwellingsavailableatpricesaffordableforlowerincomehouseholds.TheredevelopmentofexistinglowcosthousingisanissuewhichwasraisedduringtheSSROCworkshopwithcouncilplanners.Theissueoflocationwasdiscussed,highlightingtheneedforaffordablehousinginlocationsclosetoemployment,particularlyfor‘keyworkers’suchasnearhospitalprecincts.Aworkablegoalforhousingaffordabilityinthefaceofintensificationistomaintainorimprovetheproportionofstockthatisavailable(forrent)tolowincomehouseholds(including‘key’workers)intheareasimpactedandtoavoidconcentrationsofdisadvantage.Thisimpliesgeneratinganetincreaseinthestockofthelowerrenthousingavailabletoagrowingpopulation–assumingthereisanidentifiedneed.Thespecificoutcomecouldbeto:− Increasethesupplyofaffordablerentalaccommodationforlowincomehouseholds(andmiddle
incomeworkersinessentialactivities)ataratethatexceedsthegrowthinhouseholdsinalocalarea
− Ensureprovisionofaffordablerentalhousingdoesnotcreateconcentrationsofdisadvantage− Preservingtheshareofsocial(public)housingavailableforverylowincomehouseholdsand
additionalneedsgroupsTheUKpracticeofmandatingasignificantproportion(~30%)ofnewdwellingsinrenewalestatestobeavailabletolowincomehouseholdsisanexampleofgoodpractice.Thereisthepotentialforurbanintensificationprojectstocontributeacertainproportionofthedevelopmentasaffordablehousingoracontributioninlieutofundhousinginthevicinity.Thereareopportunitieswhereuplifthasoccurredthrougharezoningforvaluecaptureorconditionsforaffordablehousingtobeappliedtoadevelopment.Timingiscrucialinrelationtovaluecaptureassiteviabilitywillbeimpactedanddeveloperswillneedtofactorthisintothepurchasecostofland.Itisimportanttoreviewexistingapproachesandinternationalbenchmarkstoassesseffectivenessofimplementation,particularlytheuseoftargets.
ExistingbestpracticemeasuresThereisamixofexistingmeasuresrelatingtoboththeaffordabilityofhousingandthesupplyof‘affordablehousing’:− HousingStress-30:40Rule:ameasurementofthepopulationwhopayinggreaterthan30%oftheir
incomeinhousingcostsandwhofallinthebottom40%ofincomes.− HousingStress-ResidualIncome:ameasurementofwhatremainsofahousehold’sdisposable
incometomeetbasicneedsafterpayingforitshousingcosts.− Rental/HousingcoststoIncomes/CPI:aratioofthecostofhousingtoincomesortheconsumer
priceindex.− ProvisionofAffordableHousing:measurementofthelevelsofaffordablehousingbeingprovidedas
partofgovernmentorcommunityprogramswithinacertainarea.
9GrattanInstitute2011Thehousingwe’dchoose.

forCentralandSouthernSydney11
.AffordableHousingMeasure1:HousingStress-30:40Rule
Description: Ameasurementofthepopulationwhopayinggreaterthan30%oftheirincomeinhousingcostsandwhofallinthebottom40%ofincomes
Relevancetooutcome:
Medium
Dataoutput: Totalcountsofhouseholdsandproportionalsplit(%)Datainput(s): Datapertainingtomedianrentsandhousepricesisreadilyavailable,asisdataonrecentleasesandsalesof
propertiesatthelocalarealevel.LongitudinaldataisavailablefromtheHousing,IncomeandLabourDynamics(HILDA)survey.
RelevantScale: Precinct,LGAandSubregionLocation&Source: O’Flynn,L.,2011,Housingaffordabilitybriefingpaper,NSWParliamentaryLibraryResearchService
Gabrieletal,2005,Conceptualisingandmeasuringthehousingaffordabilityproblem,AustralianHousingandUrbanResearchInstitute
Comments: ThismeasurementhasbecomeastandardisedmeasurementofhousingstresswithinAustralia.Itcouldbeusedtoidentifythelevelsofhousingstresscurrentlybeingexperiencedwithinanareatodeterminewhichareascouldbemorevulnerabletoincreasesinpropertyvaluesduetointensificationprocesses.
AffordableHousingMeasure2:HousingStress-ResidualIncome
Description: Ameasurementofwhatremainsofahousehold’sdisposableincometomeetbasicneedsafterpayingforitshousingcosts.
Relevancetooutcome:
Medium
Dataoutput: Totalcountsofhouseholdsorproportionalsplit(%)–Hasamoderatetohighlevelofdifficultyininterpretation
Datainput(s): Dataisnotreadilyavailablefrompublishedsources,andwouldinvolveamorecomprehensivecollectionofdataandagreaterdegreeofanalysis.
RelevantScale: Precinct,LGAandSubregionLocation&Source: O’Flynn,L.,2011,Housingaffordabilitybriefingpaper,NSWParliamentaryLibraryResearchService
Gabrieletal,2005,Conceptualisingandmeasuringthehousingaffordabilityproblem,AustralianHousingandUrbanResearchInstitute
Comments: Theresidualincomemethodpresentsamoreaccuratedepictionofhousingstressthanthe30:40ruleduetothewayitaccountsforvariationsinhouseholdcomposition(andthereforeexpenditure).Thecostofcollectingandinterpretingthisthisdatamakesitlessapplicabletouse
AffordableHousingMeasure3:Rental/HousingcoststoIncomes/CPI
Description: AratioofthecostofhousingtoincomesortheconsumerpriceindexRelevancetooutcome:
Low
Dataoutput: Ratio–EasytointerpretDatainput(s): Dataforthismethodiseasytoobtainviacensusdataandfromvarioussourceswhichtrackandpublish
propertypricesandrentalcosts.RelevantScale: Precinct,LGA,SubregionandMetropolitanLocation&Source: O’Flynn,L.,2011,Housingaffordabilitybriefingpaper,NSWParliamentaryLibraryResearchServiceComments: Thismethodisrelativelyeasytoextrapolatefromthereadilyavailabledata,howeveritprovideslittle
nuanceinitspotentialanalysis,presentingarelativelyflatpictureofhousingunaffordabilitywithinanarea.

forCentralandSouthernSydney12
AffordableHousingMeasure4:ProvisionofAffordableHousing
Description: Measurementofthelevelsofaffordablehousingbeingprovidedaspartofgovernmentorcommunityprogramswithinacertainarea
Relevancetooutcome:
High
Dataoutput: Totalcountsorproportionalsplitofdwellings–EasytointerpretDatainput(s): Willrequiregatheringdataontheaffordablehousingprogramswithinaspecificarea–Dataiseasyand
cheaptoobtainRelevantScale: PrecinctandLGALocation&Source: Comments: Themonitoringofaffordablehousingprovisionrates(inconjunctionwithothermeasures)canbeusedto
identifywhichareasareinneedofanincreasedprovisionofaffordablehousingthroughprogramssupportedbystategovernment.
2.4 Accessibilitytocentresandemployment
OutcomesUrbanintensificationandgrowthcanoccurinareaswhereaccesstocentresandemployment,particularlybypublictransportisnotadequate.Newdevelopmentwillgeneratedemandfortraveltoworkandforlocalactivitiesthishasthepotentialtoleadtotrafficgrowthandcongestion.Giventhereiscommitmenttoaccommodategrowthinthedistrict,thekeyissueistherelativemeritofalocationforintensificationtomanagedemandfortheamountanddistanceoftravel.Itshouldenabletraveltobeundertakeninwaysthathavetheleastimpactoncongestionsuchasbywalking,cyclingandpublictransport.Thedesiredgoalforaccessibilityshouldbereflectedinoutcomesattwoscales:− Atadistrictscale,urbanintensificationandgrowthshouldbefocusedinareaswherethereis
goodaccesstodistrictcentresandemploymentespeciallybypublictransport− Atalocalorsuburbanscale,keycommunityfacilitiesshouldbefocusedinlocalcentresthatcan
bereadilyreachedbywalkingandactivetransportfromintensificationareaslocatedwithintheircatchment.
Theperformanceofurbanintensificationcouldbetrackedagainstwhetheritresultsin:− theincreaseofthetotalnumberandproportionofhouseholdsinthedistrictwithinsay30mins
fromcentresofemploymentbybothprivatevehicleandpublictransport− theincreaseinthetotalnumberandproportionofhouseholdswithinthewalkingcatchment(say
20mins)oflocalcentrecommunityfacilities.
ExistingbestpracticemeasuresExistingmeasuresinclude:− Publictransportprovision:adirectmeasurementofthelevelsofprovisionofpublictransportina
subjectarea,intermsofpopulation,householdsorareacovered− Serviceuptake:ameasurementofthelevelatwhichatransportserviceisusedrelativetoits
capacity− Modeshare:proportionalsplitbetweenvariousmodesoftransportwithinaspecificarea.− Relativeaccessibilitytoemployment:thedistancebetweentwosmallareageographies(placeof
employmentandresidence)appliedtoatimetravelmatrix

forCentralandSouthernSydney13
Intermsofmeasuringaccessibility,itisimportanttoidentifytowhataccessibilitywillbemeasured,forexampleemployment,transportnodesorcentres.Theideaofa20minuteneighbourhoodwasconsideredwherearesidentcanaccessaparticularproportionoftheirdailyneedswithin20minutesbywalkingorpublictransport.Modeshareisalsoimportantinrelationtoaccessandtargetscouldbesetfornewdevelopmentstoachieve.Thepotentialmeasureswhichcouldbeimplementedinclude:− Modesharetargetsfornewdevelopments− Settingatargetfortheproportionoftripswhichshouldbe‘local’orusingpedestrianshedsasa
measure− PointssystemfornewdevelopmentsbasedonpublictransporttripsandmodeshareThesemeasurescouldbeimplementedataprecinct,LGAordistrictlevel.ThemeasureswouldbemorefocussedandoutcomeorientediftheywereintegratedwithinaTransportManagementandAccessibilityPlan(TMAP)10foralocation.AccessibilityMeasure1:PublicTransportProvision
Description: Adirectmeasurementofthelevelsofprovisionofpublictransportinasubjectarea,intermsofpopulation,householdsorareacovered.
Relevancetooutcome:
High
Dataoutput: Proportion(%)ortotalcountsofunit(pop/households/area)servicedbypublictransport(basedonanappraisalofadequateserviceeg15minbusservicetonearestmajorcentre)–Easytointerpret,howeverthiswillrequireGISmodelling.Difficultyininterpretationincreaseswhendemographicfactorsareconsidered.
Datainput(s): Dataisreadilyavailable,withpopulation&employmentcounts/forecastspublishedbyBTSatthetravelzonelevelanddataobtainableregardinglocationofpublictransportstops.Demographicdatacanalsobeintegratedintothisanalysistodetermineamoredetailed,needs-basedanalysis.
RelevantScale: Precinct,LGAandSubregionLocation&Source: Comments: Thismeasurementcanbeusedtoidentifydeficienciesinorareasofhighpublictransportprovisionin
regardstosuitabilityforurbanintensification,aswellasbeingusedovertimeinalongitudinaldatasettodeterminetheimpactsofintensificationonlocalorsubregionaltransportnetworks.Avariedlevelofdetailcanbeincludedinthisanalysisthroughtheinclusionofdemographicdatapertainingtocommunitygroupswhichhavegreaterneedsforpublictransportservices.
AccessibilityMeasure2:ServiceUptake
Description: AmeasurementofthelevelatwhichatransportserviceisusedrelativetoitscapacityRelevancetooutcome:
Medium
Dataoutput: Percentageoftotalcapacitywithinamodeoftransportalongaspecificrouteorinaspecificarea–Moderatetohighdifficultytointerpret.
Datainput(s): Datawillnotlikelybeeasytoobtainathighlevelsofaccuracy,asitwillrequiredirectlytakingmeasurementsoftherateatwhichaserviceisused.Generalisedobservationsregardingcongestioncanbemadeeasily,howeverthisreducesthevalueofthedata.
RelevantScale: PrecinctandLGALocation&Source: Comments: Thismeasurementallowsfortheidentificationofpartsofthetransportnetworkwhichhaveavailable
capacityorareexperiencingstress,whichcanthenfeedintodecisionmakingregardingareasbestsuitedtointensificationorimprovementsinthetransportnetwork.ThehighcostofobtainingdatadirectlywilllikelyprecludethismethodfrombeingundertakenbymostLGAs,howeveritremainspossibletoidentifyareasofhighcongestion/lowavailablecapacitytothenundertakedetaileddatacollection.
10TMAPGuidelines(TFNSWundated)http://www.transport.nsw.gov.au/sites/default/files/b2b/abouttrans/trans-management-accessibility-plans.pdf

forCentralandSouthernSydney14
AccessibilityMeasure3:ModeShare
Description: Proportionalsplitbetweenvariousmodesoftransportwithinaspecificarea.Relevancetooutcome:
High
Dataoutput: Proportion(%)ofpersonsutilisingeachdifferentmodeoftransport.Thedataisofmoderatetolowdifficultytointerpret.
Datainput(s): BTSpublishesresultsfromitsHouseholdTravelSurveyfreeofchargeontheirwebsiteattheLGAlevel,howeversmallerstatisticalgeographiesmaybeobtainablefromBTSuponrequest.
RelevantScale: LGA,SubregionandMetropolitanLocation&Source: Comments: Theproportionalsplitbetweendifferentmodesoftransportisasimplemeasuretoaccesswhichincursvery
littlecost.Thismeasurecanbeusedtoidentifyareaswhichhaveoverallhigherorloweruseofpublictransport,andtherebygiveafocusforpotentialupgradesormodificationstothepublictransportnetwork,ortoencouragegreaterlevelsofcyclingorwalking.
AccessibilityMeasure4:RelativeAccessibilitytoEmployment
Description: Thedistancebetweentwosmallareageographies(placeofemploymentandresidence)appliedtoatimetravelmatrix.
Relevancetooutcome:
High
Dataoutput: Amountofjobsaccessiblefromacertainlocationwithinadeterminedcutofftimeperiod.Dataisnothardtointerpretwhenproduced.
Datainput(s): DatapertainingtoemploymentcountsandforecastsisavailablefromBTS,howeverdatapertainingtothetraveltimematrixofthecityismoredifficulttoobtainandwillrequireahighdegreeofspecialistknowledgetoreproduceaccurately.
RelevantScale: Precinct,LGA,SubregionandMetropolitanLocation&Source: Comments: Relativeaccessibilitytoemploymentpresentsameasurementofhowmanyjobsareaaccessibletoaspecific
locationusingeitherpublicorprivatetransport.Thismeasureisusefulforassessingtowhatextentanareahasaccesstoadiverserangeofjobopportunities,andcouldbeusedtoidentifyareassuitable/unsuitableforintensificationwithorwithouttransportationimprovementsortobeimplemented.Thisanalysishaspotentialtoincludedemographicfactors,aswellasdatapertainingtospatialvariationsinemployment.
2.5 Parking
OutcomesUrbanintensificationwillplacepressureonexistingparkingspacesandgeneratedemandgrowthforparkingspacesforarangeofusesincludingresidentialcarstorage,accesstoretail/communityfacilities,employmentandfordeliveries.Itisimportantthatthelevelofsupplyofparkingdoesnotgenerateunnecessarytraveldemandbutprovidesasufficientlevelofparkingtosupportthefunctionsofthelocation.Itiscounterproductivetomatchparkingsupplywithdemandfromintensificationinaccessibleprecincts–especiallywhendemandestimatesarebasedonformulaederivedfromlowdensityandlowaccessibilitysettings.Correctionfactorsweightedforaccessibilityareoftenappliedtoensurethatsufficientminimumparkingisavailabletosupportlocalfunctions,butoverprovisionwiththepotentialtogenerateexcessivetravelisavoidedbylimitingmaximumparkingsupply.Thisconcepthasbeenwidelyappliedforresidentialandmostcommercialdevelopment–butlesssoforretailparkingprovision.Sydney’smetropolitanstrategieshavepreviouslyidentifiedanegativefeedbackbetweenresidentialparkingprovisionandtheaffordabilityofnewresidentialunitandtownhousedevelopmentduetothespaceandexcavationconstructioncostsforparking.

forCentralandSouthernSydney15
Theoverallgoalshouldbetoachievelevelofparkingsupplyandavailabilitywhichdoesnotgenerateunnecessarytraveldemand,howeverprovidesasufficientlevelofparkingtosupportthefunctionsofthelocation.Achievingthisgoalandapplyingappropriateparkingstandardswouldrequireunderstandingandmeasuring:− thefunctionsofaprecinctundergoingintensificationwithrespecttotheroleandoperationof
residentialandcommercial/retailprecincts− therelativeaccessibilityandavailabilityoftransportchoice(i.e.publictransportconnectivity)− reviewofthepricinganddurationofon-streetparkingspacesThepreparationofaTransportManagementandAccessibilityPlan(TMAP)forrenewalprecinctswouldprovideacontextandrationaleforapplyingarelevantparkingsupplyregimeforanintensificationprecinct.Thiswouldincludeaweightingonparkingsupplyrequirementsdependingonthelevelofaccessibility.
ExistingbestpracticemeasuresParkingMeasure1:Provisionofparkinginnewdevelopment
Description: Therateofprovisionofparkinginnewdevelopmentsaspartofanintensificationprocess.Relevancetooutcome:
High
Dataoutput: Carspacesperdwelling–EasytointerpretDatainput(s): DataiseasytoobtainforlocalgovernmentauthoritiesRelevantScale: PrecinctandLGALocation&Source: ShouldreferenceaprecinctTMAPComments: Therateofcarparkingprovisioninnewdevelopmentsgreatlyinfluencesthecarownershipoftheresidents.
Inareasofhighaccessibilityandconnectivityofpublictransport,thereducedratesofcarparkingprovisioncanreducetheusageofprivateautomobilesbothlocallyandregionally.Bestpracticeparkingratesfornewdevelopmentexpressbothminimumandmaximumprovision.
ParkingMeasure2:Publictransportprovisionfornewdevelopments
Description: Theaccessibilityandconnectivityofpublictransportationinproximitytonewdevelopments/areasofintensification.
Relevancetooutcome:
Medium
Dataoutput: Totalnumbersorproportionsofhouseholdsbyqualityofthepublictransportoptionsavailabletothem–Dataisofmoderatetohighdifficultyinitsinterpretation
Datainput(s): Numberofnewdwellingsandtheirlocation,alongwithpublictransportprovisionintheseareas–dataonthenewdwellingswillbeeasytoobtain,howeverthetransportationdatawillbeofgreater(andlikelycost)toobtainandmanipulate.
RelevantScale: Precinct,LGAandSubregionLocation&Source: ShouldreferenceaprecinctTMAPandrespondandinfluenceabroaderdistricttransitservicingstrategy.Comments: Developmentawayfromeffectivepublictransportaccesscreatesorreinforcescardependencywithinthose
areas.Ratherthansimplyexaminingtheproximitytopublictransportofadevelopment,theconnectivityofthepublictransportservices,particularlytonearbylocalcentresandemployment,isofrelevancetoreducingdemandforparkingintheseareas.

forCentralandSouthernSydney16
2.6 Schoolsandothereducationfacilities
OutcomesPopulationincreasewillplacepressureonexistingfacilities,alongsideneweducationdemands.ThekeyfocusofthediscussionwithSSROCcouncilplannerswastheprovisionoflocalprimaryschoolsandissuesassociatedwithincreasingcatchmentsofexistingschools,particularlyalackofwalkabilityandpressuresplacedonroadinfrastructure.Thecouncilplannersobservedthattherearesubstantiallandcostandsiteavailabilityconstraintsforacquiringnewschoolswithsubstantialgrounds.Statepublicschoolprovisionratiosarebasedoneithertheschoolagepopulationornumberofdwellingsandthereareavarietyofratioswhichhavebeenidentifiedforarangeofnewprecinctsorgreenfieldgrowthareas.However,theseratioscannotbereadilyappliedinexistingurbanareasinbecauseofboththetakeupofindependentschoolcapacityandthelevelofacceptanceofnewmodelsforhighdensity(evenhighrise)schoolsneedstobetakenintoaccount.Newresidentsofintensificationareasmaybemorelikelytoacceptatrade-offforamoreconfinedpublicschoolsettingassumingthatopenspaceandhighqualityeducationfacilitieswereavailableandhighlyaccessible.Thistrade-offislesslikelytobeacceptabletoexistingresidentswhoexperiencetheexpansionofclassroomsandde-mountablesoverexistingschoolgrounds.Akeygoalforliveabilitywillbethe‘adequate’provisionoflocalprimaryschools(andclassroomspace)tomeetdemandcreatedbypopulationgrowthandchangingdemographicsatthelocallevel.Achievingthegoalofadequateprovisionshouldbedeterminednotonlybynominalprovisionrates(e.g.ratiosofpopulationperschool)butalsoconsiderationof:− Localaccessibility–‘ped-sheds’asameasureforlocalprimaryschoolwalkablecatchments− Needsbasedassessmentreferringtoexistingandnewpopulationexpectations− Availabilityofopportunitiesforshareduseofexternalfacilitiesforconfinedschools(e.g.open
space,planningfields,halls,libraries/resourcecentres)Thissuggestsanintegratedassessmentofneedsandschoolcapacityandavailablefacilitiesalongsidetheapplicationofconventionalratios.Thisassessmentshouldbeundertakenatadistrictscale–withadditionalemphasisontheneedsandpreferencesofnewresidentsoflocalintensificationareas.
Existingbestpracticemeasures

forCentralandSouthernSydney17
EducationMeasure1:VictorianGrowthAreasAuthorityGuidetoSocialInfrastructurePlanning
Description: • Level1-Provisionratiosupto10,000people-GovernmentPrimarySchools(includingoutofschoolshourscare)/EarlyYearsFacility,1CouncilCommunityCentres/EarlyYearsFacility/NeighbourhoodHouse,LongDayChildCareCentres
• Level2-Provisionratiosbetween10,000and30,000people–Level1,GovernmentSecondarySchoolsCatholicPrimarySchools
• Level3-Provisionratiosbetween30,000and60,000people–Level1,Level2,CatholicSecondarySchools,Otherindependentschools
Relevancetooutcome:
Medium(preparedforgreenfieldareas)
Dataoutput: Therearefivelevelsofcommunityinfrastructureprovisionbasedonpopulationsize.Thereisaclearindicationofthesocialinfrastructureprovisionrequiredforeachlevelofpopulationincrease.Easytounderstand,providesforprimaryandsecondaryeducation
Datainput(s): Numberofpeopleinaprecinct(canbescaleduptoLGA)RelevantScale: PrecinctorLGALocation&Source: WyndhamCityCouncil(outerMelbourne):http://www.mpa.vic.gov.au/wp-
content/Assets/Files/Planning_for_Community_Infrastructure_in_Growth_Areas_Apr08.pdfComments: Thismetricisusedforgreenfielddevelopment.EducationMeasure2:GreenSquareSocialInfrastructureProvisionReport(2014)
Description: SGSreportforCityofSydneyregardingsocialinfrastructurebenchmarksinGreenSquare.1primaryschoolfor500students.1governmenthighschoolforupto1,200students1TAFEtocaterforapopulationof300,000–500,0001universityforevery150,000people
Relevancetooutcome:
High
Dataoutput: Easytounderstand.Providesforprimary,secondaryandtertiaryeducationDatainput(s): Basedonnumberofstudents–needtoknowthenumberofstudentsforecastedforurbanrenewalprojectsRelevantScale: PrecinctLocation&Source: GreenSquare,SGSreportlocatedhereComments: BasedonbenchmarksforVIC,QLD,andACT
Assumes100%ofstudentsareenrolledinGovernmentschools.EducationMeasure3:ACTDesiredStandardsofService
Description: 1preschoolforevery5,000population.1publicprimaryschoolforevery7,500population.1publichighschool(years7-10)forevery20,000population.1publicsecondarycollege(years11-12)forevery30,000population.1specialschoolforevery60,000population
Relevancetooutcome:
High
Dataoutput: Simplebenchmark,providesforprimaryandsecondaryeducationlevelsDatainput(s): BasedoffpopulationsizeRelevantScale: UnclearLocation&Source: ACTComments: Fromanunpublisheddocument.CitedbySGSinGreenSquaresocialinfrastructureplanningproject,found
here.
forCentralandSouthernSydney18
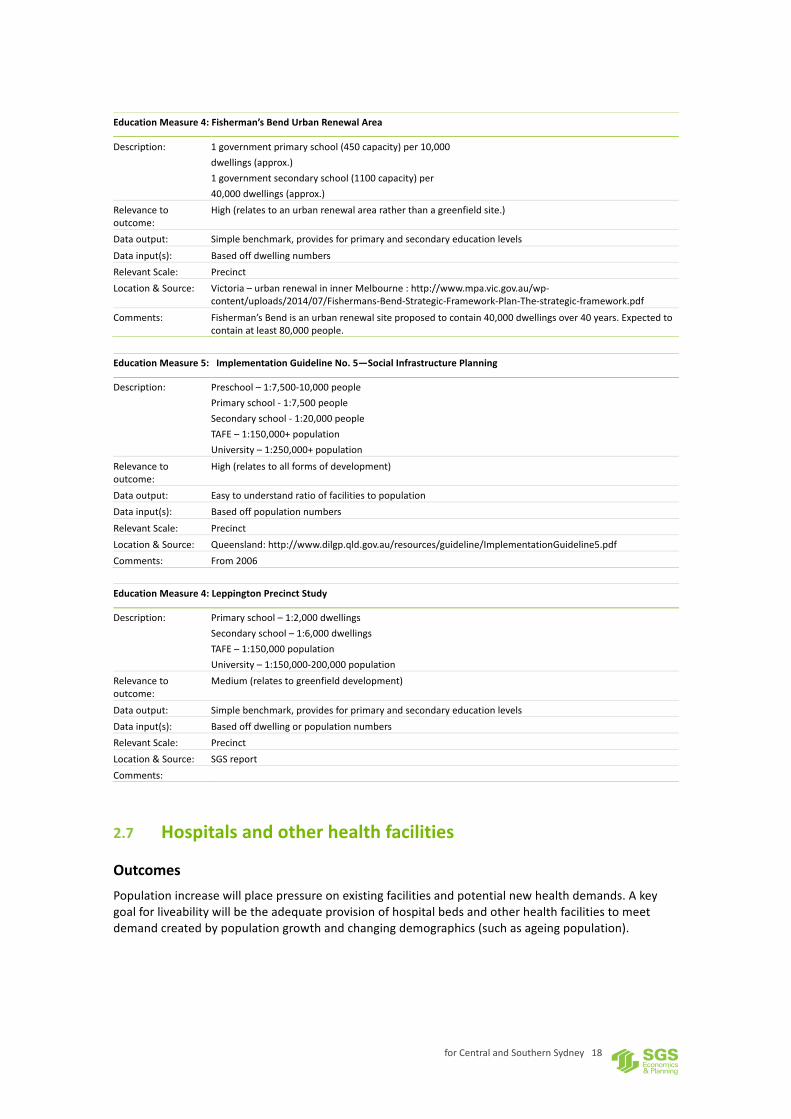
EducationMeasure4:Fisherman’sBendUrbanRenewalArea
Description: 1governmentprimaryschool(450capacity)per10,000dwellings(approx.)1governmentsecondaryschool(1100capacity)per40,000dwellings(approx.)
Relevancetooutcome:
High(relatestoanurbanrenewalarearatherthanagreenfieldsite.)
Dataoutput: Simplebenchmark,providesforprimaryandsecondaryeducationlevelsDatainput(s): BasedoffdwellingnumbersRelevantScale: PrecinctLocation&Source: Victoria–urbanrenewalininnerMelbourne:http://www.mpa.vic.gov.au/wp-
content/uploads/2014/07/Fishermans-Bend-Strategic-Framework-Plan-The-strategic-framework.pdfComments: Fisherman’sBendisanurbanrenewalsiteproposedtocontain40,000dwellingsover40years.Expectedto
containatleast80,000people.EducationMeasure5:ImplementationGuidelineNo.5—SocialInfrastructurePlanning
Description: Preschool–1:7,500-10,000peoplePrimaryschool-1:7,500peopleSecondaryschool-1:20,000peopleTAFE–1:150,000+populationUniversity–1:250,000+population
Relevancetooutcome:
High(relatestoallformsofdevelopment)
Dataoutput: EasytounderstandratiooffacilitiestopopulationDatainput(s): BasedoffpopulationnumbersRelevantScale: PrecinctLocation&Source: Queensland:http://www.dilgp.qld.gov.au/resources/guideline/ImplementationGuideline5.pdfComments: From2006EducationMeasure4:LeppingtonPrecinctStudy
Description: Primaryschool–1:2,000dwellingsSecondaryschool–1:6,000dwellingsTAFE–1:150,000populationUniversity–1:150,000-200,000population
Relevancetooutcome:
Medium(relatestogreenfielddevelopment)
Dataoutput: Simplebenchmark,providesforprimaryandsecondaryeducationlevelsDatainput(s): BasedoffdwellingorpopulationnumbersRelevantScale: PrecinctLocation&Source: SGSreportComments:
2.7 Hospitalsandotherhealthfacilities
OutcomesPopulationincreasewillplacepressureonexistingfacilitiesandpotentialnewhealthdemands.Akeygoalforliveabilitywillbetheadequateprovisionofhospitalbedsandotherhealthfacilitiestomeetdemandcreatedbypopulationgrowthandchangingdemographics(suchasageingpopulation).
forCentralandSouthernSydney19
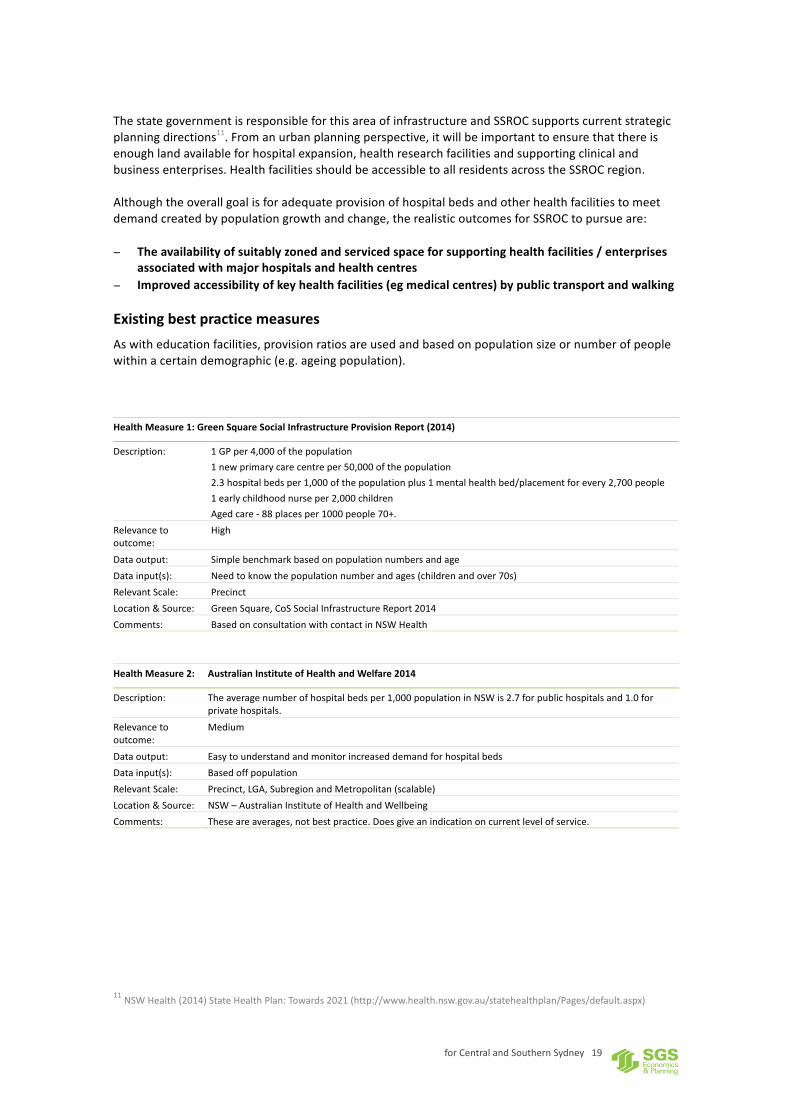
ThestategovernmentisresponsibleforthisareaofinfrastructureandSSROCsupportscurrentstrategicplanningdirections11.Fromanurbanplanningperspective,itwillbeimportanttoensurethatthereisenoughlandavailableforhospitalexpansion,healthresearchfacilitiesandsupportingclinicalandbusinessenterprises.HealthfacilitiesshouldbeaccessibletoallresidentsacrosstheSSROCregion.Althoughtheoverallgoalisforadequateprovisionofhospitalbedsandotherhealthfacilitiestomeetdemandcreatedbypopulationgrowthandchange,therealisticoutcomesforSSROCtopursueare:− Theavailabilityofsuitablyzonedandservicedspaceforsupportinghealthfacilities/enterprises
associatedwithmajorhospitalsandhealthcentres− Improvedaccessibilityofkeyhealthfacilities(egmedicalcentres)bypublictransportandwalking
ExistingbestpracticemeasuresAswitheducationfacilities,provisionratiosareusedandbasedonpopulationsizeornumberofpeoplewithinacertaindemographic(e.g.ageingpopulation).HealthMeasure1:GreenSquareSocialInfrastructureProvisionReport(2014)
Description: 1GPper4,000ofthepopulation1newprimarycarecentreper50,000ofthepopulation2.3hospitalbedsper1,000ofthepopulationplus1mentalhealthbed/placementforevery2,700people1earlychildhoodnurseper2,000childrenAgedcare-88placesper1000people70+.
Relevancetooutcome:
High
Dataoutput: SimplebenchmarkbasedonpopulationnumbersandageDatainput(s): Needtoknowthepopulationnumberandages(childrenandover70s)RelevantScale: PrecinctLocation&Source: GreenSquare,CoSSocialInfrastructureReport2014Comments: BasedonconsultationwithcontactinNSWHealthHealthMeasure2: AustralianInstituteofHealthandWelfare2014
Description: Theaveragenumberofhospitalbedsper1,000populationinNSWis2.7forpublichospitalsand1.0forprivatehospitals.
Relevancetooutcome:
Medium
Dataoutput: EasytounderstandandmonitorincreaseddemandforhospitalbedsDatainput(s): BasedoffpopulationRelevantScale: Precinct,LGA,SubregionandMetropolitan(scalable)Location&Source: NSW–AustralianInstituteofHealthandWellbeingComments: Theseareaverages,notbestpractice.Doesgiveanindicationoncurrentlevelofservice.
11NSWHealth(2014)StateHealthPlan:Towards2021(http://www.health.nsw.gov.au/statehealthplan/Pages/default.aspx)
forCentralandSouthernSydney20
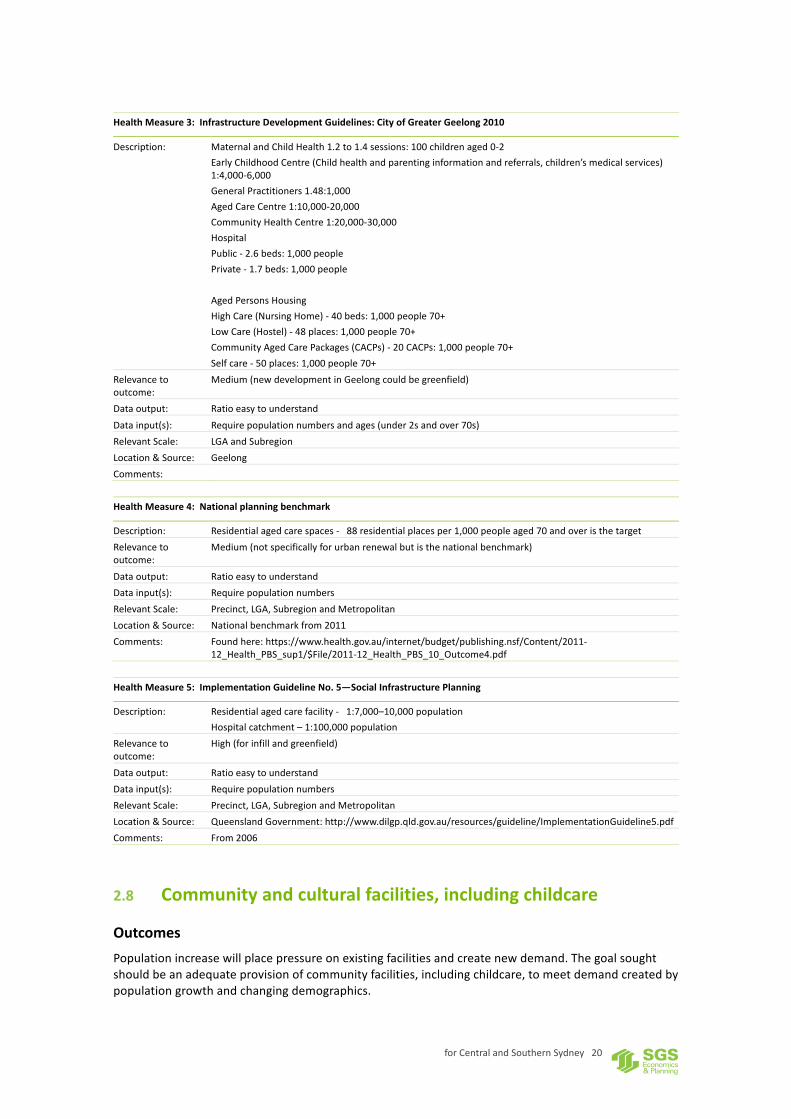
HealthMeasure3:InfrastructureDevelopmentGuidelines:CityofGreaterGeelong2010
Description: MaternalandChildHealth1.2to1.4sessions:100childrenaged0-2EarlyChildhoodCentre(Childhealthandparentinginformationandreferrals,children’smedicalservices)1:4,000-6,000GeneralPractitioners1.48:1,000AgedCareCentre1:10,000-20,000CommunityHealthCentre1:20,000-30,000HospitalPublic-2.6beds:1,000peoplePrivate-1.7beds:1,000peopleAgedPersonsHousingHighCare(NursingHome)-40beds:1,000people70+LowCare(Hostel)-48places:1,000people70+CommunityAgedCarePackages(CACPs)-20CACPs:1,000people70+Selfcare-50places:1,000people70+
Relevancetooutcome:
Medium(newdevelopmentinGeelongcouldbegreenfield)
Dataoutput: RatioeasytounderstandDatainput(s): Requirepopulationnumbersandages(under2sandover70s)RelevantScale: LGAandSubregionLocation&Source: GeelongComments: HealthMeasure4:Nationalplanningbenchmark
Description: Residentialagedcarespaces-88residentialplacesper1,000peopleaged70andoveristhetargetRelevancetooutcome:
Medium(notspecificallyforurbanrenewalbutisthenationalbenchmark)
Dataoutput: RatioeasytounderstandDatainput(s): RequirepopulationnumbersRelevantScale: Precinct,LGA,SubregionandMetropolitanLocation&Source: Nationalbenchmarkfrom2011Comments: Foundhere:https://www.health.gov.au/internet/budget/publishing.nsf/Content/2011-
12_Health_PBS_sup1/$File/2011-12_Health_PBS_10_Outcome4.pdfHealthMeasure5:ImplementationGuidelineNo.5—SocialInfrastructurePlanning
Description: Residentialagedcarefacility-1:7,000–10,000populationHospitalcatchment–1:100,000population
Relevancetooutcome:
High(forinfillandgreenfield)
Dataoutput: RatioeasytounderstandDatainput(s): RequirepopulationnumbersRelevantScale: Precinct,LGA,SubregionandMetropolitanLocation&Source: QueenslandGovernment:http://www.dilgp.qld.gov.au/resources/guideline/ImplementationGuideline5.pdfComments: From2006
2.8 Communityandculturalfacilities,includingchildcare
OutcomesPopulationincreasewillplacepressureonexistingfacilitiesandcreatenewdemand.Thegoalsoughtshouldbeanadequateprovisionofcommunityfacilities,includingchildcare,tomeetdemandcreatedbypopulationgrowthandchangingdemographics.
forCentralandSouthernSydney21
LocalcouncilswithinSSROCwillneedtoworkwiththestategovernmenttoensurethereisadequateprovisionofcommunityfacilitiesacrosseachlocalareaandthedistrict.Existings94planningregimeshaveestablishedmethodologiesforthistask.Provisionratiosarewidelyusedtodetermineexistingandfutureneedandarebasedontotalpopulationoraspecificdemographicsuchaschildrenagedbetween0-5yearsforchildcare.However,newcommunitiesinhigherdensityareasarelikelytoemphasisedifferentormulti-usefacilityneedsespeciallylocallyaccessibleculturalfacilities,recreationandresourcescentrestoimprovetheirqualityoflife.Aneedsbasedassessmentwouldbeneededtodiscernthetypeoffacilitiesvaluedbynewandexistingcommunities.Theoutcomessoughtcouldinclude:− Responsetoaneedsbasedassessmentfortypesofcommunityandculturalfacilitiestargeting
newandexistingresidents− Improvingpopulationaccesstocommunityfacilities-usingpedshedandtransitconnectivityasa
measureforaccessibilityofcommunityandculturalfacilities− Maintainingorimprovingexistingratiosofpopulationpercommunityand/orculturalfacility.
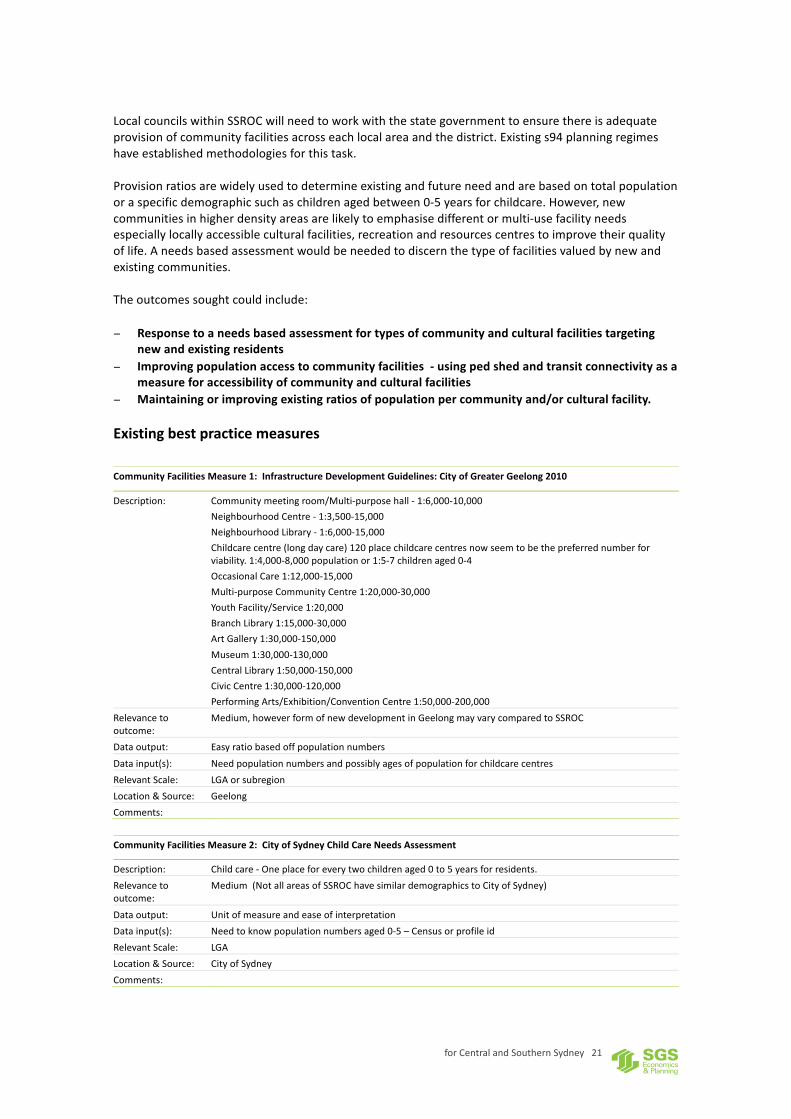
ExistingbestpracticemeasuresCommunityFacilitiesMeasure1:InfrastructureDevelopmentGuidelines:CityofGreaterGeelong2010
Description: Communitymeetingroom/Multi-purposehall-1:6,000-10,000NeighbourhoodCentre-1:3,500-15,000NeighbourhoodLibrary-1:6,000-15,000Childcarecentre(longdaycare)120placechildcarecentresnowseemtobethepreferrednumberforviability.1:4,000-8,000populationor1:5-7childrenaged0-4OccasionalCare1:12,000-15,000Multi-purposeCommunityCentre1:20,000-30,000YouthFacility/Service1:20,000BranchLibrary1:15,000-30,000ArtGallery1:30,000-150,000Museum1:30,000-130,000CentralLibrary1:50,000-150,000CivicCentre1:30,000-120,000PerformingArts/Exhibition/ConventionCentre1:50,000-200,000
Relevancetooutcome:
Medium,howeverformofnewdevelopmentinGeelongmayvarycomparedtoSSROC
Dataoutput: EasyratiobasedoffpopulationnumbersDatainput(s): NeedpopulationnumbersandpossiblyagesofpopulationforchildcarecentresRelevantScale: LGAorsubregionLocation&Source: GeelongComments: CommunityFacilitiesMeasure2:CityofSydneyChildCareNeedsAssessment
Description: Childcare-Oneplaceforeverytwochildrenaged0to5yearsforresidents.Relevancetooutcome:
Medium(NotallareasofSSROChavesimilardemographicstoCityofSydney)
Dataoutput: UnitofmeasureandeaseofinterpretationDatainput(s): Needtoknowpopulationnumbersaged0-5–CensusorprofileidRelevantScale: LGALocation&Source: CityofSydneyComments:

forCentralandSouthernSydney22
CommunityFacilitiesMeasure3:
Description: Level1Provisionratiosupto10,000people• Level1CouncilCommunityCentres/EarlyYearsFacility/NeighbourhoodHouse• Longdaycarechildcarecentres
Level2Provisionratiosbetween10,000and30,000people• CouncilCommunityCentres/EarlyYearsFacility/NeighbourhoodHouses• Loworderchildcarefacilities• OccasionalChildCare(aspartofeveryneighbourhoodhouseandleisurecentre)• Loworderyouthfacilities
Level3Provisionratiosbetween30,000and60,000people• 1multipurposecommunityfacility(couldcontainamixofthesefacilitieslisted)• 1library• 1communityartscentres• HighOrderDedicatedYouthFacilities• Level3CouncilCommunityCentres• Deliveredmealsfacility• 1publicartproject• 1performingartsfacility
Relevancetooutcome:
Medium
Dataoutput: UnitofmeasureandeaseofinterpretationDatainput(s): Availability&quality/costofnecessarydatainputsRelevantScale: Precinct/LGA/Subregion/MetropolitanLocation&Source: e.g.Auckland(referRef)Comments: CommunityFacilitiesMeasure3:SGSAucklandlibrarieswork
Description: Libraries-41squaremetersper1,000peopleRelevancetooutcome:
Medium
Dataoutput: UnitofmeasureandeaseofinterpretationDatainput(s): Availability&quality/costofnecessarydatainputsRelevantScale: Precinct/LGA/Subregion/MetropolitanLocation&Source: e.g.Auckland(referRef)Comments: CommunityFacilitiesMeasure5:BankstownAreaPlans
Description: Youthfacilities–1per20,000peopleCommunitycentre(local)–1per6,000peopleCommunitycentre(district)–1per20,000peopleBranchlibrary–1per33,000peopleDistrictlibrary–1per40,000people
Relevancetooutcome:
Medium
Dataoutput: UnitofmeasureandeaseofinterpretationDatainput(s): Availability&quality/costofnecessarydatainputsRelevantScale: Precinct/LGA/Subregion/MetropolitanLocation&Source: BankstownCouncil
https://www.bankstown.nsw.gov.au/index.aspx?NID=216Comments: FromneedsanalysispreparedbyEltonConsulting

forCentralandSouthernSydney23
2.9 Precinctsustainability
OutcomeThereisanincreasingexpectationthathighintensitylivingshouldbeaccompaniedbysuperiorenvironmentalperformance.KogarahtowncentreandCentralParkaregoodexamples.Thegoalisforenvironmentalcoststobeminimisedandtheenvironmentalperformanceofaprecincttobeimprovedoverallasaresultofnewdevelopmentandgrowth.
ExistingbestpracticemeasuresExistingprecinctsustainabilitymeasurementapproachesinclude:− GreenStarCommunities:ratingsystemforthesustainabilityofaprecinct,canbegreenfieldor
urbanrenewal.Thetoolhasaholisticapproachtosustainability,consideringenvironmental,economic,socialandgovernanceinitiativesincludedinthedevelopment.
− Ecologicalfootprint:calculateslandandwaterareaacityrequirestoproducetheresourcesitconsumesandtoabsorbitswastes
− PRECINX:modelspotentialenvironmental,economicandasocialimpactsofadevelopment.− Specificgoals:modelspotentialenvironmental,economicandasocialimpactsofadevelopment.Thepotentialmeasureswhichcouldbeimplementedinclude:− PRECINXtooltoassesssustainabilityofadevelopmentataprecinctlevel(requiringacertain
performancestandardforintensificationprecincts− SettailoredprecincttargetsinrelationtoarangeofrelevantenvironmentalperformancemetricsSustainabilityMeasure1:GreenStarCommunities
Description: Ratingsystemforthesustainabilityofaprecinct,canbegreenfieldorurbanrenewal.Thetoolhasaholisticapproachtosustainability,consideringenvironmental,economic,socialandgovernanceinitiativesincludedinthedevelopment.Inparticular,environmentalconsiderationsare:
• Protectingnaturalandculturalheritage• Promotingbiodiversity• Reducingecologicalfootprint• ReducingGHGemissionsandpollutants• Environmentallyefficientsystems(water,energyetc.)andresourceefficiency
Creditsareawardedforeachcriteriamet(seepage12oflocalgovernmentguide)Relevancetooutcome:
High
Dataoutput: Rating,need4(BestPractice),5(AustralianExcellence)or6stars(WorldLeadership)tobeworthwhile(1to3starsnotreported)
Datainput(s): Alotofworkandcost,submissiontotheGreenBuildingCouncilofAustralia.ThereisasubmissionprocesstotheGreenBuildingCouncil,whichinvolvesmultipleroundsandseveraldocuments.Dataneedstocomefromawideofsourcestodevelopacomprehensiveviewofsustainability.
RelevantScale: PrecinctLocation&Source: GreenBuildingCouncilofAustralia:
https://www.gbca.org.au/uploads/152/2712/GBCA015_Framework_Final_SinglePages.pdfGuideforlocalgovernment:https://www.gbca.org.au/uploads/189/2749/Green_Star_Communities_Guide_for_Local_Government_For_Web.pdf
Comments: Labourintensive
forCentralandSouthernSydney24
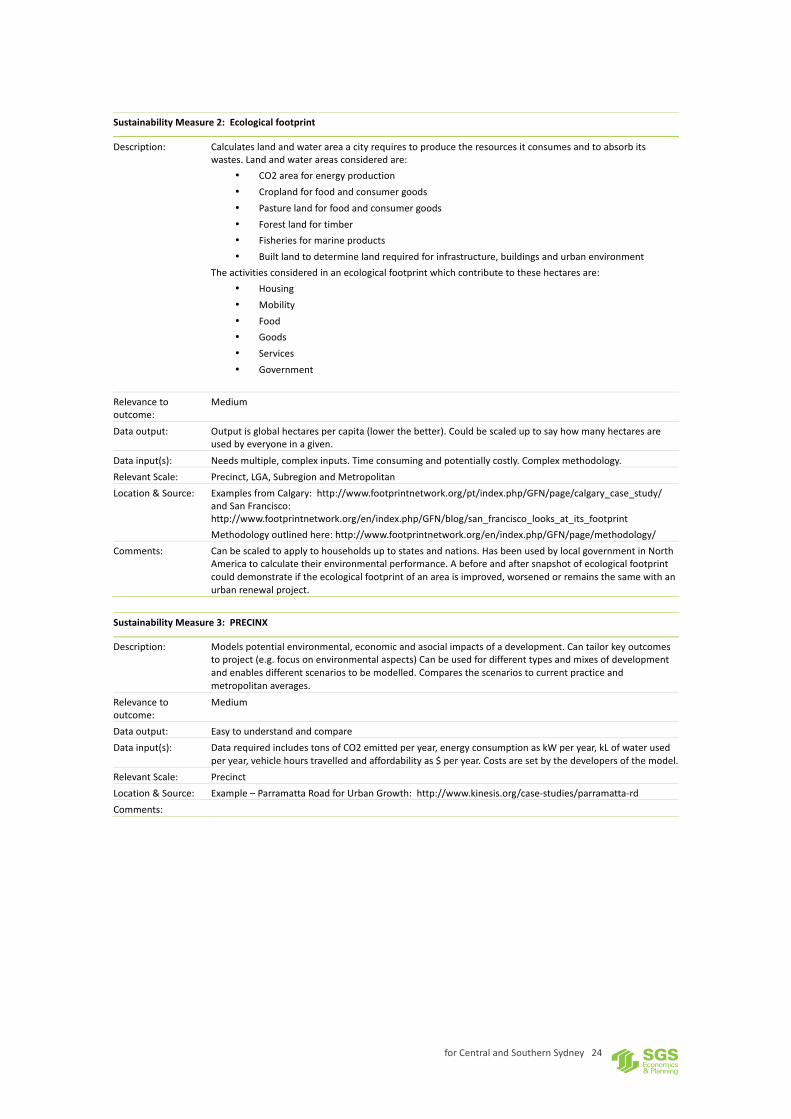
SustainabilityMeasure2:Ecologicalfootprint
Description: Calculateslandandwaterareaacityrequirestoproducetheresourcesitconsumesandtoabsorbitswastes.Landandwaterareasconsideredare:
• CO2areaforenergyproduction• Croplandforfoodandconsumergoods• Pasturelandforfoodandconsumergoods• Forestlandfortimber• Fisheriesformarineproducts• Builtlandtodeterminelandrequiredforinfrastructure,buildingsandurbanenvironment
Theactivitiesconsideredinanecologicalfootprintwhichcontributetothesehectaresare:• Housing• Mobility• Food• Goods• Services• Government
Relevancetooutcome:
Medium
Dataoutput: Outputisglobalhectarespercapita(lowerthebetter).Couldbescaleduptosayhowmanyhectaresareusedbyeveryoneinagiven.
Datainput(s): Needsmultiple,complexinputs.Timeconsumingandpotentiallycostly.Complexmethodology.RelevantScale: Precinct,LGA,SubregionandMetropolitanLocation&Source: ExamplesfromCalgary:http://www.footprintnetwork.org/pt/index.php/GFN/page/calgary_case_study/
andSanFrancisco:http://www.footprintnetwork.org/en/index.php/GFN/blog/san_francisco_looks_at_its_footprintMethodologyoutlinedhere:http://www.footprintnetwork.org/en/index.php/GFN/page/methodology/
Comments: Canbescaledtoapplytohouseholdsuptostatesandnations.HasbeenusedbylocalgovernmentinNorthAmericatocalculatetheirenvironmentalperformance.Abeforeandaftersnapshotofecologicalfootprintcoulddemonstrateiftheecologicalfootprintofanareaisimproved,worsenedorremainsthesamewithanurbanrenewalproject.
SustainabilityMeasure3:PRECINX
Description: Modelspotentialenvironmental,economicandasocialimpactsofadevelopment.Cantailorkeyoutcomestoproject(e.g.focusonenvironmentalaspects)Canbeusedfordifferenttypesandmixesofdevelopmentandenablesdifferentscenariostobemodelled.Comparesthescenariostocurrentpracticeandmetropolitanaverages.
Relevancetooutcome:
Medium
Dataoutput: EasytounderstandandcompareDatainput(s): DatarequiredincludestonsofCO2emittedperyear,energyconsumptionaskWperyear,kLofwaterused
peryear,vehiclehourstravelledandaffordabilityas$peryear.Costsaresetbythedevelopersofthemodel.RelevantScale: PrecinctLocation&Source: Example–ParramattaRoadforUrbanGrowth:http://www.kinesis.org/case-studies/parramatta-rdComments:
forCentralandSouthernSydney25
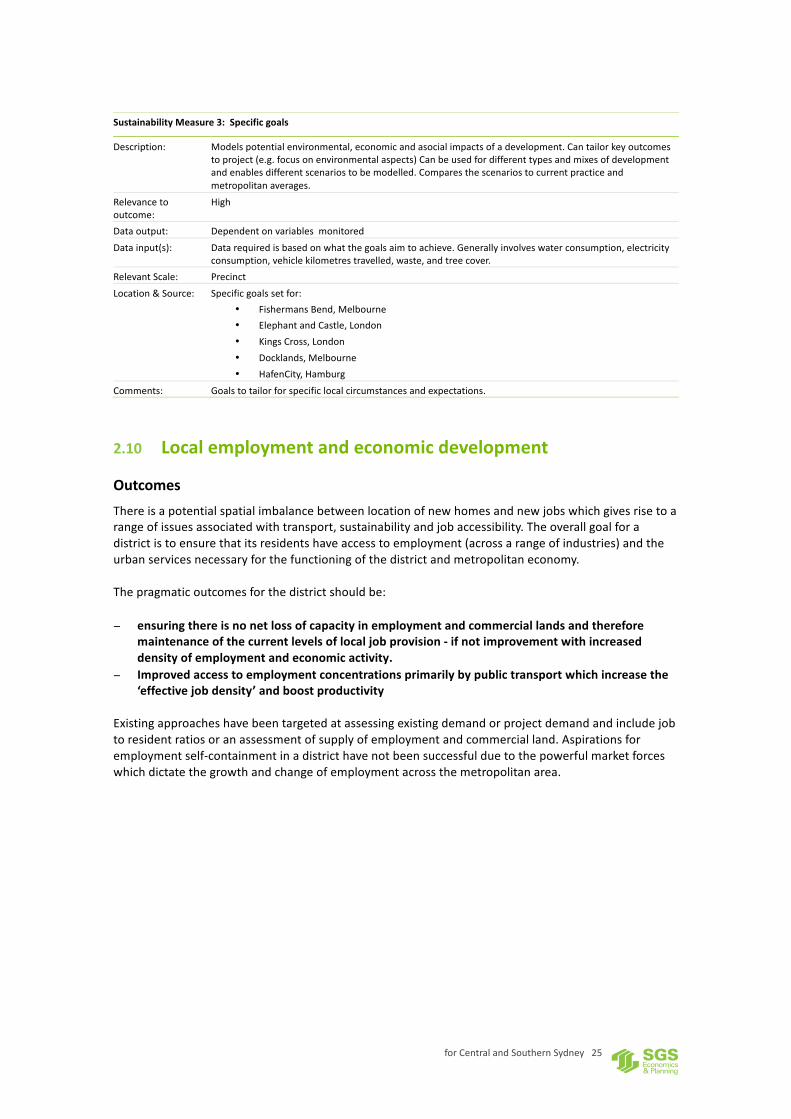
SustainabilityMeasure3:Specificgoals
Description: Modelspotentialenvironmental,economicandasocialimpactsofadevelopment.Cantailorkeyoutcomestoproject(e.g.focusonenvironmentalaspects)Canbeusedfordifferenttypesandmixesofdevelopmentandenablesdifferentscenariostobemodelled.Comparesthescenariostocurrentpracticeandmetropolitanaverages.
Relevancetooutcome:
High
Dataoutput: DependentonvariablesmonitoredDatainput(s): Datarequiredisbasedonwhatthegoalsaimtoachieve.Generallyinvolveswaterconsumption,electricity
consumption,vehiclekilometrestravelled,waste,andtreecover.RelevantScale: PrecinctLocation&Source: Specificgoalssetfor:
• FishermansBend,Melbourne• ElephantandCastle,London• KingsCross,London• Docklands,Melbourne• HafenCity,Hamburg
Comments: Goalstotailorforspecificlocalcircumstancesandexpectations.
2.10 Localemploymentandeconomicdevelopment
OutcomesThereisapotentialspatialimbalancebetweenlocationofnewhomesandnewjobswhichgivesrisetoarangeofissuesassociatedwithtransport,sustainabilityandjobaccessibility.Theoverallgoalforadistrictistoensurethatitsresidentshaveaccesstoemployment(acrossarangeofindustries)andtheurbanservicesnecessaryforthefunctioningofthedistrictandmetropolitaneconomy.Thepragmaticoutcomesforthedistrictshouldbe:
− ensuringthereisnonetlossofcapacityinemploymentandcommerciallandsandtherefore
maintenanceofthecurrentlevelsoflocaljobprovision-ifnotimprovementwithincreaseddensityofemploymentandeconomicactivity.
− Improvedaccesstoemploymentconcentrationsprimarilybypublictransportwhichincreasethe‘effectivejobdensity’andboostproductivity
Existingapproacheshavebeentargetedatassessingexistingdemandorprojectdemandandincludejobtoresidentratiosoranassessmentofsupplyofemploymentandcommercialland.Aspirationsforemploymentself-containmentinadistricthavenotbeensuccessfulduetothepowerfulmarketforceswhichdictatethegrowthandchangeofemploymentacrossthemetropolitanarea.

forCentralandSouthernSydney26
ExistingbestpracticemeasuresEmploymentMeasure4:EffectiveJobDensity(EJD)
Description: Employmentcontainedwithinanareaandexternally,withemploymentinotherareasdividedbythetraveltimerequiredtoreachtheseexternaljobs,weightedfortransportmode.
Relevancetooutcome:
High/Medium
Dataoutput: Jobdensity(totalcounts)–DatarequiresahighlevelofskillforinterpretationDatainput(s): DatapertainingtoemploymentcountsandforecastsisavailablefromBTS,howeverdatapertainingtothe
traveltimematrixofthecityismoredifficulttoobtainandwillrequireahighdegreeofspecialistknowledgetoreproduceaccurately,whichwillalsoincursubstantialcost.
RelevantScale: Precinct/LGA/Subregion/MetropolitanLocation&Source: SGSEconomicsandPlanning,2012,ProductivityandagglomerationbenefitsinAustraliancapitalcitiesComments: Effectivejobdensitypresentsameasurementofhowmanyjobsareaaccessibletoaspecificlocationusing
eitherpublicorprivatetransport.Thismeasureisusefulforassessingtowhatextentanareahasaccesstoadiverserangeofjobopportunities,andcouldbeusedtoidentifyareassuitable/unsuitableforintensificationwithorwithouttransportationimprovementsortobeimplemented.
EmploymentMeasure1:StMarysJobRatio
Description: 1:1residentstoworkersproposedaspartoftheSREPaffectingStMarys.ValidityofthismeasuretoincreaseselfcontainmentrateswasconsideredbySGSinourreport.Problemsidentifiedinclude:
• Scale–thesmallerthescale,thelessoftheeconomicsystemincludedandthelowertheselfcontainmentrate
• Existingresidentstojobsrateislower(morelike0.6:1)andselfcontainmentevenlower(35%inPenrith,27%inBlacktown)
• Landuses(primarilyresidential)andlocationofemploymentlands0.4:1wasfoundtobemorefeasibleinthiscase
Relevancetooutcome:
Low
Dataoutput: Ratio–easytounderstandandapplyDatainput(s): Needtoknowthenumberofresidentsandworkersinaspecifiedareaforratio.Needtoknowworkersinan
areareside(BTSTraveldata)forselfcontainmentrate.RelevantScale: Precinct,LGA,SubregionandMetropolitan(scalable)Location&Source: SGSEconomicsandPlanning–RevisedStMarysEIShereComments: Therangeofuncontrolledregional/nationalfactorsatplayhavelimitedtheusefulnessofthismeasure.EmploymentMeasure2:Supplyofemploymentlands
Description: Thesupplyofemploymentlands(industrial,officeandbusiness)canbeusedtodetermineifthereissufficientlandtoaccommodateemploymentusesandmaintaincurrentlevelsoflocalemployment.CouldalsodeterminehowmanyjobsthehectaresofzonedlandappliedbydeterminingtheGFApermittedundercontrols(heightsandFSR)andastandardratioofjobstofloorspace.
Relevancetooutcome:
High
Dataoutput: AreaoflandDatainput(s): Sizeoflandzonedindustrialandbusinesszones,sizeofareasproposedtoberezoned.Shouldbeavailable
foreachcouncil.ELDPhasindustriallandsummarisedbyprecinctinhectares.RelevantScale: PrecinctorLGA(couldbeusedforsubregionormetropolitanlevel–datacollationmaybemoredifficult
thanLGA.ELDPprovidesindustriallanddataforzonedindustrialprecincts)Location&Source: InternaldiscussionsComments: Useful–ifbackgroundstrategicplanningestablishescapacityandidentifiesstrategicpriorities.

forCentralandSouthernSydney27
EmploymentMeasure3:Localoccupationofnewjobs
Description: Establisha%ofnewjobstobetakenupbylocalresidents.HasbeenusedinKingsCrossredevelopmentinLondonin2004(targetof15%ofjobsby2012).OthermeasuresgenerallyadoptedincludeXamountoffloorspaceforemploymentuses(e.g.45,000sqmforretail)
Relevancetooutcome:
Low
Dataoutput: UnitofmeasureandeaseofinterpretationDatainput(s): Availability&quality/costofnecessarydatainputsRelevantScale: PrecinctLocation&Source: KingsCross,London.ReviewedaspartofSGSworkforCoSComments: Unclearwhetherlocalemploymentfactorscaninfluencetheoutcometoanygreatdegree.
2.11 Utilitiesandstormwater
OutcomesNewdevelopmentcanincreasetherunoffandimpactdownstreamwaterquantityandqualitywherethereareincreasedimpervioussurfaces,fillingorgrounddisturbance/erosion.Theoverallgoalshouldbetoensurethatintensificationdoesnotgiverise(orexacerbate)floodingorpollution.Thisgoalisimplicitincouncilandstateenvironmentaldesignandengineeringstandardsrequiredfornewdevelopment.Howeverthereareopportunitiestopromotebestpracticeperformanceinwatersensitiveurbandesign.ExistingapproachesincludeWaterSensitiveUrbanDesigngeneralcodeandcatchmentmanagementprinciples.Thesemeasurescanbeappliedatasite,precinctorcatchmentscale.
ExistingbestpracticemeasuresUtilitiesMeasure2:Watersensitiveurbandesigngeneralcode
Description: AdoptionofwatersensitiveurbandesignguidelinesRelevancetooutcome:
Medium
Dataoutput: Qualitative,multiplefactors.Maybequalitative(e.g.reducepollutants)ormorequantitativeanddetailed(e.g.reducepollutantXbyY)
Datainput(s): Variousanddetailed–developmentdesign,currentfloodwayandoverlandflow,stormwaterengineeringetc.
RelevantScale: Precinct/LGA/Subregion/MetropolitanLocation&Source: ACTComments: http://www.legislation.act.gov.au/ni/2008-27/copy/56032/pdf/2008-27.pdf
http://www.environment.act.gov.au/__data/assets/pdf_file/0010/621568/Water-Sensitive-Urban-Design_ACCESS.pdfhttp://www.landcom.com.au/downloads/uploaded/wsud_book3_casestudies_0409_3da4.pdf

forCentralandSouthernSydney28
UtilitiesMeasure3:Catchmentmanagementprinciples
Description: Upstreamcatchmentmanagementprinciplesparticularlyimportanttoimprovewaterquality,reducerunoffandfloodingincidences.
Relevancetooutcome:
Medium
Dataoutput: UnitofmeasureandeaseofinterpretationDatainput(s): Availability&quality/costofnecessarydatainputsRelevantScale: Precinct/LGA/Subregion/MetropolitanLocation&Source: e.g.Auckland(referRef)Comments:
forCentralandSouthernSydney29
3 BENCHMARKS
3.1 Overviewofpotentialbenchmarksandindicators
Thedevelopmentofpracticalliveabilitybenchmarksandindicatorsisdependentonthecriteriachosentomonitor,andtheeffectiveabilitytomonitorthesebenchmarks.Thecriteriainclude:− Effectiveness:Doestheindicatorprovideanaccuratemeasureofachievementofdesiredoutcomes?− Efficiency:Howeasyisittomeasureandwhatmightbethecostofmeasurement(dataavailability)?− Interpretationforaction:Doesthemeasurementallowreadyinterpretationasevidenceforaction,
includinginfrastructureprovision?Thisprocesswouldidentifythosethemesforwhich:− therearepracticalquantitativemeasurescurrentlyavailable–orcouldbereadilydeveloped− whereothertypesofqualitativeperformancemeasures(e.g.comparativecasestudies/needs
assessments)aremoreappropriatetodeterminewhetheranamenityoutcomeismetTherangeofpotentialbenchmarksbelowwereconsideredbyanSSROCworkinggrouppriortotesting.
3.2 Implementation
Theaimofthebenchmarkingprocessistosetappropriateambitiouspolicytargetsinlinewithbestpractice.Projectsshouldbeheldtothesetargetsunlesstheyareabletodemonstratethroughproofofanalysisthereasonswhythetargetsareunachievable.

forCentralandSouthernSydney30
3.3 Benchmarks
Theme Outcome/ssought Benchmark/s Indicators/s
Districtopenspaceandrecreation Nonetlossintheareaofavailableactiverecreationalspace(includingplayingfields)intheSouthandCentralDistricts
Existinglevelsofplayingfieldprovisionandusagerepresenttheminimumbenchmarkduetocounciladvicethatusageisalreadyatcapacityacrossthedistrict.
Areaandnumberofplayingfieldsavailableinthedistrict(bysport)(annually)
Increasedavailabilityandutilisationofplayingfieldassets;− uptotheutilisation
maximuminhoursofusefornaturalgrasssurfaces
− withtheprovisionofsuitablelightingandmaintenance
− assetusagemeteredtospreadthepeakdemand
Existinglevelsofavailabilityandprogrammedusagerepresenttheminimumbenchmark.Existinglevelofavailableplayingfieldhoursforeachplayerforeachsportrepresentstheminimumbenchmark
Numberofdaysfieldsclosed/unavailableforuse(annually).Availableplayingfieldhourspersportperparticipant
Increasedrangeofactiverecreationalopportunities
Tobedeterminedbasedonaneedsassessmentofexistingandnewresidents
Completionandadoptionoftherecreationalneedsassessment–includingthediversificationofplayingfieldtype/needs
Housingaffordability Increaseinsupplyofaffordablerentalaccommodationforlowincomehouseholds
30percentofrenewalstocktobeaffordablerentalhousing.12
Affordablehousingtomakeupanincreaseshareoftotaldwellingstock.
Accesstocentresandemployment Increaseinaverageaccessibilitytodistrictcentresandemployment
AveragedprivateANDpublictraveltimestodistrictcentrenottoexceed30minutesfromnewrenewalprojectsites
ProjectcatchmentstobedeterminedbyTraveltimematricesonJourneytoWorkandsocialtripspatterns
Localcentresocialinfrastructuretobeaccessiblewithin20minutesofactivetransportmodestocreatea’20minutecity’urbantopography.13
Averagetraveltimetokeycommunityinfrastructurenottoexceed20minutesbyactivetransportmodes
ProjectcatchmentstobedeterminedbyTraveltimematricesonsocialtripspatternsandnetworkanalysis
Parking Assessmentofcurrentparkingprovisionacrossadistrict
Abaselineassessmentofcurrentparkingdemandandsupplyandthefinancialmodeloftheparkingitem
Documentationofthelocationandquantityofpublicparkinganditsmanagementandmaintenanceregime(annualreview)inaTransportManagementandAccessibilityPlan(TMAP)
Justifiedadditionstoparkingsupply.Supplythatdoesnotgenerateunnecessarytraveldemand,yetprovidesasufficientlevelofparkingtosupportthefunctionsofthelocation
Provisionofadequateandjustifiedparkingsupplyinlinewithforecastdemandfromrenewalproject
ProvisionofparkinginaccordancewiththeTMAPstandards.
12Provisionofaffordablehousingshouldnotcreateconcentrationsofaffordablesocialhousingoraffordableadditionalneedshousingtolevelswhereitcreatesnegativesocialenvironments.
13This’20minuteCity’modelwouldincludetheambitionofincreasedaccessibilitytodistrictcentresandemploymentoftripsnolongerthan20minutes(averageofbothcarandpublictransportmodes)
Parkingbenchmarksareimpracticalduetothevastrangeofparkingneeds
andareaddressedvialocalgovernmentcodesandcontrols.

forCentralandSouthernSydney31
Theme Outcome/ssought Benchmark/s Indicators/s
Schoolsandothereducationfacilities Provisionoflocalprimaryschools(andclassroomspace)tomeetdemand(andexpectations)createdbypopulationgrowthandchangingdemographicsatthelocallevel.14
Achievingthenominalprovisionrates(e.g.ratiosofpopulationperschool)butalsoconsiderationof:− Localaccessibility–local
schoolcatchmentstoadheretothe‘20minutecity’model
− Needsbasedassessmentreferringtoexistingandnewpopulationexpectations
MeasureofschoolpopulationbyaccessiblecatchmentpopulationSchoolcatchmentstobedeterminedbyTraveltimematricesandnetworkanalysis
Optimiseefficiencyofuseandmaintenancestructureforschoolinfrastructure(betweenschools).
Usabilityandavailabilityofopportunitiesforshareduseofexternalfacilitiesforconfinedschools(e.g.openspace,planningfields,halls,libraries/resourcecentres)
Sharedfacilitiesaudittoassesscomparableaccesstofacilitiesbetweendifferentschoolmodels(acknowledgingthelimitationsofmaximumusablehoursfornaturalsurfaces).
Hospitalsandotherhealthfacilities Provisionofhospitalbedsandotherhealthfacilitiestomeetdemandcreatedbypopulationgrowthandchange.15
Theavailabilityofsuitablyzonedandservicedspaceforsupportinghealthfacilities/enterprisesassociatedwithmajorhospitalsandhealthcentres
Auditoflandsupplyinparallelwithhealthandalliedindustryneedsassessment
Loweraveragetraveltimestokeyhealthfacilitiesbypublictransportandwalking
Improvedaccessibilityofkeyhealthfacilitiesbypublictransportandwalkingtothestandardsofthe’20minutecity’
CatchmentstobedeterminedbyTraveltimematricesandnetworkanalysis
Communityandculturalfacilities,includingchildcare
Responsetoaneedsbasedassessmentfortypesofcommunityandculturalfacilitiestargetingnewandexistingresidents(withreferencetoavailablecapacity)
Improvingexistingratiosofpopulationpercommunityand/orculturalfacilityforthosefacilitiesatcapacity
Preparationandimplementationofaneedsassessment
Improvingpopulationaccesstocommunityfacilities–usingthe‘20minutecity’modelandtransitconnectivityasameasureforaccessibilityofcommunityandculturalfacilitiesThosecouncilswhoprovidepublicchildcareplacesseektoprovide1spaceforbetweenevery2-7childrenaged1-5yo.
Ensuringaccesstothefullrangeofcommunityfacilitieswithin20minutesbypublictransport(the’20minutecity’model)
ProjectcatchmentstobedeterminedbyTraveltimematricesonsocialtripspatternsandnetworkanalysis
Precinctsustainability Environmentalcoststobeminimisedandtheenvironmentalperformanceofaprecincttobeimprovedoverallasaresultofnewdevelopmentandgrowth.
Establishprecinctspecificenvironmentaltargetsforenergy,CO2,water,runoff(WSUD),waste,localaccess,heatstressandbiodiversity
Applymostrelevantprecinctsustainabilitymeasurementinstrument(i.e.PRECINX,GreenStar),shadedpublicspaces
14Independentschoolsandotherprivateinfrastructureareconsideredtooperateoutsideofbenchmarkingoutcomes15Accesstolocalcommercialfloorspace(forsupportivecommercialandlocaldispersedactivities)isneededforthesupportofprimaryhealthservices

forCentralandSouthernSydney32
4 PROOFOFCONCEPTTESTING
4.1 Testingbenchmarksinanintensificationarea
Thischapterdemonstrateshowthebenchmarksdiscussedintheprecedingchaptermightbeappliedtoanactualplace,inthiscase,ahypotheticalregenerationprecinctcalledGreen‘Circle’UrbanRenewalarea.AlthoughinputsusedhavebeentakenfromGreenSquare,thisisa‘theoretical’proofofconcepttestinthatitwasnotpossibletogatheraccuratedatagiventhelimitedscopeofthisassignment.An‘actual’proofofconcepttestingwouldrequiretheverificationofdatawhichisbeyondthescopeofthiswork.WehaveestimatedthelikelyperformanceofGreen‘Circle’againsteachindicatorand,intheprocess,hypothesisedabouttheusefulnessofeachindicatorbasedonthefollowingconsiderations:− Effectiveness:Doestheindicatorprovideanaccuratemeasureofachievementofdesiredoutcomes?− Efficiency:Howeasyisittomeasureandwhatmightbethecostofmeasurement(dataavailability)?− Interpretationforaction:Doesthemeasurementallowreadyinterpretationasevidenceforaction,
includinginfrastructureprovision?ThenextsectionoutlinessomeofthekeycharacteristicsforGreen‘Circle’.Thefinalsectionisthetheoreticalproofofconceptapplicationofthebenchmarksandindicators.
4.2 Green‘Circle’UrbanrenewalArea
Green‘Circle’UrbanrenewalAreafallswithintheCityofSydneyLocalGovernmentArea(LGA)boundary.TheCityofSydneyidentifysignificantgrowthinpopulationandemploymentforthewiderGreen‘Circle’areaforecastingpopulationtoreach61,000residentsandemploymenttoreach21,000jobs.Themajorityofthisgrowthtooccurpost2030whichisthescheduledcompletiondateformajordevelopmentoftheprecinct.Intheshorttomediumterm,theBTSidentifymodestgrowthinpopulationandemploymentouttothemid-2030s;anadditional7,200and8,400respectively.
TABLE 1 : PROJECTEDGROWTHAT GREEN ‘C IRCLE ’ (TOTAL FORTHE3 X TZS THATARE SHOWNBELOW)
Year 2011 2016 2021 2026 2031 2036 2041
Growth
(2011–2036)
Population 1,507 4,170 6,404 8,109 8,585 8,796 9,011 7,289
Employment 4,734 8,679 10,599 12,161 12,934 13,123 13,337 8,389
Workforce 963 2482 3,899 5,113 5,491 5,568 5,649 4,605BTS2015,September2014release
A2014SGSEconomicsandPlanningreportreferenceapopulationprofileacrossthewholeCityofSydneyLGA(sourcedfromid.–thepopulationexperts2013),whichoutlinesthefollowingkeyfindingsfortheperiod2011to2036;
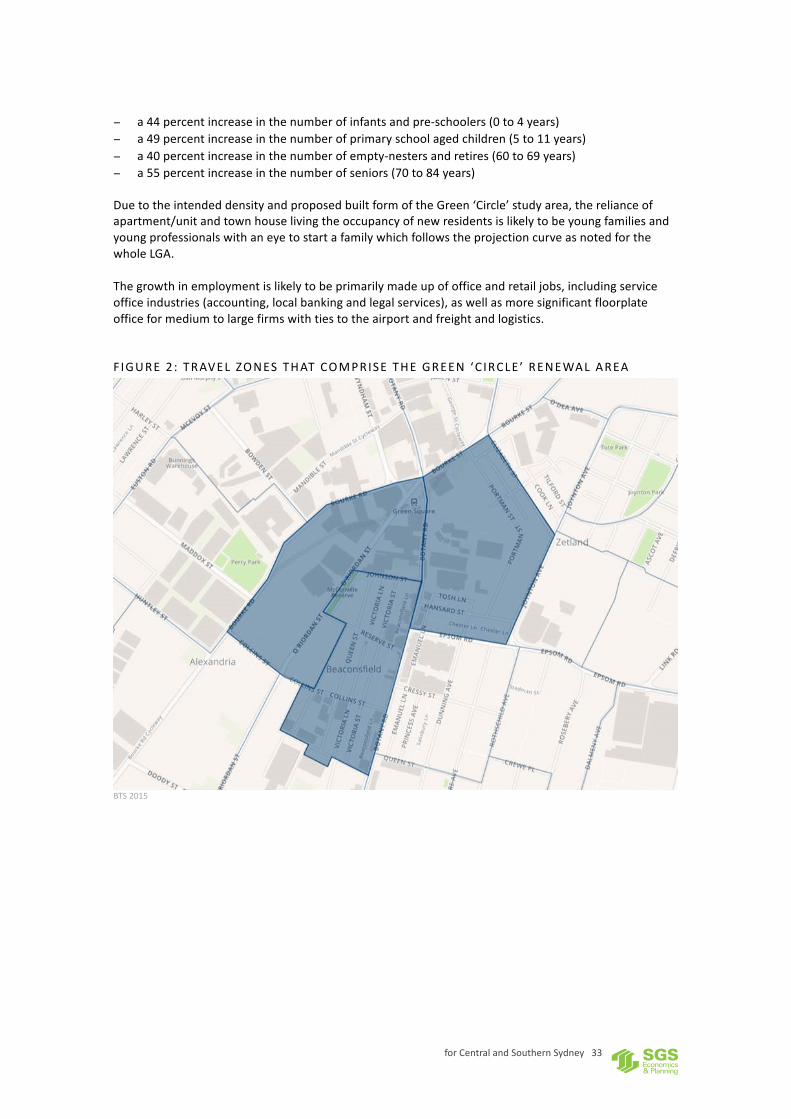
forCentralandSouthernSydney33
− a44percentincreaseinthenumberofinfantsandpre-schoolers(0to4years)− a49percentincreaseinthenumberofprimaryschoolagedchildren(5to11years)− a40percentincreaseinthenumberofempty-nestersandretires(60to69years)− a55percentincreaseinthenumberofseniors(70to84years)DuetotheintendeddensityandproposedbuiltformoftheGreen‘Circle’studyarea,therelianceofapartment/unitandtownhouselivingtheoccupancyofnewresidentsislikelytobeyoungfamiliesandyoungprofessionalswithaneyetostartafamilywhichfollowstheprojectioncurveasnotedforthewholeLGA.Thegrowthinemploymentislikelytobeprimarilymadeupofofficeandretailjobs,includingserviceofficeindustries(accounting,localbankingandlegalservices),aswellasmoresignificantfloorplateofficeformediumtolargefirmswithtiestotheairportandfreightandlogistics.
F IGURE2 : TRAVEL ZONES THATCOMPRISE THE GREEN ‘C IRCLE ’ RENEWALAREA
BTS2015
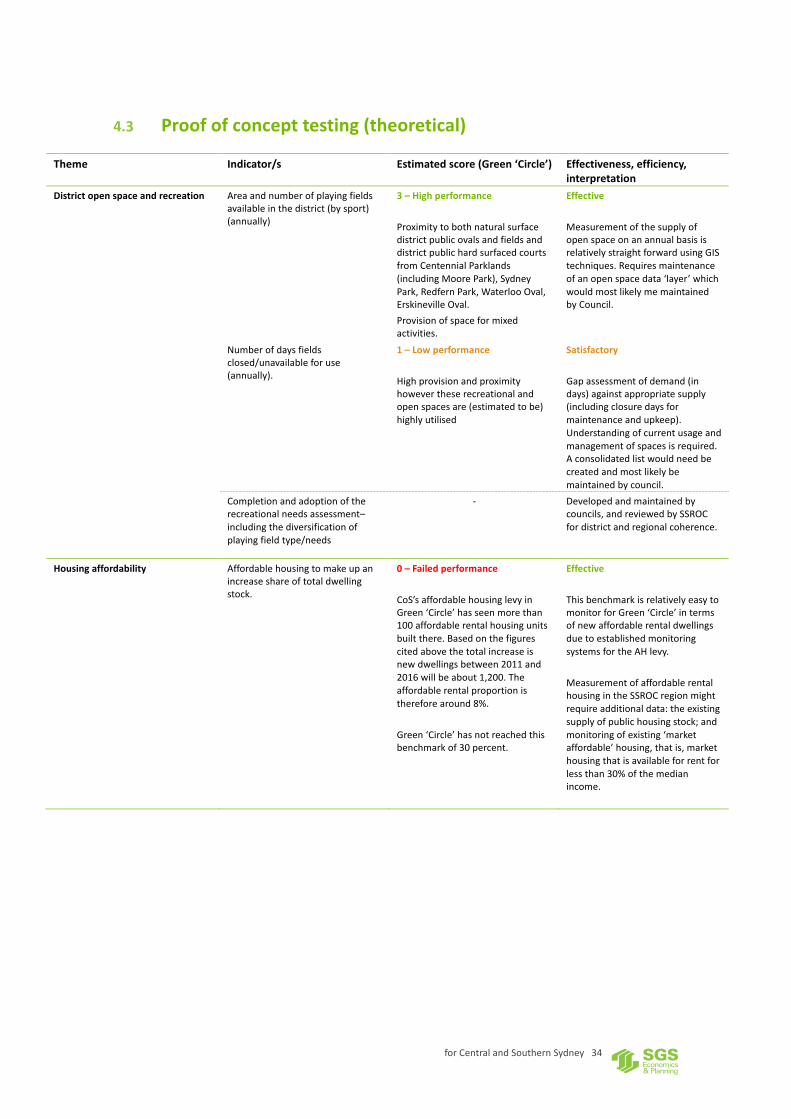
forCentralandSouthernSydney34
4.3 Proofofconcepttesting(theoretical)
Theme Indicator/s Estimatedscore(Green‘Circle’) Effectiveness,efficiency,interpretation
Districtopenspaceandrecreation Areaandnumberofplayingfieldsavailableinthedistrict(bysport)(annually)
3–HighperformanceProximitytobothnaturalsurfacedistrictpublicovalsandfieldsanddistrictpublichardsurfacedcourtsfromCentennialParklands(includingMoorePark),SydneyPark,RedfernPark,WaterlooOval,ErskinevilleOval.Provisionofspaceformixedactivities.
EffectiveMeasurementofthesupplyofopenspaceonanannualbasisisrelativelystraightforwardusingGIStechniques.Requiresmaintenanceofanopenspacedata‘layer’whichwouldmostlikelymemaintainedbyCouncil.
Numberofdaysfieldsclosed/unavailableforuse(annually).
1–LowperformanceHighprovisionandproximityhowevertheserecreationalandopenspacesare(estimatedtobe)highlyutilised
SatisfactoryGapassessmentofdemand(indays)againstappropriatesupply(includingclosuredaysformaintenanceandupkeep).Understandingofcurrentusageandmanagementofspacesisrequired.Aconsolidatedlistwouldneedbecreatedandmostlikelybemaintainedbycouncil.
Completionandadoptionoftherecreationalneedsassessment–includingthediversificationofplayingfieldtype/needs
- Developedandmaintainedbycouncils,andreviewedbySSROCfordistrictandregionalcoherence.
Housingaffordability Affordablehousingtomakeupanincreaseshareoftotaldwellingstock.
0–FailedperformanceCoS’saffordablehousinglevyinGreen‘Circle’hasseenmorethan100affordablerentalhousingunitsbuiltthere.Basedonthefigurescitedabovethetotalincreaseisnewdwellingsbetween2011and2016willbeabout1,200.Theaffordablerentalproportionisthereforearound8%.Green‘Circle’hasnotreachedthisbenchmarkof30percent.
EffectiveThisbenchmarkisrelativelyeasytomonitorforGreen‘Circle’intermsofnewaffordablerentaldwellingsduetoestablishedmonitoringsystemsfortheAHlevy.MeasurementofaffordablerentalhousingintheSSROCregionmightrequireadditionaldata:theexistingsupplyofpublichousingstock;andmonitoringofexisting‘marketaffordable’housing,thatis,markethousingthatisavailableforrentforlessthan30%ofthemedianincome.
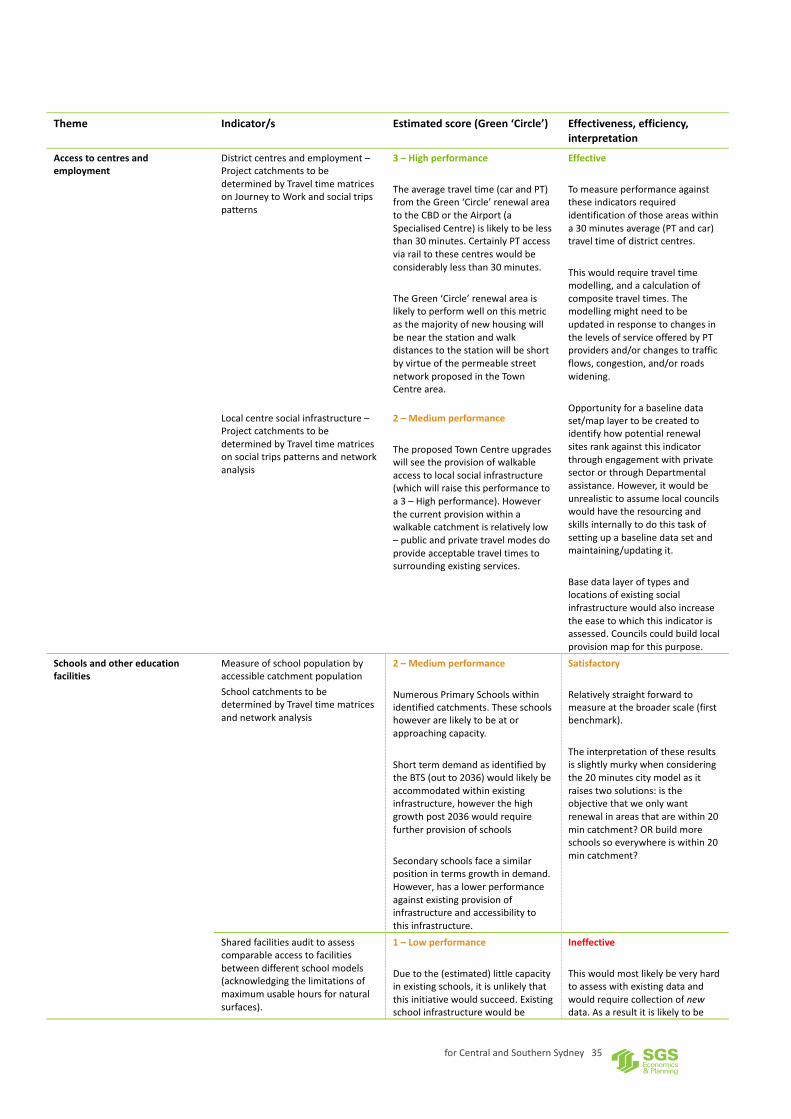
forCentralandSouthernSydney35
Theme Indicator/s Estimatedscore(Green‘Circle’) Effectiveness,efficiency,interpretation
Accesstocentresandemployment
Districtcentresandemployment–ProjectcatchmentstobedeterminedbyTraveltimematricesonJourneytoWorkandsocialtripspatterns
3–HighperformanceTheaveragetraveltime(carandPT)fromtheGreen‘Circle’renewalareatotheCBDortheAirport(aSpecialisedCentre)islikelytobelessthan30minutes.CertainlyPTaccessviarailtothesecentreswouldbeconsiderablylessthan30minutes.TheGreen‘Circle’renewalareaislikelytoperformwellonthismetricasthemajorityofnewhousingwillbenearthestationandwalkdistancestothestationwillbeshortbyvirtueofthepermeablestreetnetworkproposedintheTownCentrearea.
EffectiveTomeasureperformanceagainsttheseindicatorsrequiredidentificationofthoseareaswithina30minutesaverage(PTandcar)traveltimeofdistrictcentres.Thiswouldrequiretraveltimemodelling,andacalculationofcompositetraveltimes.ThemodellingmightneedtobeupdatedinresponsetochangesinthelevelsofserviceofferedbyPTprovidersand/orchangestotrafficflows,congestion,and/orroadswidening.Opportunityforabaselinedataset/maplayertobecreatedtoidentifyhowpotentialrenewalsitesrankagainstthisindicatorthroughengagementwithprivatesectororthroughDepartmentalassistance.However,itwouldbeunrealistictoassumelocalcouncilswouldhavetheresourcingandskillsinternallytodothistaskofsettingupabaselinedatasetandmaintaining/updatingit.Basedatalayeroftypesandlocationsofexistingsocialinfrastructurewouldalsoincreasetheeasetowhichthisindicatorisassessed.Councilscouldbuildlocalprovisionmapforthispurpose.
Localcentresocialinfrastructure–ProjectcatchmentstobedeterminedbyTraveltimematricesonsocialtripspatternsandnetworkanalysis
2–MediumperformanceTheproposedTownCentreupgradeswillseetheprovisionofwalkableaccesstolocalsocialinfrastructure(whichwillraisethisperformancetoa3–Highperformance).Howeverthecurrentprovisionwithinawalkablecatchmentisrelativelylow–publicandprivatetravelmodesdoprovideacceptabletraveltimestosurroundingexistingservices.
Schoolsandothereducationfacilities
MeasureofschoolpopulationbyaccessiblecatchmentpopulationSchoolcatchmentstobedeterminedbyTraveltimematricesandnetworkanalysis
2–MediumperformanceNumerousPrimarySchoolswithinidentifiedcatchments.Theseschoolshoweverarelikelytobeatorapproachingcapacity.ShorttermdemandasidentifiedbytheBTS(outto2036)wouldlikelybeaccommodatedwithinexistinginfrastructure,howeverthehighgrowthpost2036wouldrequirefurtherprovisionofschoolsSecondaryschoolsfaceasimilarpositionintermsgrowthindemand.However,hasalowerperformanceagainstexistingprovisionofinfrastructureandaccessibilitytothisinfrastructure.
SatisfactoryRelativelystraightforwardtomeasureatthebroaderscale(firstbenchmark).Theinterpretationoftheseresultsisslightlymurkywhenconsideringthe20minutescitymodelasitraisestwosolutions:istheobjectivethatweonlywantrenewalinareasthatarewithin20mincatchment?ORbuildmoreschoolssoeverywhereiswithin20mincatchment?
Sharedfacilitiesaudittoassesscomparableaccesstofacilitiesbetweendifferentschoolmodels(acknowledgingthelimitationsofmaximumusablehoursfornaturalsurfaces).
1–LowperformanceDuetothe(estimated)littlecapacityinexistingschools,itisunlikelythatthisinitiativewouldsucceed.Existingschoolinfrastructurewouldbe
IneffectiveThiswouldmostlikelybeveryhardtoassesswithexistingdataandwouldrequirecollectionofnewdata.Asaresultitislikelytobe

forCentralandSouthernSydney36
Theme Indicator/s Estimatedscore(Green‘Circle’) Effectiveness,efficiency,interpretation
unlikelytotakeontheadditionalusageandremainuptostandard.
timeconsumingandexpensivetomonitorthisindicatorinareliableway.
Hospitalsandotherhealthfacilities
Auditoflandsupplyinparallelwithhealthandalliedindustryneedsassessment
2–MediumperformanceQuestionofcapacityofhospitalsinthebroaderSubregion:RoyalPrinceAlfredatCamperdown,PrinceofWalesatRandwick,orevenRoyalNorthShore.Istherecapacity?Probably.
SatisfactoryThereisalevelofdifficultyinmeasuring‘otherhealthfacilities’asthesedispersedactivitiescanmovelocationswithease.Anybaselinedatawouldneedtobemonitoredandupdatedregularly–mostlikelybyCouncil.Wouldrelyonthedevelopmentofthebaselinetraveltimeworking.
CatchmentstobedeterminedbyTraveltimematricesandnetworkanalysis
2–MediumperformanceGoodinGreen‘Circle’-Oratleastbetterthanitwasbeforetherenewaloftheareaanditwasalargelyindustrialprecinct.
EffectiveRequiresidentificationofhealthfacilitiesandoftheareaswithinthe20minutePTorwalkingcatchmentofeach.
Communityandculturalfacilities,includingchildcare
Preparationandimplementationofaneedsassessment
- Developedandmaintainedbycouncils,andreviewedbySSROCfordistrictandregionalcoherence.
ProjectcatchmentstobedeterminedbyTraveltimematricesonsocialtripspatternsandnetworkanalysis
1–LowperformanceGoodinGreen‘Circle’?Oratleastbetterthanitwasbeforetherenewaloftheareaanditwasalargelyindustrialprecinct.
EffectiveRequiresidentificationofhealthfacilitiesandoftheareaswithinthe20minutePTorwalkingcatchmentofeach.
BaselinecollectionsizeprovisionismaintainedasaminimumcollectionsizeProvisionofseatingandstudyspaceataminimumsetbypopulationbenchmark
2–MediumperformanceInthelongterm,theTownCentrewillhavea“newcreativecentre,library,childcarecentre,parks,andpublicart.”Conceivable,whenthelibraryisbuilt,therateofprovisionofbooksandseatswillbemuchbetterthanitiscurrently.
IneffectiveInthecaseofmajorsocial/communityinfrastructurewhichmightbeprovidedatalaterdateinresponsestogrowthsoit’sperhapsunreasonabletoexpectitto‘keeppace’withgrowthonanannualbasis.Thistypeofbenchmarkingisperhapsnotveryeffectiveatmonitoringtheimpactofgrowthintheshortterm.
Precinctsustainability Applymostrelevantprecinctsustainabilitymeasurementinstrument(i.e.PRECINX,GreenStar),shadedpublicspaces
2–MediumperformanceVariousESDmeasures–andinparticularWSUD–werefeaturesoftheplanningforGreen‘Circle’.SomeESDfeaturesareevidentintheVictoriaParkprecinct.Othermeasuresuchastri-generation,theuseofSolarPVandwatersaving/harvestingarementionintheInfrastructureStrategy.(Theextenttowhichthesehavebeenimplementedisunclear.)Itislikely
EffectiveRelativeeaseinaccessandunderstandingofdatafornewdevelopment,meansthatthisindicatorcanbeassessedbyCouncils.
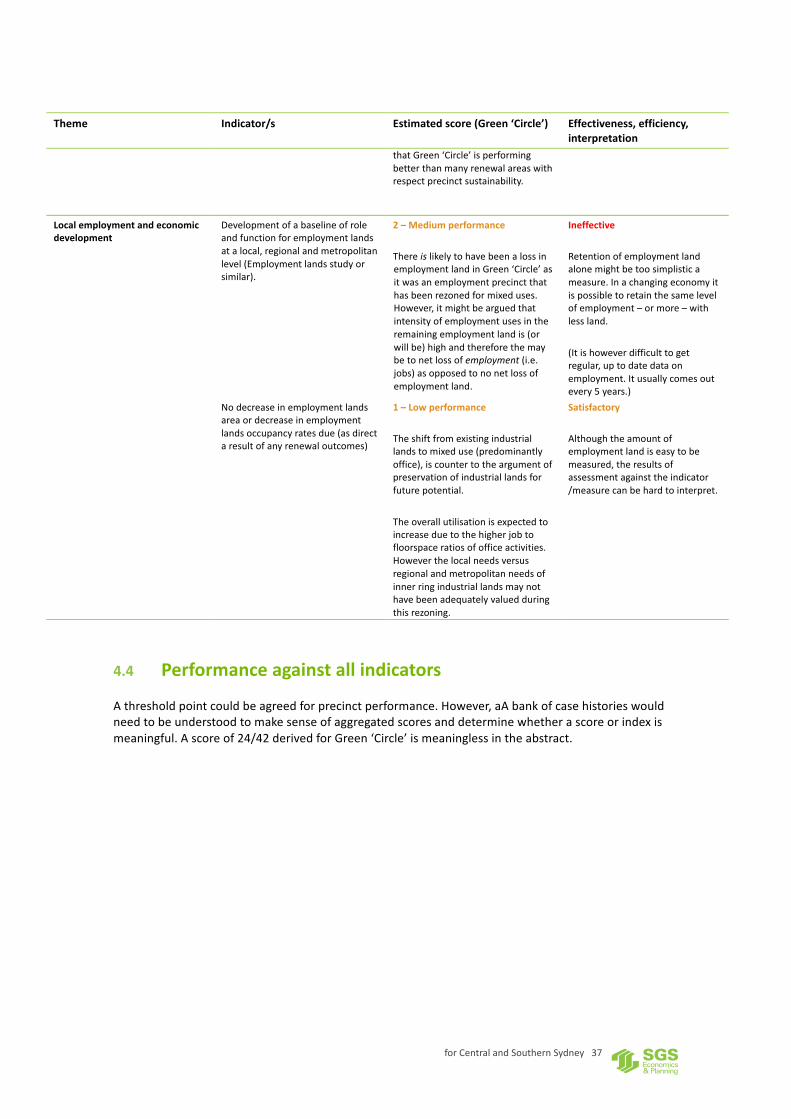
forCentralandSouthernSydney37
Theme Indicator/s Estimatedscore(Green‘Circle’) Effectiveness,efficiency,interpretation
thatGreen‘Circle’isperformingbetterthanmanyrenewalareaswithrespectprecinctsustainability.
Localemploymentandeconomicdevelopment
Developmentofabaselineofroleandfunctionforemploymentlandsatalocal,regionalandmetropolitanlevel(Employmentlandsstudyorsimilar).
2–MediumperformanceThereislikelytohavebeenalossinemploymentlandinGreen‘Circle’asitwasanemploymentprecinctthathasbeenrezonedformixeduses.However,itmightbearguedthatintensityofemploymentusesintheremainingemploymentlandis(orwillbe)highandthereforethemaybetonetlossofemployment(i.e.jobs)asopposedtononetlossofemploymentland.
IneffectiveRetentionofemploymentlandalonemightbetoosimplisticameasure.Inachangingeconomyitispossibletoretainthesamelevelofemployment–ormore–withlessland.(Itishoweverdifficulttogetregular,uptodatedataonemployment.Itusuallycomesoutevery5years.)
Nodecreaseinemploymentlandsareaordecreaseinemploymentlandsoccupancyratesdue(asdirectaresultofanyrenewaloutcomes)
1–LowperformanceTheshiftfromexistingindustriallandstomixeduse(predominantlyoffice),iscountertotheargumentofpreservationofindustriallandsforfuturepotential.Theoverallutilisationisexpectedtoincreaseduetothehigherjobtofloorspaceratiosofofficeactivities.Howeverthelocalneedsversusregionalandmetropolitanneedsofinnerringindustriallandsmaynothavebeenadequatelyvaluedduringthisrezoning.
SatisfactoryAlthoughtheamountofemploymentlandiseasytobemeasured,theresultsofassessmentagainsttheindicator/measurecanbehardtointerpret.
4.4 Performanceagainstallindicators
Athresholdpointcouldbeagreedforprecinctperformance.However,aAbankofcasehistorieswouldneedtobeunderstoodtomakesenseofaggregatedscoresanddeterminewhetherascoreorindexismeaningful.Ascoreof24/42derivedforGreen‘Circle’ismeaninglessintheabstract.

forCentralandSouthernSydney38
5 CONCLUSION
5.1 ActiveOpenSpaceandRecreation
Itisnecessarytodeterminethelevelofutilisationofplayingfieldsandtheavailabilityofanycapacityforexistingusespriortoapplyingthebenchmark.Onceatcapacity,theoutcomesoughtisnonetlossofavailableplayingfieldhours(perparticipant)foreachsport.Thismaybeachievedbyinvestinginimprovingtheamountofhoursinthedaythefacilityisabletobeused,orreducingthetime/rangeofconditioninwhichfacilityisunavailable(i.e.maintenance,lightingresurfacing,improvedscheduling).UltimatelynewfacilitieswillberequiredtoachievethebenchmarkonceoptionsformoreefficientuseareexhaustedThispointwouldreachedbasedonajudgementofthepointatwhichasignificantproportionofusersturnawayfromtheactivityinthedistrict.Onceinvestmentinnewfacilitiesisrequired,theassumptionshouldnotbethatthesamerangeofrecreationalfacilitiesshouldbeprovided.Arecreationneedsassessmentshouldinformthemixofnewfacilitiesrecognisingtheinterestsofnewandexistingresidents.
5.2 HousingAffordability
Thebenchmarkistoachieveanetincreaseinthestockofaffordablehousingineachdistrictrelativetothetotalstock.Thiswouldbeachievedbyrequiring30percentofrenewalstocktobeavailableinthemarketasaffordablehousing(includingbothsocialandaffordablerentalhousing).Giventherateofprovisioninotherlocationswhereaspecificaffordablehousinglevyhasbeenappliedisbelow10percentofthetotalhousingstock(e.g.GreenSquareandPyrmont/Ultimo)thisrequirementof30percentisunlikelytobeachieved.
5.3 Accesstocentresandemployment
Thebenchmarksoughtisanimprovementintheaccessibilityofhousinginthedistricttostrategiccentresandlocalcentresinthefaceofurbanintensification.Theindicatorismaintaintheaveragetraveltimeperpersontounder30minutes(byallmodes)tonominatedstrategiccentresservingthedistrict.Forlocalcentresthebenchmarkis20minutes.Measurementofindicatorsrequiresaccesstoanddetailedanalysisofjourneytoworkdata.Thiswouldbealagindicator.Whilethemeasureisplausibleitrequiresdetailedtechnicalanalysisofinformationthatmaybe2-5yearsold.Changesintheindicatorwouldbeverygradualevenwiththeintroductionofmajornewinfrastructureorserviceimprovements.Theindicatorwouldbeconfoundedbyfactorsinfluencingtheextenttowhichlocalresidentschoosetovisitandworkindistrictcentres.Thecomplexityanddifficultyininterpretationofresultssuggestthatthisinformationwouldbemoreusefulinmajorregionallanduseandtransportplanningstrategiesratherthaninresponsetolocalurbanintensification.

forCentralandSouthernSydney39
5.4 Parking
ThemostpracticalbenchmarkwouldbewhethernewtrafficgeneratingdevelopmentrespondswithbothminimumandmaximumoffstreetparkingrequirementsthatrespondtothelevelofaccessibilityandthelocalobjectivesofaTransportManagementandAccessibilityPlan(TMAP).Settinganabsolutebenchmarkandensuingindicatorsforparkingwouldnotrecogniselocalconditionsandmayperpetuateconditionsthatgeneratetrafficespeciallyinareasthatareaccessiblebypublictransport.Thereisalsothepotentialfornegativefeedbackintohousingcostsduetothepotentialforoverprovisionofparkingandtheassociateddevelopmentcosts.
5.5 SchoolsandOtherEducationFacilities
Theachievementofnominalschoolprovisionrateswithoutalocalcontext,isinsufficientduetotheemergingopportunitiesforhighqualityschoolingonwelldesigned,highlyaccessiblesiteswhichhaveaccesstoqualityopenspace,recreationalandculturalfacilities.Themeasurementofpublicprimaryschoolprovisionrates(perthousandpopulationwithin20minutewalkablecatchments)isonlyastartingpointtogaugepressureonlocalschools.Aqualitativeassessmentoftheadequacyofschoolgrounds,itsaccessibilityandaccesstosupportingfacilitiesisneededtodeterminewhetheraschoolisapproachingcapacity–andwhethertheschoolisscalabletoaccommodategrowth.Wheretheexistingschoolsdonotshowcapacityforgrowth–thennewschoolsitesand/orinnovativeschoolredevelopmentisneeded.Acomparableapproachcanbeappliedforhighschoolsbasedona30minutewalkingandpublictransportcatchment.Themeasurementandanalysisrequiredforthisindicatoriscomplexandwouldbemoreappropriatetoundertakeaspartofanintegrateddistrictinfrastructureplanningexercise.
5.6 HospitalsandHealthfacilities
Themeasurementandanalysisrequiredforthishospitalprovisioniscomplexandshouldbeundertakenaspartofanintegrateddistrictinfrastructureplanningexercise.Themostappropriatedistrictstrategicplanningresponsetoaperceivedneedisanauditoflandsupplyinparallelwithhealthandalliedindustryneedsassessment.Improvingaccessibilitytolocalhealthfacilitiesistheotherelementtothebenchmark.Thisrequirestheprovisionofsuitablefloorspaceinaccessiblecentresforfacilitiessuchasmedicalcentres.Againthisisanexercisebestsuitedtobeundertakenaspartoflocalstrategicplanninginvestigations.
5.7 Communityandculturalfacilities,includingchildcare
Communityfacilitiesprovisionlendsitselftoatailoredinterventionduetothedifferentexpectationsofresidents.Libraries(includingITresourcehubs)andothercommunityfacilitiesforyouth,agedandchildcareareincreasinglybeingofferedinflexiblemulti-usefacilities.Bestpracticeisachievedviaaresponsetoaneedsbasedassessmentsupportedbyas94plan.Childcareservicesarenotofferedbyallcouncils.Councilsrespondbyenablingthemarkettodelivertheseservicesinsuitablelocationsaccordingtotheirdevelopmentcontrolplans.
forCentralandSouthernSydney40
5.8 Precinctsustainability
Bestpracticeistailoringexistingprecinctsustainabilitymeasurementinstruments(i.e.PRECINX,GreenStar)toachieveenvironmentgoalssetunderadistrictplan.Precinctspecificobjectivesshouldbesettoensurethatthemeasureisrelevanttolocalconditions.
5.9 Localemploymentandeconomicdevelopment
Itisnecessarytodevelopmentofabaselineoftheroleandfunctionforemploymentlandsatalocal,regional/metropolitanlevel(viaanEmploymentlandsstudy).Havingestablishedthelocationandareaofregionallyimportantemploymentlandthereshouldbenolossinsiteareaineachidentifiedprecinct.Forlocallyimportantemploymentlandthereshouldbenonetlossinfloorspaceforemploymentuses–notingthatsomesitesmaybeconvertedtootheruseswhileothersmayintensifyascommercialorhigherdensityindustrialuses.
5.10 Utilitiesandstormwater
Councilsprovideassurancethatappropriatedesignstandardsandenvironmentalmonitoringconditionsareimplementedviatheapprovalandcertificationprocess.Wheremajorfloodinganddrainageissuesareidentifiedtheirresolutionbecomesathresholdissuebeforeredevelopment(e.g.GreenSquare).Theadoptionofwatersensitiveurbandesignprinciplesisbestpractice.

forCentralandSouthernSydney41
APPENDIX:LITERATUREREVIEW
OpenSpace
TheDepartmentofPlanning’sRecreationandOpenSpacePlanningGuidelinesforLocalGovernment(2010,p27)discussestheuseof‘default’orstandardisedratesofprovisionforopenspace.Thedocumentcautionsagainsttheuseofmetricsexpressedasarequiredareapercapita,asthistendstodiscounttherelativeaccessibilityofopenspacewithintheurbanenvironment.Withthehigherdensitiesoftheinnerurbanareas,provisionofopenspaceisquotedobservedat5%ofurbanresidentialareas(whichisbelowthetraditionallyappliedstandardof2.38ha/1000persons,whichwouldequateto10%),howeverresidentsoftheseareasoftenhavearangedifferenttypesofopenspacesinproximitytothehomes.TheGuidelinesadvocateinsteadfortheprovisionofopenspacebaseduponcatchmentaccesstoavarietyoftypesofopenspace.Whilstitisemphasisedthatalocallyspecificvariationsshouldbedevelopedinordertoappropriatelyaddresscommunityneeds,defaultstandardsderivedfromtheWest-CentralSubregionareprovidedwithinthedocumentandareincludedinTable2andapictorialdepictioninFigure3below.
F IGURE3 : COVERAGEAS A BENCHMARKFOROPENSPACEPROVIS ION

forCentralandSouthernSydney42
TABLE 2 : DEFAULT STANDARDSOF OPENSPACEPROVIS ION (DEPARTMENTOF PLANNING2010)
Hierarchylevel Size Distancefrommostdwellings
Locallyspecificalternativestomeetingthisstandard
Parks Local 0.5-2ha 400m Civicspaces,plazas,pocketparks,portionofaregionalparkorquarantinedareaofaconservationorlandscapearea
District 2-5ha 2km Beachandriverforeshoreareas,orquarantinedareaofaconservationorlandscapearea
LinearandLinkage
Local Upto1km n/a Localprimaryschools,portionofadistrictpark
District 1-5km n/a Secondaryschools,portionofaregionalpark
Outdoorsport Local 5ha 1km Localprimaryschools,portionofadistrictpark
District 5-10ha 2km Secondaryschools,portionofaregionalpark
Parks Regional 5+ha 5-10km
LinearandLinkage
Regional 5+km 5-10km
OutdoorSport Regional 10+ha 5-10km
Thecatchmentaccessmetricappliesasareasonablemeasureofbothprovisionandaccessibility;howevertherearecertainqualitativefactorsthatfurtherinfluenceaccessibilitytoandeffectiveuseofareasofopenspace,particularlyforsectionsofthecommunitywithdifferingorspecialneeds.ThePremier’sCouncilforActiveLiving(PCAL)(2011)notesthatprovidingsafetyandamenity,suchastheprovisionofappropriatepassivesurveillanceandlightingwithinopenspacesandalongaccessroutes,areimportantconsiderationsinallowingfortheutilisationofspaces.Furthertothis,theSouth-EastQueenslandCouncilofMayors’OpenSpaceandMediumDensityLivingToolkit(2012)indicatesthataccessibilitymaybeimpededbybarrierssuchasmajorroadsorsteepinclines.Differentsectionsofthecommunityarerecognisedtohavedifferentneedsinaccessingandutilisingopenspace.Forexample,areaswithhigherproportionsoffamilieswithyoungchildrenwillrequireadequateprovisionofappropriateplayequipmenttomeettheseneeds(SEQCouncilofMayors2012).AliteraturereviewconductedbyByrneandSipe(2010,p26)aspartofGriffithUniversity’sUrbanResearchProgramfoundcertainelementsofthecommunityhaveahigherneedforaccesstoopenspace,suchasthoseyoungerthan15andolderthan55,thosewithlowincomesandlowereducationlevelsandsingle-parenthouseholds.Arangeofsourcesreviewed(DepartmentofPlanning2010;Byrne&Sipe2010;SEQCouncilofMayors2012)recommendconductingsurveysofresidents’attitudestowards,usageofandbarrierstousageofopenspacesaspartofmeasuringtheeffectiveprovisionofopenspace.Surveysofparkusersorresidentsarewellsuitedtoascertaining(viadirectresponsesfromcommunities)whatspecificallypreventspeoplefromutilisingprovidedpublicspace,forexampleasaresultofalackofpublictransportprovisionwhichmayexcludecertaincommunityelements,orwhatfacilitiesarelackinginprovision

forCentralandSouthernSydney43
withinastudyarea.Conductingsurveysalsohelpstocontrolforvariationsinneedsacrossheterogeneouscommunities(Byrne&Sipe2010).Asanalternativetothestandardsbasedapproachoutlinedabove,ByrneandSipe(2010)advocateforaneeds-basedassessmentofopenspacedemand.Thisincludesdemographicvariationswithinanareatorefinethemodellingofdemandinopenspacepastthecomparativelysimplisticmeasurementcatchmentcoveragedescribedabove.Theynotethat:
“while considerably more time consuming and resource intensive than a standardsapproach, a needs-based assessment may provide the capability to better estimate theamountofopenspacerequired,thedesignofthatspace,andthefacilitiesandprogramsthat foster recreation within that space. This is especially important for areas wheredensity increases are planned, but where there is little or no opportunity for additionalgreenspace.”
ByrneandSipe(2010,p23)
TheyproposethatsuchananalysiswouldrequiretheuseofaGISplatformandanauditofallparkfacilitieswithinthestudyarea(suchasanLGAoranareatargetedforhigherdensities),alongwithcomprehensivecurrentdemographicdataandprojectedchangestherein.
AffordableHousing
Thereisarangeofdifferentmeasuresofhousingaffordabilitythatcanbeusedtodeterminechangesinaffordabilityovertime.Threepotentialmetricsarepresentedbelowwithsupportinginformationfromrelevantliterature.Agenerallyacceptedmeasurementofhousingaffordabilitylevelswithinanareaisthelevelsofhousingstressexperiencedbythecommunity.TheAustralianHousingandUrbanResearchInstitute(AHURI)providediscussionthroughvariousresearchpapersintotheissue,whereintheyhavenotedthathousingstressisfrequentlybeingmeasuredthrougharatiometric,withthe‘30:40rule’–thosewhospendmorethan30%oftheirincomeonhousingcostsandwhofallinthebottom40%ofincomes–appliedasastandardisedtestforhousingstresswithinAustralia(Gabrieletal2005),havingbeenintroducedthroughtheFederalGovernment’sNationalHousingStrategyin1991-92(O’Flynn2011).InfurtherAHURIresearch,Yatesetal(2007,p4)havefoundthistobebothaconservativeandrobustmethodofmeasurement.TheNSWParliamentaryLibrary’sResearchServicehaspreparedabriefingpaperonhousingaffordabilitywithinNSW(O’Flynn2011)whichdiscussesseveralmethodsofmeasuringaffordability.Assessmentoftheaffordabilityofhousingcanbetakenusingtheresidualincomemethod,whichmeasuresthedisposableincomeofahouseholdandexaminesadequacyandcapacitytomaintainanacceptablestandardoflivingatthatincome.Thismethodholdsadvantageinthewayinwhichitaccountsforthedifferencesinhouseholdstructure(whichinherentlyimpactsuponnon-housingneedsandexpenditurethereon),afactorwhichisdynamicwithincommunitiesexperiencingintensificationandconsolidation,inordertoderivelevelsofhousingstressbaseduponabilitytomeetpost-housingneedsratherthansimplyhousingcost(Yates&Gabriel2006).Thismethodhasdrawbacksinthatitreliesupon“detailedanalysisofbothhousingandnon-housingconsumptionandexpenditurepatterns”(Smith2009),whichimposesamoreonerousrequirementfordatacollection,alongwithhighercomplexityandtimeconsumptioninitsimplementationthanothermethodsofmeasurement(Yates&Gabriel2006).AfurthermeasurementofhousingaffordabilityexploredintheParliamentaryLibrary’sbriefing(O’Flynn2011,p12)isthecomparisonofhousepricestoconsumerpricesorincomes.Theliteraturewidelyrecognisesthattherehasbeenadramaticincreaseinthedisparitybetweenhousepricesandhouseholdincomes,alongwithCPI,withinSydneysincethe1970’s,beingdemonstratedinFigure4below(O’Flynn2011,p12),whichshowsthatby2007medianhousepricesinSydneyhadclimbedtoapproximately$450,000withCPIat100.
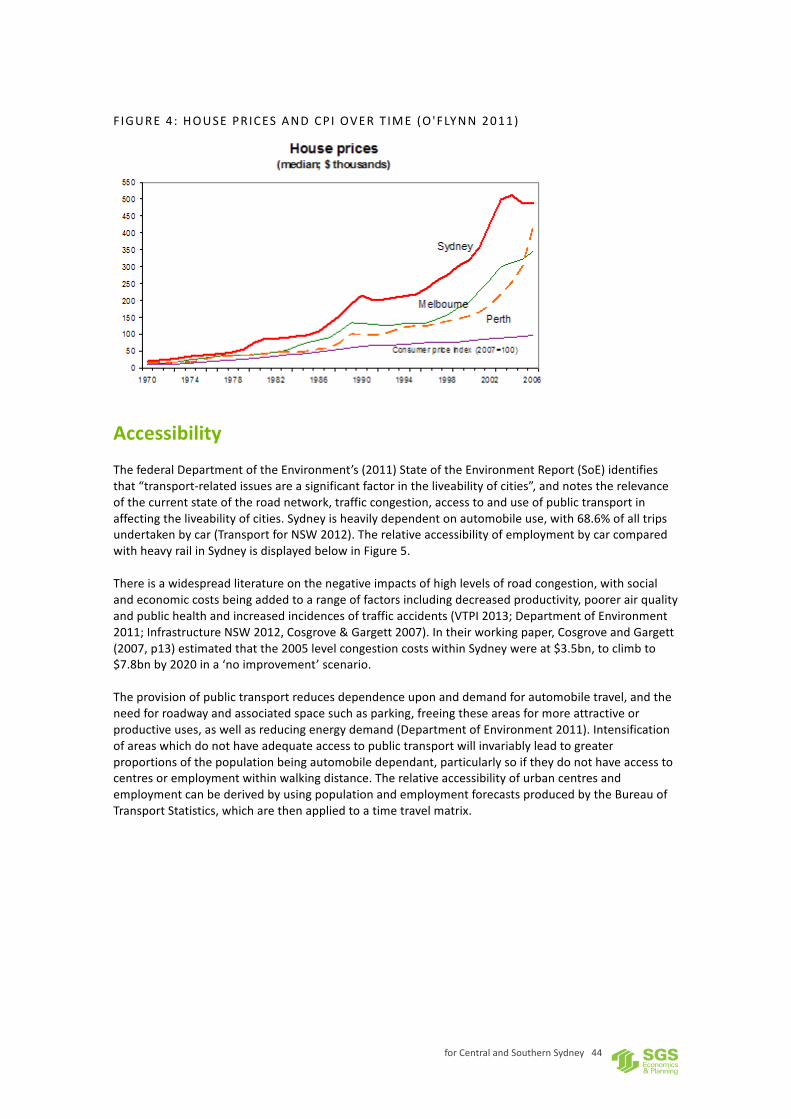
forCentralandSouthernSydney44
F IGURE4 : HOUSEPRICES ANDCPI OVERT IME (O 'FLYNN2011)
Accessibility
ThefederalDepartmentoftheEnvironment’s(2011)StateoftheEnvironmentReport(SoE)identifiesthat“transport-relatedissuesareasignificantfactorintheliveabilityofcities”,andnotestherelevanceofthecurrentstateoftheroadnetwork,trafficcongestion,accesstoanduseofpublictransportinaffectingtheliveabilityofcities.Sydneyisheavilydependentonautomobileuse,with68.6%ofalltripsundertakenbycar(TransportforNSW2012).TherelativeaccessibilityofemploymentbycarcomparedwithheavyrailinSydneyisdisplayedbelowinFigure5.Thereisawidespreadliteratureonthenegativeimpactsofhighlevelsofroadcongestion,withsocialandeconomiccostsbeingaddedtoarangeoffactorsincludingdecreasedproductivity,poorerairqualityandpublichealthandincreasedincidencesoftrafficaccidents(VTPI2013;DepartmentofEnvironment2011;InfrastructureNSW2012,Cosgrove&Gargett2007).Intheirworkingpaper,CosgroveandGargett(2007,p13)estimatedthatthe2005levelcongestioncostswithinSydneywereat$3.5bn,toclimbto$7.8bnby2020ina‘noimprovement’scenario.Theprovisionofpublictransportreducesdependenceuponanddemandforautomobiletravel,andtheneedforroadwayandassociatedspacesuchasparking,freeingtheseareasformoreattractiveorproductiveuses,aswellasreducingenergydemand(DepartmentofEnvironment2011).Intensificationofareaswhichdonothaveadequateaccesstopublictransportwillinvariablyleadtogreaterproportionsofthepopulationbeingautomobiledependant,particularlysoiftheydonothaveaccesstocentresoremploymentwithinwalkingdistance.TherelativeaccessibilityofurbancentresandemploymentcanbederivedbyusingpopulationandemploymentforecastsproducedbytheBureauofTransportStatistics,whicharethenappliedtoatimetravelmatrix.

forCentralandSouthernSydney45
F IGURE5 : RELATIVE ACCESS IB IL ITY TOEMPLOYMENTBY CARORPUBLIC TRANSPORT(TRANSPORTFORNSW2012)
Parking
Theimpactsofintensificationuponparkingavailability,useandprovisionareinherentlytiedtobroaderaccessibilityconcernswithinalocalarea.
Schoolsandothereducationfacilities
ArangeofbenchmarksarediscussedinAustraliafortheprovisionofprimaryandsecondaryschools.Thedataoutputforbenchmarksprimarilytakestheformofaratioofstudentplacesrequiredforaportionofthepopulation,schoolagedstudents,ordwellingsinanarea,forexample,oneprimaryschoolforevery5,000population.Thereisconsiderablevariabilitybetweendifferentbenchmarksforprimaryandsecondaryschools.Table3summarisesthedifferentmetricsreviewedandhighlightsthedifferencebetweenmeasurementsandoutputs.Thisvariationpreventsmanybenchmarksfrombeingdirectlycomparable.Itisimportanttonotethattherequirementsforeducationinfrastructurevarybetweeninfillandgreenfieldareas.Thisisdemonstratedinthetablebelowwhencomparingthenumberofdwellingsrequiredforschoolsininfillandgreenfielddevelopments.

forCentralandSouthernSydney46
TABLE 3 . QUANTITATIVE BENCHMARKSFOREDUCATION INFRASTRUCTURE
Project/program Greenfield/infill Primaryschool Secondaryschool Benchmark
VictorianGrowthAreasAuthorityGuidetoSocialInfrastructurePlanning
Greenfield 1:10,000 1:10,000-30,000 Totalpopulation
GreenCircleSocialInfrastructureProvision
Infill 1:500 1:1,200 Studentpopulation
ACTDesiredStandardsofService
Unknown 1:7,500 1:30,000 Totalpopulation
Fisherman’sBendUrbanRenewalArea
Infill 1:10,000 1:40,000 Dwellings
DepartmentofEducationandCommunitiesAdvisoryNotes
Greenfield 1:2,000-2,500 1:6,000-7,500 Dwellings
QldSocialInfrastructureGuidelinesbenchmarks
Both 1:7,500 1:20,000 Totalpopulation
LeppingtonPrecinctStudyGreenfield 1:2,000 1:6,000 Dwellings
Someconsiderationhasbeengiventothestudentbodysizeofschools.Forinstance,theFishersBendUrbanRenewalAreainVictoriaassumesaprimaryschoolhascapacityfor450studentswhichahighschoolhasanassumedcapacityof1,100students.Thereislimitedinformationavailableregardingdifferenttypesofschools,forinstancewhenaselective(academic,sports,performanceetc.)schoolorspecialneedsschoolneedstobeprovided.BenchmarksfortheprovisionofCatholicandIndependentschoolsarealsolimited.Thesebenchmarksdonotconsiderthelandarearequiredfornewandexpandingschools.Thebenchmarksizeforanewschoolinagreenfielddevelopmentareais3hectaresforprimaryschoolsand6hectaresforhighschools(thesefiguresincludeopenspacerequirementsforschools,whichmaybemetbyco-locatingwithsportingfieldsforcommunityuses).TheselandareasareunrealisticforthemajorityofareasinSSROCwhicharehighlyurbanisedandhavehighlandvaluesconstraininglandacquisition.TheStateInfrastructureStrategyUpdate(2014)callsfortheintensificationofusesonexistingschoolsitesandlargerschoolsinurbanisedareastominimiselandacquisitioncosts,butdoesnotprovideanindicationofoptimalschoolsize.Somequantitativebenchmarkshavebeenutilisedforpreschooleducation.Thesebenchmarksarebasedonpopulationandrangebetween1preschoolforevery5,000population(aspertheACTDesiredStandardsofService)andoneforevery7,500population(aspertheQueenslandSocialInfrastructurePlanningGuideline).Tertiaryeducationfacilitybenchmarksrequireasignificantlylargerpopulation.OneTAFEcouldbetriggeredforevery150,000-500,000people.Thebenchmarksreviewedindicatedthatauniversitycampusmayberequiredforevery250,000people.
Hospitalsandotherhealthfacilities
ThemajoritySSROCfallsintotwolocalhealthdistrictsbytheNSWDepartmentofHealth,SydneyandSydneySouth-East.BankstownLGAfallsintotheSydneySouthWestLocalHealthDistrict.Thismayseethetypesandratesofserviceprovisiondifferbetweenlocalgovernmentareasindifferentlocalhealthdistricts.Differenthealthprioritiesandprofilesofpopulationmayalsobeidentifiedindifferenthealthdistricts,e.g.therateofsmokingmaydiffer.Thequantitativebenchmarksreviewedsuggestbetweenanadditional2and2.6publichospitalbedsshouldbeprovidedforevery1,000people.Thesebenchmarksareclosetotheaveragenumberofhospitalbedsper1,000peopleinNSW,whichis2.7(AIHW2014).Thebenchmarkof2.7publichospitalbedsforevery1,000isconsideredappropriateifaspecificnumberforthecurrentratioofpublichospitalbedsinSSROCisunknown.

forCentralandSouthernSydney47
AbenchmarkforthenumberofprivatehospitalbedstobeprovidedhasbeenconsideredbytheCityofGreaterGeelonginthedevelopmentoftheirbenchmarksforsocialinfrastructureprovision(1.7bedsper1,000people).Thisisinexcessofthe1.0bedsper1,000experiencedonaverageinNSW.Aswithpublichospitalbeds,itisconsideredappropriatetoadopttheaveragenumberforNSWifaspecificnumberforthecurrentratioofpublichospitalbedsinSSROCisunknown.Thereisgeneralconsensusamongthequantitativebenchmarksreviewedfortheprovisionofbedsinagedcarefacilities.Thebenchmarksreviewedsuggest88bedsper1,000ofthepopulationaged70andabove.ThisfigurehasbeenadoptedasthenationalprovisionstandardforAustraliabythethenDepartmentofHealthandAgingin2011.ThesocialinfrastructurebenchmarkspreparedbytheCityofGreaterGeelongsuggestthat40ofthesebedsareprovidedinhighcarefacilitiesandtheremaining48areprovidedinlowcarefacilities.TwobenchmarksconsideredthepopulationtriggerfortheprovisionofanewGP,howeverthebenchmarkschosenaresignificantlydifferent(1.48per1,000and1per4,000).IfanumericalbenchmarkisrequiredfortheprovisionofGPservices,itisrecommendedthatresearchbeconductedbySSROCtodeterminethecurrentratioofGPsopopulationinareaswheretheserviceisconsideredadequate.ItshouldbenotedthatdemandforhealthinfrastructureislikelytoincreaseasAustralia’spopulationages.Whilenotdirectlyrelatedtohealthinfrastructure,theimportanceofhealthybuiltenvironmentsshouldnotbeunderestimated.Healthybuiltenvironmentsprovideforphysicalactivity(inparticularactivetransport),encouragesocialinteraction,haveimprovedperceptionsofsafetyandingeneralpromoteimprovedhealthandwellbeing.Healthybuiltenvironmentscanassistinthepreventionofhealthproblemsandinparticularchroniclifestylerelatedillness.Thedevelopmentandencouragementofhealthybuildenvironmentscanassistinreducingdemandforhealthinfrastructureandcontributetotheliveabilityandamenityaprecinct.
Communityandculturalfacilitiesincludingchildcare
Communityandculturalfacilitiescoverabroadrangeofsocialinfrastructureitemsincluding:− Communitycentres− Libraries− Youthfacilities− Artgalleries− Museums− PerformingArtsCentre− SeniorsCentre− Childcarecentre(includinglongdaycare,familydaycare,occasionalcare)− PublicartIthasbeennotedthattheprovisionofcommunityinfrastructureinurbanrenewalareasisnotasstraightforwardasingreenfielddevelopmentsassomeserviceprovisionofvaryingqualitiesalreadyexists(Weston,2014).Furthermore,manycommunityinfrastructurebenchmarksrelatespecificallytogreenfieldareas,whichhaveadifferentdemographicandattractdifferentpopulationstoinfillareasandthereforemaynotbedirectlyapplicable(Weston,2014)

forCentralandSouthernSydney48
References
Byrne,J.&Sipe,N.,2010,Greenandopenspaceplanningforurbanconsolidation–areviewofthe
literatureandbestpractice,IssuesPaper11,GriffithUniversity,BrisbaneCosgrove,D.&Gargett,D.,2007,EstimatingurbantrafficandcongestioncosttrendsforAustraliancities,
Workingpaper71,BureauofTransportandRegionalEconomics,CommonwealthofAustralia,Canberra
DepartmentoftheEnvironment,2011,Stateoftheenvironmentreport,AustralianGovernment,
Canberra,accessed11Sep2015viahttp://www.environment.gov.au/science/soe/2011-report/10-built-environment/2-state-and-trends/2-1-livability#s2-1-3
DepartmentofPlanning,2010,Recreationandopenspaceguidelinesforlocalgovernment,NSW
Government,SydneyGabriel,M.,Jacobs,K.,Arthurson,K.,Burke,TandYates,J.2005,Conceptualisingandmeasuringthe
housingaffordabilityproblem,AustralianHousingandUrbanResearchInstitute,MelbourneHollowayandWajzer(2008)ImprovingCityPerformancethroughBenchmarking,Paperpresentedatthe
InternationalCitiesTownCentres&CommunitiesSociety,Sydney.InfrastructureNSW,2012,PricingcongestioninSydney:Discussionpaper,InfrastructureNSW,SydneyLoweetal(2013)Liveable,Healthy,Sustainable:WhatAretheKeyIndicatorsforMelbourne
Neighbourhoods?(ResearchPaper1–Place,HealthandLiveabilityResearchProgram).Luque-MartinezandMunoz-Leiva(2005)CityBenchmarking:AMethodologicalProposalReferring
SpecificallytoGranada,Cities,Vol.22(6),pp.411-423.O’Flynn,L.,2011,Housingaffordabilitybriefingpaper,NSWParliamentaryLibraryResearchService,NSW
Government,SydneyPremier’sCouncilforActiveLiving,2011,Planninganddesignguidelines:Openspaces,NSW
Government,Sydney,accessed8Sep2015viahttp://www.pcal.nsw.gov.au/planning_and_design_guidelines/open_spaces
Yates,J.andGabriel,M.,2006,HousingaffordabilityinAustralia,AustralianHousingandUrbanResearch
Institute,SydneySGSEconomicsandPlanning,ProductivityandagglomerationbenefitsinAustraliancapitalcities,COAG
ReformCouncil,CanberraSmith, P., 2009, Home ownership affordability measurement – a more comprehensive and unbiased
approach,Refereepaperspresentedatthe4thAustralasianHousingResearchConference
South-EastQueenslandCouncilofMayors,2012,Openspaceandmediumdensitylivingtoolkit,CouncilofMayors(SEQ)
TransportforNSW,2012,NSWtransportlongtermmasterplan,NSWGovernment,SydneyTransportforNSW(Undated)InterimTransportmanagementandAccessPlanGuidelines
http://www.transport.nsw.gov.au/sites/default/files/b2b/abouttrans/trans-management-accessibility-plans.pdf

forCentralandSouthernSydney49
VictoriaTransportPolicyInstitute(VTPI),2013,TransportationcostandbenefitanalysisII–Congestion
costs,VTPI,VictoriaBC
Yates,J.,Vivienne,M.,Berry,M.,Burke,T.,Gabriel,M.,Phibbs,P.,Pinnegar,S.andRandolph,R.,2007,Housingaffordability:A21stcenturyproblem,AustralianHousingandUrbanResearchInstitute,Melbourne

forCentralandSouthernSydney50
ContactusCANBERRALevel6,[email protected]
HOBARTUnit2,5KingStreetBelleriveTAS7018+61(0)[email protected]
MELBOURNELevel5,[email protected]
SYDNEY209/[email protected]